As filed with the U.S. Securities and Exchange Commission on June 30, 2023
UNITED STATES
SECURITIES AND EXCHANGE COMMISSION
Washington, D.C. 20549
FORM 20-F
(Mark One)
REGISTRATION STATEMENT PURSUANT TO SECTION 12(b) OR (g) OF THE SECURITIES EXCHANGE ACT OF 1934 |
OR
ANNUAL REPORT PURSUANT TO SECTION 13 OR 15(d) OF THE SECURITIES EXCHANGE ACT OF 1934 |
For the fiscal year ended: March 31, 2023
OR
TRANSITION REPORT PURSUANT TO SECTION 13 OR 15(d) OF THE SECURITIES EXCHANGE ACT OF 1934 |
OR
SHELL COMPANY REPORT PURSUANT TO SECTION 13 OR 15(d) OF THE SECURITIES EXCHANGE ACT OF 1934 |
Commission file number: 001-14948
TOYOTA JIDOSHA KABUSHIKI KAISH
A
(Exact name of registrant as specified in its charter)
(Translation of registrant’s name into English)
(Jurisdiction of incorporation or organization)
,
Aichi Prefecture 471-8571
+81 565
28-2121
(Address of principal executive offices)
Telephone number: +81 565 28-2121
Facsimile number: +81 565
23-5800
Address: 1 Toyota-cho Toyota City , Aichi Prefecture 471-8571 , Japan
,
(Name, telephone,
e-mail
and/or facsimile number and address of registrant’s contact person) Securities registered or to be registered pursuant to Section 12(b) of the Act:
Title of each class |
Trading Symbol(s) |
Name of each exchange on which registered | ||
| * | Each American Depositary Share representing ten shares of the registrant’s Common Stock. |
| ** | No par value. Not for trading, but only in connection with the registration of American Depositary Shares, pursuant to the requirements of the U.S. Securities and Exchange Commission. |
Securities registered or to be registered pursuant to Section 12(g) of the Act:
None
Securities for which there is a reporting obligation pursuant to Section 15(d) of the Act:
None
Indicate the number of outstanding shares of each of the issuer’s classes of capital or common stock as of the close of the period covered by the annual report:
13,565,179,729
shares of common stock (including 292,036,035 shares of common stock in the form of American Depositary Shares) as of March
31, 2023
Indicate by check mark if the registrant is a well-known seasoned issuer, as defined in Rule 405 of the Securities Act: Yes ☒ No ☐
If this report is an annual or transition report, indicate by check mark if the registrant is not required to file reports pursuant to Section 13 or 15(d) of the Securities Exchange Act of 1934: Yes ☐ No ☒
Indicate by check mark whether the registrant (1) has filed all reports required to be filed by Section 13 or 15(d) of the Securities Exchange Act of 1934 during the preceding 12 months (or for such shorter period that the registrant was required to file such reports), and (2) has been subject to such filing requirements for the past 90 days: Yes ☒ No ☐
Indicate by check mark whether the registrant has submitted electronically every Interactive Data File required to be submitted pursuant to Rule 405 of Regulation Yes ☒ No ☐
S-T
(§232.405 of this chapter) during the preceding 12 months (or for such shorter period that the registrant was required to submit such files): Indicate by check mark whether the registrant is a large accelerated filer, an accelerated filer, a
non-accelerated
filer, or an emerging growth company. See definition of “large accelerated filer,” “accelerated filer,” and “emerging growth company” in Rule 12b-2
of the Exchange Act. (Check one): | Accelerated filer ☐ | Non-accelerated filer ☐ | |||
| Emerging growth company | ||||
If an emerging growth company that prepares its financial statements in accordance with U.S. GAAP, indicate by check mark if the registrant has elected not to use the extended transition period for complying with any new or revised financial accounting standards† provided pursuant to Section 13(a) of the Exchange Act: ☐
| † | The term “new or revised financial accounting standard” refers to any update issued by the Financial Accounting Standards Board to its Accounting Standards Codification after April 5, 2012. |
Indicate by check mark whether the registrant has filed a report on and attestation to its management’s assessment of the effectiveness of its internal control over financial reporting under Section 404(b) of the Sarbanes-Oxley Act (15 U.S.C. 7262(b)) by the registered public accounting firm that prepared or issued its audit report. ☒
If securities are registered pursuant to Section 12(b) of the Act, indicate by check mark whether the financial statements of the registrant included in the filing reflect the correction of an error to previously issued financial statements. ☐
Indicate by check mark whether any of those error corrections are restatements that required a recovery analysis of incentive-based compensation received by any of the registrant’s executive officers during the relevant recovery period pursuant to §240.10D-1(b). ☐
Indicate by check mark which basis of accounting the registrant has used to prepare the financial statements included in this filing:
U.S. GAAP ☐ International Financial Reporting Standards as issued by the International Accounting Standards Board ☒ Other ☐
If “Other” has been checked in response to the previous question, indicate by check mark which financial statement item the registrant has elected to follow: Item 17 ☐ Item 18 ☐
If this is an annual report, indicate by check mark whether the registrant is a shell company (as defined in Rule ☒
12b-2
of the Exchange Act): Yes ☐ No TABLE OF CONTENTS
10.F |
DIVIDENDS AND PAYING AGENTS | 134 | ||||
10.G |
STATEMENT BY EXPERTS | 134 | ||||
10.H |
DOCUMENTS ON DISPLAY | 134 | ||||
10.I |
SUBSIDIARY INFORMATION | 135 | ||||
10.J |
ANNUAL REPORT TO SECURITY HOLDERS | 135 | ||||
ITEM 11. |
135 | |||||
ITEM 12. |
135 | |||||
12.A |
DEBT SECURITIES | 135 | ||||
12.B |
WARRANTS AND RIGHTS | 135 | ||||
12.C |
OTHER SECURITIES | 135 | ||||
12.D |
AMERICAN DEPOSITARY SHARES | 135 | ||||
ITEM 13. |
137 | |||||
ITEM 14. |
MATERIAL MODIFICATIONS TO THE RIGHTS OF SECURITY HOLDERS AND USE OF PROCEEDS | 137 | ||||
ITEM 15. |
137 | |||||
ITEM 16. |
138 | |||||
ITEM 16A. |
138 | |||||
ITEM 16B. |
138 | |||||
ITEM 16C. |
139 | |||||
ITEM 16D. |
140 | |||||
ITEM 16E. |
PURCHASES OF EQUITY SECURITIES BY THE ISSUER AND AFFILIATED PURCHASERS | 140 | ||||
ITEM 16F. |
141 | |||||
ITEM 16G. |
141 | |||||
ITEM 16H. |
144 | |||||
ITEM 16I. |
DISCLOSURE REGARDING FOREIGN JURISDICTIONS THAT PREVENT INSPECTIONS | 144 | ||||
ITEM 17. |
145 | |||||
ITEM 18. |
145 | |||||
ITEM 19. |
146 | |||||
As used in this annual report, the term “fiscal” preceding a year means the twelve-month period ended March 31 of the year referred to. All other references to years refer to the applicable calendar year unless the context otherwise requires. Unless the context otherwise requires or as otherwise expressly stated, references in this prospectus supplement to “Toyota,” “TMC,” “we,” “us,” “our” and similar terms refer to Toyota Motor Corporation and its consolidated subsidiaries, as a group.
Toyota’s consolidated financial statements in this annual report have been prepared in accordance with International Financial Reporting Standards (“IFRS”), as issued by the International Accounting Standards Board (“IASB”). The term “IFRS” also includes International Accounting Standards (“IASs”) and the related interpretations of the interpretations committees (SIC and IFRIC).
CAUTIONARY STATEMENT WITH RESPECT TO FORWARD-LOOKING STATEMENTS
Written forward-looking statements may appear in documents filed with the SEC, including this annual report, documents incorporated by reference, reports to shareholders and other communications.
The U.S. Private Securities Litigation Reform Act of 1995 provides a “safe harbor” for forward-looking information to encourage companies to provide prospective information about themselves without fear of litigation so long as the information is identified as forward-looking and is accompanied by meaningful cautionary statements identifying important factors that could cause actual results to differ materially from those projected in the information. Toyota relies on this safe harbor in making forward-looking statements.
Forward-looking statements appear in a number of places in this annual report and include statements regarding Toyota’s current intent, belief, targets or expectations or those of its management. In many, but not all cases, words such as “aim,” “anticipate,” “believe,” “estimate,” “expect,” “hope,” “intend,” “may,” “plan,” “predict,” “probability,” “risk,” “should,” “will,” “would,” and similar expressions, are used as they relate to Toyota or its management, to identify forward-looking statements. These statements reflect Toyota’s current views with respect to future events and are subject to risks, uncertainties and assumptions. Should one or more of these risks or uncertainties materialize or should underlying assumptions prove incorrect, actual results may vary materially from those which are anticipated, aimed at, believed, estimated, expected, intended or planned.
Forward-looking statements are not guarantees of future performance and involve risks and uncertainties. Actual results may differ from those in forward-looking statements as a result of various factors. Important factors that could cause actual results to differ materially from estimates or forecasts contained in the forward-looking statements are identified in “Risk Factors” and elsewhere in this annual report, and include, among others:
(i) changes in economic conditions, market demand, and the competitive environment affecting the automotive markets in Japan, North America, Europe, Asia and other markets in which Toyota operates;
(ii) fluctuations in currency exchange rates (particularly with respect to the value of the Japanese yen, the U.S. dollar, the euro, the Australian dollar, the Canadian dollar and the British pound), stock prices and interest rates;
(iii) changes in funding environment in financial markets and increased competition in the financial services industry;
(iv) Toyota’s ability to market and distribute effectively;
(v) Toyota’s ability to realize production efficiencies and to implement capital expenditures at the levels and times planned by management;
(vi) changes in the laws, regulations and government policies in the markets in which Toyota operates that affect Toyota’s automotive operations, particularly laws, regulations and government policies relating to vehicle safety including remedial measures such as recalls, trade, environmental protection, vehicle emissions and vehicle fuel economy, as well as changes in laws, regulations and government policies that affect Toyota’s other operations, including the outcome of current and future litigation and other legal proceedings, government proceedings and investigations;
(vii) political and economic instability in the markets in which Toyota operates;
(viii) Toyota’s ability to timely develop and achieve market acceptance of new products that meet customer demand;
(ix) any damage to Toyota’s brand image;
(x) Toyota’s reliance on various suppliers for the provision of supplies;
(xi) increases in prices of raw materials;
(xii) Toyota’s reliance on various digital and information technologies, as well as information security;
(xiii) fuel shortages or interruptions in electricity, transportation systems, labor strikes, work stoppages or other interruptions to, or difficulties in, the employment of labor in the major markets where Toyota purchases materials, components and supplies for the production of its products or where its products are produced, distributed or sold;
(xiv) the impact of natural calamities, epidemics, political and economic instability, fuel shortages or interruptions in social infrastructure, wars, terrorism and labor strikes, including their negative effect on Toyota’s vehicle production and sales;
(xv) the impact of climate change and the transition towards a
low-carbon
economy; and (xvi) the ability of Toyota to hire or retain sufficient human resources.
PART I
ITEM 1. IDENTITY OF DIRECTORS, SENIOR MANAGEMENT AND ADVISERS
Not applicable.
ITEM 2. OFFER STATISTICS AND EXPECTED TIMETABLE
Not applicable.
ITEM 3. KEY INFORMATION
3.A [RESERVED]
3.B CAPITALIZATION AND INDEBTEDNESS
Not applicable.
3.C REASONS FOR THE OFFER AND USE OF PROCEEDS
Not applicable.
3.D RISK FACTORS
Industry and Business Risks
The worldwide automotive market is highly competitive.
The worldwide automotive market is highly competitive. Toyota faces intense competition from automotive manufacturers in the markets in which it operates. In recent years, competition in the automotive industry has further intensified amidst difficult overall market conditions. In addition, competition is likely to further intensify as technological advances in areas such as Connected, Autonomous / Automated, Shared, and Electric (“CASE”) technologies progress in the worldwide automotive industry, possibly resulting in industry reorganizations. Factors affecting competition include product quality and features, safety, reliability, fuel economy, the amount of time required for innovation and development, pricing, customer service, financing terms and tax credits or other government policies in various countries. Increased competition may lead to lower vehicle unit sales, which may result in a further downward price pressure and adversely affect Toyota’s financial condition and results of operations. Toyota’s ability to adequately respond to the recent rapid changes in the automotive market, particularly shifts in consumer preferences to electrified vehicles, and to maintain its competitiveness will be fundamental to its future success in existing and new markets and to maintain its market share. There can be no assurances that Toyota will be able to compete successfully in the future.
The worldwide automotive industry is highly volatile
.
Each of the markets in which Toyota competes has been subject to considerable volatility in demand. Demand for vehicles depends to a large extent on economic, social and political conditions in a given market and the introduction of new vehicles and technologies. As Toyota’s revenues are derived from sales in markets worldwide, economic conditions in such markets are particularly important to Toyota.
Reviewing the world economy for fiscal 2023, energy prices soared due to geopolitical tensions, and the rise in consumer prices accelerated in both advanced and emerging countries. From August onward, demand declined because of concerns regarding a slowdown in the global economy due to the acceleration of monetary tightening by central banks around the world. Although the automotive market continued to be subjected to global production constraints due to the tightening of global supply of, and increasing demand for, semiconductors as well as components shortages, the production cuts eased toward the second half of the fiscal year.
1
Changes in demand for automobiles are continuing, and it is unclear how this situation will transition in the future. Toyota’s financial condition and results of operations may be adversely affected if the changes in demand for automobiles continues or progresses further beyond Toyota’s expectations. Demand may also be affected by factors directly impacting vehicle price or the cost of purchasing and operating vehicles such as sales and financing incentives, prices of raw materials and parts and components, cost of fuel and governmental regulations (including tariffs, import regulation and other taxes). Volatility in demand may lead to lower vehicle unit sales, which may result in downward price pressure and adversely affect Toyota’s financial condition and results of operations.
Toyota’s future success depends on its ability to offer new, innovative and competitively priced products that meet customer demand on a timely basis.
Meeting customer demand by introducing attractive new vehicles and reducing the amount of time required for product development are critical to automotive manufacturers. In particular, it is critical to meet customer demand with respect to quality, safety, reliability and sustainability. The timely introduction of new vehicle models, at competitive prices, meeting rapidly changing customer preferences and demand is more fundamental to Toyota’s success than ever, as the automotive market is rapidly transforming in light of the changing global economy and technological advances. There is no assurance, however, that Toyota will adequately and appropriately respond to changing customer preferences and demand with respect to quality, safety, reliability, styling, sustainability and other features in a timely manner. Even if Toyota succeeds in perceiving customer preferences and demand, there is no assurance that Toyota will be capable of developing and manufacturing new, price competitive products in a timely manner with its available technology, intellectual property, sources of raw materials and parts and components, and production capacity, including cost reduction capacity. Further, there is no assurance that Toyota will be able to offer new products or implement capital expenditures at the level and times planned by management, including as described in targets or goals that we have disclosed publicly. Toyota’s inability to develop and offer products that meet customers’ preferences and demand with respect to quality, safety, reliability, styling, sustainability and other features in a timely manner could result in a lower market share and reduced sales volumes and margins, and may adversely affect Toyota’s financial condition and results of operations.
Toyota’s ability to market and distribute effectively is an integral part of Toyota’s successful sales.
Toyota’s success in the sale of vehicles depends on its ability to market and distribute effectively based on distribution networks and sales techniques tailored to the needs of its customers. There is no assurance that Toyota will be able to develop sales techniques and distribution networks that effectively adapt to changing customer preferences or changes in the geopolitical and regulatory environment in the major markets in which it operates. Toyota’s inability to maintain well-developed sales techniques and distribution networks may result in decreased sales and market share and may adversely affect its financial condition and results of operations.
Toyota’s success is significantly impacted by its ability to maintain and develop its brand image and reputation.
In the highly competitive automotive industry, it is critical to maintain and develop a brand image and reputation. In order to do so, it is necessary to further increase stakeholders’ confidence by ensuring that the Toyota group and its suppliers thoroughly comply with laws and regulations, provide safe, high-quality products that meet customer preferences and demand, as well as timely and appropriately disseminate information to stakeholders. It is also becoming increasingly important for companies to contribute to sustainability.
However, the Toyota group may not be able to ensure that it or its suppliers do so in all cases. Concerns regarding product safety or our product safety validation processes, whether raised internally, by regulators, or consumer advocates, can lead to product delays, recalls, lost sales, regulatory investigations, legal claims that cause reputational damage. For example, on March 4, 2022, Hino Motors, Ltd. (“Hino”), a consolidated
2
subsidiary of Toyota, confirmed and announced misconduct in relation to its applications for certification concerning the emissions and the fuel economy performance of certain of its engines for the Japanese market. Additionally, Daihatsu Motor Co., Ltd. (“Daihatsu”), a consolidated subsidiary of Toyota, confirmed and announced misconduct in relation to its applications for certification concerning safety tests of certain of its vehicles for the overseas market on April 28, 2023 for vehicles developed by Daihatsu. See “Item 4. Information on the Company — 4.B Business Overview — Selected Initiatives” for further discussion of these and related matters. In addition, actual or perceived failures on the part of Toyota or its suppliers to contribute to sustainability or to meet certain sustainability-related goals or objectives, including those relating to climate change or the protection of human rights in Toyota’s supply chain, may also harm Toyota’s reputation. Any insufficient measures taken by the Toyota group or its suppliers to maintain and develop Toyota’s brand image and reputation may have an adverse effect on Toyota’s financial condition and results of operations.
Toyota relies on suppliers for the provision of certain supplies including parts, components and raw materials.
Toyota purchases supplies including parts, components and raw materials from a number of external suppliers located around the world. For some supplies, Toyota relies on a single supplier or a limited number of suppliers, whose replacement with another supplier may be difficult. Inability to obtain supplies from a single or limited source supplier may result in difficulty obtaining supplies and may restrict Toyota’s ability to produce vehicles. Furthermore, even if Toyota were to rely on a large number of suppliers, first-tier suppliers with whom Toyota directly transacts may in turn rely on a single second-tier supplier or limited second-tier suppliers.
Irrespective of the number of suppliers, Toyota’s ability to continue to obtain supplies from its suppliers in a timely and cost-effective manner is subject to a number of factors, some of which are not within Toyota’s control. These factors include the ability of Toyota’s suppliers to provide a continued source of supply, and Toyota’s ability to effectively compete and obtain competitive prices from suppliers. Circumstances that may adversely affect such abilities include geopolitical tensions as well as related governmental actions such as economic sanctions.
A loss of any single or limited source supplier, or inability to obtain supplies from suppliers in a timely and cost-effective manner, could lead to increased costs or delays or suspensions in Toyota’s production and deliveries, which could have an adverse effect on Toyota’s financial condition and results of operations.
The worldwide financial services industry is highly competitive.
The worldwide financial services industry is highly competitive. Increased competition in automobile financing may lead to decreased margins. A decline in Toyota’s vehicle unit sales, an increase in residual value risk due to lower used vehicle prices, an increase in the ratio of credit losses and increased funding costs are additional factors which may impact Toyota’s financial services operations. If Toyota is unable to adequately respond to the changes and competition in automobile financing, Toyota’s financial services operations may adversely affect its financial condition and results of operations.
Toyota’s operations and vehicles rely on various digital and information technologies, as well as information security, which are subject to frequent attack.
Toyota depends on various information technology networks and systems, some of which are managed by third parties, to process, transmit and store electronic information, including sensitive data, and to manage or support a variety of business processes and activities, including manufacturing, research and development, supply chain management, sales and accounting. In addition, Toyota vehicles may rely on various digital and information technologies, including information service and driving assistance functions.
Despite security measures, Toyota’s digital and information technology networks and systems may be vulnerable to damage, disruptions, shutdowns due to unauthorized access or attacks by hackers, computer
3
viruses, breaches due to unauthorized use, errors or malfeasance by employees and others who have or gain access to the networks and systems Toyota depends on or otherwise uses, service failures or bankruptcy of third parties such as software development or cloud computing vendors, power shortages and outages, and utility failures or other catastrophic events like natural disasters. In particular, cyber-attacks or other intentional malfeasance are increasing in terms of intensity, sophistication and frequency, and Toyota has been and expects to continue to be the subject of such attacks. Such attacks have, in some cases, and could again disrupt critical operations, disclose sensitive data, interfere with information services and driving assistance functions in Toyota’s vehicles, and/or give rise to legal claims or proceedings, liability or regulatory penalties under applicable laws, which could have an adverse effect on Toyota’s brand image and its financial condition and results of operations. Moreover, similar attacks on Toyota’s suppliers and business partners have had, and may in the future have, a similar negative impact on Toyota.
Toyota is exposed to risks associated with climate change, including the physical risks of climate change and risks from the transition to a lower-carbon economy.
Risks associated with climate change are subject to increasing societal, regulatory and political focus in Japan and globally. These risks include the physical risks of climate change and risks from the transition to a lower-carbon economy.
The physical risks of climate change include both acute, event-driven risks such as those relating to hurricanes, floods and tornadoes, as well as longer-term weather patterns and related effects, such as sustained higher temperatures, sea level rise, drought and increased wildfires. Despite Toyota’s contingency planning, large-scale disasters due to extreme weather conditions have in the past harmed, and may in the future again harm, Toyota’s employees or its facilities and other assets, as well as those of Toyota’s suppliers and other business partners, thereby adversely affecting Toyota’s production, sales or other operational capacities. Large-scale disasters may also adversely affect the financial condition of Toyota’s customers, and thereby demand for its products and services.
Transition risks are those attributable to regulatory, technological and market changes to address the mitigation of, or adaptation to, climate-related risks. For example, Toyota is subject to the risk of changes in customer demand for vehicles due to such factors as changes in laws, regulations and government policies relating to climate change, technological innovation to address climate change, and new entrants into the automobile industry that seek to capitalize on changing market dynamics. Changes in customer demand may pose ancillary risks and challenges, such as Toyota’s having to establish new, or enhance existing, supply networks in order to source the raw materials, parts and components necessary for it to manufacture the products then in demand at desired volumes and at competitive costs. Toyota may incur significant costs and expenses as a result of the materialization of such risks, or in its efforts to mitigate or adapt to such risks. Toyota’s inability to develop and offer products that meet customers’ preferences and demand in a timely manner could result in a lower market share and reduced sales revenues and margins, and may adversely affect Toyota’s financial condition and results of operations. For a further discussion of risks associated with climate change, see “Item 4. Information on the Company — 4B. Business Overview — Climate Change-related Disclosures.”
Furthermore, Toyota has published disclosures on climate-change related matters relating to its business and its partners. Such disclosures include forward-looking statements based on Toyota’s expectations and assumptions, involving substantial discretion and forecasts about costs and future circumstances, which may prove to be incorrect. In addition, Toyota’s initiatives relating to climate change may not have the intended results, and estimates concerning the timing and cost of implementing, and ability to meet, stated goals are subject to risks and uncertainties. As a result, Toyota may not be able to meet its goals, including those set forth in this annual report, on expected timing or at all, or within expected costs.
In particular, progress toward achieving Toyota’s climate-related targets requires significant investment of resources and management time, as well as implementation of new compliance and risk management systems,
4
internal controls and other internal procedures. Toyota’s ability to achieve its climate-related goals, which are to be pursued over the long-term and are inherently aspirational, is subject to numerous risks and uncertainties, many of which are outside of Toyota’s control, such as changes in environmental and energy regulation and policy, the pace of technological change and innovation, and the actions of Toyota’s customers and competitors. Any failure, or perceived failure, by Toyota to achieve its climate-change related goals, including those set forth in this annual report, could adversely impact its reputation, financial condition and results of operations.
Toyota’s operations are dependent on securing, retaining and developing talented, diverse employees.
Given in particular the rapid changes in its business environment and its efforts to transform into a mobility company, Toyota’s success depends on its ability to continue to recruit, retain and develop talented and diverse employees. However, competition for such employees is intense and if Toyota cannot recruit and retain diverse employees with a high level of expertise and extensive experience as planned, or it is unable to provide its employees with the opportunities, training and resources they need to develop themselves further, it may reduce Toyota’s competitiveness, and its financial condition, results of operations and cashflow could be adversely affected.
Financial Market and Economic Risks
Toyota’s operations are subject to currency and interest rate fluctuations
.
Toyota is sensitive to fluctuations in foreign currency exchange rates and is principally exposed to fluctuations in the value of the Japanese yen, the U.S. dollar and the euro and, to a lesser extent, the Australian dollar, the Canadian dollar and the British pound. Toyota’s consolidated financial statements, which are presented in Japanese yen, are affected by foreign currency exchange fluctuations through translation risk, and changes in foreign currency exchange rates may also affect the price of products sold and materials purchased by Toyota in foreign currencies through transaction risk. In particular, strengthening of the Japanese yen against the U.S. dollar can have an adverse effect on Toyota’s operating results.
Toyota believes that its use of certain derivative financial instruments including foreign exchange forward contracts and interest rate swaps and increased localized production of its products have reduced, but not eliminated, the effects of interest rate and foreign currency exchange rate fluctuations. Nonetheless, a negative impact resulting from fluctuations in foreign currency exchange rates and changes in interest rates may adversely affect Toyota’s financial condition and results of operations. For a further discussion of currency and interest rate fluctuations and the use of derivative financial instruments, see “Item 5. Operating and Financial Review and Prospects — Operating Results — 5.A Operating Results — Overview — Currency Fluctuations,” “Item 11. Quantitative and Qualitative Disclosures About Market Risk,” and notes 19 and 20 to Toyota’s consolidated financial statements.
High prices of raw materials and strong pressure on Toyota’s suppliers has and could continue to negatively impact Toyota’s profitability
.
Increases in raw materials prices that Toyota and Toyota’s suppliers use in manufacturing their products or parts and components such as steel, precious metals,
non-ferrous
alloys including aluminum, and plastic parts, may lead to higher production costs for parts and components. This could, in turn, negatively impact Toyota’s profitability because Toyota may not be able to pass all those costs on to its customers or require its suppliers to absorb such costs. For example, Toyota believes that the surge in materials costs has had a significant negative impact on its business performance in fiscal 2023, and expects the impact to continue in fiscal 2024. A downturn in the financial markets could adversely affect Toyota’s ability to raise capital
.
Should the world economy suddenly deteriorate, a number of financial institutions and investors will face difficulties in providing capital to the financial markets at levels corresponding to their own financial capacity,
5
and, as a result, there is a risk that companies may not be able to raise capital under terms that they would expect to receive with their creditworthiness. If Toyota is unable to raise the necessary capital under appropriate conditions on a timely basis, Toyota’s financial condition and results of operations may be adversely affected.
Regulatory, Legal, Political and Other Risks
The automotive industry is subject to various governmental regulations and actions
.
The worldwide automotive industry is subject to various laws and governmental regulations including those related to vehicle safety and environmental matters such as emission levels, fuel economy, noise and pollution. In particular, automotive manufacturers such as Toyota are required to implement safety measures such as recalls for vehicles that do not or may not comply with the safety standards of laws and governmental regulations. In addition, Toyota may, in order to reassure its customers of the safety of Toyota’s vehicles, decide to voluntarily implement sales suspensions, recalls or other safety measures even if the vehicle complies with the safety standards of relevant laws and governmental regulations. If Toyota launches products that result in safety measures such as recalls (including where parts related to recalls or other measures were procured by Toyota from a third party), Toyota may incur various costs including significant costs for free repairs. Similarly, many governments also impose tariffs and other trade barriers, taxes and levies, or enact price or exchange controls. Furthermore, the failure to comply with such regulations could result in legal proceedings, recalls, negotiated remedial actions, fines, revocations of government approvals and the imposition of other government sanctions, restricted product offerings, compensatory payments or adverse consequences, such as those that have ensued in connection with the misconduct that Hino engaged in relating to emissions and fuel efficiency testing. See “Item 4. Information on the Company — 4.B Business Overview — Selected Initiatives.” Toyota has incurred significant costs in response to governmental regulations and actions, including costs relating to changes in global trade dynamics and policies, and expects to incur such costs in the future. Furthermore, new legislation or regulations or changes in existing legislation or regulations may also subject Toyota to additional costs in the future. If Toyota incurs significant costs related to implementing safety measures or responding to laws, regulations and governmental actions, Toyota’s financial condition and results of operations may be adversely affected.
Toyota may become subject to various legal proceedings
.
Toyota may become subject to legal proceedings in respect of various issues, including issues relating to the topics discussed in “— The automotive industry is subject to various governmental regulations and actions,” as well as product liability and infringement of intellectual property. Toyota may also be subject to legal proceedings brought by its shareholders and governmental proceedings and investigations. Toyota is in fact currently subject to a number of pending legal proceedings and government investigations. A negative outcome in one or more of these pending legal proceedings could adversely affect Toyota’s reputation, brand image, financial condition and results of operations. For a further discussion of governmental regulations, see “Item 4. Information on the Company — 4B. Business Overview — Governmental Regulation, Environmental and Safety Standards” and for legal proceedings, please see “Item 4. Information on the Company — 4B. Business Overview — Legal Proceedings.”
Toyota may be adversely affected by natural calamities, epidemics, political and economic instability, fuel shortages or interruptions in social infrastructure, wars, terrorism and labor strikes
.
Toyota is subject to various risks associated with conducting business worldwide. These risks include natural calamities; epidemics; political and economic instability; fuel shortages; interruption in social infrastructure including energy supply, transportation systems, gas, water, or communication systems resulting from natural hazards or technological hazards; wars; terrorism; labor strikes and work stoppages. Disruptions, delays and other adverse changes in the operations of Toyota’s business have ensued from such risks materializing in the past. Should the major markets in which Toyota purchases materials, parts and components
6
and supplies for the manufacture of Toyota products or in which Toyota’s products are produced, distributed or sold be affected by any of these events, it may result in future disruptions, delays and other adverse changes in the operations of Toyota’s business.
ITEM 4. INFORMATION ON THE COMPANY
4.A HISTORY AND DEVELOPMENT OF THE COMPANY
Toyota Motor Corporation is a limited liability, joint-stock company incorporated under the Commercial Code of Japan and continues to exist under the Companies Act of Japan (the “Companies Act”). Toyota commenced operations in 1933 as the automobile division of Toyota Industries Corporation (formerly Toyoda Automatic Loom Works, Ltd.). Toyota became a separate company in August 1937. In 1982, the Toyota Motor Company and Toyota Motor Sales merged into one company, the Toyota Motor Corporation of today. As of March 31, 2023, Toyota operated through 569 consolidated subsidiaries (including structured entities) and 168 associates and joint ventures accounted for by the equity method.
See “Item 4. Information on the Company — 4.B Business Overview — Capital Expenditures and Divestitures” for a description of Toyota’s principal capital expenditures and divestitures between April 1, 2020 and March 31, 2023 and information concerning Toyota’s principal capital expenditures and divestitures currently in progress.
Toyota’s principal executive offices are located at 1
Toyota-cho,
Toyota City, Aichi Prefecture 471-8571,
Japan. Toyota’s telephone number in Japan is +81-565-28-2121.
The SEC maintains a website (https://www.sec.gov/) that contains reports, proxy and information statements, and other information regarding issuers that file electronically with the SEC. Toyota also maintains a website (https://global.toyota/en/) through which its annual reports on Form
20-F
and certain of its other SEC filings may be accessed. Information contained on or accessible through Toyota’s website is not part of this annual report on Form 20-F.
4.B BUSINESS OVERVIEW
Toyota primarily conducts business in the automotive industry. Toyota also conducts business in finance and other industries. Toyota sold 8,822 thousand vehicles in fiscal 2023 on a consolidated basis. Toyota had sales revenues of ¥37,154.2 billion and net income attributable to Toyota Motor Corporation of ¥2,492.9 billion in fiscal 2023.
Toyota’s business segments are automotive operations, financial services operations and all other operations. The following table sets forth Toyota’s sales to external customers in each of its business segments for each of the past three fiscal years.
Yen in millions |
||||||||||||
Year Ended March 31, |
||||||||||||
2021 |
2022 |
2023 |
||||||||||
Automotive |
24,597,846 | 28,531,993 | 33,776,870 | |||||||||
Financial Services |
2,137,195 | 2,306,079 | 2,786,679 | |||||||||
All Other |
479,553 | 541,436 | 590,749 | |||||||||
Toyota’s automotive operations include the design, manufacture, assembly and sale of passenger vehicles, minivans and commercial vehicles such as trucks and related parts and accessories. Toyota’s financial services business consists primarily of providing financing to dealers and their customers for the purchase or lease of Toyota vehicles. Toyota’s financial services business also provides mainly retail installment credit and leasing
7
through the purchase of installment and lease contracts originated by Toyota dealers. Related to Toyota’s automotive operations, Toyota is working towards having all of its vehicles become connected vehicles, creating new value and reforming businesses by utilizing big data obtained from those connected vehicles, and establishing new mobility services. Toyota’s all other operations business segment includes the information technology related businesses including a web portal for automobile information called GAZOO.com.
Toyota sells its vehicles in approximately 200 countries and regions. Toyota’s primary markets for its automobiles are Japan, North America, Europe and Asia. The following table sets forth Toyota’s sales to external customers in each of its geographical markets for each of the past three fiscal years.
Yen in millions |
||||||||||||
Year Ended March 31, |
||||||||||||
2021 |
2022 |
2023 |
||||||||||
Japan |
8,587,193 | 8,214,740 | 9,122,282 | |||||||||
North America |
9,325,950 | 10,897,946 | 13,509,027 | |||||||||
Europe |
2,968,289 | 3,692,214 | 4,097,537 | |||||||||
Asia |
4,555,897 | 5,778,115 | 7,076,922 | |||||||||
Other* |
1,777,266 | 2,796,493 | 3,348,530 | |||||||||
| * | “Other” consists of Central and South America, Oceania, Africa and the Middle East. |
During fiscal 2023, 23.5% of Toyota’s automobile unit sales on a consolidated basis were in Japan, 27.3% were in North America, 11.7% were in Europe and 19.8% were in Asia. The remaining 17.7% of consolidated unit sales were in other markets.
The Worldwide Automotive Market
Toyota estimates that annual worldwide vehicle sales totaled approximately 81 million units in 2022.
Automobile sales are affected by a number of factors including:
| • | social, political and economic conditions; |
| • | introduction of new vehicles and technologies; |
| • | costs incurred by customers to purchase and operate automobiles; and |
| • | the availability of parts and components that Toyota needs to manufacture its products. |
These factors can cause consumer demand to vary substantially from year to year in different geographic markets and in individual categories of automobiles.
Looking at the global economy in fiscal 2023, the global economy turned toward recovery from the impact of
COVID-19,
but the pace of recovery remained slow due to downward pressure on the economy resulting from high resource prices and rising interest rates stemming from the Ukraine crisis and other factors. In the automobile market, the global strains in supply and demand for semiconductors and the supply shortage of parts continued to force production constraints on a worldwide scale. However, the impact of the production cuts eased toward the second half of the fiscal year.
Looking at the economies of major countries, in the United States, domestic demand continued to be firm due to a favorable employment and income environment and economic stimulus measures, but decelerated due to a shift to monetary tightening in order to control overheating inflation. Europe was most affected by the heightened geopolitical tensions since February 2022, and inflation and high interest rates continued against the
8
backdrop of high energy prices and labor shortages. As a consequence, the economy was sluggish. In Japan, the economy has been steady due to the normalization from the economic effects of the
COVID-19
pandemic, as well as the effects of wage increases. In China, economic activity stagnated due to the zero-coronavirus
policy accompanying the resurgence of COVID-19;
China’s economic growth slowed in 2022. In Emerging countries, the economy has started to recover, following those in developed countries, but some emerging countries, such as Brazil, saw some slowdown in consumption due to rising interest rates and increased inflation. Amid this environment, the automobile market faced a global decline in 2022, making it a difficult year.
year-on-year
In North America, new vehicle sales were approximately 16.60 million units, a decrease from the previous year. In Europe, new vehicle sales also decreased from the previous year at approximately 14.90 million units. Sanctions from Western nations and their withdrawal from Russian-related businesses progressed, causing the Russian market to fall sharply In Asia (including India but excluding Japan and China), new vehicle unit sales increased from the previous year to approximately 10.80 million units. The share of each market across the globe, which Toyota estimates based on the available automobile sales data in each country and region information, was 30% for China, 21% for North America (20% excluding Mexico and Puerto Rico), 19% for Europe and 13% for Asia. In China, new vehicle sales decreased from the previous year to approximately 24.70 million units.
year-on-year.
In the medium- to long-term, Toyota expects the automotive market to continue growing driven principally by growth in China and other emerging countries. However, global competition is expected to be severe, as the pace of technological advancement and development of new products, particularly related to electrification, quickens further, including in response to a heightened global awareness of the environment with a view to carbon neutrality and the strengthening of various regulations in line with such awareness.
The worldwide automotive industry is affected significantly by government regulations aimed at reducing harmful effects on the environment, enhancing vehicle safety and improving fuel economy. These regulations have added to the cost of manufacturing vehicles. Many governments also mandate local procurement of parts and components and impose tariffs and other trade barriers, as well as price or exchange controls as a means of creating jobs, protecting domestic producers or influencing their balance of payments. Changes in regulatory requirements and other government-imposed restrictions can limit or otherwise burden an automaker’s operations. Government laws and regulations can also make it difficult to repatriate profits to an automaker’s home country.
The development of the worldwide automotive market includes the continuing globalization of automotive operations. Manufacturers seek to achieve globalization by localizing the design and manufacture of automobiles and their parts and components in the markets in which they are sold. By expanding production capabilities beyond their home markets, automotive manufacturers are able to reduce their exposure to fluctuations in foreign exchange rates, as well as to trade restrictions and tariffs.
Over the years, there have been many global business alliances and investments entered into between manufacturers in the global automotive industry. There are various reasons behind these transactions including the need to address excessive global capacity in the production of automobiles, and the need to reduce costs and improve efficiency by increasing the number of automobiles produced using common vehicle platforms and by sharing research and development expenses for environmental and other technology, the desire to expand a company’s global presence through increased size; and the desire to expand into particular segments or geographic markets.
Toyota believes that its research and development initiatives, particularly the development of environmentally friendly new vehicle technologies, vehicle safety and information technology, provide it with a strategic advantage.
9
Toyota Philosophy
The automotive industry is experiencing a transformation. We are now striving to transform ourselves into a mobility company. In an era which it is hard to predict the future, Toyota has reflected on the path it has taken thus far and has formulated the “Toyota Philosophy” as a roadmap for the future.
once-in-a-century
Toyota’s mission is “Producing Happiness for All” by expanding the possibilities of people, companies and communities through addressing the challenges of mobility as a mobility company. In order to do so, Toyota will continue to create new and unique value with various partners by relentlessly committing towards (manufacturing), and by fostering imagination for people and society.
monozukuri
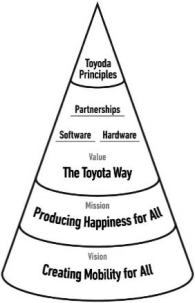 |
MISSION | Producing Happiness for All Using our technology, we work towards a future of convenience and happiness, available to all | ||||
| VISION | Creating Mobility for All Toyota strives to raise the quality and availability of mobility so that individuals, businesses, municipalities and communities can do more, while achieving a sustainable relationship with our planet | |||||
| VALUE | We unite our three strengths (Software, Hardware and Partnerships) to create new and unique value that comes from the Toyota Way | |||||
Toyota Production System (“TPS”)
TPS is imbued with the desire of Sakichi Toyoda, the founder of the Toyota family of companies, and Kiichiro Toyoda, the founder, “to make someone’s work easier.”
TPS was established based on two concepts: which can be loosely translated as “automation with a human touch,” — an idea of stopping equipment immediately when a problem occurs, in order to prevent defective products from being produced — and “” (“JIT”), a concept based on the idea that “each process produces only what is needed for the next process in a continuous flow.” Based on the basic philosophies of and JIT, through TPS, Toyota aims to efficiently and quickly produce vehicles of sound quality, one at a time, to fully satisfy customer requirements.
Jidoka,
Just in Time
jidoka
Toyota believes that improving upon TPS is essential to its future survival. Currently, TPS is being introduced into development departments and administrative departments. Toyota intends to apply TPS to its development departments so that it can be used not only to shorten development times and reduce costs, but also to develop our human resources, thus leading to the manufacturing of ever-better cars that customers will love.
Selected Initiatives
We made a New Management Policy & Direction Announcement on April 7, 2023. Our new management structure’s theme is “inheritance and evolution.” The most important value we have cultivated is “Let’s make
10
ever-better cars!” While talking about cars on the front lines and striving hard to bring smiles to customers’ faces, we continue to pursue ever-better cars. Together with the 370,000 employees of the Toyota group around the world, our suppliers, and our dealers, we all make cars together.
Car-making
is a team effort. We will accelerate the taking on of challenges for the future, with a new management style of “simultaneously and organically working as a team.” Aiming for the Future
We aim to transform into a mobility company. Toyota’s mission is “Producing happiness for all.” For cars to continue being a necessary part of society, we need to change the future of the car. For that, there are two major themes, “carbon neutrality” and “expanding the value of mobility.”
Carbon Neutrality
We are fully committed to achieving carbon neutrality in 2050 over the entire life cycle of our vehicles. When it comes to car manufacturing, we will continue to pursue a variety of options, based on a multi-pathway solutions, to stay close to the future of energy and the realities of each region.
First, we will thoroughly implement whatever electrification we can do immediately. We will strengthen sales of hybrid electric vehicles (“HEVs”), including in emerging markets, and increase our number of
plug-in
hybrid electric vehicle options (“PHEVs”). We will expand our lineup of battery electric vehicles (“BEVs”), which represent one important option, over the next several years. We will do our utmost to develop BEVs and create new business models. We will also accelerate projects for the realization of the hydrogen society that we believe lies just beyond the BEV era. With partners across industries and countries, we will advance the expansion of the realm of hydrogen usage by such means as social implementation in Thailand and Fukushima, the mass production of commercial fuel cell electric vehicles (“FCEVs”), and the development of hydrogen engine technologies in the arena of motorsports. Furthermore, we will work with the energy industry to develop technologies for carbon-neutral fuels, including next-generation biofuels and synthetic fuels.
We will work to promote electrified vehicles and reduce CO
2
emissions while leaving no one behind, including in emerging markets. Through this all-direction
approach, we aim to reduce average CO2
emissions for vehicles we sell worldwide by 33% or greater by 2030 and by 50% or greater by 2035 compared to 2019. We will continue to promote decarbonization globally and steadily toward 2050. Expanding the Value of Mobility
The cars of the future will become more connected to society as they become more electrified, intelligent, and diversified. In addition to moving people’s hearts and emotions and moving people and goods, we will gather the movements of energy and information and link them together as one through data. By doing so, we will be able to provide seamless mobility experiences that are connected with other mobilities, as well as provide new value for cars as part of the social infrastructure. Cars connected to society will also be closely connected to various services that support people’s daily lives, such as telecommunications and finance, expanding the circle of new value-added services centered on mobility.
Toyota Mobility Concept
We have developed “Toyota Mobility Concept” as our vision of the mobility society that we are aiming for. Evolving the car to be more useful to society based on its essential values that have been cultivated over time, such as safety, security, and being fun to drive — to strive toward such a future, we will continue our transformation into a mobility company in following three domains.
11
The first is “Mobility 1.0.” What we aim for in this is to expand the value of the car by connecting various types of movement. For example, BEVs offer new mobility possibilities for the transport of electricity. Collectively serving as an energy grid, BEVs can enhance the energy security of society. That is the kind of role that BEVs can also fulfill. Also, intelligence can evolve cars even further by utilizing information gathered from cars and customers. Our software platform Arene holds the key to this new kind of
car-making.
Connecting the latest hardware and software will enable cars and various software applications to freely connect. Arene will fulfill an important role as a platform to support this kind of evolution. We will do our utmost to develop a next-generation BEV for 2026 together with Woven by Toyota, Inc. What we aim for in the second domain, “Mobility 2.0,” is to expand mobility into new realms. There are many people whose mobility we are currently not able to support as we would like, such as the elderly, people living in depopulated areas, and people in emerging markets in which the car market has yet to mature. New mobility possibilities, such as mobility in the sky, are also expanding. Toyota, in addition to having a full lineup of vehicles, has new forms of mobility, such as the
e-Palette,
as well as a network of colleagues across industries, such as those in the Mobility as a Service (“MaaS”) space. Leveraging these strengths, we would like to go beyond our current scope of business to provide greater mobility support to our customers around the world. “Mobility 3.0” is about integration with social systems. We aim to create mobility ecosystems integrated with cities and society that tie into energy and transportation systems, logistics, as well as the way we live, and a future that realizes well-being. To do this, we will proceed with our demonstration experiments in Woven City. For example, we will advance our development of new logistics systems and the development of city-integrated autonomous mobility, as well as demonstrations that start from Woven City of a CO
2
-free hydrogen supply chain and of expanding the potential of hydrogen use in our daily lives. In addition to these demonstrations to date, which have utilized digital technologies, from 2025 we will accelerate comprehensive demonstrations in real cities, leading to social implementation together with our partners. The most important message we want to convey through our mobility concept is that mobility lies beyond the evolution of the car. Cars lie at the center of our transformation into a mobility company. In order to expand the possibilities of cars, it is necessary to evolve based on the concepts of and “ever-better cars,” which we have long cultivated. We will change the future of cars based on our products and regions.
“Best-in-Town”
Product-centered Management
Toyota Mobility Concept is centered on enhancing the value of the car, expanding new mobility and freedom of movement, and providing new services and energy solutions as part of social systems. The three approaches that hold the key to realizing this vision are electrification, intelligence, and diversification.
Electrification will be based on a multi-pathway approach. We will continue to tailor electrification to the needs of customers and individual regions by drawing on the strengths and characteristics of each vehicle type. We will expand our current lineup of BEVs, aiming to release ten new models by 2026 and set a pace to sell 1.5 million units annually by then. Further, we expect to launch a new generation of BEVs in 2026 that would double the driving range compared to that of the current bZ4X by using batteries with far greater efficiency, while also offering designs and driving performance to set hearts racing.
In addition, by drawing on the strengths of our Toyota Production System (“TPS”), we will change the way we work to reduce the number of processes for the BEV production line by half. This will entail a shift to more efficient lines, including autonomous inspections and unmanned transport powered by connected technology. We also aim to achieve carbon neutrality at all of our global plants by 2035. Also, we will overhaul existing supply chains by working with suppliers to procure superior quality parts at lower prices.
To realize these transformations, we are creating a new specialized unit to develop BEVs. This specialized unit will work under a single leader entrusted with full authority to handle every function, from development to
12
production and business operation. We will take part in a wide range of business opportunities through our polished competitiveness as demonstrated by the Toyota New Global Architecture (“TNGA”) having the effect of halving our development intensity and
in-house
investment as compared to those before the adoption of TNGA, and our 10-million
unit vehicle sales value chain. For PHEVs, by increasing battery efficiency to extend the
EV-mode
driving range beyond 200 km, we will reposition PHEVs as “the practical BEV” and will work harder on developing this as another BEV option. For FCEVs, we will pursue mass production centered on commercial vehicles. One feature of FCEVs is that the energy source, hydrogen, is lightweight, so even when traveling longer distances the vehicle will not be as heavy as a comparable BEV, and less space for storage of the energy source is required. Refueling is also much quicker. We plan to promote FCEVs by starting with commercial vehicles, which permit us to take advantage of these strengths.
The second approach is intelligence. Intelligence will expand connectivity between cars, services, and society. The shift to intelligent cars will involve expanding advanced safety technology, multimedia, and other constantly evolving feature updates to all of our vehicles. At the same time, alongside advances in the onboard operating system, our next-generation BEVs will enable users to customize “ride feel” according to their preferences for how the vehicle runs, turns, and stops. By also honing the vehicles’ essential attributes, we will create cars that are more fun to drive in terms of both hardware and software.
Intelligent services will include new services that connect cars to cities and infrastructure. This year, we plan to commence social implementation of logistics systems that use real-time traffic information to boost transport efficiency, and systems that provide optimal energy management. Partnering with cities and public facilities, we will also expand our BEV charging network, while providing a variety of services that support the energy grid and people’s lives. These efforts are already underway at Lexus.
With respect to intelligence in society, we will conduct demonstration experiments regarding various ways of connecting people, cars, and society in Woven City, which we have positioned as our “mobility test course.” We will use Woven City to address issues that come to light through social implementation of connected logistics services, before implementing these services in society. By repeating this process, we will accelerate the realization of an intelligent society.
Finally, we come to diversification. Our approach to diversification goes beyond cars to mobility itself, and even the energy sector. The diversification of cars will involve expanding our product lineup, services that utilize connected technology, as well as parts and accessories businesses in collaboration with new partners.
With respect to diversification of mobility, we have developed an easy-lock system for securing wheelchairs with a single motion, utilizing the
know-how
we have accumulated over many years of developing welfare vehicles, and we plan to start installing this system in vehicles. As for energy diversification, we have started demonstration experiments using hydrogen made from water, food loss and other waste, as well as carbon-neutral fuels made from biomass and other resources, in Japan and Thailand. Our energy use technology will also be strengthened in the field of motorsports with an aim to promoting widespread adoption in society.
Region-centered Management
We have refined the performance and cost of hybrid vehicles with each successive generation. As a result, we have been able to enhance greatly their earning power while investing in the future, growing with stakeholders, and reducing CO
2
emissions. This is precisely an achievement of our region-centered management, which is based on our efforts to make ever-better cars. We will continue to deepen our region-centered management and further solidify our business foundation. 13
To do so, the first thing that we must address is how to achieve carbon neutrality. Carbon knows no borders, and CO
2
emission is an issue that cannot wait. We need to immediately start with what we can do. Therefore, to spread the use of electrified vehicles as quickly as possible and as much as possible, we need to be very attentive to the needs of our customers by taking into account local conditions and the diverse ways of using cars. Thus, along with enhancement of the BEV lineup, we will continue to enhance the attractiveness and competitiveness of all powertrains, including HEVs and PHEVs. In developed countries, in parallel with the preparation of BEVs, we will expand our product lineup, with a focus on the bZ series. In the U.S., we will start the local production of a
three-row
SUV in 2025 that will be equipped with batteries to be produced in North Carolina, and we seek to increase our battery production capacity. In China, we will launch two models of locally developed BEVs in 2024, fit to the local needs, and we plan to continue to increase the number of models in the following years. In Asia and other emerging markets, we will make sure to respond to the growing demand for BEVs, starting with local production of BEV pickup trucks, and also by launching a compact BEV model by the end of the year.
In developed countries, the switch to BEVs is moving forward as the market matures, while in emerging markets, the market is expected to expand due to demand for new and additional vehicles. Toyota, with its full lineup and profitable HEVs and PHEVs, along with its diverse options of BEVs that it will be strengthening, will make sure to meet a wide range of global demand and is committed to further growth. For growth in emerging markets, profitable HEVs will be used as a source of income, and with a value chain supporting the sale of approximately 10 million units per year, we will also take part in a wide range of business opportunities. In addition, we will achieve cost reductions and (continuous improvement) by leveraging the strengths of the Toyota Production System (TPS), and thereby enhance our future investment capacity for the expansion of growth in BEVs and mobility areas, as well as establish a strong business foundation whereby carbon neutrality and growth can both be achieved.
Kaizen
While the technological innovations of electrification, intelligence and diversification are progressing, we would like to take on the challenge of contributing to regions in which we operate and to the overall good. For example, in the United States, the automotive industry is at a critical juncture, with people moving away from manufacturing and with structural costs increasing. By combining worksite-honed craftsman skills with intelligence to propose new ways of manufacturing and new “automation with human intelligence” processes, we want to do our part in preserving manufacturing in the United States while solving the country’s labor shortage problem. We also plan to start collaborations with Charoen Pokphand and the Siam Cement Group in Thailand. This is the start of an implementation that uses electrification and connected technologies to connect vehicles, people and information, and utilize mobility as part of the social infrastructure. Through these initiatives, we will take on the challenge of solving regional problems such as serious traffic congestion, air pollution and frequent road accidents.
Let’s Change the Future of Cars!
No matter how times change, Toyota is a company that manages by way of its products. And we are a company that intends to produce happiness for all by responding to the diversification of its customers and societies around the world. There is a future mobility society that Toyota in particular can aim for because it has refined the strength of its full lineups worldwide.
In an uncharted era, we believe that it is action based on strong will and passion that will change the future. Together with our colleagues, we will challenge ourselves to think outside the box. We believe that a future of mobility, one that is unique to carmakers and to Toyota, lies ahead. Let’s change the future of cars! This is our theme as we aim to become a mobility company.
Based on our unshakable motives, we will take on challenges with strong will and passion.
14
Misconduct of Hino and Daihatsu in Relation to Their Applications for Certification
On March 4, 2022, Hino, a consolidated subsidiary of Toyota, announced that it identified past misconduct in relation to its applications for certification concerning emissions and the fuel economy performance of its vehicle engines for the Japanese market. Hino subsequently received an investigation report from a special investigation committee consisting of outside experts concerning this matter. Hino also was subject to an
on-site
inspection from the Ministry of Land, Infrastructure, Transport and Tourism (“MLIT”), and received a corrective action order from it. On October 7, 2022, Hino submitted a recurrence prevention report to MLIT. To clarify management responsibility regarding this matter, Hino decided to have four persons who were directors or senior managing officers resign, reduce the remuneration of directors, and request the voluntary return of part of the remuneration of certain past representative directors. Further, Hino formulated and announced “Three Reforms,” namely reforms to management, corporate culture and vehicle manufacturing, to prevent future misconduct. Hino is committed to addressing this issue head on and living out with renewed intent its corporate mission: “We make a better world and future by helping people and goods get where they need to go.” See “Item 4. Information on the Company — 4.B Business Overview — Legal Proceedings” for a discussion of related legal proceedings, including government investigations and actions. Furthermore, on April 28, 2023, Daihatsu announced and disclosed that it had committed procedural irregularities in approval applications for side collision tests for vehicles developed by Daihatsu destined for overseas markets. During the subsequent
in-house
inspection, it was newly discovered and announced that Daihatsu identified irregularities in the certification procedures for the side impact collision tests of Daihatsu ROCKY HEVs and Toyota RAIZE HEVs. The irregularities were promptly reported to, and consultations were undertaken, with the inspection and certification authorities after they were discovered, and shipments and sales of the vehicles at issue were suspended in the countries in which approval had been granted. In addition, Daihatsu has confirmed and reported that the vehicles at issue conform to laws and regulations in in-house
re-tests
using proper parts. Daihatsu has established a third-party committee consisting of external experts in legal and technical matters to fully clarify the nature of the irregularities and identify their root cause; it has also asked the committee to recommend measures to prevent the recurrence of similar irregularities by examining the company’s organization and development processes. In the wake of the large-scale recalls that occurred in 2009, Toyota promised its customers around the world that it would not “run away, hide, or lie.” Given this, we take very seriously the fact that these problems nevertheless occurred in our group. For this matter, as the chief executive officer, Toyota’s President will further strive to improve the car manufacturing operations of Toyota and the group companies, while the Chairman of the Board of Toyota will lead initiatives to strengthen governance and compliance.
On May 12, 2023, the top management of each group company gathered to discuss Toyota’s commitment to facing manufacturing with sincerity and renewed our recognition of this goal. We are currently working with all of our group companies to
re-examine
our past governance structure, including our own, and have begun a thorough review. We view this case not as an individual or workplace issue, but rather a company-wide issue where an individual or workplace was forced to commit a wrongdoing. Together with Daihatsu, we are committed to listening to the voices of those on the front lines and carefully responding to the situation. At Toyota worksites, everyone is committed to making better cars. Toyota is a company where, when a problem occurs, everyone always stops, pursues the root cause by going and seeing the location or process where the problem exists, makes improvements, and works to prevent recurrence. This is the Toyota philosophy that has been cherished since the company’s founding. We believe that there is no other way to regain the trust of our customers than for all of Toyota and its group companies to return to this philosophy once again, for each group company’s top management to confront the problems at their respective workplaces, uncover them, and make improvements one by one, and continue this steady effort. The entire Toyota group will work together to regain trust of our customers as soon as possible.
15
Memorandum of Understanding concerning conducting a business combination of Mitsubishi Fuso and Hino Motors
On May 30, 2023, Toyota, Daimler Truck Holding AG (“Daimler Truck”), Mitsubishi Fuso Truck and Bus Corporation (“MFTBC”) and Hino entered into a Memorandum of Understanding (MoU) on accelerating the development of advanced technologies and conducting a business combination of MFTBC and Hino. Daimler Truck, MFTBC, Hino, and Toyota intend to collaborate toward achieving carbon neutrality and creating a prosperous mobility society by developing CASE technologies and strengthening the commercial vehicle business on a global scale.
The MoU contemplates that MFTBC and Hino will integrate on an equal footing and collaborate in the areas of commercial vehicle development, procurement, and production, and that they will seek to build a globally competitive Japanese commercial vehicle manufacturer. The MoU further contemplates that Daimler Truck and Toyota will equally invest in the (listed) holding company of the integrated MFTBC and Hino, and that they will seek to collaborate on the development of hydrogen and other CASE technologies to support the competitiveness of the new company.
Details on the scope and nature of the collaboration, including the name, location and corporate structure of the new holding company will be discussed. The parties envisage signing of definitive agreements regarding the business combination in the first quarter of 2024 and aim to close the transaction by the end of 2024.
Automotive Operations
Toyota’s sales revenues from its automotive operations were ¥33,820.0 billion in fiscal 2023, ¥28,605.7 billion in fiscal 2022, and ¥24,651.5 billion in fiscal 2021.
Toyota produces and sells passenger vehicles, minivans and commercial vehicles such as trucks. Toyota Motor Corporation’s subsidiary, Daihatsu, produces and sells mini-vehicles and compact cars. Hino, also a subsidiary of Toyota Motor Corporation, produces and sells commercial vehicles such as trucks and buses. Toyota also manufactures automotive parts, components and accessories for its own use and for sale to others.
Vehicle Models and Product Development
Toyota’s vehicles (produced by Toyota, Daihatsu and Hino) can be classified largely into electrified vehicles and conventional engine vehicles. Toyota’s product
line-up
includes subcompact and compact cars, mini-vehicles, mid-size,
luxury, sports and specialty cars, recreational and sport-utility vehicles, pickup trucks, minivans, trucks and buses. Toyota’s luxury cars are sold in North America, Europe, Japan and other regions, primarily under the Lexus brand name. In fiscal 2021, despite the suspension of operations at factories and the suspension of business at dealers due to the impact of
COVID-19,
Toyota launched various new models as planned. The new Harrier, an SUV for the new era, was designed to resonate with the heart of the driver, with a focus on sensory quality from the first moment of seeing, riding and driving off in it, rather than relying on utility or numerical performance. The new Mirai featured a design that appeals to the senses, a distinctive driving experience, industry-leading innovation, and cruising range that gives peace of mind as its concept, while generating zero emissions, and will serve as a new departure point for creating a hydrogen-based society of the future. In the Lexus brand, we launched the UX 300e, which offers the high-quality driving performance and excellent quietness unique to Lexus BEVs, the high reliability and convenience of the electrification technology cultivated in the manufacture of hybrid models, and the distinctive design and high functionality of the Lexus UX. GR Yaris is the first Toyota vehicle developed with the reversed concept of turning a motorsports car into a production car. The car was evaluated by Master Driver Morizo (the racing driver name for Akio Toyoda) and non-Toyota
professional drivers from the early stages of development, and even after it was unveiled at the Tokyo Auto Salon 2020, it underwent repeated 16
cycles of evaluation and improvement at the circuit before it was finally launched. As a result of our efforts to further streamline costs following the Lehman Brothers bankruptcy and the “ever better cars manufacturing” initiative, the compact car, Yaris, won the Car of the Year in Europe, a place where people have continued to have strong passion for cars in its long automotive history. The award recognized Yaris’s features and fuel efficiency as a HEV.
fun-to-drive
In fiscal 2022, Toyota launched the first-ever SUV Corolla model, Corolla Cross. Since the launch of the first-generation in 1966, the Corolla series has continued to evolve and embrace new challenges and has sold more than 50 million units worldwide. The Noah and Voxy, cars supported and loved by many customers, including families among others, were completely redesigned as minivans with the further increased ease of use and enhanced advanced fixtures. In pursuit of a suite of features designed to enable customers to drive their vehicles every day with joy, safety, peace of mind, and comfort, while also realizing superior environmental performance, Toyota launched the HEV Aqua, which is the world’s first vehicle to use a high-output bipolar nickel-hydrogen battery as an electric drive battery. With elevated levels of driving performance, design, and advanced technology, the
all-new
NX, which is the first model to introduce the next generation of Lexus, is accelerating the proliferation of electrified models by being Lexus’ first-ever PHEV also offered as a HEV. In addition, the new Toyota bZ series of BEVs that are easy to use and highly appealing, and the introduction of this series is a part of Toyota’s efforts to reduce CO2
emissions. Toyota launched the bZ4X, the first of the bZ series, which offers, in addition to a comfortable cabin, a new lifestyle and the opportunity to spend precious time with family and friends as well as the BEV’s unique joy of driving. For motorsports cars, Toyota developed the GRMN Yaris as “embodiments of making ever-better motorsports-bred cars.” In fiscal 2023, Toyota launched the package. The “Sedan” is a new formal design that meets the needs of chauffeurs, whereas the “Estate” is a functional SUV with a mature atmosphere and ample driving space. The new series will be rolled out in about 40 countries and regions. Launched in 1997 as the world’s first mass-produced hybrid car, the Prius has driven uptake of HEVs as a
all-new
Crown. While inheriting the Crown’s DNA of innovation and limit-pushing, it has been renewed as a flagship for a new era with four variations to meet the diverse values and lifestyles of customers. In addition to the “Crossover type,” a new style that combines a sedan and an SUV, the “Sport” offers a sporty driving experience with an enticing atmosphere and an easy-to-drive
new-generation
eco-car
with outstanding fuel efficiency; under the “Hybrid Reborn” concept, the Prius was renewed as an exhilarating package that adds a design inspiring love at first sight and captivating driving performance to its core strength as an environmentally friendly car. For sportscars, the development of the GR Corolla, including a hydrogen engine-equipped GR Corolla designed to participate in the Super Taikyu endurance race series, has carried forth the torch of making ever-better motorsports-bred cars. In addition, the Lexus brand announced its first globally-available pure BEV model, the all-new
RZ. The new RZ marks Lexus’ transition into a BEV-centered
brand, and embodies the unique Lexus vehicle design and driving experience brought on by advanced electrification technology. 17
Markets, Sales and Competition
Toyota’s primary markets are Japan, North America, Europe and Asia. The following table sets forth Toyota’s consolidated vehicle unit sales by geographic market for the periods shown. The vehicle unit sales below reflect vehicle sales made by Toyota to unconsolidated entities (recognized as sales under Toyota’s revenue recognition policy), including sales to unconsolidated distributors and dealers. Vehicles sold by Daihatsu and Hino are included in the vehicle unit sales figures set forth below.
Thousands of Units |
||||||||||||||||||||||||
Year Ended March 31, |
||||||||||||||||||||||||
2021 |
2022 |
2023 |
||||||||||||||||||||||
Market |
Units |
% |
Units |
% |
Units |
% |
||||||||||||||||||
Japan |
2,125 | 27.8 | % | 1,924 | 23.4 | % | 2,069 | 23.5 | % | |||||||||||||||
North America |
2,313 | 30.3 | 2,394 | 29.1 | 2,407 | 27.3 | ||||||||||||||||||
Europe |
959 | 12.5 | 1,017 | 12.4 | 1,030 | 11.7 | ||||||||||||||||||
Asia |
1,222 | 16.0 | 1,543 | 18.7 | 1,751 | 19.8 | ||||||||||||||||||
Other* |
1,027 | 13.4 | 1,352 | 16.4 | 1,565 | 17.8 | ||||||||||||||||||
Total |
7,646 |
100.0 |
% |
8,230 |
100.0 |
% |
8,822 |
100.0 |
% | |||||||||||||||
| * | “Other” consists of Central and South America, Oceania, Africa and the Middle East, etc. |
The following table sets forth Toyota’s vehicle unit sales and market share in Japan, North America, Europe and Asia on a retail basis for the periods shown. Each market’s total sales and Toyota’s sales represent new vehicle registrations in the relevant year (except for the Asia market where vehicle registration does not necessarily apply). All information on Japan excludes mini-vehicles. The sales information contained below excludes unit sales by Daihatsu and Hino, each a consolidated subsidiary of Toyota. Vehicle unit sales in Asia do not include sales in China.
Thousands of Units |
||||||||||||
Year Ended March 31, |
||||||||||||
2021 |
2022 |
2023 |
||||||||||
Japan |
||||||||||||
Total market sales (excluding mini-vehicles) |
2,901 |
2,664 |
2,696 |
|||||||||
Toyota sales (retail basis, excluding mini-vehicles) |
1,505 | 1,361 | 1,377 | |||||||||
Toyota market share |
51.9 | % | 51.1 | % | 51.1 | % | ||||||
Thousands of Units |
||||||||||||
Year Ended December 31, |
||||||||||||
2020 |
2021 |
2022 |
||||||||||
North America |
||||||||||||
Total market sales |
17,157 |
17,861 |
16,597 |
|||||||||
Toyota sales (retail basis) |
2,408 | 2,681 | 2,445 | |||||||||
Toyota market share |
14.0 | % | 15.0 | % | 14.7 | % | ||||||
Europe |
||||||||||||
Total market sales |
16,638 |
16,870 |
14,897 |
|||||||||
Toyota sales (retail basis) |
993 | 1,076 | 1,081 | |||||||||
Toyota market share |
6.0 | % | 6.4 | % | 7.3 | % | ||||||
Asia (excluding China) |
||||||||||||
Total market sales |
8,181 |
9,224 |
10,757 |
|||||||||
Toyota sales (retail basis) |
969 | 1,189 | 1,382 | |||||||||
Toyota market share |
11.8 | % | 12.9 | % | 12.8 | % | ||||||
18
Japan
Japan is one of the leading countries with respect to technological advancements and improvements in the automotive industry and will continue to demonstrate such strength. Toyota strives to earn customer satisfaction by introducing products distinctive of Japan’s manufacturing ability such as value-added products including Lexus models, FCEVs, PHEVs and HEVs, vehicles with three-seat rows and mini-vehicles. Toyota endeavors to secure and maintain its significant share of and position atop, the Japanese market. Toyota held a domestic market share (excluding mini-vehicles) on a retail basis of 51.9% in fiscal 2021, 51.1% in fiscal 2022 and 51.1% in fiscal 2023.
Although Toyota’s principle is to conduct production in regions where it enjoys true competitiveness, it considers Japan to be the source of its good manufacturing practices. Having 16 production sites in Japan, Toyota supports its operations worldwide through measures such as the development of new technologies and products,
low-volume
vehicles to complement local production, production of global vehicle models which straddle multiple regions and supporting overseas factories. North America
The North American region is one of Toyota’s most significant markets. The United States, in particular, is the largest market in the North American region, accounting for 86% of Toyota’s retail sales in the region. In the region, Toyota has in recent years reorganized its production structure and made improvements to its product lineup. In addition, Toyota has a wide product lineup in every segment (excluding large trucks and buses).
Toyota’s North American production capacities include the production of vehicle models such as the RAV4, Camry, Tacoma and Highlander through 13 manufacturing entities.
In November 2021, Toyota created Toyota Battery Manufacturing, North Carolina (“TBMNC”) as the first plant to produce automotive batteries for Toyota in North America. When it comes online in 2025, it is expected that TBMNC will have four production lines, each capable of delivering enough
lithium-ion
batteries for 200,000 vehicles — with the intention to expand to at least six production lines for a combined total of up to 1.2 million vehicles per year. In June 2023, Toyota decided to assemble an
all-new,
three-row
battery electric SUV at Toyota Motor Manufacturing Kentucky, Inc. (“TMMK”) starting in 2025. The BEV will be powered by batteries from TBMNC. Toyota has five research and development centers in North America. As for vehicle development, the Toyota Technical Center spearheads the design, planning, and evaluation of vehicles and parts as to their ability to meet customer needs.
Europe
Toyota’s principal European markets are Germany, France, the United Kingdom, Italy and Spain. In the European markets, as a full-lineup car manufacturer, Toyota aims to increase its global vehicle sales with a focus on electrified vehicles (HEVs, PHEVs, FCEVs and BEVs) that suit the needs of customers and the circumstances of each region.
In terms of production, to strengthen its business setup so that it is less likely to be affected by exchange rates, Toyota produces models such as the Corolla, Yaris and
C-HR
locally through six entities in Europe. In addition, Toyota is actively promoting production and sales measures that meet local demand by strengthening its value chain including used car dealerships, after-sales services and finance and insurance services. 19
Asia
Toyota’s principal Asian markets are Thailand, India, Indonesia and Taiwan.
In light of the importance of the Asian market that is further expected to grow in the long term, Toyota aims to build an operational framework that is efficient and self-reliant, as well as a predominant position in the automotive market in Asia. Toyota has responded to increasing competition in Asia by making strategic investments in the market and developing relationships with local suppliers. Toyota believes that its existing local presence in the market provides it with an advantage over new entrants to the market and expects to be able to promptly respond to demand for vehicles in the region.
In terms of production, Toyota manufactures models such as the Hilux, Hiace, Corolla, Camry and Vios through 15 entities. Toyota’s plants in Thailand, not only to meet domestic demand but also to serve as a production base for locations inside and outside of the ASEAN region.
China
Toyota has been conducting operations in China in large part through joint ventures, and its success in producing products that meet local demands and in establishing its sales and service network has significantly contributed to Toyota’s profits. Based on the firm business foundation that it has established, Toyota is conducting its operations with the aim of promoting further growth and increasing profitability through further development of its sales and service network and expansion of its product lineup.
In terms of production, Toyota has been conducting a significant portion of its China business, including in relation to the production and sales of vehicles, through joint ventures. Toyota has two major joint venture partners in China, namely, China FAW Group Corporation and Guangzhou Automobile Group Co., Ltd. The joint venture with China FAW Group manufactures models such as the Corolla, Vios, RAV4, bZ4X and bZ3 and the joint venture with Guangzhou Automobile Group Co., Ltd. manufactures models such as the Camry, Yaris, Highlander and bZ4X.
Total vehicle sales in the Chinese market were 24.62 million vehicles in 2022, 97.8% of that of 2021, and 25.17 million vehicles in 2021, approximately the same as the 25.21 million vehicles in 2020. In this market, Toyota’s sales were 1.94 million vehicles in 2022, 100.0% of that of 2021, and 1.94 million vehicles in 2021, 107.8% of that of 2020. In the domestically produced passenger vehicle market in mainland China (21.89 million vehicles), Toyota had a market share of 8.8%. Toyota has been expanding the distribution network for locally produced vehicles in cooperation with China FAW Group and Guangzhou Automobile Group under the names Tianjin FAW Toyota Motor Co., Ltd. and Guanqi Toyota Motor Co., Ltd., respectively, and for imported vehicles, Toyota has also been expanding primarily the Lexus brand sales network. Toyota plans to further increase sales by expanding the number of dealers and its product lineup. In addition, as the market in China develops and becomes more sophisticated, Toyota plans to promote
so-called
“Value Chain” businesses, such as used car sales, services, financing and insurance, so as to contribute to the development of a mobility society. South and Central America, Oceania, Africa and the Middle East
Toyota’s consolidated vehicle sales in South and Central America, Oceania, Africa and the Middle East (collectively, the “Four Regions”) in fiscal 2022 were 1,352 thousand units, 131.7% of that of the prior fiscal year. Toyota’s principal markets in the Four Regions are Brazil and Argentina in South and Central America, Australia in Oceania, South Africa in Africa and Saudi Arabia in the Middle East. The core models in the Four Regions are global models such as the Corolla, IMV (the Hilux) and Camry.
Toyota has seven production bases in the Four Regions. In these regions, which are expected to become increasingly important to Toyota’s business strategy, Toyota aims to continue developing new products which meet the specific demands of each region, increasing production and promoting sales.
20
Production
Toyota and its affiliated companies produce automobiles and related components through more than 50 overseas manufacturing organizations in 26 countries and regions aside from Japan. Facilities are located principally in Japan, the United States, Canada, the United Kingdom, France, Turkey, Czech Republic, Poland, Thailand, China, Taiwan, India, Indonesia, South Africa, Argentina and Brazil. See “Item 4. Information on the Company — 4D. Property, Plants and Equipment” for a description of Toyota’s principal production facilities.
In promoting a sustainable growth strategy, establishing a system capable of providing optimal supply of products in the global market is integral to Toyota’s strategy.
In line with its basic policy of manufacturing in countries or regions where there is demand and where Toyota is truly competitive, Toyota will make efficient use of and maximize capacity utilization at its existing plants to respond to the expanding market and will continue to focus on making efficient capital investments as necessary.
Furthermore, Toyota will continue to place top priority on safety and quality in strengthening true competitiveness with the aim of achieving sustainable growth.
The following table shows Toyota’s worldwide vehicle unit production by geographic market for the periods shown. These production figures do not include vehicles produced by Toyota’s unconsolidated affiliated companies. The sales unit information elsewhere in this annual report includes sales of vehicle units produced by these affiliated companies. Vehicle units produced by Daihatsu and Hino are included in the vehicle unit production figures set forth below.
Thousands of Units |
||||||||||||
Year Ended March 31, |
||||||||||||
2021 |
2022 |
2023 |
||||||||||
Japan |
3,948 | 3,738 | 3,789 | |||||||||
North America |
1,641 | 1,751 | 1,768 | |||||||||
Europe |
642 | 707 | 771 | |||||||||
Asia |
1,015 | 1,499 | 1,859 | |||||||||
Other* |
306 | 463 | 507 | |||||||||
Total |
7,553 | 8,158 | 8,694 | |||||||||
| * | “Other” consists of Central and South America and Africa. |
Toyota closely monitors its actual units of sale, market share and units of production data and uses this information to allocate resources to existing manufacturing facilities and to plan for future expansions.
See “Item 4. Information on the Company — 4B. Business Overview — Capital Expenditures and Divestitures” for a description of Toyota’s recent investments in completed plant constructions and for a description of Toyota’s current investments in ongoing plant constructions.
Distribution
Toyota’s automotive sales distribution network is the largest in Japan. As of March 31, 2023, this network consisted of 244 dealers employing approximately 110 thousand personnel and operating approximately 4.6 thousand sales and service outlets. TOYOTA Mobility Tokyo Inc. is the only dealer owned by Toyota and the rest are independent.
Toyota believes that this extensive sales network of independent local interests has been an important factor in its success in the Japanese market. A large number of the cars sold in Japan are purchased from salespersons
21
who visit customers in their homes or offices. In recent years, however, the traditional method of sales through home visits is being replaced by showroom sales, and the percentage of automobile purchases through showrooms has been gradually increasing. Toyota expects this trend to continue even after the
COVID-19
related crisis, and accordingly is working to improve its sales activities such as customer reception and meticulous service at showrooms, as well as online sales, to increase customer satisfaction. Sales of Toyota vehicles in Japan had been conducted through four sales channels until April 2020, but from May 2020 shifted to a framework where all of its Japanese-market vehicle models are made available through all sales outlets in Japan. In addition, Toyota introduced the Lexus brand to the Japanese market in August 2005, and currently distributes the Lexus brand vehicles through a network of 183
new-vehicle
sales outlets dedicated to the Lexus brand in order to enhance its competitiveness in the domestic luxury automotive market. The following table provides information on the dealer network as of March 31, 2023. Dealers | ||||||
Channel |
Toyota Owned |
Independent |
Outlets | |||
Toyota brand |
1 company | 240 companies | 4,419 outlets | |||
Lexus brand |
22 outlets | 161 outlets | 183 outlets | |||
Outside Japan, Toyota vehicles are sold through approximately 168 distributors in approximately 204 countries and regions. Through these distributors, Toyota maintains networks of dealers. The chart below shows the number of Toyota distributors as of March 31, 2023 by country and region:
Country/Region |
Number of Countries |
Number of Distributors |
||||||
North America |
3 | 5 | ||||||
Europe |
53 | 29 | ||||||
China |
1 | 4 | ||||||
Asia (excluding China) |
19 | 13 | ||||||
Oceania |
17 | 15 | ||||||
Middle East |
16 | 14 | ||||||
Africa |
56 | 48 | ||||||
Central and South America |
39 | 40 | ||||||
BEV Strategies
On December 14, 2021, Toyota held a briefing on its BEV strategy where it announced that it would be boosting its plans for BEV sales in 2030 from 2 million to 3.5 million units, and that Lexus was aiming for BEVs to account for 100 percent of its sales in Europe, North America, and China by the same year, followed by BEVs accounting for 100 percent of its sales globally starting in 2035.
Toyota believes that achieving carbon neutrality means realizing a world in which all people living on this planet continue to live happily. We want to help realize such a world. This has been and will continue to be Toyota’s wish and our mission as a global company. For that challenge, we need to reduce CO
2
emissions as much as possible, as soon as possible. Energy plays a critical role in achieving carbon neutrality. At present, the energy situation varies greatly from region to region. That is exactly why Toyota is committed to providing a diversified range of carbon-neutral options to meet whatever the needs and situations might be in every country and region. In this diversified and uncharted era, it is important to flexibly change the type and quantity of products produced while keeping an eye on market trends. We believe that the reduction in lead times and
high-mix,
low-volume
production methods that we have cultivated through the TPS, along with the steady efforts of Japanese manufacturing, will enable us to be competitive going forward. 22
In terms of vehicle production, we believe that all electrified vehicles can be divided into two categories, depending on the energy that they use. One category is that of “carbon-reducing vehicles.” If the energy that powers vehicles is not clean, the use of an electrified vehicle, no matter what type it might be, would not result in zero CO
2
emissions. The other category is that of “carbon-neutral vehicles.” Vehicles in this category run on clean energy and achieve zero CO2
emissions in the whole process of their use. We at Toyota will strive to realize such vehicles. The Toyota brand now offers more than 100 models of engine-only vehicles, HEVs, PHEVs, and FCEVs in more than 170 countries and regions. The Lexus brand has introduced more than 30 models of engine-only vehicles, HEVs, and PHEVs in more than 90 countries and regions. Furthermore, we plan to expand the options for carbon neutral vehicles by offering a full lineup of BEVs. Specifically, we plan to roll out 30 Toyota and Lexus brand BEV models by 2030, offering a full lineup of BEVs globally in both the passenger and commercial vehicle segments.
In August 2022, Toyota announced that it will invest up to 730 billion yen in Japan and the United States toward supplying automotive batteries for BEVs, aiming to begin battery production between 2024 and 2026. Through this investment, we aim to boost production capacity by up to 40 GWh. In May 2023, Toyota also announced its plan to further invest $2.1 billion in its battery manufacturing plant in the United States for new infrastructure to support future expansion. Toyota will continue working to build a supply system that can steadily meet the growing demand for BEVs around the world.
At the New Management Policy & Direction Announcement held on April 7, 2023, Toyota announced that it will expand its current BEV lineup, aim to introduce ten new BEV models by 2026, and set a pace for annual sales of 1.5 million Toyota and Lexus brand BEV units by 2026. In addition, Toyota has plans to release next-generation BEVs in 2026 that will double the driving range compared to that of the current bZ4X by using batteries with greater efficiency.
Plans for the release of BEVs in each region are as follows.
| Developed countries | In parallel with the preparation of new models scheduled for launch in 2026, with a focus on the bZ series and with further refined performance, Toyota plans to greatly expand its product lineup. | |
| The United States | In 2025, Toyota plans to start the local production of a 3-row SUV equipped with batteries to be produced in North Carolina. | |
| China | In addition to the bZ4X and bZ3, Toyota plans to launch two models of locally developed BEVs in 2024 that will fit the local needs, and to continue increase the number of models in the following years. | |
| Asia and other emerging markets (Global South) | In order to respond to the growing demand for BEVs, Toyota plans to start local production of BEV pickup trucks by the end of 2023 and also launch a small BEV model. |
In May 2023, we launched the BEV Factory, a business unit dedicated to BEVs. What we hope to achieve with BEV Factory is to change the future with BEVs through transformation on multiple axes: cars, manufacturing and the way we work.
On the car axis, through technologies such as the integration of next-generation batteries and sonic technology, we aim to achieve a vehicle cruising range of 1,000 km. To bring more stylish design, we will use AI to increase aerodynamic performance, while our designers will focus on expressing natural sensibility. We believe Arene OS and full updates will vastly expand the possibilities for enjoying cars. Like our manual transmission EVs, we plan to deliver exciting surprises and fun to our customers with technologies achievable only by a carmaker.
over-the-air
23
On the manufacturing axis, the car body will be constructed from three main components in a new modular structure. Adopting giga casting will allow significant component integration, which contributes to the reduction of vehicle development costs and factory investment. In addition, with our self-propelling production technology, we aim to reduce our manufacturing procedures and plant investment by half.
Under the way we work axis, the BEV Factory is based on the concept of “ALL in ONE TEAM,” a team under one leader that unifies functions and regions beyond the framework of a carmaker, such as Woven by Toyota and external partners. This ONE TEAM will revolutionize the way work is done, with everyone on the same site and with the same awareness of the same issues, to achieve quick decision-making and initial response.
We plan to roll out next-generation BEVs globally and as a full lineup to be launched in 2026. By 2030, we expect 1.7 million units out of our planned 3.5 million overall BEV unit target will be provided by BEV Factory. We expect that our next-generation BEVs will adopt our new batteries, through which we are determined to become a world leader in battery EV energy consumption. With the resources we earn, we will improve our product appeal to exceed customer expectations and secure earnings.
The Development and Supply of Batteries
While promoting a full lineup of electrified vehicles, we have also been developing and manufacturing a full lineup of batteries. These development efforts are organized by type of electrified vehicle. For HEVs, our focus is on power output, or in other words, instantaneous power, while, when it comes to PHEVs and BEVs, our focus is on capacity or what can be called “endurance.”
In the area of batteries, Toyota has continued to research, develop, and produce batteries
in-house
for many years. In 1996, we established what is today Prime Earth EV Energy Co., Ltd. While refining our technologies related to nickel-metal hydride batteries, we started accelerating the development of lithium-ion
batteries in 2003. Furthermore, since establishing our Battery Research Division in 2008, we have been advancing research on solid-state batteries and other next-generation batteries. In 2020, we established Prime Planet Energy & Solutions, Inc. to accelerate integrated efforts in the battery business. Over the past 28 years, Toyota has made approximately 1 trillion yen in capital expenditures, research and development expenses and other investments to produce more than 23 million batteries. We believe that our accumulated experience is an asset that gives us a competitive edge. Going forward, we intend to make a total of 5 trillion yen in new capital expenditures, research and development expenses and other investments relating to BEVs and batteries, with the aim of realizing even more-advanced, high-quality, and affordable batteries. As for batteries for HEVs, we have been continuously upgrading nickel-metal hydride batteries and
lithium-ion
batteries, taking advantage of their respective characteristics. In particular, we took on the challenge of developing a bipolar structure in the course of creating a nickel-metal hydride battery to be installed in the Aqua, which underwent a full-scale redesign completed in July 2021, and have become the first in the world to commercialize a battery of this kind as an onboard battery for driving. Compared to the batteries used in the previous generation of the Aqua, the output density has been doubled, giving the car a powerful acceleration sensation. We are currently engaged in development aimed at creating more-advanced lithium-ion
batteries by the second half of the 2020s. To develop batteries that our customers can use with peace of mind, we focus on producing batteries that balances five factors, which stand out for their “safety,” have “long service life,” boast “high-level quality,” and are “good yet affordable” as well as capable of “outstanding performance.” For example, a longer service life affects a vehicle’s residual value. In terms of cruising range, high energy density and high-level performance are also necessary. On the other hand, over-emphasis on a fast charging speed may increase the danger of overheating or even fire and thus decrease battery safety. This concept has remained unchanged since batteries were installed in the first-generation Prius, and it applied to all the batteries in all of our electrified vehicles. Although Toyota is committed to balancing the five factors, too much emphasis on one could be detrimental to
24
the others. That is why we believe that the integrated development of batteries and vehicles is essential. How batteries are used depends on how the vehicles in which they are installed are used. For example, the environments in which vehicles are operated differ according to each vehicle’s mode of use — for example, if it is being used as a taxi or for commuting — as well as geographic location, and these factors will affect such conditions as charging frequency and battery temperature. Accordingly, we carry out mock driving tests that assume a diverse range of vehicle usage in order to obtain data on actual usage environments and provide feedback to inform the evaluation and design of batteries. To determine the balancing point of the five factors discussed above, it is necessary to obtain driving data that includes driving conditions and usage environments, find out what the conditions would be like if batteries were used instead, and repeatedly verify what is happening inside the batteries. Such steady and earnest efforts for both batteries and vehicles are the secret behind Toyota’s advantages.
To popularize BEVs, we strive to reduce costs via the integrated development of vehicles and batteries to provide BEVs at a reasonable price. To start with, we aim to reduce the costs of batteries themselves by 30% or more by developing materials and structures. Then, for the vehicle, we aim to improve power consumption, which is an indicator of the amount of electricity used per unit of distance, by 30%, starting with the Toyota bZ4X. Improved power efficiency leads to reduced requirements for battery capacity, which will result in a cost reduction. Through this integrated development of vehicles and batteries, we aim to reduce the battery cost per vehicle by 50% compared to the Toyota bZ4X in the second half of the 2020s.
In the near future, the energy density of conventional
lithium-ion
batteries per unit of weight is expected to see its peak. Accordingly, vigorous efforts are now under way to develop next-generation lithium-ion
batteries, aiming to achieve longer service life, greater energy density, more compact size, and lower costs. At Toyota, we push ahead with the development of such batteries by employing the following three approaches. For liquid batteries, which use liquid electrolyte, we are taking on the challenge of realizing “material evolution” and “structural innovation.” At the same time, we are aiming to commercialize all-solid-state
batteries that employ solid electrolyte instead of liquid electrolyte. As such, our wide-ranging development efforts are aimed at creating three types of batteries, and by the second half of the 2020s, we hope to improve the characteristics of each type so that we can provide batteries that can be used with peace of mind. With regard to all-solid-state
batteries, we promote development aimed at achieving higher output, longer cruising range, and shorter charging times. In June 2020, we built a vehicle equipped with all-solid-state
batteries and conducted test runs on a test course to obtain driving data. Based on that data, we continued to make improvements, and in August 2020, we obtained license plate registration for vehicles equipped with all-solid-state
batteries and conducted test drives. In the course of the development process, we discovered that the fast movement of ions within all-solid-state
batteries could possibly enable them to achieve higher output. On the other hand, one of the challenges has been the short service life of batteries. Toyota believes it has discovered a new technology that will improve battery service life. In the future, we will work on developing a mass production system to address one of the other challenges, namely cost. Furthermore, although Toyota announced in 2021 that the introduction of all-solid-state batteries would start with HEVs, we will instead take on the challenge of practical application in batteries for BEVs in between 2027 and 2028. With the rapid expansion of EV usage, we are working to build a flexible system that can stably supply the required volume of batteries at the required time while meeting the needs of various customers in each region around the world. To this end, we intend to establish needed technologies by conducting a certain amount of
in-house
production in the pursuit of our battery development concept of achieving batteries that can be used with peace of mind. We will then cooperate and collaborate with partners who understand and will put into practice our concept. We will also proceed with discussions with new partners in some regions. Our approach to production can be described as “starting up using small basic units.” This approach draws on lessons learned from the global financial crisis. It is difficult to notice latent risks when production is growing. Because of this, we have to take a risk-controlled approach to growth based on Toyota’s philosophy of “making only what is needed, when it is needed, and only in the amount needed.” Moreover, Toyota’s strategy of “starting up using small basic units” is also 25
meant to enable the company to swiftly respond to changes arising from the arrival of a new technology, which often occurs in the course of a product cycle when the manufacturing costs for the old model come down and stabilize.
Hydrogen Business
The hydrogen markets in Europe, China, and North America are expected to be among the largest in the near future, and the fuel cell market is also expected to expand rapidly toward that point. We are promoting external sales of fuel cells using the Mirai’s hydrogen units and have received offers from third parties to purchase 100,000 units of fuel cells annually by 2030. Most of them are for commercial vehicles.
To respond to the rapid changes in the market, we will establish in July 2023 a new business unit called Hydrogen Factory, which will be able to make rapid decisions under one leader, from sales to development and production, all at once. The Hydrogen Factory will promote business on three axes. The first is localizing R&D and production in countries within the major markets. We will accelerate our efforts by establishing local bases, mainly in Europe and China. The second is strengthening alliances with leading partners. We will do our best to deliver affordable fuel cells to our customers by consolidating sufficient quantities through alliances. The third is competitiveness and technology. We will work on “innovative evolution of competitive next-generation fuel cell technologies,” such as next-generation cell technologies and fuel cell systems.
We will work toward full-scale commercialization as we move forward with these initiatives. We expect that our next-generation system will achieve significant FCEV production cost reduction through technological progress, volume efficiency, and localization. Furthermore, in collaboration with partners, if we are able to significantly increase the volume of purchase offers for units, we believe we will be able to reduce our costs further and generate solid profit while meeting the expectations of governments and our many customers. We will work together in development, production, and sales to achieve this goal.
In addition, the price of hydrogen is still very high. In order to promote the widespread use of hydrogen, Toyota will continue to work with its partners to contribute to the production, transportation, and usage of hydrogen. The relationships we have built with strong partners will be used as opportunities to accelerate our efforts to commercialize hydrogen by establishing customer-oriented bases in major markets and by offering affordable products in sufficient quantities.
As for current FCEVs, we released the completely redesigned Mirai in December 2020. Premised on the use of an FCEV system, the development of the second generation Mirai was promoted to deliver a futuristic premium car that will be genuinely appreciated and sought after by our customers. Specifically, we strove to deliver a vehicle that can win drivers’ hearts during and after driving, if not from the moment when they first catch sight of it. Moreover, Toyota aims to become a fuel cell (“FC”) system supplier supporting the realization of a hydrogen-powered society. In line with this aim, we provide a variety of business operators with a compact FC system module package that we have developed. This package consists of FC stacks for the second-generation Mirai, which boast higher performance, as well as air supply, hydrogen supply, cooling, power control and other FC system-related parts. In North America, we have unveiled a new prototype for an FC commercial heavy-duty truck that uses the second-generation FC system installed on the new Mirai. This truck boasts considerably improved performance, including more powerful acceleration and flexible driving response. Furthermore, having attained a maximum loaded weight of 80,000 pounds (approximately 36 tons) and cruising range of 300 miles (more than 480 kilometers), the truck is designed to accommodate a range of commercial truck needs. We intend to conduct the verification testing of this new FC truck in actual cargo transport operations.
26
Development of Hydrogen Engines
Toyota Motor Corporation announced in April 2021 that it is working on the technological development of a hydrogen engine.
Hydrogen engines work like modified versions of conventional gasoline engines, powered by burning hydrogen directly as fuel. The fuel is 100% pure hydrogen, unmixed with gasoline. As no fossil fuels are burned, except for the combustion of minute amounts of engine oil during driving, hydrogen-engine vehicles emit nearly no CO
2
when in operation. We believe that hydrogen engine technology is thus one option that offers great potential to contribute to carbon neutrality while making use of technologies for internal combustion engines built up over the decades and also protecting engine-related employment in the automotive industry. In late 2020, after taking a test drive in a hydrogen engine prototype car, Master Driver Morizo (Akio Toyoda, then President) decided on the spot to enter a hydrogen engine car in Super Taikyu Series races. The development of race vehicles is dramatically faster and more agile than that of mass-production vehicles. We decided that racing would provide the ideal environment for honing our hydrogen engines being developed with the goal of achieving carbon neutrality.
Looking at the overall route to the market release of a hydrogen engine car, we are currently a little less than halfway there. The finish line is still far ahead, and there are still many issues to be figured out, but we are steadily moving forward. Over the course of a year of racing with hydrogen engines, our hydrogen engine technologies and initiatives to use hydrogen have evolved. At the same time, the number of our partners who have joined our efforts to produce, transport, and use hydrogen has expanded from eight at the starting line to 25 as of August 2022.
With regard to hydrogen production, the range of available energy sources for producing hydrogen has expanded to include solar power from Yamanashi Prefecture and Namie Town, Fukushima Prefecture; geothermal energy from Obayashi Corporation; lignite from Kawasaki Heavy Industries, Ltd., Iwatani Corporation, and Electric Power Development Co., Ltd.
(“J-Power”);
and sewage biogas from Fukuoka City. To transport hydrogen, Commercial Japan Partnership Technologies Corporation has improved its FC light-duty trucks, changing from a metal tank to a lightweight resin liner tank that can transport hydrogen at higher pressure, achieving an approximately four-fold increase, as of June 2022, in the amount of hydrogen transported annually. In addition, as a first step in procuring hydrogen from overseas, hydrogen transported by air to Japan by Kawasaki Heavy Industries, Iwatani Corporation, and
J-Power
on a trial basis was used as fuel in Toyota’s hydrogen-powered vehicles. As for using hydrogen, we are working to improve cars and engines through agile development in the demanding environment of motorsports. Over a year of racing, our hydrogen engines have evolved significantly, increasing power output by 20%, torque by 30%*, and cruising range by 20%*, while hydrogen filling time has been reduced from approximately five minutes to 90 seconds* (*figures as of June 30, 2022). We have also raced with a GR86 modified to use another, nonhydrogen carbon-neutral fuel. The partners who joined us through racing in the Super Taikyu Series are now accelerating initiatives outside of racing to achieve carbon neutrality. Our efforts to develop hydrogen engine cars are extending beyond Japan. In August 2022, Morizo put a hydrogen engine car (a GR Yaris) through its paces in a demonstration run during the ninth round of the World Rally Championship in Belgium. This enabled us to highlight the potential of hydrogen as an option for achieving carbon neutrality in Europe. We also entered a hydrogen engine car in an endurance race in Thailand in December 2022. Through our efforts to use hydrogen that began with hydrogen engine vehicles in the Super Taikyu Series races in Japan, and gradual growth in understanding of our assertion that carbon is our enemy, not internal combustion engines, hydrogen has come to be seen as an option for the future. Going beyond national, regional, and industry borders, we will continue to push forward with our partners.
27
Software and Connected Initiatives
Amid this era identified by CASE, automobile manufacturing requires technological development in such new fields as “electrification,” “automated driving,” and “connectivity.” Among these fields, software is becoming an important factor in determining product appeal. Today’s cars are equipped with more than 50 electronic control units, or ECUs, and use as many as 1,000 chips. Furthermore, society has entered the age of the internet of things, and things being connected has become the norm. Cars are also equipped with communication devices, further advancing their electronification, and the volume of software (lines of code) used in cars is thus growing ever larger. Facing this major transformation in the automobile industry, Toyota is paying particular attention to how cellular phones have changed over time. As the shoulder phone evolved into the feature phone and then into the smartphone, the phone, which had become commoditized, became linked with information, creating new value through new experiences and quickly spread around the world. This change was supported by software and connected technologies. Due to the CASE revolution, cars are becoming more deeply connected to communities and people’s lives through information, becoming a more integral part of social systems. At the same time, Toyota will aim to have cars be more linked to information, and through the movement of people, goods, and things, provide new value through new experiences and by bringing excitement to customers.
When it comes to the manufacturing of cars, Toyota has a basic stance that has been handed down internally over the years: we stick to our principles and internalize important elements by attempting to first achieve them on our own. We also continue to introduce improvements on the front lines to enhance our competitive advantage. Since its founding, Toyota has been producing various production equipment
in-house
as necessary. In the 1990s, we pursued the in-house
design of ECUs and established an electronics plant, a chip plant, and a battery plant. These efforts eventually led to the commercialization of the Prius, the world’s first mass-produced HEV. Toyota has always maintained a strong awareness of the real world regardless of the era at hand, pursued our principles, and promoted internalization. That is why in the area of software and connected technologies, we established the Toyota Research Institute (“TRI”), Woven by Toyota, Inc. (“Woven by Toyota”), and Toyota Connected, and it is why we are working on the development of the e-Palette,
the construction of Woven City as a town for pilot testing, and the development of the Arene platform and other technologies. To date, Toyota has sold 20 million Lexus and Toyota vehicles that are connected cars, mainly in Japan, the United States, Europe, and China. Toyota’s vision of the connected car is not simply one of connecting the car to the internet. Rather, it is about providing customers with emotional experiences through the movement of people, goods, and activities — a vision centered on people that we call “human connected.” To achieve this, we are operating a call center as a point of contact with customers; the Toyota Smart Center, which provides a variety of services; and the Toyota Big Data Center, which utilizes vehicle information gathered from cars. In addition, we have established the Mobility Service Platform (“MSPF”) to provide mobility services and are promoting collaboration with service providers. Connected cars and connected technologies will be applied to a variety of areas, and we anticipate that which is to be connected will expand to include people, cars, communities, and society or BtoS). Toyota will handle the information gathered from customers and vehicles with care, utilizing it for the happiness of customers and the development of society while creating new value from experiences centered on mobility.
(business-to-society,
With the fashion according to the conditions of the surrounding environment and the number of passengers. All of this was realized via the MSPF that Toyota has been building and refining. In the future, we expect that these technologies will be applied to the Sienna Autono-MaaS minivan being developed in the United States for use as a robotaxi, and that the MSPF will be used not only for automated vehicles, but also for regular commercial vehicles and logistics.
e-Palette
BEV used in the Olympic Village for the Olympic and Paralympic Games Tokyo 2020, our goal was to create mobility that integrates cars and information and that coordinates with the community. During the Games, 49,000 athletes, staff, and volunteers used e-Palette.
We also developed a fleet management system for e-Palettes
based on the principles of the TPS to ensure effective, efficient, and accurate operation. The system monitors the vehicles remotely and operates them in a just-in-time
28
In this way, software has the power to promptly turn ideas into products. The aim of Arene, the vehicle development platform that Toyota and Woven by Toyota are focused on, is to continue fundamentally changing the development of software for vehicles. The most notable characteristics of Arene are that it absorbs the differences in vehicle hardware specifications (abstraction) and employs hardware abstraction layers that enable hardware to be controlled with universal methods. This, in turn, enables the independent development of hardware and software as well as the reuse of software. Arene leverages the strengths of hardware cultivated by Toyota to achieve the development of safe, high-quality, and advanced software.
Because increasingly complicated software development is becoming a bottleneck for cars, too, there is a need for a revolutionary vehicle operating system that can solve these issues. The vehicle operating system will achieve TPS in software development as well, and we must continue to realize combinations of good hardware and software. For example, when developing automated driving software, the
on-board
software needed for automated driving actually makes up only a small portion of it; the rest comprises various tools, such as data processing by the machine learning system, mounting, code review, software updates, log analyses, and simulations. Basically, most of the software we develop is used “off-board”
(that is, outside vehicles) or through the cloud. Arene is used to develop frameworks for vehicle development and development environments based on those frameworks as well as to build ecosystems for mobility development. Using industry-leading software technologies, we will strive to continue providing privacy-conscious, secure, and safe cars. Furthermore, application development on Arene is also easy. We believe partner companies will be able to program applications more efficiently using Arene’s application programming interface (a mechanism that can share software functions) and software development kit, which includes simulation environments. In this way, we believe development on Arene will swiftly realize commercialization and enables users to share the fun of providing new ideas that appeal to customers while meeting the expectations of worldwide partners and developers as well as the Toyota brand’s high-quality standards.
The portion of a car’s value attributable to software is growing. By internalizing the parts central to Toyota’s future, we will strategically ensure the strengths of our hardware and software through internal production, compartmentalize development undertaken with partners, and accelerate the speed of mass production. For these initiatives, we are building a software development structure on a
3,000-person
scale for Woven by Toyota, and Toyota Connected and on a 18,000-person
scale when including associates accounted for by the equity method. We are also strengthening the teams responsible for the internal production and development of software. Through connected technologies, we can contribute to carbon neutrality by gaining a better understanding of the characteristics of each region in the form of data and combining this knowledge with realized technologies. For example, according to market data, in Japan, the engine is turned off for half of all driving time in hybrid electric vehicles, or HEVs, while for
plug-in
hybrid electric vehicles, or PHEVs, the engine is turned off for as much as 80 percent. We believe HEVs and PHEVs can evolve into environment-friendly vehicles to an even higher degree by upgrading the switching control of engines and electric motors. In other words, there is room to expand the possibilities of both HEVs and PHEVs. One mechanism that we believe will enable this is geofencing technology. A portmanteau of geography and fence, geofencing refers to the combination of navigation and cloud technologies to enable the automatic switching of engine and motor functions in real time to reflect driving locations and driving times based on geographic data. For example, in
zero-emission
regulation regions that limit vehicle operation to only BEVs during certain time periods, geofencing would automatically control the functions of HEVs and PHEVs to ensure compliance with regulations. Furthermore, geofencing would enable anticipatory
eco-driving
that switches over to BEV driving as appropriate by predicting the driving burden based on the driving environment up to the destination. We believe utilizing connected technologies to control HEVs and PHEVs more intelligently will make it possible to further 29
promote energy saving in cars. The new NX features a mechanism that switches to HEV control. We expect that in the near future we will be able to conduct an (“OTA”) update of its software so that it will be able to use geofencing technology.
over-the-air
In October 2021, in advance of introducing geofencing technology that is under development with an eye toward practical application, we introduced anticipatory
eco-driving
(anticipatory EV/HEV mode switching control) in the Japanese market. It realizes highly efficient driving by automatically switching between EV and HEV modes depending on the charge left in the battery and the road conditions and characteristics. OTA refers to using wireless connections to keep the software (control software and high-precision mapping software) updated to the latest versions. This means that after a car’s purchase, new functions continue to be added and its performance continues to be enhanced, thereby continuing the vehicle’s evolution into a safer and more secure car that has the latest driving assistance technology.
For the LS and Mirai launched in Japan in April 2021, we have included cars that feature the latest Advanced Drive function of the newest sophisticated driving assistance technologies developed by Toyota Teammate/Lexus Teammate, and they are eligible for related software updates on an ongoing basis. The GR Yaris “Morizo Selection” is a new initiative based on GR Yaris that combines the ROOKIE Racing privateer team run by Morizo (the racing driver name for Akio Toyoda, our Chairman) and Toyota’s KINTO car subscription. We will continue to evolve each car to best match each customer by reflecting updates (which are based on feedback and data gained in races participated in by Morizo and ROOKIE Racing) and personalization (which is based on customer driving data) in the software in GR Garage shops through wired connections (not OTA). Furthermore, we offer better driving methods and support the enhancement of driving skills. Through this, we strive to realize cars that evolve to suit people by updating to the latest software in line with each customer.
Cars have a wide range of applications, from passenger cars to MaaS and commercial vehicles, and we will continue to expand the regions where we operate going forward. Needs are increasingly diversifying, and cars can be used in a myriad of ways to meet them. Our efforts thus encompass people’s problems and social issues, smiles and joy, and needed technological development.
The automobile industry must move people while also achieving coexistence with local communities. For the future and for children, the Toyota family of companies is working on producing happiness for all through freedom of movement for all and the provision of exciting experiences. We will continue to enhance the excitement that can be experienced by being able to move by combining real cars and the power of software. If we combine innovation with technology, we expect that the value of cars will be enhanced further. We will also contribute to the further development of society by going beyond the borders of cars and contributing to community building and the creation of society-wide platforms.
Efforts in Realizing a Safe Mobility Society
For Toyota to achieve its ultimate goal of eliminating traffic accident causalities, the development of safe vehicles is of course important, but it is also essential to educate people, including drivers and pedestrians, and to ensure safe traffic infrastructure, including traffic signals and roads. To achieve a safe mobility society, Toyota believes it will be important to implement an integrated three-part initiative involving people, vehicles, and the traffic environment, as well as to pursue real-world safety by learning from actual accidents and incorporating that knowledge into vehicle development. “Integrated Safety Management Concept” is Toyota’s basic philosophy behind its technologies for eliminating traffic casualties and is moving forward with development.
Toyota provides optimized driver support at every stage of driving, from parking to normal operation, the moment before a collision, during a collision, and post-collision emergency response. We also aim to enhance safety by strengthening inter-system coordination, rather than considering each system separately. These are the approaches behind our Integrated Safety Management Concept.
30
With regards to active safety, the Toyota Safety Sense system packages multiple active safety functions based around three major functions considered effective in reducing serious traffic accidents causing death or injury. These are
Pre-Collision
Safety, which helps avoid and mitigate damage from collisions with cars ahead or pedestrians; Lane Departure Alert, which contributes to preventing accidents caused by leaving the lane of travel; and Automatic High Beam, which helps ensure clear sight in front of the vehicle at night. Since its market launch in 2015, Toyota Safety Sense has been installed in more than 38 million vehicles globally as of March 2023. Toyota Safety Sense is now available on nearly all passenger car models (as standard or an option) in the Japanese, United States, and European markets. It has also been introduced in a total of 120 countries and regions, including such key markets as China, other select Asian countries, the Middle East and Australia. Another important concept is passive safety. In the context of automobiles, passive safety combines a body structure that absorbs collision energy with support to protect vehicle occupants to minimize collision damage. In 1995, in the pursuit of world-leading safety, Toyota created its own stringent internal target related to passive safety performance called “Global Outstanding Assessment (“GOA”)” and developed a collision-safety body structure and passenger protection devices. Since then, to maintain its leadership in this field, Toyota has continued to evolve GOA, striving to improve the real-world safety performance of its vehicles in a wide variety of accidents.
In addition, to analyze vehicle-related injuries, Toyota collaborated with Toyota Central R&D Labs., Inc. to develop the Total Human Model for Safety (“THUMS”), a virtual human body model. THUMS is being used in the research and development of a variety of safety technologies, including seat belts, airbags, and other safety equipment, as well as vehicle structures that mitigate injuries in accidents involving pedestrians. Toyota made THUMS freely available through its website in January 2021 in the hope that it will be used by more people across more applications.
Every minute counts in the response to an accident or medical emergency. In the event of an accident or medical emergency, Toyota’s HELPNET
®
emergency reporting system service contacts a dedicated operator who will arrange for the rapid dispatch of emergency vehicles from police, fire department, or emergency services. Specifically, HELPNET®
automatically contacts an operator when the airbags deploy and supports D-Call
Net®
, a service that makes quick deployment decisions for air ambulances. This service is provided by sending vehicle data to the HELPNET center from an on-board
data communication module. Toyota has been engaged in the research and development of automated driving technologies since the 1990s. The Mobility Teammate Concept is an automated driving concept unique to Toyota that seeks to enhance communication between drivers and their cars, enabling them to assist one another in coordinated driving as companions. Rather than cars taking over driving from people and replacing them, we believe that drivers and cars can act as partners to protect one another, so that drivers can enjoy the experience of driving while deferring to automated driving at times, and thereby achieving truly safe, secure and unrestricted mobility.
The Lexus LS and Mirai models launched in April 2021 are equipped with “Toyota/Lexus Teammate driving assist technology, with some grades including Advanced Drive, a system that assists driving on an expressways or other motor-vehicle-only roadways. The Advanced Drive
state-of-the-art”
on-board
system will appropriately detect the vehicle’s surroundings, make decisions, and assist driving under the driver’s supervision according to actual traffic conditions. It can keep the vehicle in its lane, maintain the distance from other vehicles, navigate a lane split, change lanes, and overtake other vehicles until leaving the roadway for the destination. The system achieves high levels of safety and peace of mind, reducing driver fatigue and providing a pleasant journey to the driver’s destination. Deep learning-focused AI technologies support driving by predicting and responding to a wide variety of situations that could occur when driving. In addition, Advanced Drive is capable of
Over-the-Air
upgrades, and occasional software updates may be issued. The system continues to add features and improve performance to enhance the driving experience and provide the latest safety technologies even after the vehicle has been delivered to the customer. 31
Cars have many uses, and customer needs continue to diversify. Accordingly, Toyota is advancing R&D into automated driving technologies not only for personally owned vehicles (“POVs”), but also in the field of MaaS. Toyota is one of the first companies to launch advanced automated driving technology for vehicles sold to corporate customers. Data collected from these vehicles will then be collected, analyzed, and fed back into development to further evolve automated driving technologies for POVs.
Toyota carries out awareness-raising initiatives for drivers and pedestrians to help prevent traffic accidents. One such initiative for drivers is the Toyota Driver Communication safe driving technique seminar held periodically at Toyota Safety Education Center Mobilitas, on the grounds of Fuji Speedway. For pedestrians, in cooperation with Toyota dealers across Japan, Toyota has been donating traffic safety teaching materials to kindergartens and nursery schools nationwide since 1969.
Commercial Sector Initiatives
Since the establishment together with other companies of the Commercial Japan Partnership Technologies (“CJPT”) joint venture in April 2021, Toyota has been working to disseminate CASE technologies in the commercial sector and thereby contribute to the realization of carbon neutrality.
CASE technologies can only contribute to society once they become widespread. Commercial vehicles can play important roles in CASE technology dissemination, as they travel long distances for extended periods of time to support the economy and society and can be easily linked with infrastructure development. By combining the commercial vehicle foundations of the companies participating in CJPT with Toyota’s CASE technologies, the companies aim to accelerate the societal implementation and adoption of CASE technologies and services and thereby help address social issues and contribute to the realization of carbon neutrality.
Distribution by truck accounts for the vast majority of overland logistics in Japan, and the transportation sector (including buses and taxis) involves a significant number of people. Commercial vehicles account for a significant amount of the total distance traveled by automobiles and CO
2
emissions from automobiles in Japan. Furthermore, the logistics companies operating in Japan currently face numerous management issues, such as high-frequency distribution, harsh work environments, labor shortages, and rising burdens on workers. The power of CASE, centered on connected technologies and services, is a promising approach to effecting improvements that will help resolve these issues. Solving these kinds of social issues is not something that one company can accomplish alone. It is necessary to seek a wide range of like-minded partners, apply their different strengths, and work together for the sake of those supporting transportation and for society.
As many of Japan’s roads are so narrow that only mini-vehicles can easily use them, mini-vehicles are collectively a kind of “people’s car,” made to suit the roads of Japan. They are a practical and sustainable lifeline for people across the country and have continued to evolve alongside changing lifestyles. Similarly, commercial mini-vehicles are able to effectively cover areas that their small size makes accessible, supporting logistics operations mainly in the last mile.
We expect that expanding the CJP project to include mini-vehicles will enable efficient, integrated logistics, linking the main arteries of logistics (handled by trucks) with the capillaries of logistics (the domain of commercial mini-vehicles) while leveraging connected technologies and abundant data. This new collaboration is also aimed at promoting the broader use of affordable advanced safety technologies and electrification by leveraging Suzuki and Daihatsu’s strengths in high-quality,
low-cost
manufacturing and Toyota’s CASE technologies. Our efforts to achieve carbon neutrality center on two pillars: electrification and improving logistics efficiency.
32
Amid pressure to enhance cost competitiveness, maintaining a competitive edge in the area of commercial vehicle electrification is increasingly challenging. Competitiveness increasingly hinges on connected technologies and uses of batteries and other technologies. Accordingly, manufacturers must step up the unique added value that they offer.
We believe that improving transport efficiency will contribute greatly to realizing carbon neutrality. The companies that are participating in CJPT will link their connected technology platforms to build a more comprehensive platform for commercial vehicles and leverage the TPS, one of Toyota’s strengths, to realize JIT logistics and increase transport efficiency, thereby helping to reduce CO
2
emissions. Using connected technologies to link logistics from the major arteries to the fine capillaries, and from producers to consumers, using truck logistics and local mini-vehicle-based distribution, JIT logistics have the potential to lower running costs for logistics vendors and sustainably improve logistics. In collaboration with its partners, CJPT began the construction and social implementation of an energy management system (“EMS”) in Fukushima Prefecture and Tokyo in January 2023 to promote the widespread use of electrified vehicles.
The introduction of commercial electric vehicles imposes an increasing burden on society as a whole, not only in terms of vehicle purchase, but also in terms of downtime for cargo and vehicles due to recharging and hydrogen filling and an increase in peak electricity demand at business sites due to the concentration of recharging at certain times.
A total of 580 commercial electrified vehicles will be used in this social implementation project, including heavy- and light-duty fuel cell electric trucks, light-duty BEV trucks, and mini-commercial van BEVs, to comprehensively cover transportation from trunk lines to the last mile. In addition, the use of an EMS that is integrated with commercial vehicle operation management will help reduce the overall burden on society and CO
2
emissions. At the project in Fukushima, we are working to create an implementation model focusing on hydrogen use in cities with populations of around 300,000, a common city size for Japan, with the aim of applying the model to similar-sized
cities nationwide. In addition, CJPT is working with AEON KYUSHU Co., Ltd. and AEON GLOBAL SCM Co., Ltd. on a logistics improvement project for the AEON Group in the Kyushu area that will solve problems faced by the logistics industry, such as soaring logistics costs and driver shortages.
By combining the logistics expertise built up by AEON KYUSHU and AEON GLOBAL SCM with the connected technologies of the companies participating in CJPT, the project aims to (1) establish new operations to improve efficiency by linking each process in the supply chain, (2) improve efficiency by minimizing logistics downtime through the use of big data and real-time processing on connected technology infrastructure and (3) promote collaboration with a wide range of partners to achieve these initiatives.
Going forward, through the CJP project, the participating companies will deepen their collaboration while openly considering cooperation with other like-minded partners, working to help fulfill the automotive industry’s mission of helping improve people’s lives and leave a better Japan and a better planet for the next generation.
Woven City
The Woven City project, first announced in January 2020, officially broke ground on February 23, 2021. Woven City will demonstrate cutting edge technologies in such areas as automated driving, MaaS, personal mobility, robotics, smart homes, and artificial intelligence in a real living environment. By rapidly implementing development and demonstration cycles of technologies and services in this human-centered city, we aim to continue to produce new value and business models by utilizing the mobility of “information,” “goods,” and “people” to support daily life.
33
Woven City will be constructed on the site of Toyota Motor East Japan’s former Higashi-Fuji Plant, which was a pillar of production for Toyota for 53 years, starting in 1967. At its peak, the plant had 2,000 employees, and a total of 7,000 individuals worked there over its history, producing such vehicles as the Toyota Century, Toyota’s flagship chauffeur car infused with Toyota craftsmanship, and the JPN Taxi, a car that requires many times the durability of an ordinary passenger car.
The concept for Woven City can be traced back to the Great East Japan Earthquake in 2011. As our President, Akio Toyoda sought to create jobs for the region’s people, who were hit hardest by the disaster, by creating a third base of operations in the Tohoku region. Guided by his strong leadership, Toyota established Toyota Motor East Japan, Inc. in 2012. However, this also led to the difficult decision to close the Higashi-Fuji Plant. Looking for a way to carry on the Higashi-Fuji Plant’s legacy of manufacturing to help create future mobility for the next 50 years, he arrived at the idea of transforming the site into a connected city as a large-scale demonstration experiment.
At Woven City, we aim to make people happy by expanding what mobility can do for human beings and building systems that will create novel value. In addition to the mobility of people, goods, and information, we emphasize that mobility also has an emotional component and represents feelings, such as being moved. Through mobility that connects human hearts, Woven City will help us invent the technologies and services that will become the future fabric of life, constantly evolving alongside the inventors who live there and our partners.
Woven City is a test course for mobility, enabling us to rapidly implement development and demonstration cycles for diverse forms of mobility in both the virtual and the real world. For example, to achieve safe mobility, Woven City will comprise three types of roads, woven together like warp and weft: paths for people, roads shared by people and personal mobility devices, and roads for autonomous vehicles. We will use these roads to advance the integrated three-part development of automated driving at the levels of people, vehicles, and the traffic environment. Guided by the three concepts of “human-centered,” “a living laboratory,” and the “ever-evolving city,” Woven City will demonstrate technologies from logistics to energy, food, and agriculture as it grows into a test course conducive to the timely generation of new inventions that address social issues.
One such initiative is the hydrogen refueling station to be built by ENEOS adjacent to Woven City. The station will produce CO
2
-free hydrogen for supply to both FCEVs and to Woven City. Using Woven City as a living laboratory, we will demonstrate a supply chain across the production, transportation, and use of hydrogen, taking new steps toward achieving carbon neutrality. The name “Woven City” comes from Toyota’s origins in automatic looms. Sakichi Toyoda, the founder of the Toyota family of companies, was driven to invent an automatic loom out of a desire to make his mother’s work easier. We have guarded and nurtured this spirit of service to others ever since. Woven City will take up this commitment from the Higashi-Fuji Plant, growing and evolving as the foundation for a new era at Toyota. Financial Services
Toyota’s financial services include loan programs and leasing programs for customers and dealers. Toyota believes that its ability to provide financing to its customers is an important value-added service. In July 2000, Toyota established a wholly-owned subsidiary, Toyota Financial Services Corporation, to oversee the management of Toyota’s finance companies worldwide, through which Toyota aims to strengthen the overall competitiveness of its financial business, improve risk management and streamline decision-making processes. Toyota has expanded its network of financial services, in accordance with its strategy of developing auto-related financing businesses in significant markets. Accordingly, Toyota currently operates financial services companies in 43 countries and regions, which support its automotive operations globally.
Toyota’s sales revenues from its financial services operations were ¥2,809.6 billion in fiscal 2023, ¥2,324.0 billion in fiscal 2022 and ¥2,162.2 billion in fiscal 2021. While there were negative factors in fiscal 2023, such as supply constraints on new cars due to the ongoing tight global semiconductor supply relative to
34
demand, and increased competition with other financial institutions, Toyota’s business saw steady growth mainly due to the higher interest rates on customer loans rate on the back of rising global interest rates and accumulated balance of earning assets resulting from enhanced used-vehicle financing. Under such circumstances, as a result of Toyota’s continued collaboration with dealers in various countries and regions and efforts to expand products and services that meet customer needs, Toyota’s share of financing provided for new car sales of Toyota and Lexus vehicles in regions where Toyota Financial Services Corporation operates remained at a high level of approximately 30%, and the balance of earning assets continued to steadily increase. In addition, Toyota is making efforts to provide both its customers and dealers with stable financial services by diversifying its funding methods through direct financing from the market, such as ABCP (Asset Backed Commercial Paper) and ABS (Asset Backed Securities), in addition to using already existing means as commercial paper, corporate bonds and bank borrowings. Furthermore, Toyota continued to perform detailed credit appraisals and serve customers by monitoring bad debt and loan payment extensions, but the percentage of credit losses rose to 0.17% and 0.30% in fiscal 2022 and 2023, respectively, due to inflation and rising interest rates. Toyota continues to work towards improving its risk management measures in connection with credit and residual value risks.
Toyota Motor Credit Corporation is Toyota’s principal financial services subsidiary in the United States. Toyota also provides financial services in 42 other countries and regions through various financial services subsidiaries, including:
| • | Toyota Finance Corporation in Japan; |
| • | Toyota Credit Canada Inc. in Canada; |
| • | Toyota Finance Australia Ltd. in Australia; |
| • | Toyota Kreditbank GmbH in Germany; |
| • | Toyota Financial Services (UK) PLC in the United Kingdom; |
| • | Toyota Leasing (Thailand) Co., Ltd. in Thailand; and |
| • | Toyota Motor Finance (China) Co., Ltd. in China. |
Toyota Motor Credit Corporation provides a wide range of financial services, including retail financing, retail leasing, wholesale financing and insurance. Toyota Finance Corporation also provides a range of financial services, including retail financing, retail leasing and credit cards. Toyota’s other finance subsidiaries provide services including retail financing, retail leasing and wholesale financing.
The KINTO subscription service, which started in Japan in 2019 in response to the shift from “owning” cars to “using” cars, has been steadily enhancing its service lineup and gaining brand awareness. In Europe, full service leasing is being made available in wider areas. Furthermore, Toyota developed and provides customers with the payment application “TOYOTA Wallet” as a platform that contributes to improving the convenience of customers’ daily payments and creating a foundation for a mobility society.
Finance receivables for all of Toyota’s dealer and customer financing operations were ¥24,770.8 billion as of March 31, 2023, representing an increase of 13.8% as compared to the previous year. The majority of Toyota’s financial services are provided in North America. As of March 31, 2023, 56.9% of Toyota’s finance receivables were derived from financing operations in North America, 14.0% from Europe, 12.0% from Asia, 6.3% from Japan and 10.8% from other areas.
Approximately 40% of Toyota’s unit sales in the United States during fiscal 2023 included a finance or lease arrangement with Toyota. Because the majority of Toyota’s financial services operations are related to the sale of Toyota vehicles, a decrease in vehicle unit sales may lead to a contraction of Toyota’s financial services operations.
The worldwide financial services market is highly competitive. Toyota’s competitors in retail financing and retail leasing include commercial banks, credit unions and other finance companies. Commercial banks and other
35
automobile finance subsidiary companies serving their parent automobile companies are competitors of Toyota’s wholesale financing activities. Competitors in Toyota’s insurance operations are primarily national and regional insurance companies.
For information on Toyota’s finance receivables and operating leases, please see “Item 5. Operating and Financial Review and Prospects — 5.A Operating Results — Financial Services Operations.”
Retail Financing
Toyota’s finance subsidiaries acquire new and used vehicle installment contracts primarily from Toyota dealers. Installment contracts acquired must first meet specified credit standards. Thereafter, the finance company retains responsibility for installment payment collections and administration. Toyota’s finance subsidiaries acquire security interests in the vehicles financed and can generally repossess vehicles if customers fail to meet their contractual obligations. Almost all retail financings are
non-recourse,
which relieves the dealers from financial responsibility in the event of repossession. In most cases, Toyota’s finance subsidiaries require their retail financing customers to carry automobile insurance on financed vehicles covering the interests of both the finance company and the customer. Toyota has historically sponsored, and continues to sponsor, special lease and retail programs by subsidizing below market lease and retail contract rates.
Retail Leasing
In the area of retail leasing, Toyota’s finance subsidiaries acquire new vehicle lease contracts originated primarily through Toyota dealers. Lease contracts acquired must first meet specified credit standards after which the finance company assumes ownership of the leased vehicle. The finance company is generally permitted to take possession of the vehicle upon a default by the lessee. Toyota’s finance subsidiaries are responsible for contract collection and administration during the lease period. The residual value is normally estimated at the time the vehicle is first leased. Vehicles returned to the finance subsidiaries at the end of their leases are sold by auction. For example, in the United States, vehicles are sold through a network of auction sites, as well as through the Internet. In most cases, Toyota’s finance subsidiaries require lessees to carry automobile insurance on leased vehicles covering the interests of both the finance company and the lessee.
Wholesale Financing
Toyota’s finance subsidiaries also provide wholesale financing primarily to qualified Toyota dealers to finance inventories of new Toyota vehicles and used vehicles of Toyota and others. The finance companies acquire security interests in vehicles financed at wholesale. In cases where additional security interests would be required, the finance companies take dealership assets or personal assets, or both, as additional security. If a dealer defaults, the finance companies have the right to liquidate any assets acquired and seek legal remedies.
Toyota’s finance subsidiaries also make term loans to dealers for business acquisitions, facilities refurbishment, real estate purchases and working capital requirements. These loans are typically secured with liens on real estate, other dealership assets and/or personal assets of the dealers.
Insurance
Toyota provides insurance services in the United States through Toyota Motor Credit Corporation’s wholly owned subsidiary, Toyota Motor Insurance Services, Inc. (“TMIS”) and its wholly owned insurance company subsidiaries. Their principal activities include marketing, underwriting and claims administration. TMIS also provides coverage related to vehicle service agreements through Toyota dealers to customers. In addition, TMIS also provides coverage and related administrative services to affiliated companies of Toyota Motor Credit Corporation. Toyota dealers in Japan and in other countries and regions also engage in vehicle insurance sales.
36
Other Financial Services
Toyota Finance Corporation launched its credit card business in April 2001 and began issuing Lexus credit cards in 2005 when the Lexus brand was introduced in Japan. As of March 31, 2023, Toyota Finance Corporation has 15.7 million card holders (including Lexus credit card holders).
All Other Operations
In addition to its automotive operations and financial services operations, Toyota is involved in a number of other
non-automotive
business activities. Sales revenues for these activities totaled ¥1,224.9 billion in fiscal 2023, ¥1,129.8 billion in fiscal 2022, and ¥1,052.3 billion in fiscal 2021. Governmental Regulation, Environmental and Safety Standards
Toyota is inevitably required to comply with the regulations applied to its products relating to the emission levels, fuel economy, noise, safety and so on. In addition, Toyota is subject to laws in various jurisdictions regulating the levels of pollutants generated by its plants. Toyota has incurred significant costs in complying with these laws and regulations and expects to incur significant compliance costs in the future. Toyota’s management views leadership in environmental protection as an important competitive factor in the marketplace.
International Harmonization of Vehicle Regulations
The World Forum for Harmonization of Vehicle Regulations (“WP.29”) of the United Nations Economic Commission for Europe (“UNECE”) has developed certain international rules and regulations such as the UN Regulations (“UNR”) under the 1958 Agreement and the Global Technical Regulations (“GTR”) under the 1998 Agreement and has been working to promote international harmonization of the technical prescriptions for the construction and approval of wheeled vehicles. The UNR has been adopted in jurisdictions such as Japan, EU and Russia, and each participating party’s type approvals are mutually recognized under the 1958 Agreement. The parties to the 1998 Agreement include the U.S., China and India in addition to Japan, the EU and Russia, and 23 Global Technical Regulations have been established to date. As the progress of the international harmonization of technical prescriptions will lead to the reduction of the variations in product specifications from country to country, it is expected to lead to greater efficiency in Toyota’s product development.
Vehicle Emissions
Japanese Standards
The Air Pollution Control Act of Japan and the Road Transport Vehicle Act and the Act Concerning Special Measures for Total Emission Reduction of Nitrogen Oxides and Particulate Matter from Automobiles in Specified Areas regulate vehicle emissions in Japan. In recent years, in addition to the strengthened regulations on particulate matters emitted from gasoline-fueled vehicles, as can be seen from the adoption of the Worldwide Harmonized Light Vehicles Test Cycle (“WLTC”) driving cycles and the introduction of the Real Driving Emission (“RDE”), more stringent regulations have been decided to be introduced to match the European Standards. Moreover, both the Noise Regulation Act and the Road Transport Vehicle Act provide for noise reduction standards on automobiles in Japan.
U.S. Federal Standards
The federal Clean Air Act directs the Environmental Protection Agency (“EPA”) to establish and enforce air quality standards, including emission control standards on passenger vehicles, light-duty trucks and heavy-duty vehicles. Manufacturers are not permitted to sell vehicles in the United States that do not meet the standards. In March 2014, the EPA finalized new “Tier 3” tailpipe emission and evaporative emission standards for passenger vehicles, light-duty trucks, medium-duty passenger vehicles and some heavy-duty vehicles. Under the rule,
37
tailpipe emission standards for volatile organic compounds, carbon monoxide, nitrogen oxides, and particulate matter, as well as standards for evaporative emissions and guaranteed useful life (which relates to a vehicle’s ability to meet emission limits over time), would become increasingly stringent in phases from model years 2017 to 2025. The rule brought federal emission standards for these pollutants in line with California’s emission standards. The new Tier 3 rule also required reductions in gasoline’s sulfur content beginning in model year 2017. In April 2023, new Tier 4 emission standards were proposed for passenger vehicles, light-duty trucks, medium-duty passenger vehicles and some heavy-duty vehicles from model year 2027 onwards, including more stringent emissions standards than those for California.
California Standards
Under the federal Clean Air Act, the State of California has been permitted to establish its own vehicle emission control standards if it receives a waiver from the EPA that allows the California standards to preempt less-stringent federal standards. The EPA granted such a preemption waiver to California in January 2013. The waiver provides a legal basis for California’s Advanced Clean Cars (“ACC”) program.
In January 2012, the California Air Resources Board (“CARB”) adopted the ACC program. The ACC program, developed in coordination with the EPA and the federal National Highway Traffic Safety Administration (“NHTSA”), includes
Low-Emission
Vehicle (“LEV”) regulations, known as the LEV III regulations, that reduce emissions of smog-causing pollutants (volatile organic compounds, carbon monoxide, nitrogen oxides and particulate matter) and greenhouse gases from passenger cars and light-duty trucks for model years 2015 to 2025. The regulations include standards for evaporative emissions and guaranteed useful life as well. The ACC program also includes a mandate for
zero-emission
vehicles. Pursuant to the mandate, CARB requires that a specified percentage of a manufacturer’s passenger cars and light-duty trucks sold in California be “zero-emission
vehicles” (vehicles producing no emissions of regulated pollutants) (“ZEV”), as well as permits certain advanced technology vehicles such as PHEVs, and alternative fuel vehicles that meet “partial zero-emission
vehicles requirements,” to be granted partial qualification as BEVs or FCEVs. Toyota’s MIRAI qualifies as a zero-emission
vehicle. The current Prius Prime has been certified as a partial zero-emission
vehicle. Toyota intends to continue to develop additional advanced technologies and alternative fuel technologies that will allow other vehicles to qualify as zero-emission
vehicles or partial-zero-emission
vehicles. The Advanced Clean Cars II (“ACC II”) regulations will go before the CARB on June 9, 2022. ACC II includes LEV IV regulations that would further reduce emissions from light- and medium-duty vehicles, and an expanded mandate that would increase the percentage of ZEV vehicles that manufacturers must sell in California. The new LEV IV regulations and expanded ZEV mandate would apply to model years 2026 – 2035.
California has adopted regulations that require that all new vehicles sold in California will be
On-Board
Diagnostics (“OBD”) systems be incorporated into the computers of vehicles sold in California. OBD systems monitor components that can affect the emission performance of a vehicle and, if a problem with a component is detected, illuminates a warning light on the vehicle’s instrument panel. The systems also store the malfunction information in the computer to facilitate repairs. California’s OBD regulations are the most stringent in the world. In addition, in November 2022, the CARB adopted the ACC II program covering model years 2026 to 2035. The ACC II program consists of two parts. The first is regulations on zero-emission
vehicles. Under the California Governor’s Order of 2020 (N-79-20),
zero-emission
vehicles by 2035. The second is the LEV (Low Emission Vehicle) 4 regulation, which strengthens emission standards for volatile organic compounds, carbon monoxide, nitrogen oxide, and particulate matter from passenger vehicles and light-duty trucks, except for ZEVs, and guaranteed service life, as well as evaporative emission standards. Other States’ Standards
Seventeen states (Colorado, Connecticut, Delaware, Maine, Maryland, Massachusetts, Minnesota, New Jersey, New Mexico, New York, Nevada, Oregon, Pennsylvania, Rhode Island, Vermont, Virginia and
38
Washington) have adopted regulations substantially similar to California’s
low-emission
vehicle requirement, and 15 of these have adopted California’s zero-emission
vehicle requirement. As of November 2022, according to CARB, Minnesota, Nevada, New Mexico and Virginia are planning to introduce California low-emission
vehicle emissions regulations. Canadian Standards
Canada has finalized vehicle emission standards equivalent to the federal standards in the United States in October 2014, in response to the strengthening of the federal vehicle emission standards in the United States applicable to model years 2017 to 2025. Furthermore, certain Canadian provinces are currently considering enacting their own regulations. On January 11, 2018, the Ministry of Sustainable Development, Environment and the Fight against Climate Change of the Province of Quebec issued regulations on
zero-emission
vehicles including BEVs, FCVs and PHEVs, among others. In November 2018, the premier of British Columbia announced that the government would introduce legislation concerning zero-emission
vehicles (indicating the phase-in
introduction starting from model year 2020). Canada also adopted a more stringent fuel rule, which is based on the fuel rule in the United States, that reduces refineries’ annual average sulfur concentration of gasoline to 10mg/kg from 2017 with a new addition of credit system to secure compliance. In December 2022, Environment and Climate Change Canada submitted a proposal to regulate zero-emission
vehicles from model years 2026 to 2035. The proposal incorporates Transport Canada’s declaration in July 2021 that it will introduce 100% zero emissions for light-duty passenger vehicles and light-duty trucks sold after 2035. European Standards
In 2007, the European Parliament adopted more stringent emission standards for passenger vehicles and light commercial vehicles. The effective date for phasing in these stricter standards for passenger vehicles was September 2014 for Euro 6. For light commercial vehicles, the effective date was September 2015 for Euro 6.
The primary focus of Euro 6 is to limit further emissions of diesel-powered vehicles and bring them down to a level equivalent to gasoline-powered vehicles. The EU is now implementing the RDE regulations, which require manufacturers to conduct
on-road
emissions tests using portable emissions testers to demonstrate compliance. Since September 2017, manufacturers have been required to reduce the divergence between the regulatory limit tested in laboratory conditions and the values of RDE tests, and this divergence factor was made more stringent for all new vehicles effective January 2021. The EU is now also implementing the Worldwide harmonized Light vehicles Test Procedure (“WLTP”), which was introduced on September 1, 2017. The OBD regulations have also been tightened in terms of both subject parts and regulatory values. Effective January 1, 2019, the EU implemented an improved WLTP that purports to eliminate test flexibilities and introduces on-board
fuel and energy consumption monitoring devices. Discussions are currently underway for Euro 7, which will be more stringent than Euro 6. The European Commission expects to publish the Euro 7 proposed limits in the third quarter of 2022.
Chinese Standards
The next-generation emissions regulations for passenger vehicles, or Level 6 Emissions Regulations (China 6), were issued as
GB18352.6-2016
at the end of 2016, pursuant to which tighter requirements will be implemented in two steps, depending on the regulated subjects and the implementation timing. Specifically, China 6a will apply to all models to be sold or registered in July 2020 and beyond, and China 6b will apply to all models to be sold or registered in July 2023 and beyond. China 6b will also introduce the RDE Regulations adopted under Euro 6. The OBD regulations have also been tightened in terms of both subject parts and regulatory values. With respect to fuels in the market, the quality standards and the implementation from January 2019 for China 6 gasoline fuel and China 6 diesel fuel have been provided in GB17930-2016 and GB19147-2016 so as to keep up with the implementation timing of China 6 emissions regulations. Moreover, for some areas 39
where the air quality improvement is an urgent necessity, China 6 was implemented ahead of the implementation throughout China. Discussions are currently underway for Level 7 Emissions Regulations (“China 7”), which will be more stringent that the China 6 Emissions Regulations.
For heavy-duty diesel-powered commercial vehicles, pursuant to GB17691-2005, the China V Emissions Regulations are being implemented from July 2017. With the establishment of GB17691-2018, which provides next-level China VI Emissions Regulations (“China VI”), it has been decided that China Via will be implemented from July 2021 and China Vib from July 2023 (these regulations will apply to
gas-fueled
vehicles and public vehicles for urban areas earlier than those dates). For heavy-duty gasoline-powered commercial vehicles, pursuant to GB14762-2008, Level IV Emissions Regulations (“China IV”) apply to new models after July 2012. After the first day the regulation is implemented to a new model, all new models released during the following one-year
period also become subject to the regulation. Tightening of the next-generation emissions regulations (China V and China VI) is currently considered for heavy-duty gasoline-powered commercial vehicles. Standards of Other Countries or Regions
In particular, in India, given the worsening air pollution, in December 2015, the Supreme Court banned the registration of diesel cars with engines that are two liters or larger in the National Capital Region, including the Delhi metropolitan area. In August 2016, the ban on registration was lifted on the condition that a deposit equal to 1% of the vehicle’s retail price is to be paid to the Environment Pollution Control Authority. Furthermore, the government accelerated the implementations of
BS-6
(equivalent to EURO6) to 2020. Moreover, Thailand has also decided to introduce regulations equivalent to Euro 5 and Euro 6. Vehicle Fuel Economy
Japanese Standards
The Act on Rationalizing Energy Use and Shifting to
Non-fossil
Energy requires automobile manufacturers to improve their vehicles to meet specified fuel economy standards. Fuel economy standards are established according to the types of vehicles, and are required to be met by either fiscal 2011 (April 2010-March 2011), fiscal 2016 (April 2015-March 2016), fiscal 2021 (April 2020-March 2021), fiscal 2023 (April 2022-March 2023), fiscal 2026 (April 2025-March 2026) or fiscal 2031 (April 2030-March 2031). From 2020, if the WLTC mode is applied as a vehicle emissions test cycle, fuel economy test must be also conducted based on the WLTC mode. U.S. Standards
The Federal Motor Vehicle Information and Cost Savings Act requires automobile manufacturers to comply with CAFE standards. A manufacturer is subject to substantial civil penalties if, in any model year, its vehicles do not meet the CAFE standards. Manufacturers that exceed the CAFE standards earn credits determined by the difference between the average fuel economy performance of their vehicles and the CAFE standards. Credits earned for the five model years preceding the current model year, and credits projected to be earned for the next three model years, can be used to meet CAFE standards in a current model year.
In December 2011, the EPA and the NHTSA issued a joint proposed rule to further reduce greenhouse gas emissions and improve fuel economy for passenger cars, light-duty trucks and medium-duty passenger vehicles for model years 2017 through 2025. Pursuant to the rule, which was finalized in August 2012, these vehicles would be required to meet an estimated combined average emission level of 163 grams of carbon dioxide per mile in model year 2025, equivalent to 54.5 miles per gallon if these requirements are met through improvements in fuel economy standards. At the same time, the NHTSA issued CAFE standards for passenger vehicles and light-duty trucks that would require manufacturers to meet an industry average fuel economy level of 49.6 miles per gallon in model year 2025.
40
Under the Trump Administration, the EPA and the NHTSA proposed less stringent greenhouse gas emission standards and CAFE standards, and the withdrawal of California’s waiver to issue its own, more stringent greenhouse gas emission standards under the LEV III program. However, under the Biden Administration, the EPA and the NHTSA withdrew these proposed greenhouse gas emission standards and CAFE standards, and in March 2022, the EPA reinstated California’s authority to enforce its own greenhouse gas emissions standards.
On December 30, 2021, the EPA issued a final rule revising passenger car and light-duty truck greenhouse gas emissions standards for model years 2023 through 2026. The new rule is based on Presidential Executive Order 13990 and is more stringent compared to the Safer Affordable Fuel Efficient (“SAFE) Vehicles Rule issued in April 2020 which temporarily relaxed the greenhouse gas emissions rate to 1.5% per year. The new rule reduces greenhouse gas emissions, year-over-year, by 10% for model year 2023, 5% for 2024, 6.6% for 2025, and more than 10% for 2026. Based on these reductions, the industry-wide average emission targets for passenger cars and light-duty trucks is projected by the EPA to be 161 grams of carbon dioxide per mile in model year 2026.
On March 31, 2022, the NHTSA issued a final rule revising passenger car and light-duty truck fuel economy standards for model years 2024 through 2026. As with the EPA’s greenhouse gas emission rule, this new rule is based on Presidential Executive Order 13990. The new rule establishes standards that would require an industry-wide fleet of approximately 49 mpg for passenger cars and light duty trucks in model year 2026. This is to be achieved by increasing fuel efficiency, year-over-year, by 8% for model year 2024, 8% for 2025, and 10% for 2026 which is more stringent than the SAFE Vehicles Rule that temporarily relaxed the rate to 1.5% per year.
In April 2023, the EPA announced new proposed greenhouse gas emissions standards for light-duty vehicles from model years 2027 to 2032. The proposal incorporates Executive Order 14037 which requires 50% of new vehicles sold in 2030 be
zero-emission
vehicles and that model year 2032 vehicles meet the industry average CO2
emission level of 82 grams per mile. European Standards
In the EU, the average carbon dioxide emissions limit for light commercial vehicles is currently 147 grams per kilometer and for passenger vehicles 95 grams per kilometer. Manufacturers failing to meet their targets incur penalties of €95 from the first gram of exceedance onwards in 2019 and beyond. Starting in 2021, these emissions targets are tested using the WLTP.
In April 2019, the European Parliament and the Council adopted new carbon dioxide standards for vehicles and light commercial vehicles for the period after 2020. Average emissions of the EU fleet of new vehicles and light commercial vehicles in 2025 must be 15% lower than in 2021, and by 2030, emissions must be reduced further to 37.5% and 31% of 2021 levels for vehicles and light commercial vehicles, respectively. From 2025, a crediting system will be introduced to relax a manufacturer’s specific carbon dioxide emissions targets where the manufacturer produces numbers of “zero and
low-emission
vehicles” above specified benchmarks. In March 2023, the European Parliament and the European Council approved new carbon dioxide standards applicable to automobiles and light-duty commercial vehicles in 2030 and 2035. By 2030, it will be required to reduce emissions by 55% per automobile and 50% per van compared to 2021 levels, and by 2035, it will be required to reduce emissions by 100% per automobile and van compared to 2021 levels.
To achieve a climate-neutral EU by 2050 and an intermediate target of at least 55% net reduction in greenhouse gas emissions by 2030, the European Commission proposed in July 2021 substantially more stringent carbon dioxide emissions targets for vehicles and light commercial vehicles, as part of its “Fit for 55” package. The proposal strengthens the 2030 targets from 37.5% to a 55% reduction for new passenger cars and from 31% to a 50% reduction for new light commercial vehicles, both relative to the 2021 baseline discussed above. In addition, the proposal introduces a new 2035 carbon dioxide target set at a 100% reduction for new vehicles and
41
vans, again relative to the 2021 baseline. The 2025 target remains unchanged at a 15% reduction for both new vehicles and vans. The proposal has not yet been finalized.
An EU directive on motor vehicle air conditioning units requires manufacturers to replace the refrigerants with that having a lower global warming impact for all newly registered vehicles starting in January 2017.
Chinese Standards
Fuel consumption regulations are being implemented pursuant to the Chinese National Standards (“GB”), and the manufacture and sale of vehicle models not meeting these regulations are prohibited. For light-duty passenger vehicles, GB27999-2011 was issued. In these Level 3 Fuel Consumption Regulations for passenger vehicles, the regulation framework was substantially revised, such as the introduction of new regulations requiring automobile manufacturers to meet standards of corporate average fuel consumption across models in addition to existing regulations requiring each model to meet consumption standards. Furthermore, in order to achieve the national target for average fuel efficiency for 2020, the following more stringent fuel consumption regulations have been enforced. First, GB19578-2014, which has been enacted to strengthen regulations for each model, is being applied to new models after January 2016. Second, GB27999-2014, which has been enacted as Level 4 Fuel Consumption Regulations for passenger vehicles to strengthen corporate average regulations, has been in effect since 2016. In 2021, the fuel economy test mode was changed from NEDC to WLTC, and the Level 5 Fuel Consumption Regulations for passenger vehicles to achieve the average fuel efficiency target by 2025, GB19578-2021 and GB27999-2019, has been in effect since 2021. Currently, Level 6 Fuel Consumption Regulations for passenger vehicles are being considered as more stringent fuel consumption regulations. For light-duty commercial vehicles, GB20997-2015 was enacted, which further applied Level 3 Fuel Consumption Regulations to all new vehicles from January 2018 and is currently being enforced. Moreover, the implementation of the Life Cycle Assessment (LCA), which comprehensively regulates the amount of carbon dioxide emitted during the vehicle manufacturing, use, and disposal processes, among others, is being considered earlier than in the rest of the world.
With respect to large commercial vehicles, pursuant to GB30510-2018, Level 3 Fuel Consumption Regulations apply to new vehicles from July 2019 and are currently being enforced. In addition, in an effort to further strengthen fuel consumption regulations for the next generation, Level 4 Fuel Consumption Regulations are currently being considered.
Standards of Other Countries or Regions
India, Saudi Arabia, Brazil, Chile, Mexico, New Zealand, South Korea and Taiwan have imposed regulations that require automobile manufacturers to reduce fuel consumption and carbon dioxide emissions.
Vehicle Safety
Japanese Standards
Japan has been participating in the 1958 Agreement of the UN and has a number of technical standards that are harmonized with the UN Regulations.
Furthermore, unique to Japan, the safety standards for automated driving systems were established in March 2020, requiring, in addition to a certain level of performance of automated driving system, the installation of an event data recorder and cyber security measures against unauthorized access. In addition, a certification program was introduced in April 2020 with respect to the system to control sudden acceleration by mixing up the gas and brake pedals as well as the collision damage mitigation brake system.
In addition, the approvals required for fuel-cell vehicles using compressed hydrogen under the High Pressure Gas Safety Act and the Road Vehicles Act were consolidated at the ordinary session of the Diet in 2022.
42
U.S. Standards
In November 2021, the Bipartisan Infrastructure Bill was signed into law by President Biden. It requires the NHTSA create regulations that cover a wide range of matters, including the application of preventive safety technology, the strengthening of USNCAP, and the prevention of drunk driving, in order to improve road safety. In response to this, NHTSA sought public comments in 2022 regarding the strengthening of USNCAP and expansion of the recording requirements regarding Event Data Recorders (EDR). Notices for further public comments on the USNCAP, pedestrian protection and autonomous emergency braking are also expected to be issued in the future. With respect to automated driving vehicles, on January 8, 2020 the Trump Administration and the U.S. Department of Transportation released Ensuring American Leadership in Automated Vehicle Technologies: Automated Vehicles 4.0 (“AV 4.0”). AV 4.0 unified efforts across 38 Federal departments, independent agencies, commissions, and Presidential Executive Offices in providing high level guidance to state and local governments and other stakeholders. AV 4.0 also established Federal principles for the development and integration of automated vehicles. California and many other states, despite AV 4.0, have adopted different approval systems so that automated vehicles must be compliant with regulations and systems that vary from state to state. On December 23, 2020, California issued its first autonomous vehicle deployment permit.
European Standards
In December 2019, the EU issued the revised General Safety Regulation to tighten the requirements concerning safety and the protection of vehicle occupants and vulnerable road users. This revised General Safety Regulation will make certain vehicle safety equipment mandatory in stages starting 2022, including: automated emergency braking, emergency lane keeping systems, driver drowsiness and attention warning, intelligent speed assistance, reversing detection systems, tire pressure monitoring systems, and data recorders in case of an accident (“event data recorders”). In relation to this, various UN Regulations were developed, and for the equipment for which UN Regulations have not been developed, the EU established its own technical standards.
Furthermore, a proposal for a major overhaul of the
EU-type
approval framework for motor vehicles was issued in June 2018. The new regulation purports to raise the quality and independency of vehicle type-approval and testing, to increase checks of vehicles that are already on the EU market, and to strengthen European Commission oversight of the framework. It became mandatory for all new vehicle models as of September 1, 2020. In the case of automated driving vehicles, it is also possible to obtain approval under this framework only for cars produced in small quantities. United Nations Standards
The United Nations restructured the existing working parties and established the Working Party on Automated/Autonomous and Connected Vehicles (“GRVA”) that is dedicated to the development of regulations on automated driving. The GRVA is developing regulations covering functional safety requirements, new evaluation test method requirements, cybersecurity, software updates, data recording for automated driving vehicles and data recording in case of an accident. The new regulations on cyber security, software updates and automated lane keeping system came into effect in January 2021.
Chinese Standards
Vehicle safety regulations in China were in general established having regard to the UN regulations. However, China’s own national technical standards on functions such as batteries, motors, and the charging and remote surveillance of BEVs have been made mandatory. Fuel-cell vehicles are subject to the supervising regulations on the safety of high pressure gas in addition to the vehicle type approval requirement. Moreover, in accordance with the Made in China 2025 policy, more than 100 standards for intelligent connected vehicles (“ICV”) are being developed (including automation, telecommunication and security).
43
Environmental Matters
Japanese Standards
Automotive operations in Japan are subject to substantial environmental regulation under laws such as the Air Pollution Control Act, the Water Pollution Prevention Act, the Noise Regulation Act and the Vibration Control Act. Under these laws, if a business entity establishes or alters any facility that is regulated by these laws, the business entity is required to give prior notice to regulators, and if a business entity discharges, uses or stores substances that are environmental burdens or causes noise or vibration from such facility, the business entity is also required to comply with the applicable standards. Toyota is subject to local regulations, which in some cases impose more stringent obligations than the Japanese central government requirements. Under the Waste Management and Public Cleansing Act, producers of industrial waste must dispose of industrial waste in the manner prescribed in the same act.
The Soil Contamination Countermeasures Act of Japan requires that landowners conduct contamination testing and submit a report at the time they cease to use hazardous substances, such as in connection with the sale of a former factory, or if there is a possibility of health hazards due to land contamination. If it is found that land contamination exceeds a certain level, the relevant prefectural authority designates the area as considered to be contaminated, orders the landowner to submit a plan for decontamination (such plan must describe the measures to be taken in the area, the reasons therefor, and the deadline for implementing such measures, etc.), and has the landowner take such measures in accordance with such plan. In addition, under the Act on Recycling, etc. of Vehicles, vehicle manufacturers are required to take back and recycle specified materials (automotive shredder residues, air bags and fluorocarbons) of vehicles and the provisions concerning such obligations of vehicle manufacturers became effective in January 2005. Toyota has coordinated with relevant parties to establish a vehicle take-back and recycle system throughout Japan. As a result, in fiscal 2022, Toyota achieved a recycling/recovery rate of 96% for automobile shredder residue (the legal requirement being 70%) and 95% for air bags (the legal requirement being 85%) and reached the targets set forth in this law.
End-of-Life
end-of-life
U.S. Standards
The environmental regulations applicable in the United States include, among others, the Clean Air Act, the Clean Water Act, the Resource Conservation and Recovery Act, the Pollution Prevention Act of 1990 and the Toxic Substances Control Act. Toyota is subject to a variety of state legislation that parallels, and in some cases imposes more stringent obligations than, federal requirements.
Pursuant to the Clean Air Act, the EPA has promulgated National Ambient Air Quality Standards (“NAAQS”) for six “criteria” pollutants including for particulate matter. The Clean Air Act requires that the EPA review and possibly revise these NAAQS every five years. On January 6, 2023, the EPA announced a proposed decision to revise primary (health-based) annual particulate matter (PM
2.5
) standard from its current level of 12.0 µg/m3
to within the range of 9.0 to 10.0 µg/m3
. The EPA proposed to make no changes to the current secondary (welfare-based) annual PM2.5
standard, primary and secondary 24-hour
PM2.5
standards, and primary and secondary PM10
standards. If implemented this proposed standard, as well as any future NAAQS revisions to other criteria pollutants, could lead to additional pollution control requirements on the industry, including on Toyota’s manufacturing operations. European Standards
In the EU, the Ambient Air Quality and Clearer Air for Europe Directive (Directive 2008/50/EC) sets the environmental standards for air quality. In relation to this, environmental regulations, such as the National Emissions Ceilings Directive, or NEC Directive (2016/2284/EU), the Industrial Emissions Directive, or IED Directive (2010/75/EU), and Directive 2007/46/EC, which is intended to control
on-road
emission sources, have been established, and emissions are managed under these directives based on their source. 44
The European Commission is currently reviewing the EU Directive on Vehicles with a public consultation process. The Commission expects to present a legislative proposal for revisions to this directive in 2022.
End-of-Life
Toyota strives to ensure that its operations are in compliance with environmental regulatory requirements concerning its facilities and products in each of the markets in which it operates. Toyota continuously monitors these requirements and takes necessary operational measures in an effort to ensure that it remains in material compliance with all of these requirements. However, compliance with environmental regulations and standards has increased costs and is expected to lead to higher costs in the future. Therefore, Toyota recognizes that effective environmental cost management will become increasingly important. Moreover, innovation and leadership in the area of environmental protection are becoming increasingly important to remain competitive in the market. As a result, Toyota has proceeded with the development and production of environmentally friendly technologies, such as hybrid electric vehicles, PHEVs, FCEVs, BEVs and high fuel efficiency, low emission engines.
In addressing environmental issues, based on an assessment of the environmental impact of its products through their entire life cycles, from production through sales, disposal and recycling, Toyota, as a manufacturer, strives to take all possible measures from development stage and continues to work towards technological innovations to make efficient use of resources and to reduce the burden on the environment.
Toyota’s Approach to and Initiatives Towards Sustainability
The following is a discussion of Toyota’s approach to and initiatives towards sustainability. It contains forward-looking statements that are based upon the current judgment, assumptions and beliefs of Toyota’s management. See “Cautionary Statement With Respect To Forward-Looking Statements.” Actual business, financial and operational results may vary significantly from those described below as a result of unanticipated changes in various factors, including those described in “Risk Factors.”
Governance
Toyota has inherited the spirit of “Toyoda Principles” since our foundation, and has aimed to create a prosperous society through our business activities, based on “the Guiding Principles at Toyota.” In 2020, based on these Principles, we compiled the “Toyota Philosophy” and set the mission of “Producing Happiness for All.” We aim to be the “best company in town” that is both loved and trusted by people. We aim to contribute to the sustainable development of our society and planet through such “Toyota Philosophy.”
In order to grasp changes in the external environment and societal demands, and to prioritize issues of greater importance and urgency, we continuously strive to promote and improve environmental, social, and governance sustainability activities while working closely with the relevant groups under the promotion system illustrated below and under the supervision and decision-making of the Board of Directors.
Furthermore, we have appointed a Chief Sustainability Officer (“CSO”) to lead the engagement with external stakeholders and dissemination of information regarding sustainability activities.
45
<Sustainability promotion system>
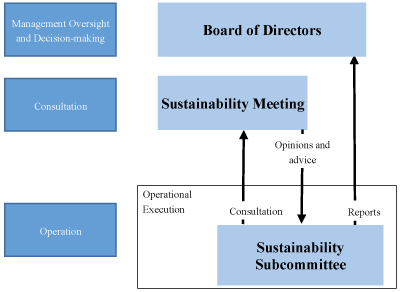
Sustainability Meeting |
Sustainability Subcommittee | |||
Chairperson |
President |
Deputy Chief Officer, General Administration & Human Resources Group (Senior management position responsible for sustainability) | ||
Members |
Members include three Outside Directors / Outside Audit & Supervisory Board Members, the Chief Sustainability Officer and the Chief Human Resources Officer |
Officers and General / Managers from related divisions will participate in keeping with agenda topics such as the environment, financial affairs, and human resources | ||
Frequency |
Twice a year, in principle |
Four times a year, in principle | ||
Function |
• To help increase corporate value by reflecting opinions and external advice about key sustainability-related issues in management practices to achieve sustainable growth |
• To implement operations related to the promotion of sustainability • To consult with the Sustainability Meeting about key issues and submit reports to the Board of Directors |
Risk Management
Toyota will strengthen risk management in response to uncertainties amid our constantly needing to rise to new challenges in the era of major changes in the circumstances surrounding, and in the values of, the automobile industry, such as carbon neutrality, CASE and other factors.
In order for each region, function, and
in-house
company to cooperate and support each other and prevent, mitigate, and reduce risks arising in business activities from a global perspective, Toyota has appointed a Chief Risk Officer (“CRO”) and Deputy CRO (“DCRO”) in charge of risk management, as well as regional CROs to serve as the head of risk management in each region. Furthermore, Toyota has established the below promotion system, and the CRO/DCRO takes up each important risk that requires a prompt response at meetings of the Board of Directors and other management meetings, where they are discussed. 46
<Risk management promotion system>

In addition, as a risk management system framework, we estimate, identify, and evaluate risks based on the Toyota Global Risk Management Standard (“TGRS”), a company-wide risk management framework based on ISO (International Organization for Standardization and COSO (Committee for Sponsoring organizations of the Treadway Commission).
Approach to and Initiatives Towards Human Resources
The Toyota group has been focusing on human resource development since its foundation based on the philosophy that “ (manufacturing) depends on human resource development.”
monozukuri
In the midst of a transformation taking place in the automobile industry, the Toyota group has set out the theme of inheritance and evolution and is doing its utmost to realize its transformation into a mobility company for the future in addition to carrying on what makes us Toyota — “let’s make ever-better cars,” “let’s aim to be rather than being the best in the world” and “let’s work for the sake of others.”
once-in-a-century
best-in-town,
Amid the era in which it is hard to predict the future, each and every one of us at Toyota, our 370,000 colleagues around the world, must share the same thoughts, working together organically as a team at the same time in order to uphold our founding spirit and what makes us Toyota, as symbolized by the Toyoda Principles, and to carve out the future of automobiles using the Toyota Philosophy as a guideline, and to that end, we need to develop human resources.
Looking at the global Toyota group as a whole, in addition to instilling the philosophy in all regions around the world, through various opportunities such as training for global executive candidates, the head office and regional entities are working together to strengthen a common foundation for human resource development based on Toyota’s “philosophy, skills, and behavior (such as Toyota Philosophy and TPS).” In addition, for regional entities, we are promoting the establishment of a system that flexibly promotes the formulation and execution of human resource strategies rooted in the region in response to the characteristics of the region and the diverse needs of customers.
47
We have also been engaged in ongoing dialogue between labor and management regarding investment in human resources, including human resources development. In March 2023, under the shared value of “the company wishes for the happiness of its employees and employees wish for the development of the Company,” we held discussions between labor and management on various measures for the future based on the common recognition that “people” are our greatest asset. We have also confirmed specific initiatives to lead to speedy change.
In an era where our circumstances change rapidly is fast and the future is uncertain, various challenges need to be undertaken in order to realize reforms for the future. On the other hand, in order to continue taking on challenges, there are many issues that need to be overcome and resolved. Toyota has organized the tasks that should be addressed as follows.
Tasks that should be addressed
| • | Creating a culture and capacity to continue taking on challenges without fear of failure |
| • | In order to bring together people with diverse characteristics and for each one of them to fully demonstrate their abilities, establishing a structure that stays close to the “individual” and that takes into account that each generation and life stage, and indeed each person has different values and sense of work. |
| • | Contribution to the automobile industry as a whole amid a period of transformation |
In the aim to address these tasks and to become a company where “anyone can take on challenges at any time, as many times as you wish, without fear of failure,” we are undertaking various measures centered around the three pillars of “Diversity,” “Growth,” and “Contribution.”
Climate Change-related Disclosures
Toyota has announced that, in response to climate change, it would address global-scale challenges to achieve carbon neutrality by 2050. In order to tackle these challenges, Toyota intends to respond quickly to changing demands, take into account the different energy conditions in each country and region around the world, and provide a variety of bespoke solutions that correspond to such country-specific and region-specific conditions.
In addition, Toyota has endorsed and signed on to the recommendations of the Financial Stability Board’s Task Force on Climate-related Financial Disclosures (“TCFD”) in April 2019. Toyota has prepared the discussion below, which relates to Toyota’s climate change-related risks and opportunities, in light of such recommendations. Certain emissions reduction targets referenced below have been set by Toyota with reference to and in line with criteria established by the Science Based Targets Initiative (“SBTi”); however, such targets are not set forth in this annual report based upon the authority of or in reliance upon SBTi as experts with respect to such targets.
Governance
(a) The Board’s Oversight of Climate-related Risks and Opportunities
Toyota addresses climate-related issues at the Board of Directors’ meetings to ensure effective strategy formulation and implementation in line with the latest societal developments. The Board deliberates and oversees related strategy, major action plans, and business plans, and important climate-related matters are included in the Board’s agenda.
The Board of Directors monitors progress toward qualitative and quantitative targets for addressing climate issues. As part of such monitoring, the Board considers climate-related issues, including risks and opportunities
48
related to products, such as fuel efficiency and emission regulations, as well as risks and opportunities related to
low-carbon
technology development. It also considers the financial impact of such factors. These governance mechanisms are used to formulate long-term strategy, including the Toyota Environmental Challenge 2050, and in formulating and revising medium- to long-term targets and action plans.
Examples of decisions made by the Board of Directors in 2022 include the following.
| • | Identifying carbon neutrality (“CN”) as an important issue in relation to climate change, we submitted to the Board of Directors, and the Board approved, the development of a transition plan towards achieving CN by 2050. |
| • | In addition, in order to meet the growing demand for BEVs, the Board of Directors approved Toyota investing in increasing its automotive battery production capacity by up to 40 GWh in Japan and the United States. |
(b) Management’s Role in Assessing and Managing Climate-related Risks and Opportunities
The Board of Directors is Toyota’s ultimate decision-making and oversight body for addressing climate-related issues. The below are the principal bodies for assessing and managing climate-related risks and opportunities.
Sustainability Meeting (Advisory function) |
Sustainability Subcommittee (Executory function) |
Environmental Product Design Assessment Committee |
Production Environment Committee | |||||
Frequency of reporting on climate related issues to the Board of Directors |
— |
When an important matter arises |
When an important matter arises |
When an important matter arises | ||||
Roles |
• Aims to improve the precision of initiatives with opinions and advice on key matters related to sustainability from a social perspective for sustainable growth |
• Executes operations related to promotion of sustainability • Reports important issues to the Sustainability Meeting and Board of Directors |
• Assesses product-related risks and opportunities, formulates / implements strategies and plans, conducts monitoring, etc. |
• Assesses plant / production-related risks and opportunities, determines countermeasures, conducts monitoring, etc. | ||||
Strategy
(a) Climate-related Risks and Opportunities the Organization Has Identified over the Short, Medium, and Long Term
Toyota strives to identify the various risks and opportunities that will arise from environmental issues, takes action while continuously confirming the validity of strategies, such as the Toyota Environmental Challenge 2050, and works to enhance its competitiveness.
49
In particular, climate change requires measures in a variety of areas, including the adoption of new technology and responding to stricter government regulations. Climate change is expected to result in higher temperatures, rising sea levels, and increases in the severity of natural disasters such as storms and flooding. These impacts may pose risks to Toyota’s business. However, we believe that responding appropriately to the impacts of climate change can lead to enhanced competitiveness and the acquisition of new business opportunities. In accordance with this understanding, we have categorized the risks relating to climate change and identified particularly significant risks in line with risk management processes based on the degree of impact and stakeholder interest.
Risks and Opportunities and Toyota’s Measures
*
1
Risks |
Opportunities |
Toyota’s measures |
Scenario Analysis* 2 | |||||||
Stated Policies Future Storyline |
1.5°C or less Future Storyline | |||||||||
(1) Tightening of regulations for fuel efficiency and ZEVs (acceleration of electrification) |
• Fines for failure in achieving fuel efficiency regulations • Decrease in total vehicle sales due to delays in complying with ZEV regulations • Impairment of internal combustion engine manufacturing facilities |
• Increase in sales of electrified vehicles • Increase in profits from external sales of electrification systems |
• Promotion of research and development to improve fuel and battery efficiency • Increase in investment in batteries and shift of resources • Start of external sales of electrification systems • Expansion of electrified vehicle lineup • Reduction of CO 2 emissions from vehicles currently in use |
Impacts will be an extension of current status | Impacts will increase | |||||
(3) Expansion of carbon pricing |
• Increase in production and purchasing costs due to the introduction of carbon taxes, etc. |
• Decrease in energy costs due to promoting the introduction of energy-saving technology • Improvement of energy security by diversifying energy supply sources |
• Comprehensive reduction of energy use and promotion of renewable energy and hydrogen use • Promotion of emission reductions in collaboration with suppliers |
Impacts will be an extension of current status | Impacts will increase | |||||
(7) Increase in frequency and severity of natural disasters |
• Production suspension due to damage to production sites and supply chain disruptions caused by natural disasters |
• Increase in demand for electrified vehicles due to increased need for supply of power from automobiles during emergency situations |
• Implementation of continuous adaptive improvements to our BCP in light of disaster experiences • Reinforcement of information gathering in collaboration with suppliers to avoid purchasing delays |
Impacts will increase | Impacts will be an extension of current status | |||||
50
* This list is not intended be exhaustive and is only a partial list of risks and opportunities and Toyota’s measures.
1
*
2
See “Item 4. — 4.B. Business Overview — Climate Change-related Disclosures — Strategy — Impact on Strategy —Resilience of the Organization’s Strategy, Taking into Consideration Different Climate-related Scenarios, including a 2°C or Lower Scenario” for a discussion of these scenarios. (b) Impact of Climate-related Risks and Opportunities on the Organization’s Businesses, Strategy, and Financial Planning
Recognizing that climate-related issues may have a substantive impact on its businesses, strategy, and financial planning, Toyota reviews its strategy based on the risks and opportunities associated with climate-related issues whenever necessary.
Toyota identifies climate-related risks, determines their degree of significance, and sets priorities in accordance with the Toyota Global Risk Management Standard (“TGRS”). Details regarding the TGRS are provided below under “Item 4. — 4.B. Business Overview — Climate Change-related Disclosures — Risk Management.” The below table describes the specific impacts on our businesses, strategy, and financial planning.
51
Impact on Strategy
Products and services |
Supply chains/value chains |
Investments in R&D |
Adaptation activities and mitigation activities | |||||
Significant climate related risks |
• Regulatory risks for decarbonization in different countries (fuel efficiency regulations, GHG emission regulations, etc.) |
• Regulatory risks for decarbonization in different countries (fuel efficiency regulations, GHG emission regulations, etc.) |
• Regulatory risks for decarbonization in different countries • Market risks, such as changes in consumer needs |
• Regulatory risks, such as the introduction of carbon pricing and decarbonization • Market risks, such as increased cost reductions, including sudden price jumps low-carbon and renewable energy prices, etc. | ||||
Impact on strategies |
The following strategies were influenced: • Long-term strategy (2050 Target): Toyota Environmental Challenge 2050 announced in 2015 • Medium-term strategy (2030 Target): 2030 Milestone announced in 2018; confirmed by Toyota to be in line with SBTi *1 criteria in 2022• Short-term strategy (2025 Target): 7th Toyota Environmental Action Plan announced in 2020 * 1 Science Based Targets Initiative: Initiative established by CDP, United Nations Global Compact, World Resources Institute (WRI), and the World Wide Fund for Nature (WWF). | |||||||
History of impacts |
• The numerical target for CO 2 emissions reduction was set as the New Vehicle Zero CO2 Emissions Challenge.• Targets for Scope 3 Category 11 were set by Toyota consistent with SBTi criteria in 2022. • In 2021, Toyota announced its aim to sell 3.5 million BEVs in 2030. • In April 2023, Toyota announced a new average GHG emissions target for new vehicles and set a pace of selling 1.5 million BEV units by 2026 as our base volume. |
• The numerical target for CO 2 emissions reduction in the entire value chain was set as the Life Cycle Zero CO2 Emissions Challenge.• The medium-term strategy takes into account of the following: • Manufacturing and disposal of batteries for the manufacture of electrified vehicles • Collaboration with suppliers • Risks and opportunities related to recycling |
• The sales target for electrified vehicles was set as the New Vehicle Zero CO 2 Emissions Challenge.• An increase in research and development expenses is expected for the promotion of research and development activities for electrified vehicles. • In 2021, Toyota announced the aim to sell 3.5 million BEVs in 2030. • In April 2023, Toyota announced a new average GHG emissions target for new vehicles and set a pace of selling 1.5 million BEV units by 2026 as our base volume. |
• The target for CO 2 emissions reduction related to plant operations was set as the Plant Zero CO2 • In 2021, the decision to aim at carbon neutrality at plants by 2035 was announced. • Targets for Scope 1 and 2 were set by Toyota consistent with SBTi criteria in 2022. | ||||
(c) Resilience of the Organization’s Strategy, Taking into Consideration Different Climate-related Scenarios, including a 2°C or Lower Scenario
The below is a discussion of the resilience of Toyota’s strategy, taking into consideration different climate-related scenarios.
<Step 1> Set Future Storylines Assuming Climate Change Effects
Climate change and the policies of various countries may expose the automobile industry and mobility society as a whole to substantial changes. We believe that these changes will present both risks and opportunities
52
for Toyota. Based on risk and opportunity analysis, using such scenarios*
1
such as those of the International Energy Agency (“IEA” *2
), we envisioned two future storylines of society and the external environment in around 2030: the “stated policies future storyline” and the “1.5°C or less future storyline.” *
1
Set using scenarios such as the IPCC’s*3
Representative Concentration Pathways (RCP) 4.5 equivalent, IEA’s Stated Policies Scenario (STEPS), Sustainable Development Scenario (SDS), and Net Zero Emissions by 2050 Scenario (NZE). *
2
International Energy Agency *
3
Intergovernmental Panel on Climate Change <Step 2> Consider the Impacts on Toyota
We considered impacts on Toyota in each future storyline of society envisioned in Step 1. In the society of the “1.5°C or less future storyline” in particular, the percentage of ZEVs*
1
among new vehicle sales will likely increase greatly while the use of carbon-neutral fuels will also expand. With regard to effects on production and purchasing, since the introduction of carbon taxes and increased tax rates may lead to higher costs, expanding the use of energy-saving technology, renewable energy, and hydrogen will mitigate risks. On the other hand, if adequate climate change measures are not implemented throughout society, as described in the “stated policies future storyline,” we believe production suspensions due to the increased frequency and severity of natural disasters, such as flooding, as well as production decreases and suspensions due to supply chain disruptions are likely to increase.
*
1
ZEV: Zero emission vehicles. Vehicles that have the potential to emit no CO2
or NOx during driving, such as BEVs and FCEVs. <Step 3> Toyota’s Strategies
In April 2021, Toyota proclaimed that it would address global-scale challenges to achieve carbon neutrality by 2050. We are developing diverse technologies that will encourage customers in different areas to choose
eco-friendly
vehicles, with the belief that they can only help reduce GHG emissions if they are widely used (multi-pathway). To this end, we have been working on environmental technology development for electrified vehicles, such as HEVs, PHEVs, BEVs, and FCEVs. We are also promoting the development of electric vehicles, as well as hydrogen fuel and hydrogen engine-powered vehicles, carbon neutral fuels, etc. Toyota currently conducts sales in over approximately 200 countries and regions, among which economic conditions, energy and industrial policies, and customer needs vary significantly. Therefore, it is important to have a strategy that offers a variety of electrified vehicle options to optimally meet the diverse needs of each country and region.
Based on this electrified vehicle strategy, Toyota has sold a cumulative total of over 22.5 million Toyota and Lexus-branded electrified vehicles worldwide (as of February 2023), and is one of the first companies to respond to climate change risks.
With regard to BEVs, we successively introduced models with dedicated platforms and will promote practical vehicle supply through battery development and production strategies.
We will aim to newly introduce 10 models of BEVs by 2026, and set the pace of selling 1.5 million annual Toyota and Lexus-brand BEV units by 2026 as our base volume to reach a target of 3.5 million Toyota and Lexus-brand BEVs sold globally each year by 2030.
53
In addition to BEVs, we are promoting electrification from all directions. We will flexibly and strategically adapt total vehicle sales and other conditions in response to changes in the market while leveraging the strengths that we have gained through experience. We believe that this will encourage customers in each region to choose us and accelerate the increased use of electrified vehicles.
Even if battery demand increases in accordance with shifts in customer needs, as in the “1.5°C or less future storyline,” we will flexibly work toward carbon neutrality by such means as enhancing collaboration with existing and new partners and swiftly establishing production structures at suppliers that have capital ties with Toyota.
In addition to increasing the number of electrified vehicles, Toyota is working on CO
2
-reducing off-cycle
technology*4
(items not necessarily reflected in driving mode fuel efficiency). There is a variety of technologies that contribute to reducing the CO2
emissions of vehicles, including carbon neutral fuels that are fit for vehicles currently in use, and hydrogen fuel and HEVs will also contribute to reducing the CO2
emissions of vehicles. We are therefore working to expand options for such technologies. *
4
Off-cycle
technology: Technologies such as high efficiency lighting, waste heat recovery, active aerodynamic improvement, and solar radiation/temperature management that improve actual fuel consumption. The United States has a system of offering credits in proportion to the amount of improvement achieved. Achieving Carbon Neutrality
To achieve carbon neutrality in the automotive industry, it is vital that energy policies (such as those relating to renewable energy and charging infrastructure) and industrial policies (such as those relating to purchasing subsidies, supplier support and battery recycling systems) are advanced in a unified manner. Initiatives must be implemented in coordination with various stakeholders, such as national governments and industry organizations.
In its global business activities, Toyota will coordinate with national governments to establish infrastructure for promoting electrification while implementing electrified vehicle strategies that contribute to reducing CO
2
emissions throughout the entire vehicle life cycle. Initiatives in the Production Field
In the production field, we have announced that we intend to achieve carbon neutrality at global plants by 2035, and we are implementing preparations to face such risks as carbon taxes. We are promoting the reduction of CO
2
emissions through comprehensive energy-saving conservation and the introduction of renewable energy and hydrogen at plants. We have already achieved 100 percent renewable electricity use at all plants in Europe. Reinforcing Strategic Resilience
Toyota will prepare measures to respond to natural disasters, such as formulating BCPs, strengthening supply chains by enhancing information gathering, and improving communication.
Working together with not only the automobile industry but all industries, Toyota will implement initiatives that are both practical and sustainable, continuously striving to ensure compatibility with the society of the “1.5°C or less future storyline.”
To demonstrate progress and validate Toyota’s strategies, we plan to appropriately disclose information regarding various ESG assessment indicators and enhance dialogue with stakeholders, including institutional investors. We believe that this will enable stable fund procurement and sustained corporate value enhancement.
54
Risk Management
(a) The Organization’s Processes for Identifying and Assessing Climate-related Risks
Toyota has a company-wide risk management system that covers all risks related to its global business activities. This system is called the TGRS. All risks, including climate change, are identified, assessed and managed based on the TGRS.
Risk assessment is carried out based on the two perspectives of magnitude of impact and vulnerabilities to clarify the substantive financial or strategic impact on Toyota’s business.
The magnitude of impact is assessed on a five-point scale based on the respective elements of finance, reputation, violation of laws and regulations, and business continuity (financial impact is indexed as a ratio to sales).
Vulnerabilities are assessed based on the two elements of current status of countermeasures and probability of occurrence.
(b) The Organization’s Processes for Managing Climate-related Risks
Once risks by region, function (such as manufacturing and sales), and product are identified by each division and assessed from the perspectives of magnitude of impact and vulnerability, each region and each group mutually cooperates and supports one another to implement a prompt response. The group chief officers and
in-house
company presidents supervise the activities of the in-house
companies and, at the subordinate level, the general managers supervise the activities of divisions and implement and monitor countermeasures. Furthermore, climate-related risks and opportunities are identified and assessed by the Environmental Product Design Assessment Committee, Production Environment Committee and Sustainability Subcommittee and then deliberated by the relevant divisions and officers. The Environmental Product Design Assessment Committee monitors the status of efforts to deal with such issues as fuel economy regulations and procurement, while the Production Environment Committee does the same for such issues affecting direct operations, including CO
2
emission regulations on plants and water risk, and the Sustainability Subcommittee also does the same for the appropriateness of the initiatives in consideration of issues related to the promotion of sustainability as well as external stakeholders. These bodies convene when an important event arises with the participation of executive- or general manager-level members of relevant divisions, such as technology, environment, finance, purchasing, and sales. These meetings assess risks multiple times a year. Important risks and opportunities that require prompt response are reported as needed to the Board of Directors, where response measures are determined.
(c) How Processes for Identifying, Assessing, and Managing Climate-related Risks are Integrated into the Organization’s Overall Risk Management
As described above, the processes using the TGRS constitute a company-wide risk management system that covers all risks and opportunities related to global business activities, including climate change.
At the meetings of the Environmental Product Design Assessment Committee, Production Environment Committee and Sustainability Subcommittee, which bring together members from relevant divisions, climate-related risks and opportunities are identified and assessed, and countermeasures are examined.
Metrics and Targets
(a) Metrics Used by the Organization to Assess Climate-related Risks and Opportunities in Line with Its Strategy and Risk Management Process
55
Toyota recognizes that setting multiple metrics to manage climate-related risks and opportunities comprehensively is an important measure for adapting to and mitigating climate change. As such, Toyota’s metrics include not only the amount of GHG emissions but also other elements related to climate change, such as energy, water, resource recycling, and biodiversity.
Taking these metrics into consideration, Toyota has set the following targets and is systematically promoting them through initiatives in six areas called the “six challenges.”
| • | Toyota Environmental Challenge 2050: A long-term target toward 2050 |
| • | 2030 Milestone: A medium-term target (set by Toyota consistent with criteria of SBTi) |
| • | Seventh Toyota Environmental Action Plan: A short-term target toward 2025 |
Among the “six challenges,” in an aim to achieve carbon neutrality by 2050, Toyota will attempt to achieve Scope 1, 2, and 3 carbon neutrality by 2050 by promoting the following “challenges.”
Initiatives |
Correlation between coverage and Scope 1, 2 and 3 | |||||
Life Cycle Zero CO 2 Emissions Challenge |
Scope 1, 2 and 3 | |||||
New Vehicle Zero CO 2 Emissions Challenge |
Average GHG emissions from new vehicles (Scope 3, category 11)* 1 | |||||
Corporate activities |
Scope 1 and 2 + voluntary initiatives* 2 | |||||
Plant Zero CO 2 Emissions Challenge |
Scope 1 and 2 at production sites + voluntary actions* 2 | |||||
*1 Per vehicle, gCO
2
e/km, Well to Wheel: Includes GHG emissions from the production of fuel and electricity, as well as GHG emissions during vehicle operation. *2 Production sites of Toyota Motor Corporation brands other than those of financially consolidated subsidiaries
Furthermore, Toyota announced in 2021 that it will aim to achieve carbon neutrality at plants by 2035. Internally, certain carbon prices are used as indicators to examine capital investment and other activities.
(b) Targets Used by the Organization to Manage Climate-related Risks and Opportunities and Performance Against Targets
Structure of Environmental Strategies
Toyota is continuously monitoring social trends and customer opinions. Toyota considers which issues it should focus on, quickly anticipates future issues, and addresses environmental issues by applying new ideas and technologies. However, global environmental issues, such as climate change, water shortages, resource depletion, and biodiversity loss continue to spread and grow more serious every day.
We formulated the Toyota Environmental Challenge 2050 in 2015 and the 2030 Milestone in 2018 so that each one of us can understand better these issues and continue to tackle challenges from a long-term perspective, looking toward the world 20 and 30 years in the future. In 2020, we set the 2025 Target as the most recent target of the Toyota Environmental Action Plan, a five-year plan for achieving the above targets.
In September 2022, we confirmed that our reduction targets for in Scope 1, 2 and Scope 3 Category 11 were in line with SBTi criteria, and updated our medium-term targets accordingly.
56
Toyota’s emissions reduction targets in line SBTi criteria
Emissions |
Target Year |
Base Year |
Reduction Rate |
Target Class | ||||||||||||
Scope 1, 2 |
|
2035 |
|
2019 | |
68 |
% |
1.5 degrees Celsius | ||||||||
Scope 3, category 11 (emission intensity) |
Passenger light duty vehicles and light commercial vehicles |
2030 | 33% or greate | r | Well Below 2 degrees Celsius | |||||||||||
Medium and heavy freight trucks |
11.6 | % | ||||||||||||||
*4 Scope 1 and 2 emissions reduction targets are in line with the science-based criteria established by SBTi to limit the global average temperature increase to 1.5 degrees Celsius above
pre-industrial
levels. Scope 3 Category 11 emissions (gCO2
e/km) reduction targets are in line with the science-based criteria to hold the increase in the global average temperature to well below 2 degrees Celsius above pre-industrial
levels. In April 2023, we announced that we aim to reduce the average GHG emissions of vehicles sold worldwide by 33% or greater by 2030 and 50% or greater by 2035 (compared to 2019 levels).
Through a process of back casting from Toyota’s medium- and long-term vision, we determine specific activities that we implement in collaboration with our global consolidated subsidiaries and business partners with the aim of realizing a sustainable world.
Long-term Targets and Medium -term Targets
Life Cycle Zero CO 2 Emissions Challenge |
New Vehicle Zero CO 2 Emissions Challenge |
Corporate Activities |
Plant Zero CO 2 Emissions Challenge |
Challenge of Minimizing and Optimizing Water Usage |
Challenge of Establishing a Recycling- based Society and Systems |
Challenge of Establishing a Future Society in Harmony with Nature | ||||||||
Contribution to SDGs |
 |
 |
 |
 |
 |
 |
 | |||||||
Long-term |
||||||||||||||
Toyota Environmental Challenge 2050 | ||||||||||||||
| Achieve CN for GHG emissions throughout the life cycle* 1 by 2050 |
Achieve CN for average GHG emissions* 2 from new vehicles*3 by 2050 |
Achieve CN for GHG emissions from corporate activities* 4 by 2050 |
Achieve zero CO 2 emissions from production at plants*5 by 2050 |
Minimize water usage and implement water discharge management according to individual local conditions | Promote global deployment of End-of-life |
Connect the reach of nature conservation activities among communities, with the world, to the future | ||||||||
Medium-term |
Reduce global average GHG emissions* 2 by 50% or greater from new vehicles*3 by |
Reduce GHG emissions in corporate activities by 68% by 2035 | Achieve CN for CO 2 emissions from production at plants*5 |
|||||||||||
57
Life Cycle Zero CO 2 Emissions Challenge |
New Vehicle Zero CO 2 Emissions Challenge |
Corporate Activities |
Plant Zero CO 2 Emissions Challenge |
Challenge of Minimizing and Optimizing Water Usage |
Challenge of Establishing a Recycling- based Society and Systems |
Challenge of Establishing a Future Society in Harmony with Nature | ||||||||
| 2035 (compared to 2019 levels) | (compared to 2019 levels) (target set by Toyota consistent with SBTi criteria) |
|||||||||||||
| 2030 Milestone | ||||||||||||||
| Reduce CO 2 emissions by 30% throughout the life cycle by 2030 (compared to 2019 levels) |
• Reduce average GHG emissions *2 from new vehicles by 2030- Passenger light duty vehicles and light commercial vehicles: 33% or greater reduction (compared to 2019 levels) - Medium and heavy freight trucks: 11.6% reduction (compared to 2019 levels) |
• Implement measures, on a priority basis, in the regions where the water environment is considered to have a large impact - Water quantity: Complete measures at the 4 Challenge-focused plants in North America, Asia, and South Africa - Water quality: Complete impact assessments and measures at all of the 22 plants where used water is discharged directly to river in North America, Asia, and Europe • Disclose information appropriately and communicate actively with local communities and suppliers |
• Complete establishment of battery collection to recycling systems globally • Complete setup of 30 model facilities for appropriate treatment and recycling of end-of-life |
• Realize “Plant in Harmony with Nature” — 12 in Japan and 7 in other regions — as well as implement activities promoting harmony with nature in all regions in collaboration with local communities and companies • Contribute to biodiversity conservation activities in collaboration with NGOs and others • Expand initiatives both in-house and outside to foster environmentally conscious persons responsible for the future | ||||||||||
Short-term |
7th Toyota Environmental Action Plan (2025 Target) | |||||||||||||
*1 Applies to GHG emissions from energy consumption in corporate activities of Toyota Motor Corporation and its financially consolidated subsidiaries, and GHG emissions from suppliers and customers in relation to vehicles under Toyota Motor Corporation’s and financially consolidated subsidiaries’ brands (Scope1,2,3). (Only Toyota Motor Corporation’s vehicles are applicable for 2050)
58
*2 Per vehicle, gCO
2
e/km, Well to Wheel: Includes GHG emissions from the production of fuel and electricity, as well as GHG emissions during vehicle operation. *3 Applies to finished vehicles under Toyota Motor Corporation and financially consolidated subsidiary brands. (Only Toyota Motor Corporation’s vehicles are applicable for 2050)
*4 Applies to GHG emissions from energy consumption in Toyota Motor and financially consolidated subsidiary corporate activities, and GHG emissions related to the production of Toyota Motor brands other than by financially consolidated subsidiaries (Scope 1, 2 + voluntary actions).
*5 Applies to CO
2
emissions from energy consumption in Toyota Motor Corporation and financially consolidated subsidiary plants, and CO2
emissions from the production of Toyota Motor Corporation brands other than those of financially consolidated subsidiaries (Scope 1, 2 + voluntary actions). Initiatives to Achieve Carbon Neutrality
In April 2021, the Toyota group declared its commitment to take on the global challenge of working toward achieving carbon neutrality by 2050.
We are aiming to promote practical electric vehicles that can reduce carbon emissions now and steadily, and offer sustainable options that are closely aligned with the energy situation in each region and the reality of how cars are used.

Disclosure of Iranian Activities under Section 13(r) of the Securities Exchange Act of 1934
Not applicable.
Research and Development
The overriding goals of Toyota’s technology and product development activities are to minimize the negative aspects of vehicles, such as traffic accidents and impact on the environment, and maximize the positive aspects, such as driving pleasure, comfort and convenience. By achieving these sometimes-conflicting goals to a high degree, Toyota seeks to open the door to the automobile society of the future. To ensure efficient progress in research and development activities, Toyota coordinates and integrates all research and development phases, from basic research and advanced research to forward-looking technology and product development. With
59
respect to long-term basic research in areas such as energy, the environment, information technology, telecommunications and materials, projects are regularly reviewed and evaluated in consultation with outside experts to achieve research and development cost control. With respect to forward-looking, leading-edge technology and product development, Toyota establishes cost-performance benchmarks on a basis to ensure efficient development investment.
project-by-project
The chart below provides an overview of Toyota’s R&D at each phase.
Basic research |
Phase to discover development theme Research on basic vehicle-related technology | |
Forward-looking and leading-edge technology development |
Phase requiring technological breakthroughs such as components and systems Development of leading-edge components and systems that are more advanced than those of competitors | |
Product development |
Phase mainly for development of new models Development of all-new models and existing-model upgrades |
With a focus on environmentally friendly, carbon-neutral and safe-vehicle technology, Toyota is promoting research and development into the early commercialization of next generation environmentally friendly, energy-efficient and safe-vehicle technology. Toyota is also moving forward with the development of innovative technologies such as electrification, connected vehicles and automated driving so as to realize a mobility society of the future that enables everyone to enjoy freedom of movement beyond the conventional concept of vehicles. To this end, Toyota is focusing on the following areas:
| • | further improvements in hybrid technologies, including in functions and cost, and contributions to the environment through advancements; |
| • | improvement in internal combustion engine fuel economy technology as well as improvement in technology in connection with more stringent emission standards; |
| • | development of BEVs, FCEVs and other alternative fuel vehicles; |
| • | development of advanced safety technology designed to promote driving and vehicle safety; |
| • | development of automated driving technologies |
| • | connected car technologies; and |
| • | development of technology to bring about more comfortable travel (driving). |
For a detailed discussion of the company’s research and development infrastructure, see “Item 5. Operating and Financial Review and Prospects — 5.C Research and Development, Patents and Licenses.”
Components and Parts, Raw Materials and Sources of Supply
Toyota purchases parts, components, raw materials, equipment and other supplies from multiple competing suppliers located around the world. Toyota works closely with its suppliers to pursue optimal procurement. Toyota believes that this policy encourages technological innovation, cost reduction and other measures to strengthen its vehicle competitiveness. Although there are supply restrictions with respect to the procurement of certain parts and components, Toyota plans to continue purchases based on the same principle.
Because Toyota had more than 50 overseas operations in 26 countries and regions as of March 31, 2023, procurement of parts and components is being carried out not only locally in the country of the production site but also from third countries. As a result, the distribution network has become increasingly complex. In order to
60
realize timely and efficient distribution while minimizing costs, Toyota is promoting efforts to optimize each stage of the supply chain. To this end, Toyota has developed a standardized system of global distribution and is supporting the operation of the system at each production base. The use of the global distribution system aims at implementing parts procurement that meets changes in vehicle production in a timely manner. These varying efforts, combined together, have led to maximized customer satisfaction, as well as to building a good working relationship with Toyota’s suppliers.
Toyota aims to share information and collaborate among the procurement divisions in each of the regions throughout the world in order to procure parts and materials from the most competitive suppliers among Toyota factories located in various areas worldwide. At the same time, Toyota carries out streamlining efforts together with suppliers in each country in order to achieve sustainable growth. Toyota has been working on cost reduction measures, referred to as , or cost innovation) and VA (value analysis) activities, which aims to eliminate waste in all processes from design to production while ensuring the reliability and safety of each part. Through these activities, Toyota focuses on “developing a real cost-competitive structure” by working together with suppliers.
RR-CI
(ryohin-renka
In response to a significant upward trend in materials costs, including related logistics and other costs, since fiscal 2022, Toyota is accelerating initiatives such as the replacement of raw materials with those that are less subject to price pressure and reduction of raw material usage.
Intellectual Property
Through its ongoing challenge to be one step ahead in conducting new research and development, Toyota has enhanced its product appeal and technological prowess, which have been serving as the source of the company’s competitiveness. At the core of Toyota’s products created through this research and development always lies intellectual property, including invention,
know-how
and brands. This intellectual property functions as Toyota’s important management resources. By protecting and utilizing our intellectual property in an appropriate manner, we will continue to contribute to society. Toward the realization of a future mobility society, Toyota is carrying out intellectual property activities in line with management priorities.
For example, we are focusing resources on such areas as carbon neutrality, including the development of electrified vehicles and batteries, and on software and connected initiatives, including connected and automated driving technologies. We are also reinforcing efforts to obtain and utilize intellectual property licenses in such areas to strengthen our future competitiveness.
As for the intellectual property activities framework, having established intellectual property functions at the R&D centers in Japan, the United States, Europe and China, Toyota supports technology development globally by securing organic, systematic coordination between R&D activities and intellectual property activities. Working in concert with approximately 110 law firms around the world, we also collect intellectual property information and take measures suitable for any intellectual property disputes that may arise in specific countries or regions. To enhance activities that incorporate management, R&D and intellectual property in one, Toyota has an Intellectual Property Management Committee. The members of the Committee discuss and make decisions concerning obtaining and utilizing important intellectual property conducive to management and for responding to management risks related to intellectual property.
In 2022, Toyota filed approximately 14,000 patent applications domestically and internationally. In Japan, Toyota believes it was one of the leading companies that year in terms of the number of both patent applications and patent registrations. In the United States, Toyota believes it was one of the leading automobile manufacturers that year in terms of the number of patent registrations.
61
Capital Expenditures and Divestitures
Set forth below is a chart of Toyota’s principal capital expenditures between April 1, 2020 and March 31, 2023, the approximate total costs of such activity, as well as the location and method of financing of such activity, presented on a “by subsidiary” basis and as reported in Toyota’s annual Japanese securities report filed with the director of the Kanto Local Finance Bureau.
Description of Activity |
Total Cost (Yen in billions) |
Location |
Primary Method of Financing | |||||
Japan |
||||||||
Investment primarily in technology and products by Toyota Motor Corporation |
1,105.6 |
Japan |
Internal funds, financing from issuance of bonds, etc. | |||||
Investment primarily in technology and products by Daihatsu Motor Co., Ltd. |
110.9 | Japan | Internal funds | |||||
Investment primarily in technology and products by Toyota Motor Kyushu, Inc. |
107.8 | Japan | Internal funds | |||||
Investment primarily in technology and products by Toyota Auto Body Co., Ltd. |
93.1 | Japan | Internal funds | |||||
Investment primarily in technology and products by Prime Planet Energy & Solutions, Inc. |
92.5 | Japan | Internal funds | |||||
Investment primarily in technology and products by Primearth EV Energy Co., Ltd. |
61.4 | Japan | Internal funds | |||||
Outside of Japan |
||||||||
Investment primarily to promote localization by Toyota Motor Manufacturing Texas, Inc. |
173.6 | United States | Internal funds | |||||
Investment primarily to promote localization by Toyota Motor Manufacturing Canada, Inc. |
167.2 | Canada | Internal funds | |||||
Investment primarily to promote localization by Toyota Motor Manufacturing, Indiana, Inc. |
140.9 | United States | Internal funds | |||||
Investment primarily to promote localization by Toyota Battery Manufacturing, Inc. |
102.5 | United States | Internal funds | |||||
Investment primarily to promote localization by Toyota Motor Manufacturing, Kentucky, Inc. |
88.0 | United States | Internal funds | |||||
Investment primarily to promote localization by Toyota Motor Thailand Co., Ltd. |
68.7 | Thailand | Internal funds | |||||
Investment primarily to promote localization by Toyota Motor Europe NV/SA |
68.3 | Belgium | Internal funds | |||||
Investment primarily to promote localization by Toyota Motor Manufacturing, Northern Kentucky, Inc. |
66.1 | United States | Internal funds | |||||
Investment primarily in leased automobiles by Toyota Motor Credit Corporation |
5,095.0 |
United States |
Internal funds, financing from issuance of bonds, etc. | |||||
62
Set forth below is information with respect to Toyota’s material plans to construct, expand or improve its facilities between April 2023 and March 2024, presented on a “by subsidiary” basis and as reported in Toyota’s annual Japanese securities report filed with the director of the Kanto Local Finance Bureau.
Description of Activity |
Total Cost (Yen in billions) |
Location |
Primary Method of Financing | |||||
Japan |
||||||||
Investment primarily in manufacturing facilities by Toyota Motor Corporation |
530.0 | Japan | Internal funds | |||||
Investment primarily in manufacturing facilities by Prime Planet Energy & Solutions, Inc. |
76.5 | Japan | Internal funds | |||||
Outside of Japan |
||||||||
Investment primarily in manufacturing facilities by Toyota Battery Manufacturing, Inc. |
186.0 | United States | Internal funds | |||||
Investment primarily in manufacturing facilities by Toyota Motor Manufacturing de Guanajuato |
104.4 | Mexico | Internal funds | |||||
Investment primarily in manufacturing facilities by Toyota Motor Manufacturing, Indiana, Inc. |
91.7 | United States | Internal funds | |||||
Investment primarily in manufacturing facilities by Toyota Motor Manufacturing, Kentucky, Inc. |
75.7 | United States | Internal funds | |||||
Toyota does not collect information on the amount of expenditures already paid for each plant under construction because Toyota believes that it is difficult and it would require unreasonable effort or expense to identify and categorize each expenditure item with reasonable accuracy as past and future expenditures. Toyota’s construction projects consist of numerous expenditures, each of which is continually being adjusted and incurred in variable and constantly changing amounts as part of the overall
work-in-progress.
Seasonality
Toyota does not consider its seasonality material in the sense of significantly higher sales during any certain period of the year as compared to other periods of the year.
Legal Proceedings
Toyota and other automakers were named in certain class actions filed in Mexico, Australia, Israel and Brazil relating to Takata airbag issues. The actions in Israel and Brazil are being litigated. The actions in Mexico and Australia have been resolved.
Toyota is named as a defendant in an economic loss class action lawsuit in Australia in which damages are claimed on the basis that diesel particulate filters in certain vehicle models are defective. On April 7, 2022 and March 27, 2023, Toyota received unfavorable judgments in the court of first instance and the Federal Court of Australia, respectively. The judgments included a finding that there was a perceived reduction in vehicle value of certain vehicle models. Toyota disagrees with the appeal court judgment and has filed a final appeal. Other claims of economic loss in this class action lawsuit continue to be litigated at the court of first instance. In calculating the provision we should record in the consolidated financial statements as a result of the aforementioned judgments, Toyota has considered various factors including the legal and factual circumstances of the case, the contents of the judgement of the court of first instance and the Federal Court of Australia, and the views of legal counsel. The currently estimated probable economic outflow related to the class action is immaterial to Toyota’s consolidated financial position, results of operations and cash flows. At this stage, however, the final outcome and therefore ultimate financial liability for Toyota on account of this matter cannot be predicted with certainty.
63
In April 2020, Toyota reported possible anti-bribery violations related to a Thai subsidiary to the SEC and the DOJ, and is cooperating with their investigations. Investigations by governmental authorities related to these matters could result in the imposition of civil or criminal penalties, fines or other sanctions, or litigation. Toyota cannot predict the scope, duration or outcome of these matters at this time.
On March 4, 2022, Hino Motors, Ltd., a publicly traded Japanese company that produces and sells commercial trucks and buses, and of which Toyota owns 50.19% of the voting interests as of March 31, 2023, disclosed that it had voluntarily commenced an investigation into potential issues regarding emissions performance and certification in the North American and Japanese markets, and that it has reported such issues to and is cooperating with the relevant authorities. Hino announced that, through such investigation, it identified past misconduct in relation to its applications for certification concerning the emissions and the fuel economy performance of certain of its engines for the Japanese market. In Japan, Hino was subject to an
on-site
inspection from MLIT, and received a corrective action order from it. On October 7, 2022, Hino submitted a recurrence prevention report to MLIT. MLIT has also revoked certain of the “type approvals” (that is, approvals that exempt new vehicles or vehicles with certain equipment from individual testing by government inspectors prior to sale) and the fuel consumption ratings relating to certain engine models. Hino has also further agreed to compensate certain of its customers in Japan for certain additional motor vehicle taxes that have become payable on account of the misconduct, as well as in connection with vehicles with engines with respect to which there were fuel efficiency problems. With respect to the United States, the U.S. Department of Justice and other U.S. agencies are conducting an investigation with respect to potential violations of relevant laws and regulations regarding the certification of Hino’s model year 2010 to model year 2019 engines for the U.S. market. In this regard, a lawsuit naming Hino and its subsidiaries as defendants in a putative class action lawsuit has been filed at the U.S. District Court for the Southern District of Florida claiming damages related to Hino’s vehicles sold in the U.S. from 2004 to 2021. Both the investigation and the legal proceedings are ongoing. In addition, a lawsuit against Hino and its subsidiaries as defendants in a representative action lawsuit has also been filed in Australia as a class action lawsuit. In the lawsuit, the plaintiffs claim that they have suffered loss and damage resulting from alleged misleading or deceptive conduct in relation to non-compliance
of the affected vehicles with emissions standards and fuel efficiency standards. It is possible that other similar lawsuits may be filed in the future. Further, Hino is continuing to conduct a comprehensive review related to engine certification procedures under European and other jurisdictions’ standards in addition to U.S. standards. Investigations by governmental authorities, as well as civil litigation, related to these matters could result in the imposition of civil or criminal penalties, fines or other sanctions, damages awards, or other consequences. Toyota cannot predict the scope, duration, or outcome of these matters at this time. See “Item 4. Information on the Company — 4.B Business Overview — Selected Initiatives” for further discussion of these and related matters. Toyota also has various other pending legal actions and claims, including without limitation personal injury and wrongful death lawsuits and claims in the United States, as well as intellectual property litigation, and is subject to government investigations from time to time.
Beyond the amounts accrued with respect to all aforementioned matters, Toyota is unable to estimate a range of reasonably possible loss, if any, for the pending legal matters because (i) many of the proceedings are in evidence gathering stages, (ii) significant factual issues need to be resolved, (iii) the legal theory or nature of the claims is unclear, (iv) the outcome of future motions or appeals is unknown and/or (v) the outcomes of other matters of these types vary widely and do not appear sufficiently similar to offer meaningful guidance. Therefore, for all of the aforementioned matters, which Toyota is in discussions to resolve, any losses that are beyond the amounts accrued could have an adverse effect on Toyota’s financial position, results of operations or cash flows.
64
4.C ORGANIZATIONAL STRUCTURE
As of March 31, 2023, Toyota Motor Corporation had 207 Japanese subsidiaries and 362 overseas subsidiaries. The following table sets forth for each of Toyota Motor Corporation’s principal subsidiaries, the country of incorporation and the percentage ownership interest and the voting interest held by Toyota Motor Corporation.
Name of Subsidiary |
Country of Incorporation |
Percentage Ownership Interest |
Percentage Voting Interest |
|||||||||
Toyota Financial Services Corporation |
Japan | 100.00 | 100.00 | |||||||||
Hino Motors, Ltd. |
Japan | 50.11 | 50.19 | |||||||||
Daihatsu Motor Co., Ltd. |
Japan | 100.00 | 100.00 | |||||||||
TOYOTA Mobility Tokyo Inc. |
Japan | 100.00 | 100.00 | |||||||||
Toyota Finance Corporation |
Japan | 100.00 | 100.00 | |||||||||
Toyota Mobility Parts Co., Ltd. |
Japan | 54.08 | 54.08 | |||||||||
Toyota Auto Body Co., Ltd. |
Japan | 100.00 | 100.00 | |||||||||
Toyota Motor Kyushu, Inc. |
Japan | 100.00 | 100.00 | |||||||||
Toyota Motor East Japan, Inc. |
Japan | 100.00 | 100.00 | |||||||||
Daihatsu Motor Kyushu Co., Ltd. |
Japan | 100.00 | 100.00 | |||||||||
Cataler Corporation |
Japan | 56.51 | 57.38 | |||||||||
Toyota Motor Engineering & Manufacturing North America, Inc. |
United States | 100.00 | 100.00 | |||||||||
Toyota Motor Manufacturing, Kentucky, Inc. |
United States | 100.00 | 100.00 | |||||||||
Toyota Motor North America, Inc. |
United States | 100.00 | 100.00 | |||||||||
Toyota Motor Credit Corporation |
United States | 100.00 | 100.00 | |||||||||
Toyota Motor Manufacturing, Indiana, Inc. |
United States | 100.00 | 100.00 | |||||||||
Toyota Motor Manufacturing, Texas, Inc. |
United States | 100.00 | 100.00 | |||||||||
Toyota Motor Sales, U.S.A., Inc. |
United States | 100.00 | 100.00 | |||||||||
Toyota Financial Savings Bank |
United States | 100.00 | 100.00 | |||||||||
Toyota Motor Manufacturing Canada Inc. |
Canada | 100.00 | 100.00 | |||||||||
Toyota Credit Canada Inc. |
Canada | 100.00 | 100.00 | |||||||||
Toyota Canada Inc. |
Canada | 51.00 | 51.00 | |||||||||
Toyota Motor Manufacturing de Baja California, S. de R.L. de C.V. |
Mexico | 100.00 | 100.00 | |||||||||
Toyota Motor Manufacturing de Guanajuato, S.A.de C.V. |
Mexico | 100.00 | 100.00 | |||||||||
Toyota Motor Europe NV/SA |
Belgium | 100.00 | 100.00 | |||||||||
Toyota Motor Manufacturing France S.A.S. |
France | 100.00 | 100.00 | |||||||||
Toyota France S.A.S |
France | 100.00 | 100.00 | |||||||||
Toyota Motor Finance (Netherlands) B.V. |
Netherlands | 100.00 | 100.00 | |||||||||
Toyota Central Europe Sp. z o.o. |
Poland | 100.00 | 100.00 | |||||||||
Toyota Financial Services (UK) PLC |
United Kingdom | 100.00 | 100.00 | |||||||||
Toyota (GB) PLC |
United Kingdom | 100.00 | 100.00 | |||||||||
Toyota Motor Manufacturing Czech Republic, s.r.o. |
Czech Republic | 100.00 | 100.00 | |||||||||
Toyota Motor Manufacturing Turkey Inc. |
Turkey | 90.00 | 90.00 | |||||||||
Guangqi Toyota Engine Co., Ltd. |
China | 70.00 | 70.00 | |||||||||
Toyota Motor (China) Investment Co., Ltd. |
China | 100.00 | 100.00 | |||||||||
Toyota Motor Finance (China) Co., Ltd. |
China | 100.00 | 100.00 | |||||||||
Toyota Kirloskar Motor Private Ltd. |
India | 89.00 | 89.00 | |||||||||
P.T. Astra Daihatsu Motor |
Indonesia | 61.75 | 61.75 | |||||||||
PT. Toyota Motor Manufacturing Indonesia |
Indonesia | 95.00 | 95.00 | |||||||||
Toyota Motor Asia Pacific Pte Ltd. |
Singapore | 100.00 | 100.00 | |||||||||
Kuozui Motors, Ltd. |
Taiwan | 70.00 | 70.00 | |||||||||
Toyota Leasing (Thailand) Co., Ltd. |
Thailand | 87.44 | 87.44 | |||||||||
Toyota Motor Thailand Co., Ltd. |
Thailand | 86.43 | 86.43 | |||||||||
Toyota Daihatsu Engineering & Manufacturing Co., Ltd. |
Thailand | 100.00 | 100.00 | |||||||||
Toyota Motor Corporation Australia Ltd. |
Australia | 100.00 | 100.00 | |||||||||
Toyota Finance Australia Ltd. |
Australia | 100.00 | 100.00 | |||||||||
Toyota Argentina S.A. |
Argentina | 100.00 | 100.00 | |||||||||
Toyota do Brasil Ltda. |
Brazil | 100.00 | 100.00 | |||||||||
Toyota South Africa Motors (Pty) Ltd. |
South Africa | 100.00 | 100.00 | |||||||||
65
4.D PROPERTY, PLANTS AND EQUIPMENT
As of March 31, 2023, Toyota and its affiliated companies produced automobiles and related components through more than 50 overseas manufacturing organizations in 26 countries and regions besides Japan. The facilities are located principally in Japan, the United States, Canada, the United Kingdom, France, Turkey, Czech Republic, Poland, Thailand, China, Taiwan, India, Indonesia, South Africa, Argentina and Brazil.
In addition to its manufacturing facilities, Toyota’s properties include sales offices and other sales facilities in major cities, repair service facilities and research and development facilities.
The following table sets forth information, as of March 31, 2023, with respect to Toyota’s principal facilities and organizations, all of which are owned by Toyota Motor Corporation or its subsidiaries. However, small portions, all under approximately 20%, of some facilities are on leased premises.
Facility or Subsidiary Name |
Location |
Land Area (thousands of square meters) |
Number of Employees |
Principal Products or Functions | ||||||||
Japan (Toyota Motor Corporation) |
||||||||||||
Toyota Technical Center Shimoyama |
Toyota City, Aichi Pref. | 5,573 | 347 | Research and Development | ||||||||
Tahara Plant |
Tahara City, Aichi Pref. | 4,032 | 6,509 | Automobiles | ||||||||
Toyota Head Office and Technical Center |
Toyota City, Aichi Pref. | 2,767 | 22,891 | Research and Development | ||||||||
Higashi-Fuji Technical Center |
Susono City, Shizuoka Pref. | 2,722 | 2,572 | Research and Development | ||||||||
Motomachi Plant |
Toyota City, Aichi Pref. | 1,575 | 8,135 | Automobiles | ||||||||
Takaoka Plant |
Toyota City, Aichi Pref. | 1,318 | 4,189 | Automobiles | ||||||||
Tsutsumi Plant |
Toyota City, Aichi Pref. | 1,004 | 4,811 | Automobiles | ||||||||
Kamigo Plant |
Toyota City, Aichi Pref. | 895 | 3,172 | Automobile parts | ||||||||
Kinu-ura Plant |
Hekinan City, Aichi Pref. | 808 | 2,791 | Automobile parts | ||||||||
Honsha Plant |
Toyota City, Aichi Pref. | 623 | 1,838 | Automobile parts | ||||||||
Japan (Subsidiaries) |
||||||||||||
Daihatsu Motor Co., Ltd. |
Ikeda City, Osaka, etc. | 7,739 | 11,048 | Automobiles | ||||||||
Hino Motors, Ltd. |
Hino City, Tokyo, etc. | 6,324 | 12,244 | Automobiles | ||||||||
Toyota Auto Body Co., Ltd. |
Kariya City, Aichi Pref., etc. | 2,274 | 11,504 | Automobiles | ||||||||
Toyota Motor Kyushu, Inc. |
Miyawaka City, Fukuoka Pref. | 1,940 | 8,508 | Automobiles | ||||||||
TOYOTA Mobility Tokyo Inc. |
Minato-ku, Tokyo, etc. |
388 | 6,702 | Sales facilities | ||||||||
Outside Japan (Subsidiaries) |
||||||||||||
Toyota Motor Manufacturing, Texas, Inc. |
Texas, U.S.A. | 8,127 | 2,881 | Automobiles | ||||||||
Toyota Motor Manufacturing, Kentucky, Inc. |
Kentucky, U.S.A. | 5,161 | 7,715 | Automobiles | ||||||||
Toyota Motor Manufacturing Canada, Inc. |
Ontario, Canada | 4,752 | 7,904 | Automobiles | ||||||||
Toyota Motor Thailand Co., Ltd. |
Samutprakarn, Thailand | 4,414 | 8,189 | Automobiles | ||||||||
Toyota Motor Manufacturing, Indiana, Inc. |
Indiana, U.S.A. | 4,359 | 6,490 | Automobiles | ||||||||
Toyota is constantly engaged in upgrading, modernizing and revamping the operations of its manufacturing facilities based on its assessment of market needs and prospects. To respond flexibly to fluctuations in demand in each of its production operations throughout the world, Toyota continually reviews and implements appropriate
66
production measures such as revising takt time and adjusting days of operation. As a result, Toyota believes it would require unreasonable effort to track the exact productive capacity and the extent of utilization of each of its manufacturing facilities with a reasonable degree of accuracy.
As of March 31, 2023, property, plant and equipment having a net book value of approximately ¥1,498.4 billion was pledged as collateral securing indebtedness incurred by Toyota Motor Corporation’s consolidated subsidiaries. Toyota believes that there does not exist any material environmental issues that may affect the company’s utilization of its assets.
Toyota considers all its principal manufacturing facilities and other significant properties to be in good condition and adequate to meet the needs of its operations.
See “Item 4. Information on the Company — 4.B Business Overview — Capital Expenditures and Divestitures” for a description of Toyota’s material plans to construct, expand or improve facilities.
ITEM 4A. UNRESOLVED STAFF COMMENTS
None.
ITEM 5. OPERATING AND FINANCIAL REVIEW AND PROSPECTS
5.A OPERATING RESULTS
Financial information discussed in this section is derived from Toyota’s consolidated financial statements that appear elsewhere in this annual report. The financial statements have been prepared in accordance with IFRS, as issued by the IASB.
Overview
The business segments of Toyota include automotive operations, financial services operations and all other operations. Automotive operations are Toyota’s most significant business segment, accounting for 89% of Toyota’s total revenues before the elimination of intersegment revenues for fiscal 2023. Toyota’s primary markets based on vehicle unit sales for fiscal 2023 were: Japan (23.5%), North America (27.3%), Europe (11.7%) and Asia (19.8%).
Automotive Market Environment
The worldwide automotive market is highly competitive and volatile. The demand for automobiles is affected by a number of factors including social, political and general economic conditions; introduction of new vehicles and technologies; and costs incurred by customers to purchase or operate vehicles. These factors can cause consumer demand to vary substantially in different geographic markets and for different types of automobiles.
During fiscal 2023, the global economy experienced an accelerated rise in consumer prices in both developed and emerging countries as energy and other prices soared against a backdrop of geopolitical tensions. From August onward, there were signs of a decline in demand due to concerns of a slowdown in the global economy as central banks in various countries accelerated the pace of monetary tightening.
67
The following table sets forth Toyota’s consolidated vehicle unit sales by geographic market based on location of customers for the past three fiscal years.
Thousands of units |
||||||||||||
Year Ended March 31, |
||||||||||||
2021 |
2022 |
2023 |
||||||||||
Japan |
2,125 | 1,924 | 2,069 | |||||||||
North America |
2,313 | 2,394 | 2,407 | |||||||||
Europe |
959 | 1,017 | 1,030 | |||||||||
Asia |
1,222 | 1,543 | 1,751 | |||||||||
Other* |
1,027 | 1,352 | 1,565 | |||||||||
Overseas total |
5,521 | 6,306 | 6,753 | |||||||||
Total |
7,646 | 8,230 | 8,822 | |||||||||
| * | “Other” consists of Central and South America, Oceania, Africa and the Middle East, etc. |
During fiscal 2022, Toyota’s consolidated vehicle unit sales in Japan decreased due to tightening of supply of, and increasing demand for, semiconductors and the spread of
COVID-19.
During fiscal 2023, Toyota’s consolidated vehicle unit sales in Japan increased due to gradual lessening of the impact of COVID-19.
During both fiscal 2022 and fiscal 2023, overseas vehicle unit sales increased due to strong market conditions as compared to the prior year. Toyota’s share of total vehicle unit sales in each market is influenced by the quality, safety, reliability, price, design, performance, economy and utility of Toyota’s vehicles compared with those offered by other manufacturers. The timely introduction of new or redesigned vehicles is also an important factor in satisfying customer needs. Toyota’s ability to satisfy changing customer preferences can affect its revenues and earnings significantly.
The profitability of Toyota’s automotive operations is affected by many factors. These factors include:
| • | vehicle unit sales volumes, |
| • | the mix of vehicle models and options sold, |
| • | the level of parts and service sales, |
| • | the levels of price discounts and other sales incentives and marketing costs, |
| • | the cost of customer warranty claims and other customer satisfaction actions, |
| • | the cost of research and development and other fixed costs, |
| • | the prices of raw materials, |
| • | the ability to control costs, |
| • | the efficient use of production capacity, |
| • | the adverse effect on production due to such factors as the reliance on various suppliers for the provision of supplies, or the general scarcity of certain supplies, |
| • | climate change risk, including both physical risks as well as transition risks, |
| • | the adverse effect on market, sales and productions of natural calamities as well as the outbreak and spread of epidemics and interruptions of social infrastructure, and |
| • | changes in the value of the Japanese yen and other currencies in which Toyota conducts business. |
68
Changes in laws, regulations, policies and other governmental actions can also materially impact the profitability of Toyota’s automotive operations. These laws, regulations and policies include those attributed to environmental matters, vehicle safety, fuel economy and emissions that can add significantly to the cost of vehicles.
Many governments also impose local content requirements, impose tariffs and other trade barriers, and enact price or exchange controls that can limit an automaker’s operations and can make the repatriation of profits unpredictable. Changes in these laws, regulations, policies and other governmental actions may affect the production, licensing, distribution or sale of Toyota’s products, cost of products or applicable tax rates. From when potential safety problems arise, Toyota issues vehicle recalls and takes other safety measures including safety campaigns relating to its vehicles. The recalls and other safety measures described above have led to a number of claims and legal proceedings against Toyota. For a more detailed description of these claims and legal proceedings, see “Item 4. Information on the Company — 4B. Business Overview — Legal Proceedings” and notes 24 and 30 to the consolidated financial statements.
time-to-time
The worldwide automotive industry is in a period of global competition which may continue for the foreseeable future, and in general the competitive environment in which Toyota operates is likely to intensify. Toyota believes it has the resources, strategies and technologies in place to compete effectively in the industry as an independent company for the foreseeable future.
Financial Services Operations
The competition in the worldwide automobile financial services industry is intensifying. As competition increases, margins on financing transactions may decrease and market share may also decline as customers obtain financing for Toyota vehicles from alternative sources.
Toyota’s financial services operations mainly include loans and leasing programs for customers and dealers. Toyota believes that its ability to provide financing to its customers is an important value added service. Therefore, Toyota has expanded its network of finance subsidiaries in order to offer financial services in many countries.
Toyota’s competitors for retail financing and retail leasing include commercial banks, credit unions and other finance companies. Meanwhile, commercial banks and other captive automobile finance companies also compete against Toyota’s wholesale financing activities.
Toyota’s total receivables related to financial services increased during fiscal 2023 mainly due to an increase in retail receivables. Also, vehicles and equipment on operating leases decreased during fiscal 2023 mainly due to a decrease in the number of operating leases in financial services subsidiaries in North America.
For details on receivables related to financial services and vehicles and equipment on operating leases, see notes 8 and 12 to the consolidated financial statements.
Toyota’s receivables related to financial services are subject to collectability risks. These risks include consumer and dealer insolvencies and insufficient collateral values (less costs to sell) to realize the full carrying values of these receivables. See notes 4 and 19 to the consolidated financial statements for additional information.
Toyota continues to originate leases to finance new Toyota vehicles. These leasing activities are subject to residual value risk. Residual value losses could be incurred when the lessee of a vehicle does not exercise the option to purchase the vehicle at the end of the lease term. See note 3 to the consolidated financial statements for additional information.
69
Toyota enters into interest rate swap agreements and cross currency interest rate swap agreements to convert its fixed-rate debt to variable-rate functional currency debt. A portion of the derivative instruments are entered into to hedge interest rate risk from an economic perspective and are not designated as a hedge of specific assets or liabilities on Toyota’s consolidated statements of financial position and accordingly, unrealized gains or losses related to derivatives that are not designated as a hedge are recognized currently in operations. See the discussion in “Quantitative and Qualitative Disclosures about Market Risk” and notes 20 and 21 to the consolidated financial statements.
The fluctuations in funding costs can affect the profitability of Toyota’s financial services operations. Funding costs are affected by a number of factors, some of which are not in Toyota’s control. These factors include general economic conditions, prevailing interest rates and Toyota’s financial strength. Funding costs decreased during fiscal 2022 mainly as a result of lower interest rates. Funding costs increased during fiscal 2023 mainly as a result of higher interest rates.
Toyota launched its credit card business in Japan in April 2001. As of March 31, 2022, Toyota had 15.7 million cardholders, a decrease of 0.7 million cardholders compared with March 31, 2021. As of March 31, 2023, Toyota had 16.1 million cardholders, an increase of 0.4 million cardholders compared with March 31, 2022. Credit card receivables as of March 31, 2022 increased by ¥17.3 billion from March 31, 2021 to ¥501.4 billion, and that as of March 31, 2023 increased by ¥53.4 billion from March 31, 2022 to ¥554.8 billion.
Other Business Operations
Toyota’s other business operations consist of its information technology business and others.
Toyota does not expect its other business operations to materially contribute to Toyota’s consolidated results of operations.
Currency Fluctuations
Toyota is affected by fluctuations in foreign currency exchange rates. Toyota is exposed to fluctuations in the value of the Japanese yen against the U.S. dollar and the euro as well as the Australian dollar, the Canadian dollar, the British pound and others. Toyota’s consolidated financial statements, which are presented in Japanese yen, are affected by foreign currency exchange fluctuations through both translation risk and transaction risk.
Translation risk is the risk that Toyota’s consolidated financial statements for a particular period or for a particular date will be affected by changes in the prevailing exchange rates of the currencies in those countries in which Toyota does business compared with the Japanese yen. Even though the fluctuations of currency exchange rates to the Japanese yen can be substantial, and therefore significantly impact comparisons with prior periods and among the various geographic markets, the translation risk is a reporting consideration and does not reflect Toyota’s underlying results of operations. Toyota does not hedge against translation risk.
Transaction risk is the risk that the currency structure of Toyota’s costs and liabilities will deviate from the currency structure of sales proceeds and assets. Transaction risk relates primarily to sales proceeds from Toyota’s
non-domestic
operations from vehicles produced in Japan. Toyota believes that the location of its production facilities in different parts of the world has significantly reduced the level of transaction risk. As part of its globalization strategy, Toyota has continued to localize production by constructing production facilities in the major markets in which it sells its vehicles. In fiscal 2022 and 2023, Toyota produced 71.6% and 77.3%, respectively, of its
non-domestic
sales outside Japan. In North America, 68.5% and 76.8% of vehicles sold in fiscal 2022 and 2023, respectively, were produced locally. In Europe, 69.1% and 73.9% of vehicles sold in fiscal 2022 and 2023, respectively, were produced locally. In Asia, 90.6% and 98.3% of vehicles sold in fiscal 2022 and 2023, respectively, were produced locally. Localizing production enables Toyota to locally purchase many of the supplies and resources used in the production process, which allows for a better match of local currency revenues with local currency expenses. 70
Toyota also enters into foreign currency transactions and other hedging instruments to address a portion of its transaction risk. This has reduced, but not eliminated, the effects of foreign currency exchange rate fluctuations, which in some years can be significant. See notes 20 and 21 to the consolidated financial statements for additional information.
Generally, a weakening of the Japanese yen against other currencies has a positive effect on Toyota’s revenues, operating income and net income attributable to Toyota Motor Corporation. A strengthening of the Japanese yen against other currencies has the opposite effect. In fiscal 2022 and 2023, the Japanese yen was on average weaker against the U.S. dollar and the euro in comparison to fiscal 2021 and 2022, respectively. At the end of each of fiscal 2022 and 2023, the Japanese yen was weaker against the U.S. dollar and the euro in comparison to the end of fiscal 2021 and 2022, respectively. See note 19 to the consolidated financial statements for additional information.
Segmentation
Toyota’s most significant business segment is its automotive operations. Toyota carries out its automotive operations as a global competitor in the worldwide automotive market. Management allocates resources to, and assesses the performance of, its automotive operations as a single business segment on a worldwide basis and assesses financial and
non-financial
data such as vehicle unit sales, production volume, market share information, vehicle model plans and plant location costs to allocate resources within the automotive operations. Toyota does not manage any subset of its automotive operations, such as domestic or overseas operations or parts, as separate management units. Geographic Breakdown
The following table sets forth Toyota’s sales revenues in each geographic market based on the country location of TMC or the subsidiaries that transacted the sale with the external customer for the past three fiscal years.
Yen in millions |
||||||||||||
Year ended March 31, |
||||||||||||
2021 |
2022 |
2023 |
||||||||||
Japan |
8,587,193 | 8,214,740 | 9,122,282 | |||||||||
North America |
9,325,950 | 10,897,946 | 13,509,027 | |||||||||
Europe |
2,968,289 | 3,692,214 | 4,097,537 | |||||||||
Asia |
4,555,897 | 5,778,115 | 7,076,922 | |||||||||
Other* |
1,777,266 | 2,796,493 | 3,348,530 | |||||||||
| * | “Other” consists of Central and South America, Oceania, Africa and the Middle East. |
71
Results of Operations — Fiscal 2023 Compared with Fiscal 2022
Yen in millions |
||||||||||||||||
Year ended March 31, |
2023 v. 2022 Change |
|||||||||||||||
2022 |
2023 |
Amount |
Percentage |
|||||||||||||
Sales revenues: |
||||||||||||||||
Japan |
15,991,436 | 17,583,196 | 1,591,760 | 10.0 | % | |||||||||||
North America |
11,166,479 | 13,843,901 | 2,677,421 | 24.0 | ||||||||||||
Europe |
3,867,847 | 4,273,735 | 405,888 | 10.5 | ||||||||||||
Asia |
6,530,566 | 8,044,906 | 1,514,340 | 23.2 | ||||||||||||
Other* |
2,928,183 | 3,472,193 | 544,011 | 18.6 | ||||||||||||
Intersegment elimination/unallocated amount |
(9,105,004 | ) | (10,063,633 | ) | (958,629 | ) | — | |||||||||
Total |
31,379,507 | 37,154,298 | 5,774,791 | 18.4 | ||||||||||||
Operating income (loss): |
||||||||||||||||
Japan |
1,423,445 | 1,901,463 | 478,018 | 33.6 | ||||||||||||
North America |
565,784 | (74,736 | ) | (640,520 | ) | — | ||||||||||
Europe |
162,973 | 57,460 | (105,513 | ) | (64.7 | ) | ||||||||||
Asia |
672,350 | 714,451 | 42,101 | 6.3 | ||||||||||||
Other* |
238,169 | 231,362 | (6,807 | ) | (2.9 | ) | ||||||||||
Intersegment elimination/unallocated amount |
(67,024 | ) | (104,974 | ) | (37,950 | ) | — | |||||||||
Total |
2,995,697 | 2,725,025 | (270,672 | ) | (9.0 | ) | ||||||||||
Operating margin |
9.5 | % | 7.3 | % | (2.2 | )% | ||||||||||
Income before income taxes |
3,990,532 | 3,668,733 | (321,799 | ) | (8.1 | ) | ||||||||||
Net margin from income before income taxes |
12.7 | % | 9.9 | % | (2.8 | )% | ||||||||||
Net income attributable to Toyota Motor Corporation |
2,850,110 | 2,451,318 | (398,792 | ) | (14.0 | ) | ||||||||||
Net margin attributable to Toyota Motor Corporation |
9.1 | % | 6.6 | % | (2.5 | )% | ||||||||||
| * | “Other” consists of Central and South America, Oceania, Africa and the Middle East. |
Sales Revenues
Toyota had sales revenues for fiscal 2023 of ¥37,154.2 billion, an increase of ¥5,774.7 billion, or 18.4%, compared with the prior fiscal year. The increase resulted mainly from the ¥1,150.0 billion impact of increased vehicle unit sales and changes in sales mix and the ¥3,580.0 billion favorable impact of changes in exchange rates.
The table below shows Toyota’s sales revenues from external customers by product category and by business.
Yen in millions |
||||||||||||||||
Year ended March 31, |
2023 v. 2022 Change |
|||||||||||||||
2022 |
2023 |
Amount |
Percentage |
|||||||||||||
Vehicles |
23,739,442 | 28,394,256 | 4,654,814 | 19.6 | % | |||||||||||
Parts and components for production |
1,504,215 | 1,710,422 | 206,208 | 13.7 | ||||||||||||
Parts and components for after service |
2,407,143 | 2,866,196 | 459,053 | 19.1 | ||||||||||||
Other |
881,193 | 805,995 | (75,198 | ) | (8.5 | ) | ||||||||||
Total Automotive |
28,531,993 | 33,776,870 | 5,244,877 | 18.4 | ||||||||||||
All Other |
541,436 | 590,749 | 49,314 | 9.1 | ||||||||||||
Total sales of products |
29,073,428 | 34,367,619 | 5,294,191 | 18.2 | ||||||||||||
Financial services |
2,306,079 | 2,786,679 | 480,600 | 20.8 | ||||||||||||
Total sales revenues |
31,379,507 | 37,154,298 | 5,774,791 | 18.4 | % | |||||||||||
72
Toyota’s sales revenues include sales revenues from sales of products, consisting of sales revenues from automotive operations and all other operations, which increased by 18.2% during fiscal 2023 compared with the prior fiscal year to ¥34,367.6 billion, and sales revenues from financial services operations, which increased by 20.8% during fiscal 2023 compared with the prior fiscal year to ¥2,786.6 billion. The increase in sales revenues from sales of products is mainly due to an increase in Toyota vehicle unit sales of 591 thousand vehicles and the favorable impact of changes in exchange rates compared with the prior fiscal year.
The following table shows the number of financing contracts by geographic region at the end of fiscal 2023 and 2022, respectively.
Number of financing contracts in thousands |
||||||||||||||||
As of March 31, |
2023 v. 2022 Change |
|||||||||||||||
2022 |
2023 |
Amount |
Percentage |
|||||||||||||
Japan |
2,745 | 2,767 | 22 | 0.8 | % | |||||||||||
North America |
5,549 | 5,500 | (49 | ) | (0.9 | ) | ||||||||||
Europe |
1,507 | 1,647 | 140 | 9.3 | ||||||||||||
Asia |
2,070 | 2,034 | (36 | ) | (1.7 | ) | ||||||||||
Other* |
895 | 938 | 43 | 4.8 | ||||||||||||
Total |
12,766 | 12,886 | 120 | 0.9 | % | |||||||||||
| * | “Other” consists of Central and South America, Oceania and Africa. |
Geographically, sales revenues (before the elimination of intersegment revenues) for fiscal 2023 increased by 10.0% in Japan, 24.0% in North America, 10.5% in Europe, 23.2% in Asia, and 18.6% in Other compared with the prior fiscal year. Excluding the impact of changes in exchange rates of ¥3,580.0 billion, sales revenues in fiscal 2023 would have increased by 10.0% in Japan, 3.2% in North America, 2.8% in Europe, 7.9% in Asia, and 12.7% in Other compared with the prior fiscal year.
The following is a discussion of sales revenues in each geographic market (before the elimination of intersegment revenues).
Japan
Thousands of units |
||||||||||||||||
Year ended March 31, |
2023 v. 2022 Change |
|||||||||||||||
2022 |
2023 |
Amount |
Percentage |
|||||||||||||
Toyota’s consolidated vehicle unit sales* |
3,640 | 3,703 | 62 | 1.7 | % | |||||||||||
* including number of exported vehicle unit sales |
||||||||||||||||
Yen in millions |
||||||||||||||||
Year ended March 31, |
2023 v. 2022 Change |
|||||||||||||||
2022 |
2023 |
Amount |
Percentage |
|||||||||||||
Sales revenues: |
||||||||||||||||
Sales of products |
15,706,514 | 17,271,451 | 1,564,938 | 10.0 | % | |||||||||||
Financial services |
284,922 | 311,744 | 26,822 | 9.4 | ||||||||||||
Total |
15,991,436 | 17,583,196 | 1,591,760 | 10.0 | % | |||||||||||
Sales revenues in Japan increased due primarily to the 62 thousand vehicles increase in domestic and exported vehicle unit sales and the favorable impact of changes in exchange rates related to export transactions compared with the prior fiscal year. For fiscal 2022 and 2023, exported vehicle unit sales were 1,716 thousand units and 1,634 thousand units, respectively.
73
North America
Thousands of units |
||||||||||||||||
Year ended March 31, |
2023 v. 2022 Change |
|||||||||||||||
2022 |
2023 |
Amount |
Percentage |
|||||||||||||
Toyota’s consolidated vehicle unit sales |
2,394 | 2,407 | 13 | 0.5 | % | |||||||||||
Yen in millions |
||||||||||||||||
Year ended March 31, |
2023 v. 2022 Change |
|||||||||||||||
2022 |
2023 |
Amount |
Percentage |
|||||||||||||
Sales revenues: |
||||||||||||||||
Sales of products |
9,578,534 | 11,965,050 | 2,386,516 | 24.9 | % | |||||||||||
Financial services |
1,587,945 | 1,878,850 | 290,905 | 18.3 | ||||||||||||
Total |
11,166,479 | 13,843,901 | 2,677,421 | 24.0 | % | |||||||||||
Sales revenues in North America increased due primarily to the 13 thousand vehicles increase in vehicle unit sales and the favorable impact of changes in exchange rates compared with the prior fiscal year.
Europe
Thousands of units |
||||||||||||||||
Year ended March 31, |
2023 v. 2022 Change |
|||||||||||||||
2022 |
2023 |
Amount |
Percentage |
|||||||||||||
Toyota’s consolidated vehicle unit sales |
1,017 | 1,030 | 13 | 1.3 | % | |||||||||||
Yen in millions |
||||||||||||||||
Year ended March 31, |
2023 v. 2022 Change |
|||||||||||||||
2022 |
2023 |
Amount |
Percentage |
|||||||||||||
Sales revenues: |
||||||||||||||||
Sales of products |
3,671,205 | 4,003,043 | 331,838 | 9.0 | % | |||||||||||
Financial services |
196,642 | 270,693 | 74,050 | 37.7 | ||||||||||||
Total |
3,867,847 | 4,273,735 | 405,888 | 10.5 | % | |||||||||||
Sales revenues in Europe increased due primarily to the 13 thousand vehicles increase in vehicle unit sales and the favorable impact of changes in exchange rates compared with the prior fiscal year.
Asia
Thousands of units |
||||||||||||||||
Year ended March 31, |
2023 v. 2022 Change |
|||||||||||||||
2022 |
2023 |
Amount |
Percentage |
|||||||||||||
Toyota’s consolidated vehicle unit sales |
1,543 | 1,751 | 208 | 13.5 | % | |||||||||||
Yen in millions |
||||||||||||||||
Year ended March 31, |
2023 v. 2022 Change |
|||||||||||||||
2022 |
2023 |
Amount |
Percentage |
|||||||||||||
Sales revenues: |
||||||||||||||||
Sales of products |
6,345,172 | 7,832,020 | 1,486,848 | 23.4 | % | |||||||||||
Financial services |
185,394 | 212,886 | 27,492 | 14.8 | ||||||||||||
Total |
6,530,566 | 8,044,906 | 1,514,340 | 23.2 | % | |||||||||||
74
Sales revenues in Asia increased due primarily to the 208 thousand vehicles increase in vehicle unit sales and the favorable impact of changes in exchange rates compared with the prior fiscal year.
Other
Thousands of units |
||||||||||||||||
Year ended March 31, |
2023 v. 2022 Change |
|||||||||||||||
2022 |
2023 |
Amount |
Percentage |
|||||||||||||
Toyota’s consolidated vehicle unit sales |
1,352 | 1,565 | 213 | 15.8 | % | |||||||||||
Yen in millions |
||||||||||||||||
Year ended March 31, |
2023 v. 2022 Change |
|||||||||||||||
2022 |
2023 |
Amount |
Percentage |
|||||||||||||
Sales revenues: |
||||||||||||||||
Sales of products |
2,756,840 | 3,225,962 | 469,122 | 17.0 | % | |||||||||||
Financial services |
171,343 | 246,232 | 74,889 | 43.7 | ||||||||||||
Total |
2,928,183 | 3,472,193 | 544,011 | 18.6 | % | |||||||||||
Sales revenues in Other increased due primarily to the 213 thousand vehicles increase in vehicle unit sales compared with the prior fiscal year.
Operating Costs and Expenses
Yen in millions |
||||||||||||||||
Year ended March 31, |
2023 v. 2022 Change |
|||||||||||||||
2022 |
2023 |
Amount |
Percentage |
|||||||||||||
Operating costs and expenses |
||||||||||||||||
Cost of products sold |
24,250,784 | 29,128,561 | 4,877,778 | 20.1 | % | |||||||||||
Cost of financing services |
1,157,050 | 1,712,721 | 555,671 | 48.0 | ||||||||||||
Selling, general and administrative |
2,975,977 | 3,587,990 | 612,014 | 20.6 | ||||||||||||
Total |
28,383,811 | 34,429,273 | 6,045,462 | 21.3 | % | |||||||||||
Yen in millions |
||||
2023 v. 2022 Change |
||||
Changes in operating costs and expenses: |
||||
Effect of changes in vehicle unit sales and sales mix |
1,110,000 | |||
Effect of changes in exchange rates |
2,300,000 | |||
Effect of increase of cost of financial services |
320,000 | |||
Effect of cost reduction efforts |
1,290,000 | |||
Increase or decrease in expenses and expense reduction efforts |
525,000 | |||
Other |
500,462 | |||
Total |
6,045,462 | |||
Operating costs and expenses increased by ¥6,045.4 billion, or 21.3%, to ¥34,429.2 billion during fiscal 2023 compared with the prior fiscal year.
Cost Reduction Efforts
Cost reduction efforts, together with related costs and expenses, led to an aggregate increase in operating costs and expenses of ¥1,290.0 billion during fiscal 2023. This increase was due to a ¥1,545.0 billion increase in
75
operating costs and expenses attributable to the impact of soaring materials prices. Through continued cost reduction efforts together with suppliers, however, that increase was partially offset by a ¥205.0 billion reduction principally attributable to value engineering activities and other cost reduction efforts concerning design-related costs, and a ¥50.0 billion reduction attributable to cost reduction efforts principally at plants and logistics departments.
The cost reduction efforts described above related to ongoing value engineering and value analysis activities, the use of common parts resulting in a reduction of part types and other manufacturing initiatives designed to reduce the costs of vehicle production. The impact of soaring materials prices includes the impact of fluctuation in the price of steel, precious metals,
non-ferrous
alloys including aluminum, plastic parts and other production materials and parts. Cost of Products Sold
Cost of products sold increased by ¥4,877.7 billion, or 20.1%, to ¥29,128.5 billion during fiscal 2023 compared with the prior fiscal year. This increase mainly reflected the unfavorable impact of fluctuations in foreign currency translation rates, the unfavorable impact of soaring materials prices, and the impact of changes in vehicle unit sales and sales mix.
Cost of Financial Services
Cost of financial services increased by ¥555.6 billion, or 48.0%, to ¥1,712.7 billion during fiscal 2023 compared with the prior fiscal year. This increase was due mainly to the worsening overall of valuation gains or losses from interest rate swaps and interest rate currency swaps and the increase in funding costs resulting from higher interest rates.
Selling, General and Administrative Expenses
Selling, general and administrative expenses increased by ¥612.0 billion, or 20.6%, to ¥3,587.9 billion during fiscal 2023 compared with the prior fiscal year. This increase mainly reflected the unfavorable impact of fluctuations in foreign currency translation rates, the increase in labor costs, and the increase in research and development expenses.
Operating Income
Yen in millions |
||||
2023 v. 2022 Change |
||||
Changes in operating income and loss: |
||||
Effect of marketing efforts |
680,000 | |||
Effect of cost reduction efforts |
(1,290,000 | ) | ||
Effect of changes in exchange rates |
1,280,000 | |||
Increase or decrease in expenses and expense reduction efforts |
(525,000 | ) | ||
Other |
(415,672 | ) | ||
Total |
(270,672 | ) | ||
Toyota’s operating income decreased by ¥270.6 billion, or 9.0%, to ¥2,725.0 billion during fiscal 2023 compared with the prior fiscal year. This decrease was due to the ¥1,290.0 billion aggregate unfavorable impact of factors categorized as cost reduction efforts (including fluctuations in raw materials prices), the ¥525.0 billion aggregate unfavorable impact of changes in expenses and expense reduction efforts and other factors, partially offset by the ¥1,280.0 billion favorable impact of changes in exchange rates and the ¥680.0 billion impact of marketing efforts.
76
Marketing efforts includes changes in vehicle unit sales and sales mix, sales expenses and other. “Other” includes valuation gains or losses from interest rate swaps and interest rate currency swaps.
The favorable impact of changes in exchange rates was due mainly to the ¥1,200.0 billion impact of overseas transactions such as imports and exports denominated in foreign currencies.
During fiscal 2023, operating income (before elimination of intersegment profits) compared with the prior fiscal year decreased by ¥640.5 billion in North America, ¥105.5 billion, or 64.7%, in Europe, and ¥6.8 billion, or 2.9%, in Other, and increased by ¥478.0 billion, or 33.6%, in Japan, and ¥42.1 billion, or 6.3%, in Asia.
The following is a description of operating income in each geographic market.
Japan
Yen in millions |
||||
2023 v. 2022 Change |
||||
Changes in operating income and loss: |
||||
Effect of marketing efforts |
365,000 | |||
Effect of cost reduction efforts |
(690,000 | ) | ||
Effect of changes in exchange rates |
1,210,000 | |||
Increase or decrease in expenses and expense reduction efforts |
(320,000 | ) | ||
Other |
(86,982 | ) | ||
Total |
478,018 | |||
North America
Yen in millions |
||||
2023 v. 2022 Change |
||||
Changes in operating income and loss: |
||||
Effect of marketing efforts |
90,000 | |||
Effect of cost reduction efforts |
(395,000 | ) | ||
Effect of changes in exchange rates |
(15,000 | ) | ||
Increase or decrease in expenses and expense reduction efforts |
(135,000 | ) | ||
Other |
(185,520 | ) | ||
Total |
(640,520 | ) | ||
Europe
Yen in millions |
||||
2023 v. 2022 Change |
||||
Changes in operating income and loss: |
||||
Effect of marketing efforts |
130,000 | |||
Effect of cost reduction efforts |
(120,000 | ) | ||
Effect of changes in exchange rates |
(15,000 | ) | ||
Increase or decrease in expenses and expense reduction efforts |
(25,000 | ) | ||
Other |
(75,513 | ) | ||
Total |
(105,513 | ) | ||
77
Asia
Yen in millions |
||||
2023 v. 2022 Change |
||||
Changes in operating income and loss: |
||||
Effect of marketing efforts |
75,000 | |||
Effect of cost reduction efforts |
(25,000 | ) | ||
Effect of changes in exchange rates |
90,000 | |||
Increase or decrease in expenses and expense reduction efforts |
(45,000 | ) | ||
Other |
(52,899 | ) | ||
Total |
42,101 | |||
Other
Yen in millions |
||||
2023 v. 2022 Change |
||||
Changes in operating income and loss: |
||||
Effect of marketing efforts |
60,000 | |||
Effect of cost reduction efforts |
(60,000 | ) | ||
Effect of changes in exchange rates |
10,000 | |||
Increase or decrease in expenses and expense reduction efforts |
0 | |||
Other |
(16,807 | ) | ||
Total |
(6,807 | ) | ||
Other Income and Expenses
Share of profit (loss) of investments accounted for using the equity method during fiscal 2023 increased by ¥82.7 billion, or 14.8%, to ¥643.0 billion compared with the prior fiscal year. This increase was due mainly to an increase during fiscal 2023 in net income attributable to the shareholders of companies accounted for by the equity method.
Other finance income increased by ¥44.5 billion, or 13.3%, to ¥379.3 billion during fiscal 2023 compared with the prior fiscal year. This increase was due mainly to an increase during fiscal 2023 in interest income.
Other finance costs increased by ¥81.1 billion, or 184.4%, to ¥125.1 billion during fiscal 2023 compared with the prior fiscal year. This increase was due mainly to an increase during fiscal 2023 in losses on securities revaluation.
Foreign exchange gain (loss), net decreased by ¥91.6 billion to ¥124.5 billion during fiscal 2023 compared with the prior fiscal year. Foreign exchange gains and losses include the differences between the value of foreign currency denominated assets and liabilities recognized through transactions in foreign currencies translated at prevailing exchange rates and the value at the date the transaction settled during the fiscal year, including those settled using forward foreign currency exchange contracts, or the value translated by appropriate
year-end
exchange rates. The ¥91.6 billion decrease in foreign exchange gain (loss), net was due mainly to the losses recorded in fiscal 2023 resulting from the functional currency of overseas subsidiaries being weaker against foreign currencies at the dates of settlement of the foreign currency trade accounts payable than at the dates of the transactions. Other income (loss), net decreased by ¥5.6 billion, to ¥78.1 billion in losses during fiscal 2023 compared with the prior fiscal year.
78
Income Taxes
The provision for income taxes increased by ¥59.8 billion, or 5.4%, to ¥1,175.7 billion during fiscal 2023 compared with the prior fiscal year. This increase was due mainly to the reversals of deferred tax assets on account of the reassessment of their recoverability. The average effective tax rate for fiscal 2023 was 32.0%.
Net Income Attributable to
Non-controlling
Interests Net income attributable to
non-controlling
interests increased by ¥17.1 billion, or 70.0%, to ¥41.6 billion during fiscal 2023 compared with the prior fiscal year. This increase was due mainly to an increase during fiscal 2023 in net income of consolidated subsidiaries. Net Income Attributable to Toyota Motor Corporation
Net income attributable to Toyota Motor Corporation decreased by ¥398.7 billion, or 14.0%, to ¥2,451.3 billion during fiscal 2023 compared with the prior fiscal year.
Other Comprehensive Income, Net of Tax
Other comprehensive income, net of tax decreased by ¥315.4 billion to ¥827.7 billion for fiscal 2023 compared with the prior fiscal year. This decrease resulted from exchange differences on translating foreign operations gains of ¥676.0 billion in fiscal 2023 compared with gains of ¥902.8 billion in the prior fiscal year and share of other comprehensive income of equity method investees gains of ¥103.0 billion in fiscal 2023 compared with gains of ¥307.4 billion in the prior fiscal year, due mainly to the weakening of the yen against the U.S. dollar and the euro, net changes in revaluation of financial assets measured at fair value through other comprehensive income losses of ¥16.5 billion in fiscal 2023 compared with losses of ¥203.4 billion in the prior fiscal year, due mainly to changes in prices of public and corporate bonds, and remeasurements of defined benefit plans gains of ¥65.1 billion in fiscal 2023 compared with gains of ¥136.2 billion in the prior fiscal year, due mainly to changes in fair value of plan assets.
Segment Information
The following is a discussion of the results of operations for each of Toyota’s operating segments. The amounts presented are prior to intersegment elimination.
Yen in millions |
||||||||||||||||
Year ended March 31, |
2023 v. 2022 Change |
|||||||||||||||
2022 |
2023 |
Amount |
Percentage |
|||||||||||||
Automotive: |
||||||||||||||||
Sales revenues |
28,605,738 | 33,820,000 | 5,214,263 | 18.2 | % | |||||||||||
Operating income |
2,284,290 | 2,180,637 | (103,653 | ) | (4.5 | ) | ||||||||||
Financial Services: |
||||||||||||||||
Sales revenues |
2,324,026 | 2,809,647 | 485,621 | 20.9 | ||||||||||||
Operating income |
657,001 | 437,516 | (219,485 | ) | (33.4 | ) | ||||||||||
All Other: |
||||||||||||||||
Sales revenues |
1,129,876 | 1,224,943 | 95,067 | 8.4 | ||||||||||||
Operating income |
42,302 | 103,451 | 61,150 | 144.6 | ||||||||||||
Intersegment elimination/unallocated amount: |
||||||||||||||||
Sales revenues |
(680,133 | ) | (700,293 | ) | (20,160 | ) | — | |||||||||
Operating income |
12,104 | 3,420 | (8,684 | ) | — | |||||||||||
Total |
||||||||||||||||
Sales revenues |
31,379,507 | 37,154,298 | 5,774,791 | 18.4 | ||||||||||||
Operating income |
2,995,697 | 2,725,025 | (270,672 | ) | (9.0 | ) | ||||||||||
79
Automotive Operations Segment
The automotive operations segment is Toyota’s largest operating segment by sales revenues. Sales revenues for the automotive segment increased during fiscal 2023 by ¥5,214.2 billion, or 18.2%, to ¥33,820.0 billion compared with the prior fiscal year. The increase mainly reflects the ¥3,170.0 billion favorable impact of changes in exchange rates and the ¥1,150.0 billion favorable impact of changes in vehicle unit sales and sales mix.
Operating income from the automotive operations decreased by ¥103.6 billion, or 4.5%, to ¥2,180.6 billion during fiscal 2023 compared with the prior fiscal year. This decrease in operating income was due mainly to the ¥1,290.0 billion aggregate unfavorable impact of factors categorized as cost reduction efforts (including fluctuations in raw materials prices) and the ¥525.0 billion aggregate unfavorable impact of changes in expenses and expense reduction efforts, partially offset by the ¥1,220.0 billion favorable impact of changes in exchange rates and the ¥755.0 billion impact of marketing efforts.
Financial Services Operations Segment
Sales revenues for the financial services operations increased during fiscal 2023 by ¥485.6 billion, or 20.9%, to ¥2,809.6 billion compared with the prior fiscal year. This increase was due mainly to the favorable impact of changes in exchange rates.
Operating income from financial services operations decreased by ¥219.4 billion, or 33.4%, to ¥437.5 billion during fiscal 2023 compared with the prior fiscal year. This decrease was due mainly to the worsening overall of valuation gains or losses from interest rate swaps and interest rate currency swaps.
All Other Operations Segment
Sales revenues for Toyota’s other operations segments increased by ¥95.0 billion, or 8.4%, to ¥1,224.9 billion during fiscal 2023 compared with the prior fiscal year.
80
Operating income from Toyota’s other operations segments increased by ¥61.1 billion, or 144.6%, to ¥103.4 billion during fiscal 2023 compared with the prior fiscal year.
Results of Operations — Fiscal 2022 Compared with Fiscal 2021
Yen in millions |
||||||||||||||||
Year ended March 31, |
2022 v. 2021 Change |
|||||||||||||||
2021 |
2022 |
Amount |
Percentage |
|||||||||||||
Sales revenues: |
||||||||||||||||
Japan |
14,948,931 | 15,991,436 | 1,042,505 | 7.0 | % | |||||||||||
North America |
9,491,803 | 11,166,479 | 1,674,676 | 17.6 | ||||||||||||
Europe |
3,134,489 | 3,867,847 | 733,359 | 23.4 | ||||||||||||
Asia |
5,045,295 | 6,530,566 | 1,485,272 | 29.4 | ||||||||||||
Other* |
1,872,895 | 2,928,183 | 1,055,287 | 56.3 | ||||||||||||
Intersegment elimination/unallocated amount |
(7,278,820 | ) | (9,105,004 | ) | (1,826,185 | ) | — | |||||||||
Total |
27,214,594 | 31,379,507 | 4,164,914 | 15.3 | ||||||||||||
Operating income (loss): |
||||||||||||||||
Japan |
1,149,217 | 1,423,445 | 274,228 | 23.9 | ||||||||||||
North America |
401,361 | 565,784 | 164,423 | 41.0 | ||||||||||||
Europe |
107,971 | 162,973 | 55,002 | 50.9 | ||||||||||||
Asia |
435,940 | 672,350 | 236,410 | 54.2 | ||||||||||||
Other* |
59,847 | 238,169 | 178,322 | 298.0 | ||||||||||||
Intersegment elimination/unallocated amount |
43,413 | (67,024 | ) | (110,436 | ) | — | ||||||||||
Total |
2,197,748 | 2,995,697 | 797,948 | 36.3 | ||||||||||||
Operating margin |
8.1 | % | 9.5 | % | 1.4 | % | ||||||||||
Income before income taxes |
2,932,354 | 3,990,532 | 1,058,177 | 36.1 | ||||||||||||
Net margin from income before income taxes |
10.8 | % | 12.7 | % | 1.9 | % | ||||||||||
Net income attributable to Toyota Motor Corporation |
2,245,261 | 2,850,110 | 604,849 | 26.9 | ||||||||||||
Net margin attributable to Toyota Motor Corporation |
8.3 | % | 9.1 | % | 0.8 | % | ||||||||||
| * | “Other” consists of Central and South America, Oceania, Africa and the Middle East. |
Sales Revenues
Toyota had sales revenues for fiscal 2022 of ¥31,379.5 billion, an increase of ¥4,164.9 billion, or 15.3%, compared with the prior fiscal year. The increase resulted mainly from the ¥1,510.0 billion impact of increased vehicle unit sales and changes in sales mix and the ¥1,390.0 billion favorable impact of changes in exchange rates.
81
The table below shows Toyota’s sales revenues from external customers by product category and by business.
Yen in millions |
||||||||||||||||
Year ended March 31, |
2022 v. 2021 Change |
|||||||||||||||
2021 |
2022 |
Amount |
Percentage |
|||||||||||||
Vehicles |
20,509,606 | 23,739,442 | 3,229,836 | 15.7 | % | |||||||||||
Parts and components for production |
1,287,053 | 1,504,215 | 217,162 | 16.9 | ||||||||||||
Parts and components for after service |
2,049,187 | 2,407,143 | 357,956 | 17.5 | ||||||||||||
Other |
752,000 | 881,193 | 129,193 | 17.2 | ||||||||||||
Total Automotive |
24,597,846 | 28,531,993 | 3,934,147 | 16.0 | ||||||||||||
All Other |
479,553 | 541,436 | 61,883 | 12.9 | ||||||||||||
Total sales of products |
25,077,398 | 29,073,428 | 3,996,030 | 15.9 | ||||||||||||
Financial services |
2,137,195 | 2,306,079 | 168,884 | 7.9 | ||||||||||||
Total sales revenues |
27,214,594 | 31,379,507 | 4,164,914 | 15.3 | % | |||||||||||
Toyota’s sales revenues include sales revenues from sales of products, consisting of sales revenues from automotive operations and all other operations, which increased by 15.9% during fiscal 2022 compared with the prior fiscal year to ¥29,073.4 billion, and sales revenues from financial services operations, which increased by 7.9% during fiscal 2022 compared with the prior fiscal year to ¥2,306.0 billion. The increase in sales revenues from sales of products is mainly due to an increase in Toyota vehicle unit sales of 584 thousand vehicles and the favorable impact of changes in exchange rates compared with the prior fiscal year.
The following table shows the number of financing contracts by geographic region at the end of fiscal 2022 and 2021, respectively.
Number of financing contracts in thousands |
||||||||||||||||
As of March 31, |
2022 v. 2021 Change |
|||||||||||||||
2021 |
2022 |
Amount |
Percentage |
|||||||||||||
Japan |
2,660 | 2,745 | 85 | 3.2 | % | |||||||||||
North America |
5,553 | 5,549 | (4 | ) | (0.1 | ) | ||||||||||
Europe |
1,412 | 1,507 | 95 | 6.7 | ||||||||||||
Asia |
1,992 | 2,070 | 78 | 3.9 | ||||||||||||
Other* |
881 | 895 | 14 | 1.6 | ||||||||||||
Total |
12,498 | 12,766 | 268 | 2.1 | % | |||||||||||
| * | “Other” consists of Central and South America, Oceania and Africa. |
Geographically, sales revenues (before the elimination of intersegment revenues) for fiscal 2022 increased by 7.0% in Japan, 17.6% in North America, 23.4% in Europe, 29.4% in Asia, and 56.3% in Other compared with the prior fiscal year. Excluding the impact of changes in exchange rates of ¥1,390.0 billion, sales revenues in fiscal 2022 would have increased by 7.0% in Japan, 10.5% in North America, 16.6% in Europe, 20.3% in Asia, and 49.2% in Other compared with the prior fiscal year.
82
The following is a discussion of sales revenues in each geographic market (before the elimination of intersegment revenues).
Japan
Thousands of units |
||||||||||||||||
Year ended March 31, |
2022 v. 2021 Change |
|||||||||||||||
2021 |
2022 |
Amount |
Percentage |
|||||||||||||
Toyota’s consolidated vehicle unit sales* |
3,853 | 3,640 | (213 | ) | (5.5 | )% | ||||||||||
* including number of exported vehicle unit sales |
||||||||||||||||
Yen in millions |
||||||||||||||||
Year ended March 31, |
2022 v. 2021 Change |
|||||||||||||||
2021 |
2022 |
Amount |
Percentage |
|||||||||||||
Sales revenues: |
||||||||||||||||
Sales of products |
14,674,496 | 15,706,514 | 1,032,018 | 7.0 | % | |||||||||||
Financial services |
274,435 | 284,922 | 10,487 | 3.8 | ||||||||||||
Total |
14,948,931 | 15,991,436 | 1,042,505 | 7.0 | % | |||||||||||
Despite Toyota’s domestic and exported vehicle unit sales having decreased by 213 thousand vehicles compared with the prior fiscal year, sales revenues in Japan increased due primarily to the favorable impact of changes in exchange rates related to export transactions. For fiscal 2021 and 2022, exported vehicle unit sales were 1,728 thousand units and 1,716 thousand units, respectively.
North America
Thousands of units |
||||||||||||||||
Year ended March 31, |
2022 v. 2021 Change |
|||||||||||||||
2021 |
2022 |
Amount |
Percentage |
|||||||||||||
Toyota’s consolidated vehicle unit sales |
2,313 | 2,394 | 81 | 3.5 | % | |||||||||||
Yen in millions |
||||||||||||||||
Year ended March 31, |
2022 v. 2021 Change |
|||||||||||||||
2021 |
2022 |
Amount |
Percentage |
|||||||||||||
Sales revenues: |
||||||||||||||||
Sales of products |
7,995,051 | 9,578,534 | 1,583,483 | 19.8 | % | |||||||||||
Financial services |
1,496,752 | 1,587,945 | 91,193 | 6.1 | ||||||||||||
Total |
9,491,803 | 11,166,479 | 1,674,676 | 17.6 | % | |||||||||||
Sales revenues in North America increased due primarily to the 81 thousand vehicles increase in vehicle unit sales and the favorable impact of changes in exchange rates compared with the prior fiscal year.
83
Europe
Thousands of units |
||||||||||||||||
Year ended March 31, |
2022 v. 2021 Change |
|||||||||||||||
2021 |
2022 |
Amount |
Percentage |
|||||||||||||
Toyota’s consolidated vehicle unit sales |
959 | 1,017 | 58 | 6.0 | % | |||||||||||
Yen in millions |
||||||||||||||||
Year ended March 31, |
2022 v. 2021 Change |
|||||||||||||||
2021 |
2022 |
Amount |
Percentage |
|||||||||||||
Sales revenues: |
||||||||||||||||
Sales of products |
2,976,259 | 3,671,205 | 694,946 | 23.3 | % | |||||||||||
Financial services |
158,229 | 196,642 | 38,413 | 24.3 | ||||||||||||
Total |
3,134,489 | 3,867,847 | 733,359 | 23.4 | % | |||||||||||
Sales revenues in Europe increased due primarily to the 58 thousand vehicles increase in vehicle unit sales and the favorable impact of changes in exchange rates compared with the prior fiscal year.
Asia
Thousands of units |
||||||||||||||||
Year ended March 31, |
2022 v. 2021 Change |
|||||||||||||||
2021 |
2022 |
Amount |
Percentage |
|||||||||||||
Toyota’s consolidated vehicle unit sales |
1,222 | 1,543 | 321 | 26.3 | % | |||||||||||
Yen in millions |
||||||||||||||||
Year ended March 31, |
2022 v. 2021 Change |
|||||||||||||||
2021 |
2022 |
Amount |
Percentage |
|||||||||||||
Sales revenues: |
||||||||||||||||
Sales of products |
4,874,746 | 6,345,172 | 1,470,426 | 30.2 | % | |||||||||||
Financial services |
170,549 | 185,394 | 14,845 | 8.7 | ||||||||||||
Total |
5,045,295 | 6,530,566 | 1,485,272 | 29.4 | % | |||||||||||
Sales revenues in Asia increased due primarily to the 321 thousand vehicles increase in vehicle unit sales and the favorable impact of changes in exchange rates compared with the prior fiscal year.
Other
Thousands of units |
||||||||||||||||
Year ended March 31, |
2022 v. 2021 Change |
|||||||||||||||
2021 |
2022 |
Amount |
Percentage |
|||||||||||||
Toyota’s consolidated vehicle unit sales |
1,027 | 1,352 | 326 | 31.7 | % | |||||||||||
Yen in millions |
||||||||||||||||
Year ended March 31, |
2022 v. 2021Change |
|||||||||||||||
2021 |
2022 |
Amount |
Percentage |
|||||||||||||
Sales revenues: |
||||||||||||||||
Sales of products |
1,719,132 | 2,756,840 | 1,037,708 | 60.4 | % | |||||||||||
Financial services |
153,764 | 171,343 | 17,579 | 11.4 | ||||||||||||
Total |
1,872,895 | 2,928,183 | 1,055,287 | 56.3 | % | |||||||||||
84
Sales revenues in Other increased due primarily to the 326 thousand vehicles increase in vehicle unit sales compared with the prior fiscal year.
Operating Costs and Expenses
Yen in millions |
||||||||||||||||
Year ended March 31, |
2022 v. 2021 Change |
|||||||||||||||
2021 |
2022 |
Amount |
Percentage |
|||||||||||||
Operating costs and expenses |
||||||||||||||||
Cost of products sold |
21,199,890 | 24,250,784 | 3,050,894 | 14.4 | % | |||||||||||
Cost of financing services |
1,182,330 | 1,157,050 | (25,280 | ) | (2.1 | ) | ||||||||||
Selling, general and administrative |
2,634,625 | 2,975,977 | 341,351 | 13.0 | ||||||||||||
Total |
25,016,845 | 28,383,811 | 3,366,965 | 13.5 | % | |||||||||||
Yen in millions |
||||
2022 v. 2021 Change |
||||
Changes in operating costs and expenses: |
||||
Effect of changes in vehicle unit sales and sales mix |
1,330,000 | |||
Effect of changes in exchange rates |
780,000 | |||
Effect of decrease of cost of financial services |
(100,000 | ) | ||
Effect of cost reduction efforts |
360,000 | |||
Increase or decrease in expenses and expense reduction efforts |
220,000 | |||
Other |
776,965 | |||
Total |
3,366,965 | |||
Operating costs and expenses increased by ¥3,366.9 billion, or 13.5%, to ¥28,383.8 billion during fiscal 2022 compared with the prior fiscal year.
Cost Reduction Efforts
Operating costs and expenses increased by ¥360.0 billion during fiscal 2022. This increase was due to a ¥640.0 billion increase in operating costs and expenses attributable to the impact of soaring materials prices. Through continued cost reduction efforts together with suppliers, however, that increase was partially offset by a ¥240.0 billion reduction principally attributable to value engineering activities and other cost reduction efforts concerning design-related costs, and a ¥40.0 billion reduction attributable to cost reduction efforts principally at plants and logistics departments.
The cost reduction efforts described above related to ongoing value engineering and value analysis activities, the use of common parts resulting in a reduction of part types and other manufacturing initiatives designed to reduce the costs of vehicle production. The impact of soaring materials prices includes the impact of fluctuation in the price of steel, precious metals,
non-ferrous
alloys including aluminum, plastic parts and other production materials and parts. Cost of Products Sold
Cost of products sold increased by ¥3,050.8 billion, or 14.4%, to ¥24,250.7 billion during fiscal 2022 compared with the prior fiscal year. This increase mainly reflected the impact of changes in vehicle unit sales and sales mix, the unfavorable impact of soaring materials prices, and the unfavorable impact of fluctuations in foreign currency translation rates.
85
Cost of Financial Services
Cost of financial services decreased by ¥25.2 billion, or 2.1%, to ¥1,157.0 billion during fiscal 2022 compared with the prior fiscal year.
Selling, General and Administrative Expenses
Selling, general and administrative expenses increased by ¥341.3 billion, or 13.0%, to ¥2,975.9 billion during fiscal 2022 compared with the prior fiscal year. This increase mainly reflected the unfavorable impact of fluctuations in foreign currency translation rates.
Operating Income
Yen in millions |
||||
2022 v. 2021 Change |
||||
Changes in operating income and loss: |
||||
Effect of marketing efforts |
860,000 | |||
Effect of cost reduction efforts |
(360,000 | ) | ||
Effect of changes in exchange rates |
610,000 | |||
Increase or decrease in expenses and expense reduction efforts |
(220,000 | ) | ||
Other |
(92,052 | ) | ||
Total |
797,948 | |||
Toyota’s operating income increased by ¥797.9 billion, or 36.3%, to ¥2,995.6 billion during fiscal 2022 compared with the prior fiscal year. This increase was due to the ¥860.0 billion impact of marketing efforts and the ¥610.0 billion favorable impact of changes in exchange rates, partially offset by, among other factors, the ¥360.0 billion aggregate unfavorable impact of factors categorized as cost reduction efforts (including fluctuations in raw materials prices) and the ¥220.0 billion aggregate unfavorable impact of changes in expenses and expense reduction efforts.
Marketing efforts includes changes in vehicle unit sales and sales mix, sales expenses and other. “Other” includes valuation gains or losses from interest rate swaps and interest rate currency swaps.
The favorable impact of changes in exchange rates was due mainly to the ¥590.0 billion impact of overseas transactions such as imports and exports denominated in foreign currencies.
During fiscal 2022, operating income (before elimination of intersegment profits) compared with the prior fiscal year increased by ¥274.2 billion, or 23.9%, in Japan, ¥164.4 billion, or 41.0%, in North America, ¥55.0 billion, or 50.9%, in Europe, ¥236.4 billion, or 54.2%, in Asia, and ¥178.3 billion, or 298.0%, in Other.
86
The following is a description of operating income in each geographic market.
Japan
Yen in millions |
||||
2022 v. 2021 Change |
||||
Changes in operating income and loss: |
||||
Effect of marketing efforts |
260,000 | |||
Effect of cost reduction efforts |
(145,000 | ) | ||
Effect of changes in exchange rates |
370,000 | |||
Increase or decrease in expenses and expense reduction efforts |
(50,000 | ) | ||
Other |
(160,772 | ) | ||
Total |
274,228 | |||
North America
Yen in millions |
||||
2022 v. 2021 Change |
||||
Changes in operating income and loss: |
||||
Effect of marketing efforts |
380,000 | |||
Effect of cost reduction efforts |
(125,000 | ) | ||
Effect of changes in exchange rates |
50,000 | |||
Increase or decrease in expenses and expense reduction efforts |
(135,000 | ) | ||
Other |
(5,577 | ) | ||
Total |
164,423 | |||
Europe
Yen in millions |
||||
2022 v. 2021 Change |
||||
Changes in operating income and loss: |
||||
Effect of marketing efforts |
105,000 | |||
Effect of cost reduction efforts |
(40,000 | ) | ||
Effect of changes in exchange rates |
0 | |||
Increase or decrease in expenses and expense reduction efforts |
(10,000 | ) | ||
Other |
2 | |||
Total |
55,002 | |||
Asia
Yen in millions |
||||
2022 v. 2021 Change |
||||
Changes in operating income and loss: |
||||
Effect of marketing efforts |
130,000 | |||
Effect of cost reduction efforts |
(35,000 | ) | ||
Effect of changes in exchange rates |
170,000 | |||
Increase or decrease in expenses and expense reduction efforts |
(40,000 | ) | ||
Other |
11,410 | |||
Total |
236,410 | |||
87
Other
Yen in millions |
||||
2022 v. 2021 Change |
||||
Changes in operating income and loss: |
||||
Effect of marketing efforts |
95,000 | |||
Effect of cost reduction efforts |
(15,000 | ) | ||
Effect of changes in exchange rates |
20,000 | |||
Increase or decrease in expenses and expense reduction efforts |
15,000 | |||
Other |
63,322 | |||
Total |
178,322 | |||
Other Income and Expenses
Share of profit (loss) of investments accounted for using the equity method during fiscal 2022 increased by ¥209.3 billion, or 59.6%, to ¥560.3 billion compared with the prior fiscal year. This increase was due mainly to an increase during fiscal 2022 in net income attributable to the shareholders of companies accounted for by the equity method.
Other finance income decreased by ¥100.4 billion, or 23.1%, to ¥334.7 billion during fiscal 2022 compared with the prior fiscal year. This decrease was due mainly to a decrease during fiscal 2022 in profit on sales of securities.
Other finance costs decreased by ¥3.5 billion, or 7.4%, to ¥43.9 billion during fiscal 2022 compared with the prior fiscal year.
Foreign exchange gain (loss), net increased by ¥201.0 billion to ¥216.1 billion during fiscal 2022 compared with the prior fiscal year. Foreign exchange gains and losses include the differences between the value of foreign currency denominated assets and liabilities recognized through transactions in foreign currencies translated at prevailing exchange rates and the value at the date the transaction settled during the fiscal year, including those settled using forward foreign currency exchange contracts, or the value translated by appropriate
year-end
exchange rates. The ¥201.0 billion increase in foreign exchange gain (loss), net was due mainly to the gains recorded in fiscal 2022 resulting from the Japanese yen being weaker against foreign currencies at the maturity dates of the foreign currency deposit than at the dates of the deposit. Other income (loss), net decreased by ¥53.2 billion, to ¥72.4 billion in losses during fiscal 2022 compared with the prior fiscal year.
Income Taxes
The provision for income taxes increased by ¥465.9 billion, or 71.7%, to ¥1,115.9 billion during fiscal 2022 compared with the prior fiscal year. This increase was due mainly to the increase in income before income taxes and reversals of deferred tax assets on account of the reassessment of their recoverability. The average effective tax rate for fiscal 2022 was 28.0%.
Net Income Attributable to
Non-controlling
Interests Net income attributable to
non-controlling
interests decreased by ¥12.6 billion, or 34.0%, to ¥24.5 billion during fiscal 2022 compared with the prior fiscal year. This decrease was due mainly to a decrease during fiscal 2022 in net income of consolidated subsidiaries. 88
Net Income Attributable to Toyota Motor Corporation
Net income attributable to Toyota Motor Corporation increased by ¥604.8 billion, or 26.9%, to ¥2,850.1 billion during fiscal 2022 compared with the prior fiscal year.
Other Comprehensive Income, Net of Tax
Other comprehensive income, net of tax increased by ¥130.6 billion to ¥1,143.1 billion for fiscal 2022 compared with the prior fiscal year. This increase resulted from exchange differences on translating foreign operations gains of ¥902.8 billion in fiscal 2022 compared with gains of ¥403.6 billion in the prior fiscal year and share of other comprehensive income of equity method investees gains of ¥307.4 billion in fiscal 2022 compared with gains of ¥88.6 billion in the prior fiscal year, due mainly to the weakening of the yen against the U.S. dollar and the euro, net changes in revaluation of financial assets measured at fair value through other comprehensive income losses of ¥203.4 billion in fiscal 2022 compared with gains of ¥303.9 billion in the prior fiscal year, due mainly to changes in prices of public and corporate bonds, and remeasurements of defined benefit plans gains of ¥136.2 billion in fiscal 2022 compared with gains of ¥216.2 billion in the prior fiscal year, due mainly to changes in fair value of plan assets.
Segment Information
The following is a discussion of the results of operations for each of Toyota’s operating segments. The amounts presented are prior to intersegment elimination.
Yen in millions |
||||||||||||||||
Year ended March 31, |
2022 v. 2021 Change |
|||||||||||||||
2021 |
2022 |
Amount |
Percentage |
|||||||||||||
Automotive: |
||||||||||||||||
Sales revenues |
24,651,552 | 28,605,738 | 3,954,186 | 16.0 | % | |||||||||||
Operating income |
1,607,161 | 2,284,290 | 677,130 | 42.1 | ||||||||||||
Financial Services: |
||||||||||||||||
Sales revenues |
2,162,237 | 2,324,026 | 161,789 | 7.5 | ||||||||||||
Operating income |
495,593 | 657,001 | 161,408 | 32.6 | ||||||||||||
All Other: |
||||||||||||||||
Sales revenues |
1,052,365 | 1,129,876 | 77,512 | 7.4 | ||||||||||||
Operating income |
85,350 | 42,302 | (43,048 | ) | (50.4 | ) | ||||||||||
Intersegment elimination/unallocated amount: |
||||||||||||||||
Sales revenues |
(651,560 | ) | (680,133 | ) | (28,573 | ) | — | |||||||||
Operating income |
9,645 | 12,104 | 2,459 | — | ||||||||||||
Automotive Operations Segment
The automotive operations segment is Toyota’s largest operating segment by sales revenues. Sales revenues for the automotive segment increased during fiscal 2022 by ¥3,954.1 billion, or 16.0%, to ¥28,605.7 billion compared with the prior fiscal year. The increase mainly reflects the ¥1,510.0 billion favorable impact of changes in vehicle unit sales and sales mix and the ¥1,250.0 billion favorable impact of changes in exchange rates.
Operating income from the automotive operations increased by ¥677.1 billion, or 42.1%, to ¥2,284.2 billion during fiscal 2022 compared with the prior fiscal year. This increase in operating income was due mainly to the ¥760.0 billion effect of marketing activities and the ¥570.0 billion favorable impact of changes in exchange rates, partially offset by the ¥360.0 billion aggregate unfavorable impact of factors categorized as cost reduction efforts (including fluctuations in raw materials prices) and the ¥220.0 billion aggregate unfavorable impact of changes in expenses and expense reduction efforts.
89
Financial Services Operations Segment
Sales revenues for the financial services operations increased during fiscal 2022 by ¥161.7 billion, or 7.5%, to ¥2,324.0 billion compared with the prior fiscal year. This increase was due mainly to the favorable impact of changes in exchange rates.
Operating income from financial services operations increased by ¥161.4 billion, or 32.6%, to ¥657.0 billion during fiscal 2022 compared with the prior fiscal year. This increase was due primarily to the increases in both financing margin and financing volume.
All Other Operations Segment
Sales revenues for Toyota’s other operations segments increased by ¥77.5 billion, or 7.4%, to ¥1,129.8 billion during fiscal 2022 compared with the prior fiscal year.
Operating income from Toyota’s other operations segments decreased by ¥43.0 billion, or 50.4%, to ¥42.3 billion during fiscal 2022 compared with the prior fiscal year.
Related Party Transactions
See note 32 to the consolidated financial statements for further discussion.
Basic Concept Regarding the Selection of Accounting Standards
TMC has adopted IFRS for its consolidated financial statements in order to improve the international comparability of its financial information in the capital markets, among other reasons, beginning with the first quarter of the fiscal year ended March 31, 2021.
Outlook
Toyota, with its full lineup and profitable HEVs and PHEVs, along with its diverse options of BEVs that it will be strengthening, will make sure to meet a wide range of global demand and is committed to further growth. For growth in emerging markets, profitable HEVs will be used as a source of income, and with a value chain that can support approximately 10 million units sold annually, we will also take part in a wide range of business opportunities. In addition, we will achieve cost reductions and by leveraging the strengths of the TPS, and thereby enhance our future investment capacity for the expansion of growth in BEVs and mobility areas, and establish a strong business foundation whereby carbon neutrality and growth can both be achieved. Taking the foregoing external factors and other factors into account, Toyota expects that sales revenues for fiscal 2024 will increase compared with fiscal 2023 due mainly to the increase in vehicle unit sales, partially offset by the unfavorable impact of changes in exchange rates. Toyota expects that operating income will increase in fiscal 2024 compared with fiscal 2023 due mainly to marketing efforts, partially offset by the unfavorable impact of changes in exchange rates. Toyota expects that income before income taxes and net income attributable to Toyota Motor Corporation will also increase in fiscal 2024 compared with fiscal 2023.
Kaizen
For the purposes of this outlook discussion, Toyota is assuming an average exchange rate of ¥125 to the U.S. dollar and ¥135 to the euro. Exchange rate fluctuations can materially affect Toyota’s operating results. In particular, a strengthening of the Japanese yen against the U.S. dollar can have a material adverse effect on Toyota’s operating results. See “Item 5. Operating and Financial Review and Prospects — 5.A Operating Results — Overview — Currency Fluctuations” for further discussion.
The foregoing statements are forward-looking statements based upon Toyota’s management’s assumptions and beliefs regarding exchange rates, market demand for Toyota’s products, economic conditions and others. See
90
“Cautionary Statement With Respect To Forward-Looking Statements”. Toyota’s actual results of operations could vary significantly from those described above as a result of unanticipated changes in the factors described above or other factors, including those described in “Risk Factors”.
5.B LIQUIDITY AND CAPITAL RESOURCES
Historically, Toyota has funded its cash requirements, including those relating to capital expenditures as well as its research and development activities through cash generated by operations.
In fiscal 2024, Toyota expects to sufficiently fund its cash requirements, including those relating to capital expenditures as well as its research and development activities, through cash and cash equivalents on hand, cash generated by operations, the issuance of corporate bonds, and debt financing. Toyota will use its funds to efficiently invest in maintenance and replacement of conventional manufacturing facilities and the introduction of new products and will focus on investment in areas contributing to strengthening competitiveness and future growth for transformation into a mobility company. See “Item 4. Information on the Company — 4.B Business Overview — Capital Expenditures and Divestitures” for information regarding Toyota’s material capital expenditures and divestitures for fiscal 2021, 2022 and 2023, and information concerning Toyota’s principal capital expenditures and divestitures currently in progress.
Toyota funds its financing programs for customers and dealers, including loans and leasing programs, from both cash generated by operations, the issuance of corporate bonds, and debt financing by its sales finance subsidiaries. Toyota seeks to expand its ability to raise funds locally in markets throughout the world by expanding its network of finance subsidiaries.
Net cash provided by operating activities decreased by ¥767.5 billion to ¥2,955.0 billion for fiscal 2023, compared with ¥3,722.6 billion for fiscal 2022. The decrease was primarily attributable to the ¥381.6 billion decrease in net income.
Net cash used in investing activities increased by ¥1,021.3 billion to ¥1,598.8 billion for fiscal 2023, compared with ¥577.4 billion for fiscal 2022. The increase was primarily attributable to the ¥1,762.7 billion decrease in withdrawals from time deposits compared to the previous fiscal year.
Net cash used in financing activities was ¥56.1 billion for fiscal 2023, compared with net cash used in financing activities of ¥2,466.5 billion for fiscal 2022, a ¥2,410.3 billion change. The change was primarily attributable to the ¥1,154.2 billion increase in funding by long-term debt in fiscal 2023.
For a discussion of cash flows for fiscal 2022 as compared to those for fiscal 2021, see “Item 4.B. Operating and Financial Review and Prospects — 5.B. Liquidity and Capital Resources” of Toyota’s Annual Report on Form 20-F for the fiscal year ended March 31, 2022.
Total capital expenditures for property, plant and equipment, including vehicles and equipment on operating leases, were ¥3,496.2 billion during fiscal 2023, remaining largely unchanged from the ¥3,611.5 billion in total capital expenditures during the prior fiscal year.
Toyota expects investments in property, plant and equipment, excluding vehicles and equipment on operating leases, to be approximately ¥1,860.0 billion during fiscal 2024.
Cash and cash equivalents were ¥7,516.9 billion as of March 31, 2023. Most of Toyota’s cash and cash equivalents are held in Japanese yen or in U.S. dollars.
Liquid assets, which Toyota defines as cash and cash equivalents, time deposits, public and corporate bonds and its investment in monetary trust funds increased during fiscal 2023, by ¥1,263.9 billion, or 9.4%, to ¥14,715.0 billion as of March 31, 2023.
91
Trade accounts and notes receivable, less allowance for doubtful accounts increased during fiscal 2023 by ¥443.2 billion, or 14.1%, to ¥3,586.1 billion. This increase was due mainly to increased revenue from sales during the quarter ended March 31, 2023.
Inventories increased during fiscal 2023 by ¥434.2 billion, or 11.4%, to ¥4,255.6 billion. This increase was due mainly to an increase in the volume of precious metals procured.
Total finance receivables, net increased during fiscal 2023 by ¥3,006.3 billion, or 13.8%, to ¥24,770.8 billion. This increase was due mainly to an increase in the impact of changes in exchange rates. Finance receivables were geographically distributed as follows: in North America 56.9%, in Asia 12.0%, in Europe 14.0%, in Japan 6.3% and in Other 10.8%.
Other financial assets increased during fiscal 2023 by ¥247.5 billion, or 2.1%.
Property, plant and equipment increased during fiscal 2023 by ¥307.3 billion, or 2.5%. This increase was due mainly to capital expenditures.
Accounts and notes payable increased during fiscal 2023 by ¥694.2 billion, or 16.2%. This increase was due mainly to an increase in accounts payable associated with parts procurement.
Income taxes payable decreased during fiscal 2023 by ¥422.2 billion, or 51.1%. This decrease was mainly due to an increase in interim payments of income taxes.
Toyota’s total borrowings increased during fiscal 2023 by ¥2,883.9 billion, or 10.9%. Toyota’s short-term borrowings consist of loans with a weighted-average interest rate of 2.02% and commercial paper with a weighted-average interest rate of 3.81%. Short-term borrowings increased during fiscal 2023 by ¥485.3 billion, or 11.8%, to ¥4,590.1 billion. Toyota’s long-term debt mainly consists of unsecured and secured loans, medium-term notes, unsecured and secured notes with weighted-average interest rates ranging from 1.29% to 6.53%, and maturity dates ranging from 2023 to 2048. The current portion of long-term debt increased during fiscal 2023 by ¥621.7 billion, or 8.8%, to ¥7,648.5 billion and the
non-current
portion increased by ¥1,741.6 billion, or 11.7%, to ¥16,685.3 billion. The increase in total borrowings resulted mainly from the increasing demand for financing associated with the increase in the loan balance at financial subsidiaries. As of March 31, 2023, approximately 53% of long-term debt was denominated in U.S. dollars, 11% in Japanese yen, 13% in euros, 6% in Australian dollars, 3% in Canadian dollars, and 14% in other currencies. Toyota hedges interest rate risk exposure of fixed-rate borrowings by entering into interest rate swaps. There are no material seasonal variations in Toyota’s borrowings requirements. As of March 31, 2023, Toyota’s total interest-bearing debt was 103.7% of Toyota Motor Corporation shareholders’ equity, compared with 101.0% as of March 31, 2022.
The following table provides information on credit ratings of Toyota’s short-term borrowing and long-term debt from Standard & Poor’s Ratings Group (S&P), Moody’s Investors Services (Moody’s), and Rating and Investment Information, Inc. (R&I), as of May 31, 2023. A credit rating is not a recommendation to buy, sell or hold securities. A credit rating may be subject to withdrawal or revision at any time. Each rating should be evaluated separately of any other rating.
S&P |
Moody’s |
R&I | ||||
Short-term borrowing |
A-1+ |
P-1 |
— | |||
Long-term debt |
A+ | A1 | AAA |
Toyota’s net defined benefit liability (asset) of Japanese plans decreased during fiscal 2023 by ¥108.2 billion, or 46.6%, to ¥124.0 billion. The net defined benefit liability (asset) of foreign plans increased
92
during fiscal 2023 by ¥50.8 billion, or 19.3%, to ¥313.8 billion. The amounts of net defined benefit liability (asset) will be funded through future cash contributions by Toyota or in some cases will be settled on the retirement date of each covered employee. The decrease in net defined benefit liability (asset) of the Japanese plans reflects mainly a decrease in defined benefit obligations due to an increased discount rate. See note 23 to the consolidated financial statements for further discussion.
Toyota’s treasury policy is to maintain controls on all exposures, to adhere to stringent counterparty credit standards, and to actively monitor marketplace exposures. Toyota remains centralized and is pursuing global efficiency of its financial services operations through Toyota Financial Services Corporation.
The key element of Toyota’s financial strategy is maintaining a strong financial position that will allow Toyota to fund its research and development initiatives, capital expenditures and financial services operations efficiently even if earnings are subject to short-term fluctuations. Toyota believes that it maintains sufficient liquidity for its present cash requirements and that, by maintaining its high credit ratings, it will continue to be able to access funds from external sources in large amounts and at relatively low costs. Toyota’s ability to maintain its high credit ratings is subject to a number of factors, some of which are not within Toyota’s control. These factors include general economic conditions in Japan and the other major markets in which Toyota does business, as well as Toyota’s successful implementation of its business strategy.
Toyota uses its securitization program as part of its funding through special purpose entities for its financial services operations. Toyota is considered as the primary beneficiary of these special purpose entities and therefore consolidates them. Toyota has not entered into any
off-balance
sheet securitization transactions during fiscal 2023. For information regarding the amounts of
non-derivative
financial liabilities and derivative financial liabilities by a remaining contract maturity period, see note 19 to the consolidated financial statements. In addition, as part of Toyota’s normal business practices, Toyota enters into long-term arrangements with suppliers for purchases of certain raw materials, components and services. These arrangements may contain fixed/minimum quantity purchase requirements. Toyota enters into such arrangements to facilitate an adequate supply of these materials and services. The following tables summarize Toyota’s contractual obligations and commercial commitments as of March 31, 2023
Yen in millions |
||||||||||||||||||||
Total |
Payments Due by Period |
|||||||||||||||||||
Less than 1 year |
1 to 3 years |
3 to 5 years |
5 years and after |
|||||||||||||||||
Contractual Obligations: |
||||||||||||||||||||
Short-term debt |
4,590,173 | 4,590,173 | — | — | — | |||||||||||||||
Long-term debt |
24,790,100 | 7,715,466 | 9,875,785 | 5,427,639 | 1,771,210 | |||||||||||||||
Commitments for the purchase of property, plant, other assets and services (note 30) |
522,336 | 251,521 | 208,243 | 28,942 | 33,630 | |||||||||||||||
Total |
29,902,609 | 12,557,160 | 10,084,028 | 5,456,581 | 1,804,840 | |||||||||||||||
Commercial Commitments (note 30): |
||||||||||||||||||||
Maximum potential exposure to guarantees given in the ordinary course of business |
3,600,631 | 955,483 | 1,614,133 | 926,168 | 104,847 | |||||||||||||||
Total |
3,600,631 | 955,483 | 1,614,133 | 926,168 | 104,847 | |||||||||||||||
| * | “Long-term debt” represents future principal payments. |
93
Toyota expects to contribute ¥38,309 million domestically and ¥16,423 million overseas to its pension plans in fiscal 2024.
Lending Commitments
Credit Facilities with Credit Card Holders
Toyota’s financial services operations issue credit cards to customers. As customary for credit card businesses, Toyota maintains credit facilities with holders of credit cards issued by Toyota. These facilities are used upon each holder’s requests up to the limits established on an individual holder’s basis. Although loans made to customers through these facilities are not secured, for the purposes of minimizing credit risks and of appropriately establishing credit limits for each individual credit card holder, Toyota employs its own risk management policy which includes an analysis of information provided by financial institutions in alliance with Toyota. Toyota periodically reviews and revises, as appropriate, these credit limits. Outstanding credit facilities with credit card holders were ¥171.4 billion as of March 31, 2023.
Credit Facilities with Dealers
Toyota’s financial services operations maintain credit facilities with dealers. These credit facilities may be used for business acquisitions, facilities refurbishment, real estate purchases, and working capital requirements. These loans are typically collateralized with liens on real estate, vehicle inventory, and/or other dealership assets, as appropriate. Toyota obtains a personal guarantee from the dealer or corporate guarantee from the dealership when deemed prudent. Although the loans are typically collateralized or guaranteed, the value of the underlying collateral or guarantees may not be sufficient to cover Toyota’s exposure under such agreements. Toyota evaluates the credit facilities according to the risks assumed in entering into the credit facility. Toyota’s financial services operations also provide financing to various multi-franchise dealer organizations, referred to as dealer groups, often as part of a lending consortium, for wholesale inventory financing, business acquisitions, facilities refurbishment, real estate purchases, and working capital requirements. Toyota’s outstanding credit facilities with dealers totaled ¥3,820.9 billion as of March 31, 2023.
Guarantees
See note 30 to the consolidated financial statements for further discussion.
5.C RESEARCH AND DEVELOPMENT, PATENTS AND LICENSES
Toyota’s research and development is dedicated to capturing the increasingly diverse and sophisticated market through the development of attractive, affordable, high-quality products for customers worldwide. The intellectual property that R&D generates is a vital management resource that Toyota utilizes and protects to maximize its corporate value. For a more detailed discussion of the company’s research and development objectives and policies, see “Item 4. Information on the Company — 4.B Business Overview — Research and Development.”
Toyota’s research and development expenditures were approximately ¥1,241.6 billion in fiscal 2023, ¥1,124.2 billion in fiscal 2022 and ¥1,090.4 billion in fiscal 2021.
Toyota presents research and development expenditures as a supplemental measure that demonstrates the amount of research and development expenditures undertaken during the relevant reporting period. Toyota defines research and development expenditures as research and development cost, plus research and development-related expenditures that were recognized as intangible assets, less amortization expenses for such assets. This measure has limitations as an analytical tool, and you should not consider it in isolation, or as a substitute for an analysis of Toyota’s research and development cost as reported under IFRS.
94
For details of the research and development cost recorded in the consolidated statement of income, see note 27 to the consolidated financial statements.
Toyota operates a global research and development organization with the primary goal of building automobiles that meet the needs of customers in every region of the world. In Japan, research and development operations are led by Toyota and Toyota Central Research & Development Laboratories, Inc., which works closely with Daihatsu, Hino, Toyota Auto Body Co., Ltd., Toyota Motor East Japan, Inc., and many other Toyota group companies. Overseas, Toyota has a worldwide network of technical centers as well as design and motorsports research and development centers.
Toyota established TRI in January 2016 to accelerate research and development of artificial intelligence technology, which has significant potential to support future industrial technologies. In July 2017, TRI invested $100 million to launch a venture capital fund designed to provide financing to startup companies, and is making investments in newly established promising startup companies in the four areas of artificial intelligence, robotics, autonomous mobility, and data and cloud technology. TRI successively invested another $100 million in May 2019 and $150 million in June 2021. In addition, TRI established a $150 million fund in an aim to achieve carbon neutrality.
In Japan, Toyota established a new company, Toyota Research Institute — Advanced Development
(“TRI-AD”),
in March 2018 to further accelerate its efforts in advanced development for automated driving technology and related technologies. Its key objectives include creating a smooth software pipeline from research to commercialization, leveraging data-handling capabilities, strengthening collaboration in development within the Toyota group, including TRI, to accelerate development, and recruiting and employing top-level
engineers globally, while cultivating and coordinating strong talent within the Toyota group. In January 2021, TRI-AD
was reorganized into Woven Planet Group comprising four companies — Woven Planet Holdings, Inc., which is responsible for decision-making for the entire group and creates new business opportunities; Woven Core, Inc., which assumed the business of TRI-AD
and is responsible for the development of automated driving technologies; Woven Alpha, Inc., which is responsible for the development of new projects such as Woven City and Arene, a software platform; and Woven Capital, L.P. with a total investment value of $800 million, which invests in growth-stage companies in areas such as autonomous driving mobility, artificial intelligence, and smart city. Moreover, to bolster overseas research and development initiatives related to automated driving technology and software platforms, Toyota established Woven Planet North America (WPNA) in the United States and Woven Planet United Kingdom in the United Kingdom, and transferred TRI’s automated driving division to WPNA in May 2022. On April 1, 2023, Woven Planet Holdings, Inc., Woven Core, Inc. and Woven Alpha, Inc. were merged and changed their name to Woven by Toyota, Inc. Toyota also established a technical development center in Otemachi, Tokyo, Japan in October 2018 as a site for development of key IT technologies that will support automated driving in collaboration with Woven Core, as well as promotion of collaboration with venture companies and creation of new value by utilizing big data.
95
The following table provides information on Toyota’s principal research and development facilities.
Facility |
Principal Activity | |
Japan |
||
Toyota Technical Center |
Product planning, style, design, prototype production and vehicle evaluation | |
Higashi-Fuji Technical Center |
Advanced development | |
Tokyo Design Research & Laboratory |
Advanced styling designs | |
Woven by Toyota, Inc. |
Development of artificial intelligence technology with a focus on automated driving technology Development of Woven City and software platform technologies | |
Otemachi Office |
Development of key IT technologies, creation of new values by utilizing big data and collaboration with venture companies | |
Shibetsu Proving Ground |
Evaluation | |
Toyota Central R&D Labs., Inc. |
Basic research | |
United States |
||
Toyota Motor Engineering and Manufacturing North America, Inc. |
Product planning, design and evaluation of vehicles manufactured in North America | |
Calty Design Research, Inc. |
Design | |
Toyota Research Institute of North America (TRI-NA) |
Advanced research relating to “energy and environment,” “safety” and “mobility infrastructure” | |
Toyota Research Institute, Inc. |
Research and development of artificial intelligence technology | |
Woven by Toyota, U.S., Inc. |
Development of automated driving technology and software | |
Europe |
||
Toyota Motor Europe NV/SA |
Planning and evaluation of vehicles manufactured in Europe | |
Toyota Europe Design Development S.A.R.L. |
Design | |
Toyota Motorsport GmbH |
Development of motor sports vehicles | |
Woven by Toyota, U.K., Ltd. |
Development of automated driving technology and software platform technology | |
Asia Pacific |
||
Toyota Daihatsu Engineering and Manufacturing Co., Ltd. |
Planning and evaluation of vehicles manufactured in Australia and Asia | |
China |
||
Toyota Motor Engineering and Manufacturing (China) Co., Ltd. |
Environmental technology design and evaluation in China | |
FAW Toyota Research & Development Co., Ltd. |
Design, evaluation and certification of vehicles manufactured in China | |
GAC Toyota Motor Co., Ltd. R&D Center |
Design, evaluation and certification of vehicles manufactured in China | |
BYD Toyota EV Technology Co., Ltd. |
Design and evaluation of BEVs | |
Toyota Motor Technical Research and Service (Shanghai) Co., Ltd. |
Research of new technology, construction and system of automobiles | |
United Fuel Cell System R&D (Beijing) Co., Ltd. |
Development of FC system for commercial vehicles in China | |
96
Toyota carefully analyzes patents and the need for patents in each area of research to formulate more effective research and development strategies. Toyota identifies research and development projects in which it should build a strong global patent portfolio.
For a further discussion of Toyota’s intellectual property, see “Item 4. Information on the Company — 4.B Business Overview — Intellectual Property.”
5.D TREND INFORMATION
For a discussion of the trends that affect Toyota’s business and operating results, see “Item 5. Operating and Financial Review and Prospects — 5.A Operating Results” and “Item 5. Operating and Financial Review and Prospects — 5.B Liquidity and Capital Resources.”
5.E CRITICAL ACCOUNTING ESTIMATES
Not applicable.
ITEM 6. DIRECTORS, SENIOR MANAGEMENT AND EMPLOYEES
6.A DIRECTORS AND SENIOR MANAGEMENT
In order to advance its transition to a mobility company, Toyota has reflected on the path it has taken thus far and has formulated the “Toyota Philosophy” as a roadmap for the future. Toyota’s mission is “Producing Happiness for All” by expanding the possibilities of people, companies and communities through addressing the challenges of mobility as a mobility company. In order to do so, Toyota will continue to create new and unique value with various partners by relentlessly committing towards (manufacturing), and by fostering imagination for people and society.
monozukuri
Toyota strives to provide a full lineup of products with “good quality yet affordable prices” globally at the right place at the right time, and offer products and services that are sympathetic towards customers in each country and region, through the initiative of “making even better cars” that we have been engaged in since the 2008 financial crisis. In order to meet these objectives, following the introduction of “region-based operations,” the “business unit system” and the ) grouped and replaced the following titles or ranks: managing officers, executive general managers, ). In April 2020, Toyota consolidated the posts of executive vice president and operating officer into the post of operating officer. In July 2020, Toyota further clarified the roles of operating officers. Members of management who, together with the president, have cross-functional oversight of the entire company, were redefined as “operating officers.”
“in-house
company system” in 2011, 2013 and 2016, respectively, in April 2017 Toyota further clarified that, for the purpose of further accelerating decision-making and operational execution, members of the board of directors are responsible for decision-making and management oversight and that operating officers are responsible for operational execution. Furthermore, in 2018, Toyota changed the commencement of operating officers’ terms of office from April to January, reduced corporate strategy functions and restructured the Japan Sales Business Group based on regions rather than sales channels in an effort to enable decision-making closer to customers and the field, in order to further accelerate execution in full coordination with each site. In 2019, in order to further advance Toyota’s “acceleration of management” and the development of a diverse and talented workforce, the executive structure was changed to be composed only of senior managing officers and people of higher rank, and a new classification called “senior professional/senior management” (kanbushoku
(sub-executive
managerial level) senior grade 1 and senior grade 2 managers, and grand masters. From the perspective of appointing the right people to the right positions, senior professionals/senior management were positioned in a wide range of posts, from those of chief officer, deputy chief officer, plant general manager, and senior general manager to group manager, to deal with management issues as they arise and to strengthen their development as part of a diverse and talented workforce through on-site
learning and problem-solving (genchi genbutsu
In-house
company presidents, regional CEOs, and chief 97
officers, as management” under the theme of “inheritance and evolution,” and the executive vice presidents were selected upon their extensive knowledge and experience from the two pillars of products and regions. Based on its basic policy of appointing the right people to the right positions, Toyota has been swiftly and continuously innovating. Toyota will further press forward the tide of such innovations, aiming for a corporate structure capable of carrying out management from a viewpoint that is optimal for a global company.
on-site
leaders of business implementation elements, were given authority while being consolidated into the classification of “senior professional/senior management.” The roles of operating officers and senior professionals/senior management are to be determined where and as needed, and persons appointed as operating officers and senior professionals/senior management will change in accordance with the challenges faced and the path that should be taken, as the company exercises greater flexibility in making appointments. However, because of the rapidly changing business environment, Toyota now recognizes that there is an increasing need for such executives to fulfill management roles (related to people, goods, and money) together with our President. Therefore, in April 2022, Toyota reorganized the roles of operating officers and reestablished the position of “executive vice president,” defining it as an operating officer who is focused on the business from a management perspective. In April 2023, the role of operating officers was revised to a management team that implements “product-centered (manufacturing ever-better cars) and region-centered (best-in-town)
In order to convey top management’s aspirations and the company’s direction to all stakeholders, Toyota communicates what Toyota is really like through “Toyota Times.”
Toyota believes that it is critical to appoint individuals who are capable of contributing to decision-making aimed at sustainable growth into the future by practicing “product-centered and region-centered management” in keeping with the spirit of the Toyoda Principles, which set forth its founding philosophy. Moreover, these individuals should be able to play a significant role in transforming Toyota into a “mobility company” through responding to electrification, intelligence, and diversification and external partnerships based on trust and friendship and internal
two-way
interactive teamwork, while working towards solutions for social challenges such as the climate change issue. Toyota maintains its board of directors and senior management at an adequate size, and ensures they are overall balanced and diverse, including from the perspective of gender and nationality. Three outside members of the board of directors have been appointed in order to further reflect the opinions of those from outside the company in management’s decision-making process. Toyota has six audit & supervisory board members, four of whom are outside audit & supervisory board members. In order to be prepared in the event Toyota lacks the number of audit & supervisory board members required by law, one substitute audit & supervisory board member has been appointed pursuant to Article 329, Paragraph 3 of the Companies Act. 98
Set forth below are brief summaries of Toyota’s members of the board of directors and audit & supervisory board members.
Name (Date of Birth) |
Position |
Brief Career Summary and Important Concurrent Duties |
Number of Common Shares (in thousands) |
|||||
Akio Toyoda (May 3, 1956) |
Chairman of the Board of Directors |
1984 Joined TMC 2000 Member of the Board of Directors of TMC 2002 Managing Director of TMC 2003 Senior Managing Director of TMC 2005 Executive Vice President of TMC 2009 President of TMC 2023 Chairman of TMC (to present) (important concurrent duties) Chairman of TOYOTA FUDOSAN CO., LTD. Chairman of the Japan Automobile Manufacturers Association, Inc. Director of DENSO Corporation Representative Director of ROOKIE Racing, Inc. Chairman of TOYOTA GAZOO Racing World Rally Team |
24,691 | |||||
| Shigeru Hayakawa (September 15, 1953) | Vice Chairman of the Board of Directors |
1977 Joined Toyota Motor Sales Co., Ltd. 2007 Managing Officer of TMC 2007 Toyota Motor North America, Inc. President 2012 Senior Managing Officer of TMC 2015 Member of the Board of Directors and Senior Managing Officer of TMC 2017 Vice Chairman of TMC (to present) (important concurrent duties) Representative Director of Institute for International Economic Studies |
326 | |||||
Koji Sato (October 19, 1969) |
President, Member of the Board of Directors |
1992 Joined TMC 2017 Executive General Manager of TMC 2020 Operating Officer of TMC 2021 Operating Officer of TMC (current system) 2023 Operating Officer and President of TMC President of TMC (to present) (important concurrent duties) Chairman of TOYOTA GAZOO Racing Europe GmbH Chairman of Toyota Motor North America, Inc. |
55 | |||||
99
Name (Date of Birth) |
Position |
Brief Career Summary and Important Concurrent Duties |
Number of Common Shares (in thousands) |
|||||
Hiroki Nakajima (April 10, 1962) |
Member of the Board of Directors, Operating Officer, Vice President | 1987 Joined TMC 2014 Executive General Manager of TMC 2015 Managing Officer of TMC 2020 Operating Officer of TMC 2023 Operating Officer and Executive Vice President of TMC (current system) Member of the Board of Directors, Operating Officer, Vice President of TMC (to present) (important concurrent duties) President of Commercial Japan Partnership Technologies Corporation |
20 | |||||
Yoichi Miyazaki (October 19, 1963) |
Member of the Board of Directors, Operating Officer, Vice President |
1986 Joined TMC 2015 Managing Officer of TMC 2019 Operating Officer of TMC 2022 Operating Officer of TMC (current system) 2023 Operating Officer and Executive Vice President of TMC Member of the Board of Directors, Operating Officer, Vice President of TMC (to present) |
42 | |||||
Simon Humphries (March 30, 1967) |
Member of the Board of Directors, Operating Officer |
1988 Joined DCA Design in UK. 1994 Joined TMC 2016 President of Toyota Europe Design Development S.A.R.L. 2018 Executive General Manager of TMC 2023 Operating Officer of TMC Member of the Board of Directors, Operating Officer (to present) (important concurrent duties) Executive Vice President of Calty Design Research, Inc. |
10 | |||||
| Ikuro Sugawara (March 6, 1957) |
Outside Member of the Board of Directors |
1981 Joined Ministry of International Trade and Industry 2010 Director-General of the Industrial Science and Technology Policy and Environment Bureau, Ministry of Economy, Trade and Industry 2012 Director-General of the Manufacturing Industries Bureau, Ministry of Economy, Trade and Industry 2013 Director-General of the Economic and Industrial Policy Bureau, Ministry of Economy, Trade and Industry 2015 Vice-Minister of Ministry of Economy, Trade and Industry 2017 Retired from the Ministry of Economy, Trade and Industry |
— | |||||
100
Name (Date of Birth) |
Position |
Brief Career Summary and Important Concurrent Duties |
Number of Common Shares (in thousands) |
|||||
2017 Special Advisor to the Cabinet 2018 Retired from Special Advisor to the Cabinet 2018 Outside Member of the Board of Directors of TMC (to present) (important concurrent duties) Independent Director of Hitachi, Ltd. Outside Director of FUJIFILM Holdings Corporation |
||||||||
| Sir Philip Craven (July 4, 1950) |
Outside Member of the Board of Directors |
1989 President of the International Wheelchair Basketball Federation 2001 President of the International Paralympic Committee 2002 Retired as President of the International Wheelchair Basketball Federation 2017 Retired as President of the International Paralympic Committee 2018 Outside Member of the Board of Directors of TMC (to present) |
— | |||||
Masahiko Oshima (September 13, 1960) |
Outside Member of the Board of Directors |
1984 Joined The Mitsui Bank Limited 2012 Executive Officer of Sumitomo Mitsui Banking Corporation (SMBC) 2014 Managing Executive Officer of SMBC 2017 Director and Managing Executive Officer of SMBC Director and Senior Managing Executive Officer of SMBC 2018 Senior Managing Corporate Executive Officer of Sumitomo Mitsui Financial Group, Inc. (SMFG) Senior Managing Executive Officer of SMBC 2019 Deputy President and Executive Officer of SMFG Director and Deputy President of SMBC 2023 Deputy Chairman of SMBC (to present) Outside Member of the Board of Directors of TMC (to present) (important concurrent duties) Deputy Chairman of Sumitomo Mitsui Banking Corporation |
— | |||||
101
Name (Date of Birth) |
Position |
Brief Career Summary and Important Concurrent Duties |
Number of Common Shares (in thousands) |
|||||
Emi Osono (August 8, 1965) |
Outside Member of the Board of Directors |
1988 Joined The Sumitomo Bank, Limited 1998 Visiting Professor of the Waseda Institute of Asia-Pacific Studies (WIAPS) 2000 Full-time lecturer at School of International Corporate Strategy, Hitotsubashi University Business School 2002 Assistant Professor at School of International Corporate Strategy, Hitotsubashi University Business School 2010 Professor at School of International Corporate Strategy, Hitotsubashi University Business School 2018 Professor at School of Business Administration, Hitotsubashi University Business School 2022 Dean and Professor at School of Business Administration and School of International Corporate Strategy, Hitotsubashi University Business School (to present) 2023 Outside Member of the Board of Directors of TMC (to present) (important concurrent duties) Professor at School of Business Administration, Hitotsubashi University Business School Outside Director of Tokio Marine Holdings, Inc. |
— | |||||
| Masahide Yasuda (April 1, 1949) |
Full-time Audit & Supervisory Board Member |
1972 Joined TMC 2000 General Manager of Overseas Parts Division of TMC 2007 President of Toyota Motor Corporation Australia Ltd. 2014 Chairman of Toyota Motor Corporation Australia Ltd. 2017 Retired as Chairman of Toyota Motor Corporation Australia Ltd. 2018 Audit & Supervisory Board Member of TMC (to present) |
62 | |||||
| Katsuyuki Ogura (January 25, 1963) | Full-time Audit & Supervisory Board Member |
1985 Joined TMC 2015 General Manager of Affiliated Companies Finance Dept. of TMC 2018 General Manager of Audit & Supervisory Board Office of TMC 2019 Audit & Supervisory Board Member of TMC (to present) (important concurrent duties) Outside Audit & Supervisory Board Member of Aichi Steel Corporation |
29 | |||||
102
Name (Date of Birth) |
Position |
Brief Career Summary and Important Concurrent Duties |
Number of Common Shares (in thousands) |
|||||
Takeshi Shirane (September 5, 1952) |
Full-time Audit & Supervisory Board Member |
1977 Joined TMC 2001 General Manager of Production Management Div. of TMC 2004 General Manager of Global Procurement Planning Div. of TMC 2005 General Manager of 1st Procurement Div. of TMC Managing Officer of TMC 2009 Senior Managing Director of TMC 2011 Senior Managing Officer of TMC Advisor of Kanto Auto Works, Ltd. 2012 President of Kanto Auto Works, Ltd. President of Toyota Motor East Japan, Inc. 2019 Chairman of the Board of Toyota Motor East Japan, Inc. 2023 Senior Executive Advisor of Toyota Motor East Japan, Inc. (to present) Audit & Supervisory Board Member of TMC (to present) |
150 | |||||
| George Olcott (May 7, 1955) |
Outside Audit & Supervisory Board Member |
1986 Joined S.G.Warburg & Co.,Ltd 1999 President of UBS Asset Management (Japan) 1999 President, Japan UBS Brinson 2000 Managing Director, Equity Capital Markets, UBS Warburg Tokyo 2001 Judge Business School, University of Cambridge 2005 FME Teaching Fellow, Judge Business School, University of Cambridge 2008 Senior Fellow, Judge Business School, University of Cambridge 2022 Outside Audit & Supervisory Board Member of TMC (to present) (important concurrent duties) Outside Director of Kirin Holdings Company, Limited |
2 | |||||
Ryuji Sakai (August 7, 1957) |
Outside Audit & Supervisory Board Member |
1985 Registered as attorney Nagashima & Ohno 1990 Wilson, Sonsini, Goodrich & Rosati (located in U.S.) 1995 Partner, Nagashima & Ohno 2000 Partner, Nagashima Ohno & Tsunematsu 2022 Audit & Supervisory Board Member of TMC (to present) 2023 Senior Counsel of Nagashima Ohno & Tsunematsu (to present) (important concurrent duties) Attorney |
— | |||||
103
Name (Date of Birth) |
Position |
Brief Career Summary and Important Concurrent Duties |
Number of Common Shares (in thousands) |
|||||
Catherine O’Connell (February 10, 1967) |
Outside Audit & Supervisory Board Member |
1987 Japan Travel Bureau Inc. 1994 Senior Solicitor of Anderson Lloyd Barristers & Solicitors (New Zealand) 2002 In House Counsel of Olympus Corporation 2004 Senior In House Counsel of Matsushita Electric Industrial Co., Ltd. Motor Company Senior In House Counsel of Matsushita Electronic Components Co., Ltd. 2008 Hogan Lovells Horitsu Jimusho Gaikokuho Kyodo Jigyo 2012 Head of Legal of Molex Japan LLC 2017 President of O’Connell Consultants 2018 CEO of Catherine O’Connell Law (to present) 2023 Outside Audit & Supervisory Board Member of TMC (to present) (important concurrent duties) Registered foreign attorney External Audit & Supervisory Board Member of Fujitsu Limited |
— | |||||
| 1. | Mr. Koji Sato, who is President and Member of the Board of Directors, concurrently serves as Operating Officer (President). |
| 2. | The terms of office of the members of the board of directors are from the conclusion of the Ordinary General Shareholders’ Meeting held on June 14, 2023 to the conclusion of the Ordinary General Shareholders’ Meeting for fiscal 2024. |
| 3. | The terms of office of Mr. Masahide Yasuda and Mr. George Olcott, who are both Audit & Supervisory Board Members, are from the conclusion of the Ordinary General Shareholders’ Meeting held on June 15, 2022 to the conclusion of the Ordinary General Shareholders’ Meeting for fiscal 2026. |
| 4. | The terms of office of Mr. Katsuyuki Ogura, Mr. Takeshi Shirane, Mr. Ryuji Sakai and Ms. Catherine O’Connell, who are all Audit & Supervisory Board Members, are from the conclusion of the Ordinary General Shareholders’ Meeting held on June 14, 2023 to the conclusion of the Ordinary General Shareholders’ Meeting for fiscal 2027. |
None of the persons listed above was selected as a member of board of directors, audit & supervisory board member or member of senior management pursuant to an arrangement or understanding with Toyota’s major shareholders, customers, suppliers or others.
104
Set forth below is a brief summary of Toyota’s substitute audit & supervisory board member.
Name (Date of Birth) |
Position |
Brief Career Summary and Important Concurrent Duties |
Number of Common Shares | |||
Maoko Kikuchi (July 14, 1965) |
Substitute Audit & Supervisory Board Member |
1992 Public Prosecutor at Public Prosecutor’s Office, Mistry of Justice 1997 Joined Paul Hastings, LLP (U.S.) 1999 Registered as attorney Joined Nagashima & Ohno 2004 Chief of the General Secretariat of the Japan Fair Trade Commission 2006 General Manager of Legal and Regulatory Affairs Div. of Vodafone K.K. 2014 Executive Officer of Microsoft Japan Co., Ltd. 2016 Standing Outside Audit & Supervisory Board Member of MITSUISOKO HOLDINGS Co., Ltd. 2020 President of Compass International Law Office (to present) (important concurrent duties) Attorney Outside Director of MITSUISOKO HOLDINGS Co., Ltd. Outside Director of Hitachi Construction Machinery Co., Ltd. |
— |
6.B COMPENSATION
Decision Making Policy and Process
Toyota believes that it is critical to appoint individuals who are capable of implementing “management centered on products and regions” and contributing to decision-making aimed at sustainable growth into the future in keeping with the spirit of the Toyoda Principles, which set forth its founding philosophy. Moreover, these individuals should be able to play a significant role in transforming Toyota into a mobility company and contribute to the solutions of social issues, including climate change, through efforts for electrification, intelligence, and diversification and building external partnerships therefor based on trust and friendship and internal
two-way
interactive teamwork. Toyota’s director compensation system is an important means through which to promote various initiatives and is determined based on the following policy. | • | It should be a system that encourages members of the board of directors to work to improve the medium- to long-term corporate value of Toyota. |
| • | It should be a system that can maintain compensation levels that will allow Toyota to secure and retain talented personnel. |
| • | It should be a system that motivates members of the board of directors to promote management from the same viewpoint as our shareholders with a stronger sense of responsibility as corporate managers. |
The board of directors decides by resolution the policy for determining remuneration for and other payments to each member of the board of directors. Remuneration is effectively linked to corporate performance while reflecting individual job responsibilities and performance. Remuneration for outside members of the board of directors and audit & supervisory board members consists only of fixed payments. As a result, this remuneration is not readily impacted by business performance, helping to ensure independence from management.
105
Based on the resolution of the 115th Ordinary General Shareholders’ Meeting held on June 13, 2019 concerning remuneration for the members of the board of directors of Toyota, the maximum cash compensation was set at 3.0 billion yen per year (of which, the maximum amount payable to outside members of the board of directors is 0.3 billion yen per year), and the maximum share compensation was set at 4.0 billion yen per year. The number of members of the board of directors as of the conclusion of the 115th Ordinary General Shareholders’ Meeting was nine (including three outside members of the board of directors).
The amount of remuneration for audit & supervisory board members of Toyota was set at 30 million yen or less per month at the 104th Ordinary General Shareholders’ Meeting held on June 24, 2008. The number of audit & supervisory board members as of the conclusion of the 104th Ordinary General Shareholders’ Meeting was seven.
The amount of remuneration for each member of the board of directors of Toyota and the remuneration system are decided by the board of directors and the “Executive Compensation Meeting,” a majority of the members of which are outside members of the board of directors, to ensure the independence of the decision. For fiscal 2023, the Executive Compensation Meeting consists of vice chairman of the board of directors Shigeru Hayakawa
*1
(Chairman), member of the board of directors Yoichi Miyazaki, and outside members of the board of directors Ikuro Sugawara, Sir Philip Craven, Masahiko Oshima*3
and Emi Osono*3
. | *1 | Shigeru Hayakawa, Vice Chairman of the Board of Directors, replaced Takeshi Uchiyamada, Chairman of the Board of Directors, as Chairman of the Executive Compensation Meeting on April 1, 2023. Takeshi Uchiyamada, Chairman of the Board of Directors, became a member of the Board of Directors as of the same date, and subsequently retired as a member of the Board of Directors upon the conclusion of the Ordinary General Shareholders’ Meeting held on June 14, 2023. |
| *2 | Kenta Kon, a member of the Board of Directors, replaced Koji Kobayashi, a member of the Board of Directors, as a member of the Executive Compensation Meeting on June 15, 2022. Yoichi Miyazaki, Operating Officer, subsequently replaced Kenta Kon as a member of the Executive Compensation Meeting on April 1, 2023. Koji Kobayashi, a member of the Board of Directors, retired as a member of the Board of Directors upon the conclusion of the Ordinary General Shareholders’ Meeting held on June 15, 2022. Kenta Kon, a member of the Board of Directors, retired as a member of the Board of Directors upon the conclusion of the Ordinary General Shareholders’ Meeting held on June 14, 2023, and Yoichi Miyazaki, Operating Officer, became a member of the Board of Directors upon the conclusion of the Ordinary General Shareholders’ Meeting held on June 14, 2023. |
| *3 | Masahiko Oshima and Emi Osono, both outside members of the Board of Directors, replaced Teiko Kudo, an outside member of the Board of Directors, as members of the Executive Compensation Meeting on June 14, 2023. Teiko Kudo, an outside member of the Board of Directors, retired as an outside member of the Board of Directors upon the conclusion of the Ordinary General Shareholders’ Meeting held on June 14, 2023. |
| *4 | The amount of remuneration for each outside member of the Board of Directors and the amount of remuneration for each non-outside member of the Board of Directors were determined at meetings of the Executive Compensation Meeting held in April 2022 and April 2023, respectively. |
The board of directors resolves the policy for determining remuneration for and other payments to each member of the board of directors and the executive remuneration system as well as the total amount of remuneration for a given fiscal year. The board of directors also resolves to delegate the determination of the amount of remuneration for each member of the board of directors to the Executive Compensation Meeting.
The Executive Compensation Meeting reviews the remuneration system for members of board of directors and senior management on which it will consult with the board of directors and determines the amount of remuneration for each member of the board of directors, taking into account factors such as corporate performance as well as individual job responsibilities and performance, in accordance with the policy for
106
determining remuneration for and other payments to each member of the board of directors established by the board of directors. The board of directors considers that such decisions made by the Executive Compensation Meeting are in line with the policy on determining remuneration and other payments for each member of the board of directors.
Remuneration for audit & supervisory board members is determined by the audit & supervisory board within the scope determined by resolution of the shareholders’ meeting.
Executive Compensation Meetings were held in April 2022 and March and April 2023 to discuss and determine the amount of remuneration for fiscal 2023 and other relevant matters.
Furthermore, preliminary examination meetings, consisting only of outside members of the board of directors, were held on a total of five occasions in July, September and October 2022 and January and February 2023 to discuss matters for the Executive Compensation Meetings. Remuneration for the members of the board of directors were determined with the unanimous consent of the Executive Compensation Meeting.
The principal topics discussed at Executive Compensation Meetings included:
| • | Remuneration level for each position and job responsibility |
| • | Evaluation of benchmarks and actual results of fiscal 2022 |
| • | Determination of the amount of remuneration for each member of the board of directors |
Method of Determining Performance-based Remuneration (Bonus and Share Compensation)
Directors with Japanese Citizenship (Excluding Outside Members of the Board of Directors)
Toyota sets the total amount of remuneration (“Annual Total Remuneration”) received by each member of the board of directors in a year based on consolidated operating income, the fluctuation of the market capitalization of Toyota (calculated by multiplying the closing price of Toyota’s common stock on the Tokyo Stock Exchange and the total number of issued shares of Toyota common stock (less shares of treasury stock)) and individual performance evaluation. The balance after deducting fixed remuneration, or monthly remuneration, from Annual Total Remuneration constitutes performance-based remuneration.
Toyota determines the annual total remuneration level appropriate for each position and job responsibility in accordance with factors including the size of each director’s role, and by referring to the benchmarking result of remuneration for officers of both Japanese and global companies.
Concept of Each Item
Consolidated operating income |
Indicator for evaluating Toyota’s efforts based on business performance | |
Fluctuation of the market capitalization |
Corporate value indicator for shareholders and investors to evaluate Toyota’s efforts | |
Individual performance evaluation |
Qualitative evaluation of performance of each member of the board of directors | |
107
Method and Reference Value for Evaluating Indicators and Evaluation Result for Fiscal 2022
Evaluation Weight |
Evaluation Method |
Reference Value |
Evaluation Result for Fiscal 2022 | |||||
Consolidated operating income |
70% | Evaluate the degree of attainment of consolidated operating income in fiscal 2021, using required income (set in 2011) for Toyota’s sustainable growth as reference value | ¥1 trillion | |||||
Fluctuation of Toyota’s market capitalization |
30% | Comparatively evaluate the fluctuation of Toyota’s market capitalization up to fiscal 2022 (average of January-March), using the market capitalization of Toyota and the TOPIX of fiscal 2021 (average of January-March) as reference values | Toyota: ¥30.4 trillion TOPIX : ¥1,909.75 |
180% | ||||
Method of Setting Annual Total Remuneration
Annual Total Remuneration is set using a theoretical formula that takes into account the benchmarking results of remuneration for members of the board of directors. Annual Total Remuneration is set based on consolidated operating income and the fluctuation of the market capitalization of Toyota, and then adjusted based on individual performance evaluation. Individual performance evaluation takes into account various factors such as initiatives (including the ESG perspective) in keeping with the spirit of the Toyoda Principles, which set forth Toyota’s founding philosophy, trust from his or her peers and contribution to the promotion of human resources development. The Individual performance evaluation is set within the range of 50% above or below Annual Total Remuneration in accordance with the position and job responsibilities, and the amount of the annual total remuneration for each member of the board of directors is calculated based on such evaluation results.
Directors with Foreign Citizenship (Excluding Outside Members of the Board of Directors)
Fixed remuneration and performance-based remuneration are set based on the remuneration levels and structures that allow Toyota to secure and retain talented personnel. Fixed remuneration is set, taking into account each member’s job responsibilities and the remuneration standards of such member’s home country (application determined based on each member’s job responsibilities and other factors). Performance-based remuneration is set based on consolidated operating income, the fluctuation of the market capitalization of Toyota and individual performance, taking into account each member’s job responsibilities and the remuneration standards of such member’s home country (application determined based on each member’s job responsibilities and other factors). The concept of each item is the same as that for directors with Japanese citizenship (excluding outside members of the board of directors). There are cases where Toyota provides income tax compensation for certain members of the board of directors in light of the difference in income tax rates with those of his or her home country.
Compensation
The aggregate amount of remuneration, including bonuses, accrued for all members of the board of directors and audit & supervisory board members as a group by Toyota for services in all capacities was ¥3,461 million during fiscal 2023.
108
Toyota Motor Corporation and its subsidiaries have not set aside or accrued any amounts to provide pension, retirement or similar benefits to members of the board of directors and audit & supervisory board members of Toyota Motor Corporation.
Toyota’s Annual Securities Report filed with the Kanto Local Bureau of Finance on June 30, 2023, contained the following information concerning compensation in fiscal 2023 on a consolidated basis for members of the board of directors and audit & supervisory board members whose total compensation exceeded ¥100 million during such period:
Name, Position |
Classification of Company |
Compensation per Type (million yen) |
Total Compensation (millions of yen) |
|||||||||||||||||||
Fixed Compensation |
Performance-based Compensation |
Retirement Benefits |
||||||||||||||||||||
Monthly Compensation |
Bonus |
Share Compensation |
||||||||||||||||||||
Takeshi Uchiyamada, Member of the Board of Directors |
Toyota Motor Corporation | 122 | 197 | — | — | 319 | ||||||||||||||||
Shigeru Hayakawa, Member of the Board of Directors |
Toyota Motor Corporation | 77 | 1 | |
73 (38,000 shares) |
|
— | 151 | ||||||||||||||
Akio Toyoda, Member of the Board of Directors |
Toyota Motor Corporation | 264 | — | |
735 (383,000 shares) |
|
— | 999 | ||||||||||||||
James Kuffner, Member of the Board of Directors |
Toyota Motor |
108 | 68 | — | — | 811 | ||||||||||||||||
| Corporation Consolidated subsidiary (Woven Planet Holdings, Inc.*) |
587 | 48 | — | — | ||||||||||||||||||
Kenta Kon, Member of the Board of Directors |
Toyota Motor |
52 | 56 | — | — | 120 | ||||||||||||||||
| Corporation Consolidated subsidiary (Hino Motors, Ltd.) |
11 | — | — | — | ||||||||||||||||||
| * | Fixed compensation that Woven Planet Holdings, Inc., Toyota’s consolidated subsidiary, pays to James Kuffner includes fixed compensation that is paid trimonthly and annually. In addition to the above compensation, Toyota and its consolidated subsidiary, Woven Planet Holdings, Inc. paid a tax compensation of 520 million yen to James Kuffner, taking into account the difference in tax rates with respect to his home country and Japan. Woven Planet Holdings, Inc. was renamed Woven by Toyota, Inc. on April 1, 2023. |
The amounts above were recorded as expenses in fiscal 2023.
6.C BOARD PRACTICES
Toyota’s articles of incorporation provide for a board of directors of not more than 20 members and for not more than seven audit & supervisory board members. Shareholders elect the members of the board of directors and audit & supervisory board members at the general shareholders’ meeting. The normal term of office of a member of the board of directors is one year and that of an audit & supervisory board member is four years. Members of the board of directors and audit & supervisory board members may serve any number of consecutive terms.
The board of directors may appoint one Chairman of the Board of Directors and one President, as well as one or more Vice Chairmen of the Board and Executive Vice Presidents. The board of directors elects, pursuant to its resolutions, one or more Representative Directors. Each Representative Director represents Toyota generally in the conduct of its affairs. The board of directors has the ultimate responsibility for the administration of Toyota’s affairs. None of Toyota’s members of the board of directors is party to a service contract with Toyota or any of its subsidiaries that provides for benefits upon termination of employment.
109
Under the provisions of the Companies Act, if Toyota decides the terms of an agreement promising that Toyota will compensate a member of the board of directors for all or part of certain expenses incurred by the member of the board of directors, such a decision must be made by a resolution of the board of directors. Under the provisions of the Companies Act, if Toyota decides the terms of an insurance agreement to be executed with an insurer, under which a member of the board of directors is the insured, and which promises that the insurer will compensate for damage arising from the member of the board of directors being held liable in relation to the execution of his or her duties or from a liability claim filed against the member of the board of directors, such decision must be made by a resolution of the board of directors.
Under the Companies Act and Toyota’s articles of incorporation, Toyota may, by a resolution of its board of directors, exempt members of the board of directors (including former members of the board of directors) from their liabilities to Toyota arising in connection with their failure to execute their duties within the limits stipulated by laws and regulations. In addition, Toyota may enter into a liability limitation agreement with each member of the board of directors (excluding executive members of the board of directors, among others) which limits the maximum amount of their liabilities owed to Toyota arising in connection with their failure to execute their duties to an amount equal to the minimum liability limit amount prescribed in the laws and regulations.
Under the Companies Act, Toyota must have at least three audit & supervisory board members. At least half of the audit & supervisory board members are required to be an “outside” audit & supervisory board member, which is any person who satisfies all of the following requirements:
(a) the person has never been a member of the board of directors, accounting counselor (in the case that an accounting counselor is a legal entity, an employee of such entity who is in charge of its affairs), executive officer, manager or employee of Toyota or its subsidiaries during the ten year period before becoming an outside audit & supervisory board member;
(b) if the person was an audit & supervisory board member of Toyota or any of its subsidiaries at any time during the ten year period before becoming an outside audit & supervisory board member, such person has not been a member of the board of directors, accounting counselor (in the case that an accounting counselor is a legal entity, an employee of such entity who is in charge of its affairs), executive officer, manager or employee of Toyota or any of its subsidiaries during the ten year period before becoming an audit & supervisory board member of Toyota or any of its subsidiaries; and
(c) the person is not a spouse or relative within the second degree of kinship of any member of the board of directors or manager or other key employee of Toyota.
The audit & supervisory board members may not at the same time be a member of the board of directors, an accounting counselor (in case that an accounting counselor is a judicial person, a member of such judicial person who is in charge of its affairs), executive officers, general managers or employees of Toyota or any of its subsidiaries. Together, these audit & supervisory board members form the audit & supervisory board. The audit & supervisory board members have the duty to examine the financial statements and business reports which are submitted by the board of directors to the general shareholders’ meeting. The audit & supervisory board members also monitor the administration of Toyota’s affairs by the members of the board of directors. Audit & supervisory board members are not required to be, and Toyota’s audit & supervisory board members are not, certified public accountants. They are required to participate in meetings of the board of directors but are not entitled to vote.
Under the Companies Act and Toyota’s articles of incorporation, Toyota may, by a resolution of its board of directors, exempt audit & supervisory board members (including former audit & supervisory board members) from their liabilities to Toyota arising in connection with their failure to execute their duties within the limits stipulated by laws and regulations. In addition, Toyota may enter into a liability limitation agreement with each audit & supervisory board member which limits the maximum amount of their liabilities owed to Toyota arising
110
in connection with their failure to execute their duties to an amount equal to the minimum liability limit amount prescribed in the laws and regulations.
Toyota does not have a remuneration committee. However, members of Toyota’s Executive Compensation Meeting discuss remuneration for members of the board of directors.
The Executive Compensation Meeting reviews the remuneration system for members of the board of directors and senior management and determines the amount of remuneration for each member of the board of directors, taking into account factors such as corporate performance as well as individual job responsibilities and performance. The members of the meeting are Shigeru Hayakawa, the Vice Chairman of the Board of Directors, and Yoichi Miyazaki, Ikuro Sugawara, Sir Philip Craven, Masahiko Oshima and Emi Osono, each, a Member of the Board of Directors.
6.D EMPLOYEES
The total number of Toyota employees, on a consolidated basis, was 375,235 as of March 31, 2023, 372,817 as of March 31, 2022, and 366,283 as of March 31, 2021. The following tables set forth a breakdown of persons employed by business segment and by geographic location as of March 31, 2023.
Segment |
Number of Employees |
Location |
Number of Employees | |||
Automotive |
332,425 | Japan | 203,212 | |||
Financial services |
13,894 | North America | 59,000 | |||
All other |
22,856 | Europe | 23,730 | |||
Unallocated |
6,060 | Asia | 66,176 | |||
| Other* | 23,117 | |||||
Total |
375,235 |
Total |
375,235 | |||
* “Other” consists of Central and South America, Oceania, Africa and the Middle East. | ||||||
Most regular employees of Toyota Motor Corporation and its consolidated subsidiaries in Japan, other than management, are required to become members of the labor unions that compose the Federation of All Toyota Workers’ Unions. Approximately 86% of Toyota Motor Corporation’s regular employees in Japan are members of this union.
In Japan, basic wages and other working conditions are negotiated annually. In addition, in accordance with Japanese national custom, each employee is also paid a semi-annual bonus. Bonuses are negotiated at the time of wage negotiations and are based on Toyota’s financial results, prospects and other factors. The average wage increase for all union members, excluding bonuses, in Japan was approximately 3.15% in fiscal 2023.
In general, Toyota considers its labor relations with all of its workers to be good. However, Toyota is currently a party to, and otherwise from time to time experiences, labor disputes in some of the countries in which it operates. Toyota does not expect any disputes to which it is currently a party to materially affect Toyota’s consolidated financial position.
Toyota’s average number of temporary employees on a consolidated basis was 94,974 during fiscal 2023.
6.E SHARE OWNERSHIP
For information on the number of shares of Toyota’s common stock held by each member of the board of directors and audit & supervisory board member as of June 2023, see “Item 6. Directors, Senior Management and Employees — 6.A Directors and Senior Management.”
111
None of Toyota’s shares of common stock entitles the holder to any preferential voting rights. As of March 31, 2023, Toyota does not have any stock option plan for which stock options or stock acquisition rights are exercisable or will become exercisable in the future.
Toyota’s board of directors resolves the share compensation within the maximum share compensation amount of 4.0 billion yen per year (also, the total number of Toyota’s shares of common stock to be allotted shall not exceed a maximum of 4 million shares per year in total for eligible members of the board of directors (excluding outside members of the board of directors)) established at the 115th Ordinary General Shareholders’ Meeting held on June 13, 2019 and the 118th Ordinary General Shareholders’ Meeting held on June 15, 2022. The overview of the share compensation is as follows.
Eligible Persons |
Members of the board of directors of Toyota (excluding outside members of the board of directors) | |
Total amount of the share compensation |
Maximum of 4.0 billion yen per year | |
Amount of the share compensation payable to each member of the board of directors |
Set each year considering factors such as corporate results, duties, and performance | |
Type of shares to be allotted and method of allotment |
Issue or disposal of common stock (with transfer restrictions under an allotment agreement) | |
Total number of shares to be allotted |
Maximum of 4,000,000 shares per year in total to eligible members of the board of directors (Provided, however, that if a stock split, including a gratis allotment, or a reverse stock split of Toyota’s common stock is carried out after June 15, 2022, or in case of events that otherwise require an adjustment to the total number of Toyota’s shares of common stock to be issued or disposed of as restricted share compensation, such total number of shares will be adjusted to a reasonable extent.) | |
Amount to be paid |
Determined by the board of directors of Toyota based on the closing price of Toyota’s common stock on the Tokyo Stock Exchange on the business day prior to each resolution of the board of directors, within a range that is not particularly advantageous to eligible members of the board of directors | |
Transfer restriction period |
A period of three to fifty years from the allotment date, which is determined by the board of directors of Toyota in advance | |
Conditions for removal of transfer restrictions |
Restrictions will be removed upon the expiration of the transfer restriction period. However, restrictions will also be removed in the case of expiration of the term of office, death, or other legitimate reasons. | |
Gratis acquisition by Toyota |
Toyota will be able to acquire all allotted shares without consideration in the case of violations of laws and regulations or other reasons specified by the board of directors of Toyota during the transfer restriction period. |
Members of the board of directors of Toyota with foreign citizenship are not eligible for the share compensation.
Toyota also has an employee stock ownership association in Japan for employees and full time and part time company advisors. Members of the employee stock ownership association set aside certain amounts from their
112
monthly salary and bonuses to purchase Toyota’s common stock through the employee stock ownership association. As of March 31, 2023, the employee stock ownership association held 74,266,923 shares of Toyota’s common stock.
ITEM 7. MAJOR SHAREHOLDERS AND RELATED PARTY TRANSACTIONS
7.A MAJOR SHAREHOLDERS
As of March 31, 2023, 16,314,987,460 shares of Toyota’s common stock (of which 2,749,807,731 shares were treasury stock and 13,565,179,729 shares were outstanding) were issued. Toyota resolved at its board of directors meeting held on December 14, 2020 to exercise Toyota’s cash call option to acquire all outstanding Model AA Class Shares and, subject to such acquisition, to cancel all Model AA Class Shares pursuant to the Companies Act. Toyota completed the acquisition of all outstanding Model AA Class Shares on April 2, 2021 and cancelled them on April 3, 2021. Information concerning beneficial ownership of Toyota’s common stock in the table below was prepared from information known to Toyota or that could be ascertained from public filings, including filings made by Toyota’s shareholders regarding their ownership of Toyota’s common stock under the Financial Instruments and Exchange Law of Japan.
Under the Financial Instruments and Exchange Law, any person who becomes, beneficially and solely or jointly, a holder, including, but not limited to, a deemed holder who manages shares for another holder pursuant to a discretionary investment agreement, of more than 5% of the total issued shares of a company listed on a Japanese stock exchange (including American Depositary Shares, or ADSs, representing such shares) must file a report concerning the shareholding with the director of the relevant local finance bureau. A similar report must be filed, with certain exceptions, if the percentage of shares held by a holder, solely or jointly, of more than 5% of the total issued shares of a company increases or decreases by 1% or more, or if any change to a material matter set forth in any previously filed reports occurs.
Based on information known to Toyota or that can be ascertained from public filings, the following table sets forth the beneficial ownership of holders of 5% or more of Toyota’s common stock as of the most recent practicable date.
Name of Beneficial Owner |
Number of Shares of Common Stock (in thousands) |
Percentage of Outstanding Voting Shares of Common Stock |
||||||
Toyota Industries Corporation |
1,192,331 | 8.81 | ||||||
According to The Bank of New York Mellon, depositary for Toyota’s ADSs (the “Depositary”), as of March 31, 2022, 292,036,035 shares of Toyota’s common stock were held in the form of ADSs and there were 1,740 ADS holders of record and 515,686 beneficial owners in the United States. According to Toyota’s register of shareholders, as of March 31, 2023, there were 989,548 holders of common stock of record worldwide. As of March 31, 2023, there were 489 record holders of Toyota’s common stock with addresses in the United States, whose shareholdings represented approximately 9.7% of the issued common stock on that date. Because some of these shares were held by brokers or other nominees, the number of record holders with addresses in the United States might not fully show the number of beneficial owners in the United States.
None of Toyota’s shares of common stock entitles the holder to any preferential voting rights.
Toyota cancelled all of the First Series Model AA Class Shares on April 3, 2021, and as such, there are no holders of First Series Model AA Class Shares.
To the extent known to Toyota, Toyota is not owned or controlled, directly or indirectly, by another corporation, any foreign government or any natural or legal person.
113
Toyota knows of no arrangements the operation of which may at a later time result in a change of control.
Toyota resolved at its board of directors meeting held on May 12, 2021 to split each share of common stock of Toyota as of September 30, 2021, the record date, into five shares, effective October 1, 2021. Toyota decided to do so in order to create an environment in which Toyota shares are more accessible to a broader base of investors by reducing the price per investment unit. In conjunction with the stock split, in accordance with Article 184, Paragraph 2 of the Companies Act, Toyota amended its articles of incorporation to increase the total number of shares of common stock which Toyota is authorized to issue from 10,000,000,000 to 50,000,000,000 on October 1, 2021, the effective date of the stock split.
7.B RELATED PARTY TRANSACTIONS
Business Relationships
Toyota purchases materials, supplies and services, among others, from numerous suppliers throughout the world in the ordinary course of business, including Toyota’s associates and joint ventures accounted for by the equity method and those firms with which certain members of Toyota’s board of directors are affiliated. Toyota purchased materials, supplies and services, among others, from these associates and joint ventures in the amount of ¥9,951.5 billion in fiscal 2023. Toyota also sells its products and services, among others, to Toyota’s associates and joint ventures accounted for by the equity method and firms with which certain members of Toyota’s board of directors are affiliated. Toyota sold products and services, among others, to these associates and joint ventures entities in the amount of ¥3,544.2 billion in fiscal 2023. See note 32 of Toyota’s consolidated financial statements for additional information regarding Toyota’s investments in and transactions with associates and joint ventures.
For a discussion of the Memorandum of Understanding concerning conducting a business combination of Mitsubishi Fuso and Hino Motors, please see “Item 4. Information on the Company — 4.B Business Overview — Selected Initiatives.”
Loans
Toyota regularly has trade accounts and other receivables by, and accounts payable to, Toyota’s associates and joint ventures accounted for by the equity method and firms with which certain members of Toyota’s board of directors are affiliated. Toyota had outstanding trade accounts and other receivables by these associates and joint ventures in the amount of ¥532.6 billion as of March 31, 2023. Toyota had outstanding trade accounts and other payables to these associates and joint ventures in the amount of ¥1,459.9 billion as of March 31, 2023.
Toyota, from time to time, provides short- to medium-term loans to its associates and joint ventures, as well as loans under a loan program established by certain subsidiaries to assist their executives and members of the board of directors with the purchase of homes. As of March 31, 2023, an aggregate amount of ¥179.6 billion in loans was outstanding to its associates and joint ventures accounted for by the equity method. Toyota believes that each of these loans was entered into in the ordinary course of business.
7.C INTERESTS OF EXPERTS AND COUNSEL
Not applicable.
ITEM 8. FINANCIAL INFORMATION
8.A CONSOLIDATED STATEMENTS AND OTHER FINANCIAL INFORMATION
1-3. |
Consolidated Financial Statements. Toyota’s audited consolidated financial statements are included under “Item 18 — Financial Statements.” Except for Toyota’s consolidated financial statements included under Item 18, no other information in this annual report has been audited by Toyota’s auditors. |
114
| 4. | Not applicable. |
| 5. | Not applicable. |
| 6. | Export Sales. See “Item 5. Operating and Financial Review and Prospects — 5.A Operating Results — Overview — Geographic Breakdown.” |
| 7. | Legal and Arbitration Proceedings. See “Item 4. Information on the Company — 4.B Business Overview — Legal Proceedings.” |
| 8. | Dividend Information. |
Toyota normally pays dividends twice per year, including an interim dividend and a
year-end
dividend. Toyota’s articles of incorporation provide that retained earnings can be distributed as dividends pursuant to a resolution of its board of directors. Toyota’s board of directors resolves to pay year-end
dividends to holders of common stock and registered pledgees of common stock of record as of March 31, the record date, in each year. At the 111th Ordinary General Shareholders’ Meeting held in June 2015, Toyota’s shareholders approved amendments to Toyota’s articles of incorporation permitting the issuance of Model AA Class Shares in the future. Toyota resolved at its board of directors meeting held on December 14, 2020 to exercise Toyota’s cash call option to acquire all outstanding First Series Model AA Class Shares and, subject to such acquisition, to cancel all First Series Model AA Class Shares pursuant to the Companies Act. Toyota completed the acquisition of all outstanding First Series Model AA Class Shares on April 2, 2021 and cancelled them on April 3, 2021. At the 117th Ordinary General Shareholders’ Meeting held in June 2021, Toyota’s shareholders approved amendments to Toyota’s articles of incorporation to, among other things, eliminate the First Series Model AA Class Shares through the Fifth Series Model AA Class Shares as classes of Toyota’s capital stock, effective June 16, 2021. Prior to the June 16, 2021 amendment, the articles of incorporation provided that, in the event that Toyota paid a
year-end
dividend to holders of common stock, it would pay a year-end
dividend to any holders of Model AA Class Shares or registered pledgees of Model AA Class Shares of record as of the record date for the year-end
dividend, in the amount payable on the Model AA Class Shares pursuant to their terms (“AA Dividends”), in preference to holders of common stock or registered pledgees of common stock. In addition to these
year-end
dividends, Toyota may pay an interim dividend in the form of cash distributions from its distributable surplus to holders of common stock and pledgees of common stock of record as of September 30, the record date, in each year by a resolution of its board of directors. Prior to the June 16, 2021 amendment, the articles of incorporation provided that, in the event that Toyota paid such interim dividends, Toyota would pay an amount equivalent to one-half
of the AA Dividends as an interim dividend to any holders of Model AA Class Shares or registered pledgees of Model AA Class Shares of record as of the record date for the interim dividend, in preference to holders of common stock or registered pledgees of common stock. In addition, under the Companies Act, dividends may be paid to holders of common stock and pledgees of record of common stock as of any record date, other than those specified above, as set forth in Toyota’s articles of incorporation or as determined by its board of directors from time to time. Under the Companies Act, dividends may be distributed in cash or (except in the case of interim dividends mentioned in the third preceding paragraph) in kind, subject to limitations on distributable surplus and to certain other conditions.
115
The following table sets forth the dividends declared per share of common stock by Toyota for each of the periods shown. The periods shown are the six months ended on that date. The U.S. dollar equivalents for the cash dividends shown are based on the noon buying rate for Japanese yen on the last date of each period set forth below.
Cash Dividends per Common Share |
||||||||
Period Ended |
Yen |
U.S. dollars |
||||||
September 30, 2020 |
105.0 | 0.99 | ||||||
March 31, 2021 |
135.0 | 1.22 | ||||||
September 30, 2021 |
120.0 | 1.07 | ||||||
March 31, 2022 |
|
28.0 <140.0 |
> |
|
0.23 <1.15 |
> | ||
September 30, 2023 |
|
25.0 <125.0 |
> |
|
0.17 <0.86 |
> | ||
March 31, 2023 |
35.0 | 0.26 | ||||||
| <175.0 | >* | <1.32 | >* | |||||
| * | The numbers in angle brackets are calculated based on a “pre-stock split” basis, that is, on the assumption that the five-for-one |
Toyota deems improving shareholder returns as one of its priority management policies, and it will continue to work to improve its corporate culture to realize sustainable growth in order to enhance its corporate value. Toyota will strive for the stable and continuous increase of dividends.
With a view to surviving tough competition and transitioning to a mobility company, Toyota will aim to utilize its internal funds mainly for investment in growth for the next generation, such as environmental technologies to achieve a carbon-neutral society and safety technologies for the safety and security of its customers, and also for the stakeholders such as employees, business partners and local communities.
Considering these factors, with respect to the dividends for fiscal 2023, Toyota has determined to pay a
year-end
dividend of 35 yen (175 yen on a pre-stock
split basis) per share of common stock by a resolution of the board of directors pursuant to Toyota’s articles of incorporation. As a result, combined with the interim dividend of 25 yen (125 yen on a pre-stock
split basis) per share of common stock, the annual dividend will be 60 yen (300 yen on a pre-stock
split basis) per share of common stock, and the total amount of the dividends on common stock for the year will be 816.9 billion yen. Furthermore, Toyota resolved, at its board of directors meeting held on May 10, 2023, to repurchase up to 120 million shares of its common stock between June 17, 2022 and September 30, 2022 at a total maximum purchase price of 150 billion yen.
Toyota intends to repurchase shares flexibly by taking into consideration the price level of its common stock and other factors.
8.B SIGNIFICANT CHANGES
Except as disclosed in this annual report, there have been no significant changes since the date of Toyota’s latest annual financial statements.
ITEM 9. THE OFFER AND LISTING
9.A LISTING DETAILS
Shares of Toyota common stock are traded on the Prime Market of the Tokyo Stock Exchange and the Nagoya Stock Exchange under the ticker symbol “7203” in Japan, and on the London Stock Exchange under the
116
ticker symbol “TYT.” Toyota’s ADSs, each representing ten shares of Toyota common stock, are listed on the New York Stock Exchange, or NYSE, under the ticker symbol “TM.”
9.B PLAN OF DISTRIBUTION
Not applicable.
9.C MARKETS
The primary trading market for Toyota’s common stock is the Prime Market of the Tokyo Stock Exchange. The common stock is also listed on the Nagoya Stock Exchange and on the London Stock Exchange.
Since September 29, 1999, American Depositary Shares, each equal to ten shares of Toyota’s common stock, have been traded and listed on the New York Stock Exchange through a sponsored ADS facility operated by The Bank of New York Mellon, as Depositary. Prior to that time, Toyota’s ADSs were listed on the Nasdaq SmallCap Market through five unsponsored ADS facilities.
9.D SELLING SHAREHOLDERS
Not applicable.
9.E DILUTION
Not applicable.
9.F EXPENSES OF THE ISSUE
Not applicable.
ITEM 10. ADDITIONAL INFORMATION
10.A SHARE CAPITAL
Toyota resolved at its board of directors meeting held on May 12, 2021 to split each share of common stock of Toyota as of September 30, 2021, the record date, into five shares, effective October 1, 2021. Toyota decided to do so in order to create an environment in which Toyota shares are more accessible to a broader base of investors by reducing the price per investment unit.
In conjunction with the stock split, in accordance with Article 184, Paragraph 2 of the Companies Act, Toyota amended its articles of incorporation to increase the total number of shares of common stock which Toyota is authorized to issue from 10,000,000,000 to 50,000,000,000 on October 1, 2021, the effective date of the stock split.
10.B MEMORANDUM AND ARTICLES OF ASSOCIATION
Except as otherwise stated, set forth below is information relating to Toyota’s common stock, including brief summaries of the relevant provisions of Toyota’s articles of incorporation and share handling regulations, as currently in effect, and of the Companies Act, Act Concerning Book-Entry Transfer of Corporate Bonds, Shares and Other Securities and related legislation.
General
Toyota’s authorized number of shares as of March 31, 2023 was 50,000,000,000 shares, of which 16,314,987,460 shares of common stock have been issued. In conjunction with the cancellation of all of the Model AA Class Shares on April 3, 2021, Toyota’s articles of incorporation were amended at the 117th Ordinary General Shareholders’ Meeting held in June 2021.
117
Toyota does not issue share certificates for its shares. In accordance with the Companies Act, the Book-Entry Transfer Act and Toyota’s articles of incorporation, Toyota’s common stock are recorded or registered on (i) Toyota’s register of shareholders and (ii) transfer account books of the Japan Securities Depository Center, Inc. (“JASDEC”) which is a book-entry transfer institution, and securities firms, banks or other account management institutions. The transfer of common stock will generally become effective once the transfer is recorded in the transferee’s account. There are no restrictions imposed by Toyota’s articles of incorporation or share handling regulations on the transfer of common stock. In order to assert shareholders’ rights against Toyota, a shareholder must generally have his or her name and address recorded or registered on Toyota’s register of shareholders. A holder of common stock can assert minority shareholders’ rights (shareholders’ rights for which Toyota has not set a record date) against Toyota if JASDEC provides an individual shareholder notice to Toyota upon the shareholder’s request. The shareholder of deposited shares underlying the ADSs is the Depositary for the ADSs. Accordingly, holders of ADSs will not be able directly to assert shareholders’ rights.
A holder of common stock must have a transfer account to transfer shares. Holders of common stock who do not have a transfer account with JASDEC must have an account with an account management institution that directly or indirectly has a transfer account with JASDEC. Once Toyota decides on the record date for its shareholders’ meeting or makes a request to JASDEC based on justifiable grounds, JASDEC will promptly provide to Toyota names, addresses and other information with respect to the holders of Toyota’s common stock who are recorded on the transfer account books of JASDEC or account management institutions. Upon receiving such information, Toyota will record or register such information received from JASDEC on its register of shareholders. Accordingly, holders of common stock recorded or registered on Toyota’s register of shareholders will be treated as holders of common stock of Toyota and may exercise rights, such as voting rights, and will receive dividends (if any) and notices to holders of common stock directly from Toyota. Holders of common stock wishing to assert minority shareholders’ rights against Toyota must request an individual shareholder notice to JASDEC or the account management institution at which the shareholder has opened a transfer account. In response to such request, JASDEC will provide the individual shareholders notice to Toyota. A holder of common stock may assert his or her minority shareholders’ rights against Toyota for a period of four weeks after the date the individual shareholder notice is provided to Toyota. The shares held by a person who is deemed to hold additional shares according to the transfer account books are aggregated for these purposes.
Corporate Purpose
Article 2 of Toyota’s articles of incorporation states that its purpose is to engage in the following businesses:
| • | the manufacture, sale, leasing and repair of: |
| • | motor vehicles, industrial vehicles, ships, aircraft, other transportation machinery and apparatus, spacecraft and space machinery and apparatus, and parts thereof; |
| • | industrial machinery and apparatus, other general machinery and apparatus, and parts thereof; |
| • | electrical machinery and apparatus, and parts thereof; and |
| • | measuring machinery and apparatus, medical machinery and apparatus, and parts thereof; |
| • | the manufacture and sale of ceramics and products of synthetic resins, and materials thereof; |
| • | the manufacture, sale and repair of construction materials and equipment, furnishings and fixtures for residential buildings; |
| • | the planning, designing, supervision, execution and undertaking of construction works, civil engineering works, land development, urban development and regional development; |
| • | the sale, purchase, leasing, brokerage and management of real estate; |
| • | the service of information processing, information communications and information supply and the development, sale and leasing of software; |
118
| • | the design and development of product sales systems that utilize networks such as the Internet, sale, leasing and maintenance of computers included within such systems, and sale of products by utilizing such systems; |
| • | the inland transportation, marine transportation, air transportation, stevedoring, warehousing and tourism businesses; |
| • | the printing, publishing, advertising and publicity, general leasing, security and workers dispatch businesses; |
| • | the credit card operations, purchase and sale of securities, investment consulting, investment trust operation, and other financial services; |
| • | the operation and management of such facilities as parking lots, showrooms, educational facilities, medical care facilities, sports facilities, marinas, airfields, food and drink stands and restaurants, lodging facilities, retail stores and others; |
| • | the non-life insurance agency business and the life insurance agency business; |
| • | the production and processing by using biotechnology of agricultural products including trees, and the sale of such products; |
| • | the power generation and the supply and sale of electric power; |
| • | the sale of goods related to each of the preceding items and mineral oil; |
| • | the conducting of engineering, consulting, invention and research relating to each of the preceding items and the utilization of such invention and research; and |
| • | any businesses incidental to or related to any of the preceding items. |
Dividends
Dividends — General
Toyota normally pays dividends twice per year, including an interim dividend and a
year-end
dividend. Toyota’s articles of incorporation provide that retained earnings can be distributed as dividends pursuant to a resolution of its board of directors. Toyota’s board of directors resolves to pay year-end
dividends to shareholders and registered pledgees of record as of March 31, the record date, in each year. In addition to these
year-end
dividends, Toyota may pay an interim dividend in the form of cash distributions from its distributable surplus to holders of stock and pledgees of stock of record as of September 30, the record date, in each year by a resolution of its board of directors. In addition, under the Companies Act, dividends may be paid to shareholders and pledgees of record as of any record date, other than those specified above, as set forth by Toyota’s articles of incorporation or as determined by its board of directors from time to time. Under the Companies Act, dividends may be distributed in cash or (except in the case of interim dividends mentioned in the second preceding paragraph) in kind, subject to limitations on distributable surplus and to certain other conditions.
Dividends — Distributable Amount
Under the Companies Act, Toyota is permitted to make distributions of surplus to the extent that the aggregate book value of the assets to be distributed to shareholders does not exceed the distributable amount provided for by the Companies Act and the ordinance of the Ministry of Justice as at the effective date of such distribution of surplus.
The amount of surplus at any given time shall be the amount of Toyota’s assets and the book value of Toyota’s treasury stock after subtracting and adding the amounts of items provided for by the Companies Act and
119
the ordinance of the Ministry of Justice, and the amount of surplus distributable for dividends is calculated by adding to and subtracting from this amount the amounts of items provided for by the Companies Act and the ordinance of the Ministry of Justice.
Dividends — Prescription
Under its articles of incorporation, Toyota is not obligated to pay any dividends in cash which are left unclaimed for a period of three years after the date on which they first became payable.
Capital Accounts
The amount of the cash or assets paid or contributed by subscribers for new shares (with certain exceptions) is required to be accounted for as stated capital, although Toyota may account for an amount not exceeding
one-half
of such cash or assets as additional paid-in
capital. Under the Companies Act, Toyota may reduce its additional
paid-in
capital and legal reserve without limitation on the amount to be reduced, generally, by a resolution of a general shareholders’ meeting and if so decided by the same resolution, may account for the whole or any part of the amount of the reduction of additional paid-in
capital as stated capital. The whole or any part of surplus which may be distributed as dividends may also be transferred to stated capital by a resolution of a general shareholders’ meeting. Stock Splits
Toyota may at any time split the outstanding shares into a greater number of shares by a resolution of the board of directors. Toyota must give public notice of the stock split, specifying a record date for the stock split, not less than two weeks prior to the record date.
Consolidation of Shares
Toyota may at any time consolidate shares in issue into a smaller number of shares by a special shareholders resolution (as defined in “Voting Rights”). When a consolidation of shares is to be made, Toyota must give public notice of certain matters two weeks prior to the effective date of the consolidation.
Japanese Unit Share System
General
Voting Rights under the Unit Share System
Purchase by Toyota of Shares Constituting Less Than a Unit
Voting Rights
Toyota holds its ordinary general shareholders’ meeting each year. In addition, Toyota may hold an extraordinary general shareholders’ meeting whenever necessary by giving at least two weeks’ advance notice.
120
Under the Companies Act, notice of any shareholders’ meeting must be given to each shareholder having voting rights or, in the case of a
non-resident
shareholder, to his or her resident proxy or mailing address in Japan in accordance with Toyota’s share handling regulations, at least two weeks prior to the date of the meeting. Holders of common stock shall have voting rights exercisable at a general shareholders’ meeting. A holder of shares constituting one or more whole units is entitled to one vote per unit of shares subject to the limitations on voting rights set forth in this paragraph. In general, under the Companies Act, a resolution can be adopted at a general shareholders’ meeting by a majority of the shares having voting rights represented at the meeting. The Companies Act and Toyota’s articles of incorporation require a quorum for the election of members of the board of directors and audit & supervisory board members of not less than
one-third
of the total number of outstanding shares having voting rights. Toyota’s shareholders are not entitled to cumulative voting in the election of members of the board of directors. A corporate shareholder, the management of which is substantially under Toyota’s control as provided by an ordinance of the Ministry of Justice, either through the holding of voting rights or for any other reason, does not have voting rights. Under the Companies Act, Toyota shall implement the electronic provision measures (“Electronic Provision”) for the information contained in the reference materials, etc. for general shareholders’ meetings.
The convocation notice of shareholders’ meeting must set forth the information contained in the reference materials, etc. for general shareholders’ meetings being provided through the Electronic Provision and the URL of the website used for the Electronic Provision, in addition to the place, the time and the purpose of the meeting. The information contained in the reference materials, etc. for general shareholders’ meetings must be posted on a website from the earlier of the date three weeks prior to the date set for the meeting or the date on which the convocation notice of shareholders’ meeting is dispatched until the date on which three months have elapsed from the meeting. In general, any shareholder is entitled to request printed paper copies of the information contained in the reference materials, etc. for general shareholders’ meetings by the record date for voting rights at the relevant general shareholders’ meeting.
Shareholders may exercise their voting rights by attending the general shareholders’ meeting or in writing by mail. Shareholders who choose to exercise their voting rights by mail must fill out and return to Toyota the voting right exercise form enclosed with the convocation notice of the general shareholders’ meeting by the date specified in such convocation notice. In addition, from the general shareholders’ meeting for fiscal 2009, shareholders may exercise their voting rights through the internet. Shareholders electing to exercise their voting rights through the internet must log on to the “Website to Exercise Voting Rights” using the login ID and temporary password provided in the voting right exercise form enclosed with the convocation notice and submit their votes by a date specified in the convocation notice, following instructions appearing on the website. Institutional investors may also use the Electronic Proxy Voting Platform operated by Investor Communications Japan to exercise their voting rights through the use of the Internet, if such institutional investor applies to use the platform in advance. Shareholders may also exercise their voting rights through proxies, provided that those proxies are also shareholders who have voting rights. Toyota may refuse a shareholder having two or more proxies attend a general shareholders’ meeting.
The Companies Act provides that a quorum of at least
one-third
of outstanding shares with voting rights must be present at a shareholders’ meeting to approve any material corporate actions such as: | (1) | any amendment of the articles of incorporation with certain exceptions in which a shareholders’ resolution is not required; |
| (2) | acquisition of its own shares from a specific party; |
| (3) | consolidation of shares; |
| (4) | any issue or transfer of its shares at a “specially favorable” price (or any issue of stock acquisition rights or bonds with stock acquisition rights at “specially favorable” conditions by Toyota) to any persons other than shareholders; |
121
| (5) | the removal of an audit & supervisory board member; |
| (6) | the exemption of liability of a director or audit & supervisory board member with certain exceptions; |
| (7) | a reduction of stated capital which meets certain requirements with certain exceptions; |
| (8) | a distribution of in-kind dividends which meets certain requirements; |
| (9) | dissolution, merger, or consolidation with certain exceptions in which a shareholders’ resolution is not required; |
| (10) | the transfer of the whole or a material part of the business; |
| (11) | the transfer in entirety or in part of shares or equity interest of a subsidiary under certain conditions; |
| (12) | the taking over of the entire business of any other corporation with certain exceptions in which a shareholders’ resolution is not required; |
| (13) | share exchange or share transfer for the purpose of establishing 100% parent-subsidiary relationships with certain exceptions in which a shareholders’ resolution is not required; |
| (14) | company split with certain exceptions in which a shareholders’ resolution is not required; or |
| (15) | share delivery with certain exceptions in which a shareholders’ resolution is not required. |
At least
two-thirds
of the shares having voting rights represented at the meeting must approve these actions. The voting rights of holders of ADSs are exercised by the Depositary based on instructions from those holders.
Rights to be Allotted Shares
Shareholders have no preemptive rights under Toyota’s articles of incorporation. Under the Companies Act, the board of directors may, however, determine that shareholders shall be given rights to be allotted shares or stock acquisition rights on request in connection with a particular issue or transfer of shares, or issue of stock acquisition rights, respectively. In this case, such rights must be given on uniform terms to all shareholders as of a specified record date by at least two weeks’ prior public notice to shareholders of the record date.
Rights to be allotted shares are nontransferable. However, a shareholder may be allotted stock acquisition rights without consideration thereto, and may transfer such rights.
Liquidation Rights
In the event of a liquidation of Toyota, the assets remaining after payment of all debts, liquidation expenses and taxes will be distributed among the shareholders or registered pledgees in proportion to the respective number of shares they own.
Liability to Further Calls or Assessments
All of Toyota’s currently outstanding shares, including shares represented by the ADSs, are fully paid and nonassessable.
Transfer Agent
Mitsubishi UFJ Trust and Banking Corporation is the transfer agent for all shares. Mitsubishi UFJ Trust and Banking Corporation’s office is located at
4-5,
Marunouchi 1-chome,
Chiyoda-ku,
Tokyo, 100-8212
Japan. Mitsubishi UFJ Trust and Banking Corporation maintains Toyota’s register of shareholders and records transfers of record ownership (in the case of common stock, upon receiving notification from JASDEC). 122
Record Date
The close of business on March 31 is the record date for Toyota’s
year-end
dividends, if paid. A holder of shares constituting one or more whole units who is recorded or registered as a holder on Toyota’s register at the close of business as of March 31 is also entitled to exercise shareholders’ voting rights at the ordinary general shareholders’ meeting with respect to the business year ending on March 31. The close of business on September 30 of each year is the record date for interim dividends, if paid. In addition, Toyota may set a record date for determining the shareholders entitled to other rights and for other purposes by giving at least two weeks’ prior public notice. The shares generally trade
ex-dividend
or ex-rights
on the Japanese stock exchanges on the business day preceding a record date (or if the record date is not a business day, one business day prior thereto), for the purpose of dividends or rights offerings. Acquisition by Toyota of Shares
Toyota may acquire its own shares (i) through a stock exchange on which such shares are listed or by way of tender offer (pursuant to an ordinary resolution of a general shareholders’ meeting or a resolution of the board of directors), (ii) by purchase from a specific party (pursuant to a special resolution of a general shareholders’ meeting) or (iii) from a subsidiary of Toyota (pursuant to a resolution of the board of directors). When such acquisition of shares is made by Toyota from a specific party other than a subsidiary of Toyota, any other shareholder may make a demand to a representative director, more than five calendar days prior to the relevant shareholders’ meeting, that Toyota also purchase the shares held by such holder. However, the acquisition of its own shares at a price not exceeding the market price to be provided under an ordinance of the Ministry of Justice will not trigger the right of any shareholder to include him/her as the seller of his/her shares in such proposed purchase.
Any acquisition of shares must satisfy certain requirements that the total amount of the acquisition price may not exceed the amount of the distributable dividends. See “Item 10. Additional Information — 10.B Memorandum and Articles of Association — Dividends.”
Shares acquired by Toyota may be held by it for any period or may be cancelled by resolution of the board of directors. Toyota may also transfer to any person the shares held by it, subject to a resolution of the board of directors, and subject also to other requirements applicable to the issuance of new shares. Toyota may also utilize its treasury stock for the purpose of transfer to any person upon exercise of stock acquisition rights or for the purpose of acquiring another company by way of merger, share exchange or corporate split through exchange of treasury stock for shares or assets of the acquired company.
The Companies Act generally prohibits any subsidiary of Toyota from acquiring shares of Toyota.
Report of Substantial Shareholdings
The Financial Instruments and Exchange Law of Japan and regulations under the Law require any person who has become a holder (together with its related persons) of more than 5% of the total issued shares of a company listed on any Japanese stock exchange (including ADSs representing such shares) to file with the Director of a competent Local Finance Bureau, within five business days, a report concerning those shareholdings. A similar report must also be filed to reflect any change of 1% or more in any shareholding or any change in material matters set out in reports previously filed. Any such report shall be filed with the Director of a competent Local Finance Bureau through the Electronic Disclosure for Investor’s Network (“EDINET”) system. For this purpose, shares issuable to a shareholder upon exercise of stock acquisition rights are taken into account in determining both the number of shares held by that stock acquisition rights holder and the company’s total issued shares.
123
10.C MATERIAL CONTRACTS
All material contracts concluded by Toyota during the two years preceding this filing were entered into in the ordinary course of business.
10.D EXCHANGE CONTROLS
The following is a general summary of major Japanese foreign exchange control regulations applicable to holders of shares of capital stock or voting rights (including ADSs) of Toyota, and to others intending to consummate other actions such as obtaining consent from other investors holding voting rights and consenting to certain proposals at a general shareholders meeting, who are “exchange
non-residents”
or “foreign investors,” as described below. The statements regarding Japanese foreign exchange control regulations set forth below are based on the laws and regulations in force and as interpreted by the Japanese authorities as of the date of this annual report and are subject to subsequent changes in the applicable Japanese laws or interpretations thereof. This summary is not exhaustive of all possible foreign exchange control considerations that may apply to a particular investor, and potential investors are advised to satisfy themselves as to the overall foreign exchange control consequences of the acquisition, ownership and disposition of shares of capital stock or voting rights of Toyota by consulting their own advisors. The Foreign Exchange and Foreign Trade Act of Japan (Act No. 228 of 1949, as amended, the “FEFTA”) and the cabinet orders and ministerial ordinances thereunder (collectively, the “Foreign Exchange Regulations”) govern the acquisition and holding of shares of capital stock and voting rights of Toyota by “exchange
non-residents”
and by “foreign investors.” The Foreign Exchange Regulations currently in effect do not, however, affect transactions between exchange non-residents
to purchase or sell shares outside Japan using currencies other than Japanese yen. Exchange
non-residents
are: | (i) | individuals who do not reside in Japan; and |
| (ii) | corporations whose principal offices are located outside Japan. |
Generally, branches and other offices of
non-resident
corporations that are located within Japan are regarded as residents of Japan. Conversely, branches and other offices of Japanese corporations located outside Japan are regarded as exchange non-residents.
Foreign investors are:
| (i) | individuals who are exchange non-residents; |
| (ii) | corporations or other organizations that are organized under the laws of foreign countries or whose principal offices are located outside of Japan; |
| (iii) | Japanese corporations of which 50% or more of their total voting rights are held directly or indirectly by individuals who are exchange non-residents and/or corporations or other organizations falling within (i) and/or (ii) above; |
| (iv) | partnerships under the Civil Code of Japan (Act No. 89 of 1896, as amended) established to invest in corporations, limited partnerships for investment under the Limited Partnership Act for Investment of Japan (Act No. 90 of 1998, as amended), or any other similar partnerships under foreign law, of which (a) 50% or more of the total contributions are made by individuals and/or corporations falling within (i), (ii), (iii) above and/or (v) below or any other persons prescribed under the Foreign Exchange Regulations or (b) a majority of the general partners are individuals and/or corporations falling within (i), (ii), (iii) above and/or (v) below or any other persons prescribed under the Foreign Exchange Regulations; and |
124
| (v) | corporations or other organizations, a majority of whose officers, or officers having the power of representation, are individuals who are exchange non-residents. |
Acquisition of Shares
In general, the acquisition of shares of a Japanese company (such as the shares of capital stock of Toyota) by an exchange
non-resident
from a resident of Japan is not subject to any prior filing requirements (other than those relating to an “inward direct investment” set out below). In certain limited circumstances, however, the Minister of Finance may require prior approval of an acquisition of this type. While prior approval, as described above, is not required in general, in the case where a resident of Japan transfers shares of a Japanese company (such as the shares of capital stock of Toyota) for consideration exceeding ¥100 million to an exchange non-resident,
the resident of Japan who transfers the shares is required to report the transfer to the Minister of Finance within 20 days from the date of the transfer or the date of receipt of payment, whichever comes later, unless (i) the transfer was made through a bank or financial instruments business operator licensed or registered under Japanese law or other entity prescribed by the Foreign Exchange Regulations acting as an agent or intermediary or (ii) the acquisition constitutes an “inward direct investment” described below. Inward Direct Investment in Shares of Listed Companies
On May 8, 2020, an amendment to the Foreign Exchange Regulations came into effect. Upon the full implementation of the Amendment as of June 7, 2020, the requirements and procedures regarding the prior notifications of inward direct investments to the Minister of Finance and any other competent Ministers under the FEFTA, were amended. After the implementation of the Amendment, Japanese listed companies are classified into the following categories:
| (i) | companies engaged in businesses excluding certain businesses designated by the Foreign Exchange Regulations as designated businesses (the “Designated Businesses”); |
| (ii) | companies engaged in Designated Businesses designated by the Foreign Exchange Regulations as core sector businesses (the “Core Sector Designated Businesses”); and |
| (iii) | corporations engaged in Designated Businesses other than the Core Sector Designated Businesses (the “Non-Core Sector Designated Businesses”). |
For reference purposes only, the Minister of Finance publishes, and may update from time to time, a list that classifies Japanese listed companies into the above categories. According to the list published by the Minister of Finance as of April 24, 2023, the businesses which are currently engaged in by Toyota are classified as category (ii) i.e., the Core Sector Designated Businesses above.
Definition of Inward Direct Investment
If a foreign investor acquires shares or voting rights of a Japanese company that is listed on a Japanese stock exchange (such as the shares of capital stock of Toyota) and, as a result of the acquisition, the foreign investor, in combination with any existing holdings, directly or indirectly holds 1% or more of the issued shares or the total number of voting rights of the relevant company, such acquisition constitutes an “inward direct investment.” In addition, an acquisition of the authority to exercise, or instruct to exercise, voting rights held by other shareholders that results in the foreign investor, in combination with any existing shareholding, directly or indirectly holding 1% or more of the total number of voting rights of the relevant company constitutes an “inward direct investment.” Furthermore, if a foreign investor manages, on a discretionary basis, shares or voting rights of a Japanese company that is listed on a Japanese stock exchange and in combination with any existing management, directly or indirectly manages 1% or more of the issued shares or the total number of voting rights of the relevant company, such discretionary investment management generally constitutes an “inward direct investment.”
125
In addition to the acquisitions of shares or voting rights described above, if a foreign investor (i) is granted the authority to exercise proxy voting rights on behalf of other shareholders of the relevant company regarding certain matters which may control substantially or have a material influence on the management of such company, such as the election or removal of directors, or (ii) obtains consent from another foreign investor holding the voting rights of the relevant company to exercise the voting rights of such company jointly, and, in each case, as a result of these arrangements, the number of the voting rights directly or indirectly held by the foreign investor, including the total number of the voting rights subject to such proxy, or the sum of the number of the voting rights directly or indirectly held by the foreign investor and such other foreign investors subject to such joint voting agreement, as the case may be, is 10% or more of the total number of voting rights of the relevant company, each such arrangement regarding voting rights (hereinafter referred to as a “voting arrangement”) also constitutes an “inward direct investment.” Additionally, if a foreign investor who directly or indirectly holds 1% or more of the total voting rights of a Japanese listed company consents, at a general meeting of shareholders, to certain proposals having a material influence on the management of such company such as (i) election of such foreign investor or its related persons (as defined in the Foreign Exchange Regulations) as directors or audit & supervisory board members of the relevant company or (ii) transfer or discontinuation of its business, such consent will also constitute an “inward direct investment.”
Prior Notification Requirements
If a foreign investor intends to consummate an “inward direct investment” as described above, in certain circumstances, such as where the foreign investor is in a country that is not listed on an exemption schedule in the Foreign Exchange Regulations or where that Japanese company is engaged (as Toyota is currently) in one or more Designated Businesses, prior notification of the relevant inward direct investment must be filed with the Minister of Finance and any other competent Ministers.
However, a foreign investor seeking to consummate an “inward direct investment” may be eligible for the exemptions, if certain conditions are met.
In the case of an acquisition (including investment discretionary management) of shares or voting rights or the authority to exercise, directly or through instructions, voting rights of a Japanese listed company that is engaged (as Toyota is currently) in one or more Core Sector Designated Businesses, the foreign investor may be exempted from the prior notification requirement, if, as a result of such acquisition, the foreign investor directly or indirectly holds less than 10% of the total number of issued shares or voting rights of the relevant company, and such foreign investor complies with the following conditions:
| (i) | the foreign investor or its closely-related persons (as defined in the Foreign Exchange Regulations) will not become directors or audit & supervisory board members of the relevant company; |
| (ii) | the foreign investor will not make certain proposals (as prescribed in the Foreign Exchange Regulations) at a general meeting of shareholders, including transfer or discontinuation of the Designated Businesses of the relevant company; |
| (iii) | the foreign investor will not access non-public technical information in relation to the Designated Businesses of the relevant company, or take certain other actions that may lead to the leak of such non-public technical information (as prescribed in the Foreign Exchange Regulations); |
| (iv) | the foreign investor will not attend, and will not cause any persons designated by it to attend, meetings of the relevant company’s board of directors, or meetings of committees having authority to make important decisions, in respect of the Core Sector Designated Businesses of the relevant company; and |
| (v) | the foreign investor will not make, and will not cause any persons designated by it to make, proposals to such board or committees or their members in writing or electronic form requesting any response or actions by certain deadlines in respect of the Core Sector Designated Businesses of the relevant company. |
126
In addition, in the case of an acquisition (including investment discretionary management) of shares or voting rights or the authority to exercise, either directly or through instructions, voting rights of a Japanese listed company that is engaged in one or more
Non-Core
Sector Designated Businesses, the foreign investor may be exempted from the prior notification requirement, including in the case where, as a result of such acquisition, the foreign investor holds 10% or more of the total number of issued shares or the total number of voting rights of the relevant company, which would have required prior notification, if such foreign investor complies with the conditions (i) through (iii) above (the “Exemption Conditions”). Notwithstanding the above, if a foreign investor falls under a category of disqualified investors designated by the Foreign Exchange Regulations (including (a) investors who have records of certain sanctions due to violations of the FEFTA and (b) certain investors who are state-owned enterprises or other related entities excluding those who are accredited by the Minister of Finance), in no event may such foreign investor be eligible for the exemptions described above. On the other hand, if a foreign investor, excluding the disqualified investors described in the foregoing sentence, falls under a category of certain foreign financial institutions (as prescribed in the Foreign Exchange Regulations) and complies with the Exemption Conditions, such foreign investor may be eligible for the exemptions, even if the acquisition results in such foreign investor’s directly or indirectly holding 10% or more of the total number of issued shares or voting rights of a corporation engaged in one or more Core Sector Designated Businesses.
In addition, if a foreign investor intends to make a voting arrangement with respect to a Japanese listed company engaged one or more Designated Businesses or consents to a proposal at a general meeting of shareholders of such company, in each case, that constitutes an “inward direct investment” as described above, in certain circumstances, prior notification of the relevant inward direct investment must be filed with the Minister of Finance and any other competent Ministers. However, the exemptions from the prior notification requirements may be available in the cases where the relevant voting arrangement is regarding matters other than certain matters which may control substantially or have a material influence on the management of the relevant company, such as the election or removal of directors, which would have required prior notification.
Acquisitions of shares by foreign investors by way of stock split are not subject to the foregoing notification requirements.
Procedures for Prior Notification
If such prior notification is filed, the proposed inward direct investment may not be consummated until after 30 days have passed from the date of filing, although this screening period may be shortened to two weeks unless such Ministers deem it necessary to review the proposed inward direct investment. The Ministers may extend the screening period up to five months if they deem it necessary to review the proposed inward direct investment and may recommend any modification or abandonment of the proposed inward direct investment and, if the foreign investor does not accept such recommendation, the Ministers may order the modification or abandonment of such inward direct investment. In addition, if the Ministers consider the proposed inward direct investment to be an inward direct investment that is likely to cause damage to the national security of Japan and, if a foreign investor (i) consummates such inward direct investment without filing the prior notification described above; (ii) consummates such inward direct investment before the expiration of the screening period described above; (iii) in connection with such inward direct investment, makes false statements in the prior notification described above; or (iv) does not follow the recommendation or order issued by the Ministers to modify or abandon such inward direct investment, the Ministers may order such foreign investor to dispose of all or part of the shares acquired or take other measures.
Post Facto Reporting Requirements
A foreign investor who consummates an inward direct investment as described above relating to a Japanese listed company that is engaged in one or more Designated Businesses, but is not subject to the prior notification
127
requirements described above due to the exemptions from such prior notification requirements, in general, must file a report of the relevant inward direct investment with the Minister of Finance and any other competent Ministers having jurisdiction over such Japanese company within 45 days of such inward direct investment when, as a result of such acquisition, the foreign investor (excluding, in the cases of (i) and (ii) below, a foreign investor who falls under a category of certain foreign financial institutions (as prescribed in the Foreign Exchange Regulations)) directly or indirectly holds (i) 1% or more but less than 3% of the total number of issued shares or voting rights, for the first time, (ii) 3% or more but less than 10% of the total number of issued shares or voting rights, for the first time, or (iii) 10% or more of the total number of issued shares or voting rights.
In addition, if a foreign investor consummates the inward direct investment described above through the acquisition (including investment discretionary management) of shares or voting rights or the authority to exercise, directly or through instructions, voting rights of a Japanese listed company that is not engaged in the Designated Businesses (which is not subject to the prior notification requirements described above) and, as a result of such acquisition, such foreign investor holds 10% or more of shares or voting rights of the total number of issued shares or voting rights of the relevant company, such foreign investor must file a report of the relevant inward direct investment with the Minister of Finance and any other competent Ministers having jurisdiction over such Japanese company within 45 days of such inward direct investment.
Additionally, if a foreign investor consummates the inward direct investment described above through a voting arrangement with respect to a Japanese listed company that is not engaged in the Designated Businesses (which is not subject to the prior notification requirements described above), such foreign investor must file a report of the relevant inward direct investment with the Minister of Finance and any other competent Ministers having jurisdiction over such Japanese company within 45 days of such inward direct investment.
Acquisitions of shares by foreign investors by way of stock split are not subject to the foregoing notification requirements.
Dividends and Proceeds of Sale
Under the Foreign Exchange Regulations, dividends paid on, and the proceeds of sales in Japan of, shares held by
non-residents
of Japan may in general be converted into any foreign currency and repatriated abroad. Under the terms of the deposit agreement pursuant to which Toyota’s ADSs are issued, the Depositary is required, to the extent that in its judgment it can convert yen on a reasonable basis into dollars and transfer the resulting dollars to the United States, to convert all cash dividends that it receives in respect of deposited shares into dollars and to distribute the amount received (after deduction of applicable withholding taxes) to the holders of ADSs. 10.E TAXATION
The following discussion is a general summary of the principal U.S. federal income and Japanese national tax consequences of the acquisition, ownership and disposition of shares of common stock or ADSs. This summary does not purport to address all material tax consequences that may be relevant to holders of shares of common stock or ADSs, and does not take into account the specific circumstances of any particular investors, some of which (such as method of accounting for their securities holdings, regulated investment companies, real estate investment trusts, partnerships and other pass-through entities, investors liable for the U.S. alternative minimum tax, investors that own or are treated as owning 10% or more of Toyota’s stock (by vote or value), investors that hold shares of common stock or ADSs as part of a straddle, hedge, conversion transaction or other integrated transaction and U.S. Holders (as defined below) whose functional currency is not the U.S. dollar) may be subject to special tax rules. This summary is based on the tax laws and regulations of the United States and Japan, judicial decisions, published rulings and administrative pronouncements all as in effect on the date hereof, as well as on the current income tax convention between the United States and Japan (the “Treaty”),
tax-exempt
entities, banks, insurance companies, broker-dealers, traders in securities that elect to use a mark-to-market
128
as described below, all of which are subject to change (possibly with retroactive effect), and to differing interpretations.
For purposes of this discussion, a “U.S. Holder” is any beneficial owner of shares of common stock or ADSs that, for U.S. federal income tax purposes, is:
| 1. | an individual who is a citizen or resident of the United States; |
| 2. | a corporation (or other entity taxable as a corporation for U.S. federal income tax purposes) organized in or under the laws of the United States, any state thereof, or the District of Columbia; |
| 3. | an estate the income of which is subject to U.S. federal income tax without regard to its source; or |
| 4. | a trust that is subject to the primary supervision of a U.S. court and the control of one or more U.S. persons, or that has a valid election in effect under applicable Treasury regulations to be treated as a U.S. person. |
An “Eligible U.S. Holder” is a U.S. Holder that:
| 1. | is a resident of the United States for purposes of the Treaty; |
| 2. | does not maintain a permanent establishment in Japan (a) with which the shares of common stock or ADSs are effectively connected and through which the U.S. Holder carries on or has carried on business, or (b) of which the shares of common stock or ADSs form part of the business property; and |
| 3. | is eligible for benefits under the Treaty with respect to income and gain derived in connection with the shares of common stock or ADSs. |
This summary does not address any aspects of U.S. federal tax law other than income taxation and does not discuss any aspects of Japanese taxation other than income taxation, as limited to national taxes, inheritance and gift taxation. This summary also does not cover any state or local, or
non-U.S.,
non-Japanese
tax considerations. Investors are urged to consult their tax advisors regarding the U.S. federal, state and local and Japanese and other tax consequences of acquiring, owning and disposing of shares of common stock or ADSs. In particular, where relevant, investors are urged to confirm their status as Eligible U.S. Holders with their tax advisors and to discuss with their tax advisors any possible consequences of their failure to qualify as Eligible U.S. Holders. In addition, this summary is based in part upon the representations of the Depositary and the assumption that each obligation in the deposit agreement, and in any related agreement, will be performed in accordance with its terms. In general, for purposes of the Treaty and for U.S. federal income and Japanese income tax purposes, owners of American Depositary Receipts evidencing ADSs will be treated as the owners of the shares of common stock represented by those ADSs, and exchanges of shares of common stock for ADSs, and exchanges of ADSs for shares of common stock, will not be subject to U.S. federal income or Japanese income tax.
The discussion below is intended for general information only and does not constitute a complete analysis of all tax consequences relating to ownership of shares of common stock or ADSs. Prospective purchasers of shares of common stock or ADSs should consult their own tax advisors concerning the tax consequences of their particular situations.
Japanese Taxation
The following is a summary of the principal Japanese tax consequences (limited to national taxes) to
non-residents
of Japan or non-Japanese
corporations without permanent establishments in Japan (“non-resident
Holders”) who are holders of shares of common stock or of ADSs of Toyota. The following information regarding taxation in Japan is based on the tax treaties and tax laws in force and their interpretation by Japan’s 129
tax authorities as of the date of this annual report. Tax laws and treaties and their interpretations may change (including with retroactive effect). Toyota will not revise this summary on the basis of any such change occurring after the date of this annual report.
Generally,
non-resident
Holders are subject to Japanese withholding tax on dividends paid by Japanese corporations. Stock splits are, in general, not taxable events. In the absence of an applicable income tax treaty, convention or agreement reducing the maximum rate of Japanese withholding tax or allowing an exemption from Japanese withholding tax, the rate of Japanese withholding tax applicable to dividends paid by Japanese corporations to
non-resident
Holders is generally 20.42 percent, provided that, with respect to dividends paid on listed shares issued by a Japanese corporation (such as the shares of common stock or ADSs of Toyota) to non-resident
Holders, other than any non-resident
Holder who is an individual holding three percent or more of the total issued shares of the relevant Japanese corporation, the aforementioned 20.42 percent withholding tax rate is reduced to 15.315 percent for dividends due and payable on or before December 31, 2037. These rates include a special additional withholding tax (2.1 percent of the original withholding tax amount) to secure funds for reconstruction from the Great East Japan Earthquake. At the date of this annual report, Japan has income tax treaties, conventions or agreements whereby the above-mentioned withholding tax rate is reduced, in most cases to 15 percent, ten percent or five percent for portfolio investors (15 percent under the income tax treaties in force with, among other countries, Canada, Denmark, Finland, Germany, Iceland, Ireland, Italy, Luxembourg, New Zealand, Norway and Singapore, ten percent under the income tax treaties with, among other countries, Australia, Austria, Belgium, France, Hong Kong, the Netherlands, Portugal, Sweden, Switzerland, the U.K. and the United States, and five percent under the income tax treaties with, among other countries, Spain).
Under the Treaty, the maximum rate of Japanese withholding tax which may be imposed on dividends paid by a Japanese corporation to an Eligible U.S. Holder that is a portfolio investor is generally reduced to ten percent of the gross amount actually distributed, and dividends paid by a Japanese corporation to an Eligible U.S. Holder that is a pension fund (as defined in the Treaty) are exempt from Japanese income tax by way of withholding or otherwise, provided that such dividends are not derived from the carrying on of a business, directly or indirectly, by such pension fund.
If the maximum tax rate provided for in the income tax treaty applicable to dividends paid by Toyota to any particular
non-resident
Holder is lower than the withholding tax rate otherwise applicable under Japanese tax law or if any particular non-resident
Holder is exempt from Japanese income tax with respect to such dividends under the income tax treaty applicable to such particular non-resident
Holder, such non-resident
Holder who is entitled to a reduced rate of or exemption from Japanese withholding tax on the payment of dividends on shares of common stock by Toyota is required to submit an Application Form for Income Tax Convention Regarding Relief from Japanese Income Tax and Special Income Tax for Reconstruction on Dividends (together with any other required forms and documents) in advance through the withholding agent to the relevant tax authority before the payment of dividends. A standing proxy for non-resident
Holders of a Japanese corporation may provide this application service. In addition, a simplified special filing procedure is available for non-resident
Holders to claim treaty benefits of exemption from or reduction of Japanese withholding tax by submitting a Special Application Form for Income Tax Convention Regarding Relief from Japanese Income Tax and Special Income Tax for Reconstruction on Dividends of Listed Stock (together with any other required forms and documents). With respect to ADSs, this reduced rate or exemption is applicable if the Depositary or its agent submits, together with other documents, two Special Application Forms (one before payment of dividends, the other within eight months after the recording date concerning such payment of dividends) to the Japanese tax authority. To claim this reduced rate or exemption, any relevant non-resident
Holder of ADSs will be required to file proof of taxpayer status, residence and beneficial ownership (as applicable) and to provide other information or documents as may be required by the Depositary. A non-resident
Holder who is entitled, under an applicable 130
income tax treaty, to a reduced treaty rate lower than the withholding tax rate otherwise applicable under Japanese tax law or an exemption from the withholding tax, but fails to submit the required application in advance, will be entitled to claim the refund of Japanese taxes withheld in excess of the rate under an applicable tax treaty (if such
non-resident
Holder is entitled to a reduced treaty rate under the applicable income tax treaty) or the entire amount of Japanese tax withheld (if such non-resident
Holder is entitled to an exemption under the applicable income tax treaty) by complying with a certain subsequent filing procedure. Toyota does not assume any responsibility to ensure withholding at the reduced rate, or exemption therefrom, for non-resident
Holders who would be so eligible under an applicable tax treaty, but where the required procedures as stated above are not followed. Gains derived from the sale of shares of common stock or ADSs outside Japan by a
non-resident
Holder holding such shares of common stock or ADSs as portfolio investors are, in general, not subject to Japanese income tax or corporation tax under Japanese law. In addition, Eligible U.S. Holders are exempt from Japanese income or corporation tax with respect to such gains under the Treaty so long as filings required under Japanese law are made. Japanese inheritance and gift taxes at progressive rates may be payable by an individual who has acquired from another individual shares of common stock or ADSs as a legatee, heir or donee, even though neither the individual, nor the deceased, nor donor is a Japanese resident.
Holders of shares of common stock or ADSs should consult their tax advisors regarding the effect of these taxes and, in the case of U.S. Holders, the possible application of the Estate and Gift Tax Treaty between the United States and Japan.
U.S. Federal Income Taxation
U.S. Holders
The following discussion is a summary of the principal U.S. federal income tax consequences to U.S. Holders that hold shares of common stock or ADSs as capital assets (generally, for investment purposes).
Taxation of Dividends
Subject to the passive foreign investment company (“PFIC”) rules discussed below, the gross amount of any distribution made by Toyota in respect of shares of common stock or ADSs (without reduction for Japanese withholding taxes) will constitute a taxable dividend to the extent paid out of current or accumulated earnings and profits, as determined under U.S. federal income tax principles. The U.S. dollar amount of such a dividend generally will be included in the gross income of a U.S. Holder, as ordinary income, when actually or constructively received by the U.S. Holder, in the case of shares of common stock, or by the Depositary, in the case of ADSs. Dividends paid by Toyota will not be eligible for the dividends-received deduction generally allowed to U.S. corporations in respect of dividends received from other U.S. corporations.
Dividends received on shares and ADSs of certain foreign corporations by
non-corporate
U.S. investors may be subject to U.S. federal income tax at lower rates than other types of ordinary income if certain conditions are met. Dividends received by non-corporate
U.S. Holders with respect to shares of common stock or ADSs of Toyota are expected to be eligible for these reduced rates of tax. U.S. Holders should consult their own tax advisors regarding the eligibility of such dividends for a reduced rate of tax. The U.S. dollar amount of a dividend paid in Japanese yen will be determined based on the Japanese yen/U.S. dollar exchange rate in effect on the date that the dividend is included in the gross income of the U.S. Holder, regardless of whether the payment is converted into U.S. dollars on that date. Generally, any gain or loss resulting from currency exchange fluctuations during the period from the date the dividend payment is included
131
in the gross income of a U.S. Holder through the date that payment is converted into U.S. dollars (or otherwise disposed of) will be treated as U.S.-source ordinary income or loss. U.S. Holders should consult their own tax advisors regarding the calculation and U.S. federal income tax treatment of foreign currency gain or loss.
To the extent, if any, that the amount of any distribution received by a U.S. Holder in respect of shares of common stock or ADSs exceeds Toyota’s current and accumulated earnings and profits, as determined under U.S. federal income tax principles, the distribution first will be treated as a
tax-free
return of capital to the extent of the U.S. Holder’s adjusted tax basis in those shares or ADSs, and thereafter will be treated as U.S.-source capital gain. Distributions of additional shares of common stock that are made to U.S. Holders with respect to their shares of common stock or ADSs, and that are part of a pro rata distribution to all of Toyota’s shareholders, generally will not be subject to U.S. federal income tax.
For U.S. foreign tax credit purposes, dividends included in gross income by a U.S. Holder in respect of shares of common stock or ADSs will constitute income from sources outside the United States, and will generally be “passive category income” or, in the case of certain U.S. Holders, “general category income.” Any Japanese withholding tax imposed in respect of a Toyota dividend may be claimed as a credit against the U.S. federal income tax liability of a U.S. Holder, subject to a number of complex limitations and conditions, including those introduced by recently issued U.S. Treasury regulations that apply to foreign income taxes paid or accrued in taxable years beginning on or after December 28, 2021. A U.S. Holder’s use of a foreign tax credit with respect to any such Japanese income or withholding taxes would generally not be allowed unless such U.S. Holder elects benefits under an applicable income tax treaty with respect to such tax. A U.S. Holder who does not elect to claim a credit for any creditable foreign income taxes paid during the taxable year may instead claim a deduction in the computation of such U.S. Holder’s taxable income. Special rules generally will apply to the calculation of foreign tax credits in respect of dividend income that qualifies for preferential U.S. federal income tax rates. Additionally, special rules apply to individuals whose foreign source income during the taxable year consists entirely of “qualified passive income” and whose creditable foreign taxes paid or accrued during the taxable year do not exceed $300 ($600 in the case of a joint return). Further, under some circumstances, a U.S. Holder that:
(i) has held shares of common stock or ADSs for less than a specified minimum period; or
(ii) is obligated to make payments related to Toyota dividends,
will not be allowed a foreign tax credit for Japanese taxes imposed on Toyota dividends.
U.S. Holders are urged to consult their tax advisors regarding the availability of the foreign tax credit under their particular circumstances.
Taxation of Capital Gains and Losses
In general, upon a sale or other taxable disposition of shares of common stock or ADSs, a U.S. Holder will recognize gain or loss for U.S. federal income tax purposes in an amount equal to the difference between the amount realized on the sale or other taxable disposition and the U.S. Holder’s adjusted tax basis in those shares of common stock or ADSs. A U.S. Holder generally will have an adjusted tax basis in a share of common stock or an ADS equal to its U.S. dollar cost. Subject to the PFIC rules discussed below, gain or loss recognized on the sale or other taxable disposition of shares of common stock or ADSs generally will be capital gain or loss and, if the U.S. Holder’s holding period for those shares or ADSs exceeds one year, will be long-term capital gain or loss.
Non-corporate
U.S. Holders, including individuals, currently are eligible for preferential rates of U.S. federal income tax in respect of long-term capital gains. Under U.S. federal income tax law, the deduction of capital losses is subject to limitations. Any gain or loss recognized by a U.S. Holder in respect of the sale or other disposition of shares of common stock or ADSs generally will be treated as U.S.-source income or loss for U.S. foreign tax credit purposes. 132
Deposits and withdrawals of common stock in exchange for ADSs will not result in the realization of gain or loss for U.S. federal income tax purposes.
Passive Foreign Investment Companies
A
non-U.S.
corporation generally will be classified as a PFIC for U.S. federal income tax purposes in any taxable year in which, after applying look-through rules, either (1) at least 75% of its gross income is passive income or (2) on average at least 50% of the gross value of its assets is attributable to assets that produce passive income or are held for the production of passive income. Passive income for this purpose generally includes dividends, interest, royalties, rents and gains from commodities and securities transactions. The PFIC determination is made annually and generally is based on the value of a non-U.S.
corporation’s assets (including goodwill) and composition of its income. Toyota does not believe that it was a PFIC for U.S. federal income tax purposes for its taxable year ended March 31, 2023, and currently intends to continue its operations in such a manner that it will not become a PFIC in the future. Because the PFIC determination is made annually and the application of the PFIC rules to a corporation such as Toyota (which among other things is engaged in leasing and financing through several subsidiaries) is not entirely clear, no assurances can be made regarding determination of its PFIC status in the current or any future taxable year. If Toyota is determined to be a PFIC, U.S. Holders could be subject to additional U.S. federal income taxes on gain recognized with respect to the shares of common stock or ADSs and on certain distributions. In addition, an interest charge may apply to the portion of the U.S. federal income tax liability on such gains or distributions treated under the PFIC rules as having been deferred by the U.S. Holder. Moreover, dividends that a
non-corporate
U.S. Holder receives from Toyota will not be eligible for the reduced U.S. federal income tax rates on dividends described above if Toyota is a PFIC either in the taxable year of the dividend or the preceding taxable year. If a U.S. Holder owns shares of common stock or ADSs in any taxable year in which Toyota is a PFIC, such U.S. Holder generally would be required to file Internal Revenue Service (“IRS”) Form 8621 (or other form specified by the U.S. Department of the Treasury) on an annual basis, subject to certain exceptions based on the value of PFIC stock held. Toyota will inform U.S. Holders if it believes that it will be classified as a PFIC in any taxable year. Prospective investors should consult their own tax advisors regarding the potential application of the PFIC rules to shares of common stock or ADSs.
Non-U.S.
Holders The following discussion is a summary of the principal U.S. federal income tax consequences to beneficial owners of shares of common stock or ADSs that are neither U.S. Holders, nor partnerships, nor entities taxable as partnerships for U.S. federal income tax purposes
(“Non-U.S.
Holders”). A
Non-U.S.
Holder generally will not be subject to any U.S. federal income or withholding tax on distributions received in respect of shares of common stock or ADSs unless the distributions are effectively connected with the conduct by the Non-U.S.
Holder of a trade or business within the United States (and, if an applicable tax treaty requires, are attributable to a U.S. permanent establishment or fixed base of such Non-U.S.
Holder). A
Non-U.S.
Holder generally will not be subject to U.S. federal income tax in respect of gain recognized on a sale or other disposition of shares of common stock or ADSs, unless: | (i) | the gain is effectively connected with a trade or business conducted by the Non-U.S. Holder within the United States (and, if an applicable tax treaty requires, is attributable to a U.S. permanent establishment or fixed base of such Non-U.S. Holder); or |
| (ii) | the Non-U.S. Holder is an individual who was present in the United States for 183 or more days in the taxable year of the disposition and other conditions are met. |
133
Income that is effectively connected with a U.S. trade or business of a
Non-U.S.
Holder, and, if an income tax treaty applies and so requires, is attributable to a U.S. permanent establishment or fixed base of the Non-U.S.
Holder, generally will be taxed in the same manner as the income of a U.S. Holder. In addition, under certain circumstances, any effectively connected earnings and profits realized by a corporate Non-U.S.
Holder may be subject to an additional “branch profits tax” at the rate of 30% or at a lower rate that may be prescribed by an applicable income tax treaty. Backup Withholding and Information Reporting
In general, information reporting requirements will apply to dividends paid to a U.S. Holder in respect of shares of common stock or ADSs, and to the proceeds received upon the sale, exchange or redemption of the shares of common stock or ADSs within the United States by U.S. Holders. Furthermore, backup withholding may apply to those amounts (currently at a 24% rate) if a U.S. Holder fails to provide an accurate taxpayer identification number to certify that such U.S. Holder is not subject to backup withholding or to otherwise comply with the applicable requirements of the backup withholding requirements.
Dividends paid to a
Non-U.S.
Holder in respect of shares of common stock or ADSs, and proceeds received upon the sale, exchange or redemption of shares of common stock or ADSs by a Non-U.S.
Holder, generally are exempt from information reporting and backup withholding under current U.S. federal income tax law. However, a Non-U.S.
Holder may be required to provide certification of non-U.S.
status in order to obtain that exemption. Persons required to establish their exempt status generally must provide such certification under penalty of perjury on IRS Form entitled Certificate of Status of Beneficial Owner for United States Tax Withholding and Reporting (Entities) (or other appropriate IRS Form
W-9,
entitled Request for Taxpayer Identification Number and Certification, in the case of U.S. persons, and on IRS Form W-8BEN,
entitled Certificate of Foreign Status of Beneficial Owner for United States Tax Withholding and Reporting (Individuals), or IRS Form W-8BEN-E,
W-8),
in the case of non-U.S.
persons. Backup withholding is not an additional tax. The amount of backup withholding imposed on a payment generally may be claimed as a credit against the holder’s U.S. federal income tax liability, provided that the required information is properly furnished to the IRS in a timely manner. In addition, certain U.S. Holders who are individuals that hold certain foreign financial assets (which may include shares of common stock or ADSs) are required to report information relating to such assets, subject to certain exceptions. U.S. Holders should consult their tax advisors regarding the effect, if any, of this legislation on their ownership and disposition of shares of common stock or ADSs.
THE SUMMARY OF U.S. FEDERAL INCOME AND JAPANESE NATIONAL TAX CONSEQUENCES SET OUT ABOVE IS INTENDED FOR GENERAL INFORMATION PURPOSES ONLY. PROSPECTIVE PURCHASERS OF COMMON STOCK OR ADSs ARE URGED TO CONSULT WITH THEIR OWN TAX ADVISORS WITH RESPECT TO THE PARTICULAR TAX CONSEQUENCES TO THEM OF OWNING OR DISPOSING OF COMMON STOCK OR ADSs, BASED ON THEIR PARTICULAR CIRCUMSTANCES.
10.F DIVIDENDS AND PAYING AGENTS
Not applicable.
10.G STATEMENT BY EXPERTS
Not applicable.
10.H DOCUMENTS ON DISPLAY
Toyota files annual reports on Form
20-F
and reports on Form 6-K
with the SEC. You may access this information through the SEC’s website (https://www.sec.gov). In addition, Toyota’s reports, proxy statements 134
and other information may be inspected at the offices of the New York Stock Exchange, 20 Broad Street, New York, New York 10005. Copies of the documents referred to herein may also be inspected at Toyota’s offices by contacting Toyota at 1
Toyota-cho,
Toyota City, Aichi Prefecture 471-8571,
Japan, attention: Capital Strategy & Affiliated Companies, Finance Division, telephone number: +81-565-28-2121.
10.I SUBSIDIARY INFORMATION
Not applicable.
10.J ANNUAL REPORT TO SECURITY HOLDERS
Not applicable.
ITEM 11. QUANTITATIVE AND QUALITATIVE DISCLOSURES ABOUT MARKET RISK
Quantitative and Qualitative Disclosures about Market Risk
Toyota is exposed to market risk from changes in foreign currency exchange rates, interest rates, certain commodity and equity security prices. In order to manage the risk arising from changes in foreign currency exchange rates and interest rates, Toyota enters into a variety of derivative financial instruments.
A description of Toyota’s accounting policies for derivative instruments is included in note 3 to the consolidated financial statements and further disclosure is provided in notes 20 and 21 to the consolidated financial statements.
Toyota monitors and manages these financial exposures as an integral part of its overall risk management program, which recognizes the unpredictability of financial markets, and seeks to reduce the potentially adverse effects on Toyota’s operating results.
Market risk analyses of risks such as foreign exchange risk, interest rate risk, commodity price fluctuation risk and stock price fluctuation risk are provided in note 19 to the consolidated financial statements.
ITEM 12. DESCRIPTION OF SECURITIES OTHER THAN EQUITY SECURITIES
12.A DEBT SECURITIES
Not applicable.
12.B WARRANTS AND RIGHTS
Not applicable.
12.C OTHER SECURITIES
Not applicable.
12.D AMERICAN DEPOSITARY SHARES
Fees and Charges for Holders of American Depositary Shares
The Bank of New York Mellon, as Depositary for the ADSs, collects its fees for delivery and surrender of ADSs directly from investors depositing shares or surrendering ADSs for the purpose of withdrawal or from intermediaries acting for them. The Depositary collects fees for making distributions to investors by deducting those fees from the amounts distributed or by selling a portion of distributable property to pay the fees. The Depositary may generally refuse to provide
fee-attracting
services until its fees for those services are paid. 135
Persons depositing or withdrawing shares must pay: |
For: | |
| $5.00 (or less) per 100 ADSs (or portion of 100 ADSs) | • Delivery of ADSs, including those resulting from a distribution, sale or exercise of shares or rights or other property | |
• Surrender of ADSs for the purpose of withdrawal including if the deposit agreement terminates | ||
| $0.05 (or less) per ADS | • Any cash distribution to ADS registered holders | |
| A fee equivalent to the fee that would be payable if securities distributed to you had been shares and the shares had been deposited for delivery of ADSs | • Distribution of securities or rights distributed to holders of deposited securities that are distributed by the Depositary to ADS registered holders | |
| $0.05 (or less) per ADS per year | • General depositary services | |
| Registration fees | • Registration of transfer of shares on Toyota’s share register to or from the name of the Depositary or its nominee or the custodian or its nominee when shares are deposited or withdrawn | |
| Fees and expenses of the Depositary | • Cable (including SWIFT) and facsimile transmissions (when expressly provided in the deposit agreement) | |
• Converting foreign currency to U.S. dollars | ||
| Taxes and other governmental charges the Depositary or the custodian have to pay on any ADS or share underlying an ADS | • As necessary | |
| Any other charges payable by the Depositary, the custodian or their respective agents in connection with the servicing of the deposited securities | • As necessary | |
Fees Incurred in Fiscal 2023
For fiscal 2023, the Depositary paid to Toyota, or paid to a third party at Toyota’s instruction, an aggregate of $890,021.33 for standard maintenance costs for the ADSs (consisting of the expenses of postage and envelopes for mailing annual reports, printing and distributing dividend checks, stationery, postage, facsimile, and telephone calls), Toyota’s continuing annual stock exchange listing fees with respect to the ADSs, expenses relating to Toyota’s annual general shareholders’ meeting that are incurred with respect to Toyota’s ADS holders and 50% of the net dividend fees collected by the Depositary.
out-of-pocket
Fees to be Paid in the Future
With regards to the ADS program, the Depositary has agreed to pay the standard maintenance costs for the ADSs, which includes the expenses of postage and envelopes for mailing annual reports, printing and distributing dividend checks, stationery, postage, facsimile and telephone calls. It has also agreed to pay for investor relations expenses, the continuing annual stock exchange listing fees with respect to the ADSs, and any other program related expenses. The limit on the amount of expenses for which the Depositary will pay is the sum of $300,000 annually. In addition, the Depositary has agreed to pay Toyota 50% of the net dividend fees collected by the Depositary during each annual period towards the aforementioned expenses.
out-of-pocket
136
PART II
ITEM 13. DEFAULTS, DIVIDEND ARREARAGES AND DELINQUENCIES
None.
ITEM 14. MATERIAL MODIFICATIONS TO THE RIGHTS OF SECURITY HOLDERS AND USE OF PROCEEDS
None.
ITEM 15. CONTROLS AND PROCEDURES
(a) DISCLOSURE CONTROLS AND PROCEDURES
Toyota performed an evaluation of the effectiveness of the design and operation of its disclosure controls and procedures as of the end of fiscal 2023. Disclosure controls and procedures are designed to ensure that information required to be disclosed in the Form
20-F
that Toyota files under the Exchange Act is accumulated and communicated to its management, including the chief executive officer and the principal accounting and financial officer, to allow timely decisions regarding required disclosure. The disclosure controls and procedures also ensure that the Form 20-F
that it files under the Exchange Act is recorded, processed, summarized and reported within the time periods specified in the Commission’s rules and forms. The evaluation was performed under the supervision of Toyota’s President and Representative Director, who concurrently serves as CEO, and the member of the board of directors who concurrently serves as CFO. Toyota’s disclosure controls and procedures are designed to provide reasonable assurance of achieving its objectives. Managerial judgment was necessary to evaluate the cost-benefit relationship of possible controls and procedures. The President and Representative Director as well as the member of the board of directors have concluded that Toyota’s disclosure controls and procedures are effective at the reasonable assurance level. (b) MANAGEMENT’S ANNUAL REPORT ON INTERNAL CONTROL OVER FINANCIAL REPORTING
Toyota’s management is responsible for establishing and maintaining effective internal control over financial reporting. Internal control over financial reporting is a process designed to provide reasonable assurance regarding the reliability of financial reporting and the preparation of financial statements for external purposes in accordance with IFRS. Toyota’s internal control over financial reporting includes those policies and procedures that:
| (i) | pertain to the maintenance of records that in reasonable detail, accurately and fairly reflect the transactions and dispositions of Toyota’s assets; |
| (ii) | provide reasonable assurance that transactions are recorded as necessary to permit preparation of financial statements in accordance with IFRS, and that Toyota’s receipts and expenditures are being made only in accordance with authorizations of Toyota’s management and members of the board of directors; and |
| (iii) | provide reasonable assurance regarding prevention or timely detection of unauthorized acquisition, use, or disposition of Toyota’s assets that could have a material effect on the financial statements. |
Because of its inherent limitations, internal control over financial reporting may not prevent or detect misstatements. Also, projections of any evaluation of effectiveness to future periods are subject to the risk that controls may become inadequate because of changes in conditions, or that the degree of compliance with the policies or procedures may deteriorate.
137
Toyota’s management conducted an evaluation of the effectiveness of internal control over financial reporting based on the framework in “Internal Control — Integrated Framework (2013)” issued by the Committee of Sponsoring Organizations of the Treadway Commission.
Based on this evaluation, management concluded that Toyota’s internal control over financial reporting was effective as of March 31, 2023.
PricewaterhouseCoopers Aarata LLC, an independent registered public accounting firm that audited the consolidated financial statements included in this report, has also audited the effectiveness of Toyota’s internal control over financial reporting as of March 31, 2023, as stated in its report included herein.
(c) ATTESTATION REPORT OF THE REGISTERED PUBLIC ACCOUNTING FIRM
Toyota’s independent registered public accounting firm, PricewaterhouseCoopers Aarata LLC, has issued an audit report on the effectiveness of Toyota’s internal control over financial reporting. This report appears in Item 18.
(d) CHANGES IN INTERNAL CONTROL OVER FINANCIAL REPORTING
There have been no changes in Toyota’s internal control over financial reporting during fiscal 2023 that have materially affected, or are reasonably likely to materially affect, Toyota’s internal control over financial reporting.
ITEM 16. [RESERVED]
ITEM 16A. AUDIT COMMITTEE FINANCIAL EXPERT
Toyota maintains an audit & supervisory board system, in accordance with the Companies Act. Toyota’s audit & supervisory board is comprised of six audit & supervisory board members, three of whom are outside audit & supervisory board members. Each audit & supervisory board member has been appointed at Toyota’s meetings of shareholders and has certain statutory powers independently, including auditing the business affairs and accounts of Toyota.
Toyota’s audit & supervisory board has determined that it does not have an “audit committee financial expert” serving on the audit & supervisory board. The qualifications for, and powers of, the audit & supervisory board member delineated in the Companies Act are different from those anticipated for any audit committee financial expert. Audit & supervisory board members have the authority to be given reports from a certified public accountant or an accounting firm concerning audits, including technical accounting matters. At the same time, each audit & supervisory board member has the authority to consult internal and external experts on accounting matters. Each audit & supervisory board member must fulfill the requirements under Japanese laws and regulations and otherwise follow Japanese corporate governance practices and, accordingly, Toyota’s audit & supervisory board has confirmed that it is not necessarily in Toyota’s best interest to nominate as audit & supervisory board member a person who meets the definition of audit committee financial expert. Although Toyota does not have an audit committee financial expert on its audit & supervisory board, Toyota believes that Toyota’s current corporate governance system, taken as a whole, including the audit & supervisory board members’ ability to consult internal and external experts, is fully equivalent to a system having an audit committee financial expert on its audit & supervisory board.
ITEM 16B. CODE OF ETHICS
Toyota has adopted a code of ethics that applies to its members of the board of directors and operating officers, including its principal executive officer, principal financial officer, principal accounting officer or controller, or persons performing similar functions. A copy of Toyota’s code of ethics is included as an exhibit to this annual report on Form
20-F.
138
ITEM 16C. PRINCIPAL ACCOUNTANT FEES AND SERVICES
PricewaterhouseCoopers Aarata LLC has audited the financial statements of Toyota included in this annual report on Form
20-F.
The following table presents the aggregate fees for professional services and other services rendered by PricewaterhouseCoopers Aarata LLC and the various network and member firms of PricewaterhouseCoopers to Toyota in fiscal 2022 and fiscal 2023.
Yen in millions |
||||||||
2022 |
2023 |
|||||||
Audit Fees (1) |
5,460 | 6,617 | ||||||
Audit-related Fees (2) |
52 | 83 | ||||||
Tax Fees (3) |
351 | 375 | ||||||
All Other Fees (4) |
181 | 177 | ||||||
Total |
6,045 |
7,251 |
||||||
| (1) | Audit Fees consist of fees billed for the annual audit services engagement and other audit services, which are those services that only the external auditor reasonably can provide, and include the services of annual audit, quarterly reviews and assessment and reviews of the effectiveness of internal controls over financial reporting of Toyota and its subsidiaries and affiliated companies; the services associated with SEC registration statements or other documents issued in connection with securities offerings such as comfort letters and consents; and consultations as to the accounting or disclosure treatment of transactions or events. |
| (2) | Audit-related Fees consist of fees billed for assurance and related services that are reasonably related to the performance of the audit or review of its financial statements or that are traditionally performed by the external auditor, and mainly include services such as agreed-upon or expanded audit procedures; and financial statement audits of employee benefit plans. |
| (3) | Tax Fees include fees billed for tax compliance services, including services such as tax planning, advice and compliance of federal, state, local and international tax; the review of tax returns; assistance with tax audits and appeals; tax-only valuation services including transfer pricing; expatriate tax assistance and compliance. |
| (4) | All Other Fees primarily include fees billed for risk management advisory services; services providing information related to automotive market conditions; and other advisory services. |
Policies and Procedures of the Audit & Supervisory Board
Below is a summary of the current policies and procedures of the audit & supervisory board for the
pre-approval
of audit and permissible non-audit
services performed by Toyota’s independent public accountants. Under the policy, specified operating officers or managers submit a request for general
pre-approval
of audit and permissible non-audit
services for the following fiscal year, which shall include details of the specific services and estimated fees for the services, to the audit & supervisory board, which reviews and determines whether or not to grant the request in advance. Upon the general pre-approval
of the audit & supervisory board, the specified operating officers or managers are not required to obtain any specific pre-approval
for audit and permissible non-audit
services so long as those services fall within the scope of the general pre-approval
provided. The audit & supervisory board makes a further determination of whether or not to grant a request to revise the general
pre-approval
for the applicable fiscal year if such request is submitted by specified operating officers or managers. Such request may include (i) adding any audit or permissible non-audit
services other than the ones listed in the general pre-approval
and (ii) obtaining services that are listed in the general pre-approval
but of 139
which the total fee amount exceeds the amount affirmed by the general
pre-approval.
The determination of whether or not to grant a request to revise the general pre-approval
noted in the foregoing may alternatively be made by an audit & supervisory board member (full time), who is designated in advance by a resolution of the audit & supervisory board, in which case such audit & supervisory board member (full time) shall report such decision at the next meeting of the audit & supervisory board. The performance of audit and permissible non-audit
services and the payment of fees are subject to review by the audit & supervisory board at least once every fiscal half year. None of the audit related fees, tax fees or all other fees described in the table above were approved by the audit & supervisory board pursuant to the de minimis exception provided by paragraph(c)(7)(i)(C) of Rule
2-01
of Regulation S-X.
ITEM 16D. EXEMPTIONS FROM THE LISTING STANDARDS FOR AUDIT COMMITTEES
Toyota does not have an audit committee. Toyota is relying on the general exemption contained in Rule
10A-3(c)(3)
under the Exchange Act, which provides an exemption from the NYSE’s listing standards relating to audit committees for foreign companies like Toyota that have an audit & supervisory board. Toyota’s reliance on Rule 10A-3(c)(3)
does not, in its opinion, materially adversely affect the ability of its audit & supervisory board to act independently and to satisfy the other requirements of Rule 10A-3.
ITEM 16E. PURCHASES OF EQUITY SECURITIES BY THE ISSUER AND AFFILIATED PURCHASERS
The following table sets forth purchases of Toyota’s common stock by Toyota and its affiliated purchasers during fiscal 2023:
Period |
(a) Total Number of Shares Purchased (1) |
(b) Average Price Paid per Share (Yen) (1) |
(c) Total Number of Shares Purchased as Part of Publicly Announced Plans or Programs (2) |
(d) Maximum Number of Shares that May Yet Be Purchased Under the Plans or Programs (2) |
||||||||||||
April 1, 2022 – April 30, 2022 |
37,148,615 | 2,153 | 37,148,100 | — | ||||||||||||
May 1, 2022 – May 31, 2022 |
6,967,285 | 2,215 | 6,966,800 | — | ||||||||||||
June 1, 2022 – June 30, 2022 |
12,251,130 | 2,115 | 12,250,400 | — | ||||||||||||
July 1, 2022 – July 31, 2022 |
34,807,025 | 2,129 | 34,805,800 | — | ||||||||||||
August 1, 2022 – August 31, 2022 |
1,074 | 2,138 | 0 | — | ||||||||||||
September 1, 2022 – September 30, 2022 |
72,151 | 1,993 | 71,200 | — | ||||||||||||
October 1, 2022 – October 31, 2022 |
43,144,565 | 1,983 | 43,143,200 | — | ||||||||||||
November 1, 2022 – November 30, 2022 |
7,415,950 | 1,996 | 7,415,100 | — | ||||||||||||
December 1, 2022 – December 31, 2022 |
20,987,270 | 1,939 | 20,986,200 | — | ||||||||||||
January 1, 2023 – January 31, 2023 |
18,869,135 | 1,840 | 18,868,300 | — | ||||||||||||
February 1, 2023 – February 28, 2023 |
16,258,940 | 1,887 | 16,258,200 | — | ||||||||||||
March 1, 2023 – March 31, 2023 |
15,631,375 | 1,862 | 15,630,600 | — | ||||||||||||
Total |
213,554,515 |
— |
213,543,900 |
— |
||||||||||||
| (1) | A portion of the above purchases were made as a result of holders of shares constituting less than one unit, which is 100 shares of common stock, requesting Toyota to purchase shares that are a fraction of a unit, in accordance with Toyota’s share handling regulations. Toyota is required to comply with such requests pursuant to the Companies Act. See “Item 10. Additional Information — 10.B Memorandum and Articles of |
140
Association — Japanese Unit Share System.” The number of shares purchased not pursuant to publicly announced plans or programs conducted in fiscal 2023 is 10,615. |
| (2) | Toyota announced on May 11, 2022 that it would repurchase up to 140 million shares of its common stock between June 17, 2022 to September 30, 2022 at a total maximum purchase price of 200 billion yen, in order to return to shareholders the profits derived in fiscal 2022. Toyota also announced on September 21, 2022 that it would extend the term of such repurchase of its common stock from September 30, 2022 to November 1, 2022. Toyota further announced on November 1, 2022 that it would repurchase up to 110 million shares of its common stock between November 2, 2022 to May 12, 2023 at a total maximum purchase price of 150 billion yen in order to return to shareholders the profits derived in the first half of fiscal 2023. |
ITEM 16F. CHANGE IN REGISTRANT’S CERTIFYING ACCOUNTANT
Not applicable.
ITEM 16G. CORPORATE GOVERNANCE
Significant Differences in Corporate Governance Practices between Toyota and U.S. Companies Listed on the NYSE
Pursuant to home country practices exemptions granted by the NYSE, Toyota is permitted to follow certain corporate governance practices complying with Japanese laws, regulations and stock exchange rules in lieu of the NYSE’s listing standards. The SEC approved changes to the NYSE’s listing standards related to corporate governance practices of listed companies (the “NYSE Corporate Governance Rules”) in November 2003, as further amended in November 2004. Toyota is exempt from the approved changes, except for requirements that (a) Toyota’s audit & supervisory board satisfies the requirements of Rule
10A-3
under the Securities Exchange Act of 1934, as amended (the “Exchange Act”), (b) Toyota must disclose significant differences in its corporate governance practices as compared to those followed by domestic companies under the NYSE listing standards, (c) Toyota’s principal executive officer must notify the NYSE in writing after any executive officer of Toyota becomes aware of any non-compliance
with (a) and (b), and (d) Toyota must submit annual and interim written affirmations to the NYSE. Toyota’s corporate governance practices and those followed by domestic companies under the NYSE Corporate Governance Rules have the following significant differences: 1.
Members of the Board of Directors
non-management
directors of each listed company meet at regularly scheduled executive sessions without management, Toyota currently has no non-management
member on its board of directors. Unlike the NYSE Corporate Governance Rules, the Companies Act does not require, and accordingly Toyota does not have, an internal corporate organ or committee comprised solely of independent directors. The Companies Act requires Toyota to have outside members of the board of directors under the Companies Act. Toyota currently has four outside members of the board of directors. An “outside” member of the board of directors refers to:
| (a) | a person who is not, and has never been during the ten year period before becoming an outside member of the board of directors, an executive director (a member of the board of directors who engages in the execution of business), executive officer, manager or employee (collectively, “Executive Director, etc.”) of Toyota or its subsidiaries; |
| (b) | if a person was a member of the board of directors, accounting counselor (in the case that an accounting counselor is a legal entity, an employee of such entity who is in charge of its affairs) or |
141
audit & supervisory board member (excluding those who have ever been Executive Directors, etc.) of Toyota or any of its subsidiaries at any time during the ten year period before becoming an outside member of the board of directors, such person who has not been an Executive Director, etc. of Toyota or any of its subsidiaries during the ten year period before becoming a member of the board of directors, accounting counselor or audit & supervisory board member; and |
| (c) | a person who is not a spouse or relative within the second degree of kinship of any member of the board of directors or manager or other key employee of Toyota. |
Such qualifications for an “outside” member of the board of directors are different from the director independence requirements under the NYSE Corporate Governance Rules.
In addition, pursuant to the regulations of the Japanese stock exchanges, Toyota is required to have one or more “independent director(s)/audit & supervisory board member(s),” defined under the relevant regulations of the Japanese stock exchanges as “outside directors” or “outside audit & supervisory board members” (as defined under the Companies Act), who are unlikely to have any conflicts of interests with Toyota’s general shareholders, and is also required to make efforts to have at least one “independent director(s)/audit & supervisory board member(s)” who is also a director. Each of the outside members of the board of directors of Toyota satisfies the “independent director/audit & supervisory board member” requirements under the regulations of the Japanese stock exchanges. The Japanese Corporate Governance Code provides that certain listed companies, including Toyota, should appoint at least one third of their directors as “independent outside directors” as defined based on the criteria for assessing director independence established by Toyota in line with the independence standards of the Japanese stock exchanges. The content of the criteria for assessing director independence established by Toyota is the same as that of the independence standards of the Japanese stock exchanges, and each of the outside members of the board of directors of Toyota satisfies the “independent outside director” requirements under such independence standards. The definition of “independent director/ audit & supervisory board member” and “independent outside director” is different from that of the definition of independent director under the NYSE Corporate Governance Rules.
2.
Committees
Pursuant to the Companies Act, Toyota’s board of directors nominates and submits a proposal for the appointment of members of the board of directors for shareholder approval. The shareholders vote on such nomination at the general shareholders’ meeting. The Companies Act requires that the limits or calculation formula of the remuneration, bonus and any other benefits in compensation for the execution of duties (“remuneration, etc.”) of directors, the kind of remuneration, etc. (in case that the remuneration, etc. are other than cash (excluding shares and stock acquisition rights)) to be received by directors, and the limits of remuneration, etc. that are shares and stock acquisition rights to be granted to directors as well as the limits of remuneration, etc. to be paid to audit & supervisory board members must be determined by a resolution of the
142
general shareholders’ meeting, unless their remuneration, etc. is provided for in the articles of incorporation. The distribution of remuneration, etc., among each member of the board of directors is broadly delegated to the board of directors and the distribution of remuneration among each audit & supervisory board member is determined by consultation among the audit & supervisory board members.
3.
Audit Committee
10A-3
of the Exchange Act, which provides a general exemption from the audit committee requirements to a foreign private issuer with an audit & supervisory board, subject to certain requirements which continue to be applicable under Rule 10A-3.
Pursuant to the requirements of the Companies Act, Toyota elects its audit & supervisory board members through a resolution adopted at a general shareholders’ meeting. Toyota currently has six audit & supervisory board members, which exceeds the minimum number of audit & supervisory board members required pursuant to the Companies Act.
Unlike the NYSE Corporate Governance Rules, the Companies Act, among others, does not require audit & supervisory board members to establish an expertise in accounting or financial management nor are they required to present other special knowledge and experience. Therefore, none of Toyota’s audit & supervisory board members has “an expertise in accounting or financial management” as set forth in the NYSE Corporate Governance Rules. The Japanese Corporate Governance Code indicates that persons with appropriate experience and skills as well as necessary knowledge of finance, accounting, and laws should be appointed as audit & supervisory board members, and in particular, one or more audit & supervisory board members who have sufficient knowledge of finance and accounting matters should be appointed. Toyota has appointed persons who are able to provide opinions and advice regarding management based on their broader experience and discretion beyond finance and accounting. Under the Companies Act, the audit & supervisory board may determine the auditing policies and methods of investigating the conditions of Toyota’s business and assets, and may resolve other matters concerning the execution of the audit & supervisory board member’s duties. The audit & supervisory board also prepares auditors’ reports and gives consent to proposals of the nomination of audit & supervisory board members. Further, the audit & supervisory board makes decisions concerning proposals relating to the appointment and dismissal of accounting auditors; it also has the authority to dismiss the accounting auditor when certain matters specified under the Companies Act occur.
Toyota currently has three outside audit & supervisory board members under the Companies Act. Under the Companies Act, at least half of the audit & supervisory board members must be an “outside” audit & supervisory board member, which is any person who satisfies all of the following requirements:
| (a) | the person has never been a member of the board of directors, accounting counselor (in the case that an accounting counselor is a legal entity, an employee of such entity who is in charge of its affairs), executive officer, manager or employee of Toyota or its subsidiaries during the ten year period before becoming an outside audit & supervisory board member; |
| (b) | if the person was an audit & supervisory board member of Toyota or any of its subsidiaries at any time during the ten year period before becoming an outside audit & supervisory board member, such person has not been a member of the board of directors, accounting counselor (in the case that an accounting counselor is a legal entity, an employee of such entity who is in charge of its affairs), executive officer, manager or employee of Toyota or any of its subsidiaries during the ten year period before becoming an audit & supervisory board member of Toyota or any of its subsidiaries; and |
| (c) | the person is not a spouse or relative within the second degree of kinship of any member of the board of directors or manager or other key employee of Toyota. |
Such qualifications for an “outside” audit & supervisory board member are different from the audit committee independence requirement under the NYSE Corporate Governance Rules.
143
Each of the outside audit & supervisory board members of Toyota satisfies the “independent director/ audit & supervisory board member” requirements under the regulations of the Japanese stock exchanges, as described above in “1. Members of the Board of Directors.”
4.
Corporate Governance Guidelines
naibu-tosei
5.
Code of Business Conduct and Ethics
naibu-tosei,”
ITEM 16H. MINE SAFETY DISCLOSURE
Not applicable.
ITEM 16I. DISCLOSURE REGARDING FOREIGN JURISDICTIONS THAT PREVENT INSPECTIONS
Not applicable.
144
PART III
ITEM 17. FINANCIAL STATEMENTS
Not applicable.
ITEM 18. FINANCIAL STATEMENTS
The following financial statements are filed as part of this annual report on Form
20-F.
145
TOYOTA MOTOR CORPORATION
INDEX TO CONSOLIDATED FINANCIAL STATEMENT
S
Page |
||||
| F - 2 | ||||
| F - 4 | ||||
| F - 6 | ||||
| F - 7 | ||||
| F - 8 | ||||
F - 10 |
||||
| F - 11 | ||||
All financial statements schedules are omitted because they are not applicable or the required information is shown in the financial statements or the notes thereto.
Financial statements of 50% or less owned persons accounted for by the equity method have been omitted because none of them meets the significance tests specified in Rule
3-09
of Regulation S-X.
F-1
Report of Independent Registered Public Accounting Firm
To the Shareholders and Board of Directors of
Toyota Jidosha Kabushiki Kaisha
(“Toyota Motor Corporation”)
Opinions on the Financial Statements and Internal Control over Financial Reporting
We have audited the accompanying consolidated statement of financial position of Toyota Motor Corporation and its subsidiaries (collectively referred to as the “Company”) as of March 31, 2023 and 2022, and the related consolidated statements of income, comprehensive income, changes in equity and cash flows for each of the three years in the period ended March 31, 2023, including the related notes (collectively referred to as the “consolidated financial statements”). We also have audited the Company’s internal control over financial reporting as of March 31, 2023, based on criteria established in Internal Control—Integrated Framework (2013) issued by the Committee of Sponsoring Organizations of the Treadway Commission (COSO).
In our opinion, the consolidated financial statements referred to above present fairly, in all material respects, the financial position of the Company as of March 31, 2023 and 2022, and the results of its operations and its cash flows for each of the three years in the period ended March 31, 2023 in conformity with International Financial Reporting Standards as issued by the International Accounting Standards Board. Also in our opinion, the Company maintained, in all material respects, effective internal control over financial reporting as of March 31, 2023, based on criteria established in Internal Control—Integrated Framework (2013) issued by the COSO.
Basis for Opinions
The Company’s management is responsible for these consolidated financial statements, for maintaining effective internal control over financial reporting, and for its assessment of the effectiveness of internal control over financial reporting, included in Management’s Annual Report on Internal Control Over Financial Reporting appearing under Item 15(b). Our responsibility is to express opinions on the Company’s consolidated financial statements and on the Company’s internal control over financial reporting based on our audits. We are a public accounting firm registered with the Public Company Accounting Oversight Board (United States) (PCAOB) and are required to be independent with respect to the Company in accordance with the U.S. federal securities laws and the applicable rules and regulations of the Securities and Exchange Commission and the PCAOB.
We conducted our audits in accordance with the standards of the PCAOB. Those standards require that we plan and perform the audits to obtain reasonable assurance about whether the consolidated financial statements are free of material misstatement, whether due to error or fraud, and whether effective internal control over financial reporting was maintained in all material respects.
Our audits of the consolidated financial statements included performing procedures to assess the risks of material misstatement of the consolidated financial statements, whether due to error or fraud, and performing procedures that respond to those risks. Such procedures included examining, on a test basis, evidence regarding the amounts and disclosures in the consolidated financial statements. Our audits also included evaluating the accounting principles used and significant estimates made by management, as well as evaluating the overall presentation of the consolidated financial statements. Our audit of internal control over financial reporting included obtaining an understanding of internal control over financial reporting, assessing the risk that a material weakness exists, and testing and evaluating the design and operating effectiveness of internal control based on the assessed risk. Our audits also included performing such other procedures as we considered necessary in the circumstances. We believe that our audits provide a reasonable basis for our opinions.
Definition and Limitations of Internal Control over Financial Reporting
A company’s internal control over financial reporting is a process designed to provide reasonable assurance regarding the reliability of financial reporting and the preparation of financial statements for external purposes in accordance with generally accepted accounting principles. A company’s internal control over financial reporting includes those policies and procedures that (i) pertain to the maintenance of records that, in reasonable detail, accurately and fairly reflect the transactions and dispositions of the assets of the company; (ii) provide reasonable assurance that transactions are recorded as necessary to permit preparation of financial statements in accordance with generally accepted accounting principles, and that receipts and expenditures of the company are being made only in accordance with authorizations of management and directors of the company; and (iii) provide reasonable assurance regarding prevention or timely detection of unauthorized acquisition, use, or disposition of the company’s assets that could have a material effect on the financial statements.
Because of its inherent limitations, internal control over financial reporting may not prevent or detect misstatements. Also, projections of any evaluation of effectiveness to future periods are subject to the risk that controls may become inadequate because of changes in conditions, or that the degree of compliance with the policies or procedures may deteriorate.
Critical Audit Matters
The critical audit matters communicated below are matters arising from the current period audit of the consolidated financial statements that were communicated or required to be communicated to the audit committee and that (i) relate to accounts or disclosures that are material to the consolidated financial statements and (ii) involved our especially challenging, subjective, or complex judgments. The communication of
F-2
critical audit matters does not alter in any way our opinion on the consolidated financial statements, taken as a whole, and we are not, by communicating the critical audit matters below, providing separate opinions on the critical audit matters or on the accounts or disclosures to which they relate.
Liabilities for the costs of recalls and other safety measures
As described in Notes 3 and 24 to the consolidated financial statements, the Company accrues for costs of recalls and other safety measures. As of March 31, 2023, estimated liabilities for the costs of recalls and other safety measures totaled ¥1,194,156 million and were included in liabilities for quality assurance in the consolidated statement of financial position. The Company generally measures the liabilities for recalls and other safety measures at the time of vehicle sales comprehensively by aggregate sales of various models in a certain period by geographical regions. However, when circumstances warrant, the Company measures liabilities for costs of a particular recall or other safety measures using an individual model when they are probable and reasonably estimable. Management calculates the liabilities for the costs of recalls and other safety measures that are determined comprehensively based on the accumulated amount of repair cost paid per unit and pattern of actual payment occurrence.
The principal considerations for our determination that performing procedures relating to liabilities for the costs of recalls and other safety measures that are determined comprehensively is a critical audit matter are 1) significant judgment and estimation was required by management when developing the liabilities which in turn led to a high degree of auditor judgment and subjectivity in performing procedures to evaluate management’s assumptions; and 2) significant audit effort was necessary relating to testing the accumulated amount of repair cost paid per unit and pattern of actual payment occurrence utilized in developing the estimate. In addition, the audit effort included the involvement of professionals with specialized skill and knowledge to assist in performing these procedures and evaluating the audit evidence obtained.
Addressing the matter involved performing procedures and evaluating audit evidence in connection with forming our overall opinion on the consolidated financial statements. These procedures included testing the effectiveness of controls relating to liabilities for the costs of recalls and other safety measures, including controls related to the determination of the significant assumptions and data used to calculate the liabilities that are determined comprehensively. These procedures also included, among others: 1) testing management’s process for estimating the liabilities, including evaluating the reasonableness of the significant assumptions; and 2) testing of the completeness and accuracy of the data used in the estimate. Professionals with specialized skill and knowledge were used to assist in testing the liabilities by developing an independent range of reasonable estimated loss based on the Company’s data and independently developed assumptions.
Allowance for Credit Losses—Retail finance receivables
As described in Notes 3, 8 and 19 to the consolidated financial statements, the Company measures an allowance for credit losses on its retail finance receivables by estimating the expected credit losses at the reporting date. As of March 31, 2023, ¥274,871 million of the allowance for credit losses corresponding to ¥20,201,004 million of retail finance receivables was recorded in the consolidated statement of financial position. The allowance for credit losses on retail finance receivables is measured based on a systematic, ongoing review and evaluation performed as part of the credit risk evaluation process, historical loss experience, the size and composition of the portfolios, current economic events and conditions, the estimated fair value and adequacy of collateral, forward-looking information including movements of the world economy and other pertinent factors. In calculating the expected credit losses, the Company uses the probability of a default and the loss rate in the event of a default based on past experience and then reflects adjustments based on its forecasts of current and future economic conditions. Retail finance receivables within the United States represent approximately half of the consolidated retail finance receivables as of March 31, 2023.
The principal considerations for our determination that performing procedures relating to the allowance for credit losses on retail finance receivables is a critical audit matter are 1) significant judgment was required by management when determining assumptions of the probability of a default, the loss rate in the event of a default, and adjustments based on the forecasts of current and future economic conditions used in the estimating of the allowance for credit losses, which in turn led to a high degree of auditor judgment and subjectivity in performing procedures to evaluate management’s assumptions and adjustments; 2) there was a high level of complexity in assessing audit evidence related to management’s estimate. In addition, the audit effort included the involvement of professionals with specialized skill and knowledge to assist in performing these procedures and evaluating the audit evidence obtained.
Addressing the matter involved performing procedures and evaluating audit evidence in connection with forming our overall opinion on the consolidated financial statements. These procedures included testing the effectiveness of controls relating to the Company’s allowance for credit losses on retail finance receivables, including controls over data supporting the assumptions, such as the probability of a default and the loss rate in the event of a default based on past experience, and adjustments used to determine the allowance. These procedures also included, among others, testing management’s process for estimating the allowance, including evaluating the reasonableness of the assumptions and adjustments. Professionals with specialized skill and knowledge were used to assist in evaluating the reasonableness of the assumptions and adjustments determined by management.
/s/ PricewaterhouseCoopers Aarata LLC
June
30
, 2023 We have served as the Company’s auditor since 2006.
F-3
TOYOTA MOTOR CORPORATION
CONSOLIDATED STATEMENT OF FINANCIAL POSITION
Yen in millions |
||||||||||||
Notes |
March 31, 2022 |
March 31, 2023 |
||||||||||
| Assets |
||||||||||||
| Current assets |
||||||||||||
| Cash and cash equivalents |
6 | |||||||||||
| Trade accounts and other receivables |
7 | |||||||||||
| Receivables related to financial services |
8 | |||||||||||
| Other financial assets |
9 | |||||||||||
| Inventories |
10 | |||||||||||
| Income tax receivable |
||||||||||||
| Other current assets |
||||||||||||
| |
|
|
|
|||||||||
| Total current assets |
||||||||||||
| |
|
|
|
|||||||||
| Non-current assets |
||||||||||||
| Investments accounted for using the equity method |
11 | |||||||||||
| Receivables related to financial services |
8 | |||||||||||
| Other financial assets |
9 | |||||||||||
| Property, plant and equipment |
||||||||||||
| Land |
12 | |||||||||||
| Buildings |
12 | |||||||||||
| Machinery and equipment |
12 | |||||||||||
| Vehicles and equipment on operating leases |
12 | |||||||||||
| Construction in progress |
12 | |||||||||||
| |
|
|
|
|||||||||
| Total property, plant and equipment, at cost |
12 | |||||||||||
| |
|
|
|
|||||||||
| Less - Accumulated depreciation and impairment losses |
12 | ( |
) | ( |
) | |||||||
| |
|
|
|
|||||||||
| Total property, plant and equipment, net |
12 | |||||||||||
| |
|
|
|
|||||||||
| Right of use assets |
13 | |||||||||||
| Intangible assets |
14 | |||||||||||
| Deferred tax assets |
15 | |||||||||||
| Other non-current assets |
23 | |||||||||||
| |
|
|
|
|||||||||
| Total non-current assets |
||||||||||||
| |
|
|
|
|||||||||
| Total assets |
||||||||||||
| |
|
|
|
|||||||||
The accompanying notes are an integral part of these consolidated financial statements.
F-4
TOYOTA MOTOR CORPORATION
CONSOLIDATED STATEMENT OF FINANCIAL POSITION—(Continued)
Yen in millions |
||||||||||||
Notes |
March 31, 2022 |
March 31, 2023 |
||||||||||
| Liabilities |
||||||||||||
| Current liabilities |
||||||||||||
| Trade accounts and other payables |
16 | |||||||||||
| Short-term and current portion of long-term debt |
17 | |||||||||||
| Accrued expenses |
||||||||||||
| Other financial liabilities |
18 | |||||||||||
| Income taxes payable |
||||||||||||
| Liabilities for quality assurance |
24 | |||||||||||
| Other current liabilities |
||||||||||||
| |
|
|
|
|||||||||
| Total current liabilities |
||||||||||||
| |
|
|
|
|||||||||
| Non-current liabilities |
||||||||||||
| Long-term debt |
17 | |||||||||||
| Other financial liabilities |
18 | |||||||||||
| Retirement benefit liabilities |
23 | |||||||||||
| Deferred tax liabilities |
15 | |||||||||||
| Other non-current liabilities |
||||||||||||
| |
|
|
|
|||||||||
| Total non-current liabilities |
||||||||||||
| |
|
|
|
|||||||||
| Total liabilities |
|
|
||||||||||
| |
|
|
|
|||||||||
| Shareholders’ equity |
||||||||||||
| Common stock |
25 | |||||||||||
| Additional paid-in capital |
25 | |||||||||||
| Retained earnings |
25 | |||||||||||
| Other components of equity |
25 | |||||||||||
| Treasury stock |
25 | ( |
) | ( |
) | |||||||
| |
|
|
|
|||||||||
| Total Toyota Motor Corporation shareholders’ equity |
25 | |||||||||||
| |
|
|
|
|||||||||
| Non-controlling interests |
||||||||||||
| |
|
|
|
|||||||||
| Total shareholders’ equity |
||||||||||||
| |
|
|
|
|||||||||
| Total liabilities and shareholders’ equity |
||||||||||||
| |
|
|
|
|||||||||
The accompanying notes are an integral part of these consolidated financial statements.
F-5
TOYOTA MOTOR CORPORATION
CONSOLIDATED STATEMENT OF INCOME
Yen in millions |
||||||||||||||||
Notes |
For the year ended March 31, 2021 |
For the year ended March 31, 2022 |
For the year ended March 31, 2023 |
|||||||||||||
| Sales revenues |
||||||||||||||||
| Sales of products |
26 | |||||||||||||||
| Financial services |
26 | |||||||||||||||
| |
|
|
|
|
|
|||||||||||
| Total sales revenues |
26 | |||||||||||||||
| |
|
|
|
|
|
|||||||||||
| Costs and expenses |
||||||||||||||||
| Cost of products sold |
||||||||||||||||
| Cost of financial services |
||||||||||||||||
| Selling, general and administrative |
||||||||||||||||
| |
|
|
|
|
|
|||||||||||
| Total costs and expenses |
||||||||||||||||
| |
|
|
|
|
|
|||||||||||
| Operating income |
||||||||||||||||
| |
|
|
|
|
|
|||||||||||
| Share of profit (loss) of investments accounted for using the equity method |
11 | |||||||||||||||
| Other finance income |
28 | |||||||||||||||
| Other finance costs |
28 | ( |
) | ( |
) | ( |
) | |||||||||
| Foreign exchange gain (loss), net |
||||||||||||||||
| Other income (loss), net |
( |
) | ( |
) | ( |
) | ||||||||||
| |
|
|
|
|
|
|||||||||||
| Income before income taxes |
||||||||||||||||
| |
|
|
|
|
|
|||||||||||
| Income tax expense |
15 | |||||||||||||||
| |
|
|
|
|
|
|||||||||||
| Net income |
||||||||||||||||
| |
|
|
|
|
|
|||||||||||
| Net income attributable to |
||||||||||||||||
| Toyota Motor Corporation |
||||||||||||||||
| Non-controlling interests |
||||||||||||||||
| |
|
|
|
|
|
|||||||||||
| Net income |
||||||||||||||||
| |
|
|
|
|
|
|||||||||||
Yen |
||||||||||||||||
| Earnings per share attributable to Toyota Motor Corporation |
||||||||||||||||
| Basic |
29 | |||||||||||||||
| |
|
|
|
|
|
|||||||||||
| Diluted |
29 | |||||||||||||||
| |
|
|
|
|
|
|||||||||||
The accompanying notes are an integral part of these consolidated financial statements.
F-6
TOYOTA MOTOR CORPORATION
CONSOLIDATED STATEMENT OF COMPREHENSIVE INCOME
Yen in millions |
||||||||||||||||
Notes |
For the year ended March 31, 2021 |
For the year ended March 31, 2022 |
For the year ended March 31, 2023 |
|||||||||||||
| Net income |
||||||||||||||||
| Other comprehensive income, net of tax |
||||||||||||||||
| Items that will not be reclassified to profit (loss) |
||||||||||||||||
| Net changes in revaluation of financial assets measured at fair value through other comprehensive income |
25 | ( |
) | |||||||||||||
| Remeasurements of defined benefit plans |
25 | |||||||||||||||
| Share of other comprehensive income of equity method investees |
11,25 | ( |
) | |||||||||||||
| |
|
|
|
|
|
|||||||||||
| Total of items that will not be reclassified to profit (loss) |
||||||||||||||||
| |
|
|
|
|
|
|||||||||||
| Items that may be reclassified subsequently to profit (loss) |
||||||||||||||||
| Exchange differences on translating foreign operations |
25 | |||||||||||||||
| Net changes in revaluation of financial assets measured at fair value through other comprehensive income |
25 | ( |
) | ( |
) | ( |
) | |||||||||
| Share of other comprehensive income of equity method investees |
11,25 | |||||||||||||||
| |
|
|
|
|
|
|||||||||||
| Total of items that may be reclassified subsequently to profit (loss) |
||||||||||||||||
| |
|
|
|
|
|
|||||||||||
| Total other comprehensive income, net of tax |
25 | |||||||||||||||
| |
|
|
|
|
|
|||||||||||
| Comprehensive income |
||||||||||||||||
| |
|
|
|
|
|
|||||||||||
| Comprehensive income for the period attributable to |
||||||||||||||||
| Toyota Motor Corporation |
||||||||||||||||
| Non-controlling interests |
||||||||||||||||
| |
|
|
|
|
|
|||||||||||
| Comprehensive income |
||||||||||||||||
| |
|
|
|
|
|
|||||||||||
The accompanying notes are an integral part of these consolidated financial statements.
F-7
TOYOTA MOTOR CORPORATION
CONSOLIDATED STATEMENT OF CHANGES IN EQUITY
For the year ended March 31, 2021
Yen in millions |
||||||||||||||||||||||||||||||||||||
Notes |
Common stock |
Additional paid-in capital |
Retained earnings |
Other components of equity |
Treasury stock |
Toyota Motor Corporation shareholders’ equity |
Non- controlling interests |
Total shareholders’ equity |
||||||||||||||||||||||||||||
| Balances at April 1, 2020 |
( |
) | ||||||||||||||||||||||||||||||||||
| |
|
|
|
|
|
|
|
|
|
|
|
|
|
|
|
|||||||||||||||||||||
| Comprehensive income |
||||||||||||||||||||||||||||||||||||
| Net income |
— | — | — | — | ||||||||||||||||||||||||||||||||
| Other comprehensive income, net of tax |
25 | — | — | — | — | |||||||||||||||||||||||||||||||
| |
|
|
|
|
|
|
|
|
|
|
|
|
|
|
|
|||||||||||||||||||||
| Total comprehensive income |
— | — | — | |||||||||||||||||||||||||||||||||
| |
|
|
|
|
|
|
|
|
|
|
|
|
|
|
|
|||||||||||||||||||||
| Transactions with owners and other |
||||||||||||||||||||||||||||||||||||
| Dividends paid |
25 | — | — | ( |
) | — | — | ( |
) | ( |
) | ( |
) | |||||||||||||||||||||||
| Repurchase of treasury stock |
25 | — | — | — | — | ( |
) | ( |
) | — | ( |
) | ||||||||||||||||||||||||
| Reissuance of treasury stock |
25 | — | — | — | — | |||||||||||||||||||||||||||||||
| Change in scope of consolidation |
— | — | — | — | — | — | ||||||||||||||||||||||||||||||
| Equity transactions and other |
— | ( |
) | — | — | — | ( |
) | ||||||||||||||||||||||||||||
| |
|
|
|
|
|
|
|
|
|
|
|
|
|
|
|
|||||||||||||||||||||
| Total transactions with owners and other |
— | ( |
) | — | ( |
) | ( |
) | ||||||||||||||||||||||||||||
| |
|
|
|
|
|
|
|
|
|
|
|
|
|
|
|
|||||||||||||||||||||
| Reclassification to retained earnings |
25 | — | — | ( |
) | — | — | — | — | |||||||||||||||||||||||||||
| |
|
|
|
|
|
|
|
|
|
|
|
|
|
|
|
|||||||||||||||||||||
| Balances at March 31, 2021 |
( |
) | ||||||||||||||||||||||||||||||||||
| |
|
|
|
|
|
|
|
|
|
|
|
|
|
|
|
|||||||||||||||||||||
For the year ended March 31, 2022
Yen in millions |
||||||||||||||||||||||||||||||||||||
Notes |
Common stock |
Additional paid-in capital |
Retained earnings |
Other components of equity |
Treasury stock |
Toyota Motor Corporation shareholders’ equity |
Non- controlling interests |
Total shareholders’ equity |
||||||||||||||||||||||||||||
| Balances at April 1, 2021 |
( |
) | ||||||||||||||||||||||||||||||||||
| |
|
|
|
|
|
|
|
|
|
|
|
|
|
|
|
|||||||||||||||||||||
| Comprehensive income |
||||||||||||||||||||||||||||||||||||
| Net income |
— | — | — | — | ||||||||||||||||||||||||||||||||
| Other comprehensive income, net of tax |
25 | — | — | — | — | |||||||||||||||||||||||||||||||
| |
|
|
|
|
|
|
|
|
|
|
|
|
|
|
|
|||||||||||||||||||||
| Total comprehensive income |
— | — | — | |||||||||||||||||||||||||||||||||
| |
|
|
|
|
|
|
|
|
|
|
|
|
|
|
|
|||||||||||||||||||||
| Transactions with owners and other |
||||||||||||||||||||||||||||||||||||
| Dividends paid |
25 | — | — | ( |
) | — | — | ( |
) | ( |
) | ( |
) | |||||||||||||||||||||||
| Repurchase of treasury stock |
25 | — | — | — | — | ( |
) | ( |
) | — | ( |
) | ||||||||||||||||||||||||
| Reissuance of treasury stock |
25 | — | — | — | — | |||||||||||||||||||||||||||||||
| Equity transactions and other |
— | — | — | — | ||||||||||||||||||||||||||||||||
| |
|
|
|
|
|
|
|
|
|
|
|
|
|
|
|
|||||||||||||||||||||
| Total transactions with owners and other |
— | ( |
) | — | ( |
) | ( |
) | ( |
) | ( |
) | ||||||||||||||||||||||||
| |
|
|
|
|
|
|
|
|
|
|
|
|
|
|
|
|||||||||||||||||||||
| Reclassification to retained earnings |
25 | — | — | ( |
) | — | — | — | — | |||||||||||||||||||||||||||
| |
|
|
|
|
|
|
|
|
|
|
|
|
|
|
|
|||||||||||||||||||||
| Balances at March 31, 2022 |
( |
) | ||||||||||||||||||||||||||||||||||
| |
|
|
|
|
|
|
|
|
|
|
|
|
|
|
|
|||||||||||||||||||||
The accompanying notes are an integral part of these consolidated financial statements.
F-8
TOYOTA MOTOR CORPORATION
CONSOLIDATED STATEMENT OF CHANGES IN EQUITY—(Continued)
For the year ended March 31, 2023
Yen in millions |
||||||||||||||||||||||||||||||||||||
Notes |
Common stock |
Additional paid-in capital |
Retained earnings |
Other components of equity |
Treasury stock |
Toyota Motor Corporation shareholders’ equity |
Non- controlling interests |
Total shareholders’ equity |
||||||||||||||||||||||||||||
| Balances at April 1, 2022 |
( |
) | ||||||||||||||||||||||||||||||||||
| |
|
|
|
|
|
|
|
|
|
|
|
|
|
|
|
|||||||||||||||||||||
| Comprehensive income |
||||||||||||||||||||||||||||||||||||
| Net income |
— | — | — | — | ||||||||||||||||||||||||||||||||
| Other comprehensive income, net of tax |
25 | — | — | — | — | |||||||||||||||||||||||||||||||
| |
|
|
|
|
|
|
|
|
|
|
|
|
|
|
|
|||||||||||||||||||||
| Total comprehensive income |
— | — | — | |||||||||||||||||||||||||||||||||
| |
|
|
|
|
|
|
|
|
|
|
|
|
|
|
|
|||||||||||||||||||||
| Transactions with owners and other |
||||||||||||||||||||||||||||||||||||
| Dividends paid |
25 | — | — | ( |
) | — | — | ( |
) | ( |
) | ( |
) | |||||||||||||||||||||||
| Repurchase of treasury stock |
25 | — | — | — | — | ( |
) | ( |
) | — | ( |
) | ||||||||||||||||||||||||
| Reissuance of treasury stock |
25 | — | — | — | — | |||||||||||||||||||||||||||||||
| Equity transactions and other |
— | ( |
) | — | — | — | ( |
) | ||||||||||||||||||||||||||||
| |
|
|
|
|
|
|
|
|
|
|
|
|
|
|
|
|||||||||||||||||||||
| Total transactions with owners and other |
— | ( |
) | — | ( |
) | ( |
) | ( |
) | ( |
) | ||||||||||||||||||||||||
| |
|
|
|
|
|
|
|
|
|
|
|
|
|
|
|
|||||||||||||||||||||
| Reclassification to retained earnings |
25 | — | — | ( |
) | — | — | — | — | |||||||||||||||||||||||||||
| |
|
|
|
|
|
|
|
|
|
|
|
|
|
|
|
|||||||||||||||||||||
| Balances at March 31, 2023 |
( |
) | ||||||||||||||||||||||||||||||||||
| |
|
|
|
|
|
|
|
|
|
|
|
|
|
|
|
|||||||||||||||||||||
The accompanying notes are an integral part of these consolidated financial statements.
F-9
TOYOTA MOTOR CORPORATION
CONSOLIDATED STATEMENT OF CASH FLOWS
Yen in millions |
||||||||||||||||
Notes |
For the year ended March 31, 2021 |
For the year ended March 31, 2022 |
For the year ended March 31, 2023 |
|||||||||||||
| Cash flows from operating activities |
||||||||||||||||
| Net income |
||||||||||||||||
| Depreciation and amortization |
||||||||||||||||
| Interest income and interest costs related to financial services, net |
( |
) | ( |
) | ( |
) | ||||||||||
| Share of profit (loss) of investments accounted for using the equity method |
( |
) | ( |
) | ( |
) | ||||||||||
| Income tax expense |
||||||||||||||||
| Changes in operating assets and liabilities, and other |
( |
) | ( |
) | ( |
) | ||||||||||
| (Increase) decrease in trade accounts and other receivables |
( |
) | ||||||||||||||
| (Increase) decrease in receivables related to financial services |
( |
) | ( |
) | ( |
) | ||||||||||
| (Increase) decrease in inventories |
( |
) | ( |
) | ( |
) | ||||||||||
| (Increase) decrease in other current assets |
( |
) | ( |
) | ||||||||||||
| Increase (decrease) in trade accounts and other payables |
||||||||||||||||
| Increase (decrease) in other current liabilities |
||||||||||||||||
| Increase (decrease) in retirement benefit liabilities |
||||||||||||||||
| Other, net |
( |
) | ( |
) | ( |
) | ||||||||||
| Interest received |
||||||||||||||||
| Dividends received |
||||||||||||||||
| Interest paid |
( |
) | ( |
) | ( |
) | ||||||||||
| Income taxes paid, net of refunds |
( |
) | ( |
) | ( |
) | ||||||||||
| |
|
|
|
|
|
|||||||||||
| Net cash provided by (used in) operating activities |
||||||||||||||||
| |
|
|
|
|
|
|||||||||||
| Cash flows from investing activities |
||||||||||||||||
| Additions to fixed assets excluding equipment leased to others |
( |
) | ( |
) | ( |
) | ||||||||||
| Additions to equipment leased to others |
( |
) | ( |
) | ( |
) | ||||||||||
| Proceeds from sales of fixed assets excluding equipment leased to others |
||||||||||||||||
| Proceeds from sales of equipment leased to others |
||||||||||||||||
| Additions to intangible assets |
( |
) | ( |
) | ( |
) | ||||||||||
| Additions to public and corporate bonds and stocks |
( |
) | ( |
) | ( |
) | ||||||||||
| Proceeds from sales of public and corporate bonds and stocks |
||||||||||||||||
| Proceeds upon maturity of public and corporate bonds |
||||||||||||||||
| Other, net |
33 | ( |
) | |||||||||||||
| |
|
|
|
|
|
|||||||||||
| Net cash provided by (used in) investing activities |
( |
) | ( |
) | ( |
) | ||||||||||
| |
|
|
|
|
|
|||||||||||
| Cash flows from financing activities |
||||||||||||||||
| Increase (decrease) in short-term debt |
17 | ( |
) | ( |
) | |||||||||||
| Proceeds from long-term debt |
17 | |||||||||||||||
| Payments of long-term debt |
17 | ( |
) | ( |
) | ( |
) | |||||||||
| Dividends paid to Toyota Motor Corporation common shareholders |
25 | ( |
) | ( |
) | ( |
) | |||||||||
| Dividends paid to non-controlling interests |
( |
) | ( |
) | ( |
) | ||||||||||
| Reissuance (repurchase) of treasury stock |
( |
) | ( |
) | ||||||||||||
| Other, net |
— | — | ||||||||||||||
| |
|
|
|
|
|
|||||||||||
| Net cash provided by (used in) financing activities |
( |
) | ( |
) | ||||||||||||
| |
|
|
|
|
|
|||||||||||
| Effect of exchange rate changes on cash and cash equivalents |
||||||||||||||||
| |
|
|
|
|
|
|||||||||||
| Net increase (decrease) in cash and cash equivalents |
||||||||||||||||
| |
|
|
|
|
|
|||||||||||
| Cash and cash equivalents at beginning of year |
6 | |||||||||||||||
| |
|
|
|
|
|
|||||||||||
| Cash and cash equivalents at end of year |
6 | |||||||||||||||
| |
|
|
|
|
|
|||||||||||
The accompanying notes are an integral part of these consolidated financial statements.
F-10
TOYOTA MOTOR CORPORATION
NOTES TO CONSOLIDATED FINANCIAL STATEMENTS
1. Reporting entity
TMC is a limited liability, joint-stock company located in Japan, and TMC’s principal executive offices are registered in Toyota City, Aichi Prefecture. The consolidated financial statements of the group consist of TMC, its consolidated subsidiaries (collectively, “Toyota”) and their interests in associates and joint ventures.
Toyota and its associates are primarily engaged in the design, manufacture, and sale of sedans, minivans, compact cars, SUVs, trucks and related parts and accessories throughout the world. In addition, Toyota and its associates provide financing, vehicle leasing and certain other financial services primarily to its dealers and their customers to support the sales of vehicles and other products manufactured by Toyota and its associates.
2. Basis of preparation
(1) Compliance with international financial reporting standards
Toyota’s consolidated financial statements have been prepared in accordance with IFRS as issued by the IASB.
The consolidated financial statements were approved on June
30
, 2023 by President, member of the Board of Directors Koji Sato and CFO, member of the Board of Directors Yoichi Miyazaki. (2) Basis of measurement
Toyota’s consolidated financial statements have been prepared on a historical cost basis, except for certain financial assets and liabilities measured at fair value and assets and liabilities associated with defined benefit plans indicated in “3. Significant accounting policies”.
(3) Functional currency and presentation currency
The consolidated financial statements are presented in Japanese yen, which is the functional currency of TMC. All financial information presented in Japanese yen has been rounded to the nearest million Japanese yen, except when otherwise indicated. Amounts may not sum to totals due to rounding.
3. Significant accounting policies
Basis of consolidation -
(1) Subsidiaries
The consolidated financial statements include the accounts of TMC, its subsidiaries that are controlled by TMC, and those structured entities that are controlled by Toyota. Toyota controls an entity when Toyota is exposed or has rights to variable returns from involvement with the entity, and has the ability to affect those returns by using its power over the entity.
The financial statements of subsidiaries have been adjusted in order to ensure consistency with the accounting policies adopted by Toyota as necessary. All significant intercompany balances and transactions as well as the unrealized profit have been eliminated in consolidation.
Changes in a subsidiary’s ownership interests that do not result in a loss of control are accounted for as equity transactions. When control over a subsidiary is lost, any gain or loss on the disposal of the interest sold is recognized in profit or loss.
TOYOTA MOTOR CORPORATION
NOTES TO CONSOLIDATED FINANCIAL STATEMENTS—(Continued)
(2) Associates and joint ventures
Associates are entities over which Toyota has a significant influence over the decisions on financial and operating policies, but does not have control or joint control.
Joint ventures are entities over which two or more parties including Toyota have joint control, based on a contractual arrangement, and financial and business decisions about the relevant activities of which require unanimous consent of the parties that have joint control.
Investments in associates and joint ventures are accounted for using the equity method. The financial statements of associates and joint ventures have been adjusted in order to ensure consistency with the accounting policies adopted by Toyota as necessary.
When the use of the equity method is discontinued from the date when the investees are determined to be no longer associates or joint ventures, any gain or loss on such disposal of the investment is recognized in profit or loss.
Foreign currency translation -
(1) Foreign currency transactions
Foreign currency transactions are translated into the respective functional currencies of Toyota at the exchange rates prevailing when such transactions occur. All foreign currency receivables and payables are translated into the respective functional currencies at the applicable exchange rates at the end of the reporting period.
Non-monetary
assets and liabilities in foreign currencies that are measured at fair value are translated into the functional currency using the exchange rate on the date when the fair value was measured. Gains or losses on exchange differences arising from settlement of foreign currency receivables and payables or on their translations at the end of the reporting date are recognized in profit or loss. Furthermore, exchange differences arising from equity financial assets measured at fair value through other comprehensive income is recognized as other comprehensive income. (2) Foreign operations
All assets and liabilities of foreign subsidiaries, associates and joint ventures (collectively, “foreign operations”) that use a functional currency other than Japanese yen are translated into Japanese yen at the exchange rates at the end of the reporting period. All revenues and expenses of foreign operations are translated into Japanese yen at the average exchange rate for the period unless the exchange rate fluctuates widely. Exchange differences arising from such translations are recognized in other comprehensive income and accumulated in other components of equity in the consolidated statement of financial position. When a foreign operation is disposed of, and control, significant influence or joint control over the foreign operation is lost, the cumulative amount of exchange differences relating to the foreign operation is reclassified from equity to profit or loss.
Cash and cash equivalents -
Cash and cash equivalents consist of cash on hand, demand deposits, and short-term investments that are readily convertible to cash and are subject to insignificant risk of changes in value with three months or less maturities from the acquisition date.
TOYOTA MOTOR CORPORATION
NOTES TO CONSOLIDATED FINANCIAL STATEMENTS—(Continued)
Financial instruments -
(1) Financial assets
(i) Initial recognition and measurement
Toyota initially recognizes financial assets when it becomes a party to a contract and except for derivatives, classifies financial assets into “financial assets measured at amortized cost”, “debt and equity financial assets measured at fair value through other comprehensive income” or “financial assets measured at fair value through profit or loss”. The sale or purchase of financial assets that occurred in the normal course of business are recognized and derecognized at the trade date.
Financial assets classified as being measured at fair value through profit or loss are measured at fair value, but other financial assets are initially recognized and measured at fair value adding transaction costs directly attributable to acquisition. Trade receivables that do not contain significant financial elements are measured at the transaction price.
(a) Financial assets measured at amortized cost
Toyota classifies a financial asset as measured at amortized cost if both of the following conditions are met:
The asset is held within a business model whose objective is to hold financial assets in order to collect contractual cash flows; and
The contractual terms of the financial asset give rise on specified dates to cash flows that are solely payments of principal and interest on the principal amount outstanding.
(b) Debt financial assets measured at fair value through other comprehensive income
Debt financial assets are measured at fair value through other comprehensive income only if it meets both of the following conditions:
The asset is held within a business model whose objective is achieved by both collecting contractual cash flows and selling financial assets; and
The contractual terms of the financial asset give rise on specified dates to cash flows that are solely payments of principal and interest on the principal amount outstanding.
(c) Equity financial assets measured at fair value through other comprehensive income
For equity financial assets such as shares held mainly for the purpose of maintaining or enhancing business relationships with investees are irrevocably designated at initial recognition, as financial assets measured at fair value through other comprehensive income.
(d) Financial assets measured at fair value through profit or loss
Financial assets other than (a) to (c) are classified as financial assets measured at fair value through profit or loss.
(ii) Subsequent measurement
After initial recognition, financial assets are measured based on the following classification.
TOYOTA MOTOR CORPORATION
NOTES TO CONSOLIDATED FINANCIAL STATEMENTS—(Continued)
(a) Financial assets measured at amortized cost
Financial assets measured at amortized cost are measured at amortized cost using the effective interest method.
(b) Debt financial assets measured at fair value through other comprehensive income
Subsequent changes in fair value of the financial assets are recognized as other comprehensive income. Impairment gains or losses, interest income and foreign exchange gains and losses are recognized in profit or loss. When the financial assets are derecognized, the cumulative gain or loss recognized in other comprehensive income is reclassified from other components of equity to profit or loss.
(c) Equity financial assets measured at fair value through other comprehensive income
Subsequent changes in fair value of the financial assets are recognized as other comprehensive income. When the financial assets are derecognized, the cumulative gain or loss recognized through other comprehensive income is reclassified from other components of equity to retained earnings. Dividends from equity financial assets are recognized in profit or loss.
(d) Financial assets measured at fair value through profit or loss
Subsequent changes in the fair value of the financial assets are recognized in profit or loss.
(iii) Impairment of financial assets
An allowance for credit losses is provided for expected credit losses on financial assets that are measured at amortized cost as well as debt financial assets measured at fair value through other comprehensive income. An allowance for credit losses is also provided for expected credit losses on loan commitments or financial guarantee agreements that are
off-balance
sheet credit exposures. At the end of the reporting period, Toyota assesses whether the credit risk on financial assets have significantly increased since initial recognition. At the end of the reporting period, if Toyota identifies a significant increase in credit risk, allowances for credit losses are measured as being equal to the amount of expected credit losses that would result from default events that are possible over the expected life of a financial asset. At the end of the reporting period, if the credit risk for a financial instrument has not increased significantly since its initial recognition, allowances for credit losses are measured as being equal to the amount of the expected credit losses caused by default events that may occur within 12 months from the end of the reporting period.
For accounts receivable that are included in “Trade accounts and other receivables” and finance lease receivables, the allowance is continuously measured at amounts equal to expected credit losses over the expected life of financial assets.
The amount of expected credit losses is measured as the present value of all cash short falls resulting from the difference between the cash flows due to Toyota in accordance with the contract and cash flows that Toyota expects to receive, and such amount is recognized in profit or loss. A reversal of the allowance for credit losses resulting from a reduction in the amount of expected credit losses is recognized in profit or loss.
If there is objective evidence of impairment such as significant financial difficulty of a borrower, or a default or delinquency by a borrower, interest income is measured applying the effective interest method to the
TOYOTA MOTOR CORPORATION
NOTES TO CONSOLIDATED FINANCIAL STATEMENTS—(Continued)
net carrying amount of the financial asset (after deducting the allowance for credit loss). Financial assets are written off either partially or fully when there is no reasonable expectation of recovering a financial asset in its entirely or a portion thereof.
(iv) Derecognition of financial assets
Toyota derecognizes a financial asset when the contractual rights to the cash flows from the asset expire, or when Toyota transfers the contractual right to receive cash flows from financial assets in transactions in which substantially all the risks and rewards of ownership of the asset are transferred to another entity. Even if Toyota transfers a financial asset, it neither transfers nor holds substantially all the risks and rewards of ownership of such transferred financial asset. Further, in cases where Toyota continues to control such a transferred financial asset, Toyota recognizes the retained interest on such financial asset and the relevant liabilities that might possibly be paid in association therewith.
(2) Financial liabilities
(i) Initial recognition and measurement
Toyota initially measures financial liabilities other than derivatives at fair value less transaction costs directly attributable to the issuance of financial liabilities.
(ii) Subsequent measurement
Toyota subsequently measures financial liabilities at amortized cost using the effective interest method. Amortization under the effective interest method and gain or losses on derecognition are recognized as finance income or costs and recognized in profit or loss.
(iii) Derecognition of financial liabilities
Toyota derecognizes financial liabilities when the financial liabilities expire, that is, when the liability identified in the contract expires due to performance, discharges, cancels, or expires.
(3) Derivative financial instruments
Toyota employs derivative financial instruments, including forward foreign exchange contracts, foreign currency options, interest rate swaps, interest rate currency swap agreements and interest rate options, to manage its exposure to fluctuations in interest rates and foreign currency exchange rates. All derivative transactions are measured at fair value as assets or liabilities.
Toyota does not use derivative financial instruments for speculative or trading purposes.
Finance receivables -
Finance receivables recorded on Toyota’s consolidated statement of financial position are net of any unearned financial income and deferred origination costs and the allowance for credit losses. Deferred origination costs are amortized so as to approximate a level rate of return over the term of the related contracts.
TOYOTA MOTOR CORPORATION
NOTES TO CONSOLIDATED FINANCIAL STATEMENTS—(Continued)
The determination of finance receivable portfolios is based primarily on the qualitative consideration of the nature of Toyota’s business operations and finance receivables. The three portfolios within finance receivables are as follows:
(1) Retail receivables portfolio
The retail receivables portfolio consists of retail installment sales contracts acquired mainly from dealers (“auto loans”) including credit card loans. These contracts acquired must first meet specified credit standards. Thereafter, Toyota retains responsibility for contract collection and administration.
The contract periods of auto loans primarily range from 2 to 7 years. Toyota acquires security interests in the vehicles financed and has the right to repossess vehicles if customers fail to meet their contractual obligations. Almost all auto loans are
non-recourse,
which relieves the dealers from financial responsibility in the event of repossession. Toyota manages the retail receivables portfolio as one portfolio based on common risk characteristics associated with the underlying finance receivables, the similarity of the credit risks, and the quantitative materiality.
(2) Finance lease receivables portfolio
Finance lease receivables are related to new vehicle lease contracts. The contract periods of these primarily range from 2 to 5 years. Lease contracts acquired must first meet specified credit standards after which Toyota assumes ownership of the leased vehicle. Toyota is responsible for contract collection and administration during the lease period.
Toyota is generally permitted to take possession of the vehicle upon a default by the lessee. The residual value is estimated at the time the vehicle is first leased. Vehicles returned to Toyota at the end of their leases are sold by auction.
Toyota manages the finance lease receivables portfolio as one portfolio based on common risk characteristics associated with the underlying finance receivables and the similarity of the credit risks.
(3) Wholesale and other dealer loan receivables portfolio
Toyota provides wholesale financing to qualified dealers to finance inventories. Toyota acquires security interests in vehicles financed at wholesale. In cases where additional security interests would be required, Toyota takes dealership assets or personal assets, or both, as additional security. If a dealer defaults, Toyota has the right to liquidate any assets acquired.
Toyota also makes term loans to dealers for business acquisitions, facilities refurbishment, real estate purchases and working capital requirements. These loans are typically secured with liens on real estate, other dealership assets and/or personal assets of the dealers.
Toyota manages the wholesale and other dealer loan receivables portfolio as one portfolio based on the risk characteristics associated with the underlying finance receivables.
Allowance for credit losses on finance receivables -
The allowance for credit losses on finance receivables is measured at the portfolio level, based on a systematic, ongoing review and evaluation performed as part of the credit risk evaluation process, historical loss
TOYOTA MOTOR CORPORATION
NOTES TO CONSOLIDATED FINANCIAL STATEMENTS—(Continued)
experience, the size and composition of the portfolios, current economic events and conditions, the estimated fair value and adequacy of collateral, forward-looking information including movements of the world economy and other pertinent factors. Furthermore, portfolios are grouped based on similarities of risk characteristics, such as product and collateral classes, when calculating expected credit losses in the aggregate.
(1) Retail receivables portfolio
With respect to retail receivables, Toyota reviews whether the credit risk on finance receivables has increased significantly. To evaluate the risk, Toyota uses the changes for the possibility of a credit loss occurring or days in arrears as an index. Toyota assesses the significant increases in credit risk when contractual payments are more than 30 days past due. When the credit risk on finance receivables has not increased significantly since initial recognition, Toyota measures the loss allowance for that finance receivables at an amount equal to
12-month
expected credit losses at the reporting date. Meanwhile, Toyota measures the loss allowance for finance receivables at an amount equal to the lifetime expected credit losses if the credit risk on that finance receivables has increased significantly since initial recognition at the reporting date. Toyota calculates the loss allowance for finance receivables at an amount equal to the lifetime expected credit losses by considering historical credit loss experience and future collectability, when there is evidence that finance receivables is credit-impaired such as a breach of contract due to default or delayed contractual payments.
In calculating expected credit losses, Toyota uses the probability of a default and the loss rate in the event of a default based on past experience and then reflects its forecasts of current and future economic conditions.
Suspension of payment over a certain period of time and or situations which contractual obligations are not being met are considered as being in default in accordance with internal management rules.
(2) Finance lease receivables portfolio
With respect to the finance lease receivables portfolio, Toyota always measures loss allowance at an amount equal to lifetime expected credit losses. Suspension of payment over a certain period of time and/or situations which contractual obligations are not being met are considered as being in default in accordance with internal management rules.
(3) Wholesale and other dealer loan receivables portfolio
With respect to the wholesale and other dealer loan receivables portfolio, receivables are sorted primarily by credit qualities based on internal risk assessments. Toyota reviews the change of the segment as an index whether the credit risk on finance receivables has increased significantly since initial recognition to assess these receivables for credit risk. Toyota assesses the significant increases in credit risk when contractual payments are more than 30 days past due. If the credit risk on finance receivables has not increased significantly since initial recognition, Toyota measures the loss allowance for that finance receivables at an amount equal to
12-month
expected credit losses at the reporting date. Meanwhile, Toyota measures the loss allowance for finance receivables at an amount equal to the lifetime expected credit losses if the credit risk on that finance receivables has increased significantly since initial recognition at the reporting date. Toyota calculates the loss allowance for finance receivables at an amount equal to the lifetime expected credit losses by considering historical credit loss experience and future collectability, when there is evidence that finance receivables are credit-impaired such as a debtor’s worsened financial conditions, breach of contract due to default or delayed contractual payments.
TOYOTA MOTOR CORPORATION
NOTES TO CONSOLIDATED FINANCIAL STATEMENTS—(Continued)
In calculating expected credit losses, Toyota uses the probability of a default and the loss rate in the event of a default based on past experience and then reflects its forecasts of current and future economic conditions.
Suspension of payment over a certain period of time and/or situations where contractual obligations are not being met are considered as defaults in accordance with internal management rules.
Although Toyota considers the allowance for credit losses on finance receivables to be adequate based on information currently available, additional provisions may be necessary due to (i) changes in management estimates and assumptions about asset impairments, (ii) information that indicates changes in expected future cash flows, or (iii) changes in economic and other events and conditions. Future changes in the economy that impact the consumer confidence such as increasing interest rates and a rise in the unemployment rate as well as higher debt balances, coupled with deterioration in actual and expected used vehicle values, could negatively affect future operating results of the financial services operations.
Inventories -
Inventories are valued at cost, not in excess of net realizable value. Net realizable value is the estimated selling price in the ordinary course of business less the estimated original cost and estimated selling expense to product completion. The cost of inventories includes purchase costs, conversion costs and other costs incurred in bringing the inventories to their present location and condition. The cost is determined principally by using the weighted-average method.
Property, plant and equipment -
Property, plant and equipment is measured based on the cost model and carried at its cost less accumulated depreciation and impairment losses. Expenditures relating to major renewals and improvements are capitalized; minor replacements, maintenance and repairs are charged to current operations as incurred. Depreciation of property, plant and equipment, except for land that is not subject to depreciation, is calculated on the straight-line method over the estimated useful life of the respective assets according to general class, type of structure and use. The estimated useful lives range from 2 to 65 years for buildings and from 2 to 20 years for machinery and equipment.
The depreciation method, useful lives and residual values of property, plant and equipment are reviewed annually at each fiscal year end, and adopted prospectively, if applicable.
Vehicles and equipment on operating leases to third parties are originated by dealers and acquired by certain consolidated subsidiaries. Such subsidiaries are also the lessors of certain property that they acquire directly. Vehicles and equipment on operating leases are depreciated on a straight-line method over the lease term, generally from 2 to 5 years, to the estimated residual value. Incremental direct costs incurred in connection with the acquisition of lease contracts are capitalized and amortized on a straight-line method over the lease term.
Toyota is exposed to risk of loss on the disposition of
off-lease
vehicles to the extent that sales proceeds are not sufficient to cover the carrying value of the leased asset at lease termination. Toyota evaluates at the end of each reporting period the estimated residual value to cover probable estimated losses related to unguaranteed residual values on its owned portfolio. The estimate is calculated considering projected vehicle return rates and projected loss severity. Factors considered in the determination of projected return rates and loss severity include historical and market information on used vehicle sales, trends in lease returns and new car markets, and general economic conditions. Toyota evaluates the foregoing factors, develops several potential loss scenarios, and evaluates the estimated residual value to determine whether it is considered adequate to cover the probable range of losses. TOYOTA MOTOR CORPORATION
NOTES TO CONSOLIDATED FINANCIAL STATEMENTS—(Continued)
By evaluating estimated residual value, Toyota reflects in depreciation the amount it considers to be appropriate in relation to the estimated losses on its owned portfolio.
Intangible assets -
Intangible assets are measured based on the cost model and carried at their cost less accumulated amortization and impairment losses.
The estimated useful lives and the amortization method of intangible assets are reviewed annually at each fiscal year end, and adopted prospectively, if appropriate.
(1) Capitalized development cost
Development expenditure for a product is capitalized only when there is a technical and commercial feasibility of completing the development, Toyota has the intention, ability and sufficient resources to use the outcome of the development, it is probable that the outcome will generate a future economic benefit, and the cost can be measured reliably.
Capitalized development cost is amortized using the straight-line method over the expected product life cycle of the developed product ranging mainly from 5 to 10 years.
(2) Other intangible assets
Other intangible assets mainly consist of software for internal use and amortized using the straight-line method over their estimated useful lives, mainly 5 years. Goodwill is not material to Toyota’s consolidated statement of financial position.
Impairment of
non-financial
assets - At the end of the reporting period, the carrying amount of
non-financial
assets other than inventories and deferred tax assets are assessed to determine whether or not there is any indication of impairment. If there is such an indication, the recoverable amount of such an asset or a cash-generating unit is estimated. An impairment loss would be recognized when the carrying amount of an asset or a cash-generating unit exceeds the estimated discounted cash flows expected to result from the use of the assets and its eventual disposition. The amount of the impairment loss to be recorded is calculated by the excess of the carrying amount of the assets over its recoverable amount. Leases -
At the inception of a contract, Toyota assesses whether the contract is, or contains, a lease.
(1) Lessee
Toyota recognizes a right of use asset and a lease liability at the lease commencement date. The cost of the right of use asset is measured at the amount of the initial measurement of the lease liability by adjusting any lease payments made or before the commencement date. Lease liability is initially measured at the present value of the lease payments that are not paid as of the commencement date.
TOYOTA MOTOR CORPORATION
NOTES TO CONSOLIDATED FINANCIAL STATEMENTS—(Continued)
After the commencement date, Toyota applies a cost model and subsequently depreciates the right of use asset using a straight-line method from the commencement date to the earlier of the end of the useful life of the right of use asset or the end of the lease term. Lease liability is measured at amortized cost using the effective interest method. In the consolidated statement of financial position, lease liability is included in short-term and long-term debt. Interest on the lease liability in each period during the lease term is the amount that produces a constant periodic rate of interest on the remaining balance of the lease liability and recognized in profit or loss over the lease term.
Many lease contracts relating to land and buildings entered into by Toyota include extension options that can be exercisable by Toyota as lessee for various purposes, such as to ensure business flexibility. Toyota assesses whether it is reasonably certain to exercise an extension option, and if it assesses it to be reasonably certain, the extension option is included in the lease term.
Toyota recognizes the lease payments associated with lease terms of 12 months or less as an expense on a straight-line basis over the lease term.
(2) Lessor
With respect to lessor lease transactions, Toyota determines at the commencement of the lease whether each lease is a finance lease or operating lease.
A lease is classified as a finance lease if it transfers substantially all of the risks and rewards incidental to the ownership of an underlying asset. Otherwise leases are classified as operating leases.
Toyota recognizes the operating lease payments in profit or loss on a straight-line basis over the lease term.
Employee benefit obligations -
Toyota has both defined benefit and defined contribution plans for employees’ retirement benefits.
(1) Defined benefit plan
The present value of defined benefit obligations and service cost are principally determined for each plan using the projected unit credit method. The net defined benefit liability (asset) is the present value of the defined benefit obligations less the fair value of plan assets. Current service cost and net interest on the net defined benefit liability (asset) are recognized as net income (loss) on the statement of net income.
Past service cost is recognized in profit or loss upon occurrence.
Toyota recognizes the difference arising from remeasurement of the net defined benefit liability (asset) including actuarial gains and losses in other comprehensive income when it is incurred and reclassifies it immediately to retained earnings.
(2) Defined contribution plan
For defined contribution plans, when the employees render services, the contribution payables are recognized in profit or loss.
TOYOTA MOTOR CORPORATION
NOTES TO CONSOLIDATED FINANCIAL STATEMENTS—(Continued)
Liabilities for quality assurance -
Toyota generally warrants its products against certain manufacturing and other defects. Provisions for product warranties are provided for specific periods of time and/or usage of the product and vary depending upon the nature of the product, the geographic location of the sale and other factors. The accrued warranty costs represent management’s best estimate at the time of sale of the total costs that Toyota will incur to repair or replace product parts that fail while still under warranty. The amount of accrued estimated warranty costs is primarily based on historical experience of product failures as well as current information on repair costs. An estimate of warranty claim accrued for each fiscal year is calculated based on the estimate of warranty claim per unit. The estimate of warranty claim per unit is calculated comprehensively by dividing the actual amounts of warranty claim by the number of sales units for the fiscal year.
Toyota accrues for costs of recalls and other safety measures, as well as product warranty cost described above. Toyota generally measures such “liabilities for recalls and other safety measures” at the time of vehicle sales comprehensively by aggregate sales of various models in a certain period by geographical regions. However, when circumstances warrant, Toyota measures “liabilities for a particular recall or other safety measure
s
” using an individual model when they are probable and reasonably estimable. The portion of “liabilities for recalls and other safety measures” recorded in the consolidated statement of financial position is calculated comprehensively based on the “expected liability for the cost of recalls and other safety measures” in consideration of the “accumulated amount of repair cost paid”. As such, this liability is evaluated every period based on new data and are adjusted as appropriate. Toyota calculates these liabilities for units sold in the current period and each of the past 10 fiscal years, and aggregates such liabilities in determining the final liability amount.
The “expected liability for the cost of recalls and other safety measures” are calculated by multiplying the “sales unit” by the “expected average repair cost per unit”. The “expected average repair cost per unit” is calculated based on dividing the “accumulated amount of repair cost paid per unit” by the “pattern of payment occurrences”. The “pattern of payment occurrence” represents a ratio that shows the measure of payment occurrence over 10 years based on actual payments with regard to units sold within 10 years.
Factors that may cause a difference between the amount accrued comprehensively at the time of vehicle sale and actual payment on individual recalls and other safety measures mainly include actual cost of recalls and safety measures during the period being significantly different from the accumulated amount of repair cost paid per unit (generally comprised of parts and labor) and the actual pattern of payment occurrence during the period being significantly different from the pattern of the payment occurrence in the past. Such differences are considered as part of our estimation process for future recalls and other safety measures.
Liabilities for product warranties and liabilities for recalls and other safety measures have been combined into “Liabilities for quality assurance” in the consolidated statement of financial position. Product warranty costs and costs of recalls and other safety measures are included in cost of products sold in the consolidated statement of income.
The foregoing evaluations are inherently uncertain, as they require material estimates as described above. Consequently, actual warranty costs may differ from the estimated amounts and could require additional warranty provisions. If these factors require a significant increase in Toyota’s accrued estimated warranty costs, it would negatively affect future operating results of the automotive operations.
TOYOTA MOTOR CORPORATION
NOTES TO CONSOLIDATED FINANCIAL STATEMENTS—(Continued)
Revenue recognition -
In the automotive operations, performance obligations are considered to be satisfied when completed vehicles and parts are delivered to the agreed locations with dealers. For parts for production, it is when they are loaded on a ship or delivered to manufacturing companies. We do not have any material significant payment terms as payment is received at or shortly after the point of sale.
Toyota’s sales incentive programs principally consist of cash payments to dealers calculated based on total vehicle volume or vehicle unit sales of certain models sold by a dealer during a certain period of time. Toyota accrues these incentives as revenue reductions upon the sale of a vehicle corresponding to the program by the amount determined in the related incentive program utilizing the most likely outcome method.
The sale of certain vehicles includes a contractual right, which entitles customers to free vehicle maintenance. We use an observable price to determine the stand-alone selling price for separate performance obligations or a cost plus margin approach when one is not available. Such revenues from free maintenance contracts are deferred and recognized as revenue over the period of the contract in proportion to the costs expected to be incurred in satisfying the obligations under the contract.
Revenues from the sales of vehicles under which Toyota conditionally guarantees the minimum resale value are recognized on a pro rata basis from the date of sale to the first exercise date of the guarantee in accordance with lease accounting. The underlying vehicles of these transactions are recorded as assets and are depreciated in accordance with Toyota’s depreciation policy.
Interest income from financial services is recognized using the effective interest method. Revenues from operating leases are recognized on a straight-line basis over the lease term.
If the period between satisfaction of the performance obligation and receipt of consideration is expected to be within one year or less, as a practical expedient, we do not adjust the promised amount of consideration for the effects of a significant financing component.
Revenue is recognized net of any taxes collected from customers and subsequently remitted to governmental authorities.
Income taxes -
Income tax expenses are presented as the aggregate amount of current taxes and deferred taxes.
Deferred tax assets and deferred tax liabilities are recognized for future tax consequences attributable to temporary differences between the carrying amount of assets or liabilities in the consolidated statement of financial position and the tax base of the assets or liabilities and carryforwards of unused tax losses and tax credits.
Deferred tax assets are recognized for all future deductible amounts, to the extent that it is probable that we will have sufficient profit to utilize the benefit of future deductible amounts.
Deferred tax liabilities for taxable temporary differences arising from investments in subsidiaries, associates, and interest in joint ventures are recognized in principle. However, they are not recognized when Toyota is able to control the timing of the reversal of the temporary difference and it is probable that the temporary difference will not reverse in the foreseeable future.
TOYOTA MOTOR CORPORATION
NOTES TO CONSOLIDATED FINANCIAL STATEMENTS—(Continued)
Deferred tax assets and deferred tax liabilities are measured at the tax rates that are expected to apply in the period when the assets are realized or the liabilities are settled, based on the tax rates and tax laws enacted or substantively enacted at the end of the reporting period. The measurement of deferred tax assets and deferred tax liabilities reflects the tax consequences that would follow from the manner in which Toyota expects, at the end of reporting period, to recover or settle the carrying amount of its assets and liabilities.
Earnings per share attributable to Toyota Motor Corporation -
Basic earnings per share attributable to Toyota Motor Corporation is calculated by dividing net income attributable to Toyota Motor Corporation by the weighted-average number of common shares outstanding with adjustment for treasury stock during the reporting period. Diluted earnings per share attributable to Toyota Motor Corporation is calculated by dividing net income attributable to Toyota Motor Corporation by the weighted-average number of common shares outstanding taking into consideration the effect of dilutive securities.
New accounting standards and interpretations not yet adopted -
None of new or revised standards and interpretations that have been issued as of the date of approval of the consolidated financial statements but have not yet been adopted by Toyota have a significant effect on the consolidated financial statements.
4. Significant accounting judgments and estimates
The preparation of the consolidated financial statements in conformity with IFRS requires management to make judgments, estimates, and assumptions that affect the application of accounting policies, the reported amounts of assets, liabilities, revenues and expenses, and the disclosure of contingent assets and liabilities. Actual results could differ from these estimates. These estimates and underlying assumptions are reviewed on a continuous basis. Changes in these accounting estimates are recognized in the period in which the estimates were revised and in any future periods affected.
Information about important estimation and judgments that have significant effects on the amounts recognized in the consolidated financial statements is as follows:
Scope of subsidiaries, associates, and joint ventures (Note 3 “Basis of consolidation”)
Intangible assets incurred by research and development (Note 3 “Intangible assets”)
Information about accounting estimates and assumption that affect the application of accounting policies and the reported amounts of assets and liabilities, and financial statements based on IFRS is as follows:
Liabilities for quality assurance (Note 3 “Liabilities for quality assurance” and Note 24)
Allowance for credit losses on finance receivables (Note 3 “Allowance for credit losses on finance receivables” and Note 19 (2))
Impairment of
non-financial
assets (Note 3 “Impairment of non-financial
assets” and Note 12) Employee benefit obligations (Note 3 “Employee benefit obligations” and Note 23)
Fair value measurements (Note 21)
Recoverability of deferred tax assets (Note 3 “Income taxes” and Note 15)
F-23
TOYOTA MOTOR CORPORATION
NOTES TO CONSOLIDATED FINANCIAL STATEMENTS—(Continued)
5. Segment information
(1) Outline of reporting segments
The operating segments reported below are the segments of Toyota for which separate financial information is available and for which operating income/loss amounts are evaluated regularly by executive management in deciding how to allocate resources and in assessing performance.
The major portions of Toyota’s operations on a worldwide basis are derived from the Automotive and Financial services business segments. The Automotive segment designs, manufactures and distributes sedans, minivans, compact cars, SUVs, trucks and related parts and accessories. The Financial services segment consists primarily of financing and vehicle leasing operations to assist in the merchandising of Toyota’s products as well as other products. The All other segment includes telecommunications and other businesses.
(2) Segment information
As of and for the year ended March 31, 2021
Yen in millions |
||||||||||||||||||||
Automotive |
Financial services |
All other |
Inter-segment Elimination/ Unallocated Amount |
Consolidated |
||||||||||||||||
Sales revenues |
||||||||||||||||||||
Revenues from external customers |
— | |||||||||||||||||||
Inter-segment revenues and transfers |
( |
) | — | |||||||||||||||||
Total |
( |
) | ||||||||||||||||||
Operating expenses |
( |
) | ||||||||||||||||||
Operating income |
||||||||||||||||||||
Total assets |
||||||||||||||||||||
Investments accounted for using the equity method |
||||||||||||||||||||
Depreciation and amortization |
— | |||||||||||||||||||
Capital expenditures |
||||||||||||||||||||
TOYOTA MOTOR CORPORATION
NOTES TO CONSOLIDATED FINANCIAL STATEMENTS—(Continued)
As of and for the year ended March 31, 2022
Yen in millions |
||||||||||||||||||||
Automotive |
Financial services |
All other |
Inter-segment Elimination/ Unallocated Amount |
Consolidated |
||||||||||||||||
Sales revenues |
||||||||||||||||||||
Revenues from external customers |
— | |||||||||||||||||||
Inter-segment revenues and transfers |
( |
) | — | |||||||||||||||||
Total |
( |
) | ||||||||||||||||||
Operating expenses |
( |
) | ||||||||||||||||||
Operating income |
||||||||||||||||||||
Total assets |
||||||||||||||||||||
Investments accounted for using the equity method |
||||||||||||||||||||
Depreciation and amortization |
— | |||||||||||||||||||
Capital expenditures |
( |
) | ||||||||||||||||||
As of and for the year ended March 31, 2023
Yen in millions |
||||||||||||||||||||
Automotive |
Financial services |
All other |
Inter-segment Elimination/ Unallocated Amount |
Consolidated |
||||||||||||||||
Sales revenues |
||||||||||||||||||||
Revenues from external customers |
— | |||||||||||||||||||
Inter-segment revenues and transfers |
( |
) | — | |||||||||||||||||
Total |
( |
) | ||||||||||||||||||
Operating expenses |
( |
) | ||||||||||||||||||
Operating income |
||||||||||||||||||||
Total assets . . . . . . . . . . . . . . . . . . . . . . . . |
||||||||||||||||||||
Investments accounted for using the equity method |
||||||||||||||||||||
Depreciation and amortization |
— | |||||||||||||||||||
Capital expenditures |
( |
) | ||||||||||||||||||
Accounting policies applied by each segment is in conformity with those of Toyota’s consolidated financial statements. Transfers between industry segments are made in accordance with terms and conditions in the ordinary course of business.
Unallocated amounts included in assets represent assets held for corporate purpose, which mainly consist of cash and cash equivalents and financial assets measured at fair value through other comprehensive income, and the balances as of March 31, 2021, 2022 and 2023 are ¥11,344,879 million, ¥10,020,460 million and ¥11,101,175 million, respectively.
TOYOTA MOTOR CORPORATION
NOTES TO CONSOLIDATED FINANCIAL STATEMENTS—(Continued)
(3) Consolidated Financial Statements on
Non-Financial
Services Businesses and Financial Services Business The financial data below presents separately Toyota’s
non-financial
services and financial services businesses. (i) Consolidated Statement of Financial Position on
Non-Financial
Services Businesses and Financial Services Business Yen in millions |
||||||||
March 31, 2022 |
March 31, 2023 |
|||||||
Assets |
||||||||
(Non-Financial Services Businesses) |
||||||||
Current assets |
||||||||
Cash and cash equivalents |
||||||||
Trade accounts and other receivable |
||||||||
Other financial assets |
||||||||
Inventories |
||||||||
Other current assets |
||||||||
Total current assets |
||||||||
Non-current assets |
||||||||
Property, plant and equipment |
||||||||
Other |
||||||||
Total non-current assets |
||||||||
Total assets |
||||||||
(Financial Services Business) |
||||||||
Current assets |
||||||||
Cash and cash equivalents |
||||||||
Trade accounts and other receivable |
||||||||
Receivables related to financial services |
||||||||
Other financial assets |
||||||||
Other current assets |
||||||||
Total current assets |
||||||||
Non-current assets |
||||||||
Receivables related to financial services |
||||||||
Property, plant and equipment |
||||||||
Other |
||||||||
Total non-current assets |
||||||||
Total assets |
||||||||
(Elimination) |
||||||||
Elimination of assets |
( |
) | ( |
) | ||||
(Consolidated) |
||||||||
Total assets |
||||||||
Note: Assets in
non-financial
services include unallocated corporate assets. TOYOTA MOTOR CORPORATION
NOTES TO CONSOLIDATED FINANCIAL STATEMENTS—(Continued)
Yen in millions |
||||||||
March 31, 2022 |
March 31, 2023 |
|||||||
Liabilities |
||||||||
(Non-Financial Services Businesses) |
||||||||
Current liabilities |
||||||||
Trade accounts and other payables |
||||||||
Short-term and current portion of long-term debt |
||||||||
Accrued expenses |
||||||||
Income taxes payable |
||||||||
Other current liabilities |
||||||||
Total current liabilities |
||||||||
Non-current liabilities |
||||||||
Long-term debt |
||||||||
Retirement benefit liabilities |
||||||||
Other non-current liabilities |
||||||||
Total non-current liabilities |
||||||||
Total liabilities |
||||||||
(Financial Services Business) |
||||||||
Current liabilities |
||||||||
Trade accounts and other payables |
||||||||
Short-term and current portion of long-term debt |
||||||||
Accrued expenses |
||||||||
Income taxes payable |
||||||||
Other current liabilities |
||||||||
Total current liabilities |
||||||||
Non-current liabilities |
||||||||
Long-term debt |
||||||||
Retirement benefit liabilities |
||||||||
Other non-current liabilities |
||||||||
Total non-current liabilities |
||||||||
Total liabilities |
||||||||
(Elimination) |
||||||||
Elimination of liabilities |
( |
) | ( |
) | ||||
(Consolidated) |
||||||||
Total liabilities |
||||||||
Shareholders’ equity |
||||||||
(Consolidated) Total Toyota Motor Corporation shareholders’ equity |
||||||||
(Consolidated) Non-controlling interests |
||||||||
(Consolidated) Total shareholders’ equity |
||||||||
(Consolidated) Total liabilities and shareholders’ equity |
||||||||
TOYOTA MOTOR CORPORATION
NOTES TO CONSOLIDATED FINANCIAL STATEMENTS—(Continued)
(ii) Consolidated Statement of Income on
Non-Financial
Services Businesses and Financial Services Business Yen in millions |
||||||||||||
For the year ended March 31, 2021 |
For the year ended March 31, 2022 |
For the year ended March 31, 2023 |
||||||||||
(Non-Financial Services Businesses) |
||||||||||||
Sales revenues |
|
|
|
|||||||||
Cost of revenues |
||||||||||||
Selling, general and administrative |
||||||||||||
Operating income |
||||||||||||
Other income (loss), net |
||||||||||||
Income before income taxes |
||||||||||||
Income tax expense |
||||||||||||
Net income |
||||||||||||
Net income attributable to |
||||||||||||
Toyota Motor Corporation |
||||||||||||
Non-controlling interests |
||||||||||||
(Financial Services Business) |
||||||||||||
Sales revenues |
||||||||||||
Cost of revenues |
||||||||||||
Selling, general and administrative |
||||||||||||
Operating income |
||||||||||||
Other income (loss), net |
( |
) | ( |
) | ||||||||
Income before income taxes |
||||||||||||
Income tax expense |
||||||||||||
Net income |
||||||||||||
Net income attributable to |
||||||||||||
Toyota Motor Corporation |
||||||||||||
Non-controlling interests |
||||||||||||
(Elimination) |
||||||||||||
Elimination of net income |
( |
) | ( |
) | ||||||||
(Consolidated) |
||||||||||||
Net income |
||||||||||||
Net income attributable to |
||||||||||||
Toyota Motor Corporation |
||||||||||||
Non-controlling interests |
||||||||||||
TOYOTA MOTOR CORPORATION
NOTES TO CONSOLIDATED FINANCIAL STATEMENTS—(Continued)
(iii) Consolidated Statement of Cash Flows on
Non-Financial
Services Businesses and Financial Services Business Yen in millions |
||||||||||||
For the year ended March 31, 2021 |
For the year ended March 31, 2022 |
For the year ended March 31, 2023 |
||||||||||
(Non-Financial Services Businesses) |
||||||||||||
Cash flows from operating activities |
||||||||||||
Net income |
|
|
|
|||||||||
Depreciation and amortization |
||||||||||||
Share of profit (loss) of investments accounted for using the equity method |
( |
) | ( |
) | ( |
) | ||||||
Income tax expense |
||||||||||||
Changes in operating assets and liabilities, and other |
( |
) | ( |
) | ||||||||
Interest received |
||||||||||||
Dividends received |
||||||||||||
Interest paid |
( |
) | ( |
) | ( |
) | ||||||
Income taxes paid, net of refunds |
( |
) | ( |
) | ( |
) | ||||||
Net cash provided by (used in) operating activities |
||||||||||||
Cash flows from investing activities |
||||||||||||
Additions to fixed assets excluding equipment leased to others |
( |
) | ( |
) | ( |
) | ||||||
Additions to equipment leased to others |
( |
) | ( |
) | ( |
) | ||||||
Proceeds from sales of fixed assets excluding equipment leased to others |
||||||||||||
Proceeds from sales of equipment leased to others |
||||||||||||
Additions to intangible assets |
( |
) | ( |
) | ( |
) | ||||||
Additions to public and corporate bonds and stocks |
( |
) | ( |
) | ( |
) | ||||||
Proceeds from sales of public and corporate bonds and stocks and upon maturity of public and corporate bonds |
||||||||||||
Other, net |
( |
) | ||||||||||
Net cash provided by (used in) investing activities |
( |
) | ( |
) | ||||||||
Cash flows from financing activities |
||||||||||||
Increase (decrease) in short-term debt |
( |
) | ||||||||||
Proceeds from long-term debt |
||||||||||||
Payments of long-term debt |
( |
) | ( |
) | ( |
) | ||||||
Dividends paid to Toyota Motor Corporation common shareholders |
( |
) | ( |
) | ( |
) | ||||||
Dividends paid to non-controlling interests |
( |
) | ( |
) | ( |
) | ||||||
Reissuance (repurchase) of treasury stock |
( |
) | ( |
) | ||||||||
Other, net |
— | — | ||||||||||
Net cash provided by (used in) financing activities |
( |
) | ( |
) | ||||||||
Effect of exchange rate changes on cash and cash equivalents |
||||||||||||
Net increase (decrease) in cash and cash equivalents |
||||||||||||
Cash and cash equivalents at beginning of year |
||||||||||||
Cash and cash equivalents at end of year |
||||||||||||
TOYOTA MOTOR CORPORATION
NOTES TO CONSOLIDATED FINANCIAL STATEMENTS—(Continued)
Yen in millions |
||||||||||||
For the year ended March 31, 2021 |
For the year ended March 31, 2022 |
For the year ended March 31, 2023 |
||||||||||
(Financial Services Business) |
||||||||||||
Cash flows from operating activities |
||||||||||||
Net income |
||||||||||||
Depreciation and amortization |
||||||||||||
Interest income and interest costs related to financial services, net |
( |
) | ( |
) | ( |
) | ||||||
Share of profit (loss) of investments accounted for using the equity method |
( |
) | ( |
) | ( |
) | ||||||
Income tax expense |
||||||||||||
Changes in operating assets and liabilities, and other |
( |
) | ( |
) | ( |
) | ||||||
Interest received |
||||||||||||
Dividends received |
||||||||||||
Interest paid |
( |
) | ( |
) | ( |
) | ||||||
Income taxes paid, net of refunds |
( |
) | ( |
) | ( |
) | ||||||
Net cash provided by (used in) operating activities |
( |
) | ||||||||||
Cash flows from investing activities |
||||||||||||
Additions to fixed assets excluding equipment leased to others |
( |
) | ( |
) | ( |
) | ||||||
Additions to equipment leased to others |
( |
) | ( |
) | ( |
) | ||||||
Proceeds from sales of fixed assets excluding equipment leased to others |
||||||||||||
Proceeds from sales of equipment leased to others |
|
|
|
|||||||||
Additions to intangible assets |
( |
) | ( |
) | ( |
) | ||||||
Additions to public and corporate bonds and stocks |
( |
) | ( |
) | ( |
) | ||||||
Proceeds from sales of public and corporate bonds and stocks and upon maturity of public and corporate bonds |
||||||||||||
Other, net |
( |
) | ( |
) | ||||||||
Net cash provided by (used in) investing activities |
( |
) | ( |
) | ( |
) | ||||||
Cash flows from financing activities |
||||||||||||
Increase (decrease) in short-term debt |
( |
) | ( |
) | ||||||||
Proceeds from long-term debt |
||||||||||||
Payments of long-term debt |
( |
) | ( |
) | ( |
) | ||||||
Dividends paid to non-controlling interests |
( |
) | ( |
) | ( |
) | ||||||
Other, net |
— | — | ||||||||||
Net cash provided by (used in) financing activities |
||||||||||||
Effect of exchange rate changes on cash and cash equivalents |
||||||||||||
Net increase (decrease) in cash and cash equivalents |
( |
) | ||||||||||
Cash and cash equivalents at beginning of year |
||||||||||||
Cash and cash equivalents at end of year |
||||||||||||
(Consolidated) |
||||||||||||
Effect of exchange rate changes on cash and cash equivalents |
||||||||||||
Net increase (decrease) in cash and cash equivalents |
||||||||||||
Cash and cash equivalents at beginning of year |
||||||||||||
Cash and cash equivalents at end of year |
||||||||||||
TOYOTA MOTOR CORPORATION
NOTES TO CONSOLIDATED FINANCIAL STATEMENTS—(Continued)
(4) Geographic information
As of and for the year ended March 31, 2021
Yen in millions |
||||||||||||||||||||||||||||
Japan |
North America |
Europe |
Asia |
Other |
Inter-segment Elimination/ Unallocated Amount |
Consolidated |
||||||||||||||||||||||
Sales revenues |
||||||||||||||||||||||||||||
Revenues from external customers |
— | |||||||||||||||||||||||||||
Inter-segment revenues and transfers |
( |
) | — | |||||||||||||||||||||||||
Total |
( |
) | ||||||||||||||||||||||||||
Operating expenses |
( |
) | ||||||||||||||||||||||||||
Operating income |
||||||||||||||||||||||||||||
Total assets |
|
|||||||||||||||||||||||||||
Non-current assets |
— | |||||||||||||||||||||||||||
As of and for the year ended March 31, 2022
Yen in millions |
||||||||||||||||||||||||||||
Japan |
North America |
Europe |
Asia |
Other |
Inter-segment Elimination/ Unallocated Amount |
Consolidated |
||||||||||||||||||||||
Sales revenues |
||||||||||||||||||||||||||||
Revenues from external customers |
— | |||||||||||||||||||||||||||
Inter-segment revenues and transfers |
( |
) | — | |||||||||||||||||||||||||
Total |
( |
) | ||||||||||||||||||||||||||
Operating expenses |
( |
) | ||||||||||||||||||||||||||
Operating income |
( |
) | ||||||||||||||||||||||||||
Total assets |
|
|||||||||||||||||||||||||||
Non-current assets |
— | |||||||||||||||||||||||||||
TOYOTA MOTOR CORPORATION
NOTES TO CONSOLIDATED FINANCIAL STATEMENTS—(Continued)
As of and for the year ended March 31, 2023
Yen in millions |
||||||||||||||||||||||||||||
Japan |
North America |
Europe |
Asia |
Other |
Inter-segment Elimination/ Unallocated Amount |
Consolidated |
||||||||||||||||||||||
Sales revenues |
||||||||||||||||||||||||||||
Revenues from external customers |
— | |||||||||||||||||||||||||||
Inter-segment revenues and transfers |
( |
) | — | |||||||||||||||||||||||||
Total |
( |
) | ||||||||||||||||||||||||||
Operating expenses |
( |
) | ||||||||||||||||||||||||||
Operating income (loss) |
( |
) | ( |
) | ||||||||||||||||||||||||
Total assets |
||||||||||||||||||||||||||||
Non-current assets |
— | |||||||||||||||||||||||||||
“Other” consists of Central and South America, Oceania, Africa and the Middle East.
Non-current
assets do not include financial instruments, deferred tax assets, net defined benefit assets and rights arising under insurance contracts. The above amounts are aggregated by region based on the location of the country where TMC or consolidated subsidiaries are located. Transfers between geographic areas are made in accordance with terms and conditions in the ordinary course of business.
Unallocated amounts included in assets represent assets held for corporate purpose, which mainly consist of cash and cash equivalents and financial assets measured at fair value through other comprehensive income, and the balances as March 31, 2021, 2022 and 2023 are ¥11,344,879 million, ¥10,020,460 million and ¥11,101,175 million, respectively.
(5) Sales revenues by location of external customers
In addition to the disclosure requirements under IFRS, Toyota discloses this information in order to provide financial statements users with valuable information
.
Yen in millions |
||||||||||||
For the years ended March 31, |
||||||||||||
2021 |
2022 |
2023 |
||||||||||
Japan |
||||||||||||
North America |
||||||||||||
Europe |
||||||||||||
Asia |
||||||||||||
Other |
||||||||||||
Total |
||||||||||||
“Other” consists of Central and South America, Oceania, Africa and the Middle East, etc.
F-32
TOYOTA MOTOR CORPORATION
NOTES TO CONSOLIDATED FINANCIAL STATEMENTS—(Continued)
6. Cash and cash equivalents
Cash and cash equivalents consist of the following:
Yen in millions |
||||||||
March 31, |
||||||||
2022 |
2023 |
|||||||
| Cash and deposits |
||||||||
| Negotiable certificate of deposit and other |
||||||||
| |
|
|
|
|||||
| Total |
|
|
||||||
| |
|
|
|
|||||
7. Trade accounts and other receivables
Trade accounts and other receivables consist of the following:
Yen in millions |
||||||||
March 31, |
||||||||
2022 |
2023 |
|||||||
| Accounts and notes receivables |
||||||||
| Other receivables |
||||||||
| Allowance for doubtful accounts |
( |
) | ( |
) | ||||
| |
|
|
|
|||||
| Total |
||||||||
| |
|
|
|
|||||
Trade accounts and other receivables which are unconditional rights to considerations are classified as financial assets measured at amortized cost. Receivables from contracts with customers correspond to “Accounts and notes receivables” and the balance as of Ap
ril 1, 2021 is ¥2,301,976 million.
The changes in the allowance for doubtful accounts consist of the following:
Yen in millions |
||||||||
For the years ended March 31, |
||||||||
2022 |
2023 |
|||||||
| Allowance for doubtful accounts at beginning of year |
||||||||
| Provision for doubtful accounts, net of reversal |
||||||||
| Write-offs |
( |
) | ( |
) | ||||
| Other |
||||||||
| |
|
|
|
|||||
| Allowance for doubtful accounts at end of year |
|
|
||||||
| |
|
|
|
|||||
“Other” includes currency translation adjustments.
A portion of the allowance for doubtful accounts is attributed to certain
non-current
receivable balances which are reported as other financial assets under non-current
assets. F-33
TOYOTA MOTOR CORPORATION
NOTES TO CONSOLIDATED FINANCIAL STATEMENTS—(Continued)
8. Finance receivables
Finance receivables consist of the following:
Yen in millions |
||||||||
March 31, |
||||||||
2022 |
2023 |
|||||||
| Retail |
||||||||
| Finance leases |
||||||||
| Wholesale and other dealer loans |
||||||||
| |
|
|
|
|||||
| Total |
||||||||
| |
|
|
|
|||||
| Deferred origination costs |
||||||||
| Less - Unearned income |
( |
) | ( |
) | ||||
| Less - Allowance for credit losses |
||||||||
| Retail |
( |
) | ( |
) | ||||
| Finance leases |
( |
) | ( |
) | ||||
| Wholesale and other dealer loans |
( |
) | ( |
) | ||||
| |
|
|
|
|||||
| Total finance receivables, net |
||||||||
| |
|
|
|
|||||
| Current assets |
||||||||
| Non-current assets |
||||||||
| |
|
|
|
|||||
| Total finance receivables, net |
||||||||
| |
|
|
|
|||||
Finance receivables were geographically distributed as follows: in North America 55.0 %, in Europe 13.3 %, in Asia 12.9 %, in Japan 7.3 % and in Other 11.5 % as of March 31, 2022, and in North America 56.9 %, in Europe 14.0 %, in Asia 12.0 %, in Japan 6.3 % and in Other 10.8 % as of March 31, 2023.
Finance receivables are classified as financial assets measured at amortized cost.
The contractual maturity of retail receivables, future lease payments to be received for finance leases, the contractual maturity of wholesale receivables and other dealer loans are as follows:
Yen in millions |
||||||||||||
March 31, 2022 |
||||||||||||
Retail |
Finance leases |
Wholesale and other dealer loans |
||||||||||
| Within 1 year |
||||||||||||
| Between 1 and 2 years |
||||||||||||
| Between 2 and 3 years |
||||||||||||
| Between 3 and 4 years |
||||||||||||
| Between 4 and 5 years |
||||||||||||
| Later than 5 years |
||||||||||||
| |
|
|
|
|
|
|||||||
| Total |
||||||||||||
| |
|
|
|
|
|
|||||||
TOYOTA MOTOR CORPORATION
NOTES TO CONSOLIDATED FINANCIAL STATEMENTS—(Continued)
Yen in millions |
||||||||||||
March 31, 2023 |
||||||||||||
Retail |
Finance leases |
Wholesale and other dealer loans |
||||||||||
| Within 1 year |
||||||||||||
| Between 1 and 2 years |
||||||||||||
| Between 2 and 3 years |
||||||||||||
| Between 3 and 4 years |
||||||||||||
| Between 4 and 5 years |
||||||||||||
| Later than 5 years |
||||||||||||
| |
|
|
|
|
|
|||||||
| Total |
||||||||||||
| |
|
|
|
|
|
|||||||
Finance leases receivables consist of the following:
Yen in millions |
||||||||
March 31, |
||||||||
2022 |
2023 |
|||||||
| Lease payments |
||||||||
| Estimated unguaranteed residual values |
||||||||
| |
|
|
|
|||||
| Total |
||||||||
| |
|
|
|
|||||
| Deferred origination costs |
||||||||
| Less - Unearned income |
( |
) | ( |
) | ||||
| Less - Allowance for credit losses |
( |
) | ( |
) | ||||
| |
|
|
|
|||||
| Finance leases receivables, net |
||||||||
| |
|
|
|
|||||
F-35
TOYOTA MOTOR CORPORATION
NOTES TO CONSOLIDATED FINANCIAL STATEMENTS—(Continued)
9. Other financial assets
Other financial assets consist of the following:
Yen in millions |
||||||||
March 31, |
||||||||
2022 |
2023 |
|||||||
| Financial assets measured at amortized cost |
||||||||
| Time deposits |
||||||||
| Other |
||||||||
| Financial assets measured at fair value through profit or loss |
||||||||
| Public and corporate bonds |
||||||||
| Stocks |
||||||||
| Derivatives |
||||||||
| Other |
||||||||
| Financial assets measured at fair value through other comprehensive income |
||||||||
| Public and corporate bonds |
||||||||
| Stocks |
||||||||
| Other |
||||||||
| |
|
|
|
|||||
| Total |
||||||||
| |
|
|
|
|||||
| Current assets |
||||||||
| Non-current assets |
||||||||
| |
|
|
|
|||||
| Total |
||||||||
| |
|
|
|
|||||
Toyota has certain financial instruments, including financial assets and liabilities which arose in the normal course of business. These financial instruments are executed with creditworthy financial institutions, and virtually all foreign currency contracts are denominated in U.S. dollars, euros and other currencies of major developed countries. Financial instruments involve, to varying degrees, market risk as instruments are subject to price fluctuations, and elements of credit risk in the event a counterparty should default. In the unlikely event the counterparties fail to meet the contractual terms of a foreign currency or an interest rate instrument, Toyota’s risk is limited to the fair value of the instrument. Although Toyota may be exposed to losses in the event of
non-performance
by counterparties on financial instruments, it does not anticipate significant losses due to the nature of its counterparties. Counterparties to Toyota’s financial instruments represent, in general, international financial institutions. Additionally, Toyota does not have a significant exposure to any individual counterparty. Toyota believes that the overall credit risk related to its financial instruments is not significant. Public and corporate bonds included in financial assets measured at fair value through other comprehensive income include securities loaned of ¥2,198,396 million and ¥2,192,934 million as of March 31, 2022 and 2023, respectively.
TOYOTA MOTOR CORPORATION
NOTES TO CONSOLIDATED FINANCIAL STATEMENTS—(Continued)
Major securities included in stocks measured at fair value through other comprehensive income as of March 31, 2022 and 2023 are as follows:
Yen in millions |
||||||||
March 31, |
||||||||
| Issue |
2022 |
2023 |
||||||
| KDDI CORPORATION |
||||||||
| NIPPON TELEGRAPH AND TELEPHONE CORPORATION |
||||||||
| MS&AD Insurance Group Holdings, Inc. |
||||||||
| HO TAI MOTOR CO., LTD. |
||||||||
| Renesas Electronics Corporation |
||||||||
To facilitate the efficient and effective utilization of assets, Toyota derecognizes stocks measured at fair value through other comprehensive income by way of sale. Fair value and total accumulated other comprehensive income at derecognition are as follows:
Yen in millions |
||||||||
For the years ended March 31, |
||||||||
2022 |
2023 |
|||||||
| Total fair value |
||||||||
| Accumulated other comprehensive income, net |
|
|
||||||
10. Inventories
Inventories consist of the following:
Yen in millions |
||||||||
March 31, |
||||||||
2022 |
2023 |
|||||||
| Products |
||||||||
| Work in process |
||||||||
| Raw materials |
||||||||
| Supplies and other |
||||||||
| |
|
|
|
|||||
| Total |
||||||||
| |
|
|
|
|||||
11. Investments accounted for using the equity method
Equity in associates and joint ventures is as follows:
Yen in millions |
||||||||
March 31, |
||||||||
2022 |
2023 |
|||||||
| Associates |
|
|
||||||
| Joint ventures |
||||||||
| |
|
|
|
|||||
| Total |
||||||||
| |
|
|
|
|||||
TOYOTA MOTOR CORPORATION
NOTES TO CONSOLIDATED FINANCIAL STATEMENTS—(Continued)
The combined information of investments accounted for using the equity method (total value of TMC’s interests) is as follows:
Yen in millions |
||||||||||||
For the years ended March 31, |
||||||||||||
2021 |
2022 |
2023 |
||||||||||
| Net income |
||||||||||||
| Associates |
|
|
|
|||||||||
| Joint ventures |
||||||||||||
| |
|
|
|
|
|
|||||||
| Total |
||||||||||||
| |
|
|
|
|
|
|||||||
| Other comprehensive income, net of tax |
||||||||||||
| Associates |
||||||||||||
| Joint ventures |
||||||||||||
| |
|
|
|
|
|
|||||||
| Total |
||||||||||||
| |
|
|
|
|
|
|||||||
| Comprehensive income |
||||||||||||
| Associates |
||||||||||||
| Joint ventures |
||||||||||||
| |
|
|
|
|
|
|||||||
| Total |
||||||||||||
| |
|
|
|
|
|
|||||||
12. Property, plant and equipment
The changes in cost and accumulated depreciation and impairment losses are as follows:
(Cost)
Yen in millions |
||||||||||||||||||||||||
Land |
Buildings |
Machinery and equipment |
Vehicles and equipment on operating leases |
Construction in progress |
Total |
|||||||||||||||||||
| Balance as of April 1, 2021 |
|
|||||||||||||||||||||||
| |
|
|
|
|
|
|
|
|
|
|
|
|||||||||||||
| Additions |
||||||||||||||||||||||||
| Sales or disposal |
( |
) | ( |
) | ( |
) | ( |
) | ( |
) | ( |
) | ||||||||||||
| Reclassification from construction in progress |
( |
) | — | |||||||||||||||||||||
| Foreign currency translation adjustments |
||||||||||||||||||||||||
| Other |
( |
) | ( |
) | ||||||||||||||||||||
| |
|
|
|
|
|
|
|
|
|
|
|
|||||||||||||
| Balance as of March 31, 2022 |
||||||||||||||||||||||||
| |
|
|
|
|
|
|
|
|
|
|
|
|||||||||||||
| Additions |
||||||||||||||||||||||||
| Sales or disposal |
( |
) | ( |
) | ( |
) | ( |
) | ( |
) | ( |
) | ||||||||||||
| Reclassification from construction in progress |
( |
) | — | |||||||||||||||||||||
| Foreign currency translation adjustments |
||||||||||||||||||||||||
| Other |
( |
) | ||||||||||||||||||||||
| |
|
|
|
|
|
|
|
|
|
|
|
|||||||||||||
| Balance as of March 31, 2023 |
|
|
||||||||||||||||||||||
| |
|
|
|
|
|
|
|
|
|
|
|
|||||||||||||
TOYOTA MOTOR CORPORATION
NOTES TO CONSOLIDATED FINANCIAL STATEMENTS—(Continued)
(Accumulated depreciation and impairment losses)
Yen in millions |
||||||||||||||||||||||||
Land |
Buildings |
Machinery and equipment |
Vehicles and equipment on operating leases |
Construction in progress |
Total |
|||||||||||||||||||
Balance as of April 1, 2021 |
( |
) | ( |
) | ( |
) | ( |
) | ( |
) | ( |
) | ||||||||||||
Depreciation |
— | ( |
) | ( |
) | ( |
) | — | ( |
) | ||||||||||||||
Impairment losses |
— | ( |
) | ( |
) | — | — | ( |
) | |||||||||||||||
Sales or disposal |
— | |
||||||||||||||||||||||
Foreign currency translation adjustments |
( |
) | ( |
) | ( |
) | ( |
) | ( |
) | ( |
) | ||||||||||||
Other |
( |
) | ( |
) | ( |
) | ( |
) | ( |
) | ( |
) | ||||||||||||
Balance as of March 31, 2022 |
( |
) | ( |
) | ( |
) | ( |
) | ( |
) | ( |
) | ||||||||||||
Depreciation |
— | ( |
) | ( |
) | ( |
) | — | ( |
) | ||||||||||||||
Impairment losses |
(393 | ) | ( |
) | ( |
) | — | ( |
) | ( |
) | |||||||||||||
Sales or disposal |
|
— | ||||||||||||||||||||||
Foreign currency translation adjustments |
( |
) | ( |
) | ( |
) | ( |
) | ( |
) | ( |
) | ||||||||||||
Other |
( |
) | ( |
) | ( |
) | ( |
) | ( |
) | ( |
) | ||||||||||||
Balance as of March 31, 2023 |
( |
) | ( |
) | ( |
) | ( |
) | ( |
) | ( |
) | ||||||||||||
Depreciation on “Property, plant and equipment” is included in “Cost of products sold” and “Selling, general and administrative” in the consolidated statement of income.
Vehicles and equipment on operating leases consist of the following:
Yen in millions |
||||||||
March 31, |
||||||||
2022 |
2023 |
|||||||
Vehicles |
||||||||
Equipment |
||||||||
Less - Accumulated depreciation |
( |
) | ( |
) | ||||
Vehicles and equipment on operating leases, net |
|
|
||||||
TOYOTA MOTOR CORPORATION
NOTES TO CONSOLIDATED FINANCIAL STATEMENTS—(Continued)
The following table presents future lease payments to be received for vehicles and equipments on operating leases:
Yen in millions |
||||||||
March 31, |
||||||||
2022 |
2023 |
|||||||
Within 1 year |
||||||||
Between 1 and 2 years |
||||||||
Between 2 and 3 years |
||||||||
Between 3 and 4 years |
||||||||
Between 4 and 5 years |
||||||||
Later than 5 years |
||||||||
Total future rentals |
|
|
||||||
The future lease payments to be received as shown above should not be considered indicative of future cash collections.
13. Right of use assets and lease liabilities
The breakdown of right of use assets is as follows:
Yen in millions |
||||||||
March 31, |
||||||||
2022 |
2023 |
|||||||
Types of original assets |
||||||||
Land |
||||||||
Buildings |
||||||||
Other |
||||||||
Total |
|
|
||||||
The increase in the right of use assets for the years ended on March 31, 2022 and 2023 were ¥110,996 million and ¥116,298 million, respectively.
The breakdown of main gains and losses on lessee’s leases is as follows:
Yen in millions |
||||||||
March 31, |
||||||||
2022 |
2023 |
|||||||
Depreciation of right of use assets |
||||||||
Land |
||||||||
Buildings |
||||||||
Other |
||||||||
Total |
||||||||
Interest expense on lease liabilities |
||||||||
Short-term leases |
||||||||
| |
|
|||||||
TOYOTA MOTOR CORPORATION
NOTES TO CONSOLIDATED FINANCIAL STATEMENTS—(Continued)
For the years ended March 31, 2022 and 2023, the total cash outflows for lessee leases were ¥149,521 million and ¥172,112 million, respectively.
The following is the maturity analysis of the total future lease payments and the adjustment to the present value:
Yen in millions |
||||||||
March 31, |
||||||||
2022 |
2023 |
|||||||
| Within 1 year |
||||||||
| Between 1 and 5 years |
||||||||
| Later than 5 years |
||||||||
| |
|
|
|
|||||
| Future lease payment, total |
||||||||
| Less - Interest expense |
( |
) | ( |
) | ||||
| |
|
|
|
|||||
| Present value of lease payment, total |
||||||||
| |
|
|
|
|||||
| Current liabilities |
||||||||
| Non-current liabilities |
||||||||
| |
|
|
|
|||||
| Present value of lease payment, total |
|
|
||||||
| |
|
|
|
|||||
14. Intangible assets
The carrying value of intangible assets is as follows:
Yen in millions |
||||||||
March 31, |
||||||||
2022 |
2023 |
|||||||
| Capitalized development costs |
||||||||
| Software and other |
||||||||
| |
|
|
|
|||||
| Total |
|
|
||||||
| |
|
|
|
|||||
TOYOTA MOTOR CORPORATION
NOTES TO CONSOLIDATED FINANCIAL STATEMENTS—(Continued)
The changes in cost and accumulated amortization of intangible ass
e
ts are as follows: (Cost)
Yen in millions |
||||||||||||
Capitalized development costs |
Software and other |
Total |
||||||||||
| Balance as of April 1, 2021 |
||||||||||||
| |
|
|
|
|
|
|||||||
| Additions |
||||||||||||
| Internally developed |
||||||||||||
| Sales or disposal |
( |
) | ( |
) | ( |
) | ||||||
| Foreign currency translation adjustments |
||||||||||||
| Other |
||||||||||||
| |
|
|
|
|
|
|||||||
| Balance as of March 31, 2022 |
|
|||||||||||
| |
|
|
|
|
|
|||||||
| Additions |
||||||||||||
| Internally developed |
||||||||||||
| Sales or disposal |
( |
) | ( |
) | ( |
) | ||||||
| Foreign currency translation adjustments |
||||||||||||
| Other |
||||||||||||
| |
|
|
|
|
|
|||||||
| Balance as of March 31, 2023 |
||||||||||||
| |
|
|
|
|
|
|||||||
(Accumulated amortization)
Yen in millions |
||||||||||||
Capitalized development costs |
Software and other |
Total |
||||||||||
| Balance as of April 1, 2021 |
( |
) | ( |
) | ( |
) | ||||||
| |
|
|
|
|
|
|||||||
| Amortization |
( |
) | ( |
) | ( |
) | ||||||
| Sales or disposal |
|
|||||||||||
| Foreign currency translation adjustments |
( |
) | ( |
) | ||||||||
| Other |
( |
) | ( |
) | ||||||||
| |
|
|
|
|
|
|||||||
| Balance as of March 31, 2022 |
( |
) | ( |
) | ( |
) | ||||||
| |
|
|
|
|
|
|||||||
| Amortization |
( |
) | ( |
) | ( |
) | ||||||
| Sales or disposal |
|
|||||||||||
| Foreign currency translation adjustments |
( |
) | ( |
) | ||||||||
| Other |
( |
) | ( |
) | ||||||||
| |
|
|
|
|
|
|||||||
| Balance as of March 31, 2023 |
( |
) | ( |
) | ( |
) | ||||||
| |
|
|
|
|
|
|||||||
Amortization of intangible assets is included in “Cost of products sold” and “Selling, general and administrative” in the consolidated statement of income. There is no material internally generated intangible assets except for capitalized development costs.
F-42
TOYOTA MOTOR CORPORATION
NOTES TO CONSOLIDATED FINANCIAL STATEMENTS—(Continued)
15. Income taxes
(1) Deferred tax assets and liabilities
Significant components of deferred tax assets and liabilities are as follows:
Yen in millions |
||||||||
March 31, |
||||||||
2022 |
2023 |
|||||||
Deferred tax assets |
||||||||
Defined benefit plan liabilities |
||||||||
Accrued expenses and liabilities for quality assurance |
||||||||
Other accrued employees’ compensation |
||||||||
Operating loss carryforwards for tax purposes |
||||||||
Allowance for doubtful accounts and credit losses |
||||||||
Property, plant and equipment and other assets |
||||||||
Other |
||||||||
Total deferred tax assets |
||||||||
Deferred tax liabilities |
||||||||
Changes in fair value of financial instruments measured in other comprehensive income |
( |
) | ( |
) | ||||
Undistributed earnings of foreign subsidiaries |
( |
) | ( |
) | ||||
Undistributed earnings of associates and joint ventures |
( |
) | ( |
) | ||||
Basis difference of acquired assets |
( |
) | ( |
) | ||||
Capitalized development costs |
( |
) | ( |
) | ||||
Lease transactions |
( |
) | ( |
) | ||||
Other |
( |
) | ( |
) | ||||
Total deferred tax liabilities |
( |
) | ( |
) | ||||
Net deferred tax assets and liabilities |
( |
) | ( |
) | ||||
TOYOTA MOTOR CORPORATION
NOTES TO CONSOLIDATED FINANCIAL STATEMENTS—(Continued)
Of the changes in deferred tax assets and deferred tax liabilities for the years ended March 31, 2021, 2022 and 2023, the amount recognized as income tax expense in the consolidated statement of income is as follows:
Yen in millions |
||||||||||||
For the years ended March 31, |
||||||||||||
2021 |
2022 |
2023 |
||||||||||
Defined benefit plan liabilities |
||||||||||||
Accrued expenses and liabilities for quality assurance |
( |
) | ( |
) | ||||||||
Other accrued employees’ compensation |
( |
) | ( |
) | ||||||||
Operating loss carryforwards for tax purposes |
||||||||||||
Allowance for doubtful accounts and credit losses |
( |
) | ||||||||||
Property, plant and equipment and other assets |
( |
) | ||||||||||
Undistributed earnings of foreign subsidiaries |
( |
) | ||||||||||
Undistributed earnings of associates and joint ventures |
( |
) | ( |
) | ||||||||
Basis difference of acquired assets |
( |
) | ( |
) | ( |
) | ||||||
Capitalized development costs |
( |
) | ( |
) | ||||||||
Lease transactions |
( |
) | ||||||||||
Other |
|
|||||||||||
Total |
|
|
( |
) | ||||||||
The deductible temporary differences, unused tax losses, and unused tax credits for which no deferred tax asset is recognized in the statement of financial position:
Yen in millions |
||||||||
March 31, |
||||||||
2022 |
2023 |
|||||||
Deductible temporary difference |
||||||||
Carryforwards of tax losses |
||||||||
Carryforwards of tax credit |
||||||||
Total |
|
|
||||||
The expected expiration date of the carryforwards of tax losses for which deferred tax assets are not recognized are as follows:
Yen in millions |
||||||||
March 31, |
||||||||
2022 |
2023 |
|||||||
Within 5 years |
||||||||
Between 5 and 10 years |
||||||||
Later than 10 years |
||||||||
Total |
|
|
||||||
TOYOTA MOTOR CORPORATION
NOTES TO CONSOLIDATED FINANCIAL STATEMENTS—(Continued)
The expected expiration date of the carryforwards of tax credit for which deferred tax assets are not recognized are as follows:
Yen in millions |
||||||||
March 31, |
||||||||
2022 |
2023 |
|||||||
Within 5 years |
||||||||
Between 5 and 10 years |
||||||||
Later than 10 years |
||||||||
Total |
|
|
||||||
Of the temporary differences in investments in foreign subsidiaries, because management intends to reinvest undistributed earnings of foreign subsidiaries to the extent not expected to be remitted in the foreseeable future, no deferred tax liability is recognized. As of March 31, 2022 and 2023, the temporary differences totaled ¥4,799,506 million and ¥4,367,250 million, respectively, and Toyota estimates an additional deferred tax liability of ¥203,229 million and ¥202,488 million would be required, respectively, if the full amount of those undistributed earnings were remitted.
(2) Income tax expenses
The income tax expense for the years ended March 31, 2021, 2022 and 2023 consists of the following:
Yen in millions |
||||||||||||
For the years ended March 31, |
||||||||||||
2021 |
2022 |
2023 |
||||||||||
Current income tax expense: |
||||||||||||
TMC and domestic subsidiaries |
||||||||||||
Foreign subsidiaries |
||||||||||||
Total current |
||||||||||||
Deferred income tax expense (benefit): |
||||||||||||
TMC and domestic subsidiaries |
( |
) | ||||||||||
Foreign subsidiaries |
( |
) | ( |
) | ||||||||
Total deferred |
( |
) | ( |
) | ||||||||
Total income tax expense |
|
|||||||||||
TOYOTA MOTOR CORPORATION
NOTES TO CONSOLIDATED FINANCIAL STATEMENTS—(Continued)
Toyota is subject to a number of different income taxes which, in the aggregate, indicate a statutory rate in Japan of approximately 30.9 % for the years ended March 31, 2021, 2022 and 2023. The statutory tax rates in effect for the year in which the temporary differences are expected to reverse are used to calculate the tax effects of temporary differences which are expected to reverse in future years. Reconciliation of the differences between the statutory tax rate and the average effective tax rate is as follows:
For the years ended March 31, |
||||||||||||
2021 |
2022 |
2023 |
||||||||||
Statutory tax rate |
% | % | % | |||||||||
Increase (reduction) in taxes resulting from: |
||||||||||||
Non-deductible expenses |
||||||||||||
Tax-exempt income |
( |
) | ( |
) | ( |
) | ||||||
Deferred tax liabilities on undistributed earnings of foreign subsidiaries |
||||||||||||
Effects of investments accounted for using the equity method |
( |
) | ( |
) | ( |
) | ||||||
Deferred tax liabilities on undistributed earnings of associates and joint ventures |
( |
) | ||||||||||
Change in unrecognized deferred tax assets |
||||||||||||
Tax credits |
( |
) | ( |
) | ( |
) | ||||||
The difference between the statutory tax rate in Japan and that of foreign subsidiaries |
( |
) | ( |
) | ( |
) | ||||||
Unrecognized tax benefits adjustments |
( |
) | ( |
) | ||||||||
Other |
( |
) | ||||||||||
Average effective tax rate |
% | % | % | |||||||||
16. Trade accounts and other payables
Trade accounts and other payables consists of the following:
Yen in millions |
||||||||
March 31, |
||||||||
2022 |
2023 |
|||||||
Accounts and notes payables |
||||||||
Other payables |
||||||||
Total |
||||||||
Trade accounts and other payables are classified as financial liabilities
m
easured at amortized cost. F-46
TOYOTA MOTOR CORPORATION
NOTES TO CONSOLIDATED FINANCIAL STATEMENTS—(Continued)
17. Financial liabilities
(1) Financial liabilities
Financial liabilities consist of the following:
Yen in millions |
||||||||||||||||||||||||||||||||
Non-cash changes |
||||||||||||||||||||||||||||||||
As of April 1, 2021 |
Cash flow |
Acquisitions |
Reclassification |
Changes in foreign currency exchange rates |
Changes in fair value |
Other |
As of March 31, 2022 |
|||||||||||||||||||||||||
| Current liabilities |
||||||||||||||||||||||||||||||||
| Short-term debt |
( |
) | — | — | — | |||||||||||||||||||||||||||
| Current portion of long-term debt |
( |
) | — | — | ||||||||||||||||||||||||||||
| Current portion of long-term lease liabilities |
( |
) | — | — | ||||||||||||||||||||||||||||
| Class share |
( |
) | — | — | — | — | ( |
) | — | |||||||||||||||||||||||
| |
|
|
|
|
|
|
|
|
|
|
|
|
|
|
|
|||||||||||||||||
| Current liabilities |
( |
) | — | — | ||||||||||||||||||||||||||||
| |
|
|
|
|
|
|
|
|
|
|
|
|
|
|
|
|||||||||||||||||
| Non-current liabilities |
||||||||||||||||||||||||||||||||
| Long-term debt |
— | ( |
) | — | ||||||||||||||||||||||||||||
| Long-term lease liabilities |
— | ( |
) | — | ( |
) | ||||||||||||||||||||||||||
| Class share |
— | — | — | — | — | — | — | — | ||||||||||||||||||||||||
| |
|
|
|
|
|
|
|
|
|
|
|
|
|
|
|
|||||||||||||||||
| Non-current liabilities |
( |
) | — | ( |
) | |||||||||||||||||||||||||||
| |
|
|
|
|
|
|
|
|
|
|
|
|
|
|
|
|||||||||||||||||
| Total |
( |
) | — | — | ||||||||||||||||||||||||||||
| |
|
|
|
|
|
|
|
|
|
|
|
|
|
|
|
|||||||||||||||||
| Derivatives |
( |
) | — | — | — | |||||||||||||||||||||||||||
Yen in millions |
||||||||||||||||||||||||||||||||
Non-cash changes |
||||||||||||||||||||||||||||||||
As of April 1, 2022 |
Cash flow |
Acquisitions |
Reclassification |
Changes in foreign currency exchange rates |
Changes in fair value |
Other |
As of March 31, 2023 |
|||||||||||||||||||||||||
| Current liabilities |
||||||||||||||||||||||||||||||||
| Short-term debt |
— | — | — | |||||||||||||||||||||||||||||
| Current portion of long-term debt |
( |
) | — | — | ||||||||||||||||||||||||||||
| Current portion of long-term lease liabilities |
( |
) | — | — | ||||||||||||||||||||||||||||
| Class share |
— | — | — | — | — | — | — | — | ||||||||||||||||||||||||
| |
|
|
|
|
|
|
|
|
|
|
|
|
|
|
|
|||||||||||||||||
| Current liabilities |
( |
) | — | — | ||||||||||||||||||||||||||||
| |
|
|
|
|
|
|
|
|
|
|
|
|
|
|
|
|||||||||||||||||
| Non-current liabilities |
||||||||||||||||||||||||||||||||
| Long-term debt |
— | ( |
) | — | ||||||||||||||||||||||||||||
| Long-term lease liabilities |
— | ( |
) | — | ( |
) | ||||||||||||||||||||||||||
| Class share |
— | — | — | — | — | — | — | — | ||||||||||||||||||||||||
| |
|
|
|
|
|
|
|
|
|
|
|
|
|
|
|
|||||||||||||||||
| Non-current liabilities |
( |
) | — | ( |
) |
|||||||||||||||||||||||||||
| |
|
|
|
|
|
|
|
|
|
|
|
|
|
|
|
|
|
|
|
|
|
|
|
|
|
|
|
|
|
|
|
|
| Total |
— | — | ||||||||||||||||||||||||||||||
| |
|
|
|
|
|
|
|
|
|
|
|
|
|
|
|
|||||||||||||||||
| Derivatives |
— | — | ( |
) | ( |
) | — | ( |
) | |||||||||||||||||||||||
Short-term and long-term debt is classified as financial liabilities measured at amortized cost.
TOYOTA MOTOR CORPORATION
NOTES TO CONSOLIDATED FINANCIAL STATEMENTS—(Continued)
(2) Short-term debt
The breakdown of “Short-term debt” is as follows:
Yen in millions |
||||||||
March 31, |
||||||||
2022 |
2023 |
|||||||
| Short-term debt |
||||||||
| (Principally from bank) |
||||||||
| [Weighted average interest rate |
||||||||
| 2022 |
||||||||
| 2023 |
||||||||
| Commercial paper |
||||||||
| [Weighted average interest rate |
||||||||
| 2022 |
||||||||
| 2023 |
||||||||
| |
|
|
|
|||||
| |
|
|||||||
| |
|
|
|
|||||
(3) Long-term debt
The breakdown of “Long-term debt” is as follows:
Yen in millions |
||||||||
March 31, |
||||||||
2022 |
2023 |
|||||||
| Unsecured loans |
||||||||
| (Principally from bank) |
||||||||
| [ 2022 |
||||||||
| Weighted average interest |
||||||||
| Due |
||||||||
| 2023 |
||||||||
| Weighted average interest |
||||||||
| Due |
||||||||
| Secured loans |
||||||||
| (Principally financial receivables securitization) |
||||||||
| [ 2022 |
||||||||
| Weighted average interest |
||||||||
| Due |
||||||||
| 2023 |
||||||||
| Weighted average interest |
||||||||
| Due |
|
|
||||||
| Medium-term notes of consolidated subsidiaries |
||||||||
| [ 2022 |
||||||||
| Weighted average interest |
||||||||
| Due |
||||||||
TOYOTA MOTOR CORPORATION
NOTES TO CONSOLIDATED FINANCIAL STATEMENTS—(Continued)
Yen in millions |
||||||||
March 31, |
||||||||
2022 |
2023 |
|||||||
2023 |
||||||||
Weighted average interest |
||||||||
Due |
||||||||
Unsecured bonds of the parent |
||||||||
[ 2022 |
||||||||
Weighted average interest |
||||||||
Due |
||||||||
2023 |
||||||||
Weighted average interest |
||||||||
Due |
||||||||
Unsecured bonds of consolidated subsidiaries |
||||||||
[ 2022 |
||||||||
Weighted average interest |
||||||||
Due |
||||||||
2023 |
||||||||
Weighted average interest |
||||||||
Due |
|
|
||||||
Secured bonds of consolidated subsidiaries |
||||||||
[ 2022 |
||||||||
Weighted average interest |
||||||||
Due |
||||||||
2023 |
||||||||
Weighted average interest |
||||||||
Due |
||||||||
Less - Current portion due within one year |
( |
) | ( |
) | ||||
As of March 31, 2022 and 2023, the currencies of long-term debt are 52 % and 53 % in US dollars, 11 % and 11 % in Japanese yen, 13 % and 13 % in Euros, 6 % and 6 % in Australian dollars, 4 % and 3 % in Canadian dollars, 14 % and 14 % in other currencies.
(4) Assets pledges as collateral
The breakdown of assets pledged as collateral mainly for loans of consolidated subsidiaries is as follows:
Yen in millions |
||||||||
March 31, |
||||||||
2022 |
2023 |
|||||||
Property, plant and equipment |
||||||||
Other assets |
||||||||
Total |
|
|
||||||
Other assets principally consist of securitized finance receivables.
TOYOTA MOTOR CORPORATION
NOTES TO CONSOLIDATED FINANCIAL STATEMENTS—(Continued)
Standard agreements with certain banks include provisions that collateral (including sums on deposit with such banks) or guarantees will be furnished upon the banks’ request and that any collateral furnished, pursuant to such agreements or otherwise, will be applicable to all present or future indebtedness to such banks.
(5) Interest expenses
The interest expenses for the fiscal year ended March 31, 2022 and 2023 are ¥410,197 million and ¥651,979 million, respectively. Interest expenses related to the financial business is included in “cost of financial services” in the consolidated statement of income.
(6) Class shares
TMC issued First Series Model AA Class Shares (the “Model AA Class Shares”) on July 24, 2015. Presented below is additional information regarding the Model AA Class Shares:
Total number of shares issued |
: | |||
Issue price |
: | |||
Purchase price |
: | |||
Voting rights |
: | Model AA Class Shares shall have voting rights. The number of shares constituting one unit with respect to Model AA Class Shares shall be 100. | ||
Restrictions on transfer |
: | Model AA Class Shares shall have restrictions on transfer. | ||
Dividends |
: | (1) If the record date falls in the fiscal year ending on March 31, 2016 : | ||
(2) If the record date falls in the fiscal year ending on March 31, 2017 through March 31, 2020 : the annual dividend rate for the previous fiscal year plus | ||||
(3) If the record date falls in the fiscal year ending on March 31, 2021 or later : | ||||
Shareholder’s right |
: | (1) Shareholder’s conversion right into Common Shares | ||
Shareholders of the Model AA Class Shares may demand TMC to acquire all or a part of their Model AA Class Shares in exchange for Common Shares on the first business day of April and October of every year, starting October 1, 2020. | ||||
(2) Shareholder’s cash put option | ||||
Shareholders of the Model AA Class Shares may demand TMC to acquire all or a part of their Model AA Class Shares in exchange for cash on the last business day of March, June, September and December of each year, starting on September 1, 2020. | ||||
TMC’s right |
: | TMC may acquire, on or after April 2, 2021, all of the outstanding Model AA Class Shares in exchange for cash. At the Directors’ Meeting held on December 14, 2020, TMC has resolved to exercise its cash call option to acquire all outstanding Model AA Class Shares and, subject to such acquisition, to cancel all Model AA Class Shares pursuant to Article 178 of the Companies Act of Japan. The acquisition took place on April 2, 2021, and the cancellation was completed on April 3, 2021. | ||
F-50
TOYOTA MOTOR CORPORATION
NOTES TO CONSOLIDATED FINANCIAL STATEMENTS—(Continued)
18. Other financial liabilities
Other financial liabilities consist of the following:
Yen in millions |
||||||||
March 31, |
||||||||
2022 |
2023 |
|||||||
Financial liabilities measured at amortized cost |
||||||||
Deposits received |
||||||||
Other |
||||||||
Financial liabilities measured at fair value through profit or loss |
||||||||
Derivatives |
||||||||
Total |
||||||||
Current liabilities |
||||||||
Non-current liabilities |
||||||||
Total |
||||||||
19. Financial risks
(1) Financial risk management policy
Toyota is exposed to various risks such as credit risk, liquidity risk, market risk (foreign currency risk, interest rate risk, commodity price fluctuation risk and stock price fluctuation risk). To hedge the market risk, Toyota also uses derivative financial instruments such as forward exchange contracts, interest rate swaps, commodity forwards transactions. With respect to the execution and management of derivative transactions, it follows the company regulations that set out transaction authority, and it is a policy not to conduct speculative transactions using derivative financial instruments.
In addition, Toyota procures necessary funds (mainly bank borrowings and issuing corporate bonds) based on the capital expenditure plans, and temporary surplus funds are managed with highly safe financial assets and short-term working capital is procured through bank borrowings and commercial paper. As for liquidity risk concerning fund procurement, each company manages it by preparing a monthly cash flow plan, etc.
(2) Credit risk
Receivables related to financial services are exposed to the credit risk. The risk is arisen from the failure of customers or dealers to meet the terms of their contracts with Toyota or otherwise fail to perform as agreed. Toyota manages its credit risk by defining risk management methods and management systems for specific risks in accordance with the regulations on risk management. Based on such regulations, Toyota mitigates the credit risk through periodical monitoring of the customer’s credit status and undertaking the maturity control and account balance control, while detecting promptly any doubtful accounts caused by deterioration in the financial conditions.
Please see Note 3 “Allowance for credit losses on finance receivables” about measuring method of the expected credit losses on receivables related to financial services.
TOYOTA MOTOR CORPORATION
NOTES TO CONSOLIDATED FINANCIAL STATEMENTS—(Continued)
The carrying amount after impairment of the financial assets presented in the consolidated financial statements, as well as guarantee obligations and loan commitments that are set forth in the notes to the consolidated financial statements, are the maximum exposure to the credit risk of Toyota’s financial assets that do not take into account the value of the acquired collateral. The allowance for credit exposures of loan commitments and financial agreements is measured in the same way that the allowance for retail receivables is measured.
Retail receivables and financial lease receivables are being secured by vehicles as collateral. Wholesale receivables and other dealer loans are secured by placing appropriate property as collateral. Also, during the reporting period, there is no change in the policy regarding collateral.
The net changes in the allowance for credit losses relating to the retail receivables are as follows:
Yen in millions |
||||||||||||||||
For the year ended March 31, 2022 |
||||||||||||||||
Expected credit loss for 12 months |
Lifetime expected credit loss |
Total |
||||||||||||||
Financial receivable not credit-impaired |
Credit-impaired financial receivable |
|||||||||||||||
Allowance for credit loss at beginning of year |
|
|
||||||||||||||
Provision for credit loss, net of reversal |
||||||||||||||||
Charge-offs |
— | — | ( |
) | ( |
) | ||||||||||
Other |
( |
) | ( |
) | ( |
) | ||||||||||
Allowance for credit loss at end of year |
|
|||||||||||||||
Yen in millions |
||||||||||||||||
For the year ended March 31, 2023 |
||||||||||||||||
Expected credit loss for 12 months |
Lifetime expected credit loss |
Total |
||||||||||||||
Financial receivable not credit-impaired |
Credit-impaired financial receivable |
|||||||||||||||
Allowance for credit loss at beginning of year |
|
|||||||||||||||
Provision for credit loss, net of reversal |
||||||||||||||||
Charge-offs |
( |
) | ( |
) | ||||||||||||
Other |
( |
) | ( |
) | ( |
) | ||||||||||
Allowance for credit loss at end of year |
|
|||||||||||||||
“Other” primarily includes reversal of allowance for credit loss due to the collection of retail receivables.
TOYOTA MOTOR CORPORATION
NOTES TO CONSOLIDATED FINANCIAL STATEMENTS—(Continued)
The table below shows the retail receivables segregated into aging categories based on the numbers of the days outstanding:
Yen in millions |
||||||||||||||||
March 31, 2022 |
||||||||||||||||
Expected credit loss for 12 months |
Lifetime expected credit loss |
Total |
||||||||||||||
Financial receivable not credit-impaired |
Credit-impaired financial receivable |
|||||||||||||||
Current |
— | |||||||||||||||
Past due less than 90 days |
||||||||||||||||
Past due 90 days or more |
— | |||||||||||||||
Total |
|
|||||||||||||||
Yen in millions |
||||||||||||||||
March 31, 2023 |
||||||||||||||||
Expected credit loss for 12 months |
Lifetime expected credit loss |
Total |
||||||||||||||
Financial receivable not credit-impaired |
Credit-impaired financial receivable |
|||||||||||||||
Current |
||||||||||||||||
Past due less than 90 days |
||||||||||||||||
Past due 90 days or more |
||||||||||||||||
Total |
|
|||||||||||||||
The net changes in the allowance for credit losses relating to the finance lease receivables are as follows:
Yen in millions |
||||||||
For the years ended March 31, |
||||||||
2022 |
2023 |
|||||||
Allowance for credit loss at beginning of year |
||||||||
Provision for credit loss, net of reversal |
||||||||
Charge-offs |
( |
) | ( |
) | ||||
Other |
( |
) | ( |
) | ||||
Allowance for credit loss at end of year |
||||||||
“Other” primarily includes reversal of allowance for credit loss due to the collection of finance lease receivables.
TOYOTA MOTOR CORPORATION
NOTES TO CONSOLIDATED FINANCIAL STATEMENTS—(Continued)
The table below shows the finance lease receivables segregated into aging categories based on the numbers of the days outstanding:
Yen in millions |
||||||||
March 31, |
||||||||
2022 |
2023 |
|||||||
Current |
||||||||
Past due less than 90 days |
||||||||
Past due 90 days or more |
||||||||
Total |
||||||||
The table below shows the net movement of the allowance for credit losses on wholesale receivables and other dealer loans.
Yen in millions |
||||||||||||||||
For the year ended March 31, 2022 |
||||||||||||||||
Expected credit loss for 12 months |
Lifetime expected credit loss |
Total |
||||||||||||||
Financial receivable not credit-impaired |
Credit-impaired financial receivable |
|||||||||||||||
Allowance for credit loss at beginning of year |
|
|
||||||||||||||
Provision for credit loss, net of reversal |
||||||||||||||||
Charge-offs |
— | — | ( |
) | ( |
) | ||||||||||
Other |
( |
) | ( |
) | ( |
) | ( |
) | ||||||||
Allowance for credit loss at end of year |
|
|
||||||||||||||
Yen in millions |
||||||||||||||||
For the year ended March 31, 2023 |
||||||||||||||||
Expected credit loss for 12 months |
Expected credit loss for the entire period |
Total |
||||||||||||||
Financial receivable not credit-impaired |
Credit-impaired financial receivable |
|||||||||||||||
Allowance for credit loss at beginning of year |
||||||||||||||||
Provision for credit loss, net of reversal |
||||||||||||||||
Charge-offs |
||||||||||||||||
Other |
( |
) | ( |
) | ( |
) | ( |
) | ||||||||
Allowance for credit loss at end of year |
||||||||||||||||
“Other” primarily includes reversal of allowance for credit loss due to the collection of wholesale receivables and other dealer loans.
Toyota charges off the credit - impaired finance receivables when Toyota considers that all or part of it will not be collected. The amount of receivables related to financial services which has been charged off but subject to ongoing collection activity was not significant for the years ended March 31, 2022 and 2023.
TOYOTA MOTOR CORPORATION
NOTES TO CONSOLIDATED FINANCIAL STATEMENTS—(Continued)
The balances of the wholesale receivables and other dealer loan receivables portfolios by credit status, as well as loan commitments and financial guarantee contracts, as of March 31, 2022 and 2023 are as follows.
The wholesale and other dealer loan receivables portfolio segment is segregated into following creditqualities below based on internal risk assessments by dealers.
Performing: Account not classified as either
Credit Watch, At Risk or DefaultCredit Watch: Account designated for elevated attention
At Risk: Account where there is an increased likelihood that default may exist based on qualitative and quantitative factors
Default: Account is not currently meeting contractual obligations, or we have temporarily waived certain contractual requirements
Yen in millions |
||||||||||||||||
March 31, 2022 |
||||||||||||||||
Expected credit loss for 12 months |
Lifetime expected credit loss |
|||||||||||||||
Financial receivable not credit-impaired |
Credit-impaired financial receivable |
Total |
||||||||||||||
| Wholesale and other dealer loan |
||||||||||||||||
| Performing |
— | — | ||||||||||||||
| Credit Watch |
— | |||||||||||||||
| At Risk |
— | |||||||||||||||
| Default |
— | — | ||||||||||||||
| Loan commitments |
||||||||||||||||
| Financial guarantee contracts |
— | |||||||||||||||
| |
|
|
|
|
|
|
|
|||||||||
| Total |
||||||||||||||||
| |
|
|
|
|
|
|
|
|||||||||
Yen in millions |
||||||||||||||||
March 31, 2023 |
||||||||||||||||
Expected credit loss for 12 months |
Lifetime expected credit loss |
|||||||||||||||
Financial receivable not credit-impaired |
Credit-impaired financial receivable |
Total |
||||||||||||||
| Wholesale and other dealer loan |
||||||||||||||||
| Performing |
||||||||||||||||
| Credit Watch |
||||||||||||||||
| At Risk |
||||||||||||||||
| Default |
||||||||||||||||
| Loan commitments |
||||||||||||||||
| Financial guarantee contracts |
||||||||||||||||
| |
|
|
|
|
|
|
|
|||||||||
| Total |
||||||||||||||||
| |
|
|
|
|
|
|
|
|||||||||
TOYOTA MOTOR CORPORATION
NOTES TO CONSOLIDATED FINANCIAL STATEMENTS—(Continued)
For the year ended March 31, 2022 and 2023, the amount of finance receivables the terms of which were modified due to deterioration in credit conditions was not significant for any portfolio of finance receivables, and the amount of payment defaults on finance receivables so modified were not significant for any portfolio of such receivables.
(3) Liquidity risk
To secure cash on hand necessary for carrying out the operation, Toyota appropriately borrows from the financial institutions and issues corporate bonds or commercial paper, and there is a risk of failing to execute the payment on due date because of deterioration of fund procurement environment etc.,.
Toyota manages liquidity risk by monitoring the fund demand of each group company as appropriate, preparing a monthly-based funding plan, and comparing it with the daily cash flow. In addition to holding sufficient cash and cash equivalents in order to secure the liquidity and stability of funds, to prepare for emergency situations such as the sudden fund demand and market liquidity deterioration, a commitment line has been set up.
The amounts of
non-derivative
financial liabilities and derivative financial liabilities by a remaining contract maturity period are as follows: As of March 31, 2022
Yen in millions |
||||||||||||||||||||||||
Maturities |
||||||||||||||||||||||||
Book value |
Contractual cash flows |
Within 1 year |
Between 1 and 3 years |
Between 3 and 5 years |
Later than 5 years |
|||||||||||||||||||
| Non-derivative financial liabilities |
||||||||||||||||||||||||
| Short-term debt |
( |
) | ( |
) | — | — | — | |||||||||||||||||
| Commercial paper |
( |
) | ( |
) | — | — | — | |||||||||||||||||
| Current portion of long-term |
( |
) | ( |
) | — | — | — | |||||||||||||||||
| Long-term debt |
( |
) | — | ( |
) | ( |
) | ( |
) | |||||||||||||||
| Lease liabilities |
( |
) | ( |
) | ( |
) | ( |
) | ( |
) | ||||||||||||||
| |
|
|
|
|
|
|
|
|
|
|
|
|||||||||||||
| Total |
( |
) | ( |
) | ( |
) | ( |
) | ( |
) | ||||||||||||||
| |
|
|
|
|
|
|
|
|
|
|
|
|||||||||||||
| Derivative financial liabilities |
||||||||||||||||||||||||
| Interest derivative |
( |
) | ( |
) | ( |
) | ( |
) | ( |
) | ||||||||||||||
| Currency derivative |
||||||||||||||||||||||||
| In |
— | |||||||||||||||||||||||
| Out |
( |
) | ( |
) | ( |
) | ( |
) | ( |
) | ||||||||||||||
| |
|
|
|
|
|
|
|
|
|
|
|
|||||||||||||
| Total |
( |
) | ( |
) | ( |
) | ( |
) | ( |
) | ||||||||||||||
| |
|
|
|
|
|
|
|
|
|
|
|
|||||||||||||
| Total |
( |
) | ( |
) | ( |
) | ( |
) | ( |
) | ||||||||||||||
| |
|
|
|
|
|
|
|
|
|
|
|
|||||||||||||
TOYOTA MOTOR CORPORATION
NOTES TO CONSOLIDATED FINANCIAL STATEMENTS—(Continued)
As of March 31, 2023
Yen in millions |
||||||||||||||||||||||||
Maturities |
||||||||||||||||||||||||
Book value |
Contractual cash flows |
Within 1 year |
Between 1 and 3 years |
Between 3 and 5 years |
Later than 5 years |
|||||||||||||||||||
| Non-derivative financial liabilities |
||||||||||||||||||||||||
| Short-term debt |
( |
) | ( |
) | — | — | — | |||||||||||||||||
| Commercial paper |
( |
) | ( |
) | — | — | — | |||||||||||||||||
| Current portion of long-term |
( |
) | ( |
) | — | — | — | |||||||||||||||||
| Long-term debt |
( |
) | — | ( |
) | ( |
) | ( |
) | |||||||||||||||
| Lease liabilities |
( |
) | ( |
) | ( |
) | ( |
) | ( |
) | ||||||||||||||
| |
|
|
|
|
|
|
|
|
|
|
|
|||||||||||||
| Total |
( |
) | ( |
) | ( |
) | ( |
) | ( |
) | ||||||||||||||
| |
|
|
|
|
|
|
|
|
|
|
|
|||||||||||||
| Derivative financial liabilities |
||||||||||||||||||||||||
| Interest derivative |
( |
) | ( |
) | ( |
) | ( |
) | ( |
) | ||||||||||||||
| Currency derivative |
||||||||||||||||||||||||
| In |
— | — | ||||||||||||||||||||||
| Out |
( |
) | ( |
) | ( |
) | ( |
) | — | |||||||||||||||
| |
|
|
|
|
|
|
|
|
|
|
|
|||||||||||||
| Total |
( |
) | ( |
) | ( |
) | ( |
) | ( |
) | ||||||||||||||
| |
|
|
|
|
|
|
|
|
|
|
|
|||||||||||||
| Total |
( |
) | ( |
) | ( |
) | ( |
) | ( |
) | ||||||||||||||
| |
|
|
|
|
|
|
|
|
|
|
|
|||||||||||||
Toyota has unused short-term lines of credit amounting to ¥2,534,291 million and ¥2,715,437 million of which ¥1,056,931 million and ¥1,153,342 million related to commercial paper programs as of March 31, 2022 and 2023, respectively. Under these programs, Toyota is authorized to obtain short-term financing at prevailing interest rates for periods not in excess of 360 days.
As of March 31, 2022 and 2023, Toyota has unused long-term lines of credit amounting to
million, respectively.
(4) Foreign exchange risk
Toyota is subject to the for
e
ign currency exposure through transactions in foreign currencies related to purchase, sale and finance associated with conducting business worldwide. Toyota is exposed to fluctuations risks related to future profitability or assets and liabilities regarding operating cash flow denominated in foreign currencies and various financial instruments. The most significant foreign currency exposure is primarily caused by the U.S. dollar and the euro. Toyota uses derivative financial instruments including foreign exchange forward contracts, foreign currency options, interest rate currency swap agreements, and others, to manage the exposure to foreign currency exchange rate fluctuations.
TOYOTA MOTOR CORPORATION
NOTES TO CONSOLIDATED FINANCIAL STATEMENTS—(Continued)
Toyota uses analysis measurement (“VaR”) to assess the risk of exchange rate fluctuation. Potential impact of
Value-at-risk
pre-tax
cash flows on VaR-integrated
foreign currency positions (including derivatives) for the years ended March 31, 2022 and 2023 is as follows: Yen in millions |
||||||||||||||||
VaR |
||||||||||||||||
Year-end |
Average |
Maximum |
Minimum |
|||||||||||||
| For the year ended March 31, 2022 |
||||||||||||||||
| For the year ended March 31, 2023 |
||||||||||||||||
The Monte Carlo simulation method is used for Toyota’s VaR measurement, and measurement is based on a 95% confidence interval and a
ten-day
holding period. (5) Interest rate risk
In preceding with business activities, Toyota is exposed to interest rate risk due to fluctuation in market interest rates as it procures and invests funds necessary for working capital and capital investment. To maintain a desirable level of exposure related to interest rate fluctuation risk and minimize interest expense, Toyota conducts various financial instruments transactions.
Sensitivity analysis of Toyota’s interest rate risk associated with holding financial instruments if the interest rate increases by 1
Yen in millions |
||||||||
For the years ended March 31, |
||||||||
2022 |
2023 |
|||||||
| Impact on income before income taxes |
( |
) | ( |
) | ||||
| Impact on other comprehensive income, before tax effect |
( |
) | ( |
) | ||||
(6) Market price fluctuation risk
Toyota is exposed to risks arising from increased costs due to commodity price fluctuations, such as iron and steel, precious metals and
non-ferrous
alloys used in the manufacture of automobiles. Toyota controls the price risk associated with the purchase of those commodities by maintaining inventory at the minimum level. Toyota is exposed to stock price fluctuation risk because it owns shares of companies that have business relationships mainly for promoting smooth business activities. Toyota periodically reviews the fair values and financial situations of the business partner companies and, taking into consideration the relationship with them, continually reviews the holding status. The impact on other comprehensive income, before tax effect when the declared price of equity financial assets (shares) in active markets changes by 10 316,281 ¥321,472
million and
million, respectively.
20. Derivative financial instruments
(1) Undesignated derivative financial instruments
Toyota uses foreign exchange forward contracts, foreign currency options, interest rate swaps, interest rate currency swap agreements, and interest rate options, to manage its exposure to foreign currency exchange rate fluctuations and interest rate fluctuations from an economic perspective, and Toyota is unable to or has elected not to apply hedge accounting. Toyota does not use derivatives for speculation or trading.
TOYOTA MOTOR CORPORATION
NOTES TO CONSOLIDATED FINANCIAL STATEMENTS—(Continued)
(2) Fair value and gain and losses of derivatives
The fair values of the derivatives as of March 31, 2022 and 2023 are as follows:
Yen in millions |
||||||||
March 31, |
||||||||
2022 |
2023 |
|||||||
Derivative assets |
||||||||
Derivative financial instruments not designated as hedging instruments: |
||||||||
Interest rate and currency swap |
||||||||
Current assets |
||||||||
- Other financial assets |
||||||||
Non-current assets |
||||||||
- Other financial assets |
||||||||
Total |
||||||||
Foreign exchange forward and option contracts |
||||||||
Current assets |
||||||||
- Other financial assets |
||||||||
Non-current assets |
||||||||
- Other financial assets |
— | — | ||||||
Total |
||||||||
Total derivative assets |
|
|
||||||
Yen in millions |
||||||||
March 31, |
||||||||
2022 |
2023 |
|||||||
Derivative financial liabilities |
||||||||
Derivative financial instruments not designated as hedging instruments: |
||||||||
Interest rate and currency swap |
||||||||
Current liabilities |
||||||||
- Other financial liabilities |
( |
) | ( |
) | ||||
Non-current liabilities |
||||||||
- Other financial liabilities |
( |
) | ( |
) | ||||
Total |
( |
) | ( |
) | ||||
Foreign exchange forward and option contracts |
||||||||
Current liabilities |
||||||||
- Other financial liabilities |
( |
) | ( |
) | ||||
Non-current liabilities |
||||||||
- Other financial liabilities |
— | — | ||||||
Total |
( |
) | ( |
) | ||||
Total derivative liabilities |
( |
) | ( |
) | ||||
TOYOTA MOTOR CORPORATION
NOTES TO CONSOLIDATED FINANCIAL STATEMENTS—(Continued)
The amount of underlying notional of derivatives as of March 31, 2022 and 2023 are as follows:
Yen in millions |
||||||||
March 31, |
||||||||
2022 |
2023 |
|||||||
| Derivative financial instruments not designated as hedging instruments: | ||||||||
Interest rate and currency swap |
||||||||
Foreign exchange forward and option contracts |
||||||||
Total |
||||||||
Undesignated derivative financial instruments are used to manage economic risks of fluctuations in foreign currency exchange rates and interest rates of certain receivables and payables. Those economic risks are offset by changes in the fair value of undesignated derivative financial instruments.
The gain (loss) on derivative transactions as of March 31, 2021, 2022 and 2023 were ¥588 million, ¥773
million and ¥
(129,782 )
million, respectively. The amounts are included in cost of financial services and foreign exchange gain (loss), net.
Cash flows from transactions of derivative financial instruments are included in cash flows from operating activities in the consolidated statement of cash flows.
(3) Credit risk related contingent features
Toyota enters into International Swaps and Derivatives Association Master Agreements with counterparties. These Master Agreements contain a provision requiring either Toyota or the counterparty to settle the contract or to post assets to the other party in the event of a ratings downgrade below a specified threshold.
The aggregate fair value amount of derivative financial instruments that contain credit risk related contingent features that are in a net liability position after being offset by cash collateral as of March 31, 2022 and 2023 is
million, respectively. The aggregate fair value amount of assets that are already posted as cash collateral as of March 31, 2022 and 2023 is
million, respectively. If the ratings of Toyota decline below specified thresholds, the maximum amount of assets to be posted or for which Toyota could be required to settle the contracts is
million as of March 31, 2023. See Note 22 for details.
21.
Fair value measurement
(1) Definition of fair value hierarchy
In accordance with IFRS, Toyota classifies fair value measurement into the following three levels based on the observability and significance of the inputs used.
| Level 1: | Quoted prices in active markets for identical assets or liabilities | |
| Level 2: | Fair value measurement based on inputs other than quoted prices included within Level 1 that are observable for the assets or liabilities, either directly or indirectly | |
| Level 3: | Fair value measurement based on models using unobservable inputs for the assets or liabilities | |
TOYOTA MOTOR CORPORATION
NOTES TO CONSOLIDATED FINANCIAL STATEMENTS—(Continued)
(2) Method of fair value measurement
The fair value of assets and liabilities is determined using relevant market information and appropriate valuation methods.
The methods and assumptions for measuring the fair value of assets and liabilities are as follows:
(i) Cash and cash equivalents -
Cash equivalents include money market funds and other investments with original maturities of three months or less. In the normal course of business, substantially all cash and cash equivalents and time deposits are highly liquid and are carried at amounts which approximate fair value due to their short duration.
(ii) Trade accounts and other receivables and Trade accounts and other payables -
These receivables and payables are carried at amounts which approximate fair value due to their short duration.
(iii) Receivables related to financial services -
The fair value of receivables related to financial services is estimated by discounting expected cash flows to present value using internal assumptions, including prepayment speeds, expected credit losses and collateral value.
As unobservable inputs are utilized, the fair value of receivables related to financial services is classified as Level 3.
(iv) Other financial assets -
(Public and corporate bonds)
Public and corporate bonds include government bonds. Japanese bonds and foreign bonds, including U.S., European and other bonds, represent 26 % and 74 % (as of March 31, 2022) and 30 % and 70 % (as of March 31, 2023) of public and corporate bonds, respectively. Toyota primarily uses quoted market prices for identical assets to measure the fair value of these securities.
(Stocks)
Listed stocks on the Japanese stock markets represent 85 % (as of March 31, 2022) and 86 % (as of March 31, 2023) of stocks that Toyota holds. Toyota primarily uses quoted market prices for identical assets to measure fair value of these securities. Therefore, stocks with an active market are classified as Level 1.
Fair value of stocks with no active market is measured by using the market approach or other appropriate methods. Therefore, stocks with no active market are thus classified as Level 3.
Price book-value ratios (“PBR”) of comparable companies, discount ratios of discounted cash flow valuation method and others are the significant unobservable inputs relating to the fair value measurement of stocks classified as Level 3. The fair value increases (decreases) as PBR of a comparable company rises (declines) or the discount rate declines (rises). The estimated increase or decrease in fair value of stocks if the unobservable inputs were to be replaced by other reasonable alternative assumptions are not significant.
TOYOTA MOTOR CORPORATION
NOTES TO CONSOLIDATED FINANCIAL STATEMENTS—(Continued)
These estimates are based on valuation methods that are considered appropriate in each case. The significant assumptions involved in the estimations include the financial condition and future prospects and trends of the investees and the outcome of the referenced transactions. Due to the uncertain nature of these assumptions or by using different assumptions and estimates, the fair value may be impacted materially.
The shares classified as Level 3 are measured by the responsible department using quarterly available information in accordance with Toyota’s consolidated financial accounting policies and reported to the supervisors along with the basis of the change in fair value.
(v) Derivative financial instruments -
Toyota employs derivative financial instruments, including foreign exchange forward contracts, foreign currency options, interest rate swaps, interest rate currency swap agreements and interest rate options to manage its exposure to fluctuations in interest rates and foreign currency exchange rates. Toyota primarily estimates the fair value of derivative financial instruments using industry-standard valuation models that require observable inputs including interest rates and foreign exchange rates, and the contractual terms. The usage of these models does not require significant judgment to be applied. These derivative financial instruments are classified as Level 2. In other certain cases when market data are not available, key inputs to the fair value measurement include quotes from counterparties, and other market data. Toyota assesses the reasonableness of changes of the quotes using observable market data. These derivative financial instruments are classified as Level 3. Toyota’s derivative fair value measurements consider assumptions about counterparty and Toyota’s own
non-performance
risk, using such as credit default probabilities. (vi) Short-term and long-term debt -
The fair values of short-term and long-term debt including the current portion, except for secured loans provided by securitization transactions using special-purpose entities (“Loans Based on Securitization”), are estimated based on the discounted amounts of future cash flows using Toyota’s current borrowing rates for similar liabilities. As these inputs are observable, the fair value of these debts is classified as Level 2.
The fair values of the Loans Based on Securitization are primarily estimated based on current market rates and credit spreads for debt with similar maturities. Internal assumptions including prepayment speeds and expected credit losses are used to estimate the timing of cash flows to be paid on the underlying securitized assets. In cases where these valuations utilize unobservable inputs, the fair value of the Loans Based on Securitization is classified as Level 3.
TOYOTA MOTOR CORPORATION
NOTES TO CONSOLIDATED FINANCIAL STATEMENTS—(Continued)
(3) Financial instrument measured at fair value on recurring basis
The following table summarizes the fair values of the assets and liabilities measured at fair value on a recurring basis. Transfers between levels of the fair value are recognized at the date of the event or change in circumstances that caused the transfer:
Yen in millions |
||||||||||||||||
March 31, 2022 |
||||||||||||||||
Level 1 |
Level 2 |
Level 3 |
Total |
|||||||||||||
| Other financial assets: |
||||||||||||||||
| Financial assets measured at fair value through profit or loss |
||||||||||||||||
| Public and corporate bonds |
||||||||||||||||
| Stocks |
— | — | ||||||||||||||
| Derivative financial instruments |
— | — | ||||||||||||||
| Other |
— | |||||||||||||||
| |
|
|
|
|
|
|
|
|||||||||
| Total |
||||||||||||||||
| |
|
|
|
|
|
|
|
|||||||||
| Financial assets measured at fair value through other comprehensive income |
||||||||||||||||
| Public and corporate bonds |
||||||||||||||||
| Stocks |
— | |||||||||||||||
| Other |
— | |||||||||||||||
| |
|
|
|
|
|
|
|
|||||||||
| Total |
||||||||||||||||
| |
|
|
|
|
|
|
|
|||||||||
| Other financial liabilities: |
||||||||||||||||
| Financial liabilities measured at fair value through profit or loss |
||||||||||||||||
| Derivative financial instruments |
— | ( |
) | — | ( |
) | ||||||||||
| |
|
|
|
|
|
|
|
|||||||||
| Total |
— | ( |
) | — | ( |
) | ||||||||||
| |
|
|
|
|
|
|
|
|||||||||
Yen in millions |
||||||||||||||||
March 31, 2023 |
||||||||||||||||
Level 1 |
Level 2 |
Level 3 |
Total |
|||||||||||||
| Other financial assets: |
||||||||||||||||
| Financial assets measured at fair value through profit or loss |
||||||||||||||||
| Public and corporate bonds |
||||||||||||||||
| Stocks |
— | — | ||||||||||||||
| Derivative financial instruments |
— | — | ||||||||||||||
| Other |
— | |||||||||||||||
| |
|
|
|
|
|
|
|
|||||||||
| Total |
||||||||||||||||
| |
|
|
|
|
|
|
|
|||||||||
| Financial assets measured at fair value through other comprehensive income |
||||||||||||||||
| Public and corporate bonds |
||||||||||||||||
| Stocks |
— | |||||||||||||||
| Other |
— | — | ||||||||||||||
| |
|
|
|
|
|
|
|
|||||||||
| Total |
||||||||||||||||
| |
|
|
|
|
|
|
|
|||||||||
| Other financial liabilities: |
||||||||||||||||
| Financial liabilities measured at fair value through profit or loss |
||||||||||||||||
| Derivative financial instruments |
— | ( |
) | — | ( |
) | ||||||||||
| |
|
|
|
|
|
|
|
|||||||||
| Total |
— | ( |
) | — | ( |
) | ||||||||||
| |
|
|
|
|
|
|
|
|||||||||
TOYOTA MOTOR CORPORATION
NOTES TO CONSOLIDATED FINANCIAL STATEMENTS—(Continued)
(4) Changes in financial instruments classified as Level 3 and measured at fair value on recurring basis
The following table summarizes the changes in Level 3 assets
and
liabilities measured at
fair value on
a recurring basis for the years ended March 31, 2022 and 2023: Yen in millions |
||||||||||||||||
For the year ended March 31, 2022 |
||||||||||||||||
Public and corporate bonds |
Stocks |
Derivative financial instruments |
Total |
|||||||||||||
| Balance at beginning of year |
— | |||||||||||||||
| Total gains (losses) |
||||||||||||||||
| Net income (loss) |
( |
) | — | |||||||||||||
| Other comprehensive income (loss) |
— | — | ||||||||||||||
| Purchases and issuances |
— | |||||||||||||||
| Sales and settlements |
( |
) | ( |
) | — | ( |
) | |||||||||
| Transfer to (from) Level 3 |
( |
) | ( |
) | — | ( |
) | |||||||||
| Others |
— | |||||||||||||||
| |
|
|
|
|
|
|
|
|||||||||
| Balance at end of year |
— | |||||||||||||||
| |
|
|
|
|
|
|
|
|||||||||
| Unrealized gains or losses included in profit or loss on assets held at March 31 |
( |
) | — | |||||||||||||
| |
|
|
|
|
|
|
|
|||||||||
| Total |
( |
) | — | |||||||||||||
| |
|
|
|
|
|
|
|
|||||||||
Yen in millions |
||||||||||||||||
For the year ended March 31, 2023 |
||||||||||||||||
Public and corporate bonds |
Stocks |
Derivative financial instruments |
Total |
|||||||||||||
| Balance at beginning of year |
— | |||||||||||||||
| Total gains (losses) |
||||||||||||||||
| Net income (loss) |
( |
) | — | |||||||||||||
| Other comprehensive income (loss) |
— | ( |
) | — | ( |
) | ||||||||||
| Purchases and issuances |
— | |||||||||||||||
| Sales and settlements |
( |
) | ( |
) | — | ( |
) | |||||||||
| Transfer to (from) Level 3 |
( |
) | — | |||||||||||||
| Others |
— | |||||||||||||||
| |
|
|
|
|
|
|
|
|||||||||
| Balance at end of year |
— | |||||||||||||||
| |
|
|
|
|
|
|
|
|||||||||
| Unrealized gains or losses included in profit or loss on assets held at March 31 |
( |
) | — | |||||||||||||
| |
|
|
|
|
|
|
|
|||||||||
| Total |
( |
) | — | |||||||||||||
| |
|
|
|
|
|
|
|
|||||||||
Net income (loss) in public and corporate bonds, stocks and derivative financial instruments, other than transactions related to financial services, are each included in “Other finance income” and “Other finance costs” in the accompanying consolidated statement of income. Transactions related to financial services are included in each of “Sales revenues—Financial services” and “Cost of financial services”
in
the consolidated statement of income. In the reconciliation table above, derivative financial instruments are presented as net of assets and liabilities.
TOYOTA MOTOR CORPORATION
NOTES TO CONSOLIDATED FINANCIAL STATEMENTS—(Continued)
“Others” includes foreign currency translation adjustments for the year ended March 31, 2022 and 2023.
Transfer to (from) Level 3 of stocks recognized in the year ended March 31, 2022 is due to the listing of investees.
(5) Financial assets and liabilities measured at amortized cost
The following table summarizes the carrying amount and the fair value of financial assets and liabilities measured on an amortized cost basis:
Yen in millions |
||||||||||||||||||||
March 31, 2022 |
||||||||||||||||||||
Fair value |
||||||||||||||||||||
Carrying amount |
Level 1 |
Level 2 |
Level 3 |
Total |
||||||||||||||||
Receivables related to financial services |
— | — | ||||||||||||||||||
Interest-bearing liabilities |
||||||||||||||||||||
Long-term debt (Including current portion) |
— | |||||||||||||||||||
Yen in millions |
||||||||||||||||||||
March 31, 2023 |
||||||||||||||||||||
Fair value |
||||||||||||||||||||
Carrying amount |
Level 1 |
Level 2 |
Level 3 |
Total |
||||||||||||||||
Receivables related to financial services |
— | — | ||||||||||||||||||
Interest-bearing liabilities |
||||||||||||||||||||
Long-term debt (Including current portion) |
— | |||||||||||||||||||
Of financial assets and liabilities that are measured on an amortized cost basis, those with carrying values that approximate fair value are excluded from the table above.
22. Offsetting Financial Assets and Liabilities
The following table
summ
arizes the amounts of financial assets and financial liabilities that are subject to an enforceable master netting agreement or similar agreement but not set off because they do not meet some or all of the offsetting criteria for financial assets and financial liabilities. With respect to financial instruments that may be offset in the future based on set-off
rights associated with master netting agreements or similar agreements, as well as the associated collateral, the set-off
will be enforceable only when certain circumstances, such as when the counterparty cannot perform on its obligations due to bankruptcy or other reasons, arise. Yen in millions |
||||||||||||||||
March 31, 2022 |
||||||||||||||||
Gross amounts of recognized financial assets and financial liabilities |
Amounts not offset |
Net amount |
||||||||||||||
Financial instruments |
Collateral of financial instruments |
|||||||||||||||
Other financial assets Derivatives |
( |
) | ( |
) | ||||||||||||
Other financial liabilities Derivatives |
( |
) | ( |
) | ||||||||||||
TOYOTA MOTOR CORPORATION
NOTES TO CONSOLIDATED FINANCIAL STATEMENTS—(Continued)
Yen in millions |
||||||||||||||||
March 31, 2023 |
||||||||||||||||
Gross amounts of recognized financial assets and financial liabilities |
Amounts not offset |
Net amount |
||||||||||||||
Financial instruments |
Collateral of financial instruments |
|||||||||||||||
Other financial assets Derivatives |
( |
) | ( |
) | ||||||||||||
Other financial liabilities Derivatives |
( |
) | ( |
) | ||||||||||||
The amounts offset, as presented in the consolidated statement of financial position, in accordance with the criteria for offsetting financial assets and financial liabilities were immaterial.
23. Employee benefits
(1) Overview of post-employment benefit Plans
Upon terminations of employment, employees of TMC and subsidiaries in Japan are entitled, under the retirement plans of each company, to
lump-sum
indemnities or pension payments, based on current rates of pay and lengths of service or the number of “points” mainly determined by those. Under normal circumstances, the minimum payment prior to retirement age is an amount based on voluntary retirement. Employees receive additional benefits on involuntary retirement, including retirement at the age limit. Effective October 1, 2004,
TM
C amended its retirement plan to introduce a “point” based retirement benefit plan. Under the new plan, employees are entitled to lump-sum
or pension payments determined based on accumulated “points” vested in each year of service. There are three types of “points” that vest in each year of service consisting of “service period points” which are attributed to the length of service, “job title points” which are attributed to the job title of each employee, and “performance points” which are attributed to the annual performance evaluation of each employee. Under normal circumstances, the minimum payment prior to retirement age is an amount reflecting an adjustment rate applied to represent voluntary retirement. Employees receive additional benefits upon involuntary retirement, including retirement at the age limit.
Effective October 1, 2005, TMC partly amended its retirement plan and introduced the quasi cash-balance plan under which benefits are determined based on the variable-interest crediting rate rather than the fixed-interest crediting rate as was in the
pre-amended
plan. TMC and most subsidiaries in Japan have contributory funded defined benefit pension plans, which are pursuant to the Corporate Defined Benefit Pension Plan Law (CDBPPL). The contributions to the plans are funded with several financial institutions in accordance with the applicable laws and regulations. These pension plan assets consist principally of common stocks, government bonds and insurance contracts.
Most foreign subsidiaries have pension plans or severance indemnity plans covering substantially all of their employees under which the cost of benefits are currently invested or accrued. The benefits for these plans are based primarily
on
lengths of service and current rates of pay. These post-employment benefit plans are exposed to general investment risk, interest rate risk and inflation risk.
TOYOTA MOTOR CORPORATION
NOTES TO CONSOLIDATED FINANCIAL STATEMENTS—(Continued)
Pension costs and defined benefit obligations are dependent on assumptions used in calculating such amounts. These assumptions include discount rates, retirement rate, salary increase rate, mortality rates and other factors. While management believes that the assumptions used are appropriate, differences in actual experience or changes in assumptions may affect Toyota’s pension costs and obligations.
The most critical assumption impacting the calculation of pension costs and defined benefit obligations is the discount rates. Toyota determines the discount rates mainly based on the rates of high quality fixed income bonds currently available and expected to be available during the period to maturity of the defined benefit pension plans.
Toyota uses a March 31 measurement date for its post-employment benefit plans.
(2) Defined benefit obligations and plan assets
The changes in present value of defined benefit obligations and fair value of plan assets are as follows:
Yen in millions |
||||||||||||||||
For the years ended March 31, |
||||||||||||||||
2022 |
2023 |
|||||||||||||||
Japanese plans |
Foreign plans |
Japanese plans |
Foreign plans |
|||||||||||||
| Present value of defined benefit obligations: |
||||||||||||||||
| Benefit obligations at beginning of year |
||||||||||||||||
| Current service cost |
||||||||||||||||
| Interest cost |
||||||||||||||||
| Remeasurements: |
||||||||||||||||
| Changes in demographic assumptions |
||||||||||||||||
| Changes in financial assumptions |
( |
) | ( |
) | ( |
) | ( |
) | ||||||||
| Other |
( |
) | ||||||||||||||
| Past service cost |
( |
) | ||||||||||||||
| Plan participants’ contributions |
||||||||||||||||
| Benefits paid |
( |
) | ( |
) | ( |
) | ( |
) | ||||||||
| Acquisition and other |
— | — | ||||||||||||||
| |
|
|
|
|
|
|
|
|||||||||
| Benefit obligations at end of year |
||||||||||||||||
| |
|
|
|
|
|
|
|
|||||||||
| Fair value of plan assets: |
||||||||||||||||
| Plan assets at beginning of year |
||||||||||||||||
| Interest income |
||||||||||||||||
| Remeasurement |
||||||||||||||||
| Actual return on plan assets, excluding interest income |
( |
) | ( |
) | ( |
) | ||||||||||
| Employer contributions |
||||||||||||||||
| Plan participants’ contributions |
||||||||||||||||
| Benefits paid |
( |
) | ( |
) | ( |
) | ( |
) | ||||||||
| Acquisition and other |
— | — | ||||||||||||||
| |
|
|
|
|
|
|
|
|||||||||
| Plan assets at end of year |
||||||||||||||||
| |
|
|
|
|
|
|
|
|||||||||
| Effect of the asset ceiling |
— | — | — | — | ||||||||||||
| |
|
|
|
|
|
|
|
|||||||||
| Net defined benefit liability (asset) |
||||||||||||||||
| |
|
|
|
|
|
|
|
|||||||||
TOYOTA MOTOR CORPORATION
NOTES TO CONSOLIDATED FINANCIAL STATEMENTS—(Continued)
The funded defined benefit obligations and the unfunded defined benefit obligations are as follows:
Yen in millions |
||||||||||||||||
March 31, |
||||||||||||||||
2022 |
2023 |
|||||||||||||||
Japanese plans |
Foreign plans |
Japanese plans |
Foreign plans |
|||||||||||||
| Funded defined benefit obligations |
||||||||||||||||
| Plan assets |
( |
) | ( |
) | ( |
) | ( |
) | ||||||||
| |
|
|
|
|
|
|
|
|||||||||
| Subtotal |
( |
) | ( |
) | ( |
) | ( |
) | ||||||||
| |
|
|
|
|
|
|
|
|||||||||
| Unfunded defined benefit obligations |
||||||||||||||||
| |
|
|
|
|
|
|
|
|||||||||
| Total |
||||||||||||||||
| |
|
|
|
|
|
|
|
|||||||||
The net defined benefit liability (asset) recognized in the consolidated statement of financial position are comprised of the following:
Yen in millions |
||||||||||||||||
March 31, |
||||||||||||||||
2022 |
2023 |
|||||||||||||||
Japanese plans |
Foreign plans |
Japanese plans |
Foreign plans |
|||||||||||||
| Retirement benefit liabilities |
|
|
|
|
||||||||||||
| Other non-current assets (Retirement benefit assets) |
( |
) | ( |
) | ( |
) | ( |
) | ||||||||
| |
|
|
|
|
|
|
|
|||||||||
| Net amount recognized |
||||||||||||||||
| |
|
|
|
|
|
|
|
|||||||||
(3) The major items of actuarial assumption
The weighted-average discount rates used to determine the present value of defined benefit obligations are as follows:
March 31, |
||||||||||||||||
2022 |
2023 |
|||||||||||||||
Japanese plans |
Foreign plans |
Japanese plans |
Foreign plans |
|||||||||||||
| Discount rate |
|
% | |
% | |
% | |
% | ||||||||
(4) Fair value of plan assets
Toyota’s policy and objective for plan asset management is to maximize returns on plan assets to meet future benefit payment requirements under risks which Toyota considers permissible. Asset allocations under the plan asset management are determined based on plan asset management policies of each plan which are established to achieve the optimized asset compositions in terms of the long-term overall plan asset management. When actual allocations are not in line with target allocations, Toyota rebalances its investments in accordance with the policies. Prior to making individual investments, Toyota performs
in-depth
assessments of corresponding factors including category of products, industry type, currencies and liquidity of each potential investment under consideration to mitigate concentrations of risks such as market risk and foreign currency exchange rate risk. To assess performance of the investments, Toyota establishes bench mark return rates for each individual investment, combines these individual bench mark rates based on the asset composition ratios within each asset category, and compares the combined rates with the corresponding actual return rates on each asset category. TOYOTA MOTOR CORPORATION
NOTES TO CONSOLIDATED FINANCIAL STATEMENTS—(Continued)
The following table summarizes the fair value of classes of plan assets.
Yen in millions |
||||||||||||||||||||||||
March 31, 2022 |
||||||||||||||||||||||||
Japanese plans |
Foreign plans |
|||||||||||||||||||||||
Quoted prices in active markets |
Total |
Quoted prices in active markets |
Total |
|||||||||||||||||||||
Available |
Not available |
Available |
Not available |
|||||||||||||||||||||
Stocks |
— | — | ||||||||||||||||||||||
Government bonds |
— | — | ||||||||||||||||||||||
Bonds (other) |
— | — | ||||||||||||||||||||||
Commingled funds |
— | — | ||||||||||||||||||||||
Insurance contracts |
— | — | — | — | ||||||||||||||||||||
Other |
||||||||||||||||||||||||
Total |
||||||||||||||||||||||||
Yen in millions |
||||||||||||||||||||||||
March 31, 2023 |
||||||||||||||||||||||||
Japanese plans |
Foreign plans |
|||||||||||||||||||||||
Quoted prices in active markets |
Total |
Quoted prices in active markets |
Total |
|||||||||||||||||||||
Available |
Not available |
Available |
Not available |
|||||||||||||||||||||
Stocks |
— | — | ||||||||||||||||||||||
Government bonds |
— | |||||||||||||||||||||||
Bonds (other) |
— | — | ||||||||||||||||||||||
Commingled funds |
— | — | ||||||||||||||||||||||
Insurance contracts |
— | — | — | — | ||||||||||||||||||||
Other |
||||||||||||||||||||||||
Total |
||||||||||||||||||||||||
“Other” consists of cash equivalents, other private placement investment funds and other assets.
(5) The sensitivity analysis
The following table illustrates the effects on defined benefit obligations of the change in weighted-average discount rates, assuming all other assumptions are consistent.
Yen in millions |
||||||||||||||||
March 31, |
||||||||||||||||
2022 |
2023 |
|||||||||||||||
Japanese plans |
Foreign plans |
Japanese plans |
Foreign plans |
|||||||||||||
0.5% decrease |
||||||||||||||||
0.5% increase |
( |
) | ( |
) | ( |
) | ( |
) | ||||||||
(6) Impact on future cash flow
Contributions to plan assets by TMC and some of its consolidated subsidiaries are determined by various factors such as employee salary levels and years of service, funded status of plan assets, and actuarial
TOYOTA MOTOR CORPORATION
NOTES TO CONSOLIDATED FINANCIAL STATEMENTS—(Continued)
calculations. In addition, according to the rules of the defined benefit corporate pension law, the corporate pension fund system recalculates the amount of the balance every five years with the end date of the reporting period as the base date so that financial balance can be maintained in the future. TMC and some of its consolidated subsidiaries may make a necessary contribution if the reserve amount is below the minimum reserve amount.
In the following year (the year ending March 31, 2024), Toyota expects to contribute ¥38,309 million for Japanese plans and ¥16,423 million for Foreign plans to the post-employment benefit plans.
The following pension benefit payments, which reflect expected future service, as appropriate, are expected to be paid:
Yen in millions |
||||||||
Years ending March 31, |
Japanese plans |
Foreign plans |
||||||
2024 |
||||||||
2025 |
||||||||
2026 |
||||||||
2027 |
||||||||
2028 |
||||||||
From 2029 to 2033 |
||||||||
Total |
||||||||
(7) Benefit obligations for
non-retirement
pension for retirees and benefit obligations for absentee Toyota’s U.S. subsidiaries provide certain health care and life insurance benefits to eligible retired employees. In addition, Toyota provides benefits to certain former or inactive employees after employment, but before retirement. These benefits are provided through various insurance companies, health care providers and others. The costs of these benefits are recognized over the period the employee provides credited service to Toyota. Toyota’s obligation under these arrangements are not material.
(8) Payroll expenses
Payroll expenses included in “Cost of products sold” and “Selling, general and administrative” in the consolidated statement of income (including expenses for post-employment benefit plans) for the years ended March 31, 2021, 2022 and 2023 are ¥3,281,292 million, ¥3,550,882 million and ¥3,985,518 million, respectively.
24. Liabilities for quality assurance
Toyota provides product warranties for certain defects mainly resulting from manufacturing based on warranty contracts with its customers at the time of sale of products. Toyota accrues estimated warranty costs to be incurred in the future in accordance with the warranty contracts. In addition to product warranties, Toyota initiates recalls and other safety measures to repair or to replace parts which might be expected to fail from products safety perspectives or customer satisfaction standpoints. Toyota accrues for costs of recalls and other safety measures based on the amount estimated from historical experience.
TOYOTA MOTOR CORPORATION
NOTES TO CONSOLIDATED FINANCIAL STATEMENTS—(Continued)
Liabilities for product warranties and liabilities for recalls and other safety measures have been combined into “Liabilities for quality assurance” in the consolidated statement of financial position due to the fact that both are liabilities for costs to repair or replace defects of vehicles and the amounts incurred for recalls and other safety measures may affect the amounts incurred for product warranties and vice versa.
The net change in liabilities for quality assurance above for the years ended March 31, 2021, 2022 and 2023 consist of the following:
Yen in millions |
||||||||||||
For the years ended March 31, |
||||||||||||
2021 |
2022 |
2023 |
||||||||||
| Liabilities for quality assurance at beginning of year |
||||||||||||
| Additional provisions |
||||||||||||
| Utilization |
( |
) | ( |
) | ( |
) | ||||||
| Reversals |
( |
) | ( |
) | ( |
) | ||||||
| Other |
||||||||||||
| |
|
|
|
|
|
|||||||
| Liabilities for quality assurance at end of year |
||||||||||||
| |
|
|
|
|
|
|||||||
“Other” primarily includes the impact of currency translation adjustments and the impact of consolidation and deconsolidation of certain entities due to changes in ownership interest.
The table below shows the net changes in liabilities for recalls and other safety measures which are comprised in liabilities for quality assurance above for the years ended March 31, 2021, 2022 and 2023.
Yen in millions |
||||||||||||
For the years ended March 31, |
||||||||||||
2021 |
2022 |
2023 |
||||||||||
| Liabilities for recalls and other safety measures at beginning of year |
||||||||||||
| Additional provisions |
||||||||||||
| Utilization |
( |
) | ( |
) | ( |
) | ||||||
| Reversals |
( |
) | ( |
) | ( |
) | ||||||
| Other |
||||||||||||
| |
|
|
|
|
|
|||||||
| Liabilities for recalls and other safety measures at end of year |
||||||||||||
| |
|
|
|
|
|
|||||||
25. Equity and other equity items
(1) Equity management
Toyota will efficiently invest in maintenance and replacement of conventional manufacturing facilities and the introduction of new products, and will focus on capital investment and research and development in areas contributing to strengthening competitiveness and future growth. Through these activities, Toyota aims to improve corporate value and keep sustainable growth for realization of a new mobility society. Generally, Toyota Motor Corporation shareholder’s equity cover such activities, with additional short-term and long-term debt, if necessary.
TOYOTA MOTOR CORPORATION
NOTES TO CONSOLIDATED FINANCIAL STATEMENTS—(Continued)
The amount of Toyota Motor Corporation shareholder’s equity and short-term and long-term debt are as follows:
Yen in millions |
||||||||
March 31, |
||||||||
2022 |
2023 |
|||||||
| Toyota Motor Corporation Shareholders’ equity |
||||||||
| Short-term and long-term debt |
||||||||
(2) Number of shares
The total number of authorized shares of TMC’s common stock was 10,000,000,000 , 50,000,000,000 and 50,000,000,000 as of March 31, 2021, 2022 and 2023, respectively.
The changes in the shares of common stock issued are as follows:
For the years ended March 31, |
||||||||||||
2021 |
2022 |
2023 |
||||||||||
| Common stock issued: |
||||||||||||
| Balance at beginning of year |
||||||||||||
| Changes during the year |
||||||||||||
| |
|
|
|
|
|
|||||||
| Balance at end of year |
||||||||||||
| |
|
|
|
|
|
|||||||
The common stock issu
e
d by TMC is a no-parity
stock without any limitations on the content of the rights, and the issued stock is fully paid. On October 1, 2021, TMC effected a five -for-one stock split of its common stock to shareholders. The total number of authorized shares of TMC’s common stock and common stock issued was increased by 40,000,000,000 and 13,051,989,968 , respectively.
The total number of treasury stock was 467,048,832 , 2,536,685,916 and 2,749,807,731 as of March 31, 2021, 2022 and 2023, respectively.
(3) Capital surplus and retained earnings
Capital surplus consists of capital reserves and other capital surplus. Retained earnings consist of retained earnings reserve and other retained earnings. The Companies Act of Japan provides that an amount equal to 10 25
The amounts of statutory retained earnings of TMC available for dividend payments to shareholders were ¥11,656,187 million and ¥13,434,394 million as of March 31, 2022 and 2023, respectively. In accordance with customary practice in Japan, the distributions from surplus are not accrued in the financial statements for the corresponding period, but are recorded in the subsequent accounting period after shareholders’ approval has been obtained.
TOYOTA MOTOR CORPORATION
NOTES TO CONSOLIDATED FINANCIAL STATEMENTS—(Continued)
Retained earnings at March 31, 2023 include ¥3,506,777 million relating to equity in undistributed earnings of associates and joint ventures.
(4) Treasury stock
The reissuance and repurchase of treasury stock are as follows:
For the year ended March 31, 2021
Reissuance of treasury stock
Reason for reissuing treasury stock -
At its Directors’ Meeting held on March 24, 2020, TMC resolved to purchase shares issued by NIPPON TELEGRAPH AND TELEPHONE CORPORATION (“NTT”) and conduct a reissuance of treasury stock through third-party allotment with NTT as the allottee to form a business and capital alliance with NTT. The parties entered into a memorandum of understanding concerning the business and capital alliance on the same day. Based on the agreement, TMC has completed the purchase of NTT shares and reissuance of treasury stock with NTT as the allottee on April 9, 2020.
Details of matters relating to reissuance -
| Number of common shares reissued |
||
| Amount of reissuance |
¥ |
For the year ended March 31, 2022
Repurchase of treasury stock
1) Repurchasing of treasury stock resolved at the Board of Directors meeting held on May 12, 2021 and November 4, 2021
Reason for repurchasing treasury stock -
The repurchase was made to promote capital efficiency by repurchasing flexibly its common stock while comprehensively considering factors such as its investment in growth, level of its dividends, its cash reserves and the price level of its common stock.
Details of matters relating to repurchase -
| Number of common shares repurchased |
||
| Total purchase price for repurchase of shares |
¥ |
2) Repurchasing of treasury stock resolved at the Board of Directors meeting held on March 23, 2022
Reason for repurchasing treasury stock -
The repurchase was made to promote capital efficiency by repurchasing flexibly its common stock than before while comprehensively considering factors such as the price level of its common stock.
TOYOTA MOTOR CORPORATION
NOTES TO CONSOLIDATED FINANCIAL STATEMENTS—(Continued)
Details of matters relating to repurchase -
| Number of common shares repurchased |
| |
| Total purchase price for repurchase of shares |
For the year ended March 31, 2023
Repurchase of treasury stock
1) Repurchasing of treasury stock resolved at the Board of Directors meeting held on March 23, 2022
Reason for repurchasing treasury stock -
The r
e
purchase was made to promote capital efficiency by repurchasing flexibly its common stock than before while comprehensively considering factors such as the price level of its common stock. Details of matters relating to repurchase -
| Number of common shares repurchased |
| |
| Total purchase price for repurchase of shares |
2) Repurchasing of treasury stock resolved at the Board of Directors meeting held on May 11, 2022 and November 1, 2022
Reason for repurchasing treasury stock -
The repurchase was made to promote capital efficiency by repurchasing flexibly its common stock than before while comprehensively considering factors such as the price level of its common stock.
Details of matters relating to repurchase -
| Number of common shares repurchased |
||
| Total purchase price for repurchase of shares |
¥ |
TOYOTA MOTOR CORPORATION
NOTES TO CONSOLIDATED FINANCIAL STATEMENTS—(Continued)
(5) Other components of equity
Other components of equity are as follows:
Yen in millions |
||||||||||||||||
Net changes in revaluation of financial assets measured at fair value through other comprehensive income |
Remeasurements of defined benefit plans |
Exchange differences on translating foreign operations |
Total |
|||||||||||||
| Balance at April 01, 2020 |
— | ( |
) | |||||||||||||
| |
|
|
|
|
|
|
|
|||||||||
| Other comprehensive income, net of tax |
||||||||||||||||
| Reclassification to retained earnings |
( |
) | ( |
) | — | ( |
) | |||||||||
| Other comprehensive income for the period attributable to non-controlling interests |
( |
) | ( |
) | ( |
) | ( |
) | ||||||||
| |
|
|
|
|
|
|
|
|||||||||
| Balance at March 31, 2021 |
— | |||||||||||||||
| |
|
|
|
|
|
|
|
|||||||||
| Other comprehensive income, net of tax |
( |
) | ||||||||||||||
| Reclassification to retained earnings |
( |
) | ( |
) | — | ( |
) | |||||||||
| Other comprehensive income for the period attributable to non-controlling interests |
( |
) | ( |
) | ( |
) | ||||||||||
| |
|
|
|
|
|
|
|
|||||||||
| Balance at March 31, 2022 |
— | |||||||||||||||
| |
|
|
|
|
|
|
|
|||||||||
| Other comprehensive income, net of tax |
( |
) | ||||||||||||||
| Reclassification to retained earnings |
( |
) | ( |
) | — | ( |
) | |||||||||
| Other comprehensive income for the period attributable to non-controlling interests |
( |
) | ( |
) | ( |
) | ( |
) | ||||||||
| |
|
|
|
|
|
|
|
|||||||||
| Balance at March 31, 2023 |
— | |||||||||||||||
| |
|
|
|
|
|
|
|
|||||||||
TOYOTA MOTOR CORPORATION
NOTES TO CONSOLIDATED FINANCIAL STATEMENTS—(Continued)
(6) Other comprehensive income
The breakdown of other comprehensive income and the corresponding tax benefits (including
non-controlling
interests) are as follows: Yen in millions |
||||||||||||
For the year ended March 31, 2021 |
||||||||||||
Before tax |
Tax effect |
After tax |
||||||||||
| Items that will not be reclassified to profit (loss) |
||||||||||||
| Net changes in revaluation of financial assets measured at fair value through other comprehensive income |
||||||||||||
| Amount incurred during the year |
( |
) | ||||||||||
| |
|
|
|
|
|
|||||||
| Net changes |
( |
) | ||||||||||
| |
|
|
|
|
|
|||||||
| Remeasurements of defined benefit plans |
||||||||||||
| Amount incurred during the year |
( |
) | ||||||||||
| |
|
|
|
|
|
|||||||
| Net changes |
( |
) | ||||||||||
| |
|
|
|
|
|
|||||||
| Shares of other comprehensive income of equity method investees |
||||||||||||
| Amount incurred during the year |
— | |||||||||||
| |
|
|
|
|
|
|||||||
| Net changes |
— | |||||||||||
| |
|
|
|
|
|
|||||||
| Items that may be reclassified subsequently to profit (loss) |
||||||||||||
| Exchange differences on translating foreign operations |
||||||||||||
| Amount incurred during the year |
— | |||||||||||
| Reclassification to profit (loss) |
— | — | — | |||||||||
| |
|
|
|
|
|
|||||||
| Net changes |
— | |||||||||||
| |
|
|
|
|
|
|||||||
| Net changes in revaluation of financial assets measured at fair value through other comprehensive income |
||||||||||||
| Amount incurred during the year |
( |
) | ( |
) | ||||||||
| Reclassification to profit (loss) |
— | — | — | |||||||||
| |
|
|
|
|
|
|||||||
| Net changes |
( |
) | ( |
) | ||||||||
| |
|
|
|
|
|
|||||||
| Shares of other comprehensive income of equity method investees |
||||||||||||
| Amount incurred during the year |
— | |||||||||||
| Reclassification to profit (loss) |
— | — | — | |||||||||
| |
|
|
|
|
|
|||||||
| Net changes |
— | |||||||||||
| |
|
|
|
|
|
|||||||
| Total other comprehensive income |
( |
) | ||||||||||
| |
|
|
|
|
|
|||||||
TOYOTA MOTOR CORPORATION
NOTES TO CONSOLIDATED FINANCIAL STATEMENTS—(Continued)
Yen in millions |
||||||||||||
For the year ended March 31, 2022 |
||||||||||||
Before tax |
Tax effect |
After tax |
||||||||||
| Items that will not be reclassified to profit (loss) |
||||||||||||
| Net changes in revaluation of financial assets measured at fair value through other comprehensive income |
||||||||||||
| Amount incurred during the year |
( |
) | ( |
) | ||||||||
| |
|
|
|
|
|
|||||||
| Net changes |
( |
) | ( |
) | ||||||||
| |
|
|
|
|
|
|||||||
| Remeasurements of defined benefit plans |
||||||||||||
| Amount incurred during the year |
( |
) | ||||||||||
| |
|
|
|
|
|
|||||||
| Net changes |
( |
) | ||||||||||
| |
|
|
|
|
|
|||||||
| Shares of other comprehensive income of equity method investees |
||||||||||||
| Amount incurred during the year |
— | |||||||||||
| |
|
|
|
|
|
|||||||
| Net changes |
— | |||||||||||
| |
|
|
|
|
|
|||||||
| Items that may be reclassified subsequently to profit (loss) |
||||||||||||
| Exchange differences on translating foreign operations |
||||||||||||
| Amount incurred during the year |
— | |||||||||||
| Reclassification to profit (loss) |
— | — | — | |||||||||
| |
|
|
|
|
|
|||||||
| Net changes |
— | |||||||||||
| |
|
|
|
|
|
|||||||
| Net changes in revaluation of financial assets measured at fair value through other comprehensive income |
||||||||||||
| Amount incurred during the year |
( |
) | ( |
) | ||||||||
| Reclassification to profit (loss) |
( |
) | ||||||||||
| |
|
|
|
|
|
|||||||
| Net changes |
( |
) | ( |
) | ||||||||
| |
|
|
|
|
|
|||||||
| Shares of other comprehensive income of equity method investees |
||||||||||||
| Amount incurred during the year |
— | |||||||||||
| Reclassification to profit (loss) |
— | — | — | |||||||||
| |
|
|
|
|
|
|||||||
| Net changes |
— | |||||||||||
| |
|
|
|
|
|
|||||||
| Total other comprehensive income |
||||||||||||
| |
|
|
|
|
|
|||||||
TOYOTA MOTOR CORPORATION
NOTES TO CONSOLIDATED FINANCIAL STATEMENTS—(Continued)
Yen in millions |
||||||||||||
For the year ended March 31, 2023 |
||||||||||||
Before tax |
Tax effect |
After tax |
||||||||||
| Items that will not be reclassified to profit (loss) |
||||||||||||
| Net changes in revaluation of financial assets measured at fair value through other comprehensive income |
||||||||||||
| Amount incurred during the year |
( |
) | ||||||||||
| |
|
|
|
|
|
|||||||
| Net changes |
( |
) | ||||||||||
| |
|
|
|
|
|
|||||||
| Remeasurements of defined benefit plans |
||||||||||||
| Amount incurred during the year |
( |
) | ||||||||||
| |
|
|
|
|
|
|||||||
| Net changes |
( |
) | ||||||||||
| |
|
|
|
|
|
|||||||
| Shares of other comprehensive income of equity method investees |
||||||||||||
| Amount incurred during the year |
( |
) | — | ( |
) | |||||||
| |
|
|
|
|
|
|||||||
| Net changes |
( |
) | — | ( |
) | |||||||
| |
|
|
|
|
|
|||||||
| Items that may be reclassified subsequently to profit (loss) |
||||||||||||
| Exchange differences on translating foreign operations |
||||||||||||
| Amount incurred during the year |
— | |||||||||||
| Reclassification to profit (loss) |
— | — | — | |||||||||
| |
|
|
|
|
|
|||||||
| Net changes |
— | |||||||||||
| |
|
|
|
|
|
|||||||
| Net changes in revaluation of financial assets measured at fair value through other comprehensive income |
||||||||||||
| Amount incurred during the year |
( |
) | ( |
) | ||||||||
| Reclassification to profit (loss) |
— | — | — | |||||||||
| |
|
|
|
|
|
|||||||
| Net changes |
( |
) | ( |
) | ||||||||
| |
|
|
|
|
|
|||||||
| Shares of other comprehensive income of equity method investees |
||||||||||||
| Amount incurred during the year |
— | |||||||||||
| Reclassification to profit (loss) |
— | — | — | |||||||||
| |
|
|
|
|
|
|||||||
| Net changes |
— | |||||||||||
| |
|
|
|
|
|
|||||||
| Total other comprehensive income |
( |
) | ||||||||||
| |
|
|
|
|
|
|||||||
TOYOTA MOTOR CORPORATION
NOTES TO CONSOLIDATED FINANCIAL STATEMENTS—(Continued)
(7) Dividends
The paid dividend amounts are as follows:
For the year ended March 31, 2021
| Resolution |
Type of shares |
Total amount of dividends (yen in millions) |
Dividend per share (yen) |
Record date |
Effective date | |||||||||||
| The Board of Directors Meeting on May 12, 2020 |
Common shares | |||||||||||||||
| |
|
|
|
|
|
|
|
| ||||||||
| The Board of Directors Meeting on November 6, 2020 |
Common shares | |||||||||||||||
For the year ended March 31, 2022
| Resolution |
Type of shares |
Total amount of dividends (yen in millions) |
Dividend per share (yen) |
Record date |
Effective date | |||||||||||
| The Board of Directors Meeting on May 12, 2021 |
Common shares | |||||||||||||||
| |
|
|
|
|
|
|
|
| ||||||||
| The Board of Directors Meeting on November 4, 2021 |
Common shares | |||||||||||||||
On October 1, 2021, TMC effected a stock split of its common stock to shareholders. “Dividend per share” presents the amount prior to the stock split.
five-for-one
For the year ended March 31, 2023
| Resolution |
Type of shares |
Total amount of dividends (yen in millions) |
Dividend per share (yen) |
Record date |
Effective date | |||||||||||
| The Board of Directors Meeting on May 11, 2022 |
Common shares | |||||||||||||||
| |
|
|
|
|
|
|
|
| ||||||||
| The Board of Directors Meeting on November 1, 2022 |
Common shares | |||||||||||||||
TOYOTA MOTOR CORPORATION
NOTES TO CONSOLIDATED FINANCIAL STATEMENTS—(Continued)
Dividends of which record date falls within the year ended March 31, and effective date is after the year ended March 31 are as follows:
For the year ended March 31, 2023
| Resolution |
Type of shares |
Total amount of dividends (yen in millions) |
Dividend per share (yen) |
Record date |
Effective date | |||||||||||
| The Board of Directors Meeting on May 10, 2023 |
Common shares | |||||||||||||||
26. Sales revenues
(1) Summary by business segments and products
The table below shows Toyota’s sales revenues from external customers by business and by product category.
Yen in millions |
||||||||||||
For the years ended March 31 |
||||||||||||
2021 |
2022 |
2023 |
||||||||||
| Sales of products |
||||||||||||
| Automotive |
||||||||||||
| Vehicles |
||||||||||||
| Parts and components for production |
||||||||||||
| Parts and components for after service |
||||||||||||
| Other |
||||||||||||
| |
|
|
|
|
|
|||||||
| Total automotive |
||||||||||||
| All other |
||||||||||||
| |
|
|
|
|
|
|||||||
| Total sales of products |
||||||||||||
| Financial services |
||||||||||||
| |
|
|
|
|
|
|||||||
| Total sales revenues |
||||||||||||
| |
|
|
|
|
|
|||||||
The majority of sales of products are revenues recognized from contracts with customers under IFRS 15 “Revenue from Contracts with Customers” (“IFRS 15”), and receivables related to such revenues are recognized as “Trade accounts and other receivables”.
The breakdown of income from leases included in financial service revenues is as follows:
Yen in millions |
||||||||||||
For the years ended March 31, |
||||||||||||
2021 |
2022 |
2023 |
||||||||||
| Finance leases |
||||||||||||
| Financial income related to net lease investment |
||||||||||||
| Operating leases |
||||||||||||
| |
|
|
|
|
|
|||||||
| Total |
||||||||||||
| |
|
|
|
|
|
|||||||
TOYOTA MOTOR CORPORATION
NOTES TO CONSOLIDATED FINANCIAL STATEMENTS—(Continued)
Financial service revenues other than income from leases mainly consist of interest income using the effective interest method. The amount of interest income using the effective interest method is not significant.
For the years ended March 31, 2021, 2022 and 2023 ¥125,748 million, ¥138,718 million and ¥166,220 million of financial service revenues were accounted for under IFRS 15.
(2) Contract liabilities
Contract liabilities consist of the following:
Yen in millions |
||||||||||||
April 1, 2021 |
March 31, |
|||||||||||
2022 |
2023 |
|||||||||||
| Contract liabilities |
||||||||||||
Contract liabilities are primarily related to advances received from customers. Contract liabilities are included in “Other current liabilities” and “Other 444,781 million and ¥529,016 million, respectively.
non-current
liabilities” in the consolidated statement of financial position. For the year ended March 31, 2022 and 2023, the amounts transferred from contract liabilities at the beginning of the fiscal year to sales revenue
were ¥(3) Performance obligations
The aggregate amounts of transaction prices allocated to unsatisfied performance obligations related to contracts that have original expected durations in excess of one year were ¥796,769 million and ¥834,624 million as of March 31, 2022 and 2023, respectively. The main contents of unsatisfied performance obligations are insurance revenues and maintenance revenues.
For insurance revenues, Toyota receives payment agreed upon in the contract at the inception of the contract, and revenue is recognized over the term of the contract, which ranges from to 120 months. As of March 31, 2022, the unsatisfied performance obligations related to insurance revenues were ¥295,648 million, and Toyota expected to recognize as revenue ¥82,215 million in fiscal 2023, and ¥213,432 million thereafter. As of March 31, 2023, the unsatisfied performance obligations related to insurance revenues were ¥352,239 million, and Toyota expects to recognize as revenue ¥101,392 million in fiscal 2024, and ¥250,847 million thereafter.
For maintenance revenues, Toyota receives payments agreed upon in the contract at the inception of the contract, and revenue is recognized over the term of the contract, which ranges from 18 to 84 months.
Unsatisfied performance obligations for sales of products related to contracts that have an original expected duration of one year or less have been excluded from this disclosure.
F-81
TOYOTA MOTOR CORPORATION
NOTES TO CONSOLIDATED FINANCIAL STATEMENTS—(Continued)
27. Research and development cost
Research and development costs consist of the following:
Yen in millions |
||||||||||||
For the years ended March 31, |
||||||||||||
2021 |
2022 |
2023 |
||||||||||
| Research and development expenditures incurred during the year |
||||||||||||
| Amount capitalized |
( |
) | ( |
) | ( |
) | ||||||
| Amortization of capitalized development costs |
||||||||||||
| |
|
|
|
|
|
|||||||
| Total |
||||||||||||
| |
|
|
|
|
|
|||||||
28. Other finance income and costs
Other finance income and costs consist of the following:
Yen in millions |
||||||||||||
For the years ended March 31, |
||||||||||||
2021 |
2022 |
2023 |
||||||||||
| Other finance income |
||||||||||||
| Interest income |
||||||||||||
| Financial assets measured at amortized cost |
||||||||||||
| Financial assets measured at fair value through other comprehensive income |
||||||||||||
| Dividend income |
||||||||||||
| Financial assets measured at fair value through other comprehensive income |
||||||||||||
| Other |
||||||||||||
| |
|
|
|
|
|
|||||||
| Total |
||||||||||||
| |
|
|
|
|
|
|||||||
| Other finance costs |
||||||||||||
| Interest expense |
||||||||||||
| Financial liabilities measured at amortized cost |
( |
) | ( |
) | ( |
) | ||||||
| Other |
( |
) | ( |
) | ( |
) | ||||||
| |
|
|
|
|
|
|||||||
| Total |
( |
) | ( |
) | ( |
) | ||||||
| |
|
|
|
|
|
|||||||
The decrease in “Other finance income—Other” was due mainly to a decrease during fiscal 2023 in profit on securities revaluation.
F-82
TOYOTA MOTOR CORPORATION
NOTES TO CONSOLIDATED FINANCIAL STATEMENTS—(Continued)
29. Earnings per share
Reconciliation of the difference between basic and diluted earnings per share attributable to Toyota Motor Corporation are as follows:
Yen in millions |
Thousands of shares |
Yen |
||||||||||
Net income attributable to Toyota Motor Corporation |
Weighted-average common shares |
Earnings per share attributable to Toyota Motor Corporation |
||||||||||
| For the year ended March 31, 2021 |
||||||||||||
| Net income attributable to Toyota Motor Corporation |
||||||||||||
| |
|
|
|
|
|
|||||||
| Basic earnings per share attributable to Toyota Motor Corporation |
||||||||||||
| Effect of dilutive securities |
||||||||||||
| Model AA Class Shares |
||||||||||||
| |
|
|
|
|
|
|||||||
| Diluted earnings per share attributable to Toyota Motor Corporation |
||||||||||||
| |
|
|
|
|
|
|||||||
| For the year ended March 31, 2022 |
||||||||||||
| Net income attributable to Toyota Motor Corporation |
||||||||||||
| |
|
|
|
|
|
|||||||
| Basic earnings per share attributable to Toyota Motor Corporation |
||||||||||||
| Effect of dilutive securities |
||||||||||||
| Model AA Class Shares |
||||||||||||
| |
|
|
|
|
|
|||||||
| Diluted earnings per share attributable to Toyota Motor Corporation |
||||||||||||
| |
|
|
|
|
|
|||||||
| For the year ended March 31, 2023 |
||||||||||||
| Net income attributable to Toyota Motor Corporation |
||||||||||||
| |
|
|
|
|
|
|||||||
| Basic earnings per share attributable to Toyota Motor Corporation |
||||||||||||
| Effect of dilutive securities |
||||||||||||
| Model AA Class Shares |
— | — | ||||||||||
| |
|
|
|
|
|
|||||||
| Diluted earnings per share attributable to Toyota Motor Corporation |
||||||||||||
| |
|
|
|
|
|
|||||||
In addition to the disclosure requirements under IFRS, Toyota discloses the information below in order to provide financial statements users with valuable information.
TOYOTA MOTOR CORPORATION
NOTES TO CONSOLIDATED FINANCIAL STATEMENTS—(Continued)
The following table shows Toyota Motor Corporation shareholders’ equity per share. Toyota Motor Corporation shareholders’ equity per share amounts are calculated by dividing Toyota Motor Corporation shareholders’ equity in the consolidated statement of financial position by common shares issued and outstanding at the end of the year (excluding treasury stock).
Yen in millions |
Thousands of shares |
Yen |
||||||||||
Toyota Motor Corporation shareholders’ equity |
Common shares issued and outstanding at the end of the year (excluding treasury stock) |
Toyota Motor Corporation shareholders’ equity per share |
||||||||||
| As of March 31, 2022 |
||||||||||||
| As of March 31, 2023 |
||||||||||||
On October 1, 2021, TMC effected a five-for-one stock split of its common stock to shareholders. “Basic earnings per share attributable to Toyota Motor Corporation”, “Diluted earnings per share attributable to Toyota Motor Corporation” and “Toyota Motor Corporation shareholders’ equity per share” are calculated based on the assumption that the stock split was implemented at the beginning of the earliest period presented in this note.
“Diluted earnings per share attributable to Toyota Motor Corporation” equals “Basic earnings per share attributable to Toyota Motor Corporation” for the year ended March 31, 2023, because there
potential dilutive shares during that period as the acquisition of all outstanding First Series Model AA Class Shares took place on April 2, 2021, and the cancellation of all First Series Model AA Class Shares was completed on April 3, 2021
30. Contractual commitments and contingent liabilities
(1) Contractual commitments
Contractual commitments relating to purchase of property, plant and equipment, other assets, and services are ¥349,143 million, ¥522,336 million as of March 31, 2022 and 2023.
(2) Guarantees
Toyota enters into contracts with Toyota dealers to guarantee customers’ payments of their installment payables that arise from installment contracts between customers and Toyota dealers, as and when requested by Toyota dealers. Guarantee periods are set to match maturity of installment payments, and as of March 31, 2023, range from 1 month to 8 years; however, they are generally shorter than the useful lives of products sold. Toyota is required to execute its guarantee primarily when customers are unable to make required payment.
The maximum potential amount of future payments are ¥3,641,978 million and ¥3,600,631 million as of March 31, 2022 and 2023. Liabilities for guarantees totaling ¥21,869 million, and ¥16,759 million have been provided as of March 31, 2022 and 2023. Under these guarantee contracts, Toyota is entitled to recover any amount paid by Toyota from the customers whose original obligations Toyota has guaranteed.
(3) Market treatment such as recalls, damages and lawsuits
Toyota and other automakers have been named in certain class actions filed in Mexico, Australia, Israel and Brazil relating to Takata airbag issues. The actions in Israel and Brazil are being litigated. The actions in Mexico and Australia have been resolved.
TOYOTA MOTOR CORPORATION
NOTES TO CONSOLIDATED FINANCIAL STATEMENTS—(Continued)
Toyota is named as a defendant in an economic loss class action lawsuit in Australia in which damages are claimed on the basis that diesel particulate filters in certain vehicle models are defective. Toyota received an unfavourable judgment both in the primary court on April 7, 2022 and in the appeal court on March 27, 2023. The judgments included a finding that there was a perceived reduction in vehicle value of certain vehicle models. Toyota disagrees with the judgments and has filed an application for a further appeal. Other claims of economic loss in this class action lawsuit continue to be litigated at the court of first instance. In estimating the provision we should record in the consolidated financial statements as a result of the aforementioned judgments, Toyota has considered various factors including the legal and factual circumstances of the case, the contents of the judgements, and the views of legal counsel. The currently estimated probable economic outflow related to the class action is immaterial to Toyota’s consolidated financial position, results of operations and cash flows. At this stage, however, the final outcome and therefore ultimate financial liability for Toyota on account of this matter cannot be predicted with certainty.
In April 2020, Toyota reported possible anti-bribery violations related to a Thai subsidiary to the SEC and the Department of Justice (“DOJ”), and is cooperating with their investigations. Investigations by governmental authorities related to these matters could result in the imposition of civil or criminal penalties, fines or other sanctions, or litigation. Toyota cannot predict the scope, duration or outcome of these matters at this time.
Toyota also has various other pending legal actions and claims, including without limitation personal injury and wrongful death lawsuits and claims in the United States, as well as intellectual property litigation, and is subject to government investigations from time to time.
Beyond the amounts accrued with respect to all aforementioned matters, Toyota is unable to estimate a range of reasonably possible loss, if any, for the pending legal matters because (i) many of the proceedings are in evidence gathering stages, (ii) significant factual issues need to be resolved, (iii) the legal theory or nature of the claims is unclear, (iv) the outcome of future motions or appeals is unknown and/or (v) the outcomes of other matters of these types vary widely and do not appear sufficiently similar to offer meaningful guidance. Therefore, for all of the aforementioned matters, which Toyota is in discussions to resolve, any losses that are beyond the amounts accrued could have an adverse effect on Toyota’s financial position, results of operations or cash flows.
TMC has a concentration of labor supply in employees working under collDecember 31, 2023 .
e
ctive bargaining agreements and a substantial portion of these employees are working under the agreement that will expire on 31. Details of company organization
(1) Major subsidiaries
Toyota primarily conducts business in the automotive industry. Toyota also conducts business in finance and other industries.
Toyota’s major subsidiaries are as follows:
Automobiles are mainly manufactured by TMC, Hino Motors Ltd. and Daihatsu Motor Co., Ltd., but some of them are outsourced in Japan. Toyota Motor Manufacturing Kentucky, Inc. and others manufacture overseas.
Auto parts are manufactured by TMC and others. These products are sold through dealers such as TOYOTA Mobility Tokyo Inc. in Japan, and through dealers such as Toyota Motor Sales, U.S.A., Inc. overseas.
In the financing business, Toyota Finance Corporation and others provide sales finance services in Japan and Toyota Motor Credit Corporation and others overseas.
TOYOTA MOTOR CORPORATION
NOTES TO CONSOLIDATED FINANCIAL STATEMENTS—(Continued)
Other business consists of information technology-related businesses and other businesses.
(2) Structured entities
| (i) | Consolidated structured entities |
Toyota periodically securitizes receivables related to financial services and vehicles on leases for liquidity and funding purposes and transfers them to special purpose entities. Toyota is deemed to have the power to direct the activities of these entities that most significantly impact the entities’ economic performances. Therefore, Toyota has consolidated them.
The creditors of these entities do not have recourse to Toyota’s general credit with the exception of debts guaranteed by Toyota. Risks to which Toyota is exposed including credit, interest rate, and/or prepayment risks are not incremental compared with the situation before Toyota enters into securitization transactions.
Toyota has equity in investment trusts and other special purpose entities. With respect to some of the investment trusts, Toyota has both the obligation to absorb losses of or the right to receive benefits from the investment trusts that could potentially be significant to the investment trusts and the power to direct the activities of the investment trusts that most significantly impact the investment trusts’ economic performance through the asset manager. Therefore, Toyota has consolidated them.
Related to securitization transactions, ¥3,367,601 million and ¥5,037,203 million receivables related to financial services, ¥3,882,623 million and ¥5,245,195 million secured debt were included in Toyota’s consolidated financial statements as of March 31, 2022 and 2023, respectively.
| (ii) | Unconsolidated structured entities |
Other investment trusts and other special purpose entities are instructed based on contractual arrangements, and are designed so that voting or similar rights are not the dominant factor in deciding who controls the entities. The trusts and the special purpose entities are defined as structured entities but are determined that Toyota lacks the power to direct the activities of these investments that most significantly impact the trust’s economic performance and, therefore does not consolidate the investment trusts and the special purpose entities. Investments in the investment trusts and the special purpose entities are held at fair value and are included in “Other financial assets” in the consolidated statement of financial position. The maximum exposure to loss is limited to the carrying value of its investment. The carrying value of the trusts totaled ¥18,829 million and ¥17,217 million as of March 31, 2022 and 2023, respectively. The carrying value of the special purpose entities totaled ¥1,073,137 million and ¥784,826 million as of March 31, 2022 and 2023, respectively. Toyota does not provide support that is not contractually required to the investments.
F-86
TOYOTA MOTOR CORPORATION
NOTES TO CONSOLIDATED FINANCIAL STATEMENTS—(Continued)
32. Related party transactions
(1) Transactions with associates and joint ventures
The balances and turnover of receivables and payables with associates and joint ventures accounted for under the equity method are as follows:
Yen in millions |
||||||||
March 31, |
||||||||
2022 |
2023 |
|||||||
Trade accounts and other receivables |
||||||||
Associates |
||||||||
Joint ventures |
||||||||
Total |
||||||||
Trade accounts and other payables |
||||||||
Associates |
||||||||
Joint ventures |
||||||||
Total |
||||||||
Yen in millions |
||||||||||||
For the years ended March 31, |
||||||||||||
2021 |
2022 |
2023 |
||||||||||
Sales revenues |
||||||||||||
Associates |
||||||||||||
Joint ventures |
||||||||||||
Total |
||||||||||||
Cost of products sold (purchases) |
||||||||||||
Associates |
||||||||||||
Joint ventures |
||||||||||||
Total |
||||||||||||
Dividends from associates and joint ventures accounted for under the equity method are ¥252,557 million and ¥349,632 million for the years ended March 31, 2022 and 2023, respectively. In addition, Toyota does not engage in transactions with associates and joint ventures outside of the normal course of business.
(2) Compensation of key management
The compensation for the directors and audit & supervisory board members of TMC is as follows:
Yen in millions |
||||||||||||
For the years ended March 31, |
||||||||||||
2021 |
2022 |
2023 |
||||||||||
Monthly compensation |
||||||||||||
Bonus |
||||||||||||
Share compensation |
||||||||||||
Other |
— | |||||||||||
Total |
||||||||||||
TOYOTA MOTOR CORPORATION
NOTES TO CONSOLIDATED FINANCIAL STATEMENTS—(Continued)
“Other” refers to income tax compensation that was granted to a member of the Board of Directors, Mr. Didier Leroy, with respect to his remuneration during the period in which he served as a member of the Board of Directors. Mr. Leroy retired on June 11, 2020.
33. Supplemental cash flow information
“Other, net” in cash flows from investing activities includes a net decrease in time deposits of ¥2,070,726 million and a net decrease in time deposits of ¥307,970 million for the year ended March 31, 2022 and 2023, respectively.
34. Significant subsequent events
On May 30, 2023, Toyota, Daimler Truck, MFTBC and Hino concluded a memorandum of understanding on accelerating the development of advanced technologies and conducting a business combination of MFTBC and Hino so as to collaborate toward achieving carbon neutrality, create a prosperous mobility society by developing CASE technologies and strengthening the commercial vehicle business on a global scale, and build a globally competitive Japanese commercial vehicle manufacturer.
MFTBC and Hino will become wholly owned subsidiaries of a new listed holding company. Toyota and Daimler Truck will equally invest in the holding company and will collaborate on the development of hydrogen and other CASE technologies to support the competitiveness of the new company. The parties endeavor to develop and execute definitive agreements related to this transaction, including those concerning details related to the scope and nature of the collaboration, including the name, location, shareholding ratio and corporate structure of the new holding company, during the fiscal year ended March 31, 2024 and expect to close the transaction by December 31, 2024. Accordingly, we cannot currently estimate the impact of this agreement on Toyota’s consolidated financial statements.
F-88
ITEM 19. EXHIBITS
Index to Exhibit
146
| 101.DEF | Inline XBRL Taxonomy Extension Definition Linkbase Document | |
| 101.LAB | Inline XBRL Taxonomy Extension Label Linkbase Document | |
| 101.PRE | Inline XBRL Taxonomy Extension Presentation Linkbase Document | |
| 104 | The cover page for the registrant’s Annual Report on Form 20-F for the year ended March 31, 2023, has been formatted in Inline XBRL | |
147
SIGNATURES
The registrant hereby certifies that it meets all of the requirements for filing on Form
20-F
and that it has duly caused and authorized the undersigned to sign this annual report on its behalf. TOYOTA MOTOR CORPORATION | ||
By: |
/s/ Masahiro Yamamoto | |
Name: |
Masahiro Yamamoto | |
Title: |
Chief Officer, Accounting Group | |
Date: June 30, 2023