UNITED STATES
SECURITIES AND EXCHANGE COMMISSION
Washington, D.C. 20549

FORM 10-K
| ANNUAL REPORT PURSUANT TO SECTION 13 OR 15 (d) OF THE SECURITIES EXCHANGE ACT OF 1934 | |||||
For the fiscal year ended | |||||
| or | |||||
| TRANSITION REPORT PURSUANT TO SECTION 13 OR 15 (d) OF THE SECURITIES EXCHANGE ACT OF 1934 | |||||
For the transition period from to | |||||
Commission File Number: 001-14845
(Exact name of Registrant as specified in its charter)
(State or other jurisdiction of incorporation or organization) | (I.R.S. Employer Identification Number) | |||||||
(Address of principal executive offices) (Zip Code)
(720 ) 887-6100
(Registrant’s telephone number, including area code)
Securities registered pursuant to Section 12(b) of the Act:
| Title of each class | Trading Symbol(s) | Name of each exchange on which registered | ||||||
| | ||||||||
Securities registered pursuant to Section 12(g) of the Act: NONE
Indicate by check mark if the registrant is a well-known seasoned issuer, as defined in Rule 405 of the Securities Act.
Yes ☒ No ☐
Indicate by check mark if the registrant is not required to file reports pursuant to Section 13 or Section 15(d) of the Exchange Act.
Yes ☐No ☒
Yes ☐
Indicate by check mark whether the registrant (1) has filed all reports required to be filed by Section 13 or 15(d) of the Securities Exchange Act of 1934 during the preceding 12 months (or for such shorter period that the registrant was required to file such reports), and (2) has been subject to such filing requirements for the past 90 days. Yes ☒ No ☐
Indicate by check mark whether the registrant has submitted electronically, every Interactive Data File required to be submitted pursuant to Rule 405 of Regulation S-T during the preceding 12 months (or for such shorter period that the registrant was required to submit such files). Yes ☒ No ☐
Indicate by check mark whether the registrant is a large accelerated filer, an accelerated filer, or a non-accelerated filer.
| ☒ | Accelerated Filer | ☐ | ||||||||||||
| Non-accelerated Filer | ☐ | Smaller Reporting Company | ||||||||||||
| Emerging Growth Company | ||||||||||||||
If an emerging growth company, indicate by check mark if the registrant has elected not to use the extended transition period for complying with any new or revised financial accounting standards provided pursuant to Section 13(a) of the Exchange Act. ☐
Indicate by check mark whether the registrant has filed a report on and attestation to its management's assessment of the effectiveness of its internal control over financial reporting under Section 404(b) of the Sarbanes-Oxley Act (15 U.S.C. 7262(b)) by the registered public accounting firm that prepared or issued its audit report. ☒
If securities are registered pursuant to Section 12(b) of the Act, indicate by check mark whether the financial statements of the registrant included in the filing reflect the correction of an error to previously issued financial statements. ☐
Indicate by check mark whether any of those error corrections are restatements that required a recovery analysis of incentive-based compensation received by any of the registrant’s executive officers during the relevant recovery period pursuant to §240.10D-1(b). ☐
Indicate by check mark whether the registrant is a shell company (as defined in Rule 12b-2 of the Exchange Act). Yes ☐ No ☒
As of June 30, 2023, the aggregate market value of the common stock held by non-affiliates of the registrant was approximately $13.1 billion based on the closing price as reported on the NASDAQ Global Select Market. Shares of common stock held by each officer and director of the registrant have been excluded in that such person may be deemed to be an affiliate. This determination of affiliate status is not necessarily a conclusive determination for any other purpose.
Indicate the number of shares outstanding of each of the issuer’s classes of common stock, as of the latest practicable date.
| Class | Outstanding at February 20, 2024 | ||||||||||
| Common stock, $0.001 par value | shares | ||||||||||
DOCUMENTS INCORPORATED BY REFERENCE
Some of the information required by Part III of this report is incorporated by reference from the proxy statement relating to the registrant’s 2024 annual meeting of stockholders (the “Proxy Statement”), to be filed with the Securities and Exchange Commission within 120 days after the end of the fiscal year to which this report relates.
SPECIAL NOTE ON FORWARD-LOOKING STATEMENTS
This report contains forward-looking statements within the meaning of Section 27A of the Securities Act of 1933 and Section 21E of the Securities Exchange Act of 1934, which are subject to the “safe harbor” created by those sections. These statements include, among other things:
•general U.S. and global macroeconomic outlook, including slowing growth, inflationary pressures, and increases in interest rates;
•economic disruptions caused by potential impact of volatility and conflict in the political and economic environment, including the conflicts in the Middle East and between Russian and Ukraine;
•our belief that inflationary cost pressures will diminish over time as supply chain conditions continue to normalize;
•fluctuations in foreign currency exchange rates;
•our ability to convert backlog to revenue;
•the cyclical nature of our hardware revenue;
•our expectations that we will experience less seasonality in the future;
•the portion of our revenue expected to come from sales to customers located in countries outside of the U.S.;
•our plans to continue to invest in research and development for the active development and introduction of new products and to deliver targeted solutions to the markets we serve;
•our shift towards a more significant mix of recurring revenue;
•our belief that increases in recurring revenue will provide us with enhanced business visibility over time;
•risks associated with our growth strategy, focusing on historically underserved large markets;
•any anticipated benefits or impact to our results of operations and financial conditions from our acquisitions and our ability to successfully integrate the acquired businesses;
•any anticipated benefits associated with the pending contribution of our precision agriculture business, excluding certain products and technologies, to a newly formed joint venture (the “JV”) and the sale of the majority interest in the JV to AGCO Corporation (“AGCO”);
•our belief that our cash and cash equivalents and borrowings, along with cash provided by operations, will be sufficient in the foreseeable future to meet our anticipated operating cash needs, including expenditures related to our Connect and Scale strategy, debt service, stock repurchases, and any acquisitions;
•tax payments or refunds related to research and development (“R&D”) costs;
•our belief that our gross unrecognized tax benefits will not materially change in the next twelve months;
•our discretion to conduct, suspend, or discontinue our stock repurchase program subject to the discretion of our management; and
•our commitments to environmental, social, and governance matters.
The forward-looking statements regarding future events and the future results of Trimble Inc. (“Trimble” or “the Company” or “we” or “our” or “us”) are based on current expectations and the beliefs and assumptions of our management that are subject to risks and uncertainties. Discussions containing such forward-looking statements may be found in Item 1A “Risk Factors” and Item 7 “Management’s Discussion and Analysis of Financial Condition and Results of Operations” section of this report. Forward-looking statements generally can be identified by words such as “may,” “will,” “should,” “could,” “predicts,” “potential,” “continue,” “expects,” “anticipates,” “future,” “intends,” “plans,” “believes,” “estimates,” and similar expressions. These forward-looking statements involve certain risks and uncertainties that could cause actual results, levels of activity, performance, achievements, and events to differ materially from those implied by such forward-looking statements, including but not limited to, those discussed in this report under the section entitled “Risk Factors” and elsewhere, and in other reports we file with the Securities and Exchange Commission (“SEC”), specifically the most recent reports on Form 8-K and Form 10-Q, each as it may be amended from time to time. These forward-looking statements are made as of the date of this report. We undertake no obligation to revise or publicly release the results of any revision to these forward-looking statements, except as required by law. Given these risks and uncertainties, readers are cautioned not to place undue reliance on such forward-looking statements.
i
TRIMBLE INC.
2023 FORM 10-K ANNUAL REPORT
TABLE OF CONTENTS
| PART I | ||||||||
| Item 1 | ||||||||
| Item 1A | ||||||||
| Item 1B | ||||||||
Item 1C | ||||||||
| Item 2 | ||||||||
| Item 3 | ||||||||
| Item 4 | ||||||||
| PART II | ||||||||
| Item 5 | ||||||||
| Item 6 | ||||||||
| Item 7 | ||||||||
| Item 7A | ||||||||
| Item 8 | ||||||||
| Item 9 | ||||||||
| Item 9A | ||||||||
| Item 9B | ||||||||
| Item 9C | ||||||||
| PART III | ||||||||
| Item 10 | ||||||||
| Item 11 | ||||||||
| Item 12 | ||||||||
| Item 13 | ||||||||
| Item 14 | ||||||||
| PART IV | ||||||||
| Item 15 | ||||||||
| Item 16 | ||||||||
ii
PART I
Item 1.Business
Trimble is a leading technology solutions provider that enables office and mobile professionals to connect their workflows and asset lifecycles to drive a more productive, sustainable future. With a focus on the industries that feed, build, and move the world, the comprehensive depth and breadth of our solutions is transforming the way the world works, making it easier for Trimble customers to focus on what matters—getting the job done right.
We innovate at the intersection of the digital and physical worlds with solutions that span the world’s foundational industries including building, civil and infrastructure construction, geospatial, survey and mapping, agriculture, natural resources, utilities, transportation, and government.
We exist to empower our customers: asset owners, general and specialty contractors, engineers and designers, surveyors, agricultural companies and farmers, energy and utility companies, trucking companies and drivers, as well as state, federal, and municipal governments.
Productivity and sustainability are at the heart of who we are—woven into our work internally and through our customers’ application of our technologies. Our solutions provide customers with the ability to improve their work quality while being safe, efficient, and sustainable. More than that, our products enable reduced environmental impact in our markets, ranging from reduced greenhouse gas (“GHG”) emissions to improved water stewardship.
Today’s work requires solutions for an interconnected world, no matter the industry. Trimble offers a diverse range of coherent capabilities that connect applications, data, workflows, and mobile technologies to more efficiently orchestrate work, often in mixed fleet environments. Our advanced positioning and autonomous guidance capabilities enable increased precision with large equipment, such as agricultural tractors and construction bulldozers. We offer integrated systems that track and manage fleets of vehicles, improve the driver experience, and provide real-time logistical analytics and insights back to the office. Our connected reality capture systems enable the management of large amounts of geo-referenced information, and our software solutions connect all aspects of a fleet, a farm, or a lane, while our collaborative building information modeling (“BIM”) solutions are used throughout the design, build, and operation of the built environment.
We focus on integrating our software application and cloud capabilities to create vertically-focused, system-wide solutions that transform how work is done. The integration of sensors, software, hardware, and data in our portfolio gives us a unique ability to provide detailed insights for our customers to improve their specific workflows.
Our strategy is centered on the concept of open industry clouds and underlying common data environments as the nucleus of our connected solutions, allowing all stakeholders to collaborate and make decisions based on the same information. In construction, we connect teams across the design, build, and operational phases of a project. In agriculture, we continue to develop connected farm solutions to optimize operations for agricultural production and protection. Meanwhile, our connected supply chain solutions provide transportation companies and their drivers with tools to enhance fuel efficiency, safety, transparency, and sustainability throughout their connected fleets.
Connected software applications and cloud platform services are key elements of our solutions and account for a steadily increasing portion of our business. Our software enhances a broad range of other products and systems to allow our customers to optimize their work toward targeted outcomes and improve their decision-making and productivity. Ranging from embedded, real-time firmware to software that integrates data with large-scale enterprise back-office systems, many of our solutions are extensible and can be tailored by users for customized business processes and workflows. Trimble software capabilities include extensive three-dimensional (“3D”) modeling, analysis, planning and design solutions as well as a large suite of domain-specific software applications used across industries including construction, geospatial, agriculture, utilities, and transportation.
Our software is sold as perpetual licenses, term licenses, or subscription services and can be provisioned for on-premise, and increasingly, hosted as Software as a Service (“SaaS”). We are extending our capabilities to run in multi-cloud environments, while delivering our unique value via domain-specific workflows and lifecycle management in our target industries.
Our global operations include major research, development, manufacturing, and logistics operations in the United States, the Netherlands, India, Germany, Finland, Canada, New Zealand, the United Kingdom, and Sweden.
Business Strategy
Our growth strategy is centered on multiple elements:
•Executing on our Connect and Scale strategy. We continue to focus on executing our multi-year platform strategy. This strategy contains two elements.
1
◦The first element, Connect, aims to connect more customer workflows, industry lifecycles, and solution offerings, so that we can continue to transform the way our customers work. This includes integrating more of our customers’ data through cloud offerings and making more of our solutions available on a subscription basis. For example, our flagship design and construction platform solution, Trimble Connect, enables entire project teams to collaborate in real-time between the office and the field to make efficient decisions around the same data-rich design model enhanced by our cloud capabilities. Our Trimble Construction Cloud creates a connected data environment for online collaboration, the ability to author unique workflows that connect the digital and physical worlds, and the power to dynamically orchestrate design coordination in the cloud from wherever project stakeholders may be. Meanwhile in our Transportation business, the Trimble Transportation Cloud, for example, provides shippers and carriers with the critical information they need to make more informed bid and contract award decisions, while our Transporeon business creates a marketplace for shippers, forwarders, carriers, and retailers to connect online and digitize their end-to-end transportation management processes.
◦The second element, Scale, allows cloud enablement, which raises the bar with shared, on-demand services that empower network participants to proactively contribute to organic value creation and delivery, directly and with fewer intermediaries. When end users interact on a shared, online platform, the overall value that is created increases as the number of end-user participants increases. This network effect means that the willingness of developers, partners, or end users to engage increases as the number of network participants grows, which further enhances the platform experience and end-user value. Scale also aims to invest in the people, processes, and technologies that are necessary to streamline and standardize our internal processes; provide a seamless experience for our customers as they engage with our connected solutions; and enable us to continue to grow our business efficiently and effectively for many years into the future.
•Increasing focus on software and services. Software and services targeted for the needs of vertical end markets are increasingly important elements of our solutions and are core to our growth strategy. We generally have an open application programming interface philosophy and open vendor environment, which leads to increased adoption of our software and analytics offerings. These software and services solutions integrate and optimize additional workflows for our customers, thereby improving their work productivity, and in the case of subscription, maintenance, and support services, also provide us with enhanced business visibility over time. Professional services constitute an additional customer offering that helps our customers integrate and optimize the use of our offerings in their environment.
•Focus on attractive markets with significant growth and profitability potential. We focus on large markets historically underserved by technology that offer significant potential for long-term revenue growth, profitability, and market leadership. Our core industries, such as construction, agriculture, and transportation, are each multitrillion-dollar global industries that operate in demanding environments with technology adoption in the early phases relative to other industries. With the emergence of mobile and cloud computing capabilities, the increasing technological know-how of end users, and compelling return on investment, we believe many of our markets are attractive for substituting Trimble’s technology and solutions in place of traditional operating methods.
•Domain knowledge and technological innovation that benefit a diverse customer base. We have over time redefined our technological focus from hardware-driven point solutions to integrated work process solutions by developing domain expertise and heavily reinvesting in research and development (“R&D”) and acquisitions. We currently have over 1,000 unique patents reflective of our technology portfolio and deep domain knowledge to deliver specific, targeted solutions quickly and cost-effectively to each of the vertical markets we serve. Our patent portfolio is continuously updated with new patent grants that emerge from our investments in research and development. We look for opportunities where the opportunity for technological change is high and that have a requirement for the integration of multiple technologies into complete vertical solutions.
•Geographic expansion with localization strategy. We view international expansion as an important element of our strategy, and we continue to position ourselves in geographic markets that will serve as important sources of future growth. Products are sold in more than 150 countries, through dealers, joint ventures, original equipment manufacturers (“OEM”), and other channels throughout the world, as well as direct sales to end users. Sales are supported by our own offices located in over 40 countries around the world.
•Optimized go-to-market strategies to best access our markets. We utilize vertically focused go-to-market strategies that leverage domain expertise to best serve the needs of individual markets both domestically and abroad. These go-to-market capabilities include independent dealers, joint ventures including with Caterpillar and Nikon, OEM, and distribution alliances with key partners, as well as direct sales to end users, which provide us with broad market reach and localization capabilities to effectively serve our markets.
•Strategic acquisitions, joint ventures, and investments. Organic growth continues to be our primary focus, while acquisitions serve to enhance our market position. We acquire businesses that bring domain expertise, geographic presence, technology, products, and distribution capabilities that augment our portfolio and allow us to penetrate existing
2
markets more effectively, or to establish a market beachhead. Our success in targeting and effectively integrating acquisitions is an important aspect of our growth strategy.
To further grow and position the Company, we partner with leaders in various fields by investing in early-to-growth stage companies through our venture fund and through strategic formation of joint ventures. In September 2023, we signed a definitive agreement to contribute our Trimble precision agriculture (“Trimble Ag”) business, excluding certain Global Navigation Satellite System (“GNSS”) and guidance technologies, to a JV with AGCO, of which we will retain a 15% ownership stake. Trimble and AGCO’s shared vision is to create a global leader in mixed fleet smart farming and autonomy solutions that delivers on our collective strategy to better serve farmers with factory fit and aftermarket applications in the mixed fleet precision agriculture market. The proposed transaction is expected to close in the first half of 2024.
•Sustainability. The global economy is experiencing a fundamental shift toward sustainability driven through broad stakeholder engagement, with a focus on decarbonization. Historically, through delivering productivity and efficiency gains, Trimble products have delivered sustainability for our customers, and we envision more opportunities to deliver expanded carbon reductions and other sustainability benefits, such as water management in agriculture and utilities.
Our focus on these growth drivers has led over time to growth in revenue and profitability and an increasingly diversified business model. As our solutions have expanded, our go-to-market model has also evolved, with a balanced mix between direct, distribution, and OEM customers, as well as an increasing number of enterprise-level customer relationships.
Business Segments and Markets
Our segments are distinguished by the markets they serve. Each segment consists of businesses that are responsible for product development, marketing, sales, strategy, and financial performance. We report our financial performance, including revenue and operating income, based on four reportable segments: Buildings and Infrastructure, Geospatial, Resources and Utilities, and Transportation. For further financial information about our segments, see Note 7 “Reporting Segment and Geographic Information” of this report.
Buildings and Infrastructure
The Buildings and Infrastructure segment primarily serves customers working in architecture, engineering, construction, design, asset management, operations, and maintenance. Within this segment, our most substantial product portfolios are focused on building and civil engineering construction, design, capital planning, and asset management.
Building Construction. Our building construction portfolio of solutions for the residential, commercial, and industrial building industry spans the entire lifecycle of a building and is used by construction owners, architects, designers, general contractors, sub-contractors, and engineers. These solutions serve to improve productivity and to enhance data sharing and collaboration across different teams and stakeholders to help keep projects within cost, time, and quality targets. The suite of technologies and solutions we provide to the building industry includes program management solutions for construction owners including software for 3D conceptual design and modeling; BIM software that is used in design, engineering, and construction; enterprise resource planning, project management, and project collaboration for general contractors; and advanced integrated site layout and measurement systems, cost estimating, scheduling, and project controls solutions for contractors. The suite also includes applications for sub-contractors and construction trades such as steel, concrete, and Mechanical, Electrical and Plumbing (“MEP”); project coordination; and capital program planning and management. In addition, our Trimble Connect collaboration platform streamlines customer workflows and enables interoperability between Trimble’s and other providers’ solutions. These solutions for the building industry serve to automate, streamline, and transform work processes across the building construction industry. Our solutions provide customer benefits such as reduced costs, reduced waste and re-work, increased worker safety and efficiencies, faster project completion times, improved information flow, better decision making, enhanced quality control, and multiple sustainability benefits for our customers.
During 2023, we announced a number of new developments including: (i) new versions of our Tekla Structure software for improved user experience such as extended collaboration with BIM model data; (ii) new AI features in Sketchup such as AI-powered image search capabilities to access 3D models on 3D Warehouse, as well as generative AI utilizing text prompts to convert a SketchUp 3D model to a rendered image in seconds with SketchUp Diffusion; (iii) new MEP products including Fabrication Smart Tools for use with native Autodesk users; and (iv) AI functionality for Viewpoint Vista and Spectrum to assist users with injection of PDF invoices.
Civil Engineering Construction and Asset Management. Our civil engineering and construction portfolio spans the lifecycle of civil infrastructure assets from feasibility and capital budgeting, to planning and design, to construction, through to long-term operation and maintenance. Our solutions serve the key industry stakeholders including the asset owners or clients, design engineers, consultants, contractors, sub-contractors, and suppliers. Our technological suite is employed across the entire project lifecycle to improve productivity, reduce waste and re-work, including reduced carbon emissions, and enable more informed decision making through enhanced situational awareness, data flow, data-driven insights and decision support, and project
3
collaboration. At the same time, our solutions can improve worker safety and reduce environmental impact. Our suite of integrated solutions and technologies in this area includes field and office software for estimating and job cost management and optimized project design and visualization; software for 3D design and data sharing; systems to automatically guide and control construction equipment such as excavators, bulldozers, wheel loaders, motor graders, and paving equipment; systems to monitor, track, and manage assets, equipment, and workers; and software to facilitate the management of the construction process and for sharing and communication of data in real time. Together, these solutions are designed to transform how work is done within the civil construction industry.
The civil construction market portfolio integrates data and information across the entire construction process and across mixed fleets. This includes data from site positioning and machine control systems, construction asset management equipment and services, and various software applications. Utilizing wireless and internet-based site communications infrastructure, our solutions include the ability to track and control equipment, deploy a 3D model to machines, track progress of work in real-time, and reduce re-work. By leveraging our technology, contractors gain greater insight into their operations helping them to lower costs and improve productivity, worker safety, and asset utilization.
We maintain a joint venture with Caterpillar, Caterpillar-Trimble Control Technologies (“CTCT”), to develop the next generation of advanced electronic guidance and control products for earth-moving machines. The joint venture develops machine control and guidance products that use site design information combined with accurate positioning technology to automatically control dozer blades and other machine tools. We also maintain a joint venture with Hilti, which focuses on the joint development of measuring solutions for the building construction trades and the integration of data for construction management.
During 2023, we announced a number of developments, including: (i) the introduction of Trimble Siteworks Machine Guidance Module, extending the capabilities of Trimble Siteworks Software from surveying and layout to support on-machine excavator guidance and operator assistance; (ii) completion of the first test of a fully autonomous soil compactor on a live jobsite, taking another important step on the path toward Trimble’s autonomous vision; and (iii) release of the Trimble DA2 GNSS Smart Antenna for construction surveying as part of the Trimble Works Subscription program, which provides contractors access to construction technology at a lower upfront cost.
We sell and distribute our products in the Building and Infrastructure segment through both a direct sales force and global networks of independent distributors with expertise and customer relationships in the respective markets, including SITECH Technology dealers, which serve the civil construction industry, and BuildingPoint dealers, which serve the building construction industry. We also sell many of our software solutions through our own direct sales force, to asset owners and clients, contractors, sub-contractors, and consulting engineers.
Competitors in this segment are typically companies that provide optical, laser, or GNSS positioning products as well as companies that produce software specific to the construction process. As we extend our software and services offerings to cover the full set of construction lifecycle management solutions used by construction owners, designers, and construction companies, we increasingly compete with large established companies that offer similar systems across all industries. We compete principally on the basis of innovation, differentiated products, domain expertise, service, quality, and geographic reach.
Geospatial
The Geospatial segment primarily serves customers working in surveying, mapping, engineering, and government. Within this segment, our most substantial product portfolios are focused on surveying and geospatial and geographic information systems (“GIS”).
Surveying and Geospatial. Through our surveying product portfolio, professional surveyors and engineers provide services to the construction, engineering, mining, oil and gas, energy and utilities, government, and land management sectors. Our survey solutions replace less productive conventional methods of surveying, mapping, 2D or 3D modeling, monitoring, measurement, reporting, and analysis. Our suite of solutions includes field-based data collection systems and field software, real time communications systems, and back-office software for data processing, modeling, monitoring, reporting, and analysis. Our field-based technologies are used in handheld, land mobile, and airborne applications and incorporate technologies such as mobile application software, high precision GNSS, robotic measurement systems, inertial positioning, 3D laser scanning, digital imaging, and optical or laser measurement. We maintain a joint venture with Nikon, which focuses on the design and manufacture in Japan of surveying instruments including mechanical total stations and related products. Our office-based products include software for planning, data processing and editing, quality control, 3D modeling, intelligent data analysis and feature extraction, deformation monitoring, project reporting, and data export. Our customers in this area benefit from using our products including significantly improved productivity in both field and office activities, improved safety through non-contact measurement and detection of potentially dangerous ground or structure movement, and improved data flow that enables better decision making.
4
Geographic Information Systems. Our GIS product line collects authoritative field data and integrates that data into GIS databases. Our handheld data collection systems allow users to efficiently and accurately log positions and descriptive information about their assets, ensure the integrity and accuracy of GIS information, and ultimately enable better decision-making. Through a combination of wireless technologies and software solutions, fieldwork results are seamlessly delivered to back-office GIS systems, while mobile workers can access relevant GIS information remotely. This capability provides significant advantages to users, including improved productivity, accuracy, and access to information in the field.
During 2023, we announced several new developments, including: (i) the scalable and configurable Trimble R580 GNSS Integrated Receiver that includes our industry-leading ProPoint engine; (ii) the newest addition to our scanning portfolio, the Trimble X9 3D laser scanning system; and (iii) the Trimble T10x model 2 tablet for survey and mapping professionals. Additionally, we delivered multiple feature releases in our powerful Trimble Access field software, Trimble Business Center office software, Trimble 4D Control Monitoring software, as well as TerraFlex and TerraOffice enabling productivity gains through improved connectivity, simplicity, and efficiency enhancements for survey, mapping, and construction professionals.
We sell and distribute our products in the Geospatial segment primarily through a global network of independent distribution partners. Major competitors in this segment are typically survey instrument companies that provide software-driven 3D measurement and imaging solutions. We compete principally based on innovation, differentiated products, integrated workflow solutions, domain expertise, service, quality, and geographic reach.
Resources and Utilities
The Resources and Utilities segment primarily serves customers working in agriculture, forestry, and utilities. Within this segment, our most substantial product portfolio addresses the agriculture market, including our Trimble Ag and Positioning Services businesses.
In September, we signed a definitive agreement to contribute our Trimble Ag business, excluding certain GNSS and guidance technologies, to a JV with AGCO, of which we will retain a 15% stake. Trimble and AGCO’s shared vision is to create a global leader in mixed fleet smart farming and autonomy solutions that delivers on our collective strategy to better serve farmers with factory fit and aftermarket applications in the mixed fleet precision agriculture market. The proposed transaction is expected to close in the first half of 2024. See Note 4 “Divestitures” of this report for additional discussion of this transaction.
Our precision agriculture products and services consist of guidance and positioning systems, including autonomous steering systems, automated and variable-rate application and technology systems, and information management solutions that enable farmers and their partners to improve crop performance, profitability, and environmental quality. Our precision agriculture solutions can assist farmers throughout every step of their farming process beginning with land preparation and continuing through the planting, nutrient, pest management, water management, and harvesting phases of a crop cycle. We provide manual and automated navigation guidance for tractors and other farm equipment used in spraying, planting, cultivating, and harvesting applications. The benefits to the farmer include faster machine operation, higher yields, lower consumption of fuel and chemicals, lower carbon footprint, and improved soil health as compared to conventional equipment. In addition, we provide solutions to automate application of pesticide and seeding. Our water solutions help farmers minimize their water costs and distribute water more efficiently and include applications for leveling agricultural fields for irrigation and aligning drainage systems to better manage water flow in fields.
Software solutions that use data to enhance farm productivity are an increasing focus in our agriculture business. Our agricultural software is used by farmers to help integrate all of the information on the farm, and is also used by advisors, suppliers, and purchasers to share information to help improve efficiencies. Our agricultural software enables farmers to make more informed decisions leading to higher yields, better quality crops, increased profitability, and increased environmental sustainability.
For many of our end-market applications and customer needs, the positional accuracy that can be derived from GNSS satellite signals alone is insufficient. In these applications, higher levels of positional accuracy are required. For these situations, we provide an augmentation service that improves the positional accuracy that is available to the customer; thereby, enabling higher levels of precision and automation in work processes that are conducted in the field. This service is provided by Trimble Positioning Services and is available in a variety of formats and accuracy levels, depending on the relevant application's specific needs. Trimble Positioning Services serves customers in a variety of end markets, including agriculture, construction, geospatial, and other markets, with a majority of its customers being in agriculture.
We use multiple distribution approaches to access the mixed fleet agricultural market including independent dealers and direct selling to enterprise accounts. Our aftermarket solutions address both new equipment as well as equipment already in the field. In 2023, the following changes occurred in the Ag distribution channels as follows:
•In February, we gave CNH a 12-month notification that we will no longer supply aftermarket precision agriculture products to CNH for resale through the CNH dealer network.
5
•In December, we gave CNH a 12-month notification that we will no longer supply hardware for their factory installations.
When the proposed transaction with AGCO closes, the JV will be the exclusive distributor in the agriculture market.
Competitors in the agricultural market are vertically integrated farm equipment and implement companies, agricultural instrumentation companies, and companies that provide agricultural software and services. We compete principally on the basis of robust performance, ease of use, domain expertise, customer support, price, interoperability, interconnectedness, and the completeness of our solutions.
Transportation
Our transportation solutions provide capabilities for the long-haul trucking and freight shipper markets to create a connected supply chain and integrate all forms of transportation, drivers, back-office management, shippers, and freight. We provide enterprise and mobility solutions focused on business intelligence and data analytics, safety and regulatory compliance, navigation and routing, freight brokerage, supply chain visibility and final mile, and transportation management and fleet maintenance. Within this segment, our most substantial product portfolio addresses the truckload freight market.
In the transportation market, we offer a suite of solutions that provides comprehensive fleet and transportation management systems, analytics, routing, mapping, reporting, and predictive modeling solutions to enable the transportation industry to achieve greater overall operational efficiency, fleet utilization, including greater fuel efficiency and reduced carbon emissions, and profitability while ensuring regulatory compliance. In addition to cloud-hosted solutions, we also integrate our applications and services directly into the customer’s IT infrastructure.
The mobility solutions encompass route management, safety and compliance, end-to-end vehicle management, video intelligence, and supply chain communications. The transportation management system serves as a central hub from which the core operations of transportation organizations are managed, data is stored and analyzed, and mission critical business processes are automated. Our enterprise transportation management system automates business processes spanning the entire transportation lifecycle for shippers, carriers, and intermediaries, delivering visibility, control, and decision support for the intricate relationships and complex processes involved in the movement of freight. Our products also provide truck routing, mileage, and mapping solutions, as well as a voice-guided turn-by-turn navigation solution.
During 2023, we had a number of important developments, including: (i) the acquisition and integration of Transporeon, a leading European cloud-based transportation management software platform; (ii) the wide-scale launch of our new in-cab platform, Instinct, that improves the driver experience and can support both Trimble and third-party apps; and (iii) significant progress in integrating data and connecting workflows, from our own unique set of capabilities and a growing network of partners, and through the Trimble Transportation Cloud (“TTC”). Market facing solutions enabled by TTC include Connected Maintenance, Connected Locations, and Connected Workflows.
The Transportation segment generally sells directly to end users and OEMs. Competitors in this segment are typically companies that provide fleet mobility services, transportation management software, and digital freight matching. We compete principally on the basis of interoperability, domain expertise, customer support and service, price, innovative product offerings, quality, and the completeness of our solutions.
Seasonality of Business
Construction equipment revenue, within our Buildings and Infrastructure segment, historically has been higher in early spring. Our agricultural equipment revenue, within our Resources and Utilities segment, has historically been the highest in the first quarter, followed by the second quarter, reflecting buying in anticipation of the spring planting season in the Northern hemisphere. However, overall, as a company, we are experiencing less seasonality as a result of diversification of our businesses across segments and the increased impact of software and subscription revenue. Changes in global macroeconomic conditions could also impact the level of seasonality we experience.
Manufacturing
We outsource the manufacturing of many of our hardware products to our key contract manufacturing partners that include Jabil and Benchmark Electronics Inc. Our contract manufacturing partners are responsible for significant material procurement, assembly, and testing. We continue to manage product design through pilot production for the subcontracted products, and we are directly involved in qualifying suppliers and key components used in all our products. We also utilize original design manufacturers for some of our products.
We manufacture our optics-based products, as well as some of our GPS products, at our plants in Dayton, Ohio and Danderyd, Sweden. Some of these products or portions of these products are also subcontracted to third parties for assembly.
6
Our primary design, manufacturing, and distribution sites in Dayton, Ohio; Sunnyvale, California; Eindhoven, Netherlands; and Danderyd, Sweden are registered to ISO9001:2015 covering the design, production, distribution, and servicing of our products.
Research and Development and Intellectual Property
We believe that our competitive position is maintained through the development and introduction of new products, including software and services. Trimble delivers digital technologies that enhance the physical world by integrating and connecting industry workflows, stakeholders, and data, while modernizing its interfaces and business models to make it easier for customers to do business. Our platform investments allow us to extend our differentiation in positioning and sensing, modeling, and analytics into emerging industry solutions and to drive ecosystem collaboration across our target industries. This improves our value over the customer lifecycle, while enhancing our leadership in software and services, which already accounts for over 65% of our R&D investment. Our investments enable us to push the state-of-the-art in key technology areas and to connect other leading technologies to solve customer problems in new and unique ways.
As part of our technology development practices, we actively establish and maintain our intellectual property rights through the use of patents, copyrights, trademarks, and trade secret laws. We hold over 1,000 unique issued and enforceable patents covering key technology areas, including precision GNSS, optical and inertial positioning solutions, artificial intelligence and machine learning, IoT, cloud computing, laser scanning, 3D modeling, point cloud processing, augmented reality, and many others. Our patent portfolio is continuously updated with new patent grants that emerge from our investments in research and development. We actively manage the intellectual property used in the development, operations, and sales of our products and services. We also own numerous trademarks and service marks that contribute to the identity and recognition of Trimble and that of its global products and services.
Environmental, Social, and Governance
We recognize that we are living in a time of increasing urgency for action on sustainability, and we are moving quickly and harnessing our potential to address global challenges. Inspired by our mission of “Transforming the Way the World Works,” and fueled by the dedication of our employees, we are working to build momentum and strive for continual improvement and measurable progress in shaping a sustainable future.
Sustainability is deeply integrated into our business strategy, threaded throughout our products and solutions and our people and culture. It’s what guides our innovations and investments. It’s what drives us to build resilience for our company and our customers, to empower people, including our employees and partners, and to lead with integrity in all that we do.
 Building Resilience •Drive, Enable, and Contribute to Decarbonization •Drive toward a net-zero future |  Empowering People •Values: Belong, Grow, and Innovate •Key Pillars: Diversity, Equity, Inclusion, Leaders, and Communities |  Leading with Integrity •Corporate and Sustainability Governance •Ethical Business Practices •Privacy and Cybersecurity | ||||||
Building Resilience. Building resilience is about enabling ourselves, our customers, and the essential industries we serve to adapt, grow, and thrive in the face of change. We continue to invest in innovation, research, and development in order to adapt, prepare, and expand capabilities that help transform our industries and accelerate toward a net zero future. In 2022, we received approval of our carbon reduction targets from the Science Based Targets initiative (SBTi), the predominant third-party net-zero target assessment entity. Our goals are consistent with requirements to keep global warming to 1.5°C in accordance with the Paris Climate Agreement.
To help us drive toward a net-zero future, we are working to (i) cut our Greenhouse Gas (GHG) footprint in half by 2030, (ii) source 100% renewable energy by 2025, and (iii) engage 70% of our suppliers to set their own science-based targets by 2026. Our customers trust us to deliver solutions that drive their productivity, safety, transparency, quality, and ultimately, their sustainability and profitability. Our technologies enable precision and efficiency for the world’s essential industries by helping our customers to build, move, and feed the world while minimizing waste and consumption—ultimately generating sustainable outcomes for people and communities on a global scale.
Empowering People. Together, our diverse community of innovators and problem solvers create opportunities for our employees, customers, and community members to thrive. We extend our commitment to empowering people in the communities where we do business, collectively addressing challenges in alignment with our values. As further described in the below Human Capital section, we are focused on building a welcoming, diverse, equitable, and inclusive workplace. We believe our diversity makes us stronger and better able to solve complex problems for our customers.
7
Leading with Integrity. We are dedicated to leadership principles that ensure excellence in all we do. Through transparency, good governance, and a deep commitment to sustainability and ethics, we continue operating from a strong foundation of integrity now and in the future.
Supported by the Audit Committee, People and Compensation Committee, and Nominating and Corporate Governance Committee, the Board of Directors has oversight for our sustainability strategy, commitments, and accountability for risk management.
The Code of Business Conduct provides the tools and information necessary for our team and partners to make the right decisions while working for or with Trimble, acting lawfully, ethically, fairly, complying with our policies, and avoiding even the appearance of impropriety.
Enhancing cybersecurity and data protection, maintaining system integrity, and ensuring availability are key to our overall security at Trimble. We make significant investments in technology safety across our value chain, ensuring our customers benefit from our cybersecurity investment as well.
Human Capital
Our culture reflects our guiding principles at work and is fundamental to sustaining our success. That company culture is foundational to a thriving workplace; it is the behaviors and values of leaders and employees that are the foundation for who we are. At Trimble, we value being yourself and thriving together; being intentional and humble; and being curious and solving problems. Our leaders inspire purpose and vision, engage to draw out the best from each other, and strive to achieve meaningful results. This mindset shapes how we treat one another and how we serve our customers, colleagues, and stockholders. We strive to make Trimble a diverse, equitable, inclusive, and safe workplace and provide opportunities for our employees to grow and develop in their careers, supported by competitive compensation, benefits, health and wellness programs, and by programs that build connections between our employees and their communities.
At the end of 2023, we employed over 12,700 full-time and part-time employees, the overwhelming majority of which were full-time employees. Approximately 42%, 37%, 17%, and 4% of employees reside in North America, Europe, Asia-Pacific, and the rest of the world. Our employees are working in approximately 200 locations in over 40 countries.
Diversity, Equity, and Inclusion (“DEI”)
We value diversity in our workforce, including various cultures, backgrounds, ages, genders, races and ethnicities, nationalities, sexual orientations, religions, people with different abilities, parents and caregivers, and many other characteristics, knowing that it drives our best thinking. Our focus on diversity starts at the top. Three out of our ten board members are female or ethnically diverse, and we are making progress towards our goal of increasing global female employees and U.S. ethnically diverse employees in our workforce and in our leadership positions across the company.
A number of employee resource networks exist in Trimble that enhance our inclusive and diverse culture, including networks that support women, caregivers, Black, Hispanic/Latinx and Indian professionals, veterans, employees with disabilities, and our LGBTQ+ community.
In 2023, we continued our investments in community partners by serving as a Board of Corporate Affiliates sponsor for the National Society of Black Engineers, sponsoring Out & Equal, a non-profit organization working on LGBTQ+ workplace equality, and increasing our presence at events like AfroTech and Colorado Technology Association’s Women in Tech annual summit.
Compensation and Benefits
We believe people should be paid for the role they perform and their skills and experience, regardless of their gender, race, age, or other personal characteristics. To deliver on that commitment, we benchmark and set pay ranges based on market data and consider factors such as an employee’s role, their experience, their performance, and the region in which they live. We also regularly review our compensation practices to ensure our pay is fair and equitable. In addition to base salaries, certain roles are eligible to participate in short-term and long-term incentive plans.
We offer market-competitive benefit programs (that vary by country/region), which include health and wellness benefits, life insurance and disability benefits, flexible savings accounts, paid time off, parental and family leave, employee support programs, retirement plans, and an employee stock purchase plan. Other benefits include fertility, adoption, and surrogacy education assistance; gender affirmation, family and caregiver support; flexible work arrangements; education assistance; and on-site services such as health centers and fitness centers at some sites.
Talent Development and Building Connections
We are committed to providing every employee with the opportunity to learn, grow, and excel in a respectful and collaborative workplace. Through our internal global talent platform, we empower employees to identify internal job opportunities, skill
8
development resources, and projects to achieve their personal development goals and full potential. We encourage employees to nurture a love of continuous learning and resilience that is essential for accomplishment.
We believe that building connections between our employees, their families, and our communities creates a more meaningful, fulfilling, and enjoyable workplace. In our offices around the world, our employee-led committees select local organizations to support, often in the form of grants and employee fundraising.
Our Trimble Foundation Fund (the “Foundation”) aligns international philanthropic efforts by giving back to the communities where Trimble does business and helping those in need. The Foundation focuses on three key areas within our communities (i) Disaster and Climate Resilience, (ii) Female Education and Empowerment, and (iii) Advancing Diversity, Equity, and Inclusion.
Health, Safety, and Wellness
The success of our business is fundamentally connected to the well-being of our people. Accordingly, we are committed to the health, safety, and wellness of our employees. We provide our employees and their families with access to a variety of innovative, flexible, and convenient health and wellness programs that offer choice where possible, so they can customize their benefits to meet their needs and the needs of their families.
Available Information
This Annual Report on Form 10-K, quarterly reports on Form 10-Q, current reports on Form 8-K, and all amendments to these reports are available free of charge on our website through investor.trimble.com, as soon as reasonably practicable after such material is electronically filed with or furnished to the Securities and Exchange Commission. Financial news and reports and related information about our Company, GAAP to non-GAAP reconciliations, as well as our Sustainability report and DEI report, are also found on this website. Information contained on our website is not part of this report.
In addition, you may request a copy of these filings (excluding exhibits) at no cost by writing or telephoning us at our principal executive offices at the following address or telephone number:
Trimble Inc.
10368 Westmoor Drive, Westminster, CO 80021
Attention: Investor Relations
Telephone: (303) 635-8551
10368 Westmoor Drive, Westminster, CO 80021
Attention: Investor Relations
Telephone: (303) 635-8551
The URLs in this report are intended to be inactive textual references only. They are not intended to be active hyperlinks to websites. The information on such websites, even if it might be accessible through a hyperlink resulting from the URLs or referenced herein, is not and shall not be deemed to be incorporated into this report. No assurance or representation is given as to the suitability or reliability for any purpose whatsoever of any information on such websites.
Information about our Executive Officers
The names, ages, and positions of our executive officers as of February 26, 2024, are as follows:
| Name | Age | Position | ||||||||||||
| Robert G. Painter | 52 | President and Chief Executive Officer | ||||||||||||
| David G. Barnes | 62 | Chief Financial Officer | ||||||||||||
Jennifer Allison | 51 | Vice President, General Counsel and Secretary | ||||||||||||
| Ronald J. Bisio | 55 | Senior Vice President | ||||||||||||
| Peter Large | 54 | Senior Vice President | ||||||||||||
Phillip Sawarynski | 51 | Vice President, Treasurer | ||||||||||||
Mark Schwartz | 49 | Senior Vice President | ||||||||||||
| Julie A. Shepard | 66 | Chief Accounting Officer | ||||||||||||
Robert G. Painter—Robert Painter became Trimble’s president and chief executive officer in January 2020. From 2016 through 2019, he served as the Company’s chief financial officer. Prior to that, Mr. Painter held a variety of positions in the Company, including vice president of Trimble Buildings construction software, general manager of the Intelligent Construction Tools international joint venture, general manager of Construction Services, and leadership positions in corporate development and corporate strategy. Before joining the Company in 2006, Mr. Painter served in a variety of management and finance positions at Cenveo, Rapt Inc., Bain & Company, Whole Foods Market, and Kraft Foods. Mr. Painter holds a bachelor’s degree in finance from West Virginia University and an MBA from Harvard University.
9
David G. Barnes—David G. Barnes joined Trimble as chief financial officer in January 2020 with more than 35 years of financial and strategic management experience, including treasury, tax, investor relations, and risk management. Mr. Barnes will retire from the Company in May 2024, and Phillip Sawarynski will be his successor at that time. Prior to Trimble, he served as chief financial officer at MWH Global Inc., a global provider of engineering and construction services, from January 2009 to May 2016. At MWH, he served on the board of directors and had responsibility for information technology and procurement in addition to his financial role. Following the sale of MWH to Stantec Inc., he assumed operational responsibility for Stantec’s businesses outside North America from September 2017 to January 2019. He also served as a leader on the committee overseeing the integration of MHW into Stantec from May 2016 to July 2017. Prior to MWH, he held financial leadership positions at Western Union, Coors, and YUM Brands. He began his career as a strategy consultant at Bain & Company. Mr. Barnes received a Bachelor of Science in Applied Mathematics from Yale University and an MBA in Finance and Marketing from the University of Chicago. Mr. Barnes also serves as a board member and chair of the Audit Committee of CSG Systems International.
Jennifer Allison—Jennifer Allison became Trimble's general counsel and corporate secretary in April 2023, having served as general counsel for Trimble’s Construction Sector since July 2018, when Trimble acquired Viewpiont, where she had served as general counsel since 2016. Previously, Ms. Allison was general counsel at Tripwire, and prior to that she was the assistant general counsel and director of human resources and corporate compliance for EthicsPoint (now NAVEX Global). Prior to those roles, Ms. Allison clerked for the Oregon Supreme Court. Ms. Allison received a Bachelor’s degree in English Literature from Portland State University and her JD from Lewis & Clark Law School.
Ronald J. Bisio—Ronald Bisio currently serves as senior vice president in charge of advanced positioning, agriculture industry solutions, civil construction field systems, and geospatial business operations. From July 2022 to November 2023, he served as senior vice president responsible for Trimble’s transportation businesses. Prior to that, Mr. Bisio was responsible for Trimble’s surveying and geospatial businesses since April 2015, first as vice president and then as senior vice president as of February 2019. From January 2011 until April 2015, he served as general manager for Trimble’s rail division. He joined Trimble in 1996 and has also held several marketing, sales, and general management positions while at Trimble. Mr. Bisio earned an MBA from the University of Denver, a Master of Regional Planning from the University of Massachusetts, and a Bachelor of Science in Cartography from Salem State University in Salem, Massachusetts.
Peter Large—Peter Large currently serves as senior vice president in charge of strategy, corporate development, corporate partnerships and alliances, and Trimble’s office of technology innovation. From October 2022 to November 2023, he served as senior vice president responsible for Trimble's buildings and infrastructure segment, and from July 2021 to October 2022, as senior vice president responsible for our civil infrastructure solutions businesses, including Trimble’s joint ventures with Caterpillar and Hilti. Prior to that, he was vice president responsible for Trimble’s construction field solutions businesses. He was appointed to that position when he rejoined Trimble in December 2020, having earlier served with the Company as described below. Prior to re-joining Trimble, he was a research solutions strategist with Boeing’s Digital Solutions and Analytics business from 2019 to 2020. While pursuing a doctoral degree between 2015 to 2019, he engaged in consulting projects with Inmarsat plc, and was also employed as an executive director of Inmarsat from 2016 until 2018. Between 1996 and 2014, he served in a number of leadership roles at Trimble, including as vice president of channel development; as general manager for the mapping, GIS, and utilities business; and in a variety of product management, marketing, and sales management roles. Dr. Large holds an Ed.D. from Oklahoma State University, a Master of Science in Management from the Stanford University Graduate School of Business, a Postgraduate Diploma in Strategy and Innovation from the University of Oxford, and a Bachelor of Science degree from the University of Newcastle Upon Tyne, U.K.
Phillip Sawarynski—Phillip Sawarynski has accepted the position of chief financial officer of Trimble Inc., to be effective in May 2024, replacing David Barnes who will be retiring from the Company at that time. Mr. Sawarynski served as the Company’s treasurer since 2018, as well as managing director and co-head of Trimble Ventures since 2021, and vice president of corporate development since 2022. From 2015 to 2018, he served as sector vice president of finance in the Company’s mobility and intelligent transportation division, and from 2013 to 2015, as general manager of the Company’s imaging division. Mr. Sawarynski joined the Company in 2009 as a finance director, first in the Company’s agriculture division from 2009 to 2011 and then in the Company’s geospatial business segment from 2011 to 2013. Prior to joining the Company, Mr. Sawarynski served as CFO of Nexus Corporation and held a variety of finance and engineering positions at Ford Motor Company, The Dow Chemical Company, and International Paper Company. He holds a Bachelor of Science degree in chemical engineering from the University of Michigan, and an MBA from Carnegie Mellon University.
Mark Schwartz—Mark Schwartz was appointed senior vice president in November 2023 responsible for Trimble’s construction enterprise solutions, civil infrastructure design and engineering, and owner and public sector businesses. Prior to that, Mr. Schwartz served as senior vice president responsible for construction enterprise solutions from October 2022 until November 2023, and as Trimble’s chief digital officer from September 2020 through October 2022, leading the transformation initiatives of Trimble's business systems, processes, and infrastructure to better serve the customer through the transition to “as-a-service” business models. Mr. Schwartz served as vice president and general manager of Trimble’s civil construction software business
10
from January 2020 until September 2020 and as chief operating officer of virtual site solutions, a joint venture between Trimble and Caterpillar from April 2017 to January 2020. He joined Trimble in 2010 and has held several executive roles across Trimble’s construction businesses. Mr. Schwartz holds a Bachelor of Science from Bryant University in Smithfield, Rhode Island.
Julie A. Shepard—Julie Shepard currently serves as Trimble’s chief accounting officer. She joined Trimble in December of 2006 as vice president of finance and was appointed chief accounting officer in May 2007. Prior to joining Trimble, she served as vice president of finance and corporate controller at Quantum Corporation. She brings with her over 30 years of experience in a broad range of finance roles, with diverse experience ranging from early-stage private equity backed technology companies to large multinational corporations. She began her career at Price Waterhouse and is a Certified Public Accountant. Ms. Shepard received a Bachelor of Science in Accounting from California State University. She is a member of the AICPA, Financial Executives Institute, and the Institute of Management Accounting, where she currently serves on the Sustainable Business Management - Global Task Force.
11
Item 1A. Risk Factors
RISKS AND UNCERTAINTIES
You should carefully consider the following risk factors, in addition to the other information contained in this report and in any other documents to which we refer you in this report, before purchasing our securities. The risks and uncertainties described below are not the only ones we face.
Risks related to our business
We operate globally and are subject to significant risks in many jurisdictions, including risks related to adverse economic, political, regulatory, and other global and regional conditions
We have operations in many countries, and a significant portion of our revenue is derived from countries outside of the United States. As a result, our business, financial condition, and results of operations, including our ability to design, develop, or sell products, has been and may continue to be adversely affected by a number of factors outside of our control, including:
•global and local economic conditions, such as inflation and recession;
•the demand and cost of commodities, such as corn and oil;
•the strength of the agricultural, engineering and construction, and transportation markets;
•inadequate infrastructure and other disruptions, such as supply chain interruptions and large-scale outages or unreliable provision of services from utilities, transportation, data hosting, or telecommunications providers;
•government restrictions on our operations in any country, or restrictions on our ability to repatriate earnings from a particular country;
•differing employment practices and labor issues and the challenges and costs of staffing and managing a global workforce;
•imposition of new and changing trade barriers, including trade sanctions, duties, tariffs, and import or export licensing requirements or restrictions;
•compliance with differing local laws and regulations, including those relating to privacy, labor, and local content;
•ineffective legal protection of our IP rights in certain countries or difficulties procuring or enforcing our IP rights;
•volatile geopolitical conditions, including significant regional military conflicts and political and economic instability, in countries where we do business;
•local business and cultural factors that differ from our normal standards and practices, which can include longer payment cycles and difficulties in enforcing agreements and collecting receivables in certain foreign jurisdictions;
•fluctuations in currency rates; and
•uncertainty regarding social, political, including elections, immigration, tax, and trade policies in the U.S. and abroad.
A significant trade disruption or the establishment or increase of any trade barrier in any area where we do business could increase the cost of our products, which could adversely impact the margin that we earn on sales, make our products more expensive for customers or create uncertainty around demand for certain types of products, which could make our products less competitive and reduce customer demand. If there were to be a deterioration in the global economy, the economies of the countries or regions where our customers are located or do business, or the industries that we or our customers serve, the demand for our products and services would likely decrease. In addition, government or customer efforts, attitudes, laws or policies may lead to non-U.S. customers favoring domestic suppliers that could compete with or replace our products, which would also have an adverse effect on our business. Changes in economic conditions and political uncertainty surrounding international trade also make it difficult to make financial forecasts. Any of the foregoing factors could adversely affect our business, financial condition, and results of operations.
We have experienced disruption in our supply chain and related events, and are subject to ongoing supply chain risks
We are dependent upon a limited number of contract manufacturers for the manufacture, testing, and assembly of certain products and specific suppliers for a number of our critical components. These arrangements can generally be terminated with a limited notice. Our current reliance on a limited group of contract manufacturers and suppliers involves risks, including the potential inability to obtain products or components to meet customers’ delivery requirements, reduced control over pricing and delivery schedules and discontinuation of or increased prices for certain components. The geopolitical conditions such as the ongoing military conflict in the Middle East and between Russia and Ukraine and related events and their impact on our suppliers and on international trade in general, have led to shortfalls in available components we need to make products as well as increased costs to obtain components, to make products, and to transport components and products. The disruptions include extended delivery times for certain components of our hardware products and increased freight costs. These disruptions have had an adverse effect on our ability to meet customer demand and have resulted in delays in shipping products to customers and dealers.
Future disruptions could occur as a result of any number of events, such as:
•inflationary cost increases,
•increases in wages that drive up prices of labor,
12
•the imposition of new regulations, quotas or embargoes on components,
•a scarcity of, or significant increase in the price of, raw materials or required components for our products,
•trade restrictions, tariffs, or duties,
•fluctuations in currency exchange rates,
•transportation failures affecting the supply chain and shipment of materials and finished goods,
•third party interference in the integrity of the products sourced through the supply chain,
•severe weather conditions or natural disasters,
•civil unrest, military conflicts, geopolitical developments, war or terrorism, and
•disruptions in utility and other services.
Any other circumstance that would require us to seek alternative sources of supply or to manufacture, assemble, and test such components internally could significantly delay our ability to ship our products, which could damage relationships with current and prospective customers and could harm our reputation and brand as well as our results of operations.
Lastly, due to supply chain issues, we have in the past and may in the future accumulate excess inventories if we inaccurately forecast demand for our products, or if dealers are unable to work through their excess inventory.
If we are unable to effectively integrate, streamline and manage our diverse and complex businesses and operations, our ability to generate growth and revenue from new or existing customers may be adversely affected
Because our operations are geographically diverse and increasingly complex, our personnel resources and infrastructure could become strained, and our reputation in the market and our ability to successfully manage and grow our business may be adversely affected. The size, complexity, and diverse nature of our business and the expansion of our product lines and customer base have placed increased demands on our management and operations, and future growth may place additional strains on our resources in the future. Our ability to effectively compete and to manage our planned future growth will depend on, among other things, the following:
•maintaining continuity in our senior management and key personnel;
•increasing the productivity of our existing employees;
•attracting, retaining, training, and motivating our employees, particularly our technical and management personnel;
•deploying our solutions using third party information systems, which may require changes to our applications, documentation, and operational processes;
•improving our operational, financial, and management controls; and
•improving our information reporting systems and procedures.
We have increasingly diversified the nature of our businesses both organically and by acquisition. As a result, an increasing amount of our business involves business models that require managerial techniques and skill sets that are different from those required to manage our historical core businesses.
Pursuant to our Connect and Scale strategy, we are investing substantial resources in integrating our product offerings and transitioning our businesses to common core services and systems to achieve economies of scale, simplify our operations, and improve the customer experience. These efforts may result in disruptions to our operations, which could have an adverse effect on our customers, may cost more than we anticipate increasing our expenses, and take longer than planned.
These factors could have an adverse impact on our business, financial condition, and results of operations.
Changes in our software and subscription businesses may adversely affect our revenue
An increasing portion of our revenue is generated through software maintenance and subscription revenue, which includes “Software as a Service” (“SaaS”) and new subscription services for integrated solutions. Our customers have no obligation to renew their agreements for our software maintenance or subscription services after the expiration of their initial contract period, which typically ranges from one to three years. This shift reflects both an increasing use of subscription models for new products, and a transition for some existing products from perpetual license sales and distribution in favor of SaaS or other subscription offerings.
Our customer acquisition and renewal rates may decline or fluctuate as a result of a number of factors, including overall economic conditions, the health of their businesses, competitive offerings, and customer dissatisfaction with our services. Customer satisfaction with our services is affected by a variety of factors, such as security, reliability, performance, concerns about data privacy, current subscription terms, customer preference, and industry adoption. If customers do not renew their contracts for our products, our maintenance and subscription revenue will decline, and our financial results will suffer.
Our subscription models provide our customers the right to access certain of our software in a hosted environment or use downloaded software for a specified subscription period. Market acceptance of such offerings is affected by a variety of factors, such as security, reliability, performance, current license terms, customer preference and industry adoption, social/community engagement, customer concerns with entrusting a third party to store and manage their data, public concerns
13
regarding privacy and the enactment of restrictive laws or regulations. If we are unable to successfully market and support our subscription offerings, our business, financial condition, and results of operations could be adversely impacted.
We continually re-evaluate our software licensing programs and subscription programs, including specific license models, delivery methods, and terms and conditions. Changes to our licensing programs and subscription programs, including the introduction of new subscription services for integrated solutions that include hardware, the timing of the release of enhancements, upgrades, maintenance releases, the term of the contract, discounts, and promotions, could impact the timing of the recognition of revenue for our products, and adversely affect our cash flow, business, financial condition, and results of operations.
Investing in and integrating new acquisitions or divesting businesses could be costly, place a significant strain on our management systems and resources, or fail to deliver expected outcomes
We typically acquire a number of businesses each year and we intend to continue to acquire other businesses. Acquisitions entail numerous risks, including:
•potential inability to successfully integrate acquired operations and products or to realize cost savings or other anticipated benefits from integration;
•loss of key employees or customers of acquired operations;
•difficulty of assimilating geographically dispersed operations and personnel of the acquired companies;
•potential disruption of our business or the acquired business;
•unanticipated expenses related to acquisitions;
•unanticipated difficulties in conforming business practices, policies, procedures, internal controls, and financial records of acquisitions with our own business;
•impairment of relationships with employees, customers, vendors, distributors or business partners of either an acquired company or our own business;
•inability to accurately forecast the performance of recently acquired businesses, resulting in unforeseen adverse effects on our operating results;
•potential liabilities, including liabilities resulting from known or unknown compliance or legal issues, associated with an acquired business; and
•adverse accounting impact to our results of operations because of purchase accounting treatment and the business or accounting practices of acquired companies.
Any such effects from acquisitions could be costly and place a significant strain on our management systems and resources.
As a result of acquisitions, we have significant assets that include goodwill and other purchased intangibles. The testing of goodwill and intangibles for impairment under generally accepted accounting principles (“GAAP”) requires us to make significant judgments and assumptions. Changes in business conditions or in the prospects or results of operations of the acquired business could require adjustments to the valuation of these assets resulting in impairments that would adversely affect our results. In addition, changes in the operating results or the valuation of companies in which we have investments may have a direct impact on our financial statements or could result in our having to write down the value of such investment.
Acquisitions may not yield expected synergies, may not grow, scale, or advance our business strategy as expected, may fall short of expected return-on-investment targets, or may not prove successful or effective for our business. Companies that we acquire may operate with different cost and margin structures, which could further cause fluctuations in our operating results and adversely affect our business, financial condition, and results of operations.
From time to time we have divested businesses, and we expect to do so in the future. Any such divestiture may result in:
•a disruption of our business;
•reduced synergies, including the loss of scale or key employees;
•impairment of customer relationships; and
•reductions in the breadth of our product offerings.
Divestitures may adversely impact our results if we are unable to offset the dilutive impacts from the loss of revenue associated with the divested products or businesses, or mitigate overhead costs allocated to those businesses. We could also experience higher than expected transaction costs and business sale losses, which may adversely affect our business, financial condition, and results of operations. Additionally, we typically agree to provide certain transitional services and support when we divest a business, and we may face significant, unanticipated costs in providing such services. For significant divestitures, these transitional services can take up considerable corporate resources and attention, which may then adversely affect our other businesses, operations, and results.
We have identified a material weakness in our internal control over financial reporting, and if our remediation of such material weakness is not effective, it could impact our ability to produce timely and accurate financial statements or comply with applicable laws and regulations.
14
As more fully disclosed in Part II, Item 9A, “Controls and Procedures,” we identified a material weakness in internal control over financial reporting for the fiscal year ended December 29, 2023. A material weakness is a deficiency, or combination of deficiencies, in internal control over financial reporting, such that there is a reasonable possibility that a material misstatement of our annual or interim financial statements will not be prevented or detected on a timely basis. In the course of preparing our consolidated financial statements as of and for the fiscal year ended December 29, 2023, we identified a material weakness related to the accounting for the Company’s business combination of Transporeon. This included lack of appropriate oversight of third-party valuation specialists and insufficient design and operating effectiveness of management review controls, including controls over the completeness and accuracy of certain assumptions used in the valuation of acquired intangible assets. Furthermore, there is a possibility that material misstatements to our future annual or interim financial statements will not be prevented or detected in a timely basis as a result of the identified material weakness.
Our management, under the oversight of the Audit Committee, is taking actions to implement our remediation plan as described more fully in Part II, Item 9A, “Controls and Procedures”. Unless otherwise described herein, the material weakness will not be considered remediated until the applicable remedial controls operate for a sufficient period of time and management has concluded through testing that these controls are operating effectively.
We can give no assurance that additional material weaknesses will not arise in the future. Any failure to remediate the material weakness, or the development of new material weaknesses in our internal control over financial reporting, could result in material misstatements in our financial statements and cause us to fail to meet our reporting and financial obligations, which in turn could have a negative impact on our financial condition, results of operations or cash flows, restrict our ability to access the capital markets, require significant resources to correct the material weaknesses or deficiencies, subject us to fines, penalties or judgments, harm our reputation or otherwise cause a decline in investor confidence and cause a decline in the market price of our stock.
The announced contribution of Trimble Ag to a newly formed JV, and the sale of a majority interest in the JV, are subject to substantial risks, including the possible inability to complete the transaction, failure to realize the intended benefits, unanticipated challenges, and other uncertainties.
In September 2023, we signed a definitive agreement to contribute our Trimble Ag business, excluding certain GNSS and guidance technologies, to a JV with AGCO, of which we will retain a 15% stake (the “Trimble Ag JV Transaction”). The proposed transaction is expected to close in the first half of 2024. The pending transaction may not be completed in accordance with announced plans, on the currently expected timeline, or at all, and the pending sale may be disruptive to our business operations and adversely affect our profitability. In addition, the risks and uncertainties associated with the new JV include that (i) we may fail to realize the anticipated benefits of our noncontrolling stake in the JV, (ii) the closing of the proposed transaction is subject to conditions that may not be satisfied or may take longer to be satisfied than expected, (iii) the benefits from the long-term Supply Agreement, the Technology Transfer and License Agreement, the Trademark License Agreement, and the Transition Services Agreement with the JV will be dependent upon the JV’s ability to successfully develop and market products, (iv) unanticipated difficulties may arise in separating the precision agriculture business, (v) unanticipated factors may arise affecting the cost of operating the JV as a standalone business, (vi) we may be unable to successfully integrate AGCO's JCA Technologies business into the JV, (vii) the use of proceeds may be affected by market conditions and alternative uses that become more attractive over time, (viii) the development of technology synergies will depend on the level of research and development spending and the success of future innovation, and (ix) we may fail to obtain governmental or regulatory approval that may be required for the proposed transaction, or that, if such approval is obtained, the approval may be obtained subject to unexpected conditions.
We may not be able to continue to enter into or maintain important alliances and distribution relationships
We believe that in certain business opportunities, our success will depend on our ability to form and maintain alliances with industry participants. Our failure to form and maintain such alliances, or the preemption or disruption of such alliances by actions of competitors, could adversely affect our ability to sell our products to customers. Our relationships with substantial industry participants such as Caterpillar, Nikon, and Hilti are complex and multifaceted and are likely to evolve over time based upon the changing business needs and objectives of the parties.
To develop and expand our distribution channels, we must continue to expand and improve our processes and procedures that support our distribution channels, including our investment in systems and training, and those processes and procedures may become increasingly complex and difficult to manage. The time and expense required for sales and marketing organizations of our channel partners to become familiar with our product offerings, including our new product developments, and newer types of offering, such as subscription programs for integrated solutions that include hardware, software maintenance, and other recurring services, may make it more difficult to introduce those products to end users and delay end-user adoption, which could result in lower revenue.
15
Disruption of dealer coverage within specific geographic or end-user markets could cause difficulties in marketing, selling, or servicing our products and have an adverse effect on our business, financial condition, and results of operations. We utilize dealer networks, including dealers associated with Caterpillar to market, sell, and service many of our products. Dealers who carry products that compete with our products may focus their inventory purchases and sales efforts on goods provided by competitors due to industry demand or profitability. Such sourcing decisions can adversely impact our business, financial condition, and results of operations.
A significant portion of our agriculture aftermarket sales have historically been generated through CNH, which resells our aftermarket products through its dealer network. In February 2023, we gave CNH a 12-month notification that we would no longer be supplying aftermarket precision agriculture products to CNH for resale through the CNH dealer network. In December 2023, we notified CNH that our OEM agreement to supply CNH with products for factory installation would terminate in 2024. Upon the closing of the proposed Trimble Ag JV Transaction, the JV will directly manage the independent dealer network to ensure access, service, and support for the agriculture customers. Our revenue from the independent dealer network, whether owned by us or the JV, might not offset the reduction in revenue resulting from our discontinuance of sales of aftermarket products to CNH. Evolution of our respective business strategies and diversification of product portfolios may lead to increased competition with our other strategic allies, placing additional pressure on these relationships. Since these strategic relationships contribute to significant ongoing business in certain of our important markets, changes in these relationships could adversely affect our sales.
We face substantial competition in our markets, which could decrease our revenue and growth rates
Our markets are highly competitive, and we expect that both direct and indirect competition will increase in the future. Our overall competitive position depends on a number of factors including the price, quality and performance of our products, the effectiveness of our distribution channel and direct sales force, the level of customer service, the development of new technology, and our ability to participate in emerging markets. Within each of our markets, we encounter direct competition from other GNSS, software, optical, and laser suppliers, and competition may intensify from various larger U.S. and non-U.S. competitors and new market entrants, particularly from markets such as China. Our products, which commonly use GNSS for basic location information, may be subject to competition from alternative location technologies such as simultaneous location and mapping technology. In our software and subscription services businesses, we face competition from a group of large, well-established companies, particularly in the areas of design software, enterprise resource planning (“ERP”) solutions, and collaboration and project management offerings. Our integrated hardware and software products may be subject to increasing competition from mass market devices such as smartphones and tablets used in conjunction with relatively inexpensive applications, which have not been heavily used for commercial applications in the past.
These competitive developments may require us to rapidly adapt to technological and customer preference changes, including those related to cloud computing, mobile devices, and new computing platforms. Such competition has in the past resulted, and in the future may result, in price reductions, reduced margins, or loss of market share, any of which could decrease our revenue and growth rates. We believe that our ability to compete successfully in the future against existing and additional competitors will depend largely on our ability to execute our strategy to provide products with significantly differentiated features compared to currently available products. We may not be able to implement this strategy successfully, and our products may not be competitive with other technologies or products that may be developed by our competitors, many of whom have significantly greater financial, technical, manufacturing, marketing, sales, and other resources than we do.
If we are unable to attract and retain qualified personnel, our business could be harmed
Our continued success depends, in part, on our ability to hire and retain qualified personnel, advance our corporate strategy, and preserve the key aspects of our corporate culture. Because our future success is dependent on our ability to continue to enhance and introduce new products, we are particularly dependent on our ability to hire and retain qualified engineers, including in areas of technology such as GNSS, software programming, information systems, and data analytics. In addition, to increase revenues, we will be required to increase the size and productivity of our sales and channel management groups. Competition for qualified employees in our major locations is intense. Our inability to hire and retain qualified management and skilled personnel, particularly engineers, salespeople, and key executive management, could disrupt our development efforts, sales results, business relationships, and our ability to execute our business plan and strategy on a timely basis and could materially and adversely affect our business, financial condition, and results of operations. In addition, any future reductions in force or other restructuring intended to improve operational efficiencies and operating costs, may adversely affect our ability to attract and retain qualified personnel.
Equity grants are a critical component of our current compensation programs. If we fail to grant equity competitively, we may have difficulty attracting and retaining critical employees. In addition, because of our sales structure, cash, and equity incentive compensation plans, we may be at increased risk of losing employees at certain times. For example, the retention value of our compensation plans decreases after the payment of periodic bonuses or the vesting of equity awards.
16
Risks related to our technology and products
Our products are highly technical and may contain undetected errors, product defects, or security vulnerabilities
Our products, including our software products, are highly technical and complex and, when deployed, may contain errors, defects, or security vulnerabilities. We must develop our products quickly to keep pace with the rapidly changing market, and we have a history of frequently introducing new products. Products and services as sophisticated as ours could contain undetected errors or defects, especially when first introduced or when new models or versions are released. Such occurrences could result in damage to our reputation, lost revenue, diverted development resources, increased customer service and support costs, warranty claims, and litigation.
We warrant that our products will be free of defect for various periods of time, depending on the product. In addition, certain of our contracts include epidemic failure clauses. If invoked, these clauses may entitle the customer to return or obtain credits for products and inventory, or to cancel outstanding purchase orders even if the products themselves are not defective.
Errors, viruses, or bugs may be present in software or hardware that we acquire or license from third parties and incorporate into our products or in third-party software or hardware that our customers use in conjunction with our products. Our customers’ proprietary software and network firewall protections may corrupt data from our products or create difficulties in implementing our solutions. Changes to third-party software or hardware that our customers use in conjunction with our software could also render our applications inoperable. Any errors, defects, or security vulnerabilities in our products or any defects in, or compatibility issues with, any third-party hardware or software or customers’ network environments discovered after commercial release could result in loss of revenue or delay in revenue recognition, loss of customers, theft of trade secrets, data or intellectual property and increased service and warranty cost, any of which could adversely affect our business, financial condition, and results of operations.
Undiscovered vulnerabilities in our products alone or in combination with third-party hardware or software could expose them to hackers or other unscrupulous third parties who develop and deploy viruses and other malicious software programs that could attack our products. Actual or perceived security vulnerabilities in our products could harm our reputation and lead some customers to return products, reduce or delay future purchases, or use competitive products.
Our internal and customer-facing systems, and systems of third parties we rely upon, may be subject to cybersecurity breaches, disruptions, or delays
A cybersecurity incident in our own systems or the systems of our third-party providers may compromise the confidentiality, integrity, or availability of our own internal data, the availability of our products and websites designed to support our customers, or our customer data. Computer hackers, foreign governments, cybercriminals, or cyber terrorists may attempt to or succeed in penetrating our network security and our website. Additionally, due to geopolitical tensions, such as the ongoing military conflict between Russia and Ukraine, we and our third-party vendors may be vulnerable to a heightened risk of cybersecurity attacks, phishing attacks, viruses, malware, ransomware, hacking or similar breaches and incidents from nation-state actors or affiliated actors, including attacks that could materially disrupt our systems and operations, supply chain, and ability to produce, sell, and distribute our products and services. Unauthorized access to our proprietary business information or customer data may be obtained through break-ins, sabotage, breach of our secure network by an unauthorized party, computer viruses, computer denial-of-service attacks, employee theft or misuse, breach of the security of the networks of our third-party providers, or other misconduct. Additionally, outside parties may attempt to fraudulently induce employees or users to disclose sensitive or confidential information to gain access to data.
We have experienced security breaches in the past, and despite our efforts to maintain the security and integrity of our systems, it is impossible to eliminate this risk. Because the techniques used by computer hackers who may attempt to penetrate and sabotage our network security or our website change frequently, they may take advantage of weaknesses in third party technology or standards of which we are unaware or that we do not control and may not be recognized until after they have been launched against a target. We may be unable to anticipate or counter these techniques. It is also possible that unauthorized access to customer data or confidential information may be obtained through inadequate use of security controls by customers, vendors, or business partners. Efforts to prevent hackers from disrupting our service or otherwise accessing our systems are expensive to develop, implement, and maintain. Such efforts require ongoing monitoring and updating as technologies change and efforts to overcome security measures become more sophisticated and may limit the functionality of, or otherwise adversely impact our service offering and systems. A cybersecurity incident affecting our systems may also result in theft of our intellectual property, proprietary data, or trade secrets, which would compromise our competitive position, reputation, and operating results. We also may be required to notify regulators about any actual or perceived personal data breach (including the EU Lead Data Protection Authority) as well as the individuals who are affected by the incident within strict time periods.
The systems we rely upon also remain vulnerable to damage or interruption from a number of other factors, including access to the internet, the failure of our network or software systems, or significant variability in visitor traffic on our product websites,
17
earthquakes, floods, fires, power loss, telecommunication failures, computer viruses, human error, and similar events or disruptions. Some of our systems are not fully redundant, and our disaster recovery planning is not sufficient for all eventualities. Our systems are also subject to intentional acts of vandalism. Despite any precautions we may take, the occurrence of a natural disaster, a decision by any of our third-party hosting providers to close a facility we use without adequate notice for financial or other reasons, or other unanticipated problems at our hosting facilities could cause system interruptions and delays, and result in loss of critical data and lengthy interruptions in our services.
We rely on our information systems and those of third parties for activities such as processing customer orders, delivery of products, hosting and providing services and support to our customers, billing and tracking our customers, hosting and managing our customer data, and otherwise running our business. Any disruptions or unexpected incompatibilities in our information systems and those of the third parties upon whom we rely could have a significant impact on our business.
An increasing portion of our revenue comes from SaaS solutions and other hosted services in which we store, retrieve, communicate, and manage data that is critical to our customers’ business systems. Disruption of our systems that support these services and solutions could cause disruptions in our customers’ systems and in the businesses that rely on these systems. Any such disruptions could harm our reputation, create liabilities to our customers, hurt demand for our services and solutions, and adversely impact our business, financial condition, and results of operations.
We are dependent on new products and services, and if we are unable to successfully introduce them into the market or to effectively compete with new, disruptive product alternatives, our customer base may decline or fail to grow as anticipated
Our future revenue stream depends to a large degree on our ability to bring new products and services to market on a timely basis. We must continue to make significant investments in research and development to continue to develop new products and services, enhance existing products, and achieve market acceptance of such products and services. We may encounter problems in the future in innovating and introducing new products and services. Our development stage products may not be successfully completed or, if developed, may not achieve significant customer acceptance. Development and manufacturing schedules for technology products are difficult to predict, and we might not achieve our goals as to the timing of introducing new technology products or could encounter increased costs. The timely availability and cost-effective production of these products in volume and their acceptance by customers are important to our future success. This has been and may continue to be negatively impacted by the global supply chain shortage. If we are unable to introduce new products and services, if other companies develop competing technology products and services, or if we do not develop compelling new products and services, our number of customers may not grow as anticipated, or may decline, which could harm our operating results.
Many of our offerings are increasingly focused on software and subscription services. The software industry is characterized by rapidly changing customer preferences, which require us to address multiple delivery platforms, new mobile devices, and cloud computing. Lifecycles of software products can be short, and this can exacerbate the risks associated with developing new products. The introduction of third party solutions embodying new, disruptive technologies and the emergence of new industry standards could make our existing and future software solutions and other products obsolete or non-competitive. If we are not able to develop software and other solutions that address the increasingly sophisticated needs of our customers, or if we are unable to adapt to new platforms, technologies, or new industry standards that impact our markets, our ability to retain or increase market share could be adversely affected, harming our business, financial condition, and results of operations.
Some of our products rely on third-party technologies including open-source software, which could result in product incompatibilities or harm availability of our products and services
We license software, technologies, and intellectual property underlying some of our software from third parties. The third-party licenses we rely upon may not continue to be available to us on commercially reasonable terms, or at all, and the software and technologies may not be appropriately supported, maintained, or enhanced by the licensors, resulting in development delays. Some software licenses are subject to annual renewals at the discretion of the licensors. In some cases, if we were to breach a provision of these license agreements, the licensor could terminate the agreement immediately. The loss of licenses to, or inability to support, maintain, and enhance, any such third-party software or technology could result in increased costs, or delays in software releases or updates, until such issues have been resolved.
We also incorporate open-source software into our products. Although we monitor our use of open-source software, the terms of many open-source licenses have not been interpreted by U.S. courts, and there is a risk that such licenses could be construed in a manner that could impose unanticipated conditions or restrictions on our ability to market or sell our products or to develop new products. In such event, we could be required to seek licenses from third parties in order to continue offering our products, to disclose and offer royalty-free licenses in connection with our own source code, to re-engineer our products, or to discontinue the sale of our products in the event re-engineering cannot be accomplished on a timely basis, any of which could adversely affect our business, financial condition, and results of operations.
18
We are dependent on proprietary technology, which could result in litigation that could divert significant valuable resources
Our future success and competitive position are dependent upon our proprietary technology, and we rely on patent, trade secret, trademark, and copyright laws to protect our intellectual property. The patents owned or licensed by us may be invalidated, circumvented, infringed, or challenged. The rights granted under these patents may not provide competitive advantages to us. Any of our pending or future patent applications may not be issued within the scope of the claims sought by us, if at all.
Despite our efforts to protect our intellectual property rights, unauthorized parties may attempt to copy or otherwise obtain our software or develop software with the same functionality or to obtain and use information that we regard as proprietary. Others may develop technologies that are similar or superior to our technology, duplicate our technology, or design around the patents owned by us. In addition, effective copyright, patent, and trade secret protection may be unavailable, limited, or not applied for in certain countries. The steps taken by us to protect our technology might not prevent the misappropriation of such technology.
The value of our products relies substantially on our technical innovation in fields in which there are many current patent filings. Third parties may claim that we or our customers (some of whom are indemnified by us) are infringing their intellectual property rights. For example, individuals and groups may purchase intellectual property assets for the purpose of asserting claims of infringement and attempting to extract settlements from us or our customers. As new patents are issued or are brought to our attention by the holders of such patents, it may be necessary for us to secure a license from such patent holders, redesign our products, or withdraw products from the market. In addition, the legal costs and engineering time required to safeguard intellectual property or to defend against litigation could become a significant expense of operations. Any such litigation could require us to incur substantial costs and divert significant valuable resources, including the efforts of our technical and management personnel, which could harm our business, financial condition, and results of operations.
We are dependent on the availability and unimpaired use of allocated bands within the radio frequency spectrum; our products may be subject to harmful interference from new or modified spectrum uses
Our GNSS technology is dependent on the use of satellite signals and on terrestrial communication bands. International allocations of radio frequency are made by the International Telecommunications Union (“ITU”), a specialized technical agency of the United Nations. These allocations are further governed by radio regulations that have treaty status and which may be subject to modification every two to three years by the World Radio Communication Conference. Each country also has regulatory authority over how each band is used in the country. In the United States, the Federal Communications Commission (“FCC”) and the National Telecommunications and Information Administration share responsibility for radio frequency allocations and spectrum usage regulations.
Any ITU or local reallocation of radio frequency bands, including frequency band segmentation and sharing of spectrum, or other modifications of the permitted uses of relevant frequency bands, may materially and adversely affect the utility and reliability of our products and have significant adverse impacts on our customers, both of which could reduce demand for our products. For example, in 2020 the FCC approved a proposal by a private party to repurpose spectrum adjacent to the authorized GNSS bands for terrestrial wireless operations throughout the United States. The company has opposed and continues to oppose this proposal, along with a wide range of participants in commercial and governmental sectors that rely on the use of GNSS in their critical activities. The FCC’s action is subject to further review as well as potential legislative action. If the FCC’s action continues in effect and terrestrial operations are implemented in the affected spectrum, these operations could create harmful interference to GNSS receivers in proximity to such operations and impose costs to retrofit or replace affected receivers. Similarly, other countries have considered proposals for use of frequencies used by our products as well as adjacent bands that could cause harmful interference to our products.
Many of our products use other radio frequency bands, such as the public land mobile radio bands, together with the GNSS signal, to provide enhanced GNSS capabilities, such as real-time kinematics precision. The continuing availability of these non-GNSS radio frequencies is essential to provide enhanced GNSS products to our precision survey, agriculture, and construction machine controls markets. In addition, transmissions and emissions from other services and equipment operating in adjacent frequency bands or in-band may impair the utility and reliability of our products. Any regulatory changes in spectrum allocation or in allowable operating conditions could have a material adverse effect on our business, financial condition, and results of operations.
Many of our products rely on GNSS technology, GPS and other satellite systems, which may become degraded or inoperable and result in lost revenue
GNSS technology, GPS satellites, and their ground support systems are complex electronic systems subject to electronic and mechanical failures and possible intentional disruption. Many of the GPS satellites currently in orbit were originally designed to have lives of 7.5 years and are subject to damage by the hostile space environment in which they operate. However, of the current deployment of operational satellites in orbit, some have been in operation for much longer. Repair of damaged or malfunctioning satellites is currently not economically feasible. If a significant number of satellites were to become inoperable,
19
there could be a substantial delay before they are replaced with new satellites. A reduction in the number of operating satellites below the 24-satellite standard established for GPS may impair the utility of the GPS system and the growth of current and additional market opportunities. In addition, software updates to GPS satellites and ground control segments, and infrequent known events such as GPS week number rollover, may adversely affect our products and customers. We depend on public access to open technical specifications in advance of system updates to mitigate these problems, which may not be available or complete.
We are dependent on continued operation of GPS, the principal GNSS currently in operation. The GPS constellation is operated by the U. S. Government, which is committed to maintenance and improvement of GPS. If supporting policies were to change, or if user fees were imposed, it could have an adverse effect on our business, financial condition, and results of operations.
Many of our products also use signals from systems that augment GPS, such as the Wide Area Augmentation System and National Differential GPS System, and satellites transmitting signal corrections data on mobile satellite services frequencies utilized by our RTX corrections services. Some of these augmentation systems are operated by the U.S. government and rely on continued funding and maintenance of these systems. Any curtailment of the operating capability of these systems or limitations on access to, or use of the signals, or discontinuance of service could result in degradation of our services or product performance, with an adverse effect on our business, financial condition, and results of operations.
Many of our products use satellite signals available globally from the Russian GLONASS, China’s BeiDou, and the European Galileo GNSS Systems. Other countries have developed regional GNSS systems, such as India’s NavIC and Japan's QZSS, which we support in some products. National or European authorities may provide preferential access to signals to companies associated with their markets, including our competitors, which could harm our competitive position. Geopolitical tensions between the United States and Russia and China could also result in the restriction of our usage of such satellite signals. Use of non-U.S. GNSS signals are also subject to FCC waiver requirements and to restrictions based upon international trade or geopolitical considerations. If we are unable to develop timely and competitive commercial products using these systems, or obtain timely and equal access to service signals, this could result in lost revenue.
Regulatory risks
Compliance with international and U.S. laws and regulations that apply to our international operations can be complex, and exposes us to various risks related to potential non-compliance
These laws and regulations include data privacy requirements, labor relations laws, tax laws, anti-competition regulations, import and trade restrictions, export control laws, and laws that prohibit corrupt payments to governmental officials or certain payments or remunerations to customers, including the U.S. Foreign Corrupt Practices Act (“FCPA”), the U.K. Bribery Act, and other anti-corruption laws, that have been the subject of a substantial increase in global enforcement. Many of our products are subject to U.S. export law restrictions that limit the destinations and types of customers to which our products may be sold or that require an export license in connection with sales outside the United States. Given the high level of complexity of these laws, there is a risk that some provisions may be inadvertently or intentionally breached, for example through fraudulent or negligent behavior of individual employees, our failure to comply with certain formal documentation requirements or otherwise. Also, we may be held liable for actions taken by our local dealers and partners. Violations of these laws and regulations could result in fines, criminal sanctions against us, our officers or our employees, and prohibitions or conditions on the conduct of our business. Any such violations could include prohibitions or conditions on our ability to offer our products in one or more countries and could materially damage our reputation, our brand, our international expansion efforts, our ability to attract and retain employees, our business, financial conditions, and results of operations.
We operate in many parts of the world that have experienced significant governmental corruption to some degree and, in certain circumstances, strict compliance with anti-bribery laws may conflict with local customs and practices. We may be subject to competitive disadvantages to the extent that our competitors are able to secure business, licenses, or other preferential treatment by making payments to government officials and others in positions of influence or through other methods that relevant law and regulations prohibit us from using. Our success depends, in part, on our ability to anticipate these risks and manage these difficulties.
We are subject to evolving and potentially conflicting privacy laws in the United States and other jurisdictions, which could adversely impact our business and require that we incur substantial costs
Existing privacy-related laws and regulations in the United States and other countries are evolving and are subject to unclear or potentially differing interpretations, and various U.S. federal and state or other international legislative and regulatory bodies may expand or enact laws regarding privacy and data security-related matters. In Europe, conflicting privacy policies are being pursued by the Commission, legislators and enforcement agencies. New privacy laws may lack clarity and depend on regulators implementing further rules and guidance, which are often significantly delayed, such as in Brazil, China and the European Union. Some countries are considering or have passed legislation that requires local storage and processing of data,
20
including geospatial data, which could impact our ability to deliver cloud-based solutions in an efficient manner. In 2023, the U.S. and European Union agreed on a new EU-U.S. Data Privacy Framework to provide a mechanism for data transfers from the EU to the U.S. as a replacement for the invalided Privacy Shield program, but legal challenges to the Framework are currently pending. International transfers of personal data present ongoing compliance challenges and complicate our business transactions and operations. In addition, the California Privacy Rights Act (“the “CPRA”) amendments to the California Consumer Privacy Act (the “CCPA”) took full effect in January 2023, with enforcement to begin in March 2024. The CCPA, as amended by the CPRA, among other things give California residents expanded rights to access and delete their personal information, opt out of certain personal information sharing, and receive detailed information about how their personal information is used. Other U.S. states and the U.S. Congress have introduced, and a number of states have enacted, data privacy legislation, which may impact our business. Such legislation, amendments and revisions to existing data privacy legislation, and other developments impacting data privacy and data protection may contain unclear and conflicting requirements, and may require us to modify our data processing practices and policies, increase the complexity of providing our products and services, and cause us to incur substantial costs in an effort to comply. Failure to comply may lead to significant fines and business interruption.
We are subject to the impact of governmental and other certifications processes and regulations, which could adversely affect our products and our business
We market many products that are subject to governmental regulations and certifications before they can be sold. The European Union increasingly regulates the use of our products on agriculture, construction, and other types of machinery. As we develop and enhance features which support automated and autonomous operation of our products, we are increasingly subject to functional safety regulation. Conformité Européenne (CE) certification is required for GNSS receivers and data communications products, which must also conform to the European harmonized GNSS receiver requirements and the radio equipment directive to be sold in the European community. In the future, the U.S., European, or other governmental authorities may propose GPS receiver testing and certification for compliance with published GPS signal interface or other specifications. Governmental authorities may also propose other forms of GPS receiver performance standards, which may limit design alternatives, hamper product innovation, or impose additional costs. Some of our products that use integrated radio communication technology require product type certification and some products require an end user to obtain licensing from the FCC and other national authorities for frequency-band usage. Compliance with evolving product regulations in our major markets could require that we redesign our products, cease selling products in certain markets, and increase our costs of product development. An inability to obtain required certifications in a timely manner could adversely affect our ability to bring our products to market and harm our customer relationships. Failure to comply with evolving requirements could result in fines and limitations on sales of our products.
Financial and tax risks
Our debt could adversely affect our cash flow and prevent us from fulfilling our financial obligations
At the end of 2023, our total debt was $3.1 billion, of which $1.8 billion was senior notes. When our senior notes mature, we will have to utilize significant resources to repay these senior notes or seek to refinance them. If we decide to refinance the senior notes, we may be required to do so on different or less favorable terms, or we may be unable to refinance the senior notes at all, both of which may adversely affect our business, financial condition, and results of operation. Any downgrade by credit rating agencies could adversely affect our cost of borrowing, limit our access to the capital markets, or result in more restrictive covenants in future debt agreements.
Our outstanding indebtedness could have other important consequences, such as:
•decreasing our business flexibility, limiting access to capital, and/or increasing our borrowing costs;
•requiring us to dedicate a portion of our cash flow from operations and other capital resources to debt service, thereby reducing our ability to fund working capital, capital expenditures, general corporate purposes, and other cash requirements, particularly if the ratings assigned to our debt securities by rating organizations were revised downward;
•increasing our vulnerability to adverse economic and industry conditions;
•reducing our ability to make investments and acquisitions, which support the growth of the company, or to repurchase shares of our common stock; and
•limiting our flexibility in planning for, or reacting to changes and opportunities in our industry, which may place us at a competitive disadvantage.
There are various financial covenants and other restrictions in our debt instruments. If we fail to comply with any of these requirements, the related indebtedness (and other unrelated indebtedness) could become due and payable prior to its stated maturity, and we may not be able to repay the indebtedness that becomes due. A default under our debt instruments may also significantly affect our ability to obtain additional or alternative financing.
Our ability to make scheduled payments or to refinance our obligations with respect to indebtedness will depend on our operating and financial performance, which in turn, is subject to prevailing economic conditions and to financial, business, and
21
other factors beyond our control. A portion of our outstanding debt has interest rates that float based on prevailing interest rates, and we may incur additional variable-rate debt in the future. Such rates tend to fluctuate based on general economic conditions, general interest rates, Federal Reserve rates, and the supply of and demand for credit in the relevant interbanking market. If interest rates increase, our interest expense will also increase as would the costs of refinancing existing indebtedness or obtaining new debt.
Significant increases in our level of indebtedness could impact the ratings assigned to our debt securities by rating organizations, which in turn would increase the interest rates and fees that we pay in connection with our indebtedness.
Changes in our effective tax rate may reduce our net income in future periods
We are subject to income and other taxes in the United States and numerous foreign jurisdictions. Significant judgment is required to determine and estimate worldwide tax liabilities. While we believe our tax positions are consistent with the tax laws in the jurisdictions in which we conduct our business, it is possible that these positions may be contested or overturned by jurisdictional tax authorities, which may have a significant impact on our global provision for income taxes. Our effective tax rate is primarily subject to the geographic mix of earnings, statutory rates, inter-company transfer pricing, and enacted tax laws.
A number of factors may increase our future effective tax rates, including:
•the jurisdictions in which profits are determined to be earned and taxed;
•the resolution of issues arising from tax audits with the U.S. and foreign tax authorities;
•changes in our intercompany transfer pricing methodology;
•changes in the valuation of our deferred tax assets and liabilities;
•increases in expense not deductible for tax purposes, including transaction costs and impairments of goodwill in connection with acquisitions;
•changes in the realizability of available tax credits;
•changes in share-based compensation;
•changes in tax laws or the interpretation of such tax laws; and
•changes in generally accepted accounting principles.
The jurisdictions where we do business may change tax laws, regulations, and interpretations on a prospective or retroactive basis and these potential changes could adversely affect our effective tax rates and impact our financial results.
The Organization of Economic Cooperation and Development (“OECD”) introduced, and member countries agreed to, a framework that imposes a minimum tax of 15% to certain multinational enterprises. We will continue to monitor and assess how this may impact our financial results when implemented.
We are currently in various stages of multiple year examinations by state and foreign taxing authorities. If taxing authorities of any jurisdiction were to successfully challenge a material tax position, we could become subject to higher taxes and our earnings could be adversely affected.
We may be affected by fluctuations in currency exchange rates
Over half of our revenue is derived from sales to customers outside of the U.S., and we are potentially exposed to adverse as well as beneficial movements in currency exchange rates. Historically, the majority of our revenue contracts are denominated in U.S. Dollars, with the most significant exception being Europe, where we invoice primarily in Euro. Additionally, a portion of our expenses, such as the cost to manufacture and costs of personnel, are denominated in foreign currencies, primarily the Euro. An increase in the value of the dollar could increase the real cost to our customers of our products in those markets outside the U.S. where we sell in dollars, and a weakened dollar could increase the cost of local operating expenses, procurement of raw materials from sources outside the U.S., and overseas capital expenditures. We also conduct certain investing and financing activities in local currencies. Our foreign exchange forward contracts reduce, but do not eliminate, the impact of currency exchange rate movements; therefore, changes in exchange rates could harm our business, financial condition, and results of operations.
Risks related to ownership of our stock
Our stock price is volatile
The market price of our common stock has been, and may continue to be, highly volatile. During 2023, our stock price ranged from $39.57 to $62.01. A variety of factors can cause the price of our common stock to fluctuate, perhaps substantially, including:
•quarterly fluctuations in our actual or anticipated operating results and order levels;
•announcements and reports of developments related to our business, our major customers and partners, and the industries in which we compete, or the industries in which our customers compete;
•security breaches;
•acquisition announcements;
22
•new products or product enhancements announced or introduced by us or our competitors;
•disputes with respect to developments in patents or other intellectual property rights;
•developments in our relationships with our partners, customers, and suppliers;
•the imposition of tariffs or other trade barriers;
•political, economic, or social uncertainty, such as the conflicts in the Middle East and between Russian and Ukraine;
•general conditions in the worldwide economy;
•catastrophic or geopolitical events, including global pandemics; and
•acts of terrorism.
In addition, the stock market in general and the markets for shares of “high-tech” companies in particular have frequently experienced extreme price fluctuations, which have often been unrelated to the operating performance of affected companies.
Our annual and quarterly performance fluctuates, which can adversely impact our stock price
Our operating results have fluctuated and can be expected to continue to fluctuate in the future on a quarterly and annual basis as a result of a number of factors, many of which are beyond our control. Results in any period could be affected by:
•changes in market demand;
•competitive market conditions;
•supply chain disruptions;
•the amount of inventory that our dealer networks carry;
•the timing of recognizing revenue;
•fluctuations in foreign currency exchange rates;
•the cost and availability of components;
•the mix of our customer base and sales channels;
•the mix of products sold;
•pricing of products;
•execution of objectives and key results;
•changes in the U.S. or foreign policies on taxes, trade, or spending;
•regional responses and restrictions related to global pandemics; and
•other risks, including those described below.
Seasonal variations in demand for our products may also affect our quarterly results. Construction equipment revenue has historically been the highest in early spring. Our agricultural equipment revenue has historically been the highest in the first quarter, followed by the second quarter, reflecting buying in anticipation of the spring planting season in the Northern hemisphere. If we do not accurately forecast seasonal demand, we may be left with unsold inventory or have a shortage of inventory, which could adversely impact our business, financial conditions, and results of operations.
Due in part to the buying patterns of our customers, a portion of our hardware revenue occurs from orders received and immediately shipped to customers in the last few weeks and days of each quarter, while our operating expense tends to remain fairly predictable. These patterns could harm our operating results if for any reason expected sales are deferred, orders are not received, or shipments are delayed a few days at the end of a quarter.
The price of our common stock could decline substantially in the event any of these risks result in our financial performance being below the expectations of public market analysts and investors, which are based on historical and predictive models that are not necessarily accurate representations of the future.
General risk factors
We have claims and lawsuits against us that may result in adverse outcomes
We are subject to a variety of claims and lawsuits. Adverse outcomes in some or all of these claims may result in significant monetary damages or injunctive relief that could adversely affect our ability to conduct business. Litigation and other claims are subject to inherent uncertainties and the outcomes can be difficult to predict. Management may not adequately reserve for a contingent liability, or may suffer unforeseen liabilities, which could then impact the results of a financial period. A material adverse impact on our consolidated financial statements could occur for the period in which the effect of an unfavorable final outcome becomes probable and reasonably estimable which, if not expected, could harm our business, financial condition, and results of operations.
Catastrophic events or geopolitical conditions could disrupt our operations
Acts of war, acts of terrorism or civil unrest, natural disasters and other catastrophic events, especially any events that impact our larger markets or GNSS signals or systems, could have a material adverse impact on our business. The threat of terrorism and war and heightened security and military activity in response to this threat, or any future acts of terrorism or hostilities, may involve a redeployment of the satellites used in GNSS or interruptions of the system. Civil unrest, local conflicts, or other
23
political instability may adversely impact regional economies, cause work stoppages, or result in limitations on business transactions with the affected jurisdictions. To the extent that such interruptions result in delays or the cancellation of orders, disruption of the manufacturing or shipment of our products, or reduced demand for our products, these interruptions could have a material adverse effect on our business, financial condition, and results of operations.
The uncertain nature, magnitude, and duration of hostilities stemming from the ongoing military conflict in the Middle East and between Russia and Ukraine, including effects of sanctions on the world economy and markets, possible retaliatory cyber-attacks, and supply chain disruptions, have contributed to increased market volatility and uncertainty, and could have an adverse impact on our business and could amplify the existing supply chain challenges we faced. As a result of the ongoing military conflict in Ukraine, the United States, the United Kingdom, and the European Union governments, among others, implemented a series of sanctions packages against Russia. The sanctions have contributed to supply chain disruptions, higher commodity prices, higher oil and natural gas price, and a slowdown in global economic growth. It is not possible to predict the broader consequences of the conflict, which could include further sanctions; embargoes; regional instability; geopolitical shifts and adverse effects on macroeconomic conditions; the availability and cost of raw materials, supplies, freight, and labor; currency exchange rates; our suppliers, customers, and potential consumer demand for our products; and financial markets, all of which could impact our business, financial condition, and results of operations.
Additionally, we rely on our Americas Regional Fulfillment Center (“ARFC”) in Dayton, Ohio to support our hardware product sales in the U.S. and internationally, and we typically maintain a significant concentration of inventory at this location. Any disruption or damage to our facility, operations, or inventory at our ARFC, whether as a result of a natural disaster or other catastrophic event, could significantly impair our ability to fulfill orders for our hardware products, including into Europe, which would negatively affect our results of operations.
Damage to our reputation could significantly harm our businesses, competitive position, and prospects for growth
Our ability to attract and retain investors, customers, and employees could be adversely affected by damage to our reputation resulting from various events, including environmental, social, and governance (“ESG”) related issues; employee misconduct, litigation, or regulatory outcomes; failure to deliver minimum standards of service and quality; compliance failures; unethical behavior; unintended breach of confidential information; and the activities of our customers and commercial partners.
In addition, we are committed to aligning our purpose, culture, and corporate strategy with sustainability. Any perceived change in our dedication to these commitments could harm our reputation and could adversely impact our business. Our disclosures on these matters, and standards we set for ourselves or a failure to meet these standards, may influence our reputation and the value of our brand.
For example, we have elected to share publicly our commitments and ongoing efforts in our Sustainability Report, where we address the importance of ESG matters to our stakeholders and our Company. Our business may face increased scrutiny related to these activities, including from the investment community, and our failure to achieve progress in these areas on a timely basis, or at all, could adversely affect our reputation, growth, business, financial condition, and results of operations.
Climate change could disrupt or harm our business
While we seek to mitigate our business risks associated with climate change by establishing robust environmental programs and partnering with organizations who are also focused on mitigating their own climate-related risks, we recognize that there are inherent climate-related risks wherever business is conducted. Any of our primary locations may be vulnerable to the adverse effects of climate change. Changing market dynamics, global policy developments, and the increasing frequency and impact of extreme weather events on critical infrastructure in the U.S. and elsewhere, each have the potential to disrupt our business, the business of our third-party suppliers, and the business of our customers, and may cause us to experience higher attrition, losses, and additional costs to maintain or resume operations.
Environmental, social, and governance matters and related reporting obligations may cause us to incur additional expenses or adversely impact our business or reputation
U.S. and international regulators, investors, and other stakeholders are increasingly focused on ESG matters. New domestic and international laws and regulations relating to ESG matters, including human capital, diversity, sustainability, climate change, and cybersecurity are under consideration or being adopted, which may include specific, target-driven disclosure requirements or obligations. We communicate certain ESG-related initiatives, goals, and/or and other matters in our annual Sustainability Report, on our website, in our filings with the SEC, and elsewhere. For example, in 2022, we established science-based targets for Scope 1, 2, and 3 greenhouse gas emissions, certain commitments on sourcing renewable energy, and the goal to engage 70% of our suppliers in setting their own science-based targets. Implementation of our goals and targets may require capital improvements. Our ability to achieve any stated commitment, goal, target, or objective is subject to many factors and conditions, some of which are outside of our control, including the pace of changes in technology and the cooperation and/or availability of suppliers that can meet our sustainability standards. If we fail to achieve, are perceived to have failed or been delayed in achieving, or improperly report our progress toward achieving our publicly stated goals and
24
commitments or compliance with U.S. and international ESG laws and regulations, our business reputation and our financial condition, and results of operations may be negatively impacted.
Item 1B. Unresolved Staff Comments
None.
Item 1C. Cybersecurity
The Company takes a multifaceted approach to assessing, identifying, and managing material risks from cybersecurity threats. The cybersecurity risk management processes described below are integrated into the Company’s overall risk management system.
Each Trimble sector has identified a dedicated expert to assess vulnerabilities, calculate risks and determine where risk mitigation efforts are needed. These experts work with the Company’s Chief Information Security Officer (“CISO”) and alongside product engineering personnel, to review technical risk data that comes from our central risk tracking system, prioritize risk mitigation activities, and manage other risk management processes. We employ a variety of security protections in our digital systems, including access controls and logging, denial of service protection, and automated intrusion-prevention tools. We have an information security training program, including an annual program of general security awareness for all employees and developer training throughout the year. We maintain an information security risk insurance policy.
As part of our product development activities, we have implemented the Trimble Secure Development Life Cycle (“TSDLC”), which uses overlapping security activities and controls to build robust security into the cloud-based products and services we provide, some of which are also deployed across our own IT infrastructure. TSLDC includes vulnerability scanning, intrusion prevention, tracking of security metrics, and code analysis vulnerability tools. Over 100 of our products are certified to ISO/IEC 27001:2013, which addresses secure information, resilience to cyber-attacks, existence of a centrally managed framework, organization-wide protection, responses to evolving security threats, and protection of data.
Core information technology systems supporting our business operations are backed up and stored outside of our network infrastructure. Our cloud-based systems, including products we sell, utilize configurations for backup designed to prevent data from being destroyed as a result of a cyber event.
Trimble’s incident response process is based on widely accepted industry frameworks, such as the cybersecurity framework set forth by the National Institute of Standards and Technology (“NIST”). Our framework includes steps to: identify threat actors, contain the affected infrastructure, eradicate threat actor access, recover affected data or systems, and study lessons learned to help ensure any root causes are mitigated outside of the affected area.
Each year, our team of cybersecurity specialists builds a strategic vision of shared outcomes which provides the basis for how cybersecurity risks are factored into the Company’s risk management initiatives. Along with the rest of the Company, the cybersecurity team, led by the CISO, sets goals for cybersecurity risk management that are then periodically tracked and reported back to the cybersecurity team and to our CEO and Audit Committee.
We utilize a set of third parties for technical and non-technical evaluation of our security posture, including regular assessment of our products for vulnerabilities. We also perform an annual external “red team” assessment that provides an attack simulation for our security operations team to identify and triage. We perform a vendor security assessment process for purchases over a certain minimum threshold.
To date, risks from cybersecurity threats, including as a result of any previous cybersecurity incidents, have not materially affected, and the Company is not aware of a basis to believe that such risks are reasonably likely to materially affect, the Company, including its business strategy, results of operations, or financial condition. For additional information, see Item 1A. Risk Factors—Our internal and customer-facing systems, and systems of third parties we rely upon, may be subject to cybersecurity breaches, disruptions, or delays.
The Board has overall responsibility for the oversight of risk management for the Company, and it exercises this oversight through Board committees and regular engagement with the Company's senior management. The Audit Committee is responsible for oversight of cybersecurity risk exposure and mitigation, and receives regular updates on cybersecurity risk management as well as timely notice of any material cybersecurity developments from the CISO through our escalation processes. The CISO presents quarterly or as needed at the Audit Committee meetings on the Company’s cybersecurity risk management activities.
We have a dedicated team that is led by the CISO, who has a technical degree in computer science from an accredited public university and has over 20 years of information technology and cybersecurity experience in multiple industries, including financial services and defense. The team comprises security engineers, detection specialists, and business cybersecurity experts. When the team identifies credible risks, we invoke our incident response process to track and manage the details,
25
quickly manage exposures, assess potential customer impact, and facilitate consistent reporting to our CEO and to our Audit Committee.
Item 2. Properties
Our corporate headquarters is located in Westminster, Colorado where we own approximately 250 thousand square feet. We also currently own approximately 500 thousand square feet in Dayton, Ohio. These facilities are used by all reporting segments. For financial information regarding leases, refer to Note 9 “Leases” of this report.
We believe that our existing facilities are adequate to support current and near-term operations.
Item 3. Legal Proceedings
From time to time, we are involved in litigation arising in the ordinary course of our business. There are no material legal proceedings, other than ordinary routine litigation incidental to the business, to which we or any of our subsidiaries is a party or of which any of our or our subsidiaries' property is subject.
Item 4. Mine Safety Disclosures
None.
26
PART II
Item 5. Market for Registrant’s Common Equity, Related Stockholder Matters, and Issuer Purchases of Equity Securities
Company Stock Performance
Our common stock trades on NASDAQ under the symbol “TRMB.” The following graph compares the cumulative five-year total return provided to stockholders on our common stock relative to the cumulative total returns of the S&P 500 Index, the S&P 500 Information Technology Index, and the S&P 500 Industrials Index. An investment of $100 (with reinvestment of all dividends) is assumed to have been made in our common stock and in each of the indexes on December 31, 2018, and its relative performance is tracked through December 31, 2023.
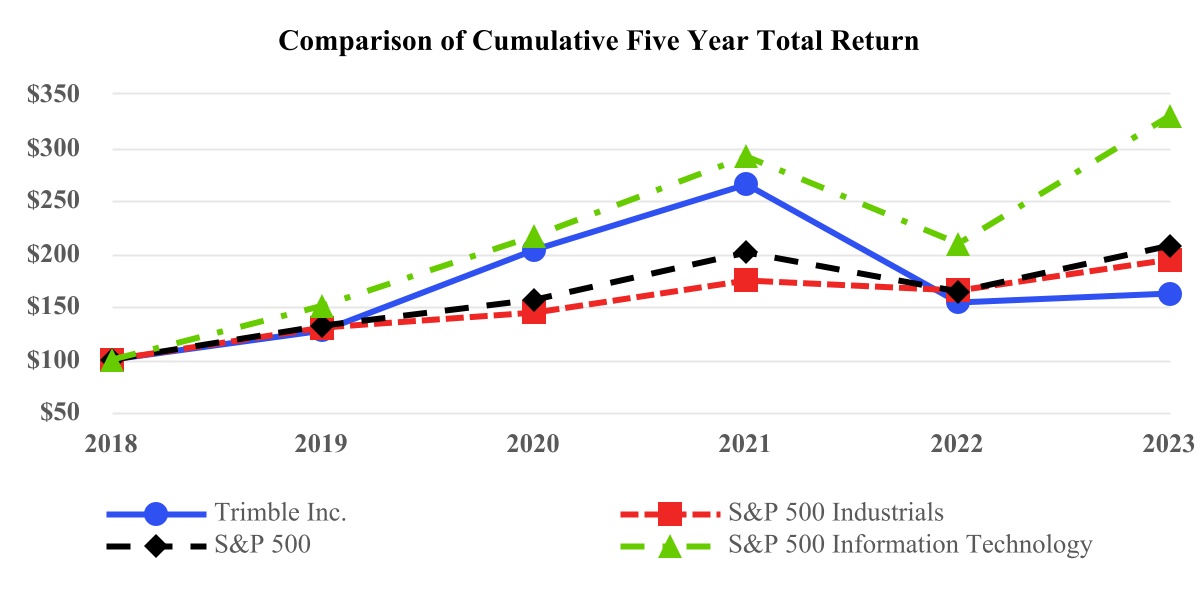
Stock Repurchase Program
In August 2021, our Board of Directors approved a stock repurchase program (“2021 Stock Repurchase Program”) authorizing up to $750.0 million in repurchases of our common stock. On January 28, 2024, our Board of Directors approved a new stock repurchase program (“2024 Stock Repurchase Program”) authorizing up to $800.0 million in repurchases of our common stock. The 2024 Stock Repurchase Program replaced the 2021 Stock Repurchase Program, which has been cancelled. Under the 2024 Stock Repurchase Program, the stock repurchase authorization does not have an expiration date.
According to the 2024 Stock Repurchase Program, we may repurchase stocks from time to time through accelerated stock repurchase programs, open market transactions, privately negotiated transactions, block purchases, tender offers or other means. The timing and actual number of any stock repurchased will depend on a variety of factors including market conditions, our stock price, other available uses of capital, applicable legal requirements, and other factors. The 2024 Stock Repurchase Program may be suspended, modified, or discontinued at any time without prior notice.
The following table provides information relating to our purchase of equity securities for the fourth quarter of 2023; these
purchases were made under the 2021 Stock Repurchase Program:
| Total Number of Shares Purchased | Average Price Paid per Share | Total Number of Shares Purchased as Part of Publicly Announced Program | Maximum Approximate Dollar Value of Shares that May Yet Be Purchased Under the Program | |||||||||||||||||||||||
| September 30, 2023 – November 3, 2023 | — | $ | — | — | $ | 215,255,003 | ||||||||||||||||||||
| November 4, 2023 – December 1, 2023 | 2,352,860 | $ | 42.50 | 2,352,860 | $ | 115,255,017 | ||||||||||||||||||||
| December 2, 2023 – December 29, 2023 | — | $ | — | — | $ | 115,255,017 | ||||||||||||||||||||
| Total | 2,352,860 | 2,352,860 | ||||||||||||||||||||||||
During 2023, we repurchased approximately 2.4 million shares of common stock in open market purchases under our 2021 Stock Repurchase Programs, at an average price of $42.50 per share, for a total of $100.0 million. At the end of 2023, the 2021
27
Stock Repurchase Program had remaining authorized funds of $115.3 million, which amount was subsequently replaced with $800.0 million under the 2024 Stock Repurchase Program.
As of February 20, 2024, there were approximately 499 registered holders of record of our common stock.
Dividend Policy
We have not declared or paid any cash dividends on our common stock during any period for which financial information is provided in this report. At this time, we intend to retain future earnings, if any, to fund the development and growth of our business and do not anticipate paying any cash dividends on our common stock in the foreseeable future.
Item 6. Reserved
28
Item 7. Management’s Discussion and Analysis of Financial Condition and Results of Operations
The following discussion should be read in conjunction with the consolidated financial statements and the related notes. The following discussion contains forward-looking statements that reflect our plans, estimates, and beliefs. Our actual results could differ materially from those discussed in the forward-looking statements. Factors that could cause or contribute to these differences include, but are not limited to, those discussed below and those listed under “Risks Factors.” This section of this report generally discusses 2023 and 2022 items and year-to-year comparisons between 2023 and 2022. Discussions of 2021 items and year-to-year comparisons between 2022 and 2021 that are not included in this report can be found in “Management's Discussion and Analysis of Financial Condition and Results of Operations” in Part II, Item 7 of our Annual Report on Form 10-K, for the year ended December 30, 2022.
EXECUTIVE LEVEL OVERVIEW
We are a leading provider of technology solutions that enable professionals and field mobile workers to improve or transform their work processes. Our comprehensive work process solutions are used across a range of industries including architecture, building construction, civil engineering, geospatial, survey and mapping, agriculture, natural resources, utilities, transportation, and government. Our representative customers include construction owners, contractors, engineering and construction firms, surveying companies, farmers and agricultural companies, energy and utility companies, trucking companies, and state, federal, and municipal governments. Further information on our business is presented in Part I, Item 1, “Business” of this report.
Our growth strategy is centered on multiple elements:
•Executing on our Connect and Scale strategy;
•Increasing focus on software and services;
•Focus on attractive markets with significant growth and profitability potential;
•Domain knowledge and technological innovation that benefits a diverse customer base;
•Geographic expansion with a localization strategy;
•Optimized go-to-market strategies to best access our markets;
•Strategic and targeted acquisitions, joint ventures, and investments; and
•Sustainability.
Our focus on these growth drivers has led over time to growth in revenue and profitability and an increasingly diversified business model. We continue to experience a shift toward a more significant mix of recurring revenue as demonstrated by our success in driving annualized recurring revenue (“ARR”) of $1,982.3 million, which represents growth of 24% year-over-year at the end of 2023. Excluding the impact of foreign currency, acquisitions, and divestitures, ARR organic growth was 13%. This shift toward recurring revenue has positively impacted our revenue mix and growth over time and is leading to improved visibility in our businesses. Our software, services, and recurring revenue represented 67% and 59% of total revenue for 2023 and 2022. Additionally, we continue to maintain focus on new product introductions and transitions to recurring revenue as evidenced by the Transporeon business and the pending Trimble Ag JV Transaction (as described below).
As our solutions have expanded, our go-to-market model has also evolved with a balanced mix between direct, distribution, and OEM customers as well as enterprise-level customer relationships.
Throughout this “Management’s Discussion and Analysis of Financial Condition and Results of Operations,” we refer to organic revenue growth, which is a non-GAAP measure. For a full definition of ARR, organic ARR, and organic revenue growth as used in this discussion and analysis, refer to the “Supplemental Disclosure of Non-GAAP Financial Measures and Annualized Recurring Revenue” found later in this Item 7.
Impact of Recent Events on Our Business
Acquisitions and Divestitures
We acquire businesses that align with our long-term growth strategies including our strategic product roadmap and, conversely, we divest certain businesses that no longer fit those strategies.
On September 28, 2023, we executed a definitive agreement with AGCO that provides for the formation of a JV with AGCO in the mixed fleet precision agriculture market. Under the terms of the agreement, we will contribute the Trimble Ag business, excluding certain GNSS and guidance technologies, and AGCO will contribute its JCA Technologies business to the JV. We will sell an interest in the JV to AGCO for $2.0 billion in pre-tax cash proceeds, subject to working capital adjustments. Immediately following the closing of this proposed transaction, we will own 15% of the JV and AGCO will own 85% of the JV.
29
Additionally, we plan to enter into the following agreements with AGCO as part of the overall proposed transaction:
•a seven-year, renewable Supply Agreement through which we will provide key GNSS and guidance technologies to the JV for use in professional agriculture machines sold by AGCO, on an exclusive basis with limited exceptions;
•a Technology Transfer and License Agreement to govern the licensing of certain non-divested intellectual property and technology for use by the JV in the agriculture field and, upon expiration of the Supply Agreement, to govern fixed and variable royalty payments made to us by the JV;
•a Trademark License Agreement to govern the licensing of certain Trimble trademarks for use by the JV in the agriculture field;
•a Positioning Services Agreement through which the JV will serve as our channel partner for the positioning services in the agriculture market; and
•a Transition Services Agreement to provide contract manufacturing services for the divested products for two years following closing of the proposed transaction.
The formation of the JV is expected to better serve farmers with factory fit and aftermarket applications in the mixed fleet precision agriculture market to help farmers drive productivity, efficiency, and sustainability. Additionally, the proposed transaction is expected to (i) simplify our Connect and Scale strategy, (ii) reduce risk of channel transition in the agriculture market, and (iii) enhance our financial profile and flexibility with a resulting higher mix of software, services, and recurring revenue, as well allowing us to repurchase stock and repay $1.1 billion of our debt through use of the net proceeds.
The proposed transaction is expected to close in the first half of 2024 and is subject to customary closing conditions, including regulatory approvals. Trimble Ag is reported as a part of our Resources and Utilities segment.
The assets and liabilities of Trimble Ag that are subject to the proposed transaction were classified as held for sale at the end of 2023. See Note 4 “Divestitures” of this report.
On April 3, 2023, we acquired all of the outstanding shares of Transporeon in an all-cash transaction valued at €1.9 billion or $2.1 billion. Transporeon is a Germany-based company and leading cloud-based transportation management software platform that connects key stakeholders across the industry lifecycle to positively impact the optimization of global supply chains, which aligns with our Connect and Scale strategy. By combining Transporeon’s operations with ours, we expect economies of scale, growth, such as acceleration of recurring revenue, expansion of the addressable market, cross-sell opportunities, and enhanced productivity and sustainability solutions for our customers. Transporeon is reported in our Transportation segment. We have included the financial results of Transporeon in our Consolidated Financial Statements starting in the second quarter of 2023.
Macroeconomic Conditions
Macroeconomic conditions, including geopolitical tensions, such as the ongoing military conflicts in the Middle East and between Russia and Ukraine and related sanctions, exchange rate and interest rate volatility, and inflationary pressures, will continue to evolve globally. Global inflation rates rose in 2022 and continued into early 2023. As a result, interest rates increased over 2022 and 2023 in an effort to curb inflation. These macroeconomic conditions have had and are expected to have a negative impact on our results of operations.
We may experience higher borrowing costs on our variable-rate debt. At the end of 2023, our outstanding balance of variable-rate debt was $1.3 billion. See Note 8 “Debt” of this report for additional information regarding our debt.
In 2023, as compared to the prior year, our organic hardware sales declined and bookings moderated as dealers moved toward lower levels of inventories due to improved product lead times and reduced end user demand. Buildings and Infrastructure, Geospatial, and Resources and Utilities all had stronger hardware sales in the prior year.
CRITICAL ACCOUNTING POLICIES AND ESTIMATES
The preparation of financial statements and related disclosures in conformity with U.S. GAAP requires us to make judgments, assumptions, and estimates that affect the reported amounts of assets, liabilities, revenue, costs of sales, operating expenses, and related disclosures. We consider the accounting polices described below to be our critical accounting policies. These critical accounting policies are impacted significantly by judgments, assumptions, and estimates used in the preparation of the consolidated financial statements, and actual results could differ materially from the amounts reported based on these policies. Our accounting policies are more fully described in Note 1 “Description of Business and Accounting Policies” of this report.
Revenue Recognition
Revenue is recognized upon transfer of control of promised products or services to customers in an amount that reflects the consideration that we expect to receive in exchange for those products or services. Revenue is recognized net of allowance for returns and any taxes collected from customers. We enter into contracts that can include various combinations of products and services, which are generally capable of being distinct and accounted for as separate performance obligations; however,
30
determining whether products or services are considered distinct performance obligations that should be accounted for separately versus together may sometimes require significant judgment.
Judgment is required to determine stand-alone selling price (“SSP”) for each performance obligation. We use a range of amounts to estimate SSP when products and services are sold separately and determine whether there is a discount to be allocated based on the relative SSP of the various products and services. In instances where SSP is not directly observable, we estimate SSP considering multiple factors including but not limited to, our internal cost, pricing practices, sales channel, competitive positioning, and overall market and business environments. As our offerings and markets change, we may be required to reassess our estimated SSP and, as a result, the timing and classification of our revenue could be affected.
Income Taxes
We are a U.S. based multinational company operating in multiple U.S. and foreign jurisdictions. Judgment is required in evaluating our uncertain tax positions and determining our provision for income taxes. We consider many factors when evaluating and estimating our tax positions and tax benefits, which may require periodic adjustments and may not accurately forecast actual tax audit outcomes. Determining whether an uncertain tax position is effectively settled requires judgment. Changes in recognition or measurement of our uncertain tax positions would result in the recognition of a tax benefit or an additional charge to the tax provision.
Income taxes are accounted for under the liability method, whereby deferred tax assets or liability account balances are calculated at the balance sheet date using current tax laws and rates in effect for the year in which the differences are expected to affect taxable income. A valuation allowance is recorded to reduce the carrying amounts of deferred tax assets if we believe it is more likely than not such assets will not be realized.
We are subject to the periodic examination of our domestic and foreign tax returns by the IRS, state, local, and foreign tax authorities who may challenge our tax positions. We regularly assess the likelihood of adverse outcomes from these examinations in determining the adequacy of our provision for income taxes.
Business Combinations and Valuation of Goodwill and Purchased Intangible Assets
For business combinations, we allocate the purchase consideration to the assets acquired, liabilities assumed, and any noncontrolling interest based on their fair values at the acquisition date. When determining the fair values, we make significant estimates and assumptions, especially concerning intangible assets. Critical estimates when valuing intangible assets include expected future cash flows based on consideration of revenue and revenue growth rates and margins, customer attrition rates, future changes in technology and brand awareness, loyalty and position, and discount rates. Any purchase consideration in excess of the fair values of the net assets acquired is recorded as goodwill.
We evaluate goodwill on an annual basis in our fourth quarter or more frequently if indicators of potential impairment exist. To determine whether goodwill is impaired, we first assess qualitative factors. Qualitative factors include but are not limited to macroeconomic conditions, industry and market considerations, cost factors, overall financial performance, or other relevant company-specific events. If it is determined more likely than not that the fair value of a goodwill reporting unit is less than its carrying amount, we perform a quantitative analysis. Alternatively, we may bypass the qualitative assessment and perform a quantitative impairment test.
When performing a quantitative approach, we compare the reporting unit’s carrying amount, including goodwill, to the reporting unit's fair value. The estimation of a reporting unit's fair value involves using estimates and assumptions, including expected future operating performance using risk-adjusted discount rates. If the reporting unit's carrying amount exceeds its fair value, an impairment loss is recognized.
We review intangible assets for impairment whenever events or changes in circumstances indicate that the carrying amount of those assets may not be recoverable based on their future cash flows. The estimated future cash flows are primarily based on assumptions about expected future operating performance.
31
RESULTS OF OPERATIONS
Overview
The following table shows revenue by category, gross margin and gross margin as a percentage of revenue, operating income and operating income as a percentage of revenue, diluted earnings per share, and annualized recurring revenue compared for the periods indicated:
| 2023 | 2022 | Dollar Change | % Change | ||||||||||||||||||||
| (In millions, except per share amounts) | |||||||||||||||||||||||
| Revenue: | |||||||||||||||||||||||
| Product | $ | 1,771.7 | $ | 1,986.1 | $ | (214.4) | (11)% | ||||||||||||||||
| Subscription and services | 2,027.0 | 1,690.2 | 336.8 | 20% | |||||||||||||||||||
| Total revenue | $ | 3,798.7 | $ | 3,676.3 | $ | 122.4 | 3% | ||||||||||||||||
| Gross margin | $ | 2,332.8 | $ | 2,105.6 | $ | 227.2 | 11% | ||||||||||||||||
| Gross margin as a % of revenue | 61.4 | % | 57.3 | % | |||||||||||||||||||
| Operating income | $ | 448.8 | $ | 510.9 | $ | (62.1) | (12)% | ||||||||||||||||
| Operating income as a % of revenue | 11.8 | % | 13.9 | % | |||||||||||||||||||
| Diluted earnings per share | $ | 1.25 | $ | 1.80 | $ | (0.55) | (31)% | ||||||||||||||||
Non-GAAP operating income (1) | $ | 934.7 | $ | 841.5 | $ | 93.2 | 11% | ||||||||||||||||
Non-GAAP operating income as a % of revenue(1) | 24.6 | % | 22.9 | % | |||||||||||||||||||
Non-GAAP diluted earnings per share (1) | $ | 2.66 | $ | 2.64 | $ | 0.02 | 1% | ||||||||||||||||
Annualized Recurring Revenue (“ARR”) (1) | $ | 1,982.3 | $ | 1,603.7 | $ | 378.6 | 24% | ||||||||||||||||
(1) Refer to “Supplemental Disclosure of Non-GAAP Financial Measures and Annualized Recurring Revenue” of this report for definitions.
Basis of Presentation
We use a 52–53 week fiscal year ending on the Friday nearest to December 31, which for 2023 was December 29, 2023. Both 2023 and 2022 were 52–week years. 2024 will be a 53-week year.
Year 2023 Compared with Year 2022
Revenue
| 2023 | ||||||||||||||||||||
Change versus 2022 | % Change | |||||||||||||||||||
| Product | Subscription and Services | Total Revenue | ||||||||||||||||||
| Change in Revenue | (11) | % | 20 | % | 3 | % | ||||||||||||||
| Acquisitions | — | % | 9 | % | 4 | % | ||||||||||||||
| Divestitures | (3) | % | (2) | % | (2) | % | ||||||||||||||
| Organic growth | (8) | % | 13 | % | 1 | % | ||||||||||||||
Organic total revenue was up 1%. Organic subscription and services revenue was up primarily due to strong growth in subscription and software term licenses in Buildings and Infrastructure, and to a lesser extent, positioning services in Resources and Utilities, and enterprise and MAPS in Transportation. Organic product revenue decreased due to reductions in dealer inventory levels as a result of improved product lead times and reduced end user demand. These decreases impacted sales in Buildings and Infrastructure, Geospatial, and Resources and Utilities.
Gross Margin
Gross margin and gross margin as a percentage of revenue increased due to an increased mix of higher margin software and subscription sales including organic growth and the Transporeon acquisition, and declines in hardware sales, as well as lower supply chain costs.
Operating Income
Operating income decreased slightly primarily due to increased operating expense, partially offset by revenue and gross margin expansion. Operating expense increased due to the Transporeon acquisition, higher research and development, and general and administrative costs, including investments related to our Connect and Scale strategy and increased amortization of purchased intangibles. In addition, we incurred higher acquisition and divestiture transaction costs.
32
Operating income as a percentage of revenue decreased primarily due to increased operating expense, partially offset by gross margin expansion as a percentage of revenue. We had cost reductions in 2023 and will continue to focus on further reductions.
Research and Development, Sales and Marketing, and General and Administrative Expense
The following table shows research and development (“R&D”), sales and marketing (“S&M”), and general and administrative (“G&A”) expense along with these expenses as a percentage of revenue for the periods indicated:
| 2023 | 2022 | Dollar Change | % Change | ||||||||||||||||||||
| (In millions) | |||||||||||||||||||||||
| Research and development | $ | 664.3 | $ | 542.1 | $ | 122.2 | 23% | ||||||||||||||||
| Percentage of revenue | 17.5 | % | 14.7 | % | |||||||||||||||||||
| Sales and marketing | $ | 583.0 | $ | 553.6 | $ | 29.4 | 5% | ||||||||||||||||
| Percentage of revenue | 15.3 | % | 15.1 | % | |||||||||||||||||||
| General and administrative | $ | 487.5 | $ | 422.2 | $ | 65.3 | 15% | ||||||||||||||||
| Percentage of revenue | 12.8 | % | 11.5 | % | |||||||||||||||||||
| Total | $ | 1,734.8 | $ | 1,517.9 | $ | 216.9 | 14% | ||||||||||||||||
R&D expense increased primarily due to higher compensation expense, including incentive compensation, and to a lesser extent, the Transporeon acquisition. We believe that the development and introduction of new solutions are critical to our future success, and we expect to continue the active development of new products.
S&M expense increased slightly primarily due to the Transporeon acquisition.
G&A expense increased primarily due to higher acquisition and divestiture transaction costs, the Transporeon acquisition, and to a lesser extent, increased compensation expense, including incentive compensation.
Amortization of Purchased Intangible Assets
The following table shows amortization of purchased intangible assets for the periods indicated:
| 2023 | 2022 | Dollar Change | % Change | ||||||||||||||||||||
| (In millions) | |||||||||||||||||||||||
| Cost of sales | $ | 108.7 | $ | 85.0 | $ | 23.7 | 28% | ||||||||||||||||
| Operating expenses | 103.6 | 46.6 | 57.0 | 122% | |||||||||||||||||||
| Total amortization expense of purchased intangibles | $ | 212.3 | $ | 131.6 | $ | 80.7 | 61% | ||||||||||||||||
| Total amortization expense of purchased intangibles as a percentage of revenue | 6 | % | 4 | % | |||||||||||||||||||
In 2023, total amortization expense of purchased intangibles increased primarily due to amortization of intangibles acquired from the Transporeon acquisition, which were not applicable in the prior year.
Non-Operating Income (Expense), Net
The following table shows non-operating income (expense), net for the periods indicated:
| 2023 | 2022 | Dollar Change | % Change | ||||||||||||||||||||
| (In millions) | |||||||||||||||||||||||
| Divestitures gain, net | $ | 9.2 | $ | 99.0 | $ | (89.8) | (91)% | ||||||||||||||||
| Interest expense, net | (161.0) | (71.1) | (89.9) | 126% | |||||||||||||||||||
| Income from equity method investments, net | 28.1 | 31.1 | (3.0) | (10)% | |||||||||||||||||||
| Other income (expense), net | 31.9 | (0.8) | 32.7 | (4088)% | |||||||||||||||||||
| Total non-operating income (expense), net | $ | (91.8) | $ | 58.2 | $ | (150.0) | (258)% | ||||||||||||||||
Non-operating expense, net increased primarily due to lower net gains from divestitures and higher interest expense from the new debt associated with the Transporeon acquisition, partially offset by foreign currency hedging gains associated with the Transporeon acquisition and fluctuations in the deferred compensation plan assets, both included in Other income (expense), net.
Income Tax Provision
Our effective income tax rate for 2023 and 2022 were 12.8% and 21.0%. The decrease was primarily due to an increases in tax benefit from U.S. federal R&D credit and foreign-derived intangible income (“FDII”) in 2023, and change in geographic mix of earnings, partially offset by lower stock-based compensation deductions in the current year.
33
Results by Segment
We report our financial performance, including revenue and operating income, based on four reportable segments: Buildings and Infrastructure, Geospatial, Resources and Utilities, and Transportation.
Our Chief Executive Officer, who is our Chief Operating Decision Maker (“CODM”) views and evaluates operations based on the results of our reportable operating segments under our management reporting system. These results are not necessarily in conformance with U.S. GAAP. For additional discussion of our segments, refer to Note 7 “Segment Information” of this report.
The following table is a summary of revenue and operating income by segment compared for the periods indicated:
| 2023 | 2022 | Dollar Change | % Change | ||||||||||||||||||||
| (In millions) | |||||||||||||||||||||||
| Buildings and Infrastructure | |||||||||||||||||||||||
| Segment revenue | $ | 1,593.1 | $ | 1,494.0 | $ | 99.1 | 7% | ||||||||||||||||
| Segment revenue as a % of total revenue | 42 | % | 41 | % | |||||||||||||||||||
| Segment operating income | $ | 440.8 | $ | 406.3 | $ | 34.5 | 8% | ||||||||||||||||
| Segment operating income as a % of segment revenue | 27.7 | % | 27.2 | % | |||||||||||||||||||
| Geospatial | |||||||||||||||||||||||
| Segment revenue | $ | 695.5 | $ | 756.5 | $ | (61.0) | (8)% | ||||||||||||||||
| Segment revenue as a % of total revenue | 18 | % | 21 | % | |||||||||||||||||||
| Segment operating income | $ | 209.1 | $ | 221.4 | $ | (12.3) | (6)% | ||||||||||||||||
| Segment operating income as a % of segment revenue | 30.1 | % | 29.3 | % | |||||||||||||||||||
| Resources and Utilities | |||||||||||||||||||||||
| Segment revenue | $ | 769.1 | $ | 821.6 | $ | (52.5) | (6)% | ||||||||||||||||
| Segment revenue as a % of total revenue | 20 | % | 22 | % | |||||||||||||||||||
| Segment operating income | $ | 270.6 | $ | 278.3 | $ | (7.7) | (3)% | ||||||||||||||||
| Segment operating income as a % of segment revenue | 35.2 | % | 33.9 | % | |||||||||||||||||||
| Transportation | |||||||||||||||||||||||
| Segment revenue | $ | 741.0 | $ | 604.2 | $ | 136.8 | 23% | ||||||||||||||||
| Segment revenue as a % of total revenue | 20 | % | 16 | % | |||||||||||||||||||
| Segment operating income | $ | 130.2 | $ | 58.8 | $ | 71.4 | 121% | ||||||||||||||||
| Segment operating income as a % of segment revenue | 17.6 | % | 9.7 | % | |||||||||||||||||||
The following table is a reconciliation of our consolidated segment operating income to consolidated income before taxes:
| 2023 | 2022 | ||||||||||
| (In millions) | |||||||||||
| Consolidated segment operating income | $ | 1,050.7 | $ | 964.8 | |||||||
| Unallocated general corporate expenses | (116.0) | (123.3) | |||||||||
| Purchase accounting adjustments | (212.3) | (131.6) | |||||||||
| Acquisition / divestiture items | (72.4) | (32.8) | |||||||||
| Stock-based compensation / deferred compensation | (151.1) | (112.0) | |||||||||
| Restructuring and other costs | (50.1) | (54.2) | |||||||||
| Consolidated operating income | 448.8 | 510.9 | |||||||||
| Total non-operating income (expense), net | (91.8) | 58.2 | |||||||||
| Consolidated income before taxes | $ | 357.0 | $ | 569.1 | |||||||
34
Buildings and Infrastructure
| Change versus 2022 | 2023 | |||||||
| % Change | ||||||||
Change in Revenue - Buildings and Infrastructure | 7 | % | ||||||
| Acquisitions | 2 | % | ||||||
| Divestitures | (2) | % | ||||||
| Foreign currency exchange | — | % | ||||||
Organic growth | 7 | % | ||||||
Organic revenue increased due to strong demand for our subscription and term license software. The increases resulted from higher sales to new and existing customers as well as cumulative conversions from perpetual software to recurring offerings. The increase was offset by lower civil construction hardware sales due to reductions in dealer inventory levels as a result of improved lead times and reduced end user demand.
Operating income and operating income as a percentage of revenue increased primarily from gross margin expansion due to increased sales and a higher mix of software and subscription revenue, partially offset by increased operating expense. Operating expense increased due to increased compensation expense and investments, including our Connect and Scale strategy.
Geospatial
| Change versus 2022 | 2023 | |||||||
| % Change | ||||||||
| Change in Revenue - Geospatial | (8) | % | ||||||
| Divestitures | (4) | % | ||||||
| Organic growth | (4) | % | ||||||
Organic revenue decreased due to lower surveying hardware sales due to reductions in dealer inventory levels as a result of improved lead times and reduced end user demand. The declines were partially offset by higher U.S. Federal government sales in the current year; the timing of government sales can fluctuate from period to period.
Operating income decreased due to reduced revenue, partially offset by gross margin expansion driven by product mix and lower hardware supply chain costs. Operating income as a percentage of revenue was relative flat.
Resources and Utilities
| Change versus 2022 | 2023 | |||||||
| % Change | ||||||||
Change in Revenue - Resources and Utilities | (6) | % | ||||||
| Acquisitions | 1 | % | ||||||
| Divestitures | (1) | % | ||||||
| Organic growth | (6) | % | ||||||
Organic revenue decreased due to reductions in channel inventory levels as a result of improved lead times and slowing demand in agriculture markets, as well as impacts related to changes in our distribution network. The decrease was partially offset by higher subscription revenue in positioning services.
Operating income decreased slightly due to reduced revenue and higher operating expense, largely offset by gross margin expansion. Operating income as a percentage of revenue was up primarily due to gross margin expansion driven by a higher mix of software and subscription revenue and lower hardware supply chain costs.
35
Transportation
| Change versus 2022 | 2023 | |||||||
| % Change | ||||||||
Change in Revenue - Transportation | 23 | % | ||||||
| Acquisitions | 21 | % | ||||||
| Divestitures | (2) | % | ||||||
| Organic growth | 4 | % | ||||||
Organic revenue increased primarily driven by enterprise and MAPS subscription revenue growth. Additionally, North American mobility hardware sales increased in 2023.
Operating income and operating income as a percentage of revenue increased primarily due to gross margin expansion, driven by a higher mix of subscription revenue, including the impact of the Transporeon acquisition. We continue to maintain focus on new product introductions and transitions to recurring revenue.
36
LIQUIDITY AND CAPITAL RESOURCES
| At the End of Year | 2023 | 2022 | Dollar Change | % Change | |||||||||||||||||||
| (In millions, except percentages) | |||||||||||||||||||||||
Cash and cash equivalents (1) | $ | 238.9 | $ | 271.0 | $ | (32.1) | (12) | % | |||||||||||||||
| As a percentage of total assets | 2.5 | % | 3.7 | % | |||||||||||||||||||
| Principal balance of outstanding debt | $ | 3,080.4 | $ | 1,525.0 | $ | 1,555.4 | 102 | % | |||||||||||||||
| Years | 2023 | 2022 | Dollar Change | % Change | |||||||||||||||||||
| (In millions) | |||||||||||||||||||||||
| Net cash provided by operating activities | $ | 597.1 | $ | 391.2 | $ | 205.9 | 53 | % | |||||||||||||||
| Net cash used in investing activities | (2,068.1) | (226.3) | (1,841.8) | 814 | % | ||||||||||||||||||
| Net cash provided by (used in) financing activities | 1,431.5 | (199.0) | 1,630.5 | (819) | % | ||||||||||||||||||
| Effect of exchange rate changes on cash and cash equivalents | 7.4 | (20.6) | 28.0 | (136) | % | ||||||||||||||||||
| Net (decrease) increase in cash and cash equivalents | $ | (32.1) | $ | (54.7) | |||||||||||||||||||
(1) Includes $9.1 million of cash and cash equivalents classified as held for sale as of December 29, 2023.
Operating Activities
The increase in cash provided by operating activities was primarily driven by lower inventory purchases and reduced bonus payouts. The increase was partially offset by a decrease in deferred revenue due to the timing of billings and higher interest payments.
Investing Activities
The increase in cash used in investing activities was primarily due to acquisition activities in the current year, including the Transporeon acquisition, and higher proceeds from divestitures in the prior year.
Financing Activities
The increase in cash provided by financing activities was primarily driven by proceeds from our $800.0 million issuance of 2033 Senior Notes and $1.0 billion term loans in the current year, and higher common stock repurchases in the prior year. The increase was partially offset by the repayment of the 2023 Senior Notes that matured in the current year.
Cash and Cash Equivalents
We believe that our cash and cash equivalents and available borrowing capacity under our existing lines of credit, along with cash provided by operations will be sufficient in the foreseeable future to meet our anticipated operating cash needs, including expenditures related to our Connect and Scale strategy, debt service, acquisitions, and any stock repurchases under the stock repurchase program.
Our 2022 Credit Facility allows us to borrow up to $1.25 billion, with an option to increase the borrowings up to $1.75 billion with lender approval. As of December 29, 2023, $150.0 million was outstanding under the 2022 Credit Facility.
Our 2023 Senior Notes totaling $300.0 million matured and were paid in June 2023. Our 2024 Senior Notes totaling $400.0 million are maturing in December 2024. We anticipate using a combination of cash on hand, borrowing from our existing revolvers, or new debt to repay the 2024 Senior Notes.
In the second quarter of 2023, we acquired Transporeon, which was funded through a combination of $1.0 billion of term loans, $225.0 million drawn on the 2022 credit facility, as amended, and the 2033 senior notes, see Note 3 “Acquisitions” of this report.
In the third quarter of 2023, we executed a definitive agreement to contribute our Trimble Ag business to a newly formed JV with AGCO and sell 85% of the stake in the JV to AGCO for $2.0 billion in pre-tax cash proceeds, subject to certain adjustments. See Note 4 “Divestitures” of this report. Although we will continue to evaluate the optimal capital structure for our business following the completion of the pending sale, we expect to use the $1.5 billion of estimated proceeds after tax to repurchase stock and repay approximately $1.1 billion in debt.
Our material cash requirements include the following contractual and other obligations and cash needs:
Leases
We have operating leases primarily for certain of our major facilities including corporate offices, research and development facilities, and manufacturing facilities. Operating leases represent undiscounted lease payments and include short-term leases.
37
At the end of 2023, we had fixed lease payment obligations of $208.9 million, with $49.3 million payable within the next 12 months. Refer to Note 9 “Leases” of this report for additional information regarding our leases.
Tax Payable
At the end of 2023, we had income taxes payable of $62.4 million, with $39.7 million payable within the next 12 months. The amount payable within the next 12 months includes $18.2 million representing a one-time transition tax liability as a result of the 2017 Tax Cuts and Jobs Act (the “Tax Act”).
In addition, we have unrecognized tax benefits of $88.3 million included in Other non-current liabilities, including interest and penalties. At this time, we cannot make a reasonably reliable estimate of the period of cash settlement with tax authorities regarding this liability. Refer to Note 13 “Income Taxes” of this report for additional information regarding our taxes.
Other Purchase Obligations and Commitments
Purchase obligations and commitments primarily relate to investments in our platform associated with our Connect and Scale strategy and non-cancellable inventory commitments. At the end of 2023, we had operating purchase obligations and commitments of $618.9 million, with $253.5 million payable within the next 12 months. Refer to Note 10 “Commitments and Contingencies” of this report for additional information regarding our purchase obligations and commitments. Other than the items discussed above, we do not have any off-balance sheet financing arrangements or liabilities.
Debt
At the end of 2023, we had outstanding fixed-rate senior notes and floating credit facilities with varying maturities for an aggregate principal amount of approximately $3.1 billion. Future interest payments total $898.4 million, with $190.7 million payable within the next 12 months. We anticipate repaying $1.1 billion of our debt through the use of the net proceeds from the proposed AGCO JV transaction. Refer to Note 4 “Divestitures” of this report for additional information.
During 2023, we had $1.6 billion of proceeds from debt, net of the payments. Refer to Note 8 “Debt” of this report for additional information regarding our debt.
Stock Repurchase Program
At the end of 2023, we had a 2021 Stock Repurchase Program authorized by our Board of Directors that allowed us to repurchase stocks from time to time, subject to business and market conditions and other investment opportunities, through open market transactions, privately-negotiated transactions, accelerated stock repurchase plans, or by other means for up to $750.0 million. On January 28, 2024, our Board of Directors approved a 2024 Stock Repurchase Program that allows us to repurchase stock from time to time, through accelerated stock repurchase plans, open market transactions, privately negotiated transactions, block purchases, tender offers, or by other means for up to $800.0 million. The 2024 Stock Repurchase Program does not obligate us to acquire any specific number of shares. The 2024 Stock Repurchase Program replaced the 2021 Stock Repurchase Program, which was cancelled. Refer to Note 15 “Common Stock Repurchase” of this report for additional information regarding our 2021 Stock Repurchase Program and 2024 Stock Repurchase Program.
EFFECT OF NEW ACCOUNTING PRONOUNCEMENTS
The impact of recent accounting pronouncements is disclosed in Note 1 “Description of Business and Accounting Policies” of this report.
SUPPLEMENTAL DISCLOSURE OF NON-GAAP FINANCIAL MEASURES AND ANNUALIZED RECURRING REVENUE
To supplement our consolidated financial information, we included non-GAAP financial measures, which are not meant to be considered in isolation or as a substitute for comparable GAAP. We believe non-GAAP financial measures provide useful information to investors and others in understanding our “core operating performance”, which excludes (i) the effect of non-cash items and certain variable charges not expected to recur; and (ii) transactions that are not meaningful in comparison to our past operating performance or not reflective of ongoing financial results. Lastly, we believe that our core operating performance offers a supplemental measure for period-to-period comparisons and can be used to evaluate our historical and prospective financial performance, as well as our performance relative to competitors.
Organic revenue growth is a non-GAAP measure that refers to revenue excluding the impacts of (i) foreign currency translation, and (ii) acquisitions and divestitures. We believe organic revenue growth provides useful information in evaluating the results of our business because it excludes items that are not indicative of ongoing performance or impact comparability with the prior year. We provide reconciliation tables showing the change in revenue growth to organic revenue growth in the “Results of Operations” section found earlier in this Item 7.
38
In addition to providing non-GAAP financial measures, we disclose Annualized Recurring Revenue (“ARR”) to give the investors supplementary indicators of the value of our current recurring revenue contracts. ARR represents the estimated annualized value of recurring revenue. ARR is calculated by taking our subscription, maintenance and support, and recurring transaction revenue for the current quarter and adding the portion of the contract value of all our term licenses attributable to the current quarter, then dividing that sum by the number of days in the quarter and then multiplying that quotient by 365. Organic ARR refers to annualized recurring revenue excluding the impacts of (i) foreign currency translation, and (ii) acquisitions and divestitures. ARR and organic ARR should be viewed independently of revenue and deferred revenue as they are performance measures and are not intended to be combined with or to replace either of those items.
The non-GAAP financial measures, definitions, and explanations to the adjustments to comparable GAAP measures are included below:
| Years | ||||||||||||||||||||
| 2023 | 2022 | |||||||||||||||||||
| Dollar | % of | Dollar | % of | |||||||||||||||||
| (In millions, except per share amounts) | Amount | Revenue | Amount | Revenue | ||||||||||||||||
| REVENUE: | ||||||||||||||||||||
| GAAP revenue: | $ | 3,798.7 | $ | 3,676.3 | ||||||||||||||||
| GROSS MARGIN: | ||||||||||||||||||||
| GAAP gross margin: | $ | 2,332.8 | 61.4 | % | $ | 2,105.6 | 57.3 | % | ||||||||||||
| Amortization of purchased intangible assets | (A) | 108.7 | 85.0 | |||||||||||||||||
| Acquisition / divestiture items | (B) | 0.5 | 0.2 | |||||||||||||||||
| Stock-based compensation / deferred compensation | (C) | 15.0 | 12.1 | |||||||||||||||||
| Restructuring and other costs | (D) | (0.1) | 1.7 | |||||||||||||||||
| Non-GAAP gross margin: | $ | 2,456.9 | 64.7 | % | $ | 2,204.6 | 60.0 | % | ||||||||||||
| OPERATING EXPENSES: | ||||||||||||||||||||
| GAAP operating expenses: | $ | 1,884.0 | 49.6 | % | $ | 1,594.7 | 43.4 | % | ||||||||||||
| Amortization of purchased intangible assets | (A) | (103.6) | (46.6) | |||||||||||||||||
| Acquisition / divestiture items | (B) | (71.9) | (32.6) | |||||||||||||||||
| Stock-based compensation / deferred compensation | (C) | (136.1) | (99.9) | |||||||||||||||||
| Restructuring and other costs | (D) | (50.2) | (52.5) | |||||||||||||||||
| Non-GAAP operating expenses: | $ | 1,522.2 | 40.1 | % | $ | 1,363.1 | 37.1 | % | ||||||||||||
| OPERATING INCOME: | ||||||||||||||||||||
| GAAP operating income: | $ | 448.8 | 11.8 | % | $ | 510.9 | 13.9 | % | ||||||||||||
| Amortization of purchased intangible assets | (A) | 212.3 | 131.6 | |||||||||||||||||
| Acquisition / divestiture items | (B) | 72.4 | 32.8 | |||||||||||||||||
| Stock-based compensation / deferred compensation | (C) | 151.1 | 112.0 | |||||||||||||||||
| Restructuring and other costs | (D) | 50.1 | 54.2 | |||||||||||||||||
| Non-GAAP operating income: | $ | 934.7 | 24.6 | % | $ | 841.5 | 22.9 | % | ||||||||||||
| NON-OPERATING INCOME (EXPENSE), NET: | ||||||||||||||||||||
| GAAP non-operating income (expense), net: | $ | (91.8) | $ | 58.2 | ||||||||||||||||
| Acquisition / divestiture items | (B) | (36.5) | (107.5) | |||||||||||||||||
| Deferred compensation | (C) | (5.8) | 8.5 | |||||||||||||||||
| Restructuring and other costs | (D) | 1.3 | 6.0 | |||||||||||||||||
| Non-GAAP non-operating expense, net: | $ | (132.8) | $ | (34.8) | ||||||||||||||||
| GAAP and Non-GAAP Tax Rate % | GAAP and Non-GAAP Tax Rate % | |||||||||||||||||||
(G) | (G) | |||||||||||||||||||
| INCOME TAX PROVISION: | ||||||||||||||||||||
| GAAP income tax provision: | $ | 45.7 | 12.8 | % | $ | 119.4 | 21.0 | % | ||||||||||||
| Non-GAAP items tax effected | (E) | 56.9 | 49.9 | |||||||||||||||||
| Difference in GAAP and Non-GAAP tax rate | (F) | 35.6 | (22.9) | |||||||||||||||||
| Non-GAAP income tax provision: | $ | 138.2 | 17.2 | % | $ | 146.4 | 18.2 | % | ||||||||||||
| NET INCOME: | ||||||||||||||||||||
| GAAP net income: | $ | 311.3 | $ | 449.7 | ||||||||||||||||
| Amortization of purchased intangible assets | (A) | 212.3 | 131.6 | |||||||||||||||||
| Acquisition / divestiture items | (B) | 35.9 | (74.7) | |||||||||||||||||
| Stock-based compensation / deferred compensation | (C) | 145.3 | 120.5 | |||||||||||||||||
| Restructuring and other costs | (D) | 51.4 | 60.2 | |||||||||||||||||
| Non-GAAP tax adjustments | (E) - (F) | (92.5) | (27.0) | |||||||||||||||||
| Non-GAAP net income: | $ | 663.7 | $ | 660.3 | ||||||||||||||||
39
| Years | ||||||||||||||||||||
| 2023 | 2022 | |||||||||||||||||||
| DILUTED NET INCOME PER SHARE: | ||||||||||||||||||||
| GAAP diluted net income per share: | $ | 1.25 | $ | 1.80 | ||||||||||||||||
| Amortization of purchased intangible assets | (A) | 0.85 | 0.53 | |||||||||||||||||
| Acquisition / divestiture items | (B) | 0.14 | (0.30) | |||||||||||||||||
| Stock-based compensation / deferred compensation | (C) | 0.58 | 0.48 | |||||||||||||||||
| Restructuring and other costs | (D) | 0.21 | 0.24 | |||||||||||||||||
| Non-GAAP tax adjustments | (E) - (F) | (0.37) | (0.11) | |||||||||||||||||
| Non-GAAP diluted net income per share: | $ | 2.66 | $ | 2.64 | ||||||||||||||||
| ADJUSTED EBITDA: | ||||||||||||||||||||
| GAAP operating income: | $ | 448.8 | 11.8 | % | $ | 510.9 | 13.9 | % | ||||||||||||
| Amortization of purchased intangible assets | (A) | 212.3 | 131.6 | |||||||||||||||||
| Acquisition / divestiture items | (B) | 72.4 | 32.8 | |||||||||||||||||
| Stock-based compensation / deferred compensation | (C) | 151.1 | 112.0 | |||||||||||||||||
| Restructuring and other costs | (D) | 50.1 | 54.2 | |||||||||||||||||
| Non-GAAP operating income: | 934.7 | 24.6 | % | 841.5 | 22.9 | % | ||||||||||||||
| Depreciation expense and cloud computing amortization | 46.9 | 44.7 | ||||||||||||||||||
| Income from equity method investments, net | 28.1 | 31.1 | ||||||||||||||||||
| Adjusted EBITDA | $ | 1,009.7 | 26.6 | % | $ | 917.3 | 25.0 | % | ||||||||||||
Non-GAAP Definitions
Non-GAAP gross margin
We define Non-GAAP gross margin as GAAP gross margin, excluding the effects of amortization of purchased intangible assets, acquisition/divestiture items, stock-based compensation, deferred compensation, and restructuring and other costs. We believe our investors benefit by understanding our non-GAAP gross margin as a way of understanding how product mix, pricing decisions, and manufacturing costs influence our business.
Non-GAAP operating expenses
We define Non-GAAP operating expenses as GAAP operating expenses, excluding the effects of amortization of purchased intangible assets, acquisition/divestiture items, stock-based compensation, deferred compensation, and restructuring and other costs. We believe this measure is important to investors evaluating our non-GAAP spending in relation to revenue.
Non-GAAP operating income
We define Non-GAAP operating income as GAAP operating income, excluding the effects of amortization of purchased intangible assets, acquisition/divestiture items, stock-based compensation, deferred compensation, and restructuring and other costs. We believe our investors benefit by understanding our non-GAAP operating income trends, which are driven by revenue, gross margin, and spending.
Non-GAAP non-operating expense, net
We define Non-GAAP non-operating expense, net as GAAP non-operating income (expense), net, excluding acquisition/divestiture items, deferred compensation, and restructuring and other costs. We believe this measure helps investors evaluate our non-operating expense trends.
Non-GAAP income tax provision
We define Non-GAAP income tax provision as GAAP income tax provision, excluding charges and benefits such as net deferred tax impacts resulting from the non-U.S. intercompany transfer of intellectual property, tax law changes, and significant one-time reserve releases upon the statute of limitations expirations. We believe this measure helps investors because it provides for consistent treatment of excluded items in our non-GAAP presentation and a difference in the GAAP and non-GAAP tax rates.
Non-GAAP net income
We define Non-GAAP net income as GAAP net income, excluding the effects of amortization of purchased intangible assets, acquisition/divestiture items, stock-based compensation, restructuring and other costs, and non-GAAP tax adjustments. This measure provides a supplemental view of net income trends, which are driven by non-GAAP income before taxes and our non-GAAP tax rate.
40
Non-GAAP diluted net income per share
We define Non-GAAP diluted net income per share as GAAP diluted net income per share, excluding the effects of amortization of purchased intangible assets, acquisition/divestiture items, stock-based compensation, restructuring and other costs, and non-GAAP tax adjustments. We believe our investors benefit by understanding our non-GAAP operating performance as reflected in a per share calculation as a way of measuring non-GAAP operating performance by ownership in the company.
Adjusted EBITDA
We define Adjusted EBITDA as non-GAAP operating income plus depreciation expense, cloud computing amortization, and income from equity method investments, net. Other companies may define Adjusted EBITDA differently. Adjusted EBITDA is not intended to purport to be an alternative to net income or operating income as a measure of operating performance or cash flow from operating activities as a measure of liquidity. Adjusted EBITDA is a performance measure that we believe offers a useful view of the overall operations of our business because it facilitates operating performance comparisons by removing potential differences caused by variations unrelated to operating performance, such as capital structures (interest expense), income taxes, depreciation, and amortization of purchased intangibles and cloud computing costs.
Explanations of Non-GAAP adjustments
(A).Amortization of purchased intangible assets. Non-GAAP gross margin and operating expenses exclude the amortization of purchased intangible assets, which primarily represents technology and/or customer relationships already developed.
(B).Acquisition / divestiture items. Non-GAAP gross margin and operating expenses exclude costs consisting of external and incremental costs resulting directly from acquisitions, divestitures, and strategic investment activities such as legal, due diligence, integration, and other closing costs, including the acceleration of acquisition stock awards and adjustments to the fair value of earn-out liabilities. Non-GAAP non-operating expense, net, excludes unusual one-time acquisition/divestiture charges, including foreign currency exchange rate gains/losses related to an acquisition, divestiture gains/losses, and strategic investment impairments. These are one-time costs that vary significantly in amount and timing and are not indicative of our core operating performance.
(C).Stock-based compensation / deferred compensation. Non-GAAP gross margin and operating expenses exclude stock-based compensation and income or expense associated with movement in our non-qualified deferred compensation plan liabilities. Changes in non-qualified deferred compensation plan assets, included in non-operating expense, net, offset the income or expense in the plan liabilities.
(D).Restructuring and other costs. Non-GAAP gross margin and operating expenses exclude restructuring and other costs comprised of termination benefits related to reductions in employee headcount and closure or exit of facilities, executive severance agreements, business exit costs, as well as a $20 million commitment to donate to the Trimble Foundation that was paid over four quarters ending in the first quarter of 2023.
(E).Non-GAAP items tax effected. This amount adjusts the provision for income taxes to reflect the effect of the non-GAAP items (A) - (D) on non-GAAP net income.
(F).Difference in GAAP and Non-GAAP tax rate. This amount represents the difference between the GAAP and non-GAAP tax rates applied to the non-GAAP operating income plus the non-GAAP non-operating expense, net. The non-GAAP tax rate excludes charges and benefits such as (i) deferred tax impacts from tax amortization relating to a non-U.S. intercompany transfer of intellectual property and R&D cost capitalization impact to global intangible low-taxed income ("GILTI"), and (ii) significant one-time reserve releases upon statute of limitations expirations.
(G).GAAP and non-GAAP tax rate percentages. These percentages are defined as GAAP income tax provision as a percentage of GAAP income before taxes and non-GAAP income tax provision as a percentage of non-GAAP income before taxes.
41
Item 7A. Quantitative and Qualitative Disclosures about Market Risk
We are exposed to market risk related to changes in interest rates and foreign currency exchange rates. We use certain derivative financial instruments to manage these risks. We do not use derivative financial instruments for speculative purposes. All financial instruments are used in accordance with policies approved by our board of directors.
Market Interest Rate Risk
Our cash equivalents consisted primarily of interest and non-interest bearing bank deposits as well as bank time deposits. The main objective of these instruments is safety of principal and liquidity while maximizing return, without significantly increasing risk. Due to the nature of our cash equivalents that they are readily convertible to cash, we do not anticipate any material effect on our portfolio due to fluctuations in interest rates.
In the second quarter of 2023, we borrowed $1.2 billion of variable-rate debt in conjunction with the Transporeon acquisition. At the end of 2023, our outstanding balance of variable-rate debt was $1.3 billion, see details in Note 8 “Debt” of this report. We are exposed to market risk due to the possibility of changing interest rates. While not predictive, a hypothetical 50 basis point increase in interest rates on our variable-rate debt would result in an increase of approximately $6.5 million in annual interest expense.
Foreign Currency Exchange Rate Risk
We operate in international markets, which expose us to market risk associated with foreign currency exchange rate fluctuations between the U.S. Dollar and various foreign currencies, the most significant of which is the Euro.
Historically, the majority of our revenue contracts are denominated in U.S. Dollars, with the most significant exception being Europe, where we invoice primarily in Euro. Additionally, a portion of our expenses, primarily the cost to manufacture, cost of personnel to deliver technical support on our products and professional services, sales and sales support, and research and development, are denominated in foreign currencies, primarily the Euro.
Revenue resulting from selling in local currencies and costs incurred in local currencies are exposed to foreign currency exchange rate fluctuations, which can affect our operating income. As exchange rates vary, operating income may differ from expectations. In 2023, changes in foreign currency exchange rates had a favorable impact of $0.9 million on revenue and an unfavorable impact of $5.8 million on operating income.
We enter into foreign currency forward contracts to minimize the short-term impact of foreign currency exchange rate fluctuations on cash, debt, and certain trade and intercompany receivables and payables, primarily denominated in Euro, Canadian Dollars, New Zealand Dollars, British Pound, and Brazilian Real. These contracts reduce the exposure to fluctuations in foreign currency exchange rate movements, as the gains and losses associated with foreign currency balances are generally offset with the gains and losses on the forward contracts. We occasionally enter into foreign currency exchange contracts to hedge the purchase price of some of our larger business acquisitions.
Our foreign currency contracts are marked-to-market through earnings every period and generally range in maturity from one to two months, or from four to six months for acquisitions. We do not enter into foreign currency contracts for trading purposes. Foreign currency contracts outstanding at the end of 2023 and 2022 are summarized as follows:
At the End of 2023 | At the End of 2022 | ||||||||||||||||||||||
| Nominal Amount | Fair Value | Nominal Amount | Fair Value | ||||||||||||||||||||
| (In millions) | |||||||||||||||||||||||
| Forward contracts: | |||||||||||||||||||||||
| Purchased | $ | (120.3) | $ | 0.3 | $ | (77.9) | $ | — | |||||||||||||||
| Sold | 50.8 | (0.3) | 130.6 | 0.2 | |||||||||||||||||||
| Foreign currency exchange contract related to acquisition | — | — | 1,999.4 | 10.4 | |||||||||||||||||||
42
TRIMBLE INC.
INDEX TO FINANCIAL STATEMENTS
Reports of Independent Registered Public Accounting Firm (PCAOB ID: | |||||
43
Item 8. Financial Statements and Supplementary Data
TRIMBLE INC.
CONSOLIDATED BALANCE SHEETS
| At the End of Year | 2023 | 2022 | |||||||||
| (In millions, except par value) | |||||||||||
| ASSETS | |||||||||||
| Current assets: | |||||||||||
| Cash and cash equivalents | $ | $ | |||||||||
| Accounts receivable, net | |||||||||||
| Inventories | |||||||||||
| Prepaid expenses | |||||||||||
| Other current assets | |||||||||||
| Assets held for sale | |||||||||||
| Total current assets | |||||||||||
| Property and equipment, net | |||||||||||
| Operating lease right-of-use assets | |||||||||||
| Goodwill | |||||||||||
| Other purchased intangible assets, net | |||||||||||
| Deferred income tax assets | |||||||||||
| Other non-current assets | |||||||||||
| Total assets | $ | $ | |||||||||
| LIABILITIES AND STOCKHOLDERS’ EQUITY | |||||||||||
| Current liabilities: | |||||||||||
| Short-term debt | $ | $ | |||||||||
| Accounts payable | |||||||||||
| Accrued compensation and benefits | |||||||||||
| Deferred revenue | |||||||||||
| Income taxes payable | |||||||||||
| Other current liabilities | |||||||||||
| Liabilities held for sale | |||||||||||
| Total current liabilities | |||||||||||
| Long-term debt | |||||||||||
| Deferred revenue, non-current | |||||||||||
| Deferred income tax liabilities | |||||||||||
| Operating lease liabilities | |||||||||||
| Other non-current liabilities | |||||||||||
| Total liabilities | |||||||||||
Commitments and contingencies (Note 10) | |||||||||||
| Stockholders’ equity: | |||||||||||
Preferred stock, $ | |||||||||||
Common stock, $ | |||||||||||
| Additional paid-in-capital | |||||||||||
| Retained earnings | |||||||||||
| Accumulated other comprehensive loss | ( | ( | |||||||||
| Total stockholders' equity | |||||||||||
| Total liabilities and stockholders' equity | $ | $ | |||||||||
See accompanying Notes to the Consolidated Financial Statements.
44
TRIMBLE INC.
CONSOLIDATED STATEMENTS OF INCOME
| (In millions, except per share amounts) | 2023 | 2022 | 2021 | ||||||||||||||
| Revenue: | |||||||||||||||||
| Product | $ | $ | $ | ||||||||||||||
| Subscription and services | |||||||||||||||||
| Total revenue | |||||||||||||||||
| Cost of sales: | |||||||||||||||||
| Product | |||||||||||||||||
| Subscription and services | |||||||||||||||||
| Amortization of purchased intangible assets | |||||||||||||||||
| Total cost of sales | |||||||||||||||||
| Gross margin | |||||||||||||||||
| Operating expense: | |||||||||||||||||
| Research and development | |||||||||||||||||
| Sales and marketing | |||||||||||||||||
| General and administrative | |||||||||||||||||
| Restructuring | |||||||||||||||||
| Amortization of purchased intangible assets | |||||||||||||||||
| Total operating expense | |||||||||||||||||
| Operating income | |||||||||||||||||
| Non-operating income (expense), net: | |||||||||||||||||
| Divestitures gain, net | |||||||||||||||||
| Interest expense, net | ( | ( | ( | ||||||||||||||
| Income from equity method investments, net | |||||||||||||||||
| Other income (expense), net | ( | ( | |||||||||||||||
| Total non-operating income (expense), net | ( | ||||||||||||||||
| Income before taxes | |||||||||||||||||
| Income tax provision | |||||||||||||||||
| Net income | $ | ||||||||||||||||
| Net income attributable to noncontrolling interests | |||||||||||||||||
| Net income attributable to Trimble Inc. | $ | $ | |||||||||||||||
| Earnings per share: | |||||||||||||||||
| Basic | $ | $ | $ | ||||||||||||||
| Diluted | $ | $ | $ | ||||||||||||||
| Shares used in calculating earnings per share: | |||||||||||||||||
| Basic | |||||||||||||||||
| Diluted | |||||||||||||||||
See accompanying Notes to the Consolidated Financial Statements.
45
TRIMBLE INC.
CONSOLIDATED STATEMENTS OF COMPREHENSIVE INCOME
| 2023 | 2022 | 2021 | |||||||||||||||
| (In millions) | |||||||||||||||||
| Net income | $ | $ | $ | ||||||||||||||
| Other comprehensive income (loss), net of tax | |||||||||||||||||
| Foreign currency translation adjustments | ( | ( | |||||||||||||||
| Net change related to derivatives and other | ( | ||||||||||||||||
| Comprehensive income | |||||||||||||||||
| Comprehensive income attributable to noncontrolling interests | |||||||||||||||||
Comprehensive income attributable to Trimble Inc. | $ | $ | $ | ||||||||||||||
See accompanying Notes to the Consolidated Financial Statements.
46
TRIMBLE INC.
CONSOLIDATED STATEMENTS OF STOCKHOLDERS’ EQUITY
| Common stock | Retained Earnings | Accumulated Other Comprehensive Loss | Total Stockholders’ Equity | Noncontrolling Interest | Total | ||||||||||||||||||||||||||||||||||||||||||
| Shares | Amount | Additional Paid-In Capital | |||||||||||||||||||||||||||||||||||||||||||||
| (In millions) | |||||||||||||||||||||||||||||||||||||||||||||||
| Balance at the end of 2020 | $ | $ | $ | $ | ( | $ | $ | $ | |||||||||||||||||||||||||||||||||||||||
| Net income | — | — | — | — | |||||||||||||||||||||||||||||||||||||||||||
Other comprehensive loss | — | — | — | — | ( | ( | — | ( | |||||||||||||||||||||||||||||||||||||||
| Comprehensive income | |||||||||||||||||||||||||||||||||||||||||||||||
| Issuance of common stock under employee plans, net of tax withholdings | — | ( | — | ( | — | ( | |||||||||||||||||||||||||||||||||||||||||
| Stock repurchases | ( | — | ( | ( | — | ( | — | ( | |||||||||||||||||||||||||||||||||||||||
| Stock-based compensation | — | — | — | — | — | ||||||||||||||||||||||||||||||||||||||||||
| Noncontrolling interest investments | — | — | — | — | ( | ( | |||||||||||||||||||||||||||||||||||||||||
| Balance at the end of 2021 | $ | $ | $ | $ | ( | $ | $ | $ | |||||||||||||||||||||||||||||||||||||||
| Net income | — | ||||||||||||||||||||||||||||||||||||||||||||||
| Other comprehensive loss | — | — | — | — | ( | ( | — | ( | |||||||||||||||||||||||||||||||||||||||
| Comprehensive income | |||||||||||||||||||||||||||||||||||||||||||||||
| Issuance of common stock under employee plans, net of tax withholdings | — | ( | — | ( | — | ( | |||||||||||||||||||||||||||||||||||||||||
| Stock repurchases | ( | ( | ( | ( | — | ( | — | ( | |||||||||||||||||||||||||||||||||||||||
| Stock-based compensation | — | — | — | — | — | ||||||||||||||||||||||||||||||||||||||||||
| Balance at the end of 2022 | $ | $ | $ | $ | ( | $ | $ | $ | |||||||||||||||||||||||||||||||||||||||
| Net income | — | — | — | — | — | ||||||||||||||||||||||||||||||||||||||||||
| Other comprehensive income | — | — | — | — | — | ||||||||||||||||||||||||||||||||||||||||||
| Comprehensive income | |||||||||||||||||||||||||||||||||||||||||||||||
| Issuance of common stock under employee plans, net of tax withholdings | — | ( | — | — | |||||||||||||||||||||||||||||||||||||||||||
| Stock repurchases | ( | — | ( | ( | — | ( | — | ( | |||||||||||||||||||||||||||||||||||||||
| Stock-based compensation | — | — | — | — | — | ||||||||||||||||||||||||||||||||||||||||||
| Balance at the end of 2023 | $ | $ | $ | $ | ( | $ | $ | $ | |||||||||||||||||||||||||||||||||||||||
See accompanying Notes to the Consolidated Financial Statements.
47
TRIMBLE INC.
CONSOLIDATED STATEMENTS OF CASH FLOWS
| (In millions) | 2023 | 2022 | 2021 | ||||||||||||||
| Cash flow from operating activities: | |||||||||||||||||
| Net income | $ | $ | $ | ||||||||||||||
| Adjustments to reconcile net income to net cash provided by operating activities: | |||||||||||||||||
| Depreciation expense | |||||||||||||||||
| Amortization expense | |||||||||||||||||
| Deferred income taxes | ( | ( | ( | ||||||||||||||
| Stock-based compensation | |||||||||||||||||
| Divestitures gain, net | ( | ( | ( | ||||||||||||||
| Other, net | |||||||||||||||||
| (Increase) decrease in assets: | |||||||||||||||||
| Accounts receivable, net | ( | ( | ( | ||||||||||||||
| Inventories | ( | ( | |||||||||||||||
| Other current and non-current assets | ( | ( | ( | ||||||||||||||
| Increase (decrease) in liabilities: | |||||||||||||||||
| Accounts payable | ( | ( | |||||||||||||||
| Accrued compensation and benefits | ( | ||||||||||||||||
| Deferred revenue | |||||||||||||||||
| Income taxes payable | ( | ( | ( | ||||||||||||||
| Other current and non-current liabilities | ( | ( | ( | ||||||||||||||
| Net cash provided by operating activities | |||||||||||||||||
| Cash flow from investing activities: | |||||||||||||||||
| Acquisitions of businesses, net of cash acquired | ( | ( | ( | ||||||||||||||
| Purchases of property and equipment | ( | ( | ( | ||||||||||||||
| Net proceeds from divestitures | |||||||||||||||||
| Other, net | ( | ||||||||||||||||
| Net cash used in investing activities | ( | ( | ( | ||||||||||||||
| Cash flow from financing activities: | |||||||||||||||||
| Issuance of common stock, net of tax withholdings | ( | ( | |||||||||||||||
| Repurchases of common stock | ( | ( | ( | ||||||||||||||
| Proceeds from debt and revolving credit lines | |||||||||||||||||
| Payments on debt and revolving credit lines | ( | ( | ( | ||||||||||||||
| Other, net | ( | ( | ( | ||||||||||||||
| Net cash provided by (used in) financing activities | ( | ( | |||||||||||||||
| Effect of exchange rate changes on cash and cash equivalents | ( | ( | |||||||||||||||
| Net (decrease) increase in cash and cash equivalents | ( | ( | |||||||||||||||
| Cash and cash equivalents - beginning of period | |||||||||||||||||
Cash and cash equivalents - end of period (1) | $ | $ | $ | ||||||||||||||
| Supplemental cash flow disclosure: | |||||||||||||||||
| Cash paid for income taxes, net | $ | $ | $ | ||||||||||||||
| Cash paid for interest | $ | $ | $ | ||||||||||||||
(1) Includes $9.1 million of cash and cash equivalents classified as held for sale as of December 29, 2023.
See accompanying Notes to the Consolidated Financial Statements.
48
NOTES TO CONSOLIDATED FINANCIAL STATEMENTS
NOTE 1: DESCRIPTION OF BUSINESS AND ACCOUNTING POLICIES
Trimble Inc., (“we” or “our” or “us”) is incorporated in the State of Delaware since October 2016.
We are a leading provider of technology solutions that enable professionals and field mobile workers to improve or transform their work processes. We focus on transforming the way the world works by delivering products and services that connect the physical and digital worlds. We generate revenue primarily through the sale of our hardware, software, maintenance and support, professional services, and subscriptions.
Basis of Presentation
These Consolidated Financial Statements include our results of our consolidated subsidiaries. Intercompany accounts and transactions have been eliminated. Noncontrolling interests represent the noncontrolling stockholders’ proportionate share of the net assets and results of operations of our consolidated subsidiaries.
We use a 52–53 week fiscal year ending on the Friday nearest to December 31. Fiscal 2023, 2022, and 2021 were all 52-week years ending on December 29, 2023, December 30, 2022, and December 31, 2021. Unless otherwise stated, all dates refer to our fiscal year and fiscal periods.
Use of Estimates
The preparation of financial statements in accordance with U.S. GAAP requires us to make estimates and assumptions that affect the amounts reported in the financial statements and accompanying notes. Estimates and assumptions are used for (i) revenue recognition, including determining the nature and timing of satisfaction of performance obligations and determining standalone selling price (“SSP”) of performance obligations; (ii) inventory valuation; (iii) valuation of long-lived assets and their estimated useful lives; (iv) goodwill and other long-lived asset impairment analyses; (v) stock-based compensation; and (vi) income taxes. We base our estimates on historical experience and various other assumptions we believe to be reasonable. Actual results that we experience may differ materially from our estimates.
Change in Presentation
During the first quarter of 2023, we changed the presentation of revenue and cost of sales in the Consolidated Statements of Income. This change was made to better reflect our Connect and Scale strategy and business model evolution with a continued shift toward a more significant mix of recurring revenues, which includes subscription, maintenance and support, and term licenses. As such, we revised our presentation, including (i) the combination of subscription and services into one line item, and (ii) moving term licenses from product to subscription and services. The subscription and services line item is more aligned with our performance measures, how we manage our business, and is helpful to investors and others to better understand our results.
Previously, we presented revenue and cost of sales on three lines as follows:
•product, which included hardware and software licenses (both perpetual and term licenses);
•service, which included hardware and software maintenance and support and professional services;
•subscription, which included SaaS, data, and hosting services.
The revised categories are as follows:
•product, which includes hardware and perpetual software licenses;
•subscription and services, which includes SaaS, data, and hosting services, as well as term licenses, hardware and software maintenance and support, and professional services.
Prior period amounts have been revised to conform to the current period presentation. This change in presentation did not affect the total revenue or total cost of sales. The effect of the change on the Consolidated Statements of Income for 2022 and 2021 was as follows:
49
| 2022 | 2021 | ||||||||||||||||||||||||||||||||||
| (In millions) | |||||||||||||||||||||||||||||||||||
| As Previously Reported | Effect of Change in Presentation | As Reported Herein | As Previously Reported | Effect of Change in Presentation | As Reported Herein | ||||||||||||||||||||||||||||||
| Revenue: | |||||||||||||||||||||||||||||||||||
| Product | $ | $ | ( | $ | $ | $ | ( | $ | |||||||||||||||||||||||||||
| Subscription and services | — | — | |||||||||||||||||||||||||||||||||
| Service | ( | — | ( | — | |||||||||||||||||||||||||||||||
| Subscription | ( | — | ( | — | |||||||||||||||||||||||||||||||
| Total revenue | $ | $ | — | $ | $ | $ | — | $ | |||||||||||||||||||||||||||
| Cost of sales: | |||||||||||||||||||||||||||||||||||
| Product | $ | $ | ( | $ | $ | $ | ( | $ | |||||||||||||||||||||||||||
| Subscription and services | — | — | |||||||||||||||||||||||||||||||||
| Service | ( | — | ( | — | |||||||||||||||||||||||||||||||
| Subscription | ( | — | ( | — | |||||||||||||||||||||||||||||||
| Amortization of purchased intangible assets | — | — | |||||||||||||||||||||||||||||||||
| Total cost of sales | $ | $ | — | $ | $ | $ | — | $ | |||||||||||||||||||||||||||
Reportable Segments
We report our financial performance, including revenue and operating income, based on four reportable segments: Buildings and Infrastructure, Geospatial, Resources and Utilities, and Transportation.
Revenue Recognition
Significant Judgments
Revenue is recognized upon transfer of control of promised products or services to customers in an amount that reflects the consideration we expect to receive in exchange for those products or services. Revenue is recognized net of allowance for returns and any taxes collected from customers. We enter into contracts that may include various combinations of products and services, which are generally capable of being distinct and accounted for as separate performance obligations; however, determining whether products or services are considered distinct performance obligations that should be accounted for separately versus together may sometimes require significant judgment.
Judgment is required to determine SSP for each performance obligation. We use a range of amounts to estimate SSP when products and services are sold separately and determine whether there is a discount to be allocated based on the relative SSP of the various products and services. In instances where SSP is not directly observable, we estimate SSP considering multiple factors including but not limited to, our internal cost, pricing practices, sales channel, competitive positioning, and overall market and business environments. As our offerings and markets change, we may be required to reassess our estimated SSP and, as a result, the timing and classification of our revenue could be affected.
Nature of Goods and Services
We generate revenue primarily from products and services and subscriptions; each of which is a distinct performance obligation. Descriptions are as follows:
Product
Product revenue includes hardware and perpetual software licenses.
Hardware is recognized when the control of the product transfers to the customer, which is generally when the product is shipped. We recognize shipping fees reimbursed by customers as revenue and the cost for shipping as an expense in Cost of sales when control over products has transferred to the customer.
Software including perpetual licenses is recognized upon delivery and commencement of the license term. In general, our contracts do not provide for customer specific acceptances.
50
Subscription and Services
Subscription and services revenue includes SaaS and hosting services, term licenses, hardware and software maintenance, and support and professional services.
SaaS may be sold with devices used to collect, generate, and transmit data. SaaS is distinct from the related devices. SaaS is provided on either a subscription or a consumption basis. In addition, we may host the software that the customer has separately licensed. Hosting services are distinct from the underlying software. Subscription terms generally range from month-to-month to to three years . Subscription revenue is recognized monthly over the subscription term, commencing from activation. Revenue related to SaaS on a consumption basis is recognized when the customer utilizes the service based on the quantity of the services consumed.
Term license subscriptions contain an on-premise term license component as well as maintenance and support. Term licenses are distinct and recognized upon transfer and commencement of the subscription license term. Maintenance and support are recognized ratably over the subscription term. The subscription term generally ranges from to three years .
Hardware maintenance and support, commonly called extended warranty, entitles the customer to receive replacement parts and repair services. Extended warranty is separately priced and is recognized on a straight-line basis over the extended service period, which begins after the standard warranty period, ranging from to two years depending on the product line.
Software maintenance and support entitles the customer to receive software product upgrades and enhancements on a when and if available basis and technical support. Software maintenance is recognized on a straight-line basis commencing upon product delivery over the post-contract support term, which ranges from to three years , with one year being most common.
Professional services include installation, training, configuration, project management, system integrations, customization, data migration/conversion, and other implementation services. The majority of professional services are not complex, can be provided by other vendors, and are readily available and billed on a time-and-material basis. Revenue for distinct professional services is recognized over time, based on work performed.
Accounts Receivable, Net
Accounts receivable, net, includes billed and unbilled amounts due from customers. Unbilled receivables include revenue recognized that exceeds the amount billed to the customer, provided the billing is not contingent upon future performance, and we have the unconditional right to future payment with only the passage of time required. Both billed and unbilled amounts due are stated at their net estimated realizable value.
Inventories
Inventories are stated at the lower of cost or net realizable value. Cost is computed using standard cost, which approximates actual cost. Adjustments are also made to reduce the cost of inventory for estimated excess or obsolete balances. Factors influencing these adjustments include declines in demand that impact inventory purchasing forecasts, technological changes, product lifecycle and development plans, component cost trends, product pricing, physical deterioration, and quality issues. If our estimate used to reserve for excess and obsolete inventory differs from what is expected, we may be required to recognize additional reserves, which would negatively impact our gross margin.
Property and Equipment, Net
Property and equipment are depreciated using the straight-line method over the shorter of the estimated useful lives or the lease terms when applicable. Useful lives generally range from to six years for machinery and equipment, to ten years for furniture and fixtures, to five years for computer equipment and software, thirty-nine years for buildings, and the life of the lease for leasehold improvements. We capitalize eligible costs to acquire or develop certain internal-use software and amortize those assets using the straight-line method over the estimated useful lives of the assets, which range from to five years .
Leases
We determine if an arrangement is a lease at inception. Operating leases with lease terms greater than one year are included in Operating lease right-of-use (“ROU”) assets, Other current liabilities, and Operating lease liabilities in our Consolidated Balance Sheets.
51
ROU assets represent our right to use an underlying asset for the lease term, and lease liabilities represent our obligation to make lease payments arising from the lease. Operating lease ROU assets and liabilities are recognized at commencement date based on the present value of lease payments over the lease term. Present value is determined by using our incremental borrowing rate based on the estimated rate of interest for collateralized borrowings over a similar term of the lease payments at the commencement date. The operating lease ROU assets include adjustments made for uneven rents, lease incentives, and lease impairments. Lease expense for lease payments is recognized on a straight-line basis over the lease term.
Business Combinations
We allocate the fair value of purchase consideration to the assets acquired, liabilities assumed, and any noncontrolling interest based on their fair values at the acquisition date. When determining the fair values, we make significant estimates and assumptions, especially concerning intangible assets. Critical estimates when valuing intangible assets include expected future cash flows based on consideration of revenue and revenue growth rates and margins, customer attrition rates, future changes in technology and brand awareness, loyalty and position, and discount rates. Any purchase consideration in excess of the fair values of the net assets acquired is recorded as goodwill.
Amounts recorded in a business combination may change during the measurement period, which is a period not to exceed one year from the date of acquisition, as additional information about conditions existing at the acquisition date becomes available.
Acquisition costs are expensed as incurred.
Goodwill
We evaluate goodwill on an annual basis or more frequently if indicators of potential impairment exist. To determine whether goodwill is impaired, we first assess qualitative factors. Qualitative factors include but are not limited to macroeconomic conditions, industry and market considerations, cost factors, overall financial performance, or other relevant company-specific events. If it is determined more likely than not that the fair value of a goodwill reporting unit is less than its carrying amount, we perform a quantitative analysis. Alternatively, we may bypass the qualitative assessment and perform a quantitative impairment test.
Intangible Assets
Intangible assets acquired in a business combination are recorded at fair value. Our intangible assets are amortized over the period of estimated benefit using the straight-line method over their estimated useful lives, which range from to ten years and have a weighted-average useful life of approximately seven years . We write off fully amortized intangible assets when those assets are no longer used.
Foreign Currency Translation
Assets and liabilities recorded in foreign currency are translated to U.S. dollars at the exchange rates on the balance sheet date. Revenue and expense are translated at average monthly exchange rates during the year. Translation adjustments resulting from this process are recorded to other comprehensive income.
Stock-Based Compensation
Research and Development Costs
Research and development costs are expensed as incurred. Development costs for software to be sold subsequent to reaching technical feasibility were not significant and were expensed as incurred. We offset research and development expense with any unconditional third party funding earned and retain the rights to any technology developed under such arrangements.
52
Income Taxes
Income taxes are accounted for under the liability method, whereby deferred tax assets or liability account balances are calculated at the balance sheet date using current tax laws and rates in effect for the year in which the differences are expected to affect taxable income. A valuation allowance is recorded to reduce the carrying amounts of deferred tax assets if it is more likely than not such assets will not be realized. Our valuation allowance is primarily attributable to foreign net operating losses and state research and development credit carryforwards.
Relative to uncertain tax positions, we only recognize a tax benefit if it is more likely than not that the tax position will be sustained on examination by the taxing authorities, based on the technical merits of the position. We consider many factors when evaluating and estimating our tax positions and tax benefits, which may require periodic adjustments and may not accurately forecast actual tax audit outcomes. Changes in recognition or measurement of our uncertain tax positions would result in the recognition of a tax benefit or an additional charge to the tax provision. Our practice is to recognize interest and/or penalties related to income tax matters in income tax expense.
We are subject to income taxes in the U.S. and numerous other countries and are subject to routine corporate income tax audits in many of these jurisdictions. We generally believe that positions taken on our tax returns are more likely than not to be sustained upon audit, but tax authorities in some circumstance have, and may in the future, successfully challenge these positions. Accordingly, our income tax provision includes amounts intended to satisfy assessments that may result from these challenges. The amounts ultimately paid on resolution of an audit could be materially different from the amounts previously included in our income tax provision and, therefore, could have a material impact on our income tax provision, net income, and cash flows.
Concentrations of Risk
Cash and cash equivalents are maintained with several financial institutions. Deposits held with banks may exceed the amount of insurance provided on such deposits. Generally, these deposits may be redeemed upon demand and are maintained with financial institutions of reputable credit and therefore bear minimal credit risk.
We are also exposed to credit risk in our trade receivables, which are derived from sales to end-user customers in diversified industries as well as various resellers. We perform ongoing credit evaluations of our customers’ financial conditions and limit the amount of credit extended, when deemed necessary, but generally do not require collateral.
In addition, we rely on a limited number of suppliers for a number of our critical components.
Guarantees, Including Indirect Guarantees of Indebtedness of Others
In the normal course of business to facilitate sales of our products, we indemnify other parties, including customers, lessors, and parties to other transactions with us with respect to certain matters. We may agree to hold the other party harmless against losses arising from a breach of representations or covenants, or out of intellectual property infringement or other claims made against certain parties. These agreements may limit the time within which an indemnification claim can be made and the amount of the claim. In connection with divesting some of our businesses or assets, we may also indemnify purchasers for certain matters in the normal course of business, such as breaches of representations, covenants, or excluded liabilities. In addition, we entered into indemnification agreements with our officers and directors, and our bylaws contain similar indemnification obligations to our agents.
It is not possible to determine the maximum potential amount under these indemnification agreements due to the limited history of prior indemnification claims and the unique facts and circumstances involved in each particular agreement. Historically, payments made under these agreements were not material, and no liabilities have been recorded for these obligations in the Consolidated Balance Sheets at the end of 2023 and 2022.
Derivative Financial Instruments
We enter into foreign exchange forward contracts to minimize the short-term impact of foreign currency fluctuations on cash and certain trade and intercompany receivables and payables, primarily denominated in Euro, Canadian Dollars, New Zealand Dollars, British Pound, and Brazilian Real. These contracts reduce the exposure to fluctuations in foreign currency exchange rate movements, as the gains and losses associated with foreign currency balances are generally offset with the gains and losses on the forward contracts. We occasionally enter into foreign currency contracts to minimize the impact of foreign currency fluctuations on the purchase price of pending acquisitions. We do not enter into foreign currency forward contracts for trading purposes.
At the end of 2023 and 2022, there were no
53
Recently issued Accounting Pronouncements not yet Adopted
In November 2023, the FASB issued Accounting Standards Update (“ASU”) 2023-07, Segment Reporting (Topic 280): Improvements to Reportable Segment Disclosures. The ASU updates reportable segment disclosure requirements primarily through (i) enhanced disclosures about significant segment expenses, (ii) the composition of other segment items, and (iii) optional disclosure of more than one measure of segment profit or loss if the CODM uses those measures to assess segment performance and allocate resources. The ASU is effective for our Annual Report on Form 10-K beginning in 2024 and, afterward, interim reports. Early adoption is permitted. The ASU should be applied retrospectively to all prior periods presented in the financial statements. We are currently evaluating the impact of adopting this ASU on our financial reporting disclosures.
In December 2023, the FASB issued ASU 2023-09, Income Taxes (Topic 740): Improvements to Income Tax Disclosures. The ASU updates the annual income tax disclosures by requiring (i) specific categories and greater disaggregation of information in the rate reconciliation, (ii) income taxes paid disaggregated by taxing authority and jurisdiction, and (iii) disclosures of pretax income (or loss) and income tax expense (or benefit). Additionally, certain existing disclosure requirements are removed. The ASU is effective for our Annual Report on Form 10-K beginning in 2025 and is applied prospectively. Early adoption and retrospective application are permitted. We are currently evaluating the impact of adopting this ASU on our financial reporting disclosures.
Recent Adopted Accounting Pronouncements
There are no recently adopted accounting pronouncements.
NOTE 2: EARNINGS PER SHARE
Basic earnings per share is computed based on the weighted-average number of shares of common stock outstanding during the period. Diluted earnings per share is computed based on the weighted-average number of shares of common stock outstanding during the period plus additional shares of common stock that would have been outstanding if potentially dilutive securities had been issued. Potentially dilutive common shares include outstanding stock options, restricted stock units (“RSUs”), contingently issuable shares, and shares to be purchased under our employee stock purchase plan.
The following table shows the computation of basic and diluted earnings per share:
| 2023 | 2022 | 2021 | |||||||||||||||
| (In millions, except per share amounts) | |||||||||||||||||
| Numerator: | |||||||||||||||||
| Net income attributable to Trimble Inc. | $ | $ | $ | ||||||||||||||
| Denominator: | |||||||||||||||||
| Weighted-average number of common shares used in basic earnings per share | |||||||||||||||||
| Effect of dilutive securities | |||||||||||||||||
| Weighted-average number of common shares and dilutive potential common shares used in diluted earnings per share | |||||||||||||||||
| Basic earnings per share | $ | $ | $ | ||||||||||||||
| Diluted earnings per share | $ | $ | $ | ||||||||||||||
Antidilutive weighted-average shares (1) | |||||||||||||||||
(1) Antidilutive stock-based awards are excluded from the calculation of diluted shares and diluted earnings per share because their impact would increase diluted earnings per share.
NOTE 3: ACQUISITIONS
On April 3, 2023, we acquired all of the issued and outstanding shares of TP Group Holding GmbH and Sixfold GmbH, which owned Transporeon, in an all-cash transaction. Transporeon is a Germany-based company and leading cloud-based transportation management software platform that connects key stakeholders across the industry lifecycle to positively impact the optimization of global supply chains, which aligns with our Connect and Scale strategy. Transporeon is reported as part of our Transportation segment.
The total purchase consideration was €1.9 billion or $2.1 billion, which included the repayment of outstanding Transporeon debt of $339.6 million. The acquisition was funded through a combination of cash on hand and debt. See Note 8 “Debt” of this report for more information.
In addition to Transporeon, we acquired two businesses in 2023 with total purchase consideration of $47.0 million. In the
54
aggregate, the two businesses acquired contributed less than 1 % of our total revenue during 2023.
In 2022, we acquired two businesses, with total purchase consideration of $379.5 million. The largest acquisition was Bid2Win Software, LLC, a leading provider of estimating and operations solutions for the heavy civil construction industry. In the aggregate, the businesses acquired contributed less than 1 % of our total revenue during 2022.
In 2021, we acquired AgileAssets, with total purchase consideration of $237.5 million. AgileAssets is a provider of SaaS solutions for transportation asset lifecycle management. The acquisition contributed less than 1 % of our total revenue during 2021.
Acquisition costs of $35.0 million, $20.4 million, and $13.6 million in 2023, 2022, and 2021, were expensed as incurred and are included in Cost of sales and General and administrative expenses in our Consolidated Statements of Income.
Purchase Price Allocation
The fair value of identifiable assets acquired and liabilities assumed was determined under the acquisition method of accounting for business combinations. The excess of purchase consideration over the fair value of net tangible and identifiable intangible assets acquired was recorded as goodwill. The fair value of intangible assets acquired is generally determined based on a discounted cash flow analysis.
The following table summarizes the consideration transferred to acquire Transporeon and the preliminary allocation of the purchase price among the assets acquired and liabilities assumed, as well as the estimated useful lives of the identifiable intangible assets as of the date of the acquisition. The allocation of the purchase price is still preliminary as we finalize deferred income taxes. Preliminary estimates will be finalized within one year of the acquisition date.
| Fair Value as of the Acquisition Date | Estimated Useful Life | |||||||
| (In millions) | ||||||||
| Total purchase consideration | $ | |||||||
| Net tangible assets acquired: | ||||||||
| Cash and cash equivalents | ||||||||
| Accounts receivable, net | ||||||||
| Other current assets | ||||||||
| Non-current assets | ||||||||
| Accounts payable | ( | |||||||
| Accrued compensation and benefits | ( | |||||||
| Deferred revenue | ( | |||||||
| Other current liabilities | ( | |||||||
| Non-current liabilities | ( | |||||||
| Total net tangible assets acquired | ||||||||
| Intangible assets acquired: | ||||||||
| Customer relationships | ||||||||
| Developed product technology | ||||||||
| Trade name | ||||||||
| Total intangible assets acquired | ||||||||
| Deferred tax liability | ( | |||||||
| Fair value of all assets/liabilities acquired | ||||||||
| Goodwill | $ | |||||||
Goodwill consists of growth potential, synergies, and economies of scale expected from combining Transporeon’s operations with ours, together with the highly skilled and valuable assembled workforce. We do not expect the goodwill to be deductible for income tax purposes.
The Company corrected an error which resulted in an adjustment of $34 million between goodwill and developed technology intangibles, net of tax.
55
Financial Information
The following table presents the amounts of revenue and net loss included in the Consolidated Statements of Income resulting from Transporeon since the acquisition date, which includes the effects of purchase accounting, primarily amortization of intangible assets and other adjustments.
| Year of | |||||
| 2023 | |||||
| (In millions) | |||||
| Total revenue | $ | ||||
Net loss | ( | ||||
Pro Forma Financial Information
The unaudited pro forma financial information presented in the following table was computed by combining the historical financial information of Trimble and Transporeon along with the effects from business combination accounting and the associated debt resulting from this acquisition as if the companies were combined on January 1, 2022. This information is presented for informational purposes only, and it is not necessarily indicative of the operating results that would have occurred if the acquisition had been consummated as of that date. This information should not be used as a predictive measure of our future financial position, results of operations, or liquidity.
| Year of | |||||||||||
| 2023 | 2022 | ||||||||||
| (In millions) | |||||||||||
| Total revenue | $ | $ | |||||||||
| Net income | |||||||||||
NOTE 4: DIVESTITURES
Pending Divestiture
On September 28, 2023, we executed a definitive agreement with AGCO that provides for the formation of a JV with AGCO in the mixed fleet precision agriculture market. Under the terms of the agreement, we will contribute the Trimble Ag business, excluding certain GNSS and guidance technologies, and AGCO will contribute its JCA Technologies business to the JV. We will sell an interest in the JV to AGCO for $2.0 billion in pre-tax cash proceeds, subject to working capital adjustments. Immediately following the closing of this proposed transaction, we will own 15 % of the JV and AGCO will own 85 % of the JV.
Additionally, we plan to enter into the following agreements with AGCO as part of the overall transaction:
•a seven-year , renewable Supply Agreement through which we will provide key GNSS and guidance technologies to the JV for use in professional agriculture machines sold by AGCO, on an exclusive basis with limited exceptions;
•a Technology Transfer and License Agreement to govern the licensing of certain non-divested intellectual property and technology for use by the JV in the agriculture field and, upon expiration of the Supply Agreement, to govern fixed and variable royalty payments made to us by the JV;
•a Trademark License Agreement to govern the licensing of certain Trimble trademarks for use by the JV in the agriculture field;
•a Positioning Services Agreement through which the JV will serve as our channel partner for the positioning services in the agriculture market; and
•a Transition Services Agreement to provide contract manufacturing services for the divested products for two years following the closing of the proposed transaction.
The proposed transaction is expected to close in the first half of 2024 and is subject to customary closing conditions, including regulatory approvals. Trimble Ag is reported as a part of our Resources and Utilities segment.
Following the closing of this proposed transaction, our 15 % ownership interest in the JV is expected to be reported as an equity method investment.
The assets and liabilities of Trimble Ag that are subject to the proposed transaction were classified as held for sale at the end of 2023. The following table presents the carrying values of the major classes of assets and liabilities classified as held for sale in our Consolidated Balance Sheets at the end of 2023:
56
| At the End of Year | |||||
| (In millions) | 2023 | ||||
| Cash and cash equivalents | $ | ||||
| Accounts receivable, net | |||||
Inventories, net | |||||
| Other current assets | |||||
| Property and equipment, net | |||||
| Other purchased intangible assets, net | |||||
Goodwill | |||||
| Other non-current assets | |||||
Total Assets Held for Sale | $ | ||||
| Accounts payable | $ | ||||
Deferred revenue, current | |||||
| Other current liabilities | |||||
| Deferred revenue, non-current | |||||
| Other non-current liabilities | |||||
Total Liabilities Held for Sale | $ | ||||
Other Divestitures
In addition to the pending Trimble Ag JV Transaction, we divested five businesses in 2023 with total proceeds of $18.7 million.
In 2022, we divested six businesses with total proceeds of $226.3 million. The largest divestiture was the sale of Time and Frequency, LOADRITE, Spectra Precision Tools, and SECO accessories businesses to Precisional LLC, an affiliate of The Jordan Company (“TJC”), for $205.1 million in cash, which included a working capital adjustment.
In 2021, divestitures were not material to the financial statements.
NOTE 5: INTANGIBLE ASSETS AND GOODWILL
Intangible Assets
The following table presents a summary of our intangible assets:
| At the End of 2023 | At the End of 2022 | |||||||||||||||||||||||||||||||||||||
| (In millions) | Weighted-Average Useful Lives (in years) | Gross Carrying Amount | Accumulated Amortization | Net Carrying Amount | Gross Carrying Amount | Accumulated Amortization | Net Carrying Amount | |||||||||||||||||||||||||||||||
| Developed product technology | $ | $ | ( | $ | $ | $ | ( | $ | ||||||||||||||||||||||||||||||
| Customer relationships | ( | ( | ||||||||||||||||||||||||||||||||||||
| Trade names and trademarks | ( | ( | ||||||||||||||||||||||||||||||||||||
| Distribution rights and other intellectual property | ( | ( | ||||||||||||||||||||||||||||||||||||
| $ | $ | ( | $ | $ | $ | ( | $ | |||||||||||||||||||||||||||||||
As of the end of 2023 and 2022, $267.8 million and $79.9 million
57
The estimated future amortization expense of intangible assets at the end of 2023 was as follows:
| (In millions) | |||||
| 2024 | $ | ||||
| 2025 | |||||
| 2026 | |||||
| 2027 | |||||
| 2028 | |||||
| Thereafter | |||||
| Total | $ | ||||
Goodwill
The changes in the carrying amount of goodwill by segment for 2023 were as follows:
| Buildings and Infrastructure | Geospatial | Resources and Utilities | Transportation | Total | |||||||||||||||||||||||||
| (In millions) | |||||||||||||||||||||||||||||
| Balance as of year end 2022 | $ | $ | $ | $ | $ | ||||||||||||||||||||||||
| Additions due to acquisitions | |||||||||||||||||||||||||||||
| Assets held for sale | ( | ( | ( | ||||||||||||||||||||||||||
| Foreign currency translation and other adjustments | |||||||||||||||||||||||||||||
| Balance as of year end 2023 | $ | $ | $ | $ | $ | ||||||||||||||||||||||||
NOTE 6: CERTAIN BALANCE SHEET COMPONENTS
The components of inventory, net were as follows:
| At the End of Year | 2023 | 2022 | |||||||||
| (In millions) | |||||||||||
| Inventories: | |||||||||||
| Raw materials | $ | $ | |||||||||
| Work-in-process | |||||||||||
| Finished goods | |||||||||||
| Total inventories | $ | $ | |||||||||
Finished goods includes $11.3 million and $16.9 million at the end of 2023 and 2022 for costs of sales that have been deferred in connection with deferred revenue arrangements.
The components of property and equipment, net were as follows:
| At the End of Year | 2023 | 2022 | |||||||||
| (In millions) | |||||||||||
| Property and equipment, net: | |||||||||||
| Land, building, furniture, and leasehold improvements | $ | $ | |||||||||
| Machinery and equipment | |||||||||||
| Software and licenses | |||||||||||
| Construction in progress | |||||||||||
| Less: accumulated depreciation | ( | ( | |||||||||
| Total property and equipment, net | $ | $ | |||||||||
58
The components of accumulated other comprehensive loss, net of related tax were as follows:
| At the End of Year | 2023 | 2022 | |||||||||
| (In millions) | |||||||||||
| Accumulated foreign currency translation adjustments | $ | ( | $ | ( | |||||||
| Gain on cash flow hedge | |||||||||||
Net unrealized actuarial gains | |||||||||||
| Total accumulated other comprehensive loss | $ | ( | $ | ( | |||||||
NOTE 7: REPORTING SEGMENT AND GEOGRAPHIC INFORMATION
We determined our operating segments based on how our CODM views and evaluates operations. Various factors, including market separation and customer-specific applications, go-to-market channels, and products and services, were considered in determining these operating segments. Our CODM regularly reviews our segment operating results to make decisions about resources that are allocated to each segment and to assess performance. In each of our segments, we sell many individual products. For this reason, it is impracticable to segregate and identify revenue for each of the individual products or group of products we sell.
Our reportable segments are described below:
•Buildings and Infrastructure. This segment primarily serves customers working in architecture, engineering, construction, and operations and maintenance.
•Geospatial. This segment primarily serves customers working in surveying, engineering, and government.
•Resources and Utilities. This segment primarily serves customers working in agriculture, forestry, and utilities.
•Transportation. This segment primarily serves customers working in long haul trucking and freight shipper markets.
The following Reporting Segment tables reflect the results of our reportable operating segments under our management reporting system. These results are not necessarily in conformity with U.S. GAAP. This is consistent with the way the CODM evaluates each of the segment's performance and allocates resources.
| Reporting Segments | |||||||||||||||||||||||||||||
| Buildings and Infrastructure | Geospatial | Resources and Utilities | Transportation | Total | |||||||||||||||||||||||||
| (In millions) | |||||||||||||||||||||||||||||
| 2023 | |||||||||||||||||||||||||||||
| Segment revenue | $ | $ | $ | $ | $ | ||||||||||||||||||||||||
| Segment operating income | $ | ||||||||||||||||||||||||||||
| 2022 | |||||||||||||||||||||||||||||
| Segment revenue | $ | $ | $ | $ | $ | ||||||||||||||||||||||||
| Segment operating income | |||||||||||||||||||||||||||||
| 2021 | |||||||||||||||||||||||||||||
| Segment revenue | $ | $ | $ | $ | $ | ||||||||||||||||||||||||
| Segment operating income | |||||||||||||||||||||||||||||
59
| Reporting Segments | |||||||||||||||||||||||||||||
| Buildings and Infrastructure | Geospatial | Resources and Utilities | Transportation | Total | |||||||||||||||||||||||||
| (In millions) | |||||||||||||||||||||||||||||
| As of Year End 2023 | |||||||||||||||||||||||||||||
| Accounts receivable, net | $ | $ | $ | $ | $ | ||||||||||||||||||||||||
| Inventories | |||||||||||||||||||||||||||||
| Goodwill | |||||||||||||||||||||||||||||
| As of Year End 2022 | |||||||||||||||||||||||||||||
| Accounts receivable, net | $ | $ | $ | $ | $ | ||||||||||||||||||||||||
| Inventories | |||||||||||||||||||||||||||||
| Goodwill | |||||||||||||||||||||||||||||
| As of Year End 2021 | |||||||||||||||||||||||||||||
| Accounts receivable, net | $ | $ | $ | $ | $ | ||||||||||||||||||||||||
| Inventories | |||||||||||||||||||||||||||||
| Goodwill | |||||||||||||||||||||||||||||
A reconciliation of our consolidated segment operating income to consolidated income before income taxes was as follows:
| 2023 | 2022 | 2021 | |||||||||||||||
| (In millions) | |||||||||||||||||
| Consolidated segment operating income | $ | $ | $ | ||||||||||||||
| Unallocated general corporate expenses | ( | ( | ( | ||||||||||||||
| Purchase accounting adjustments | ( | ( | ( | ||||||||||||||
| Acquisition / divestiture items | ( | ( | ( | ||||||||||||||
| Stock-based compensation / deferred compensation | ( | ( | ( | ||||||||||||||
| Restructuring and other costs | ( | ( | ( | ||||||||||||||
| Consolidated operating income | |||||||||||||||||
| Total non-operating income (expense), net | ( | ||||||||||||||||
| Consolidated income before taxes | $ | $ | $ | ||||||||||||||
60
The disaggregation of revenue by geography is summarized in the tables below. Revenue is defined as revenue from external customers attributed to countries based on the location of the customer and excludes the effects of certain acquired deferred
revenue that was written down to fair value in purchase accounting, consistent with the Reporting Segment tables above.
| Reporting Segments | |||||||||||||||||||||||||||||
| Buildings and Infrastructure | Geospatial | Resources and Utilities | Transportation | Total | |||||||||||||||||||||||||
| (In millions) | |||||||||||||||||||||||||||||
| 2023 | |||||||||||||||||||||||||||||
| North America | $ | $ | $ | $ | $ | ||||||||||||||||||||||||
| Europe | |||||||||||||||||||||||||||||
| Asia Pacific | |||||||||||||||||||||||||||||
| Rest of World | |||||||||||||||||||||||||||||
| Total segment revenue | $ | $ | $ | $ | $ | ||||||||||||||||||||||||
| 2022 | |||||||||||||||||||||||||||||
| North America | $ | $ | $ | $ | $ | ||||||||||||||||||||||||
| Europe | |||||||||||||||||||||||||||||
| Asia Pacific | |||||||||||||||||||||||||||||
| Rest of World | |||||||||||||||||||||||||||||
| Total segment revenue | $ | $ | $ | $ | $ | ||||||||||||||||||||||||
| 2021 | |||||||||||||||||||||||||||||
| North America | $ | $ | $ | $ | $ | ||||||||||||||||||||||||
| Europe | |||||||||||||||||||||||||||||
| Asia Pacific | |||||||||||||||||||||||||||||
| Rest of World | |||||||||||||||||||||||||||||
| Total segment revenue | $ | $ | $ | $ | $ | ||||||||||||||||||||||||
Total revenue in the United States as included in the Consolidated Statements of Income was $1,855.2 million, $1,777.4 million, and $1,687.4 million in 2023, 2022, and 2021. No single customer or country other than the United States accounted for 10% or more of our total revenue in 2023, 2022, and 2021. No single customer accounted for 10% or more of our accounts receivable at the end of 2023 and 2022.
Property and equipment, net by geographic area were as follows:
| At the End of Year | 2023 | 2022 | |||||||||
| (In millions) | |||||||||||
| Property and equipment, net: | |||||||||||
| United States | $ | $ | |||||||||
| Europe | |||||||||||
| Asia Pacific and Rest of World | |||||||||||
| Total property and equipment, net | $ | $ | |||||||||
61
NOTE 8: DEBT
Debt consisted of the following:
| At the End of Year | Effective interest rate | |||||||||||||||||||||||||
| (In millions, except percentages) | Date of Issuance | End of 2023 | 2023 | 2022 | ||||||||||||||||||||||
| Senior Notes: | ||||||||||||||||||||||||||
Senior Notes, | June 2018 | $ | $ | |||||||||||||||||||||||
Senior Notes, | November 2014 | |||||||||||||||||||||||||
Senior Notes, | June 2018 | |||||||||||||||||||||||||
Senior Notes, | March 2023 | |||||||||||||||||||||||||
| Credit Facilities: | ||||||||||||||||||||||||||
| 2022 Revolving Credit Facility, due March 2027 | September 2022 | |||||||||||||||||||||||||
| Term Loan, due April 2026 | April 2023 | |||||||||||||||||||||||||
| Term Loan, due April 2028 | April 2023 | |||||||||||||||||||||||||
| Uncommitted Credit Facilities, floating rate | ||||||||||||||||||||||||||
| Unamortized discount and issuance costs | ( | ( | ||||||||||||||||||||||||
| Total debt | $ | $ | ||||||||||||||||||||||||
| Less: Short-term debt | ||||||||||||||||||||||||||
| Long-term debt | $ | $ | ||||||||||||||||||||||||
Debt Maturities
At the end of 2023, our debt maturities based on outstanding principal were as follows (in millions):
| Year Payable | |||||
| 2024 | $ | ||||
| 2025 | |||||
| 2026 | |||||
| 2027 | |||||
| 2028 | |||||
| Thereafter | |||||
| Total | $ | ||||
Senior Notes
All of our senior notes are unsecured obligations. Interest on the senior notes is payable semi-annually in June and December of each year, except for the interest on the 2033 Senior Notes payable in March and September (as next described). For the 2028 and 2033 senior notes, the interest rate is subject to adjustment from time to time if Moody’s or S&P (or, if applicable, a substitute rating agency) downgrades (or subsequently upgrades) its rating assigned to the notes.
Senior Notes are unsecured and rank equally in right of payment with all of our other senior unsecured indebtedness. We may redeem the notes of each series of senior notes at our option in whole or in part at any time. Such indenture also contains covenants limiting our ability to create certain liens, enter into sale and lease-back transactions, and consolidate or merge with or into, or convey, transfer, or lease all or substantially all of our properties and assets, each subject to certain exceptions.
2033 Senior Notes
In March 2023, we issued an aggregate principal amount of $800.0 million in senior notes (the “2033 Senior Notes”) that will mature in March 2033 and bear interest at a fixed rate of 6.1 % per annum. The interest is payable semi-annually in March and September of each year, commencing in September 2023. The interest rate is subject to adjustment from time to time upon a rating agency downgrade or upgrade of the credit rating assigned to the 2033 Senior Notes. The 2033 Senior Notes were sold at 99.843 % of the aggregate principal amount. The 2033 Senior Notes are unsecured and rank equally in right of payment with all of our other senior unsecured indebtedness.
62
Credit Facilities
Bridge Facility
On December 11, 2022, we entered into a bridge facility commitment letter (the “Bridge Facility”) in connection with the acquisition of Transporeon. Under the Bridge Facility, the lender committed to provide a term loan up to an aggregate amount of €1.88 billion. On December 27, 2022, the Bridge Facility was automatically reduced to €500 million upon entering into the 2022 Term Loan Agreement and the 2022 Credit Facility Amendment (as next described). On March 9, 2023, as a result of completing the issuance of the 2033 Senior Notes, the remaining €500 million was automatically terminated with no amounts having been drawn.
2022 Term Loan Credit Agreement
On December 27, 2022, we entered into a $1.0 billion unsecured, delayed draw term loan credit agreement comprised of commitments for a 3-year tranche for $500.0 million and a 5-year tranche for $500.0 million. On April 3, 2023, both variable-rate term loans were drawn to fund the acquisition of Transporeon.
Prepayments are allowed without penalty and cannot be reborrowed.
2022 Credit Facility and Amendment
In March 2022, we entered into a credit agreement (the “2022 Credit Facility”) maturing in March 2027. The 2022 Credit Facility provides for a five-year , unsecured revolving credit facility in the aggregate principal amount of $1.25 billion, and permits us, subject to the satisfaction of certain conditions, to increase the commitments for revolving loans by an aggregate principal amount of up to $500.0 million. The variable interest rate and commitment fees are based on our current long-term, senior unsecured debt ratings, our leverage ratio, and certain specified sustainability targets.
On December 27, 2022, we entered into an amendment to the 2022 Credit Facility (the “2022 Credit Facility Amendment”) that made $600.0 million of the existing commitments under the Credit Facility available for the acquisition of Transporeon and increased our maximum permitted leverage ratio following the closing of the acquisition. On April 3, 2023, we borrowed $225.0 million as part of the proceeds to finance the acquisition. For additional information related to the Transporeon acquisition, see Note 3 “Acquisitions” of this report.
Uncommitted Facilities
At the end of 2023, we had two $75.0 million and one €100.0 million revolving credit facilities, which are uncommitted (the “uncommitted facilities”). Generally, these variable-rate uncommitted facilities may be redeemed upon demand. Borrowings under uncommitted facilities are classified as short-term debt in the Consolidated Balance Sheet.
Covenants
The 2022 term loan credit agreement and 2022 credit facility, as amended, contain customary covenants including, among other requirements, limitations that restrict the Company’s and its subsidiaries’ ability to create liens and enter into sale and leaseback transactions, and restrictions on the ability of the subsidiaries to incur indebtedness. Further, both debt agreements contain financial covenants that require the maintenance of maximum leverage and minimum interest coverage ratios. At the end of 2023, we were in compliance with the covenants for each of our debt agreements.
NOTE 9: LEASES
We have operating leases primarily for certain of our major facilities, including corporate offices, research and development facilities, and manufacturing facilities. Lease terms range from 1 to 12 years, and certain leases include options to extend the lease for up to 10 years. We consider options to extend the lease in determining the lease term.
Operating lease expense consisted of:
| 2023 | 2022 | 2021 | |||||||||||||||
| (In millions) | |||||||||||||||||
| Operating lease expense | $ | $ | $ | ||||||||||||||
| Short-term lease expense and other | |||||||||||||||||
| Total lease expense | $ | $ | $ | ||||||||||||||
63
Supplemental cash flow information related to leases was as follows:
| 2023 | 2022 | 2021 | |||||||||||||||
| (In millions) | |||||||||||||||||
| Cash paid for liabilities included in the measurement of lease liabilities: | |||||||||||||||||
Operating cash flows from operating leases (1) | $ | $ | $ | ||||||||||||||
| Right-of-use assets obtained in exchange for Operating lease liabilities: | $ | $ | $ | ||||||||||||||
(1)Excludes cash payments for short-term leases, which are not capitalized.
Supplemental balance sheet information related to leases was as follows:
| At the End of Year | 2023 | 2022 | |||||||||
| (In millions) | |||||||||||
| Operating lease right-of-use assets | $ | $ | |||||||||
| $ | $ | ||||||||||
| Operating lease liabilities | |||||||||||
| Total operating lease liabilities | $ | $ | |||||||||
| Weighted-average discount rate | % | % | |||||||||
| Weighted-average remaining lease term | |||||||||||
At the end of 2023, the maturities of lease liabilities were as follows:
| (In millions) | |||||
| 2024 | $ | ||||
| 2025 | |||||
| 2026 | |||||
| 2027 | |||||
| 2028 | |||||
| Thereafter | |||||
| Total lease payments | $ | ||||
| Less: imputed interest | |||||
| Total | $ | ||||
We signed operating leases for real estate of approximately $21.5 million that have not yet commenced at the end of 2023, and as such, have not been recognized on our Consolidated Balance Sheets. These operating leases are expected to commence in 2024 with lease terms ranging from 1 to 11 years.
NOTE 10: COMMITMENTS AND CONTINGENCIES
Commitments
At the end of 2023, we had unconditional purchase obligations of approximately $618.9 million as compared to $858.8 million at the end of 2022. These unconditional purchase obligations primarily represent (i) open non-cancellable purchase orders for material purchases with our inventory vendors, and (ii) various non-cancelable agreements with certain service providers with minimum or fixed commitments.
Litigation
From time to time, we are involved in litigation arising in the ordinary course of our business. There are no material legal proceedings, other than ordinary routine litigation incidental to the business, that we or any of our subsidiaries is a party, or that any of our or our subsidiaries’ property is subject.
64
NOTE 11: FAIR VALUE MEASUREMENTS
The following table summarizes the fair values of financial instruments at fair value on a recurring basis for the periods indicated and determined using the following inputs:
Fair Values at the end of 2023 | Fair Values at the end of 2022 | ||||||||||||||||||||||||||||||||||||||||||||||
| Quoted prices in Active Markets for Identical Assets | Significant Other Observable Inputs | Significant Unobservable Inputs | Quoted prices in Active Markets for Identical Assets | Significant Other Observable Inputs | Significant Unobservable Inputs | ||||||||||||||||||||||||||||||||||||||||||
| (In millions) | (Level I) | (Level II) | (Level III) | Total | (Level I) | (Level II) | (Level III) | Total | |||||||||||||||||||||||||||||||||||||||
| Assets | |||||||||||||||||||||||||||||||||||||||||||||||
Deferred compensation plan (1) | $ | $ | $ | $ | $ | $ | $ | $ | |||||||||||||||||||||||||||||||||||||||
Contingent consideration (3) | |||||||||||||||||||||||||||||||||||||||||||||||
| Total assets measured at fair value | $ | $ | $ | $ | $ | $ | $ | $ | |||||||||||||||||||||||||||||||||||||||
| Liabilities | |||||||||||||||||||||||||||||||||||||||||||||||
Deferred compensation plan (1) | $ | $ | $ | $ | $ | $ | $ | $ | |||||||||||||||||||||||||||||||||||||||
Derivatives (2) | |||||||||||||||||||||||||||||||||||||||||||||||
| Total liabilities measured at fair value | $ | $ | $ | $ | $ | $ | $ | $ | |||||||||||||||||||||||||||||||||||||||
(1)Represents a self-directed, non-qualified deferred compensation plan for certain executives and other highly compensated employees included in Other non-current assets and Other non-current liabilities on our Consolidated Balance Sheets. The plan is invested in actively traded mutual funds and individual stocks valued using observable quoted prices in active markets.
(2)Represents forward currency exchange contracts, and for 2022, a treasury rate lock contract, all that are included in Other current assets and Other current liabilities on our Consolidated Balance Sheets.
At the end of 2022, derivative assets included foreign currency exchange contracts and a treasury rate lock contract, both related to the acquisition of Transporeon and associated debt and were settled in the first two quarters of 2023.
Additional Fair Value Information
The total estimated fair value of all outstanding financial instruments that are not recorded at fair value on a recurring basis (debt) was approximately $3.1 billion and $1.5 billion at the end of 2023 and 2022.
The fair value of the senior notes was determined based on observable market prices in less active markets and is categorized accordingly as Level II. The fair values do not indicate the amount we would currently have to pay to extinguish the debt.
65
NOTE 12: DEFERRED REVENUE AND REMAINING PERFORMANCE OBLIGATIONS
Deferred Revenue
Changes in our deferred revenue during 2023 and 2022 were as follows:
| (In millions) | 2023 | 2022 | |||||||||
| Beginning balance of the period | $ | $ | |||||||||
| Revenue recognized from prior year-end | ( | ( | |||||||||
| Billings net of revenue recognized from current year | |||||||||||
| Ending balance of the period | $ | $ | |||||||||
Remaining Performance Obligations
At the end of 2023, approximately $1.8 billion of revenue is expected to be recognized from remaining performance obligations for which goods or services have not been delivered, primarily subscription, software, and software maintenance, and to a lesser extent, hardware and professional services contracts. We expect to recognize $1.2 billion or 70 % of our remaining performance obligations as revenue during the next 12 months and the remainder thereafter.
NOTE 13: INCOME TAXES
Income before taxes and the provision (benefit) for taxes consisted of the following:
| 2023 | 2022 | 2021 | |||||||||||||||
| (In millions) | |||||||||||||||||
| Income before taxes: | |||||||||||||||||
| United States | $ | $ | $ | ||||||||||||||
| Foreign | |||||||||||||||||
| Total | $ | $ | $ | ||||||||||||||
| Provision (benefit) for taxes: | |||||||||||||||||
| U.S. Federal: | |||||||||||||||||
| Current | $ | $ | $ | ||||||||||||||
| Deferred | ( | ( | ( | ||||||||||||||
| ( | |||||||||||||||||
| U.S. State: | |||||||||||||||||
| Current | |||||||||||||||||
| Deferred | ( | ( | ( | ||||||||||||||
| Foreign: | |||||||||||||||||
| Current | |||||||||||||||||
| Deferred | ( | ( | |||||||||||||||
| Income tax provision | $ | $ | $ | ||||||||||||||
| Effective tax rate | % | % | % | ||||||||||||||
66
The difference between the tax provision (benefit) at the statutory federal income tax rate and the tax provision (benefit) as a percentage of income before taxes (“effective tax rate”) was as follows:
| 2023 | 2022 | 2021 | |||||||||||||||
| Statutory federal income tax rate | % | % | % | ||||||||||||||
| Increase (reduction) in tax rate resulting from: | |||||||||||||||||
| Foreign income taxed at different rates | % | % | % | ||||||||||||||
| U.S. State income taxes | % | % | % | ||||||||||||||
| Stock-based compensation | % | % | ( | % | |||||||||||||
| Other U.S. taxes on foreign operations | ( | % | ( | % | ( | % | |||||||||||
Foreign-derived intangible income | ( | % | ( | % | % | ||||||||||||
| U.S. Federal research and development credits | ( | % | ( | % | ( | % | |||||||||||
| Tax reserve releases | ( | % | ( | % | ( | % | |||||||||||
| Intellectual property restructuring and tax law changes | % | % | ( | % | |||||||||||||
| Other | % | % | % | ||||||||||||||
| Effective tax rate | % | % | % | ||||||||||||||
Our effective income tax rates for 2023 and 2022 were 12.8 % and 21.0 %. The decrease was primarily due to increases in tax benefits from U.S. federal R&D credits and FDII in 2023, and a change in the geographic mix of earnings, partially offset by lower stock-based compensation deductions in the current year.
67
Deferred income taxes reflect the net effects of temporary differences between the carrying amounts of assets and liabilities for financial reporting purposes and the amounts used for income tax purposes. The significant components of deferred tax assets and liabilities were as follows:
| At the End of Year | 2023 | 2022 | |||||||||
| (In millions) | |||||||||||
| Deferred tax liabilities: | |||||||||||
| Global intangible low-taxed income | $ | $ | |||||||||
| Purchased intangibles | |||||||||||
| Operating lease right-of-use assets | |||||||||||
| Other | |||||||||||
| Total deferred tax liabilities | |||||||||||
| Deferred tax assets: | |||||||||||
| Depreciation and amortization | |||||||||||
| Capitalized research and development | |||||||||||
Operating lease liabilities | |||||||||||
| U.S. tax credit carryforwards | |||||||||||
| Expenses not currently deductible | |||||||||||
Net operating loss carryforwards | |||||||||||
Stock-based compensation | |||||||||||
Intercompany prepayments | |||||||||||
| Other | |||||||||||
| Total deferred tax assets | |||||||||||
| Valuation allowance | ( | ( | |||||||||
| Total deferred tax assets | |||||||||||
| Total net deferred tax assets | $ | $ | |||||||||
| Reported as: | |||||||||||
| Non-current deferred income tax assets | $ | $ | |||||||||
| Non-current deferred income tax liabilities | ( | ( | |||||||||
| Net deferred tax assets | $ | $ | |||||||||
At the end of 2023, we have U.S. federal and foreign net operating loss carryforwards, or NOLs, of approximately $19.1 million and $86.3 million, respectively. The U.S. federal NOLs will begin to expire in 2026. There is generally no expiration for the foreign NOLs. Utilization of our U.S. federal NOLs is subject to annual limitations in accordance with the applicable tax code. We have determined that it is more likely than not that we will not realize a portion of the foreign NOLs and, accordingly, a valuation allowance has been established for such amount.
We have California research and development credit carryforwards of approximately $35.3 million, which have an indefinite carryforward period. We believe that it is more likely than not that we will not realize a significant portion of the California research and development credit carryforwards and, accordingly, a valuation allowance has been established for such amount.
As a result of the Tax Act, we can repatriate foreign earnings back to the U.S. when needed with minimal U.S. income tax consequences. We reinvested a large portion of our undistributed foreign earnings in acquisitions and other investments and intend to bring back a portion of foreign cash that was subject to the transition tax and the global intangible low-taxed income tax. During 2023, we repatriated $371.3 million of our foreign earnings to the U.S.
68
The total amount of unrecognized tax benefits at the end of 2023 was $88.3 million. A reconciliation of gross unrecognized tax benefits was as follows:
| 2023 | 2022 | 2021 | |||||||||||||||
| (In millions) | |||||||||||||||||
| Beginning balance | $ | $ | $ | ||||||||||||||
| Increase related to current year tax positions | |||||||||||||||||
| (Decrease) increase related to prior years' tax positions | ( | ||||||||||||||||
| Settlement with taxing authorities | ( | ||||||||||||||||
| Lapse of statute of limitations | ( | ( | ( | ||||||||||||||
| Ending balance | $ | $ | $ | ||||||||||||||
Total unrecognized tax benefits that, if recognized, would affect our effective tax rate were $59.5 million and $51.6 million at the end of 2023 and 2022.
We and our subsidiaries are subject to U.S. federal, state, and foreign income taxes. Our tax years are substantially closed for all U.S. federal and state income taxes for audit purposes through 2015. Non-U.S. income tax matters have been concluded for years through 2008. We are currently in various stages of multiple year examinations from state and foreign (multiple jurisdictions) taxing authorities. While we generally believe it is more likely than not that our tax positions will be sustained, it is reasonably possible that future obligations related to these matters could arise. We believe that our reserves are adequate to cover any potential assessments that may result from the examinations and negotiations.
Although timing of the resolution and/or closure of audits is not certain, we do not believe that our gross unrecognized tax benefits would materially change in the next twelve months.
Our practice is to recognize interest and/or penalties related to income tax matters in income tax expense. Our liability for unrecognized tax benefits including interest and penalties was recorded in Other non-current liabilities on our Consolidated Balance Sheets. At the end of 2023 and 2022, we accrued $9.9 million and $8.4 million for interest and penalties.
NOTE 14: EMPLOYEE STOCK BENEFIT PLANS
Amended and Restated 2002 Stock Plan
In May 2020, our stockholders approved an amendment to the 2002 Stock Plan to increase the number of shares of common stock available for issuance by 18.0 million shares. As such, our Amended and Restated 2002 Stock Plan provides for the granting of incentive and non-statutory stock options and Restricted Stock Units (“RSUs”) for up to 92.6 million shares. At the end of 2023, the remaining number of shares available for grant under the 2002 stock plan was 11.5 million.
Stock-Based Compensation Expense
The following table summarizes the components of stock-based compensation expense recognized in our Consolidated Statements of Income for the periods indicated:
| 2023 | 2022 | 2021 | |||||||||||||||
| (In millions) | |||||||||||||||||
| Restricted stock units | $ | $ | $ | ||||||||||||||
| Stock options | |||||||||||||||||
| ESPP | |||||||||||||||||
| Total stock-based compensation expense | $ | $ | $ | ||||||||||||||
69
Stock-based compensation expense was allocated as follows:
| 2023 | 2022 | 2021 | |||||||||||||||
| (In millions) | |||||||||||||||||
| Cost of sales | $ | $ | $ | ||||||||||||||
| Research and development | |||||||||||||||||
| Sales and marketing | |||||||||||||||||
| General and administrative | |||||||||||||||||
| Total stock-based compensation expense | $ | $ | $ | ||||||||||||||
At the end of 2023, total unamortized stock-based compensation expense was $214.9 million, with a weighted-average recognition period of 1.8 years.
Restricted Stock Units
We grant RSUs containing only service conditions and RSUs containing a combination of service, performance, and market conditions (“PSUs”). RSUs containing only service conditions typically vest ratably over a - to three-year service period. PSUs are granted to executive officers and other senior employees and vest after a three-year service period.
The fair value at the grant date is determined by (a) the closing price of our common stock for awards containing only service or both service and performance conditions, or (b) the Monte Carlo valuation model for awards containing both service and market conditions.
For PSUs, the number of shares received at vesting will range from 0 % to 220 % of the target grant amount based on either market conditions or performance conditions or, in some cases, both. Market conditions consider our relative total stockholder return (“TSR”) of our common stock as compared to the TSR of the constituents of the S&P 500 over the vesting period. Performance conditions consider the achievement of our financial results or metrics over the vesting period.
2023 Restricted Stock Units Outstanding | |||||||||||
Number of Units (1) | Weighted Average Grant-Date Fair Value per Share | ||||||||||
| (In millions, except for per share data) | |||||||||||
| Outstanding at the beginning of year | $ | ||||||||||
Granted (2) | |||||||||||
Shares vested, net (2) | ( | ||||||||||
| Canceled and forfeited | ( | ||||||||||
| Outstanding at the end of year | $ | ||||||||||
(1) Includes 0.9 million PSUs granted, 0.1 million PSUs vested, 0.2 million PSUs cancelled and forfeited, and 1.2 million PSUs outstanding at the end of the year.
(2) Excludes approximately 0.1 million PSUs related to achievement above target levels at the vesting date and approximately 0.1 million PSUs related to shares cancelled due to achievement below target levels.
The weighted-average grant date fair value of all RSUs granted during 2023, 2022, and 2021 was $49.93 , $73.32 , and $78.44 per share. The fair value of all RSUs vested during 2023, 2022, and 2021 was $110.1 million, $108.3 million, and $81.4 million.
Employee Stock Purchase Plan
We have an ESPP under which our stockholders have approved an aggregate of 39.0 million shares of common stock for issuance to eligible employees. The fair value at the grant date is based on the Black-Scholes valuation model. The plan permits eligible employees to purchase common stock through payroll deductions at 85 % of the lower of the fair market value of the common stock at the beginning or at the end of each offering period, which is six months . Rights to purchase shares are granted during the first and third quarter of each year. The ESPP terminates on March 15, 2027. In 2023, 2022, and 2021, 0.8 million, 0.6 million, and 0.6 million shares were issued, representing $35.7 million, $34.7 million, and $33.4 million in cash received for the issuance of stock under the ESPP. At the end of 2023, the number of shares reserved for future purchases was 4.6 million.
70
NOTE 15: COMMON STOCK REPURCHASE
In August 2021, our Board of Directors approved a stock repurchase program (“2021 Stock Repurchase Program”) authorizing up to $750.0 million in repurchases of our common stock. At the end of 2023, the 2021 Stock Repurchase Program had remaining authorized funds of $115.3 million.
On January 28, 2024, our Board of Directors approved a new stock repurchase program (“2024 Stock Repurchase Program”) authorizing up to $800.0 million in repurchases of our common stock. The 2024 Stock Repurchase Program replaced the 2021 Stock Repurchase Program, which has been cancelled. Under the 2024 Stock Repurchase Program, the stock repurchase authorization does not have an expiration date.
According to the 2024 Stock Repurchase Program, we may repurchase stock from time to time through accelerated share repurchase programs, open market transactions, privately negotiated transactions, block purchases, tender offers, or by other means. The timing and actual number of any shares repurchased will depend on a variety of factors, including market conditions, our share price, other available uses of capital, applicable legal requirements, and other factors. The 2024 Stock Repurchase Program may be suspended, modified, or discontinued at any time without prior notice.
During 2023, 2022, and 2021, we repurchased approximately 2.4 million, 6.0 million, and 2.1 million shares of common stock in open market purchases at an average price of $42.50 , $65.90 , and $85.75 per share for a total of $100.0 million, $394.7 million, and $180.0 million.
NOTE 16: SUBSEQUENT EVENT
Reporting Segment Change
Considering the pending AGCO JV transaction and our CODM’s revised organizational structure, effective in the first quarter of 2024, we reorganized our businesses under a new structure. This structure brings similar businesses together, which is expected to enhance our ability to achieve scale and growth consistent with our strategy. Beginning with the first quarter of 2024, our reporting segments, and the results of those segments, will be reorganized to reflect how our CODM assesses performance and allocates resources. The new reporting segments will be as follows:
•Architecture, Engineering, and Construction and Owner Software (“AECO Software”). This segment primarily provides software solutions, which sell through a direct channel to customers in the construction industry.
•Field Systems. This segment primarily includes hardware-centric businesses, which sell through dealer partner channels.
•Transportation and Logistics (“T&L”). This segment will primarily maintain the historical businesses from the previous Transportation segment, which serves customers working in long haul trucking and freight shipper markets.
71
Report of Independent Registered Public Accounting Firm
To the Stockholders and the Board of Directors of Trimble Inc.
Opinion on the Financial Statements
We have audited the accompanying consolidated balance sheets of Trimble Inc. (the Company) as of December 29, 2023 and December 30, 2022, the related consolidated statements of income, comprehensive income, stockholders’ equity and cash flows for each of the three years in the period ended December 29, 2023, and the related notes (collectively referred to as the “consolidated financial statements”). In our opinion, the consolidated financial statements present fairly, in all material respects, the financial position of the Company at December 29, 2023 and December 30, 2022, and the results of its operations and its cash flows for each of the three years in the period ended December 29, 2023, in conformity with U.S. generally accepted accounting principles.
We also have audited, in accordance with the standards of the Public Company Accounting Oversight Board (United States) (PCAOB), the Company's internal control over financial reporting as of December 29, 2023, based on criteria established in Internal Control–Integrated Framework issued by the Committee of Sponsoring Organizations of the Treadway Commission (2013 framework) and our report dated February 26, 2024 expressed an adverse opinion thereon.
Basis for Opinion
These financial statements are the responsibility of the Company's management. Our responsibility is to express an opinion on the Company’s financial statements based on our audits. We are a public accounting firm registered with the PCAOB and are required to be independent with respect to the Company in accordance with the U.S. federal securities laws and the applicable rules and regulations of the Securities and Exchange Commission and the PCAOB.
We conducted our audits in accordance with the standards of the PCAOB. Those standards require that we plan and perform the audit to obtain reasonable assurance about whether the financial statements are free of material misstatement, whether due to error or fraud. Our audits included performing procedures to assess the risks of material misstatement of the financial statements, whether due to error or fraud, and performing procedures that respond to those risks. Such procedures included examining, on a test basis, evidence regarding the amounts and disclosures in the financial statements. Our audits also included evaluating the accounting principles used and significant estimates made by management, as well as evaluating the overall presentation of the financial statements. We believe that our audits provide a reasonable basis for our opinion.
Critical Audit Matters
The critical audit matters communicated below are matters arising from the current period audit of the financial statements that were communicated or required to be communicated to the audit committee and that: (1) relate to accounts or disclosures that are material to the financial statements and (2) involved our especially challenging, subjective or complex judgments. The communication of the critical audit matters does not alter in any way our opinion on the consolidated financial statements, taken as a whole, and we are not, by communicating the critical audit matters below, providing separate opinions on the critical audit matters or on the accounts or disclosures to which they relate.
Revenue Recognition – Identification of Performance Obligations | |||||
| Description of the Matter | As described in Note 1 to the consolidated financial statements, the Company enters into contracts that can include various combinations of products and services. Determining whether products or services are considered distinct performance obligations that should be recognized separately or combined into a single performance obligation may sometimes require significant judgment. Auditing the Company's determination of distinct performance obligations was complex due to the effort involved in assessing whether the various product and service offerings promised within each contract are separate performance obligations or should be combined into a single performance obligation. | ||||
72
| How We Addressed the Matter in Our Audit | We obtained an understanding, evaluated the design, and tested the operating effectiveness of the Company's internal controls over the evaluation of the relevant terms of its contracts, and the appropriate identification of distinct performance obligations. Our audit procedures included evaluating management’s revenue recognition policy which included the application of management’s judgment in the identification of performance obligations. Among other procedures to evaluate management’s identification and determination of the distinct performance obligations, we read executed contracts for a sample of sales transactions to understand the terms in the customer agreement and evaluated the appropriateness of management’s application of the Company’s accounting policy. We evaluated the accuracy of the Company’s contract summary documentation, specifically related to the identification and determination of distinct performance obligations, and the related revenue recognition. Finally, we assessed the appropriateness of the related disclosures in the consolidated financial statements. | ||||
Business Combination – Customer Relationships and Developed Technology | |||||
| Description of the Matter | During fiscal year 2023, the Company completed the acquisition of Transporeon for consideration of $2.1 billion, as disclosed in Note 3 to the consolidated financial statements. The transaction was accounted for as a business combination. Auditing the Company's accounting for its acquisition of Transporeon was complex due to the significant estimation uncertainty in the Company’s determination of the fair value of identified intangible assets, which principally consisted of developed technology and customer relationships. The significant estimation uncertainty was primarily due to the sensitivity of the respective fair values to underlying assumptions about the future performance of the acquired business. The Company used a discounted cash flow model to measure the developed technology and customer relationship intangible assets. The significant assumptions used to estimate the value of these intangible assets included certain assumptions that form the basis of the forecasted results, specifically, critical estimates when valuing intangible assets include expected future cash flows based on consideration of revenue, revenue growth rates, customer attrition rates, royalty rates, and discount rates. These significant assumptions are forward looking and could be affected by future economic and market conditions. | ||||
| How We Addressed the Matter in Our Audit | To test the estimated fair value of the developed technology and customer relationships intangible assets, we performed audit procedures that included, among others, evaluating the Company's selection of the valuation methodology, evaluating the methods and significant assumptions used by the Company, and evaluating the completeness and accuracy of the underlying data supporting the significant assumptions and estimates. For example, we compared the significant assumptions to current industry, market and economic trends and to the Company's budgets and forecasts, and Transporeon’s historical operating results. We involved our valuation specialists to assist with our evaluation of the methodology used by the Company and significant assumptions included in the fair value estimates. Our valuation specialists’ procedures included, among others, developing a range of independent estimates for the discount rates used in the valuation models and comparing those to the discount rates selected by management. | ||||
/s/ Ernst & Young LLP
We have served as the Company’s auditor since 1986.
February 26, 2024
73
Report of Independent Registered Public Accounting Firm
To the Stockholders and the Board of Directors of Trimble Inc.
Opinion on Internal Control Over Financial Reporting
We have audited Trimble Inc.’s internal control over financial reporting as of December 29, 2023, based on criteria established in Internal Control–Integrated Framework issued by the Committee of Sponsoring Organizations of the Treadway Commission (2013 framework) (the COSO criteria). In our opinion, because of the effect of the material weakness described below on the achievement of the objectives of the control criteria, Trimble Inc. (the Company) has not maintained effective internal control over financial reporting as of December 29, 2023, based on the COSO criteria.
A material weakness is a deficiency, or combination of deficiencies, in internal control over financial reporting, such that there is a reasonable possibility that a material misstatement of the company’s annual or interim financial statements will not be prevented or detected on a timely basis. The following material weakness has been identified and included in management’s assessment. Management has identified a material weakness related to the accounting for the Company’s business combination of Transporeon, including lack of appropriate oversight of third-party valuation specialists and insufficient design and operating effectiveness of management review controls, including controls over the completeness and accuracy of certain assumptions used in the valuation of acquired intangible assets.
As indicated in the accompanying Management’s Annual Report on Internal Control over Financial Reporting, management’s assessment of and conclusion on the effectiveness of internal control over financial reporting did not include the internal controls of businesses acquired in 2023, which are included in the 2023 consolidated financial statements of the Company and constituted approximately 3% of both tangible assets and revenue as of and for the year ended December 29, 2023. Our audit of internal control over financial reporting of the Company also did not include an evaluation of the internal control over financial reporting of the businesses acquired in 2023.
We also have audited, in accordance with the standards of the Public Company Accounting Oversight Board (United States) (PCAOB), the consolidated balance sheets of the Company as of December 29, 2023 and December 30, 2022, the related consolidated statements of income, comprehensive income, stockholders’ equity and cash flows for each of the three years in the period ended December 29, 2023, and the related notes. This material weakness was considered in determining the nature, timing and extent of audit tests applied in our audit of the 2023 consolidated financial statements, and this report does not affect our report dated February 26, 2024, which expressed an unqualified opinion thereon.
Basis for Opinion
The Company’s management is responsible for maintaining effective internal control over financial reporting and for its assessment of the effectiveness of internal control over financial reporting included in the accompanying Management’s Annual Report on Internal Control over Financial Reporting. Our responsibility is to express an opinion on the Company’s internal control over financial reporting based on our audit. We are a public accounting firm registered with the PCAOB and are required to be independent with respect to the Company in accordance with the U.S. federal securities laws and the applicable rules and regulations of the Securities and Exchange Commission and the PCAOB.
We conducted our audit in accordance with the standards of the PCAOB. Those standards require that we plan and perform the audit to obtain reasonable assurance about whether effective internal control over financial reporting was maintained in all material respects.
Our audit included obtaining an understanding of internal control over financial reporting, assessing the risk that a material weakness exists, testing and evaluating the design and operating effectiveness of internal control based on the assessed risk, and performing such other procedures as we considered necessary in the circumstances. We believe that our audit provides a reasonable basis for our opinion.
Definition and Limitations of Internal Control Over Financial Reporting
A company’s internal control over financial reporting is a process designed to provide reasonable assurance regarding the reliability of financial reporting and the preparation of financial statements for external purposes in accordance with generally accepted accounting principles. A company’s internal control over financial reporting includes those policies and procedures that (1) pertain to the maintenance of records that, in reasonable detail, accurately and fairly reflect the transactions and dispositions of the assets of the company; (2) provide reasonable assurance that transactions are recorded as necessary to permit preparation of financial statements in accordance with generally accepted accounting principles, and that receipts and expenditures of the company are being made only in accordance with authorizations of management and directors of the company; and (3) provide reasonable assurance regarding prevention or timely detection of unauthorized acquisition, use, or disposition of the company’s assets that could have a material effect on the financial statements.
74
Because of its inherent limitations, internal control over financial reporting may not prevent or detect misstatements. Also, projections of any evaluation of effectiveness to future periods are subject to the risk that controls may become inadequate because of changes in conditions, or that the degree of compliance with the policies or procedures may deteriorate.
/s/ Ernst & Young LLP
February 26, 2024
75
Item 9. Changes in and Disagreements with Accountants on Accounting and Financial Disclosure
None
Item 9A. Controls and Procedures
(a) Evaluation of Disclosure Controls and Procedures
Management, including our Chief Executive Officer (“CEO”) and Chief Financial Officer (“CFO”), has evaluated the effectiveness of our disclosure controls and procedures (as such term is defined in Rules 13a-15(e) and 15d-15(e) under the Exchange Act), as of the end of the period covered by this report. Based on such evaluation, our CEO and CFO have concluded that our disclosure controls and procedures were not effective as of the end of such period because of the material weakness in internal control over financial reporting described below.
Inherent Limitations on Effectiveness of Controls
Management does not expect that the internal control over financial reporting will prevent or detect all errors and all fraud. A control system, no matter how well-designed and operated, can provide only reasonable, not absolute, assurance that the control system’s objectives will be met. The design of any system of controls is based in part on certain assumptions about the likelihood of future events, and there can be no assurance that any design will succeed in achieving its stated goals under all potential future conditions.
(b) Management’s Annual Report on Internal Control over Financial Reporting
Management is responsible for establishing and maintaining adequate internal control over financial reporting, as such term is defined in Exchange Act Rule 13a-15(f). The internal control over financial reporting is designed to provide reasonable assurance regarding the reliability of financial reporting and the preparation of financial statements for external purposes in accordance with generally accepted accounting principles.
Management conducted an evaluation of the effectiveness of the internal control over financial reporting based on the Internal Control—Integrated Framework issued by the Committee of Sponsoring Organizations of the Treadway Commission (2013 framework). Based on the assessment by management, it was determined that the Company’s internal control over financial reporting was not effective due to a material weakness related to the accounting for the Company’s business combination of Transporeon. This included lack of appropriate oversight of third-party valuation specialists and insufficient design and operating effectiveness of management review controls, including controls over the completeness and accuracy of certain assumptions used in the valuation of acquired intangible assets. The Company corrected an error, which resulted in an adjustment of $34 million between goodwill and developed technology intangibles, net of tax.
We have excluded the businesses acquired in 2023 from our evaluation of the internal control over financial reporting internal controls. The excluded businesses constituted approximately 3% of both tangible assets and revenue as of and for the year ended December 29, 2023.
The effectiveness of our internal control over financial reporting at the end of 2023 has been audited by Ernst & Young LLP, an independent registered public accounting firm, as stated in their report which is included elsewhere herein.
Remediation Plan for Material Weakness
Management, with the oversight of the Audit Committee, is currently taking actions to remediate the material weakness and is implementing additional processes and controls to address the underlying causes associated with the material weakness described above. We are in the process of reassessing the design of review controls over third-party valuation specialists to add greater levels of precision to detect and prevent potential material misstatements, including the establishment of process and controls to evaluate adequate review and evidence used in the valuation of acquired intangible assets.
The material weakness will not be considered remediated until the applicable remedial controls operate for a sufficient period of time and management has concluded, through testing, that these controls are operating effectively. We believe the measures described above will remediate the control deficiencies we have identified and strengthen our internal control over financial reporting. We are committed to continuing to improve our internal control processes and will continue to review, optimize, and enhance our financial reporting controls and procedures.
The process of designing and implementing an effective financial reporting system is a continuous effort that requires us to anticipate and react to changes in our business and the economic and regulatory environments, and to expend significant resources to maintain a financial reporting system that is adequate to satisfy our reporting obligations. As we continue to evaluate and take actions to improve our internal control over financial reporting, we may determine to take additional actions to address control deficiencies or determine to modify certain of the remediation measures described above.
Changes in Internal Control over Financial Reporting
76
During the fourth quarter of 2023, there were no changes in our internal control over financial reporting that have materially affected, or are reasonably likely to materially affect, our internal control over financial reporting.
Item 9B. Other Information
On November 2, 2023 , Mark Schwartz , Senior Vice President , and an officer for purposes of Section 16 of the Exchange Act as of the date of this filing, entered into a Rule 10b5-1 trading arrangement that is intended to satisfy the affirmative defense of Rule 10b5-1(c) under the Exchange Act. The trading arrangement was entered into during an open trading window and provides for potential sales of our common stock of up to 12,344 shares between April 15, 2024 and October 16, 2024.
Item 9C. Disclosure Regarding Foreign Jurisdictions that Prevent Inspections
Not applicable.
77
PART III
Item 10. Directors, Executive Officers and Corporate Governance
The information required by this item, insofar as it relates to our directors, will be contained under the captions “Election of Directors” and “Section 16(a) Beneficial Ownership Reporting Compliance” in the Proxy Statement and is incorporated herein by reference. The information required by this item relating to executive officers is set forth above in Item 1 Business Overview under the caption “Executive Officers.”
The information required by this item insofar as it relates to the nominating and audit committees will be contained in the Proxy Statement under the caption “Board Meetings and Committees; Director Independence.”
Code of Ethics
Our Business Ethics and Conduct Policy applies to, among others, our Chief Executive Officer, Chief Financial Officer, Chief Accounting Officer, and other finance organization employees. We make available our Business Ethics and Conduct Policy free of charge through our website at www.trimble.com under the heading “Corporate Governance - Governance Documents” on the Investor Relations page.
If any substantive amendments to the Business Ethics and Conduct Policy are made or any waivers are granted, including any implicit waiver, from a provision of the Business Ethics and Conduct Policy, to its Chief Executive Officer, Chief Financial Officer, or Chief Accounting Officer, we will disclose the nature of such amendment or waiver on our website at www.trimble.com or in a report on Form 8-K. The contents of these websites are not intended to be incorporated by reference into this report or in any other report or document we file or furnish with the SEC, and any reference to these websites are intended to be inactive textual references only.
Item 11. Executive Compensation
The information required by this item will be contained in the Proxy Statement under the captions “Executive Compensation” and “Non-Employee Director Compensation” and is incorporated herein by reference.
Item 12. Security Ownership of Certain Beneficial Owners and Management and Related Stockholder Matters
The information required by this item will be contained in the Proxy Statement under the caption “Security Ownership of Certain Beneficial Owners and Management and Related Stockholder Matters” and is incorporated herein by reference.
Item 13. Certain Relationships and Related Transactions, and Director Independence
The information required by this item will be contained in the Proxy Statement under the caption “Certain Relationships and Related Person Transactions” and is incorporated herein by reference.
Item 14. Principal Accounting Fees and Services
The information required by this item will be contained in the Proxy Statement under the caption “Principal Accounting Fees and Services” and is incorporated herein by reference.
78
PART IV
Item 15. Exhibits and Financial Statement Schedules.
(1) Financial Statements
The following consolidated financial statements required by this item are included in Part II Item 8 hereof under the caption “Financial Statements and Supplementary Data.
| Page in this Report | |||||
(2) Financial Statement Schedules
All financial statement schedules have been omitted, since the required information is not applicable or is not present in amounts sufficient to require submission of the schedule, or because the information required is included in the consolidated financial statements and accompanying notes included in this report.
(3) Exhibits
We have filed, or incorporated into the Report by reference, the exhibits listed on the accompanying Index to Exhibits immediately preceding the signature page of this report.
Item 16. Form 10-K Summary.
None.
79
INDEX TO EXHIBITS
| Exh. No. | Description of Exhibit | Filed herewith or incorporated by reference to: | ||||||
| 2.1 * | Exh. 2.1 to Form 8-K/A filed Dec. 21, 2022 | |||||||
| 2.2 | Exh. 10.1 to Form 8-K/A filed Sep. 29, 2023 | |||||||
| 3.1 | Exh. 3.1 to Form 8-K filed Oct. 3, 2016 | |||||||
| 3.2 | Exh. 3.1 to Form 8-K filed Dec. 11, 2023 | |||||||
| 4.1 | Exh. 4.2 to Form 10-K filed Feb. 28, 2020 | |||||||
4.2(A) | Exh. 4.2 to Form S-3 filed Oct. 30, 2014 | |||||||
4.2(B) | Exh. 4.1 to Form 8-K filed Nov. 24, 2014 | |||||||
4.2(C) | Exh. 4.2 to Form 8-K filed Oct. 3, 2016 | |||||||
4.2(D) | Exh. 4.1 to Form 8-K filed Jun. 15, 2018 | |||||||
4.2(E) | Exh. 4.1 to Form 8-K filed March 9, 2023 | |||||||
10.1(A) | Exh. 10.1 to Form 8-K filed Mar. 30. 2022 | |||||||
10.1(B) | Exh. 10.2 to Form 8-K filed Dec. 30, 2022 | |||||||
10.1(C) | Exh. 10.1 to Form 10-Q filed Aug. 4, 2023 | |||||||
10.1(D) | Exh. 10.1 to Form 8-K filed Dec. 30, 2022 | |||||||
10.2+ | Exh. 10.1 to Form 8-K filed Nov. 15, 2017 | |||||||
10.3+ | Exh. 10.1 to Form 8-K filed Feb. 28, 2022 | |||||||
10.4+ | Exh. 10.1 to Form 10-Q filed Nov. 3, 2023 | |||||||
10.5+ | Exh. 10.2 to Form 10-Q filed Nov. 6, 2020 | |||||||
10.6+ | Exh. 10.5 to Form 10-Q filed May 3, 2023 | |||||||
10.7(A)+ | App. B of Form DEF 14A filed Mar. 23, 2017 | |||||||
10.7(B)+ | Exh. 10.5 to Form 10-Q filed Nov. 10, 2015 | |||||||
10.8(A)+ | App. B of Form DEF 14A filed Apr. 15, 2020 | |||||||
10.8(B)+ | Exh. 10.2 to Form 10-Q filed Nov. 7, 2014 | |||||||
10.8(C)+ | Exh. 10.3 to Form 10-Q filed Nov. 7, 2014 | |||||||
10.8(D)+ | Exh. 10.1 to Form 10-Q filed Nov. 10, 2015 | |||||||
10.8(E)+ | Exh. 10.2 to Form 10-Q filed May 3, 2023 | |||||||
10.8(F)+ | Exh. 10.2 to Form 10-Q filed Nov. 10, 2015 | |||||||
10.8(G)+ | Exh. 10.6 to Form 10-Q filed Nov. 10, 2015 | |||||||
10.8(H)+ | Exh. 10.30 to Form 10-K filed Feb. 24, 2017 | |||||||
80
10.8(I)+ | Exh. 10.4 to Form 10-Q filed Aug. 8, 2017 | |||||||
10.8(J)+ | Exh. 10.5 to Form 10-Q filed Aug. 8, 2017 | |||||||
10.8(K)+ | Exh. 10.1 to Form 10-Q filed Aug. 2, 2019 | |||||||
10.8(L)+ | Exh. 10.9(K) to Form 10-K filed Feb. 28, 2020 | |||||||
10.8(M)+ | Exh. 10.2 to Form 10-Q filed Aug. 9, 2021 | |||||||
10.8(N)+ | Exh. 10.1 to Form 10-Q filed May 5, 2022 | |||||||
10.8(O)+ | Exh. 10.3 to Form 10-Q filed May 3, 2023 | |||||||
10.8(P)+ | Exh. 10.4 to Form 10-Q filed May 3, 2023 | |||||||
10.9+ | Exh. 10.1 to Form 8-K filed Feb. 25, 2021 | |||||||
10.10+ | Exh. 10.1 to Form 10-Q filed Aug. 8, 2017 | |||||||
10.11+ | Exh. 10.2 to Form 10-Q filed Aug. 8, 2017 | |||||||
10.12+ | Exh. 10.15 to Form 10-K filed Feb. 26, 2021 | |||||||
10.13+ | Exh. 10.16 to Form 10-K filed Feb. 26, 2021 | |||||||
| 21.1 | Filed herewith | |||||||
| 23.1 | Filed herewith | |||||||
| 24.1 | Power of Attorney (included on signature page herein) | |||||||
| 31.1 | Filed herewith | |||||||
| 31.2 | Filed herewith | |||||||
| 32.1 | Filed herewith | |||||||
| 32.2 | Filed herewith | |||||||
| 101++ | The following financial statements from this Annual Report on Form 10-K, formatted in Inline XBRL: (i) Consolidated Balance Sheets, (ii) Consolidated Statements of Income, (iii) Consolidated Statements of Comprehensive Income, (iv) Consolidated Statements of Stockholders' Equity, (v) Consolidated Statements of Cash Flows, and (vi) Notes to Consolidated Financial Statements, tagged as blocks of text and including detailed tags | |||||||
| 104++ | The cover page from this Annual Report on Form 10-K, formatted in Inline XBRL | |||||||
* Certain portions of this exhibit have been redacted pursuant to Item 601(b)(10)(iv) of Regulation S-K. The Company agrees to supplementally furnish an unredacted copy of this exhibit to the SEC upon request; provided, however, that the Company may request confidential treatment pursuant to Rule 24b-2 of the Securities Exchange Act of 1934, as amended, to the extent so furnished.
+ Indicates management contract or compensatory plan or arrangement required to be filed as an exhibit to this Annual Report on Form 10–K.
++ Pursuant to applicable securities laws and regulations, the Company is deemed to have complied with the reporting obligation relating to the submission of interactive data files in such exhibits and is not subject to liability under any anti-fraud provisions of the federal securities laws as long as the Company has made a good faith attempt to comply with the submission requirements and promptly amends the interactive data files after becoming aware that the interactive data files fails to comply with the submission requirements.
81
SIGNATURES
Pursuant to the requirements of Section 13 or 15(d) of the Securities Exchange Act of 1934, the registrant has duly caused this Report to be signed on its behalf by the undersigned, thereunto duly authorized.
TRIMBLE INC. | ||||||||
| By: | /S/ ROBERT G. PAINTER | |||||||
| Robert G. Painter, President and Chief Executive Officer | ||||||||
February 26, 2024
82
POWER OF ATTORNEY
Know all persons by these presents, that each person whose signature appears below constitutes and appoints Robert G. Painter as his attorney-in-fact, with the power of substitution, for him in any and all capacities, to sign any amendments to this Report of this Annual Report on Form 10-K, and to file the same, with exhibits thereto and other documents in connection therewith, with the Securities and Exchange Commission, hereby ratifying and confirming all that said attorney-in-fact, or his substitute or substitutes, may do or cause to be done by virtue hereof.
Pursuant to the requirements of the Securities Exchange Act of 1934, this Annual Report on Form 10-K has been signed below by the following persons on behalf of the registrant and in the capacities and on the dates indicated:
| Signature | Capacity in which Signed | |||||||||||||
/s/ ROBERT G. PAINTER Robert G. Painter | President, Chief Executive Officer, Director | February 26, 2024 | ||||||||||||
/s/ DAVID G. BARNES David G. Barnes | Chief Financial Officer (Principal Financial Officer) | February 26, 2024 | ||||||||||||
/s/ JULIE A. SHEPARD Julie A. Shepard | Chief Accounting Officer (Principal Accounting Officer) | February 26, 2024 | ||||||||||||
/s/ JAMES C. DALTON James C. Dalton | Director | February 26, 2024 | ||||||||||||
/s/ BORJE EKHOLM Börje Ekholm | Director | February 26, 2024 | ||||||||||||
/s/ KAIGHAM (KEN) GABRIEL Kaigham (Ken) Gabriel | Director | February 26, 2024 | ||||||||||||
/s/ MEAGHAN LLOYD Meaghan Lloyd | Director | February 26, 2024 | ||||||||||||
/s/ RON NERSESIAN Ron Nersesian | Director | February 26, 2024 | ||||||||||||
/s/ MARK S. PEEK Mark S. Peek | Director | February 26, 2024 | ||||||||||||
/s/ KARA SPRAGUE Kara Sprague | Director | February 26, 2024 | ||||||||||||
/s/ THOMAS W. SWEET Thomas W. Sweet | Director | February 26, 2024 | ||||||||||||
/s/ JOHAN WIBERGH Johan Wibergh | Director | February 26, 2024 | ||||||||||||
83