UNITED STATES
SECURITIES AND EXCHANGE COMMISSION
Washington, D.C. 20549
FORM
ANNUAL REPORT PURSUANT TO SECTION 13 OR 15(d) OF THE SECURITIES EXCHANGE ACT OF 1934 |
for the fiscal year ended
or
TRANSITION REPORT PURSUANT TO SECTION 13 OR 15(d) OF THE SECURITIES EXCHANGE ACT OF 1934 |
Commission file number

(Exact name of Registrant as specified in its charter)
|
||
(State or other jurisdiction of incorporation or organization) |
|
(IRS Employer Identification Number) |
|
|
|
|
||
(Address of principal executive offices) |
|
(Zip Code) |
|
|
|
Registrant’s telephone number, including area code: |
|
( |
|
|
|
|
Securities registered pursuant to Section 12(b) of the Act: |
|
|
|
|
(Title of Class) |
(Trading Symbol) |
(Name of Exchange on Which Registered) |
Indicate by check mark if the registrant is a well-known seasoned issuer, as defined in Rule 405 of the Securities Act.
Indicate by check mark if the registrant is not required to file reports pursuant to Section 13 or Section 15(d) of the Act. Yes ☐
Indicate by check mark whether the registrant (1) has filed all reports required to be filed by Section 13 or 15(d) of the Securities Exchange Act of 1934 during the preceding 12 months (or for such shorter period that the registrant was required to file such reports), and (2) has been subject to such filing requirements for the past 90 days.
Indicate by check mark whether the registrant has submitted electronically every Interactive Data File required to be submitted pursuant to Rule 405 of Regulation S-T (§232.405 of this chapter) during the preceding 12 months (or for such shorter period that the registrant was required to submit such files).
Indicate by check mark whether the registrant is a large accelerated filer, an accelerated filer, a non-accelerated filer, a smaller reporting company, or an emerging growth company. See definition of “large accelerated filer,” “accelerated filer,” “smaller reporting company,” and “emerging growth company” in Rule 12b-2 of the Exchange Act.
☑ |
|
Accelerated filer |
☐ |
|
Non-accelerated filer |
☐ |
|
Smaller reporting company |
|
|
|
|
Emerging growth company |
If an emerging growth company, indicate by check mark if the registrant has elected not to use the extended transition period for complying with any new or revised financial accounting standards provided pursuant to Section 13(a) of the Exchange Act. ☐
Indicate by check mark whether the registrant has filed a report on and attestation to its management’s assessment of the effectiveness of its internal control over financial reporting under Section 404(b) of the Sarbanes-Oxley Act (15 U.S.C. 7262(b)) by the registered public accounting firm that prepared or issued its audit report.
If securities are registered pursuant to Section 12(b) of the Act, indicate by check mark whether the financial statements of the registrant included in the filing reflect the correction of an error to previously issued financial statements.
Indicate by check mark whether any of those error corrections are restatements that required a recovery analysis of incentive-based compensation received by any of the registrant’s executive officers during the relevant recovery period pursuant to §240.10D-1(b). ☐
Indicate by check mark whether the registrant is a shell company (as defined in Rule 12b-2 of the Act.) Yes ☐ No
Based on the closing sales price at June 30, 2023, the last business day of the registrant’s most recently completed second fiscal quarter, the aggregate market value of the shares of common stock held by nonaffiliates of the registrant was approximately $
As of January 31, 2024, there were issued and outstanding
DOCUMENTS INCORPORATED BY REFERENCE
Portions of the Proxy Statement for Trustmark’s 2024 Annual Meeting of Shareholders to be held April 23, 2024 are incorporated by reference into Part III of the Form 10-K report.
TRUSTMARK CORPORATION
ANNUAL REPORT ON FORM 10-K
TABLE OF CONTENTS
PAGE |
||
Item 1. |
3 |
|
Item 1A. |
16 |
|
Item 1B. |
28 |
|
Item 1C. |
28 |
|
Item 2. |
29 |
|
Item 3. |
29 |
|
Item 4. |
29 |
|
|
||
Item 5. |
29 |
|
Item 6. |
32 |
|
Item 7. |
Management’s Discussion and Analysis of Financial Condition and Results of Operations |
33 |
Item 7A. |
66 |
|
Item 8. |
68 |
|
Item 9. |
Changes in and Disagreements with Accountants on Accounting and Financial Disclosure |
144 |
Item 9A. |
144 |
|
Item 9B. |
144 |
|
Item 9C. |
Disclosure Regarding Foreign Jurisdictions that Prevent Inspections |
144 |
|
||
Item 10. |
Directors, Executive Officers of the Registrant and Corporate Governance |
145 |
Item 11. |
145 |
|
Item 12. |
Security Ownership of Certain Beneficial Owners and Management and Related Stockholder Matters |
145 |
Item 13. |
Certain Relationships and Related Transactions, and Director Independence |
145 |
Item 14. |
145 |
|
|
||
Item 15. |
145 |
|
Item 16. |
146 |
|
150 |
||
2
Forward-Looking Statements
Certain statements contained in this Annual Report on Form 10-K constitute forward-looking statements within the meaning of the Private Securities Litigation Reform Act of 1995. You can identify forward-looking statements by words such as “may,” “hope,” “will,” “should,” “expect,” “plan,” “anticipate,” “intend,” “believe,” “estimate,” “predict,” “project,” “potential,” “seek,” “continue,” “could,” “would,” “future” or the negative of those terms or other words of similar meaning. You should read statements that contain these words carefully because they discuss our future expectations or state other “forward-looking” information. These forward-looking statements include, but are not limited to, statements relating to anticipated future operating and financial performance measures, including net interest margin, credit quality, business initiatives, growth opportunities and growth rates, among other things, and encompass any estimate, prediction, expectation, projection, opinion, anticipation, outlook or statement of belief included therein as well as the management assumptions underlying these forward-looking statements. You should be aware that the occurrence of the events described under the caption Item 1A. Risk Factors in this report could have an adverse effect on our business, results of operations and financial condition. Should one or more of these risks materialize, or should any such underlying assumptions prove to be significantly different, actual results may vary significantly from those anticipated, estimated, projected or expected.
Risks that could cause actual results to differ materially from current expectations of Management include, but are not limited to, changes in the level of nonperforming assets and charge-offs, an increase in unemployment levels and slowdowns in economic growth, actions by the Board of Governors of the Federal Reserve System (FRB) that impact the level of market interest rates, local, state and national economic and market conditions, conditions in the housing and real estate markets in the regions in which Trustmark operates and the extent and duration of the current volatility in the credit and financial markets, levels of and volatility in crude oil prices, changes in our ability to measure the fair value of assets in our portfolio, material changes in the level and/or volatility of market interest rates, the impacts related to or resulting from bank failures and other economic and industry volatility, including potential increased regulatory requirements and costs and potential impacts to macroeconomic conditions, the performance and demand for the products and services we offer, including the level and timing of withdrawals from our deposit accounts, the costs and effects of litigation and of unexpected or adverse outcomes in such litigation, our ability to attract noninterest-bearing deposits and other low-cost funds, competition in loan and deposit pricing, as well as the entry of new competitors into our markets through de novo expansion and acquisitions, economic conditions, including the potential impact of issues related to the European financial system and monetary and other governmental actions designed to address credit, securities, and/or commodity markets, the enactment of legislation and changes in existing regulations or enforcement practices or the adoption of new regulations, changes in accounting standards and practices, including changes in the interpretation of existing standards, that affect our consolidated financial statements, changes in consumer spending, borrowings and savings habits, technological changes, changes in the financial performance or condition of our borrowers, changes in our ability to control expenses, greater than expected costs or difficulties related to the integration of acquisitions or new products and lines of business, cyber-attacks and other breaches which could affect our information system security, natural disasters, environmental disasters, pandemics or other health crises, acts of war or terrorism, and other risks described in our filings with the Securities and Exchange Commission (SEC).
Although we believe that the expectations reflected in such forward-looking statements are reasonable, we can give no assurance that such expectations will prove to be correct. Except as required by law, we undertake no obligation to update or revise any of this information, whether as the result of new information, future events or developments or otherwise.
PART I
ITEM 1. BUSINESS
The Corporation
Description of Business
Trustmark Corporation (Trustmark), a Mississippi business corporation incorporated in 1968, is a bank holding company headquartered in Jackson, Mississippi. Trustmark’s principal subsidiary is Trustmark National Bank (TNB), initially chartered by the State of Mississippi in 1889. At December 31, 2023, TNB had total assets of $18.720 billion, which represented approximately 99.99% of the consolidated assets of Trustmark.
Through TNB and its subsidiaries, Trustmark operates as a financial services organization providing banking and other financial solutions through offices and 2,757 full-time equivalent associates (measured at December 31, 2023) located in the states of Alabama (includes the Georgia Loan Production Office (LPO), which are collectively referred to herein as Trustmark's Alabama market region), Florida (primarily in the northwest or “Panhandle” region of that state, which is referred to herein as Trustmark’s Florida market), Mississippi, Tennessee (in the Memphis and Northern Mississippi regions, which are collectively referred to herein as Trustmark’s
3
Tennessee market), and Texas (primarily in Houston, which is referred to herein as Trustmark’s Texas market). The principal products produced and services rendered by TNB and Trustmark’s other subsidiaries are as follows:
Trustmark National Bank
Commercial Banking – TNB provides a full range of commercial banking services to corporations and other business customers. Loans are provided for a variety of general corporate purposes, including financing for commercial and industrial projects, income producing commercial real estate, owner-occupied real estate and construction and land development. TNB also provides deposit services, including checking, savings and money market accounts and certificates of deposit as well as treasury management services.
Consumer Banking – TNB provides banking services to consumers, including checking, savings, and money market accounts as well as certificates of deposit and individual retirement accounts. In addition, TNB provides consumer customers with installment and real estate loans and lines of credit.
Mortgage Banking – TNB provides mortgage banking services, including construction financing, production of conventional and government insured mortgages, secondary marketing and mortgage servicing.
Insurance – TNB provides a competitive array of insurance solutions for business and individual risk management needs. Business insurance offerings include services and specialized products for medical professionals, construction, manufacturing, hospitality, real estate and group life and health plans. Individual customers are also provided life and health insurance, and personal line policies. TNB provides these services through Fisher Brown Bottrell Insurance, Inc. (FBBI), a Mississippi corporation and a wholly-owned subsidiary of TNB, which is based in Jackson, Mississippi.
Wealth Management and Trust Services – TNB offers specialized services and expertise in the areas of wealth management, trust, investment and custodial services for corporate and individual customers. These services include the administration of personal trusts and estates as well as the management of investment accounts for individuals, employee benefit plans and charitable foundations. TNB also provides corporate trust and institutional custody, securities brokerage, financial and estate planning and retirement plan services.
New Market Tax Credits (NMTC) – TNB provides an intermediary vehicle for the provision of loans or investments in Low-Income Communities (LICs) through its subsidiary Southern Community Capital, LLC (SCC). SCC is a Mississippi single member limited liability company, a certified Community Development Entity (CDE) and a wholly-owned subsidiary of TNB. The primary mission of SCC is to provide investment capital for LICs, as defined by Section 45D of the Internal Revenue Code, or for Low-Income Persons (LIPs). As a certified CDE, SCC is able to apply to the Community Development Financial Institutions Fund (CDFI Fund) to receive NMTC allocations to offer investors in exchange for equity investments in qualified projects.
Capital Trust
Trustmark Preferred Capital Trust I (the Trust) is a Delaware trust affiliate and a wholly-owned subsidiary of Trustmark formed in 2006 to facilitate a private placement of $60.0 million in trust preferred securities. As defined in applicable accounting standards, the Trust is considered a variable interest entity for which Trustmark is not the primary beneficiary. Accordingly, the accounts of the Trust are not included in Trustmark’s consolidated financial statements.
Strategy
Trustmark seeks to be a premier diversified financial services company in its markets, providing a broad range of banking, wealth management and insurance solutions to its customers. Trustmark’s products and services are designed to strengthen and expand customer relationships and enhance the organization’s competitive advantages in its markets as well as to provide cross-selling opportunities that will enable Trustmark to continue to diversify its revenue and earnings streams.
4
The following table sets forth summary data regarding Trustmark’s securities, loans, assets, deposits, equity and revenue over the past three years ($ in thousands):
December 31, |
|
2023 |
|
|
2022 |
|
|
2021 |
|
|||
Securities |
|
$ |
3,189,157 |
|
|
$ |
3,518,596 |
|
|
$ |
3,581,414 |
|
Total securities growth (decline) |
|
$ |
(329,439 |
) |
|
$ |
(62,818 |
) |
|
$ |
1,051,527 |
|
Total securities growth (decline) |
|
|
-9.4 |
% |
|
|
-1.8 |
% |
|
|
41.6 |
% |
|
|
|
|
|
|
|
|
|
|
|||
Loans held for investment (LHFI) |
|
$ |
12,950,524 |
|
|
$ |
12,204,039 |
|
|
$ |
10,247,829 |
|
Total loans growth (decline) |
|
$ |
746,485 |
|
|
$ |
1,956,210 |
|
|
$ |
423,305 |
|
Total loans growth (decline) |
|
|
6.1 |
% |
|
|
19.1 |
% |
|
|
4.3 |
% |
|
|
|
|
|
|
|
|
|
|
|||
Assets |
|
$ |
18,722,189 |
|
|
$ |
18,015,478 |
|
|
$ |
17,595,636 |
|
Total assets growth (decline) |
|
$ |
706,711 |
|
|
$ |
419,842 |
|
|
$ |
1,043,796 |
|
Total assets growth (decline) |
|
|
3.9 |
% |
|
|
2.4 |
% |
|
|
6.3 |
% |
|
|
|
|
|
|
|
|
|
|
|||
Deposits |
|
$ |
15,569,763 |
|
|
$ |
14,437,648 |
|
|
$ |
15,087,160 |
|
Total deposits growth (decline) |
|
$ |
1,132,115 |
|
|
$ |
(649,512 |
) |
|
$ |
1,038,396 |
|
Total deposits growth (decline) |
|
|
7.8 |
% |
|
|
-4.3 |
% |
|
|
7.4 |
% |
|
|
|
|
|
|
|
|
|
|
|||
Equity |
|
$ |
1,661,847 |
|
|
$ |
1,492,268 |
|
|
$ |
1,741,311 |
|
Total equity growth (decline) |
|
$ |
169,579 |
|
|
$ |
(249,043 |
) |
|
$ |
194 |
|
Total equity growth (decline) |
|
|
11.4 |
% |
|
|
-14.3 |
% |
|
|
— |
|
|
|
|
|
|
|
|
|
|
|
|||
Years Ended December 31, |
|
|
|
|
|
|
|
|
|
|||
Revenue * |
|
$ |
759,836 |
|
|
$ |
699,852 |
|
|
$ |
640,261 |
|
Total revenue growth (decline) |
|
$ |
59,984 |
|
|
$ |
59,591 |
|
|
$ |
(60,869 |
) |
Total revenue growth (decline) |
|
|
8.6 |
% |
|
|
9.3 |
% |
|
|
-8.7 |
% |
* Consistent with Trustmark’s audited financial statements, revenue is defined as net interest income plus noninterest income.
For additional information regarding the general development of Trustmark’s business, see Part II. Item 6. – Selected Financial Data and Item 7. – Management’s Discussion and Analysis of Financial Condition and Results of Operations of this report.
Overview of Lending Business
Trustmark categorizes loans on its balance sheet into two categories. These categories are described in more detail in Note 1 – Significant Accounting Policies included in Part II. Item 8. - Financial Statements and Supplementary Data of this report.
The following discussion briefly summarizes Trustmark’s lending business by focusing on LHFI and LHFS and includes a discussion of the risks inherent in these loans, Trustmark’s underwriting policies for its loans and the characteristics of the real estate loan component of these loans.
As a general matter, extending credit to businesses and consumers exposes Trustmark to credit risk, which is the risk that the principal balance and any related interest may not be collected according to the original terms due to the inability or unwillingness of the borrower to repay the loan. Trustmark mitigates credit risk through a set of internal controls, which includes adherence to conservative lending practices and underwriting guidelines, collateral monitoring, and oversight of its borrower’s financial performance and collateral. The risks inherent in specific subsets of lending are discussed below.
LHFI Secured by Construction, Land Development, and Other Land – Construction and land development loans include loans for both commercial and residential properties to builders/developers, other commercial borrowers and consumers. This category also includes loans secured by vacant land, except land known to be used or usable for agricultural purposes, such as crop and livestock production. Repayment is normally derived from the sale of the underlying property or from permanent financing, which refinances Trustmark’s
5
initial loan. Trustmark’s engagement in this type of lending is generally extended to those builders and developers exhibiting the highest credit quality with significant equity invested in the project and is primarily restricted to projects within Trustmark’s geographic markets. The underwriting process for these loans includes analysis of the financial position and strength of both the borrower and guarantor, experience with similar projects in the past, market demand and prospects for successful completion of the proposed project within the established budget and schedule, values of underlying collateral and availability of permanent financing. Risk within this portfolio is mitigated through adherence to policies and lending limits, periodic target credit reviews of the different segments of this portfolio, inspection of projects throughout the life of the loan and routine monitoring of financial information and collateral values as they are updated.
Inherent in real estate construction lending is the risk that the full value of the collateral does not exist at the time the loan is granted. Construction lending also inherently includes the risk associated with a borrower’s ability to successfully complete a proposed project on time and within budget. Further, adverse changes in the market occurring between the start of construction and completion of the projects can result in slower sales or rental rates and lower sales prices than originally anticipated which could impact the underlying real estate collateral values and timely and full repayment of these loans. Rising interest rates can adversely affect the cost of construction and the financial viability of real estate projects. Higher interest rates may also result in higher capitalization rates, thereby reducing a property’s value. As a result of this risk profile, LHFI secured by construction, land development and other land are considered to be higher risks than other real estate loans.
LHFI and LHFS Secured by Residential Properties – Residential real estate loans consist of first and junior liens on residential properties that are extended in the geographic markets in which Trustmark operates as well as mortgage products, originated and purchased, that are underwritten to secondary market standards. Credit underwriting standards include evaluation of the borrower’s credit history and repayment capacity, including verification of income and valuation of collateral. Portfolio performance is continuously evaluated through monitoring of repayment performance.
Credit performance of consumer residential real estate loans is highly dependent on housing values and household income which, in turn are highly dependent on national, regional and local economic factors. Rising interest rates, rising unemployment rates and other adverse changes in these economies may have a negative effect on the ability of Trustmark’s borrowers to repay these loans and negatively affect value of the underlying residential real estate collateral.
LHFI Secured by Nonfarm, Nonresidential Properties (NFNR LHFI) – Trustmark provides financing for both owner-occupied commercial real estate as well as income-producing commercial real estate. Trustmark seeks to maintain a balance of owner-occupied and income-producing real estate loans that moderates its risk to the specific risks of each type of loan. Commercial real estate term loans are typically collateralized by liens on real property. Both types of commercial real estate loans are underwritten to lending policies that include maximum loan-to-value ratios, minimum equity requirements, acceptable amortization periods and minimum debt service coverage requirements, based on property type. Income-producing commercial real estate loans also generally require substantial equity and are subject to exposure limits for a single project. All exceptions to established guidelines are subject to stringent internal review and require specific approval. As with commercial loans, the borrower’s financial strength and capacity to repay their obligations remain the primary focus of underwriting. Financial strength is evaluated based upon analytical tools that consider historical and projected cash flows and performance in addition to analysis of the proposed project for income-producing properties. Additional support offered by guarantors is also considered.
Risk for owner-occupied commercial real estate is driven by the creditworthiness of the underlying borrowers, particularly cash flow from the borrowers’ business operations as well as the risk of a shortfall in collateral. Credit performance of loans secured by commercial income-producing real estate can be negatively affected by national, regional and local economic conditions, which may result in deteriorating tenant credit profiles, tenant losses, reduced rental/lease rates and higher than anticipated vacancy rates, all contributing to declines in value or liquidity of the underlying real estate collateral. Other factors, such as increasing interest rates, may result in higher capitalization rates, thereby reducing a property’s value.
Commercial and Industrial LHFI – Commercial loans (other than commercial loans related to real estate assets, which are summarized above) are made to many types of businesses for various purposes, such as short-term working capital loans that are usually secured by accounts receivable and inventory, equipment and fixed asset purchases that are secured by those assets and term financing for those within Trustmark’s geographic markets. Trustmark’s credit underwriting process for commercial loans includes analysis of historical and projected cash flows and performance, evaluation of financial strength of both borrowers and guarantors as reflected in current and detailed financial information and evaluation of underlying collateral to support the credit. Credit risk within the commercial loan portfolio is managed through adherence to specific commercial lending policies and internally established lending authorities, diversification within the portfolio and monitoring of the portfolio on a continuing basis.
Credit risk in commercial and industrial loans can arise due to fluctuations in borrowers’ financial condition, deterioration in collateral values and changes in market conditions. The credit risk inherent in these loans depends on, to a significant degree, the general economic
6
conditions of these areas. Further, credit risk can increase if Trustmark’s loans are concentrated to borrowers engaged in the same or similar activities, or to groups of borrowers who may be uniquely or disproportionately affected by market or economic conditions.
Consumer LHFI – Consumer credit includes loans to individuals for household and personal items, automobile purchases, unsecured loans, personal lines of credit and credit cards. All consumer loans are subject to a standardized underwriting process through Trustmark’s consumer loan center, with emphasis placed upon the borrower’s credit evaluation and historical performance, income evaluation and valuation of collateral (where applicable).
Similar to residential real estate loan portfolios, an inherent risk factor in consumer loans is that they are dependent on national, regional and local economic factors that affect employment in the markets where these loans are originated. Generally, consumer loan portfolios consist of a large number of relatively small-balance loans, some of which are originated as unsecured credit (credit cards and some personal lines of credit), and as such, do not have collateral as a secondary source of repayment. Consumer loans generally pose heightened risks of collectability and loss when compared to other loan types.
Other LHFI – Other loans primarily consist of loans to non-depository financial institutions, such as mortgage companies, finance companies and other financial intermediaries, loans to state and political subdivisions, and loans to non-profit and charitable organizations. These loans are underwritten based on the specific nature or purpose of the loan and underlying collateral with special consideration given to the specific source of repayment for the loan.
Similar to commercial and industrial loans, inherent risk in other loans can arise due to fluctuations in borrowers’ financial condition, deterioration in collateral values and changes in market and economic conditions. Loans to state and political subdivisions have the added inherent risk of being somewhat dependent on the ability and capacity of those entities to generate tax and other revenue to repay the loans. Loans to non-profit and charitable organizations are dependent on those organizations’ ability to generate revenue through their fundraising efforts and other forms of financial support, which can be susceptible to economic downturns.
Recent Economic and Industry Developments
Economic activity improved slightly during 2023; however, economic concerns remain as a result of the cumulative weight of uncertainty regarding the potential economic impact of geopolitical developments, such as the conflicts in Ukraine and the Middle East, inflation, the consequences of bank failures in the first half of 2023 and other economic and industry volatility, the 2024 political cycle in the United States, supply chain issues, higher energy prices and broader price pressures. Doubts surrounding the near-term direction of global markets and the potential impact on the United States economy are expected to persist for the near term. While Trustmark's customer base is wholly domestic, international economic conditions affect domestic economic conditions, and thus may have an impact upon Trustmark's financial condition or results of operations.
Market interest rates began to rise during 2022 after an extended period at historical lows. Starting in March 2022, the FRB began raising the target federal funds rate for the first time in three years and continued with multiple increases throughout 2022 and 2023, up to a range of 5.25% to 5.50% as of December 2023. In addition, the FRB increased the interest that it pays on reserves multiple times during 2022 and 2023 from 0.10% to 5.40% as of December 2023. As interest rates have increased, so have competitive pressures on the deposit cost of funds. This has been exacerbated by bank failures and the resulting heightened competition for deposits, which has also affected the interest that Trustmark pays on deposits. It is not possible to predict the pace and magnitude of changes in interest rates, or the impact rate changes will have on Trustmark's results of operations.
In the January 2024 “Summary of Commentary on Current Economic Conditions by Federal Reserve District,” the twelve Federal Reserve Districts’ reports suggested that economic activity during the reporting period (covering the period from November 18, 2023 through January 8, 2024) was mixed across Districts, with three Districts reporting modest increases in overall activity, eight Districts reporting little or no change and one District reporting a moderate decline. Reports by the twelve Federal Reserve Districts noted the following during the reporting period:
7
Reports by the Federal Reserve’s Sixth District, Atlanta (which includes Trustmark’s Alabama, Florida and Mississippi market regions), Eighth District, St. Louis (which includes Trustmark’s Tennessee market region), and Eleventh District, Dallas (which includes Trustmark’s Texas market region), noted similar findings for the reporting period as those discussed above. The Federal Reserve’s Sixth District also noted lending increased during the reporting period, especially for multifamily and home equity loans; however, consumer lending contracted overall, alongside a rise in delinquencies in credit cards, auto loans and unsecured personal loans. The Federal Reserve's Sixth District reported that demand and large time deposit balances continued to increase as financial institutions paid higher interest rates on deposits; however, these higher funding costs have led to earnings concerns resulting in some banks restructuring securities portfolios and reinvesting proceeds into higher-yielding securities to protect margins. The Federal Reserve’s Eighth District also reported that loan growth slowed at a modest pace during the reporting period, but banking conditions and lending activity remained healthy. The Federal Reserve’s Eighth District also noted that commercial and industrial loan growth decreased slightly despite an increase in overall loan volume, demand for loans continues to be lower than the prior year and an ongoing modest decline in real estate loan growth. The Federal Reserve’s Eighth District also reported that total deposit growth increased modestly although faster than the national rate. The Federal Reserve’s Eleventh District also reported loan volumes stabilized during the reporting period and the pace of credit tightening decelerated, loan demand continued to decline, though at a slower pace, loan nonperformance continued to rise, still largely driven by consumer loans, and loan pricing continued to increase but at a slower rate. The Federal Reserve’s Eleventh District also noted that bankers reported increased core deposit volumes and although banking outlooks remain pessimistic and future business activity and loan demand are expected to decline, the rate of decline is anticipated to be milder than prior expectations.
The rising interest rate environment during 2022 and 2023, the resulting industry-wide reduction in the fair value of securities portfolios and the bank runs that led to the failures of some financial institutions in March 2023, among other events, have resulted in a current state of volatility and uncertainty with respect to the health of the United States banking system. There is heightened awareness around liquidity, uninsured deposits, deposit composition, unrecognized investment losses and capital.
For additional discussion of the impact of the current economic environment on the financial condition and results of operations of Trustmark and its subsidiaries, see Part II. Item 7. – Management’s Discussion and Analysis of Financial Condition and Results of Operations of this report.
Competition
There is significant competition within the banking and financial services industry in the markets in which Trustmark operates. Changes in regulation, technology and product delivery systems have resulted in an increasingly competitive environment. Trustmark expects to continue to face increasing competition from online and traditional financial institutions seeking to attract customers by providing access to similar services and products.
Trustmark and its subsidiaries compete with national and state-chartered banking institutions of comparable or larger size and resources and with smaller community banking organizations. Trustmark has numerous local, regional and national nonbank competitors, including savings and loan associations, credit unions, mortgage companies, insurance companies, finance companies, financial service operations of major retailers, investment brokerage and financial advisory firms and mutual fund companies. Because nonbank financial institutions are not subject to the same regulatory restrictions as banks and bank holding companies, they can often operate with greater flexibility and lower cost structures. Currently, Trustmark does not face meaningful competition from international banks in its markets, although that could change in the future.
At June 30, 2023, Trustmark’s deposit market share ranked within the top three positions in 56.0% of the 55 counties served and within the top five positions in 69.0% of the counties served. The following table presents Federal Deposit Insurance Corporation (FDIC) deposit data regarding TNB’s deposit market share by state as of June 30, 2023. The FDIC deposit market share data presented below does not align with Trustmark’s reported geographic market regions, which in some instances cross state lines, and Trustmark’s
8
geographic coverage within certain states presented below is not statewide (see the section captioned “Description of Business” above).
State |
|
Deposit Market Share |
|
|
Alabama |
|
|
1.80 |
% |
Florida |
|
|
0.17 |
% |
Mississippi |
|
|
12.87 |
% |
Tennessee |
|
|
0.33 |
% |
Texas |
|
|
0.04 |
% |
Services provided by the Wealth Management Segment face competition from many national, regional and local financial institutions. Companies that offer broad services similar to those provided by Trustmark, such as other banks, trust companies and full-service brokerage firms, as well as companies that specialize in particular services offered by Trustmark, such as investment advisors and mutual fund providers, all compete with Trustmark’s Wealth Management Segment.
Trustmark’s insurance subsidiary faces competition from local, regional and national insurance companies, independent insurance agencies as well as from other financial institutions offering insurance products.
Trustmark’s ability to compete effectively is a result of providing customers with desired products and services in a convenient and cost-effective manner. Customers for commercial, consumer and mortgage banking as well as wealth management and insurance services are influenced by convenience, quality of service, personal contacts, availability of products and services and competitive pricing. Trustmark continually reviews its products, locations, alternative delivery channels, and pricing strategies to maintain and enhance its competitive position. While Trustmark’s position varies by market, Management believes it can compete effectively as a result of the quality of Trustmark’s products and services, local market knowledge and awareness of customer needs.
Supervision and Regulation
The following discussion sets forth material elements of the regulatory framework applicable to bank holding companies and their subsidiaries and provides specific information relevant to Trustmark. The discussion is a summary of detailed statutes, regulations and policies. The descriptions are not intended to be complete summaries of the statutes, regulations and policies referenced therein. Such statutes, regulations and policies are continually under the review of the United States Congress and state legislatures as well as federal and state regulatory agencies. A change in statutes, regulations or policies could have a material impact on the business of Trustmark and its subsidiaries.
Regulation of Trustmark
Trustmark is a registered bank holding company under the Bank Holding Company Act of 1956 (BHC Act). Trustmark and its nonbank subsidiaries are therefore subject to the supervision, examination, enforcement and reporting requirements of the BHC Act, the Federal Deposit Insurance Act (FDI Act), the regulations of the FRB and certain of the requirements imposed by the Dodd-Frank Wall Street Reform and Consumer Protection Act (Dodd-Frank Act), as amended by the Economic Growth, Regulatory Relief and Consumer Protection Act (EGRRCPA).
Federal Oversight Over Mergers and Acquisitions, Investments and Branching
The BHC Act requires every bank holding company to obtain the prior approval of the FRB before: (i) it may acquire direct or indirect ownership or control of any voting shares of any bank if, after such acquisition, the bank holding company will directly or indirectly own or control 5.0% or more of the voting shares of the bank; (ii) it or any of its subsidiaries, other than a bank, may acquire all or substantially all of the assets of any bank; or (iii) it may merge or consolidate with any other bank holding company. The BHC Act further requires the FRB to consider the competitive impact of the transaction, the financial and managerial resources and future prospects of the bank holding companies and banks concerned and the convenience and needs of the community to be served, including the applicant’s record of performance under the Community Reinvestment Act (CRA). The FRB is also required to take into account in evaluating such a transaction the effectiveness of the parties in combating money laundering activities. Provisions of the FDI Act known as the Bank Merger Act impose similar approval standards for an insured depository institution to merge with another insured depository institution.
The BHC Act, as amended by the interstate banking provisions of the Riegle-Neal Interstate Banking and Branching Efficiency Act of 1994 (Riegle-Neal Act), permits a bank holding company, such as Trustmark, to acquire a bank located in any other state, regardless of state law to the contrary, subject to certain deposit-percentage, aging requirements, and other restrictions, if the company is
9
well-capitalized. The Riegle-Neal Act also generally permits national and state-chartered banks to branch interstate through acquisitions of banks in other states, if the resulting institution would be well-capitalized and well-managed.
In addition, the Office of the Comptroller of the Currency (OCC) has the authority to approve applications by national banks to establish de novo branches, including, under the Riegle-Neal Act, in states other than the bank’s home state if the law of the state in which the branch is located, or is to be located, would permit establishment of the branch if the bank were a state bank chartered by such state.
The BHC Act also generally requires FRB approval for a bank holding company’s acquisition of a company that is not an insured depository institution. Bank holding companies generally may engage, directly or indirectly, only in banking and such other activities as are determined by the FRB to be closely related to banking. Additionally, a provision of the BHC Act known as the Volcker Rule places limits on the ability of Trustmark and TNB to acquire or retain ownership interests in, or act as sponsor to, certain investment funds, including hedge funds and private equity funds, or to engage in proprietary trading (i.e., engaging as principal in any purchase or sale of one or more financial instruments for a trading account).
Certain acquisitions of Trustmark’s voting stock may be subject to regulatory approval or notice under federal law. Under the Change in Bank Control Act and BHC Act, a person or company that directly or indirectly acquires control of a bank holding company or bank must obtain the non-objection or approval of the institution’s appropriate federal banking agency in advance of the acquisition. For a publicly-traded bank holding company such as Trustmark, control for purposes of the Change in Bank Control Act is presumed to exist if the acquirer will have 10% or more of any class of the company’s voting securities.
Source of Strength
Under the FDI Act, Trustmark is expected to act as a source of financial and managerial strength to TNB. Under this policy, a bank holding company is expected to commit resources to support its bank subsidiary, including at times when the holding company may not be inclined or in a financial position to provide it.
Capital Adequacy
Bank holding companies and banks are subject to various regulatory capital requirements administered by state and federal bank regulatory agencies. Capital adequacy regulations involve quantitative measures of assets, liabilities, and certain off-balance sheet items calculated under regulatory accounting practices. Capital amounts and classifications are also subject to qualitative judgments by regulators about components, risk weighting and other factors. The FRB and the OCC, the primary regulators of Trustmark and TNB, respectively, have established substantially similar minimum risk-based capital ratio and leverage ratio requirements for bank holding companies and banks.
Under capital requirements applicable to Trustmark and TNB, Trustmark and TNB are required to meet a common equity Tier 1 capital to risk-weighted assets ratio of at least 7.0% (a minimum of 4.5% plus a capital conservation buffer of 2.5%), a Tier 1 capital to risk-weighted assets ratio of at least 8.5% (a minimum of 6.0% plus a capital conservation buffer of 2.5%), a total capital to risk-weighted assets ratio of at least 10.5% (a minimum of 8.0% plus a capital conservation buffer of 2.5%), and a leverage ratio of Tier 1 capital to total consolidated assets of at least 4.0%.
For purposes of calculating the denominator of the risk-based capital ratios, a banking institution’s assets and some of its specified off-balance sheet commitments and obligations are assigned to various risk categories. For purposes of calculating the numerator of the capital ratios, capital, at both the holding company and bank level, is classified in one of three tiers depending on the “quality” and loss-absorbing features of the capital instrument. Common equity Tier 1 capital is predominantly comprised of common stock instruments (including related surplus) and retained earnings, net of treasury stock, and after making necessary capital deductions and adjustments. Tier 1 capital is comprised of common equity Tier 1 capital and additional Tier 1 capital, which includes non-cumulative perpetual preferred stock and similar instruments meeting specified eligibility criteria (including related surplus). Newly issued trust preferred securities and cumulative perpetual preferred stock may not be included in Tier 1 capital. Smaller depository institution holding companies (those with assets of less than $15 billion as of year-end 2009, including Trustmark) and most mutual holding companies are generally allowed to continue to count as Tier 1 capital most outstanding trust preferred securities and other non-qualifying securities that were issued prior to May 19, 2010 (up to a limit of 25% of Tier 1 capital, excluding non-qualifying capital instruments) rather than phasing such securities out of regulatory capital. However, a smaller depository institution holding company that has $15 billion or more in assets following an acquisition of another depository institution holding company generally is no longer allowed to count outstanding non-qualifying capital instruments toward its Tier 1 capital. Trustmark currently has outstanding trust preferred securities that are permitted to continue to count as Tier 1 capital up to the regulatory limit. Total capital is comprised of Tier 1 capital and Tier 2 capital, which includes certain subordinated debt with a minimum original maturity of five years (including related surplus) and a limited amount of allowance for loan losses. Newly issued trust preferred securities and cumulative perpetual preferred stock generally
10
may be included in Tier 2 capital, provided they do not include features that are disallowed by the capital rules, such as the acceleration of principal other than in the event of a bankruptcy, insolvency, or receivership of the issuer.
Failure to meet minimum capital requirements could subject a bank to a variety of enforcement remedies, including issuance of a capital directive, the termination of deposit insurance by the FDIC and certain other restrictions on its business. An institution’s failure to exceed the capital conservation buffer with common equity Tier 1 capital would result in limitations on an institution’s ability to make capital distributions and discretionary bonus payments.
In addition, the FDI Act’s “prompt corrective action” framework identifies five capital categories for insured depository institutions: well-capitalized, adequately capitalized, undercapitalized, significantly undercapitalized and critically undercapitalized. For an insured depository institution to be “well-capitalized,” it must have a common equity Tier 1 capital ratio of at least 6.5%, a Tier 1 capital ratio of at least 8.0%, a total capital ratio of at least 10.0% and a leverage ratio of at least 5.0%, and must not be subject to any written agreement, order or capital directive or prompt corrective action directive issued by its primary federal regulator to meet and maintain a specific capital level for any capital measure. An insured depository institution is subject to differential regulation corresponding to the capital category within which the institution falls. For example, an insured depository institution is generally prohibited from making capital distributions, including paying dividends, or paying management fees to a holding company, if the institution would thereafter be undercapitalized.
At December 31, 2023, Trustmark exceeded its minimum capital requirements with common equity Tier 1 capital, Tier 1 capital and total capital equal to 10.04%, 10.44% and 12.29% of its total risk-weighted assets, respectively. At December 31, 2023, TNB also exceeded these requirements with common equity Tier 1 capital, Tier 1 capital and total capital equal to 10.58%, 10.58% and 11.61% of its total risk-weighted assets, respectively. At December 31, 2023, the leverage ratios for Trustmark and TNB were 8.62% and 8.75%, respectively. At December 31, 2023, TNB was well-capitalized based on the ratios and guidelines described above.
In December 2018, the federal banking agencies issued a final rule that allows institutions to elect to phase in the regulatory capital effects of the Current Expected Credit Losses (CECL) accounting standard over three years. In addition, as a result of the Coronavirus Aid, Relief, and Economic Security Act (the CARES Act) enacted on March 27, 2020 in response to the COVID-19 pandemic, the federal bank regulatory agencies issued rules that allow banking organizations that implemented CECL in 2020 to elect to mitigate the effects of the CECL accounting standard on their regulatory capital for two years. This two-year delay is in addition to the three-year transition period that the agencies had already made available. Trustmark elected to defer the regulatory capital effects of CECL in accordance with these rules, which largely delayed the effects of the adoption of CECL on its regulatory capital through December 31, 2021. The effects are being phased-in over a three-year period from January 1, 2022 through December 31, 2024.
Payment of Dividends and Stock Repurchases
Trustmark is limited in its ability to pay dividends or repurchase its stock by the FRB, including if doing so would be an unsafe or unsound banking practice. In addition, the FRB has adopted the policy that a bank holding company should pay cash dividends only to the extent that the company’s net income for the past year is sufficient to cover the cash dividends, and that the company’s rate of earning retention is consistent with the company’s capital needs, asset quality and overall financial condition. In addition, a bank holding company is required to consult with or notify the FRB prior to purchasing or redeeming its outstanding equity securities in certain circumstances, including if the gross consideration for the purchase or redemption, when aggregated with the net consideration paid by the company for all such purchases or redemptions during the preceding twelve months, is equal to 10% or more of the company’s consolidated net worth. A bank holding company that is well-capitalized, well-managed and not the subject of any unresolved supervisory issues is exempt from this notice requirement.
Anti-Money Laundering (AML) Initiatives and Sanctions Compliance
Trustmark and TNB are subject to extensive laws and regulations aimed at combating money laundering and terrorist financing, including the USA Patriot Act of 2001 (USA Patriot Act) and the Bank Secrecy Act. Regulations implementing these statutes impose obligations on financial institutions to maintain appropriate policies, procedures and controls to detect, prevent and report money laundering and terrorist financing and to verify the identity of their customers and of beneficial owners of their legal entity customers. Failure of a financial institution to maintain and implement adequate programs to combat money laundering and terrorist financing, or to comply with all of the relevant laws or regulations, could have serious legal and financial consequences for the institution. The federal Financial Crimes Enforcement Network of the Department of the Treasury, in addition to federal bank regulatory agencies, is authorized to impose significant civil money penalties for violations of these requirements, and has recently engaged in coordinated enforcement efforts with state and federal banking regulators, the U.S. Department of Justice, the Consumer Financial Protection Bureau (CFPB), the Drug Enforcement Administration and the Internal Revenue Service. Violations of AML requirements can also lead to criminal penalties. In addition, the federal banking agencies are required to consider the effectiveness of a financial institution’s AML activities when reviewing proposed bank mergers and bank holding company acquisitions.
11
The U.S. Department of the Treasury’s Office of Foreign Assets Control (OFAC) is responsible for helping to ensure that U.S. entities do not engage in transactions with certain prohibited parties, as defined by various Executive Orders and Acts of Congress. OFAC administers and enforces economic and trade sanctions programs, including publishing lists of persons, organizations, and countries suspected of aiding, harboring or engaging in terrorist acts, known as Specially Designated Nationals and Blocked Persons. OFAC regulations generally require either the blocking of accounts or other property of specified entities or individuals, but they may also require the rejection of certain transactions involving specified entities or individuals. Trustmark maintains policies, procedures and other internal controls designed to comply with these sanctions programs.
Other Federal Regulation of Trustmark
In addition to being regulated as a bank holding company, Trustmark is subject to regulation by the State of Mississippi under its general business corporation laws. Trustmark is also subject to the disclosure and other regulatory requirements of the Securities Act of 1933 and the Securities Exchange Act of 1934, as administered by the SEC.
Regulation of TNB
TNB is a national bank and, as such, is subject to extensive regulation by the OCC and, to a lesser extent, by the FDIC. In addition, as a large provider of consumer financial services, TNB is subject to regulation, supervision, enforcement and examination by the CFPB. Almost every area of the operations and financial condition of TNB is subject to extensive regulation and supervision and to various requirements and restrictions under federal and state law including loans, reserves, investments, issuance of securities, establishment of branches, capital adequacy, liquidity, earnings, dividends, management practices and the provision of services. TNB is subject to supervision, examination, enforcement and reporting requirements under the National Bank Act, the Federal Reserve Act, the FDI Act, regulations of the OCC and certain of the requirements imposed by the Dodd-Frank Act. Trustmark and TNB are also subject to a wide range of consumer protection laws and regulations.
Restrictions on Lending, Insider Transactions and Affiliate Transactions
National banks are limited in the amounts they may lend to one borrower and the amount they may lend to insiders. These single counterparty and insider lending limits extend to loans, derivative transactions, repurchase agreements, reverse repurchase agreements and securities lending or borrowing transactions. In addition, the FDI Act imposes restrictions on insured depository institutions’ purchases of assets from insiders.
Under section 22 of the Federal Reserve Act, as implemented by the FRB’s Regulation O, restrictions also apply to extensions of credit by a bank to its executive officers, directors, principal shareholders and their related interests, and to similar individuals at the holding company or affiliates. In general, such extensions of credit (i) may not exceed certain dollar limitations, (ii) must be made on substantially the same terms, including interest rates and collateral, as those prevailing at the time for comparable transactions with third parties and (iii) must not involve more than the normal risk of repayment or present other unfavorable features.
Sections 23A and 23B of the Federal Reserve Act establish parameters for an insured bank to conduct “covered transactions” with its affiliates, generally (i) limiting the extent to which the bank or its subsidiaries may engage in “covered transactions” with any one affiliate to an amount equal to 10% of the bank’s capital stock and surplus, and limiting the aggregate of all such transactions with all affiliates to an amount equal to 20% of the bank’s capital stock and surplus, and (ii) requiring that all such transactions be on terms substantially the same, or at least as favorable, to the bank or subsidiary as those that would be provided to a non-affiliate. In addition, an insured bank’s loans to affiliates must be fully collateralized. The term “covered transaction” includes the making of loans to the affiliate, purchase of assets from the affiliate, issuance of a guarantee on behalf of the affiliate and several other types of transactions.
Payment of Dividends
The principal source of Trustmark’s cash revenue is dividends from TNB. There are various legal and regulatory provisions that limit the amount of dividends TNB can pay to Trustmark without regulatory approval. Under the National Bank Act, approval of the OCC is required if the total of all dividends declared in any calendar year exceeds the total of TNB’s net income for that year combined with its retained net income from the preceding two years. Also, under the National Bank Act, TNB may not pay any dividends in excess of undivided profits (retained earnings).
Community Reinvestment Act
The Community Reinvestment Act (CRA) requires an insured depository institution’s appropriate federal banking regulator to evaluate the institution's record of meeting the credit needs of its entire community, including low- and moderate-income neighborhoods, and to
12
consider this record in its evaluation of certain applications to banking regulators, such as an application for approval of a merger or the establishment of a branch.
As of its last examination from the OCC, TNB received a CRA rating of “Needs to Improve.” The evaluation covered activities in the period from January 1, 2019 through December 31, 2021. TNB received performance ratings of “High Satisfactory” on each of the three individual components of the CRA examination. The TNB’s final overall rating, however, was downgraded from “Satisfactory” to “Needs to Improve” as a result of alleged discriminatory credit practices in the Memphis Metropolitan Statistical Area between 2014 and 2018. As previously disclosed on October 22, 2021, TNB entered into a consent order with the OCC and a separate consent order jointly with the U.S. Department of Justice and the CFPB, to resolve allegations that TNB previously violated the FHA, the Equal Credit Opportunity Act and the Consumer Financial Protection Act within the Memphis Metropolitan Statistical Area. The OCC Performance Evaluation states that “Following the findings, the bank undertook significant corrective actions to address the impact of these practices and ensure that the conduct does not recur.”
A “Needs to Improve” rating adversely affects TNB’s ability to obtain regulatory approvals to engage in certain expansionary activities, including certain mergers and acquisitions and the establishment of bank branches. These limitations will remain in place until TNB receives a CRA rating of at least “Satisfactory” following a subsequent CRA examination. The precise timing of the completion of that examination and any results therefrom will not be known until later.
On October 24, 2023, the federal banking agencies released a final rule significantly revising the framework that the agencies use to evaluate banks’ records of meeting the credit needs of their entire communities under the CRA. Under the revised framework, banks with assets of at least $2 billion, including TNB, are considered large banks and, accordingly, will have their retail lending, retail services and products, community development financing and community development services subject to periodic evaluation under complex, multi-part standards. Large banks will be subject to enhanced data collection and reporting requirements, with additional data collection and reporting requirements applying to banks, such as TNB, with assets greater than $10 billion. Depending on a large bank’s geographic concentrations of lending, the evaluation of retail lending may include assessment areas in which the bank extends loans but does not operate any deposit-taking facilities, in addition to assessment areas in which the bank has deposit-taking facilities. The rule becomes effective April 1, 2024. Compliance with most provisions of the final rule will be required beginning January 1, 2026, and compliance with the remaining provisions will be required beginning January 1, 2027. Trustmark is evaluating the impact of the final rule.
Consumer Protection Laws
TNB is subject to a number of federal and state laws designed to protect customers and promote lending to various sectors of the economy and population. These consumer protection laws apply to a broad range of TNB’s activities and to various aspects of its business, and include laws relating to interest rates, fair lending, disclosures of credit terms and estimated transaction costs to consumer borrowers, debt collection practices, the use of and the provision of information to consumer reporting agencies and the prohibition of unfair, deceptive or abusive acts or practices in connection with the offer, sale or provision of consumer financial products and services. These laws include the Equal Credit Opportunity Act, the Fair Credit Reporting Act, the Truth in Lending Act, the Home Mortgage Disclosure Act, the Real Estate Settlement Procedures Act, the Fair Debt Collection Practices Act and their state law counterparts. At the federal level, most consumer financial protection laws are administered by the CFPB, which supervises TNB. The CFPB also has authority to issue regulations and has proposed several rules that would restrict various fees that financial institutions can charge consumers, including credit card late fees, overdraft fees and certain insufficient funds (NSF) fees.
Violations of applicable consumer protection laws can result in significant potential liability, including actual damages, restitution and injunctive relief, from litigation brought by customers, state attorneys general and other plaintiffs, as well as enforcement actions by banking regulators and reputational harm.
Many states and local jurisdictions have consumer protection laws analogous, and in addition to, those listed above. While TNB’s activities are governed primarily by federal law, the Dodd-Frank Act potentially narrowed National Bank Act preemption of state consumer financial laws, thereby making TNB and other national banks potentially subject to increased state regulation. The Dodd-Frank Act also codified the Supreme Court’s decision in Cuomo v. Clearing House Association. As a result, State Attorneys General may enforce in a court action “an applicable law” against federally-chartered depository institutions like TNB. In addition, under the Dodd-Frank Act, state attorneys general are authorized to bring civil actions against federally-chartered institutions, like TNB, to enforce regulations prescribed by the CFPB or to secure other remedies.
Finally, the Dodd-Frank Act potentially expanded state regulation over banks by eliminating National Bank Act preemption for national bank operating subsidiaries, including operating subsidiaries of TNB.
13
Financial Privacy Laws and Cybersecurity
The Gramm-Leach-Bliley Financial Services Modernization Act of 1999 (GLB Act) imposed requirements related to the privacy of customer financial information. In accordance with the GLB Act, federal bank regulators adopted rules that limit the ability of banks and other financial institutions to disclose nonpublic information about consumers to nonaffiliated third parties. The GLB Act also requires disclosure of privacy policies to consumers and, in some circumstances, allows consumers to prevent disclosure of certain personal information to a nonaffiliated third party. The privacy provisions of the GLB Act affect how consumer information is transmitted through diversified financial companies and conveyed to outside vendors. Trustmark recognizes the need to comply with legal and regulatory requirements that affect its customers’ privacy.
In addition, the federal banking agencies pay close attention to the cybersecurity practices of banks, and the agencies include review of an institution’s information technology and its ability to thwart cyberattacks in their examinations. An institution’s failure to have adequate cybersecurity safeguards in place can result in supervisory criticism, monetary penalties and/or reputational harm. Additionally, banking organizations are required to notify their primary federal regulator of significant computer security incidents within 36 hours of determining that such an incident has occurred.
Debit Interchange Regulation
The FRB has issued rules under the Electronic Fund Transfer Act (EFTA), as amended by the Dodd-Frank Act, to limit interchange fees that an issuer with $10.0 billion or more in assets, such as TNB, may receive or charge for an electronic debit card transaction. Under the FRB’s rules, the maximum permissible interchange fee that an issuer may receive for an electronic debit transaction is the sum of 21 cents per transaction and five basis points multiplied by the value of the transaction. In addition, the FRB’s rules allow for an upward adjustment of no more than one cent to an issuer’s debit card interchange fee if the issuer develops and implements policies and procedures reasonably designed to achieve the fraud-prevention standards set out in the rule.
In October 2023, the FRB proposed changes to its EFTA rules that would decrease the maximum interchange fees that an issuer may receive for an electronic debit transaction to the sum of 14.4 cents and four basis points multiplied by the value of the transaction and increase the fraud prevention adjustment to 1.3 cents. Trustmark is evaluating the impact of this proposal.
The FRB also has established rules governing routing and exclusivity that require debt card issuers to offer two unaffiliated networks for routing transactions on each debit or prepaid product.
FDIC Deposit Insurance Assessments
The deposits of TNB are insured by the Deposit Insurance Fund (DIF), as administered by the FDIC, and, accordingly, are subject to deposit insurance assessments to maintain the DIF at minimum levels required by statute.
The FDIC uses a risk-based assessment system that imposes insurance premiums as determined by multiplying an insured bank’s assessment base by its assessment rate. A bank’s deposit insurance assessment base is generally equal to the bank’s total assets minus its average tangible equity during the assessment period.
The FDIC determines a bank’s assessment rate within a range of base assessment rates using a risk scorecard that takes into account the bank’s financial ratios and supervisory rating (the CAMELS composite rating), among other factors. The CAMELS rating system is a supervisory rating system developed to classify a bank’s overall condition by taking into account capital adequacy, assets, management capability, earnings, liquidity and sensitivity to market and interest rate risk. The methodology that the FDIC uses to calculate assessment amounts is also based on the FDIC’s designated reserve ratio, which is currently 2.0%. Since the outbreak of the COVID-19 pandemic, the amount of total estimated insured deposits has grown rapidly while the funds in the DIF have grown at a normal rate, causing the DIF reserve ratio to fall below the statutory minimum of 1.35%. The FDIC adopted a restoration plan in September 2020, which it amended in June 2022, to restore the DIF reserve ratio to at least 1.35% by September 30, 2028. On October 18, 2022, the FDIC adopted a final rule to increase initial base deposit insurance assessment rates for insured depository institutions by 2 basis points, which began with the first quarterly assessment period of 2023. The increased assessment rate schedules will remain in effect unless and until the DIF reserve ratio meets or exceeds 2.00%. As a result of this rule, the FDIC insurance costs of insured depository institutions, including TNB, have generally increased. TNB incurred an additional $2.6 million of FDIC assessment expense during 2023 as a result of this rule.
On November 16, 2023, the FDIC adopted a final rule implementing a special assessment to recover the loss to the FDIC’s DIF incurred in the receiverships of Silicon Valley Bank and Signature Bank. Under the final rule, the FDIC will collect special assessments at a quarterly rate of 3.36 basis points, or approximately 13.4 basis points annually, over eight quarterly assessment periods beginning with the first quarterly assessment period of 2024. The assessment base for the special assessment is equal to an insured depository
14
institution's estimated uninsured deposits, reported as of December 31, 2022, adjusted to exclude the first $5 billion in estimated uninsured deposits. The FDIC retained the ability to cease collection early, extend the special assessment collection period one or more quarters beyond the initial eight-quarter collection period to collect the difference between estimated or actual losses and the amounts collected, or impose a final shortfall special assessment on a one-time basis after the receiverships for Silicon Valley Bank and Signature Bank terminate. The special assessment is not expected to be material to Trustmark's financial condition or results of operations.
The FDIC may terminate the deposit insurance of any insured depository institution, including the TNB, if the FDIC determines after a hearing that the institution has engaged or is engaging in unsafe or unsound banking practices, is in an unsafe or unsound condition to continue operations or has violated any applicable law, regulation, order or any condition imposed by an agreement with the FDIC. The FDIC also may suspend deposit insurance temporarily during the hearing process for the permanent termination of insurance if the institution has no tangible capital.
In 2023, TNB’s expenses related to deposit insurance premiums totaled $13.5 million.
TNB Subsidiaries
TNB’s nonbanking subsidiaries are subject to a variety of state and federal laws and regulations. FBBI is subject to the insurance laws and regulations of the states in which it is active. SCC is subject to the supervision and regulation of the CDFI Fund and the State of Mississippi.
The GLB Act authorizes national banks to own or control a “financial subsidiary” that engages in activities that are not permissible for national banks to engage in directly. The GLB Act contains a number of provisions dealing with insurance activities by bank subsidiaries. Generally, the GLB Act affirms the role of the states in regulating insurance activities, including the insurance activities of financial subsidiaries of banks, but the GLB Act also preempts certain state laws. As a result of the GLB Act, TNB elected for predecessor subsidiaries that now constitute FBBI to become financial subsidiaries. This enables FBBI to engage in insurance agency activities at any location.
Available Information
Trustmark’s internet address is www.trustmark.com. Information contained on this website is not a part of this report. Trustmark makes available through this address, free of charge, its Annual Report on Form 10-K, Quarterly Reports on Form 10-Q, Current Reports on Form 8-K and amendments to those reports filed or furnished pursuant to Section 13(a) or 15(d) of the Exchange Act as soon as reasonably practicable after such material is electronically filed, or furnished to, the SEC.
Employees
At December 31, 2023, Trustmark employed 2,757 full-time equivalent associates, none of which are represented by a collective bargaining agreement. Trustmark believes its employee relations to be satisfactory.
Information about Executive Officers of Trustmark
As of the filing date, the executive officers of Trustmark and its primary bank subsidiary, TNB, including their ages, positions and principal occupations for the last five years are as follows:
Gerard R. Host, 69
Trustmark Corporation
Chairman since May 2022
Executive Chairman from January 2021 to April 2022
Chairman from April 2020 to December 2020
President and Chief Executive Officer from January 2011 to December 2020
Trustmark National Bank
Chairman since May 2022
Executive Chairman from January 2021 to April 2022
Chairman from April 2020 to December 2020
Chief Executive Officer from January 2011 to December 2020
President from January 2011 to December 2019
15
Duane A. Dewey, 65
Trustmark Corporation
President and Chief Executive Officer since January 2021
Trustmark National Bank
Chief Executive Officer since January 2021
President since January 2020
Chief Operating Officer from January 2019 to December 2020
George T. Chambers, Jr., 64
Trustmark Corporation
Principal Accounting Officer since March 2021
Trustmark National Bank
Executive Vice President and Chief Accounting Officer since March 2021
Senior Vice President and Controller from March 2009 to February 2021
Monica A. Day, 63
Trustmark National Bank
President – Institutional Banking since April 2019
Executive Vice President and Real Estate Banking Manager from May 2017 to April 2019
Robert Barry Harvey, 64
Trustmark National Bank
Chief Credit and Operations Officer since June 2021
Chief Credit Officer from March 2010 to May 2021
Executive Vice President since March 2010
Thomas C. Owens, 59
Trustmark Corporation
Treasurer and Principal Financial Officer since March 2021
Trustmark National Bank
Chief Financial Officer since March 2021
Bank Treasurer from September 2013 to February 2021
Executive Vice President since 2013
W. Arthur Stevens, 59
Trustmark National Bank
President – Retail Banking since September 2011
Maria Luisa "Ria" Sugay, 42
Trustmark National Bank
Bank Treasurer since March 2021
Bank Co-Treasurer from July 2020 to February 2021
Executive Vice President since July 2020
USAA
Director, Asset Liability Management from June 2016 to June 2020
Granville Tate, Jr., 67
Trustmark Corporation
Secretary since December 2015
Trustmark National Bank
Chief Administrative Officer since January 2021
Chief Risk Officer from June 2016 to November 2021
General Counsel from December 2015 to November 2021
Executive Vice President and Secretary since December 2015
ITEM 1A. RISK FACTORS
Trustmark and its subsidiaries could be adversely impacted by various risks and uncertainties, which are difficult to predict. As a financial institution, Trustmark has significant exposure to market risks, including interest rate risk, liquidity risk and credit risk. This
16
section includes a description of the risks, uncertainties and assumptions identified by Management that could, individually or in combination, materially affect Trustmark’s financial condition and results of operations, as well as the value of Trustmark’s financial instruments in general, and Trustmark common stock, in particular. Additional risks and uncertainties that Management currently deems immaterial or is unaware of may also impair Trustmark’s financial condition and results of operations. This report is qualified in its entirety by the risk factors that are identified below.
Risks Related to Trustmark’s Business
Interest Rate Risks
Trustmark’s largest source of revenue (net interest income) is subject to interest rate risk.
Trustmark’s profitability depends to a large extent on net interest income, which is the difference between income on interest-earning assets, such as loans and investment securities, and expense on interest-bearing liabilities, such as deposits and borrowings. Trustmark is exposed to interest rate risk in its core banking activities of lending and deposit taking, since assets and liabilities reprice at different times and by different amounts as interest rates change. Trustmark is unable to predict changes in market interest rates, which are affected by many factors beyond Trustmark’s control, including inflation, recession, unemployment, money supply, domestic and international events and changes in the United States and other financial markets. Market interest rates began to rise during 2022 after an extended period at historical lows. Starting in March 2022, the FRB began raising the target federal funds rate for the first time in three years and continued with multiple increases throughout 2022 and 2023, up to a range of 5.25% to 5.50% as of December 2023. In addition, the FRB increased the interest that it pays on reserves multiple times during 2022 and 2023 from 0.10% to 5.40% as of December 2023. As interest rates have increased, so have competitive pressures on the deposit cost of funds. This has been exacerbated by the bank failures in the first half of 2023 and the resulting heightened competition for deposits, which has also affected the interest that Trustmark pays on deposits. It is not possible to predict the pace and magnitude of changes in interest rates, or the impact rate changes will have on Trustmark's results of operations.
Financial simulation models are the primary tools used by Trustmark to measure interest rate exposure. Using a wide range of scenarios, Management is provided with extensive information on the potential impact to net interest income caused by changes in interest rates. Models are structured to simulate cash flows and accrual characteristics of Trustmark’s balance sheet. Assumptions are made about the direction and volatility of interest rates, the slope of the yield curve and the changing composition of Trustmark’s balance sheet, resulting from both strategic plans and customer behavior. In addition, the model incorporates Management’s assumptions and expectations regarding such factors as loan and deposit growth, pricing, prepayment speeds and spreads between interest rates. Trustmark’s simulation model using static balances at December 31, 2023, estimated that in the event of a hypothetical 200 basis point increase in interest rates, net interest income may increase 0.5%, while a hypothetical 100 basis point increase in interest rates, may increase net interest income 0.3%. In the event of a hypothetical 100 basis point decrease in interest rates using static balances at December 31, 2023, it is estimated net interest income may decrease by 0.4%, while a hypothetical 200 basis point decrease in interest rates, may decrease net interest income 1.0%.
Net interest income is Trustmark’s largest revenue source, and it is important to discuss how Trustmark’s interest rate risk may be influenced by the various factors shown below:
Financial instruments do not respond in a parallel fashion to rising or falling interest rates. This causes asymmetry in the magnitude of changes in net interest income, net economic value and investment income resulting from the hypothetical increases and decreases in interest rates. Therefore, Management monitors interest rate risk and adjusts Trustmark’s investment, funding and hedging strategies to mitigate adverse effects of interest rate shifts on Trustmark’s balance sheet.
17
Trustmark utilizes derivative contracts to hedge the mortgage servicing rights (MSR) in order to offset changes in fair value resulting from changes in interest rate environments. In spite of Trustmark’s due diligence in regard to these hedging strategies, significant risks are involved that, if realized, may prove such strategies to be ineffective, which could adversely affect Trustmark’s financial condition or results of operations. Risks associated with these strategies include the risk that counterparties in any such derivative and other hedging transactions may not perform; the risk that these hedging strategies rely on Management’s assumptions and projections regarding these assets and general market factors, including prepayment risk, basis risk, market volatility and changes in the shape of the yield curve, and that these assumptions and projections may prove to be incorrect; the risk that these hedging strategies do not adequately mitigate the impact of changes in interest rates, prepayment speeds or other forecasted inputs to the hedging model; and the risk that the models used to forecast the effectiveness of hedging instruments may project expectations that differ from actual results. In addition, increased regulation of the derivative markets may increase the cost to Trustmark to implement and maintain an effective hedging strategy.
Trustmark closely monitors the sensitivity of net interest income and investment income to changes in interest rates and attempts to limit the variability of net interest income as interest rates change. Trustmark makes use of both on- and off-balance sheet financial instruments to mitigate exposure to interest rate risk.
Trustmark may be adversely affected by the transition from the London Interbank Offered Rate (LIBOR) as a reference rate.
In 2017, the United Kingdom’s Financial Conduct Authority (FCA), which regulates LIBOR, announced that after the end of 2021 it would no longer compel banks to submit the rates required to calculate LIBOR. On March 5, 2021, the FCA confirmed that the publication of most LIBOR term rates would end on June 30, 2023 (excluding one-week U.S. LIBOR and two-month U.S. LIBOR, the publication of which ended on December 31, 2021). The Alternative Reference Rates Committee (ARRC), a committee of U.S. financial market participants, identified the Secured Overnight Financing Rate (SOFR) as the reference rate that represents best practice as the alternative to LIBOR for use in derivatives and other financial contracts that are currently indexed to USD-LIBOR. However, there are conceptual and technical differences between LIBOR and SOFR. The federal banking agencies encouraged banking organizations to cease entering into new contracts that use US$ LIBOR as a reference rate by no later than December 31, 2021, and to ensure existing contracts have robust fallback language that includes a clearly defined alternative reference rate.
On December 16, 2022, the FRB adopted a final rule that implemented the Adjustable Interest Rate (LIBOR) Act by identifying benchmark rates based on SOFR that will replace LIBOR in certain financial contracts after June 30, 2023. Following the LIBOR cessation date of June 30, 2023, the nationwide process for replacing LIBOR in financial contracts that mature thereafter and that do not provide for an effective means to replace LIBOR upon its cessation took effect pursuant to the Adjustable Interest Rate (LIBOR) Act. For contracts in which a party has the discretion to identify a replacement rate, the Adjustable Interest Rate (LIBOR) Act also provides a safe harbor to parties if they choose the SOFR-based benchmark replacement rate to be identified by the FRB. Trustmark transitioned to SOFR for new variable rate loans, derivative contracts, borrowings and other financial instruments as of January 1, 2022.
Trustmark had a significant number of loans, derivative contracts, borrowings and other financial instruments with attributes that were either directly or indirectly dependent on LIBOR. As of December 31, 2023, all of Trustmark’s LIBOR exposure was remediated or in the process of being remediated. The transition from LIBOR has resulted in and could continue to result in added costs and employee efforts and could present additional risk. Since alternative reference rates are calculated differently than LIBOR, payments under contracts referencing new alternative reference rates will differ from those referencing LIBOR. Trustmark cannot predict what the ultimate impact of the transition from LIBOR will be; however, Trustmark has implemented various measures to manage the transition and mitigate risks.
Credit and Lending Risks
Trustmark is subject to lending risk, which could impact the adequacy of the allowance for credit losses and results of operations.
There are inherent risks associated with Trustmark’s lending activities. If trends in the housing and real estate markets were to revert to or decline below recession levels, Trustmark may experience higher than normal delinquencies and credit losses. Moreover, if the United States economy returns to a recessionary state, Management expects that it could severely affect economic conditions in Trustmark’s market areas and that Trustmark could experience significantly higher delinquencies and credit losses. In addition, bank regulatory agencies periodically review Trustmark’s allowance for credit losses and may require an increase in the provision for credit losses or the recognition of further charge-offs, based on judgments different from those of Management. As a result, Trustmark may elect, or be required, to make further increases in its provision for credit losses in the future, particularly if economic conditions deteriorate.
Additionally, Trustmark may rely on information furnished by or on behalf of customers and counterparties in deciding whether to extend credit or enter into other transactions. This information could include financial statements, credit reports, business plans, and
18
other information. Trustmark may also rely on representations of those customers, counterparties or other third parties, such as independent auditors, as to the accuracy and completeness of that information. Reliance on inaccurate or misleading financial statements, credit reports or other information could have a material adverse impact on Trustmark’s business, financial condition and results of operations.
Trustmark is subject to environmental liability risk associated with lending activities.
A significant portion of Trustmark’s loan portfolio is secured by real property. During the ordinary course of business, Trustmark forecloses on and takes title to properties securing certain loans. In doing so, there is a risk that hazardous or toxic substances could be found on these properties. If hazardous or toxic substances are found, Trustmark may be liable for remediation costs, as well as for personal injury and property damage, civil fines and criminal penalties regardless of when the hazardous conditions or toxic substances first affected any particular property. Environmental laws may require Trustmark to incur substantial expenses and may materially reduce the affected property’s value or limit Trustmark’s ability to use or ability to sell the affected property or to repay the indebtedness secured by the property. In addition, future laws or more stringent interpretations or enforcement policies with respect to existing laws may increase Trustmark’s exposure to environmental liability. Environmental reviews of nonresidential real estate before initiating foreclosure actions may not be sufficient to detect all potential environmental hazards. The remediation costs and any other financial liabilities associated with an environmental hazard could have a material adverse effect on Trustmark’s business, financial condition and results of operations.
Declines in asset values may result in credit losses and adversely affect the value of Trustmark’s investments.
Trustmark maintains an investment portfolio that includes, among other asset classes, obligations of states and municipalities, agency debt securities and agency mortgage-related securities. The market value of investments in Trustmark’s investment portfolio may be affected by factors other than interest rates or the underlying performance of the issuer of the securities, such as ratings downgrades, adverse changes in the business climate and a lack of pricing information or liquidity in the secondary market for certain investment securities. In addition, government involvement or intervention in the financial markets or the lack thereof or market perceptions regarding the existence or absence of such activities could affect the market and the market prices for these securities.
On a quarterly basis, Trustmark evaluates investments and other assets for expected credit losses. At December 31, 2023, gross unrealized losses on securities for which an allowance for credit losses has not been recorded totaled $196.1 million. Trustmark may be required to record credit loss expense if these investments suffer a decline in value that is the result of a credit loss. If Trustmark determines that a credit loss exists, the credit portion of the allowance would be measured using a discounted cash flow (DCF) analysis using the effective interest rate as of the security’s purchase date. The amount of credit loss Trustmark may record is limited to the amount by which the amortized cost exceeds the fair value, which could have a material adverse effect on results of operations in the period in which a credit loss, if any, occurs.
Liquidity Risk
Trustmark is subject to liquidity risk, which could disrupt its ability to meet its financial obligations.
Liquidity refers to Trustmark’s ability to ensure that sufficient cash flow and liquid assets are available to satisfy current and future financial obligations, including demand for loans and deposit withdrawals, funding operating costs and other corporate purposes. Liquidity risk arises whenever the maturities of financial instruments included in assets and liabilities differ or when assets cannot be liquidated at fair market value as needed. Trustmark obtains funding through deposits and various short-term and long-term wholesale borrowings, including federal funds purchased and securities sold under repurchase agreements, the Federal Reserve Discount Window (Discount Window) and Federal Home Loan Bank (FHLB) advances. Any significant restriction or disruption of Trustmark’s ability to obtain funding from these or other sources could have a negative effect on Trustmark’s ability to satisfy its current and future financial obligations, which could materially affect Trustmark’s financial condition or results of operations.
In addition to the risk that one or more of the funding sources may become constrained due to market conditions unrelated to Trustmark, there is the risk that Trustmark’s credit profile may decline such that one or more of these funding sources becomes partially or wholly unavailable to Trustmark.
Trustmark attempts to quantify such credit event risk by modeling bank specific and systemic scenarios that estimate the liquidity impact. Trustmark estimates such impact by attempting to measure the effect on available unsecured lines of credit, available capacity from secured borrowing sources and securitizable assets. To mitigate such risk, Trustmark maintains available lines of credit with the Federal Reserve Bank of Atlanta and the FHLB of Dallas that are secured by loans and investment securities. Management continuously monitors Trustmark’s liquidity position for compliance with internal policies.
19
External and Market-Related Risks
Trustmark’s business may be adversely affected by conditions in the financial markets and economic conditions in general.
Economic activity improved slightly during 2023; however, economic concerns remain as a result of the cumulative weight of uncertainty regarding the potential economic impact of geopolitical developments, such as the conflicts in Ukraine and the Middle East, inflation, the consequences of bank failures and other economic and industry volatility, the 2024 political cycle in the United States, supply chain issues, higher energy prices and broader price pressures. Doubts surrounding the near-term direction of global markets, and the potential impact of these trends on the United States economy, are expected to persist for the near term. While Trustmark’s customer base is wholly domestic, international economic conditions affect domestic conditions, and thus may have an impact upon Trustmark’s financial condition or results of operations. Strategic risk, including threats to business models from rising rates and modest economic growth, remains high. Management’s ability to plan, prioritize and allocate resources in this environment will be critical to Trustmark’s ability to sustain earnings that will attract capital. Because of the complexities presented by current economic conditions, Management will continue to be challenged in identifying alternative sources of revenue, prudently diversifying assets, liabilities and revenue and effectively managing the costs of compliance.
Market interest rates began to rise during 2022 after an extended period at historical lows and continued to rise in 2023. As interest rates have increased, so have competitive pressures on the deposit cost of funds. This has been exacerbated by bank failures and the resulting heightened competition for deposits, which has also affected the interest that Trustmark pays on deposits. It is not possible to predict the pace and magnitude of changes to interest rates, or the impact rate changes will have on Trustmark’s results of operations.
Trustmark does not assume that current uncertain conditions in the economy will improve significantly in the near future. A weakened economy could affect Trustmark in a variety of substantial and unpredictable ways. In particular, Trustmark may face the following risks in connection with these events:
The rising interest rate environment during 2022 and 2023, the resulting industry-wide reduction in the fair value of securities portfolios and the bank runs that led to the failures of some financial institutions in March 2023, among other events, have resulted in a current state of volatility and uncertainty with respect to the health of the United States banking system. There is heightened awareness around liquidity, uninsured deposits, deposit composition, unrecognized investment losses and capital. It is difficult to predict the extent to which these challenging economic conditions will persist or whether recent progress in the economic recovery will instead shift to the potential for further decline. If the economy does weaken in the future, it is uncertain how Trustmark’s business would be affected and whether Trustmark would be able to successfully mitigate any such effects on its business. Accordingly, these factors in the United States (and, indirectly, global) economy could have a material adverse effect on Trustmark’s financial condition and results of operations.
Trustmark operates in a highly competitive financial services industry.
Trustmark faces substantial competition in all areas of its operations from a variety of different competitors, many of which are larger and may have greater financial resources. Such competitors primarily include banks, as well as community banks operating nationwide and regionally within the various markets in which Trustmark operates. Trustmark also faces competition from many other types of financial institutions, including savings and loans, credit unions, finance companies, brokerage firms, insurance companies, factoring companies and other financial intermediaries. Additionally, fintech developments, such as blockchain and other distributed ledger technologies, have the potential to disrupt the financial industry and change the way banks do business. The financial services industry could become even more competitive as a result of legislative, regulatory and technological changes and continued consolidation.
20
Some of Trustmark’s competitors have fewer regulatory constraints and may have lower cost structures. Additionally, due to their size, many of Trustmark’s larger competitors may be able to achieve economies of scale and, as a result, may offer a broader range of products and services as well as better pricing for those products and services than Trustmark.
Trustmark’s ability to compete successfully depends on a number of factors, including: the ability to develop, maintain and build upon long-term customer relationships based on top quality service, high ethical standards and safe, sound assets; the ability to continue to expand Trustmark’s market position through organic growth and acquisitions; the scope, relevance and pricing of products and services offered to meet customer needs and demands; the rate at which Trustmark introduces new products and services relative to its competitors; and industry and general economic trends. Failure to perform in any of these areas could significantly weaken Trustmark’s competitive position, which could adversely affect Trustmark’s financial condition or results of operations.
The soundness of other financial institutions could adversely affect Trustmark.
Financial services institutions are interrelated as a result of trading, clearing, counterparty or other relationships. As a result, defaults by, or questions or rumors about, one or more financial services institutions or the financial services industry in general, could lead to market-wide liquidity problems, which could, in turn, lead to defaults or losses by Trustmark and by other institutions. Trustmark has exposure to many different industries and counterparties, and routinely executes transactions with counterparties in the financial services industry, including commercial banks, brokers and dealers, investment banks, mutual funds, and other institutional clients. Many of these transactions expose Trustmark to credit risk in the event of default of its counterparty or client. In addition, Trustmark’s credit risk may be exacerbated when the collateral it holds cannot be realized upon or is liquidated at prices not sufficient to recover the full amount of the credit or derivative exposure owed to Trustmark. Losses related to these credit risks could materially and adversely affect Trustmark’s results of operations.
Compliance and Regulatory Risks
Trustmark is subject to extensive government regulation and supervision and possible enforcement and other legal actions.
Trustmark, primarily through TNB and certain nonbank subsidiaries, is subject to extensive federal and state regulation and supervision, which vests a significant amount of discretion in the various regulatory authorities. Banking regulations are primarily intended to protect depositors’ funds, federal deposit insurance funds and the banking system as a whole, not security holders. These regulations and supervisory guidance affect Trustmark’s lending practices, capital structure, investment practices, dividend policy and growth, among other things. Congress and federal regulatory agencies continually review banking laws, regulations and policies for possible changes. Changes to statutes, regulations or regulatory policies or supervisory guidance, including changes in interpretation or implementation or statutes, regulations, policies and supervisory guidance, could affect Trustmark in substantial and unpredictable ways. Such changes could subject Trustmark to additional costs, limit the types of financial services and products Trustmark may offer and/or increase the ability of nonbanks to offer competing financial services and products, among other things. Failure to comply with laws, regulations, policies or supervisory guidance could result in enforcement and other legal actions by Federal or state authorities, including criminal and civil penalties, the loss of FDIC insurance, the revocation of a banking charter, civil money penalties, other sanctions by regulatory agencies and/or reputational damage. In this regard, government authorities, including bank regulatory agencies, continue to pursue enforcement agendas with respect to compliance and other legal matters involving financial activities, which heightens the risks associated with actual and perceived compliance failures. Any of the foregoing could have a material adverse effect on Trustmark’s financial condition or results of operations.
Trustmark is subject to numerous laws designed to protect consumers, including fair lending laws, and failure to comply with these laws could lead to a wide variety of sanctions.
The Equal Credit Opportunity Act, the Fair Housing Act and other fair lending laws and regulations impose nondiscriminatory lending requirements on financial institutions. The Department of Justice and other federal agencies are responsible for enforcing these laws and regulations. A successful regulatory challenge to an institution’s performance under fair lending laws and regulations could result in a wide variety of direct or indirect negative consequences, including damages and civil money penalties, injunctive relief, restrictions on mergers and acquisitions activity, restrictions on geographic expansion and restrictions on entering new business lines. Private parties may also have the ability to challenge an institution’s performance under fair lending laws in private class action litigation. Such actions could have a material adverse effect on Trustmark’s business, financial condition or results of operations. In 2021, TNB settled a fair lending enforcement action with the Department of Justice, the OCC and the CFPB and incurred a one-time settlement expense of $5.0 million and made other commitments to enhance credit opportunities to residents of majority-Black and Hispanic neighborhoods in the Memphis metropolitan statistical area. Trustmark and TNB could be subject to other enforcement actions in the future.
In addition, financial institutions face scrutiny on actions and policies that are deemed to adversely impact consumers under the Dodd-Frank Act’s prohibition against unfair, deceptive or abusive acts and practices and Section 5 of the Federal Trade Commission Act’s
21
prohibition against unfair or deceptive acts and practices. Bank regulators and the CFPB are responsible for enforcing these prohibitions against banking organizations. These prohibitions have been applied to prohibit perceived customer abuse in connection with a range of products, services, and practices, including account openings and fees charged where inadequate or no services are rendered for which charges were imposed, as well as other instances where consumers may have been misled through bank disclosures. In addition, the enforcement priorities of the agencies enforcing consumer protection laws have evolved over time and may continue to do so.
TNB's CRA rating of "Needs to Improve" could make it more difficult for Trustmark’s business to grow.
The performance of a bank under the CRA in meeting the credit needs of its community is a factor that must be taken into consideration when the federal banking agencies evaluate applications related to mergers and acquisitions, as well as branch opening and relocations. As of its last examination, TNB received a CRA rating of “Needs to Improve,” which is downgraded from its prior rating of “Satisfactory.” The rating of “Needs to Improve” adversely affects TNB’s ability to obtain regulatory approvals to engage in certain expansionary activities, including certain mergers and acquisitions and the establishment of bank branches. These limitations will remain in place until TNB receives a CRA rating of at least “Satisfactory” following a subsequent CRA examination. The precise timing of the completion of that examination and any results therefrom will not be known until later, and it is possible that TNB’s current CRA rating would not improve in the next examination.
Trustmark is subject to stringent capital requirements.
Under the regulatory capital rules of the FRB, OCC, and FDIC that implement a set of capital requirements issued by the Basel Committee on Banking Supervision known as Basel III, Trustmark and TNB are required to maintain a common equity Tier 1 capital to risk-weighted assets ratio of at least 7.0% (a minimum of 4.5% plus a capital conservation buffer of 2.5%), a Tier 1 capital to risk-weighted assets ratio of at least 8.5% (a minimum of 6.0% plus a capital conservation buffer of 2.5%), a total capital to risk-weighted assets ratio of at least 10.5% (a minimum of 8.0% plus a capital conservation buffer of 2.5%) and a leverage ratio of Tier 1 capital to total consolidated assets of at least 4.0%. In addition, for TNB to be “well-capitalized” under the banking agencies’ prompt corrective action framework, it must have a common equity Tier 1 capital ratio of at least 6.5%, a Tier 1 capital ratio of at least 8.0%, a total capital ratio of at least 10.0% and a leverage ratio of at least 5.0%, and must not be subject to any written agreement, order or capital directive, or prompt corrective action directive issued by its primary federal regulator to meet and maintain a specific capital level for any capital measure.
The capital rules also include stringent criteria for capital instruments to qualify as Tier 1 or Tier 2 capital. For instance, the rules effectively disallow newly issued trust preferred securities to be a component of a holding company’s Tier 1 capital. Trustmark will continue to count $60.0 million in outstanding trust preferred securities issued by the Trust as Tier 1 capital up to the regulatory limit, as permitted by a grandfather provision in the capital rules, but this grandfather provision may cease to apply if Trustmark consummates an acquisition of a depository institution holding company and the resulting organization has $15 billion of more in total assets.
Financial Accounting Standards Board (FASB) Accounting Standard Codification (ASC) Topic 326, “Financial Instruments-Credit Losses: Measurement of Credit Losses on Financial Instruments,” requires Trustmark to recognize all expected credit losses over the life of a loan based on historical experience, current conditions and reasonable and supportable forecasts. FASB ASC Topic 326 generally is expected to result in earlier recognition of credit losses, which would increase reserves and decrease capital. Additionally, the allowance for credit losses model could be materially impacted by changes in current and forecasted macroeconomic conditions. It is not possible to predict the timing or magnitude of changes in macroeconomic conditions or the impact such changes could have on Trustmark’s allowance for credit losses; however, material changes in the allowance for credit losses could have a material impact on Trustmark’s reserves and capital.
The regulatory capital rules applicable to Trustmark and TNB may continue to evolve as a result of new requirements established by the Basel Committee on Banking Supervision or legislative, regulatory or accounting changes in the United States. Management cannot predict the effect that any changes to current capital requirements would have on Trustmark and TNB.
Trustmark’s use of third-party service providers and Trustmark’s other ongoing third-party business relationships are subject to increasing regulatory requirements and attention.
Trustmark regularly uses third-party service providers and subcontractors as part of its business. Trustmark also has substantial ongoing business relationships with partners and other third-parties and relies on certain third-parties to provide products and services necessary to maintain day-to-day operations. These types of third-party relationships are subject to increasingly demanding regulatory requirements and attention by regulators, including the FRB, OCC, CFPB and FDIC. Under regulatory guidance, Trustmark is required to apply stringent due diligence, conduct ongoing monitoring and maintain effective control over third-party service providers and subcontractors and other ongoing third-party business relationships. These regulatory expectations may change, and potentially become more rigorous in certain ways, due to an interagency effort to replace existing guidance on the risk management of third-party
22
relationships with new guidance. Trustmark expects that the regulators will hold Trustmark responsible for deficiencies in its oversight and control of its third-party relationships and in the performance of the parties with which Trustmark has these relationships. Trustmark maintains a system of policies and procedures designed to ensure adequate due diligence is performed and to monitor vendor risks. While Trustmark believes these policies and procedures effectively mitigate risk, if the regulators conclude that Trustmark has not exercised adequate oversight and control over third-party service providers and subcontractors or other ongoing third-party business relationships or that such third-parties have not performed appropriately, Trustmark could be subject to enforcement actions, including civil monetary penalties or other administrative or judicial penalties or fines as well as requirements for customer remediation.
Operational Risks
There may be risks resulting from the extensive use of models in Trustmark’s business.
Trustmark relies on statistical and quantitative models to measure risks and to estimate certain financial values. Models may be used in such processes as determining the pricing of various products, assessing potential acquisition opportunities, developing presentations made to market analysts and others, creating loans and extending credit, measuring interest rate and other market risks, predicting losses, assessing capital adequacy, calculating regulatory capital levels and estimating the fair value of financial instruments and balance sheet items. These models reflect assumptions that may not be accurate, particularly in times of market stress or other unforeseen circumstances. Even if these assumptions are adequate, the models may prove to be inadequate or inaccurate because of other flaws in their design or their implementation. If models for determining interest rate risk and asset-liability management are inadequate, Trustmark may incur increased or unexpected losses upon changes in market interest rates or other market measures. If models for determining expected credit losses are inadequate, the allowance for credit losses may not be sufficient to support future charge-offs. If models to measure the fair value of financial instruments are inadequate, the fair value of such financial instruments may fluctuate unexpectedly or may not accurately reflect what Trustmark could realize upon sale or settlement of such financial instruments. Any such failure in the analytical or forecasting models could have a material adverse effect on Trustmark’s financial condition or results of operations.
Also, information Trustmark provides to its regulators based on poorly designed or implemented models could be inaccurate or misleading. Certain decisions that the regulators make, including those related to capital distributions and dividends to Trustmark’s shareholders, could be adversely affected due to the regulator’s perception that the quality of Trustmark’s models used to generate the relevant information is insufficient.
Trustmark could be required to write down goodwill and other intangible assets.
If Trustmark consummates an acquisition, a portion of the purchase price would generally be allocated to goodwill and other identifiable intangible assets. The amount of the purchase price that is allocated to goodwill and other intangible assets is determined by the excess of the purchase price over the net identifiable assets acquired. At December 31, 2023, goodwill and other identifiable intangible assets were $387.2 million. Under current accounting standards, if Trustmark determines goodwill or intangible assets are impaired, Trustmark would be required to write down the carrying value of these assets. Trustmark’s annual goodwill impairment evaluation performed during the fourth quarter of 2023 indicated no impairment of goodwill for any reporting segment. Management cannot provide assurance, however, that Trustmark will not be required to take an impairment charge in the future. Any impairment charge would have an adverse effect on Trustmark’s shareholders’ equity and financial condition and could cause a decline in Trustmark’s stock price.
Trustmark holds other real estate and may acquire and hold significant additional amounts, which could lead to increased operating expenses and vulnerability to additional declines in real property values.
As business necessitates, Trustmark forecloses on and takes title to real estate serving as collateral for loans. At December 31, 2023, Trustmark held $6.9 million of other real estate. The amount of other real estate held by Trustmark may increase in the future as a result of, among other things, business combinations, increased uncertainties in the housing market or increased levels of credit stress in residential real estate loan portfolios. Increased other real estate balances could lead to greater expenses as Trustmark incurs costs to manage, maintain and dispose of real properties as well as to remediate any environmental cleanup costs incurred in connection with any contamination discovered on real property on which Trustmark has foreclosed and to which Trustmark has taken title. As a result, Trustmark’s earnings could be negatively affected by various expenses associated with other real estate owned, including personnel costs, insurance and taxes, completion and repair costs, valuation adjustments and other expenses associated with real property ownership, as well as by the funding costs associated with other real estate assets. The expenses associated with holding a significant amount of other real estate could have a material adverse effect on Trustmark’s financial condition or results of operations.
23
If Trustmark is required to repurchase a significant number of mortgage loans that it had previously sold, such repurchases could negatively affect earnings.
One of Trustmark’s primary business operations is mortgage banking under which residential mortgage loans are sold in the secondary market under agreements that contain representations and warranties related to, among other things, the origination and characteristics of the mortgage loans. Trustmark may be required to either repurchase the outstanding principal balance of a loan or make the purchaser whole for the anticipated economic benefits of a loan if it is determined that the loan sold was in violation of representations or warranties made by Trustmark at the time of the sale, herein referred to as mortgage loan servicing putback expenses. Such representations and warranties typically include those made regarding loans that had missing or insufficient file documentation, loans that do not meet investor guidelines, loans in which the appraisal does not support the value and/or loans obtained through fraud by the borrowers or other third parties. Generally, putback requests may be made until the loan is paid in full. However, mortgage loans delivered to the Federal National Mortgage Association (FNMA) and the Federal Home Loan Mortgage Corporation (FHLMC) on or after January 1, 2013 are subject to the Representations and Warranties Framework, which provides that FNMA and FHLMC will not exercise their remedies, including a putback request, for breaches of certain selling representations and warranties if the mortgage loans satisfy certain criteria, such as payment history or quality control review.
Changes in retail distribution strategies and consumer behavior may adversely impact Trustmark’s investments in premises, equipment, technology and other assets and may lead to increased expenditures to change its retail distribution channel.
Trustmark has significant investments in bank premises and equipment for its branch network. Advances in technology such as ecommerce, telephone, internet and mobile banking, and in-branch self-service technologies including interactive teller machines (ITMs) and other equipment, as well as an increasing customer preference for these other methods of accessing Trustmark’s products and services, could decrease the value of its branch network, technology, or other retail distribution physical assets and may cause Trustmark to change its retail distribution strategy, close and/or sell certain branches or parcels of land held for development and restructure or reduce its remaining branches and work force. These actions could lead to losses on these assets or could adversely impact the carrying value of any long-lived assets and may lead to increased expenditures to renovate, reconfigure or close a number of Trustmark’s remaining branches or to otherwise reform its retail distribution channel.
Trustmark may experience disruptions of its operating systems or breaches in its information system security.
Trustmark is dependent upon communications and information systems to conduct business as such systems are used to manage virtually all aspects of Trustmark’s business. Trustmark’s operations rely on the secure processing, storage and transmission of confidential and other information within its computer systems and networks. Any failure, interruption or breach in security of these systems could result in significant disruption to Trustmark's operations. Trustmark has taken protective measures, which are continuously monitored and modified as warranted; however, Trustmark’s computer systems, software and networks may fail to operate properly or become disabled or damaged as a result of a number of factors, including events that are wholly or partially beyond Trustmark’s control. There could be sudden increases in customer transaction volume; electrical, telecommunications or other major physical infrastructure outages; natural disasters; and events arising from local or larger scale political or social matters, including terrorist acts.
Further, Trustmark’s operational and security systems and infrastructure may be vulnerable to breaches and cybersecurity-related incidents including, but not limited to, attempts to access information, including customer and company information, malicious code, computer viruses and denial of service attacks that could result in unauthorized access, theft, misuse, loss, release or destruction of data (including confidential customer information), account takeovers, unavailability of service or other events. These types of threats may derive from human error, fraud or malice on the part of external or internal parties, or may result from accidental technological failure. If one or more of these events were to occur, Trustmark’s or its customers’ confidential and other information would be jeopardized, or such an event could cause interruptions or malfunctions in Trustmark’s or its customers’ or counterparties’ operations. Any failures related to upgrades and maintenance of Trustmark's technology and information systems could further increase its information and system security risk. Trustmark's increased use of cloud and other technologies, such as remote work technologies, also increases its risk of being subject to a cyber-attack. The risk of a security breach or disruption, particularly through cyber-attack or cyber intrusion, has increased as the number, intensity and sophistication of attempted attacks and intrusions from around the world have increased. Trustmark may be required to expend significant additional resources to modify its protective measures or to investigate and remediate vulnerabilities or other exposures in its computer systems and networks, and Trustmark may be subject to litigation and financial losses that are either not insured against or not fully covered through any insurance maintained by Trustmark. Any such losses, which may be difficult to detect, could adversely affect Trustmark’s financial condition or results of operations. In addition, the occurrence of such a loss could expose Trustmark to reputational risk, the loss of customer business and additional regulatory scrutiny.
Security breaches in Trustmark’s internet and mobile banking activities (myTrustmark®) could further expose Trustmark to possible liability and reputational risk. Any compromise in security could deter customers from using Trustmark’s internet and mobile banking services that involve the transmission of confidential information. Trustmark relies on standard internet security systems to provide the
24
security and authentication necessary to effect secure transmission of data. However, these precautions may not protect Trustmark’s systems from compromise or breaches of security, which could result in significant legal liability and significant damage to Trustmark’s reputation and business.
Trustmark relies upon certain third-party vendors to provide products and services necessary to maintain day-to-day operations. Accordingly, Trustmark’s operations are exposed to the risk that these vendors might not perform in accordance with applicable contractual arrangements or service level agreements or that the security of the third-party vendors’ computer systems, software and networks may be vulnerable to compromises that could impact information system security. Trustmark maintains a system of policies and procedures designed to monitor vendor risks. While Trustmark believes these policies and procedures effectively mitigate risk, the failure of an external vendor to perform in accordance with applicable contractual arrangements or service level agreements or any compromise in the security of an external vendor’s information systems could be disruptive to Trustmark’s operations, which could have a material adverse effect on its financial condition or results of operations.
As of the date of this Annual Report on Form 10-K, Trustmark has seen no material adverse impact on its business or operations from cyber-attacks or events. Trustmark's customers, employees and third parties that it does business with have been, and will continue to be, targeted by parties using fraudulent e-mails and other communications in attempts to misappropriate passwords, bank account information or other personal information or to introduce viruses or other malware programs to its information systems, the information systems of its merchants or third-party service providers and/or its customers' personal devices, which are beyond Trustmark's security control systems. Though Trustmark endeavors to mitigate these threats through product improvements, use of encryption and authentication technology and customer and employee education, such cyber-attacks against Trustmark, its merchants, third-party service providers and customers remain a serious issue and have been successful in the past.
Although Trustmark makes significant efforts to maintain the security and integrity of its information systems and has implemented various measures to manage the risks of a security breach or disruption, there can be no assurance that its security efforts and measures will be effective or that attempted security breaches or disruptions would not be successful or damaging. Even well protected information, networks, systems and facilities remain potentially vulnerable to attempted security breaches or disruptions because the techniques used in such attempts are constantly evolving and generally are not recognized until launched against a target, and in some cases are designed not to be detected and, in fact, may not be detected. Accordingly, Trustmark may be unable to anticipate these techniques or to implement adequate security barriers or other preventative measures, and thus it is virtually impossible for Trustmark to entirely mitigate this risk. Furthermore, in the event of a cyber-attack, Trustmark may be delayed in identifying or responding to the attack, which could increase the negative impact of the cyber-attack on its business, financial condition and results of operations. A security breach or other significant disruption of Trustmark's information systems or those related to its customers, merchants or third-party vendors, including as a result of cyber-attacks, could (i) disrupt the proper functioning of its networks and systems and therefore its operations and/or those of its customers; (ii) result in the unauthorized access to, and destruction, loss, theft, misappropriation or release of confidential, sensitive or otherwise valuable information of Trustmark or its customers; (iii) result in a violation of applicable privacy, data breach and other laws, subjecting Trustmark to additional regulatory scrutiny and exposing it to civil litigation, enforcement actions, governmental fines and possible financial liability; (iv) require significant management attention and resources to remedy the damages that result; or (v) harm Trustmark's reputation or cause a decrease in the number of customers that choose to do business with Trustmark. The occurrence of any of the foregoing could have a material adverse effect on Trustmark's business, financial condition and results of operations.
Trustmark must utilize new technologies to deliver its products and services, which could require significant resources and expose Trustmark to additional risks, including cyber-security risks.
In order to deliver new products and services and to improve the productivity of existing products and services, the banking industry relies on rapidly evolving technologies. Trustmark continues to invest in technology to facilitate the ability of its customers to engage in financial transactions, and otherwise enhance the customer experience with respect to its products and services. Trustmark’s ability to effectively utilize new technologies to address customer needs and create operating efficiencies could materially affect future prospects. Management cannot provide any assurances that Trustmark will be successful in utilizing such new technologies. Incorporation of new products and services, such as internet and mobile banking services, may require significant resources and expose Trustmark to additional risks, including cyber-security risks.
Trustmark’s controls and procedures may fail or be circumvented.
Trustmark’s internal controls, disclosure controls and procedures, and corporate governance policies and procedures are based in part on assumptions, and can provide only reasonable, not absolute, assurances that the objectives of the system are met. Any failure or circumvention of Trustmark’s controls and procedures or failure to comply with regulations related to controls and procedures could have a material adverse effect on Trustmark’s business, financial condition and results of operations.
25
Trustmark may be subject to increased claims and litigation, which could result in legal liability and reputational damage.
Trustmark has been named from time to time as a defendant in litigation relating to its businesses and activities. Litigation may include claims for substantial compensatory or punitive damages or claims for indeterminate amounts of damages.
In recent years, a number of judicial decisions have upheld the right of borrowers to sue lending institutions on the basis of various evolving legal theories, collectively termed “lender liability.” Generally, lender liability is founded on the premise that a lender has either violated a duty, whether implied or contractual, of good faith and fair dealing owed to the borrower or has assumed a degree of control over the borrower resulting in the creation of a fiduciary duty owed to the borrower or its other creditors or shareholders.
Substantial legal liability against Trustmark, including its subsidiaries, could materially adversely affect Trustmark’s business, financial condition or results of operations, or cause significant harm to its reputation. TNB recently agreed to settlements relating to litigation involving the Stanford Financial Group and Adams/Madison Timber. For additional information regarding these settlements, see the section captioned “Legal Proceedings” in Note 16 - Commitments and Contingencies included in Part II. Item 8. - Financial Statements and Supplementary Data of this report.
Damage to Trustmark’s reputation could have a significant negative impact on Trustmark’s business.
Trustmark’s ability to attract and retain customers, clients, investors, and highly-skilled management and employees is affected by its reputation. Significant harm to Trustmark’s reputation can also arise from other sources, including employee misconduct, actual or perceived unethical or illegal behavior, litigation or regulatory outcomes, failing to deliver minimum or required standards of service and quality, compliance failures, disclosure of confidential information, significant or numerous failures, interruptions or breaches of its information systems and the activities of its clients, customers and counterparties, including vendors. Actions by the financial services industry generally or by certain members or individuals in the industry may have a significant adverse effect on Trustmark’s reputation. Trustmark could also suffer significant reputational harm if it fails to properly identify and manage potential conflicts of interest. Management of potential conflicts of interests has become increasingly complex as Trustmark expands its business activities through more numerous transactions, obligations and interests with and among its clients. The actual or perceived failure to adequately address conflicts of interest could affect the willingness of clients to deal with Trustmark, which could adversely affect Trustmark’s businesses.
Risk Related to Acquisition Activity
Potential acquisitions by Trustmark may disrupt Trustmark’s business and dilute shareholder value.
Trustmark continuously monitors the market for merger or acquisition opportunities and, depending upon business and other considerations, may elect to pursue one or more such opportunities in the future. Any such merger or acquisition candidate would need to have a similar culture to Trustmark, have experienced management and possess either significant market presence or have potential for improved profitability through financial management, economies of scale or expanded services. Acquiring other banks, businesses, or branches involves various risks commonly associated with acquisitions, including: potential exposure to unknown or contingent liabilities of the target company, exposure to potential asset quality issues of the target company, difficulty and expense of integrating the operations and personnel of the target company, potential disruption to Trustmark’s business, potential diversion of Trustmark’s Management’s time and attention, the possible loss of key employees and customers of the target company, difficulty in estimating the value of the target company and potential changes in banking or tax laws or regulations that may affect the target company. Acquisitions may involve the payment of a premium over book and market values, and, therefore, some dilution of Trustmark’s tangible book value and net income per share of common stock may occur in connection with any future transaction. Furthermore, failure to realize the expected revenue projections, cost savings, increases in geographic or product presence, and/or other projected benefits from an acquisition could have a material adverse effect on Trustmark’s financial condition or results of operations.
General Risk Factors
The stock price of financial institutions, like Trustmark, can be volatile.
The volatility in the stock prices of companies in the financial services industry, such as Trustmark, may make it more difficult for shareholders to resell Trustmark common stock at attractive prices in a timely manner. Trustmark’s stock price can fluctuate significantly in response to a variety of factors, including factors affecting the financial industry as a whole, such as the bank failures in March 2023. The factors affecting financial stocks generally and Trustmark’s stock price in particular include:
26
General market fluctuations, the potential for breakdowns on electronic trading or other platforms for executing securities transactions, industry factors and general economic and political conditions could also cause Trustmark’s stock price to decrease regardless of operating results.
Changes in accounting standards may affect how Trustmark reports its financial condition and results of operations.
Trustmark’s accounting policies and methods are fundamental to how Trustmark records and reports its financial condition and results of operations. From time to time, the FASB changes the financial accounting and reporting standards that govern the preparation of Trustmark’s financial statements. The most recent economic recession resulted in increased scrutiny of accounting standards by regulators and legislators, particularly as they relate to fair value accounting principles. In addition, ongoing efforts to achieve convergence between generally accepted accounting principles (GAAP) and International Financial Reporting Standards may result in changes to GAAP. Any such changes can be difficult to predict and can materially affect how Trustmark records and reports its financial condition or results of operations. For additional details regarding recently adopted and pending accounting pronouncements, see Note 1 – Significant Accounting Policies included in Part II. Item 8. - Financial Statements and Supplementary Data of this report.
Trustmark may not be able to attract or retain key employees.
Trustmark’s success depends substantially on its ability to attract and retain skilled, experienced personnel. Competition for qualified candidates in the activities and markets that Trustmark serves is intense. While Trustmark invests significantly in the training and development of its employees, it is possible that Trustmark may not be able to retain key employees. If Trustmark were unable to retain its most qualified employees, its performance and competitive positioning could be materially adversely affected.
Natural disasters, such as hurricanes, could have a significant negative impact on Trustmark’s business.
Many of Trustmark’s loans are secured by property or are made to businesses in or near the Gulf Coast regions of Alabama, Florida, Mississippi and Texas, which are often in the path of seasonal hurricanes. Natural disasters, such as hurricanes, could have a significant negative impact on the stability of Trustmark’s deposit base, the ability of borrowers to repay outstanding loans and the value of collateral securing loans, and could cause Trustmark to incur material additional expenses. Although Management has established disaster recovery policies and procedures, the occurrence of a natural disaster, especially if any applicable insurance coverage is not adequate to enable Trustmark’s borrowers to recover from the effects of the event, could have a material adverse effect on Trustmark’s financial condition or results of operations.
Expectations around Environmental, Social and Governance (ESG) practices as well as climate change and related legislative and regulatory initiatives could adversely affect Trustmark’s business and results of operations, including indirectly through impact to its customers.
Companies are facing increased scrutiny from customers, regulators and other stakeholders with respect to their ESG practices and disclosures. Institutional investors, and investor advocacy groups, in particular, are increasingly focused on these matters and expectations in many of these areas can vary widely. In addition, increased ESG related compliance costs could result in increases to Trustmark’s overall operational costs. Failure to adapt to or comply with regulatory requirements or investor or stakeholder expectations and standards, and fluctuations in these standards, could negatively impact Trustmark’s reputation, ability to do business with certain partners and its stock price. New government regulations could also result in new or more stringent forms of ESG oversight and expanding mandatory and voluntary reporting, diligence and disclosure.
In addition to regulatory and investor expectations on environmental matters in general, the current and anticipated effects of climate change are creating an increasing level of concern for the state of the global environment. As a result, political and social attention to the issue of climate change has increased. In recent years, governments across the world have entered into international agreements to attempt to reduce global temperatures, in part by limiting greenhouse gas emissions. The United States Congress, state legislatures and
27
federal and state regulatory agencies have continued to propose and advance numerous legislative and regulatory initiatives seeking to mitigate the effects of climate change. These agreements and measures may result in the imposition of taxes and fees, the required purchase of emission credits and the implementation of significant operational changes, each of which may require businesses to expend significant capital and incur compliance, operating, maintenance and remediation costs. Consumers and businesses also may change their behavior on their own as a result of these concerns.
It is not possible to predict how climate change may impact Trustmark’s financial condition and operations; however, Trustmark operates in areas where its business and the activities of its customers could be impacted by the effects of climate change. The effects of climate change may include increased frequency or severity of weather-related events, such as severe storms, hurricanes, flooding and droughts and rising sea levels. These effects can disrupt business operations, damage property, devalue assets and change customer and business preferences, which may adversely affect borrowers, increase credit risk and reduce demand for Trustmark’s products and services. Trustmark and its customers will need to respond to new laws and regulations as well as consumer and business preferences resulting from climate change concerns. Trustmark and its customers may face cost increases, asset value reductions, operating process changes and the like. The impact to Trustmark’s customers will likely vary depending on their specific attributes, including reliance on or role in carbon intensive activities. In addition, Trustmark could face reductions in creditworthiness on the part of some customers or in the value of assets securing loans. Trustmark’s efforts to take these risks into account may not be effective in protecting it from the negative impact of new laws and regulations or changes in consumer or business behavior and could have a material adverse effect on Trustmark’s financial condition and results of operations.
ITEM 1B. UNRESOLVED STAFF COMMENTS
None
ITEM 1C. CYBERSECURITY
Trustmark recognizes the critical importance of identifying, assessing and managing material risks from cybersecurity threats. Trustmark is committed to implementing and maintaining a comprehensive information security program to manage such risks and safeguard its systems and data.
Trustmark’s Board of Directors has ultimate oversight of cybersecurity-related risks and it is assisted in this role by the Enterprise Risk Committee and the Audit Committee. Processes for identifying, assessing and managing cybersecurity-related risks are integrated into Trustmark’s overall enterprise risk management process, which is overseen by the Enterprise Risk Committee. The Enterprise Risk Committee is responsible for monitoring risks that are being taken by Trustmark, understanding the enterprise-wide effect of those risks and reporting such risks to the Board. In fulfilling this role, the Enterprise Risk Committee has primary oversight responsibility over management’s efforts to manage and mitigate cybersecurity-related risk and reviews and approves Trustmark’s cybersecurity strategy for protecting Trustmark’s information assets and technology platforms. The Audit Committee oversees Trustmark’s Internal Audit Department, which conducts reviews and assessments related to information security. Management provides periodic reports to the Enterprise Risk Committee and the Audit Committee, both of which provide reports of their meetings to the full Board. These reports to the Board and its Committees address the threat environment, vulnerability assessments, specific cyber incidents and management’s efforts to monitor, detect and prevent cyber threats.
Trustmark’s information security program is primarily administered at the management level by the Information Security Department, which is led by Trustmark’s Chief Information Security Officer (CISO), and is supported by the Information Technology Department, which is led by Trustmark’s Chief Information Officer (CIO). The CISO reports to the CIO, who in turn reports to Trustmark’s Chief Credit and Operations Officer. Trustmark’s Information Security Department is responsible for day-to-day management of Trustmark’s information security program, including data loss prevention, access control, threat monitoring, incident response and employee education and training. The Information Security Department also maintains policies related to cybersecurity and data security that provide the required governance for the information security program. Additionally, Trustmark’s Information Technology Department maintains policies that govern technical aspects of Trustmark’s information security program. Each policy is reviewed and approved by the Enterprise Risk Committee at least every three years and is mapped to applicable regulatory guidance. The Cybersecurity Operations team within the Information Technology Department maintains and runs Trustmark’s security operations center and is responsible for cybersecurity event management and maintaining security tooling. Trustmark also maintains an Information Security / Cybersecurity Management Committee, which is comprised of representatives from the Information Security, Information Technology, Enterprise Risk, Corporate Security, Internal Audit and Legal departments and members of executive management. This committee meets quarterly to discuss and review Trustmark’s information security program and receives qualitative and quantitative update reports from the Information Security Department, Internal Audit Department and Information Technology Department.
Trustmark engages third party assessors, consultants and auditors in connection with its information security program, including to conduct external penetration testing, independent audits and risk assessments. Trustmark also utilizes third party service providers in
28
the ordinary course of business. The Information Security Department performs information security assessments for third party service providers that store or process Trustmark confidential data. These information security assessments include a review of any systems and organization control reports, proof of the vendor’s independent testing of their data protection controls, as well as a review of any exceptions noted and assessment of management responses, results of vulnerability and penetration testing, incident response processes and third party data protection controls (which can include, but is not limited to: access reviews and controls, backups, monitoring, encryption standards and disaster recovery). The review of these areas is taken into account in order to provide an overall information security conclusion and risk rating for the vendor.
As a regulated financial institution, Trustmark is also subject to financial privacy laws and its cybersecurity practices are subject to oversight by the federal banking agencies. For additional information, see “Supervision and Regulation – Financial Privacy Laws and Cybersecurity” included in Part I. Item 1 – Business of this report.
Although Trustmark has not, as of the date of this Annual Report on Form 10-K, experienced a cybersecurity threat or incident that materially affected its business strategy, results of operations or financial condition, there can be no guarantee that Trustmark will not experience such an incident in the future. For additional information regarding the risk Trustmark faces from cybersecurity threats, please see the risk factors titled “Trustmark may experience disruptions of its operating systems or breaches in its information system security” and “Trustmark must utilize new technologies to deliver its products and services, which could require significant resources and expose Trustmark to additional risks, including cyber-security risks” included in Part I. Item 1A. – Risk Factors of this report.
ITEM 2. PROPERTIES
Trustmark’s principal offices are housed in its main office building located in downtown Jackson, Mississippi and owned by TNB. Trustmark’s main office building is primarily allocated for bank use with a small portion available for occupancy by tenants on a lease basis, although such incidental leasing activity is not material to Trustmark’s operations. At December 31, 2023, Trustmark, through TNB, operated 163 full-service branches, 7 limited-service branches and an automated teller machine (ATM) network, which included 131 ATMs and 128 ITMs at its branches and other locations. In addition, Trustmark operated 13 offices in various locations providing mortgage banking, wealth management and insurance services. Trustmark leases 32 of its branch and other office locations with the remainder being owned. Trustmark believes its properties are suitable and adequate to operate its financial services business.
ITEM 3. LEGAL PROCEEDINGS
Information required in this section is set forth under the heading “Legal Proceedings” of Note 16 – Commitments and Contingencies in Part II. Item 8. – Financial Statements and Supplementary Data of this report.
In accordance FASB ASC Subtopic 450-20, “Loss Contingencies,” Trustmark will establish an accrued liability for litigation matters when those matters present loss contingencies that are both probable and reasonably estimable. As a result of the entry into the Stanford Settlement relating to the litigation involving the Stanford Financial Group, Trustmark recognized a $100.0 million litigation settlement expense included in noninterest expense during 2022, plus an additional $750 thousand in related legal fees. As a result of the entry into the Adams/Madison Timber Settlement relating to the litigation involving Adams/Madison Timber, Trustmark recognized a $6.5 million litigation settlement expense included in noninterest expense during 2023. At the present time, Trustmark believes, based on its evaluation and the advice of legal counsel, that a loss in any currently pending legal proceeding is not probable and reasonably estimable. All matters will continue to be monitored for further developments that would make such loss contingency both probable and reasonably estimable. In view of the inherent difficulty of predicting the outcome of legal proceedings, Trustmark cannot predict the eventual outcomes of the currently pending matters or the timing of their ultimate resolution. Management currently believes, however, based upon the advice of legal counsel and Management’s evaluation and after taking into account its current insurance coverage, that the legal proceedings currently pending should not have a material adverse effect on Trustmark’s consolidated financial condition.
ITEM 4. MINE SAFETY DISCLOSURES
Not applicable.
PART II
ITEM 5. MARKET FOR THE REGISTRANT’S COMMON EQUITY, RELATED STOCKHOLDER MATTERS AND ISSUER PURCHASES OF EQUITY SECURITIES
Common Stock Prices and Dividends
Trustmark’s common stock is listed on the Nasdaq Stock Market and is traded under the symbol “TRMK.”
29
Trustmark paid quarterly cash dividends to shareholders of $0.23 per share, or $0.92 per share annually, in 2023. As a component of return to common shareholders, Trustmark intends to pay cash dividends when corporate financial performance and capital strength allow it to do so. All dividend payments must be approved and declared by the Board of Directors of Trustmark and are required to be in compliance with all applicable laws and regulations.
At January 31, 2024, there were approximately 2,936 registered shareholders of record and approximately 15,952 beneficial account holders of shares in nominee name of Trustmark’s common stock. Other information required by this item can be found in Note 17 - Shareholders’ Equity included in Part II. Item 8. - Financial Statements and Supplementary Data of this report.
Stock Repurchase Program
On January 28, 2020, the Board of Directors of Trustmark authorized a stock repurchase program, effective April 1, 2020, under which $100.0 million of Trustmark’s outstanding common stock could be acquired through December 31, 2021. Under this authority, Trustmark repurchased approximately 1.9 million shares of its outstanding common stock valued at $61.8 million during 2021.
On December 7, 2021, the Board of Directors of Trustmark authorized a stock repurchase program, effective January 1, 2022, under which $100.0 million of Trustmark’s outstanding common stock could be acquired through December 31, 2022. Under this authority, Trustmark repurchased approximately 789 thousand shares of its common stock value at $24.6 million during 2022.
On December 6, 2022, the Board of Directors of Trustmark authorized a stock repurchase program, effective January 1, 2023, under which $50.0 million of Trustmark's outstanding common stock could be acquired through December 31, 2023. No shares were repurchased under this authority.
On December 5, 2023, the Board of Directors of Trustmark authorized a new stock repurchase program, effective January 1, 2024, under which $50.0 million of Trustmark's outstanding common stock may be acquired through December 31, 2024. The repurchase program, which is subject to market conditions and management discretion, will be implemented through open market repurchases or privately negotiated transactions. No shares have been repurchased under this authority.
30
Performance Graph
The following graph compares Trustmark’s annual percentage change in cumulative total return on common shares over the past five years with the cumulative total return of companies comprising the Nasdaq market value index and the S&P 500 – Regional Banks index. The S&P 500 – Regional Banks index is an industry index published by S&P Dow Jones Indices, a division of S&P Global, and is comprised of stock in the S&P Total Market Index that are classified in the Global Industry Classification Standard regional banks sub-industry. This presentation assumes that $100 was invested in shares of the relevant issuers on December 31, 2018, and that dividends received were immediately invested in additional shares. The graph plots the value of the initial $100 investment at one-year intervals for the fiscal years shown.
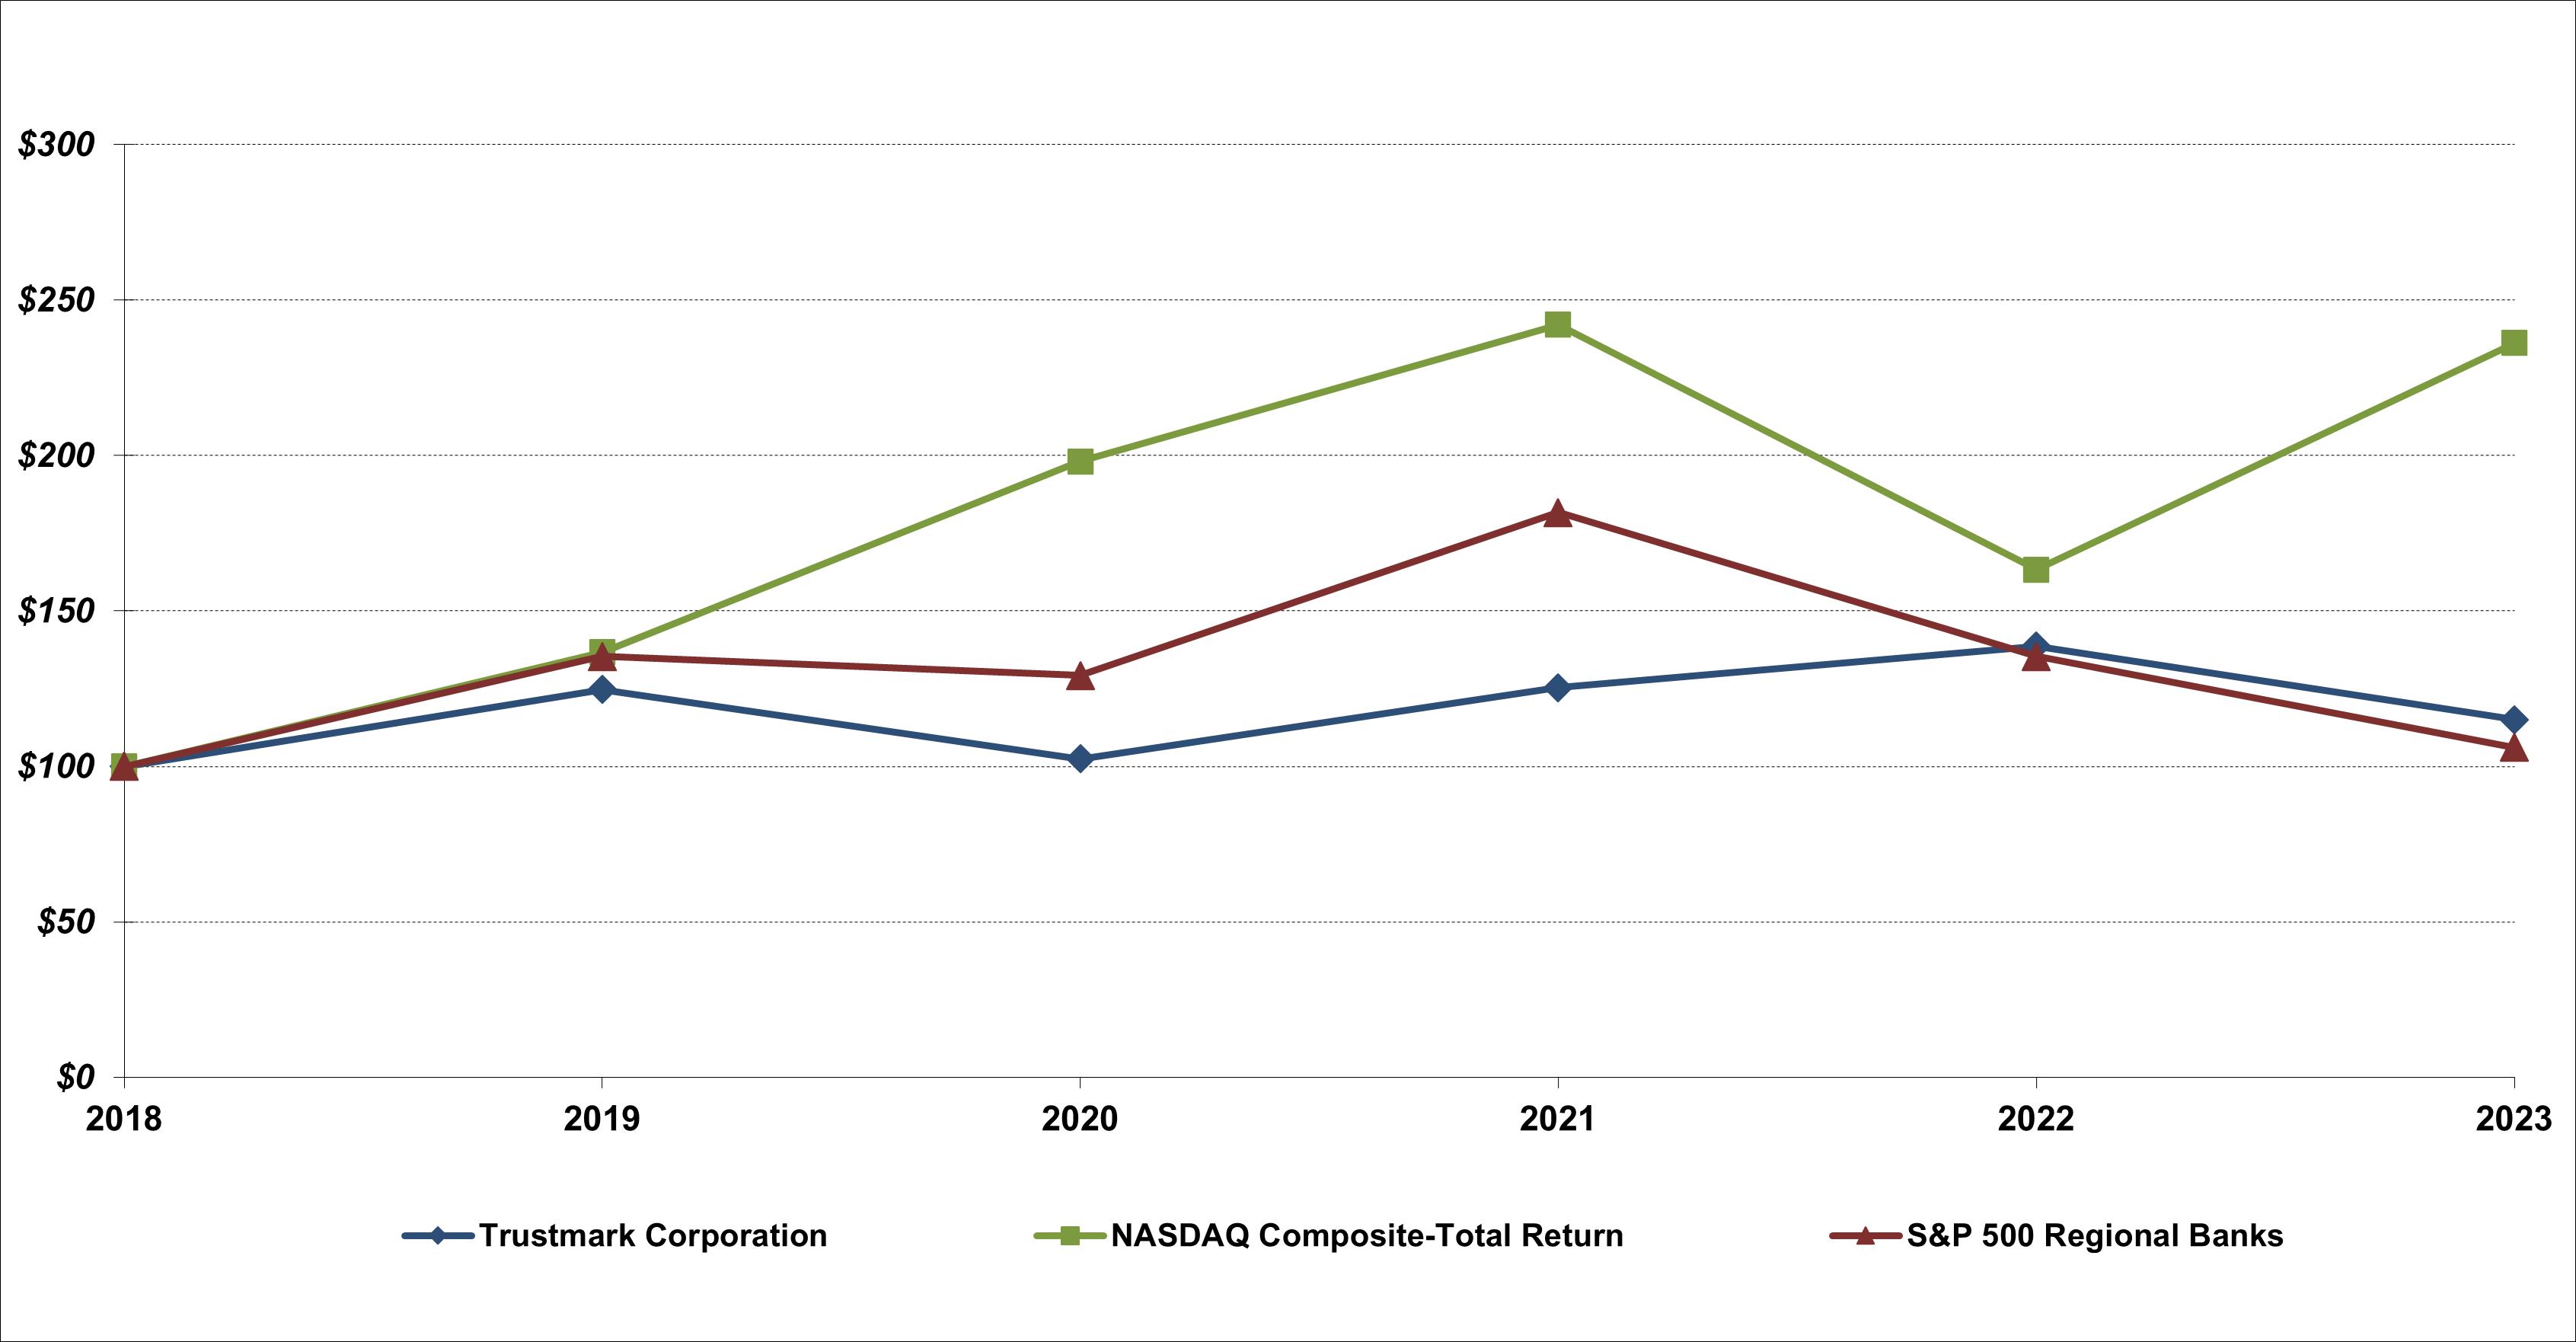
Company |
|
2018 |
|
|
2019 |
|
|
2020 |
|
|
2021 |
|
|
2022 |
|
|
2023 |
|
||||||
Trustmark |
|
$ |
100.00 |
|
|
$ |
124.73 |
|
|
$ |
102.39 |
|
|
$ |
125.30 |
|
|
$ |
138.67 |
|
|
$ |
115.09 |
|
NASDAQ Composite-Total Return |
|
|
100.00 |
|
|
|
136.69 |
|
|
|
198.10 |
|
|
|
242.03 |
|
|
|
163.28 |
|
|
|
236.17 |
|
S&P 500 - Regional Banks |
|
|
100.00 |
|
|
|
135.42 |
|
|
|
129.28 |
|
|
|
181.68 |
|
|
|
135.32 |
|
|
|
106.07 |
|
Prepared by Zacks Investment Research, Inc. Used with permission. All rights reserved. Copyright 1980-2024.
Index Data: Copyright NASDAQ OMX, Inc. Used with permission. All rights reserved.
Index Data: Copyright Standard and Poor’s, Inc. Used with permission. All rights reserved.
31
ITEM 6. SELECTED FINANCIAL DATA
The following unaudited consolidated financial data is derived from Trustmark’s audited financial statements as of and for the three years ended December 31, 2023 ($ in thousands, except per share data). The data should be read in conjunction with Part II. Item 7. - Management’s Discussion and Analysis of Financial Condition and Results of Operations and Item 8. – Financial Statements and Supplementary Data.
Years Ended December 31, |
|
2023 |
|
|
2022 |
|
|
2021 |
|
|||
Consolidated Statements of Income |
|
|
|
|
|
|
|
|
|
|||
Total interest income |
|
$ |
878,832 |
|
|
$ |
541,833 |
|
|
$ |
442,511 |
|
Total interest expense |
|
|
325,954 |
|
|
|
47,125 |
|
|
|
24,160 |
|
Net interest income |
|
|
552,878 |
|
|
|
494,708 |
|
|
|
418,351 |
|
Provision for credit losses (PCL), LHFI |
|
|
27,362 |
|
|
|
21,677 |
|
|
|
(21,499 |
) |
PCL, off-balance sheet credit exposures |
|
|
(2,781 |
) |
|
|
1,215 |
|
|
|
(2,949 |
) |
Noninterest income |
|
|
206,958 |
|
|
|
205,144 |
|
|
|
221,910 |
|
Noninterest expense |
|
|
537,919 |
|
|
|
603,213 |
|
|
|
489,296 |
|
Income before income taxes |
|
|
197,336 |
|
|
|
73,747 |
|
|
|
175,413 |
|
Income taxes |
|
|
31,847 |
|
|
|
1,860 |
|
|
|
28,048 |
|
Net Income |
|
$ |
165,489 |
|
|
$ |
71,887 |
|
|
$ |
147,365 |
|
|
|
|
|
|
|
|
|
|
|
|||
Total Revenue (1) |
|
$ |
759,836 |
|
|
$ |
699,852 |
|
|
$ |
640,261 |
|
|
|
|
|
|
|
|
|
|
|
|||
Per Share Data |
|
|
|
|
|
|
|
|
|
|||
Basic earnings per share |
|
$ |
2.71 |
|
|
$ |
1.17 |
|
|
$ |
2.35 |
|
Diluted earnings per share |
|
|
2.70 |
|
|
|
1.17 |
|
|
|
2.34 |
|
Cash dividends per share |
|
|
0.92 |
|
|
|
0.92 |
|
|
|
0.92 |
|
|
|
|
|
|
|
|
|
|
|
|||
Performance Ratios |
|
|
|
|
|
|
|
|
|
|||
Return on average equity |
|
|
10.54 |
% |
|
|
4.48 |
% |
|
|
8.32 |
% |
Return on average tangible equity |
|
|
14.04 |
% |
|
|
6.00 |
% |
|
|
10.81 |
% |
Return on average assets |
|
|
0.89 |
% |
|
|
0.41 |
% |
|
|
0.86 |
% |
Average equity / average assets |
|
|
8.41 |
% |
|
|
9.18 |
% |
|
|
10.38 |
% |
Net interest margin (fully taxable equivalent) |
|
|
3.32 |
% |
|
|
3.17 |
% |
|
|
2.76 |
% |
Dividend payout ratio |
|
|
33.95 |
% |
|
|
78.63 |
% |
|
|
39.15 |
% |
|
|
|
|
|
|
|
|
|
|
|||
Credit Quality Ratios (2) |
|
|
|
|
|
|
|
|
|
|||
Net charge-offs (recoveries)/average loans |
|
|
0.06 |
% |
|
|
0.01 |
% |
|
|
-0.04 |
% |
PCL, LHFI / average loans |
|
|
0.21 |
% |
|
|
0.19 |
% |
|
|
-0.21 |
% |
Nonaccrual LHFI / (LHFI + LHFS) |
|
|
0.76 |
% |
|
|
0.53 |
% |
|
|
0.60 |
% |
Nonperforming assets / (LHFI + LHFS) |
|
|
0.81 |
% |
|
|
0.55 |
% |
|
|
0.64 |
% |
Allowance for credit losses (ACL), LHFI / LHFI |
|
|
1.08 |
% |
|
|
0.99 |
% |
|
|
0.97 |
% |
32
December 31, |
|
2023 |
|
|
2022 |
|
|
2021 |
|
|||
Consolidated Balance Sheets |
|
|
|
|
|
|
|
|
|
|||
Total assets |
|
$ |
18,722,189 |
|
|
$ |
18,015,478 |
|
|
$ |
17,595,636 |
|
Securities |
|
|
3,189,157 |
|
|
|
3,518,596 |
|
|
|
3,581,414 |
|
Total loans (incl. PPP, LHFS and LHFI) |
|
|
13,135,336 |
|
|
|
12,339,265 |
|
|
|
10,556,871 |
|
Deposits |
|
|
15,569,763 |
|
|
|
14,437,648 |
|
|
|
15,087,160 |
|
Total shareholders' equity |
|
|
1,661,847 |
|
|
|
1,492,268 |
|
|
|
1,741,311 |
|
|
|
|
|
|
|
|
|
|
|
|||
Stock Performance |
|
|
|
|
|
|
|
|
|
|||
Market value - close |
|
$ |
27.88 |
|
|
$ |
34.91 |
|
|
$ |
32.46 |
|
Book value |
|
|
27.21 |
|
|
|
24.47 |
|
|
|
28.25 |
|
Tangible book value |
|
|
20.87 |
|
|
|
18.11 |
|
|
|
21.93 |
|
|
|
|
|
|
|
|
|
|
|
|||
Capital Ratios |
|
|
|
|
|
|
|
|
|
|||
Total equity / total assets |
|
|
8.88 |
% |
|
|
8.28 |
% |
|
|
9.90 |
% |
Tangible equity / tangible assets |
|
|
6.95 |
% |
|
|
6.27 |
% |
|
|
7.86 |
% |
Tangible equity / risk-weighted assets |
|
|
8.41 |
% |
|
|
7.61 |
% |
|
|
10.71 |
% |
Tier 1 leverage ratio (1) |
|
|
8.62 |
% |
|
|
8.47 |
% |
|
|
8.73 |
% |
Common equity tier 1 risk-based capital ratio (1) |
|
|
10.04 |
% |
|
|
9.74 |
% |
|
|
11.29 |
% |
Tier 1 risk-based capital ratio (1) |
|
|
10.44 |
% |
|
|
10.15 |
% |
|
|
11.77 |
% |
Total risk-based capital ratio (1) |
|
|
12.29 |
% |
|
|
11.91 |
% |
|
|
13.55 |
% |
ITEM 7. MANAGEMENT’S DISCUSSION AND ANALYSIS OF FINANCIAL CONDITION AND RESULTS OF OPERATIONS
The following provides a narrative discussion and analysis of Trustmark’s financial condition and results of operations. This discussion should be read in conjunction with the consolidated financial statements and the supplemental financial data included in Part II. Item 8. – Financial Statements and Supplementary Data of this report. Discussion and analysis of Trustmark’s financial condition and results of operations for the years ended December 31, 2022 and 2021 are included in the respective sections within Part II. Item 7 – Management’s Discussion and Analysis of Financial Condition and Results of Operations of Trustmark’s Annual Report filed on Form 10-K for the year ended December 31, 2022.
Executive Overview
Trustmark has been committed to meeting the banking and financial needs of its customers and communities for over 130 years and remains focused on providing support, advice and solutions to its customers' unique needs. Trustmark produced strong financial results during 2023, despite the challenging financial services environment and increasingly competitive deposit costs, reflected by significant growth in LHFI of $746.5 million, or 6.1%, and deposits of $1.132 billion, or 7.8%, an increase in net interest income of $58.2 million, or 11.8%, and solid credit quality. Trustmark’s capital position remained solid, reflecting the consistent profitability of its diversified financial services businesses.
On October 9, 2023, Trustmark entered into a settlement agreement that resolved all current and potential future claims relating to litigation involving Adams/Madison Timber. As a result, Trustmark recognized $6.5 million of litigation settlement expense which was included in noninterest expense for the third quarter of 2023.
Trustmark is committed to managing the franchise for the long term, supporting investments to promote profitable revenue growth, realigning delivery channels to support changing customer preferences as well as reengineering and efficiency opportunities to enhance long-term shareholder value. The Board of Directors of Trustmark declared a quarterly cash dividend of $0.23 per share. The dividend is payable March 15, 2024, to shareholders of record on March 1, 2024.
Financial Highlights
Trustmark reported net income of $36.1 million, or basic and diluted earnings per share (EPS) of $0.59, for the fourth quarter of 2023, compared to a net loss of $34.1 million, or basic and diluted EPS of -$0.56, in the fourth quarter of 2022. Trustmark’s reported performance during the quarter ended December 31, 2023, produced a return on average tangible equity of 11.92%, a return on average assets of 0.77%, an average equity to average assets ratio of 8.51% and a dividend payout ratio of 38.98%, compared to a return on
33
average tangible equity of -12.14%, a return on average assets of -0.76%, an average equity to average assets ratio of 8.41% and a dividend payout ratio of -41.07% during the quarter ended December 31, 2022.
The increase in net income when the fourth quarter of 2023 is compared to the fourth quarter of 2022 was principally due to the litigation settlement expense recorded during the fourth quarter of 2022 related to the Stanford Financial Group litigation. Excluding the litigation settlement expense, net income decreased $5.4 million, or 13.0%, when the fourth quarter of 2023 is compared to the fourth quarter of 2022, principally due to a decrease in revenue and an increase in noninterest expense, excluding the litigation settlement expense, partially offset by a decrease in the PCL on off-balance sheet credit exposures. Revenue, which is defined as net interest income plus noninterest income, totaled $186.5 million for the quarter ended December 31, 2023 compared to $191.8 million for the quarter ended December 31, 2022, a decrease of $5.2 million, or 2.7%. The decrease in total revenue for the fourth quarter of 2023 compared to the same time period in 2022, resulted from a decrease in net interest income, principally due to increases in interest on deposits and other interest expense largely offset by increases in interest and fees on LHFS and LHFI and other interest income, partially offset by an increase in noninterest income, principally due to increases in mortgage banking, net and insurance commissions.
Net interest income for the fourth quarter of 2023 totaled $136.7 million, a decrease of $9.8 million, or 6.7%, when compared to the fourth quarter of 2022. Interest income totaled $232.9 million for the fourth quarter of 2023, an increase of $56.4 million, or 31.9%, when compared to the same time period in 2022, principally due to increases in interest and fees on LHFS and LHFI primarily due to loan growth and rising interest rates and other interest income primarily due to an increase in the rate paid by the Federal Reserve Bank of Atlanta (FRBA) on reserves. Interest expense totaled $96.1 million for the fourth quarter of 2023, an increase of $66.2 million when compared to the same time period in 2022. The increase in interest expense when the fourth quarter of 2023 is compared to the same time period in 2022 was principally due to an increase in interest on deposits primarily due to rising interest rates, increased competition for deposits and higher average balances, and an increase in other interest expense primarily due to the increase in the rate paid on short-term FHLB advances.
Noninterest income for the fourth quarter of 2023 totaled $49.8 million, an increase of $4.6 million, or 10.3%, when compared to the fourth quarter of 2022, principally due to increases in mortgage banking, net and insurance commissions. Mortgage banking, net totaled $5.5 million for the fourth quarter of 2023, an increase of $2.1 million, or 61.9%, when compared to the same time period in 2022, principally due to a decline in the net negative hedge ineffectiveness and an increase in the gain on sales of loans, net. Insurance commissions totaled $13.2 million for the fourth quarter of 2023, an increase of $1.2 million, or 9.8%, when compared to the same time period in 2022, principally due to an increase in other commission income.
Noninterest expense for the fourth quarter of 2023 totaled $136.4 million, a decrease of $94.8 million, or 41.0%, when compared to the fourth quarter of 2022, principally due to the litigation settlement expense recorded during the fourth quarter of 2022 related to the Stanford Financial Group litigation partially offset by increases in salaries and employee benefits and other expense. Excluding the litigation settlement expense, noninterest expense increased $6.0 million, or 4.6%, when the fourth quarter of 2023 is compared to the fourth quarter of 2022. Salaries and employee benefits totaled $78.0 million for the fourth quarter of 2023, an increase of $4.5 million, or 6.2%, when compared to the same time period in 2022, principally due to increases in salaries expense, primarily due to general merit increases, and accrued management performance incentives, partially offset by a decrease in commission expense due to the decline in mortgage originations. Other expense totaled $16.6 million for the fourth quarter of 2023, an increase of $1.5 million, or 10.0%, when compared to the same time period in 2022, principally due to an increase in FDIC assessment expense.
Trustmark’s PCL, LHFI for the three months ended December 31, 2023 totaled $7.6 million compared to $6.9 million for the three months ended December 31, 2022, an increase of $683 thousand, or 9.9%. The PCL, LHFI for the fourth quarter of 2023 primarily reflected an increase in required reserves as a result of net adjustments to the qualitative reserve factors, loan growth and changes in the macroeconomic forecasts, partially offset by a decline in specific reserves for individually analyzed LHFI. The PCL, off-balance sheet credit exposures totaled a negative $888 thousand for the three months ended December 31, 2023 compared to $5.2 million for the three months ended December 31, 2022, a decrease of $6.1 million. The PCL, off-balance sheet credit exposures for the fourth quarter of 2023 primarily reflected declines in required reserves as a result of a decline in unfunded commitments. Please see the section captioned “Provision for Credit Losses,” for additional information regarding the PCL on LHFI and off-balance sheet credit exposures.
For the year ended December 31, 2023, Trustmark reported net income of $165.5 million, or basic and diluted EPS of $2.71 and $2.70, respectively, compared to $71.9 million, or basic and diluted EPS of $1.17, for the year ended December 31, 2022 and $147.4 million, or basic and diluted EPS of $2.35 and $2.34, respectively, for the year ended December 31, 2021. Trustmark’s reported performance for the year ended December 31, 2023, produced a return on average tangible equity of 14.04%, a return on average assets of 0.89% and a dividend payout ratio of 33.95%, compared to a return on average tangible equity of 6.00%, a return on average assets of 0.41% and a dividend payout ratio of 78.63% for the year ended December 31, 2022 and a return on average tangible equity of 10.81%, a return on average assets of 0.86% and a dividend payout ratio of 39.15% for the year ended December 31, 2021. Trustmark’s average equity to average assets ratio was 8.41%, 9.18% and 10.38% for the years ended December 31, 2023, 2022 and 2021, respectively.
34
Revenue totaled $759.8 million for the year ended December 31, 2023, compared to $699.9 million and $640.3 million for the years ended December 31, 2022 and 2021, respectively, an increase of $60.0 million, or 8.6%, and $59.6 million, or 9.3%, respectively. The increase in total revenue for 2023 compared to 2022 was principally due an increase in net interest income, principally due to increases in interest and fees on LHFS and LHFI and other interest income largely offset by an increase in total interest expense.
Net interest income for the year ended December 31, 2023 totaled $552.9 million, an increase of $58.2 million, or 11.8%, when compared to the year ended December 31, 2022. Interest income totaled $878.8 million for the year ended December 31, 2023, an increase of $337.0 million, or 62.2%, when compared to the year ended December 31, 2022, principally due to increases in interest and fees on LHFS and LHFI, primarily due to loan growth and rising interest rates, and other interest income, primarily due to an increase in the rate paid by the FRBA on reserves. Interest expense totaled $326.0 million for the year ended December 31, 2023, an increase of $278.8 million, when compared to the year ended December 31, 2022. The increase in interest expense when 2023 is compared to 2022 was due to an increase in interest on deposits primarily due to rising interest rates, increased competition for deposits and higher average balances, an increase in other interest expense primarily due to the increase in the amount of short-term FHLB advances held throughout 2023 as well as an increase in the rate paid for short-term FHLB advances and an increase in interest on federal funds purchased and securities sold under repurchase agreements primarily due to increases to the target rate for federal funds purchased by the FRB.
Noninterest income for 2023 totaled $207.0 million, an increase of $1.8 million, or 0.9%, when compared to 2022, principally due to increases in insurance commissions, other income, net and service charges on deposit accounts, partially offset by declines in bank card and other fees and mortgage banking, net. Insurance commissions totaled $57.6 million for 2023, an increase of $3.8 million, or 7.2%, when compared to 2022, principally due to increases in commercial property and casualty commissions and other commission income. Other income, net totaled $11.2 million for 2023, an increase of $1.3 million, or 13.7%, when compared to 2022, principally due to an increase in cash management service charges partially offset by an increase in the amortization of tax credit partnerships and a decrease in other miscellaneous income. Service charges on deposit accounts totaled $43.4 million for 2023, an increase of $1.3 million, or 3.0%, when compared to 2022, principally due to an increase in service charges on personal interest checking accounts partially offset by a decline in NSF and overdraft charges on consumer deposit accounts. Bank card and other fees totaled $33.4 million for 2023, a decline of $2.7 million, or 7.4%, when compared to 2022, principally due to declines in customer derivatives revenue and miscellaneous other bank fees. Mortgage banking, net totaled $26.2 million for 2023, a decrease of $2.1 million, or 7.4%, when compared to 2022, principally due to a decline in the gain on sales of loans, net and an increase in the net negative hedge ineffectiveness, partially offset by a decline in the run-off of the MSR.
Noninterest expense totaled $537.9 million for 2023, a decrease of $65.3 million, or 10.8%, when compared to 2022, principally due to the $100.8 million litigation settlement expense recorded during the fourth quarter of 2022, partially offset by the $6.5 million of litigation settlement expense recorded during the third quarter of 2023 as well as increases in salaries and employee benefits, other expense, services and fees and equipment expense. Excluding the litigation settlement expenses, noninterest expense increased $29.0 million, or 5.8%, when 2023 is compared to 2022. Salaries and employee benefits totaled $304.7 million for the year ended December 31, 2023, an increase of $17.2 million, or 6.0%, when compared to the year ended December 31, 2022, principally due to increases in salaries expense, primarily due to general merit increases, accrued management performance incentives and commission expense due to improvements in insurance production, partially offset by a decline in commission expense due to the decline in mortgage originations. Other expense totaled $61.7 million for 2023, an increase of $5.8 million, or 10.4%, when compared to 2022, principally due to increases in FDIC assessment expense, primarily due to an increase in the assessment rate, partially offset by a decline in loan expense. Services and fees totaled $109.5 million for 2023, an increase of $4.0 million, or 3.8%, when compared to 2022, principally due to increases in data processing charges related to software and business process outsourcing fees, partially offset by a decrease in other services and fees. Equipment expense totaled $26.1 million for 2023, an increase of $1.7 million, or 6.9%, when compared to 2022, principally due to increases in data processing equipment expenses, depreciation on furniture and equipment and personal property taxes.
Trustmark’s PCL, LHFI for 2023 totaled $27.4 million compared to $21.7 million for 2022, an increase of $5.7 million, or 26.2%. The PCL, LHFI for 2023 primarily reflected an increase in required reserves as a result of loan growth, net changes in the qualitative reserve factors, changes in the macroeconomic forecasts and extended maturities on the secured by 1-4 family residential properties portfolio resulting from lower prepayment speeds, partially offset by a decline in specific reserves for individually analyzed LHFI. The PCL, off-balance sheet credit exposures totaled a negative $2.8 million for 2023 compared to $1.2 million for 2022, a decrease of $4.0 million. The release in PCL on off-balance sheet credit exposures for 2023 primarily reflected a decrease in required reserves due to a decline in unfunded commitments partially offset by an increase in required reserves as a result of changes in the total reserve rate. Please see the section captioned “Provision for Credit Losses” for additional information regarding the PCL on LHFI and off-balance sheet credit exposures.
At December 31, 2023, nonperforming assets totaled $106.9 million, an increase of $38.9 million, or 57.3%, compared to December 31, 2022 principally due to an increase in nonaccrual LHFI. Total nonaccrual LHFI were $100.0 million at December 31, 2023, an increase of $34.0 million, or 51.6%, relative to December 31, 2022, primarily as a result of three large commercial credits placed on nonaccrual as well as an increase in mortgage nonaccruals that were partially offset by other commercial credits that were foreclosed, charged off,
35
returned to accrual or paid off. The percentage of total loans (LHFS and LHFI) that are 30 days or more past due and nonaccrual LHFI increased in 2023 to 1.69% compared to 1.33% in 2022.
LHFI totaled $12.951 billion at December 31, 2023, an increase of $746.5 million, or 6.1%, compared to December 31, 2022. The increase in LHFI during 2023 was primarily due to net growth in LHFI secured by real estate, commercial and industrial LHFI and other commercial LHFI and leases partially offset by a decline in state and other political subdivision LHFI. For additional information regarding changes in LHFI and comparative balances by loan category, see the section captioned “LHFI.”
Management has continued its practice of maintaining excess funding capacity to provide Trustmark with adequate liquidity for its ongoing operations. In this regard, Trustmark benefits from its strong deposit base, its investment portfolio and its access to funding from a variety of external funding sources such as upstream federal funds lines, FHLB advances and brokered deposits. See the section captioned “Capital Resources and Liquidity” for further discussion of the components of Trustmark’s excess funding capacity.
Total deposits were $15.570 billion at December 31, 2023, an increase of $1.132 billion, or 7.8%, compared to December 31, 2022. During 2023, noninterest-bearing deposits decreased $896.2 million, or 21.9%, as a result of declines in all categories of noninterest-bearing deposits reflecting customers' desire for higher-yielding deposit accounts. Interest-bearing deposits increased $2.028 billion, or 19.6%, during 2023, primarily due to growth in certificates of deposits (CDs), which was principally attributable to deposit campaigns offered during 2023 and the addition of $578.8 million of brokered CDs, business and consumer money market deposit accounts (MMDA) and business interest checking accounts, partially offset by declines in consumer and public interest checking accounts and consumer savings accounts.
Federal funds purchased and repurchase agreements totaled $405.7 million at December 31, 2023 compared to $449.3 million at December 31, 2022, a decrease of $43.6 million, or 9.7%, principally due to a decrease in customer sweep transactions. Trustmark had $370.0 million of upstream federal funds purchased at December 31, 2023, compared to $383.0 million at December 31, 2022. Other borrowings totaled $483.2 million at December 31, 2023, a decrease of $567.7 million, or 54.0%, when compared with $1.051 billion at December 31, 2022, principally due to a decline in outstanding short-term FHLB advances obtained from the FHLB of Dallas.
Critical Accounting Policies and Accounting Estimates
Trustmark’s consolidated financial statements are prepared in accordance with GAAP and follow general practices within the financial services industry. Application of these accounting principles requires Management to make estimates, assumptions and judgments that affect the amounts reported in the consolidated financial statements and accompanying notes. These estimates, assumptions and judgments are based on historical experience, current information and other factors deemed relevant as of the date of the consolidated financial statements; accordingly, as this information changes, actual financial results could differ from those estimates.
Certain policies inherently have a greater reliance on the use of estimates, assumptions and judgments and, as such, have a greater possibility of producing results that could be materially different than originally reported. An accounting estimate is considered critical if the accounting estimate requires Management to make assumptions about matters with a significant level of uncertainty and if the accounting estimate, or changes to the accounting estimate that are reasonably likely to occur from period to period, have had or are reasonable likely to have a material impact to the consolidated financial statements.
For additional information regarding the accounting policies discussed below, please see Note 1 – Significant Accounting Policies set forth in Part II. Item 8. – Financial Statements and Supplementary Data of this report.
Allowance for Credit Losses (ACL)
LHFI
The ACL, LHFI is a valuation account, calculated in accordance with FASB ASC Topic 326, that is deducted from the loans’ amortized cost basis to present the net amount expected to be collected on the loans. The ACL, LHFI represents Management’s best estimate of current expected credit losses on Trustmark’s existing LHFI portfolio considering available information, from internal and external sources, relevant to assessing exposure to credit loss over the contractual term of the instrument. The ACL, LHFI is adjusted through the PCL, LHFI and reduced by the charge off of loan amounts, net of recoveries.
The credit loss estimation process involves procedures to appropriately consider the unique characteristics of Trustmark’s LHFI portfolio segments. These segments are further disaggregated into loan classes, the level at which credit risk is estimated. When computing allowance levels, credit loss assumptions are estimated using a model that categorizes loan pools based on loss history, delinquency status and other credit trends and risk characteristics, including current conditions and reasonable and supportable forecasts about the future. Evaluations of the portfolio and individual credits are inherently subjective, as they require estimates, assumptions and judgments
36
as to the facts and circumstances of particular situations. Determining the appropriateness of the ACL, LHFI is complex and requires judgment by Management about the effect of matters that are inherently uncertain. While Management utilizes its best judgment and information available, the ultimate adequacy of Trustmark’s ACL, LHFI is dependent upon a variety of factors beyond its controls, including the performance of the portfolios, the economy, changes in interest rates and the view of regulatory authorities toward classification of assets. In future periods, evaluations of the overall LHFI portfolio, in light of the factors and forecasts then prevailing, may result in significant changes in the ACL and PCL for LHFI. Given the nature of many of the factors, forecasts and assumptions in the ACL methodology for LHFI, it is not possible to provide meaningful estimates of the impact of any such potential change.
For a complete description of Trustmark’s ACL methodology for the LHFI portfolio, please see Note 4 – LHFI and Allowance for Credit Losses, LHFI included in Part II. Item 8. – Financial Statements and Supplementary Data of this report.
Off-Balance Sheet Credit Exposures
Trustmark maintains a separate ACL on off-balance sheet credit exposures, including unfunded loan commitments and letters of credit, which are not unconditionally cancellable. The ACL on off-balance sheet credit exposures is a liability account calculated in accordance with FASB ASC Topic 326 and presented in the accompanying consolidated balance sheets. Adjustments to the ACL on off-balance sheet credit exposures are recorded to PCL, off-balance sheet credit exposures.
Expected credit losses for off-balance sheet credit exposures are estimated by calculating a commitment usage factor over the contractual period for exposures that are not unconditionally cancellable by Trustmark. Trustmark calculates a loan pool level unfunded amount for the period. In addition to the unfunded balances, Trustmark uses a funding rate for loan pools that are considered open-ended. In order to mitigate volatility and incorporate historical experience in the funding rate, Trustmark uses a twelve-quarter moving average. For the closed-ended loan pools, Trustmark takes a conservative approach and uses a 100% funding rate. The expected funding rate is applied to each pool’s unfunded commitment balances to ensure that reserves will be applied to each pool based upon balances expected to be funded based upon historical levels. In addition to the funding rate being applied to the unfunded commitment balance, a reserve rate is applied that is loan pool specific and is applied to the unfunded amount to ensure loss factors, both quantitative and qualitative, are being considered on the unfunded portion of the loan pool, consistent with the methodology applied to the funded loan pools.
Evaluations of the unfunded commitments are inherently subjective, as they require estimates, assumptions and judgments as to the facts and circumstances of particular situations. Determining the appropriateness of the ACL on off-balance sheet credit exposures is complex and requires judgment by Management about the effect of matters that are inherently uncertain. While Management utilizes its best judgment and information available, the ultimate adequacy of Trustmark’s ACL on off-balance sheet credit exposures is dependent upon a variety of factors beyond its control, including the performance of the portfolios, the economy, changes in interest rates and the view of regulatory authorities toward classification of assets. In future periods, evaluations of off-balance sheet credit exposures, in light of the factors and forecasts then prevailing, may result in significant changes in the ACL and PCL on off-balance sheet credit exposures. Given the nature of many of the factors, forecasts and assumptions in the ACL methodology for off-balance sheet credit exposures, it is not possible to provide meaningful estimates of the impact of any such potential change.
For a complete description of Trustmark’s ACL methodology for off-balance sheet credit exposures, please see the section captioned “Lending Related” in Note 16 – Commitments and Contingencies included in Part II. Item 8. – Financial Statements and Supplementary Data of this report.
Mortgage Servicing Rights (MSR)
Trustmark recognizes as assets the rights to service mortgage loans based on the estimated fair value of the MSR when loans are sold and the associated servicing rights are retained. Trustmark has elected to account for the MSR at fair value.
The fair value of the MSR is determined using a valuation model administered by a third party that calculates the present value of estimated future net servicing income. The model incorporates assumptions that market participants use in estimating future net servicing income, including estimates of prepayment speeds, discount rate, escrow account earnings and contractual servicing fee income and costs. Management reviews all significant assumptions at least quarterly. Mortgage loan prepayment speeds, a key assumption in the model, is the annual rate at which borrowers are forecasted to repay their mortgage loan principal. The discount rate used to determine the present value of estimated future net servicing income, another key assumption in the model, is an estimate of the required rate of return investors in the market would require for an asset with similar risk. Both assumptions can, and generally will, change as market conditions and interest rates change.
By way of example, an increase in either the prepayment speed or discount rate assumption may result in a decrease in the fair value of the MSR, while a decrease in either assumption may result in an increase in the fair value of the MSR. In recent years, there have been significant market-driven fluctuations in loan prepayment speeds and discount rates. These fluctuations can be rapid and may continue
37
to be significant. Therefore, estimating prepayment speeds and/or discount rates within ranges that market participants would use in determining the fair value of the MSR requires significant management judgment.
At December 31, 2023, the MSR fair value was $131.9 million. The impact on the MSR fair value of either a 10% adverse change in prepayment speeds or a 100 basis point increase in discount rates at December 31, 2023, would be a decline in fair value of approximately $4.8 million and $5.4 million, respectively. Changes of equal magnitude in the opposite direction would produce similar increases in fair value in the respective amounts. See the section captioned “MSR” in Note 6 – Mortgage Banking included in Part II. Item 8. – Financial Statements and Supplementary Data of this report for additional information regarding the valuation of the MSR.
Recent Legislative and Regulatory Developments
For information regarding legislation and regulation applicable to Trustmark, see the section captioned “Supervision and Regulation” included in Part I. Item 1. – Business of this report.
Non-GAAP Financial Measures
In addition to capital ratios defined by GAAP and banking regulators, Trustmark utilizes various tangible common equity measures when evaluating capital utilization and adequacy. Tangible common equity, as defined by Trustmark, represents common equity less goodwill and identifiable intangible assets. Trustmark’s Common Equity Tier 1 capital includes common stock, capital surplus and retained earnings, and is reduced by goodwill and other intangible assets, net of associated net deferred tax liabilities as well as disallowed deferred tax assets and threshold deductions as applicable.
Trustmark believes these measures are important because they reflect the level of capital available to withstand unexpected market conditions. Additionally, presentation of these measures allows readers to compare certain aspects of Trustmark’s capitalization to other organizations. These ratios differ from capital measures defined by banking regulators principally in that the numerator excludes shareholders’ equity associated with preferred securities, the nature and extent of which varies across organizations. In Management’s experience, many stock analysts use tangible common equity measures in conjunction with more traditional bank capital ratios to compare capital adequacy of banking organizations with significant amounts of goodwill or other intangible assets, typically stemming from the use of the purchase accounting method in accounting for mergers and acquisitions.
These calculations are intended to complement the capital ratios defined by GAAP and banking regulators. Because GAAP does not include these capital ratio measures, Trustmark believes there are no comparable GAAP financial measures to these tangible common equity ratios. Despite the importance of these measures to Trustmark, there are no standardized definitions for them and, as a result, Trustmark’s calculations may not be comparable with other organizations. Also, there may be limits in the usefulness of these measures to investors. As a result, Trustmark encourages readers to consider its audited consolidated financial statements and the notes related thereto in their entirety and not to rely on any single financial measure.
38
The following table reconciles Trustmark’s calculation of these measures to amounts reported under GAAP for the periods presented ($ in thousands, except per share data):
|
|
|
Years Ended December 31, |
|
|||||||||
TANGIBLE EQUITY |
|
|
2023 |
|
|
2022 |
|
|
2021 |
|
|||
AVERAGE BALANCES |
|
|
|
|
|
|
|
|
|
|
|||
Total shareholders' equity |
|
|
$ |
1,570,098 |
|
|
$ |
1,604,854 |
|
|
$ |
1,770,151 |
|
Less: Goodwill |
|
|
|
(384,237 |
) |
|
|
(384,237 |
) |
|
|
(384,463 |
) |
Identifiable intangible assets |
|
|
|
(3,259 |
) |
|
|
(4,312 |
) |
|
|
(6,205 |
) |
Total average tangible equity |
|
|
$ |
1,182,602 |
|
|
$ |
1,216,305 |
|
|
$ |
1,379,483 |
|
PERIOD END BALANCES |
|
|
|
|
|
|
|
|
|
|
|||
Total shareholders' equity |
|
|
$ |
1,661,847 |
|
|
$ |
1,492,268 |
|
|
$ |
1,741,311 |
|
Less: Goodwill |
|
|
|
(384,237 |
) |
|
|
(384,237 |
) |
|
|
(384,237 |
) |
Identifiable intangible assets |
|
|
|
(2,965 |
) |
|
|
(3,640 |
) |
|
|
(5,074 |
) |
Total tangible equity |
(a) |
|
$ |
1,274,645 |
|
|
$ |
1,104,391 |
|
|
$ |
1,352,000 |
|
|
|
|
|
|
|
|
|
|
|
|
|||
TANGIBLE ASSETS |
|
|
|
|
|
|
|
|
|
|
|||
Total assets |
|
|
$ |
18,722,189 |
|
|
$ |
18,015,478 |
|
|
$ |
17,595,636 |
|
Less: Goodwill |
|
|
|
(384,237 |
) |
|
|
(384,237 |
) |
|
|
(384,237 |
) |
Identifiable intangible assets |
|
|
|
(2,965 |
) |
|
|
(3,640 |
) |
|
|
(5,074 |
) |
Total tangible assets |
(b) |
|
$ |
18,334,987 |
|
|
$ |
17,627,601 |
|
|
$ |
17,206,325 |
|
Risk-weighted assets |
(c) |
|
$ |
15,153,263 |
|
|
$ |
14,521,078 |
|
|
$ |
12,623,630 |
|
|
|
|
|
|
|
|
|
|
|
|
|||
NET INCOME ADJUSTED FOR INTANGIBLE AMORTIZATION |
|
|
|
|
|
|
|
|
|
|
|||
Net income |
|
|
$ |
165,489 |
|
|
$ |
71,887 |
|
|
$ |
147,365 |
|
Plus: Intangible amortization net of tax |
|
|
|
505 |
|
|
|
1,076 |
|
|
|
1,738 |
|
Net income adjusted for intangible amortization |
|
|
$ |
165,994 |
|
|
$ |
72,963 |
|
|
$ |
149,103 |
|
Period end common shares outstanding |
(d) |
|
|
61,071,173 |
|
|
|
60,977,686 |
|
|
|
61,648,679 |
|
|
|
|
|
|
|
|
|
|
|
|
|||
TANGIBLE EQUITY MEASUREMENTS |
|
|
|
|
|
|
|
|
|
|
|||
Return on average tangible equity (1) |
|
|
|
14.04 |
% |
|
|
6.00 |
% |
|
|
10.81 |
% |
Tangible equity/tangible assets |
(a)/(b) |
|
|
6.95 |
% |
|
|
6.27 |
% |
|
|
7.86 |
% |
Tangible equity/risk-weighted assets |
(a)/(c) |
|
|
8.41 |
% |
|
|
7.61 |
% |
|
|
10.71 |
% |
Tangible book value |
(a)/(d)*1,000 |
|
$ |
20.87 |
|
|
$ |
18.11 |
|
|
$ |
21.93 |
|
|
|
|
|
|
|
|
|
|
|
|
|||
COMMON EQUITY TIER 1 CAPITAL (CET1) - BASEL III |
|
|
|
|
|
|
|
|
|
|
|||
Total shareholders' equity |
|
|
$ |
1,661,847 |
|
|
$ |
1,492,268 |
|
|
$ |
1,741,311 |
|
CECL transition adjustment (2) |
|
|
|
13,000 |
|
|
|
19,500 |
|
|
|
26,000 |
|
AOCI-related adjustments |
|
|
|
219,723 |
|
|
|
275,403 |
|
|
|
32,560 |
|
CET1 adjustments and deductions: |
|
|
|
|
|
|
|
|
|
|
|||
Goodwill net of associated deferred tax liabilities (DTLs) |
|
|
|
(370,212 |
) |
|
|
(370,241 |
) |
|
|
(370,252 |
) |
Other adjustments and deductions for CET1 (3) |
|
|
|
(2,693 |
) |
|
|
(3,258 |
) |
|
|
(4,392 |
) |
CET1 capital |
(e) |
|
|
1,521,665 |
|
|
|
1,413,672 |
|
|
|
1,425,227 |
|
Additional tier 1 capital instruments plus related surplus |
|
|
|
60,000 |
|
|
|
60,000 |
|
|
|
60,000 |
|
Tier 1 capital |
|
|
$ |
1,581,665 |
|
|
$ |
1,473,672 |
|
|
$ |
1,485,227 |
|
Common equity tier 1 risk-based capital ratio |
(e)/(c) |
|
|
10.04 |
% |
|
|
9.74 |
% |
|
|
11.29 |
% |
Significant Non-routine Transactions
Trustmark discloses certain non-GAAP financial measures, including net income adjusted for significant non-routine transactions, because Management uses these measures for business planning purposes, including to manage Trustmark’s business against internal projected results of operations and to measure Trustmark’s performance. Trustmark views net income adjusted for significant non-routine transactions as a measure of its core operating business, which excludes the impact of the items detailed below, as these items are generally not operational in nature. This non-GAAP measure also provides another basis for comparing period-to-period results as presented in the accompanying selected financial data table and the audited consolidated financial statements by excluding potential differences caused by non-operational and unusual or non-recurring items. Readers are cautioned that these adjustments are not permitted under GAAP. Trustmark encourages readers to consider its audited consolidated financial statements and the notes related thereto, included in Part II. Item 8. – Financial Statements and Supplementary Data of this report, in their entirety, and not to rely on any single financial measure.
39
The following table presents adjustments to net income and select financial ratios as reported in accordance with GAAP resulting from significant non-routine items occurring during the periods presented ($ in thousands, except per share data):
|
|
Years Ended December 31, |
|
|||||||||||||||||||||
|
|
2023 |
|
|
2022 |
|
|
2021 |
|
|||||||||||||||
|
|
Amount |
|
|
Diluted EPS |
|
|
Amount |
|
|
Diluted EPS |
|
|
Amount |
|
|
Diluted EPS |
|
||||||
Net income (GAAP) |
|
$ |
165,489 |
|
|
$ |
2.70 |
|
|
$ |
71,887 |
|
|
$ |
1.17 |
|
|
$ |
147,365 |
|
|
$ |
2.34 |
|
|
|
|
|
|
|
|
|
|
|
|
|
|
|
|
|
|
|
|
||||||
Significant non-routine transactions (net of taxes): |
|
|
|
|
|
|
|
|
|
|
|
|
|
|
|
|
|
|
||||||
Reduction in force expense |
|
|
1,055 |
|
|
|
0.02 |
|
|
|
— |
|
|
|
— |
|
|
|
— |
|
|
|
— |
|
Litigation settlement expense |
|
|
4,875 |
|
|
|
0.08 |
|
|
|
75,563 |
|
|
|
1.23 |
|
|
|
— |
|
|
|
— |
|
Voluntary early retirement program |
|
|
— |
|
|
|
— |
|
|
|
— |
|
|
|
— |
|
|
|
4,275 |
|
|
|
0.07 |
|
Regulatory settlement charge |
|
|
— |
|
|
|
— |
|
|
|
— |
|
|
|
— |
|
|
|
5,000 |
|
|
|
0.08 |
|
Net Income adjusted for significant |
|
$ |
171,419 |
|
|
$ |
2.80 |
|
|
$ |
147,450 |
|
|
$ |
2.40 |
|
|
$ |
156,640 |
|
|
$ |
2.49 |
|
|
|
|
|
|
|
|
|
|
|
|
|
|
|
|
|
|
|
|
||||||
|
|
Reported |
|
|
Adjusted |
|
|
Reported |
|
|
Adjusted |
|
|
Reported |
|
|
Adjusted |
|
||||||
Return on average equity |
|
|
10.54 |
% |
|
|
10.90 |
% |
|
|
4.48 |
% |
|
|
9.13 |
% |
|
|
8.32 |
% |
|
|
8.83 |
% |
Return on average tangible equity |
|
|
14.04 |
% |
|
|
14.51 |
% |
|
|
6.00 |
% |
|
|
12.12 |
% |
|
|
10.81 |
% |
|
|
11.45 |
% |
Return on average assets |
|
|
0.89 |
% |
|
|
0.92 |
% |
|
|
0.41 |
% |
|
|
0.84 |
% |
|
|
0.86 |
% |
|
|
0.92 |
% |
Reduction in Force Expense
During the fourth quarter 2023, Trustmark incurred reduction in force expenses of $1.4 million related to various restructuring initiatives.
Litigation Settlement Expense
On October 9, 2023, Trustmark entered into a settlement agreement that resolved all current and potential future claims relating to litigation involving Adams/Madison Timber. Information regarding this settlement and related litigation is set forth under the heading “Legal Proceedings” of Note 16 – Commitments and Contingencies in Part II. Item 8. – Financial Statements and Supplementary Data of this report. As a result of this settlement, Trustmark recognized a one-time charge of $6.5 million of litigation settlement expense during the third quarter of 2023.
On January 13, 2023, TNB entered into a settlement agreement relating to the litigation involving the Stanford Financial Group. Information regarding this settlement and related litigation is set forth under the heading “Legal Proceedings” of Note 16 – Commitments and Contingencies in Part II. Item 8. – Financial Statements and Supplementary Data of this report. As a result of this settlement, Trustmark recognized a one-time charge of $100.0 million of litigation settlement expense as well as an additional $750 thousand of legal fees during the fourth quarter of 2022.
Voluntary Early Retirement Program
During 2021, Trustmark completed a voluntary early retirement program and incurred one-time charges of $5.7 million ($5.6 million of non-routine salaries and employee benefits expense and $89 thousand of non-routine other miscellaneous expense) related to this program.
Regulatory Settlement Charge
During 2021, Trustmark finalized a settlement with regulatory authorities to resolve fair lending allegations in the Memphis metropolitan statistical area (MSA). Trustmark incurred a one-time settlement expense of $5.0 million and made other commitments to enhance credit opportunities to residents in majority-Black and Hispanic neighborhoods in the Memphis MSA.
Results of Operations
Net Interest Income
Net interest income is the principal component of Trustmark’s income stream and represents the difference, or spread, between interest and fee income generated from earning assets and the interest expense paid on deposits and borrowed funds. Fluctuations in interest
40
rates, as well as volume and mix changes in earning assets and interest-bearing liabilities, can materially impact net interest income. The net interest margin is computed by dividing fully taxable equivalent (FTE) net interest income by average interest-earning assets and measures how effectively Trustmark utilizes its interest-earning assets in relationship to the interest cost of funding them. The accompanying Yield/Rate Analysis Table shows the average balances for all assets and liabilities of Trustmark and the interest income or expense associated with earning assets and interest-bearing liabilities. The yields and rates have been computed based upon interest income and expense adjusted to a FTE basis using the federal statutory corporate tax rate in effect for each of the periods shown. Loans on nonaccrual have been included in the average loan balances, and interest collected prior to these loans having been placed on nonaccrual has been included in interest income. Loan fees included in interest associated with the average LHFS and LHFI balances are immaterial.
Net interest income-FTE for the year ended December 31, 2023 increased $59.3 million, or 11.7%, when compared with the year ended December 31, 2022. The increase in net interest income-FTE when 2023 is compared to 2022 was principally due to increases in interest and fees on LHFS and LHFI-FTE and other interest income, partially offset by an increase in total interest expense. The net interest margin-FTE for 2023 increased 15 basis points to 3.32% when compared to 2022. The net interest margin-FTE excluding PPP loans and the balance held at the FRBA, which equals the reported net interest income-FTE excluding interest and fees on PPP loans and interest on the FRBA balance, as a percentage of average earning assets excluding average PPP loans and the average FRBA balance, was 3.25% for 2023, a decrease of 5 basis points when compared to 3.30% for 2022. The decrease in the net interest margin-FTE excluding PPP loans and the balance held at the FRBA for 2023 was principally due to higher costs of interest-bearing liabilities, partially offset by increases in the yields on the LHFS and LHFI and securities portfolios reflecting the higher interest rate environment.
At both December 31, 2023 and 2022, Trustmark had no PPP loans outstanding.
The average FRBA balance, included in other earning assets, for 2023 totaled $617.6 million, a decrease of $229.3 million, or 27.1%, when compared to 2022. Interest earned on the FRBA balance increased $25.0 million when 2023 is compared to 2022. The yield on the FRBA balance was 5.17% and 0.82% for 2023 and 2022, respectively, an increase of 435 basis points reflecting the FRBA's increase in the interest rate that it pays on reserves during 2023.
Average interest-earning assets for 2023 were $17.082 billion compared to $16.014 billion for 2022, an increase of $1.068 billion, or 6.7%. The increase in average earning assets during 2023 was primarily due to an increase in average loans (LHFS and LHFI) of $1.565 billion, or 13.9%, which was partially offset by decreases in average securities of $302.5 million, or 7.9%, and average other earning assets of $179.2 million, or 19.8%. The increase in average loans (LHFS and LHFI) was primarily attributable to an increase in the average balance of the LHFI portfolio of $1.596 billion, or 14.5%, partially offset by a decrease in the average balance of the LHFS portfolio of $30.8 million, or 15.9%, when balances at December 31, 2023 are compared to balances at December 31, 2022. See the sections captioned "LHFS" and "LHFI" for additional information regarding changes in the LHFS and LHFI portfolios. The decrease in average securities when 2023 is compared to 2022 was principally due to calls, maturities and pay-downs of the underlying loans of government-sponsored enterprise (GSE) guaranteed securities. The decrease in average other earning assets when 2023 is compared to 2022 was primarily due to a decrease in reserves held at the FRBA.
Interest income-FTE totaled $892.3 million for 2023, an increase of $338.1 million, or 61.0%, while the yield on total earning assets increased 176 basis points to 5.22% when compared to 2022. The increase in interest income-FTE in 2023 primarily reflects increases in interest and fees on LHFS and LHFI-FTE and other interest income. During 2023, interest and fees on LHFS and LHFI-FTE increased $303.5 million, or 62.5%, when compared to 2022, while the yield on loans (LHFS and LHFI) increased to 6.16% compared to 4.32% as a result of the increase in the average balance of the LHFI portfolio as well as higher interest rates. During 2023, other interest income increased $29.1 million when compared to 2022, while the yield on other earning assets increased to 5.10% compared to 0.89%, principally due to the FRBA's increase in the interest rate paid on reserves during 2023. See the discussion above regarding changes in interest income and yields on balances held at the FRBA.
Average interest-bearing liabilities for 2023 totaled $12.983 billion compared to $10.987 billion for 2022, an increase of $1.996 billion, or 18.2%. The increase in average interest-bearing liabilities was primarily the result of increases in average interest-bearing deposits, average other borrowings and average federal funds purchased and securities sold under repurchase agreements. Average interest-bearing deposits for 2023 increased $1.083 billion, or 10.5%, when compared to 2022, reflecting growth in average time deposits and average interest-bearing demand deposits partially offset by declines in average savings deposits. Average other borrowings for 2023 increased $785.6 million when compared to 2022, principally due to the increase in short-term FHLB advances outstanding during the year. Average federal funds purchased and securities sold under repurchase agreements increased $127.6 million, or 45.0%, when 2023 is compared to 2022, principally due to an increase in upstream federal funds purchased during the year.
Interest expense for 2023 totaled $326.0 million, an increase of $278.8 million when compared with 2022, while the rate on total interest-bearing liabilities increased to 2.51% compared to 0.43%. The increase in total interest expense for 2023 reflected increases in interest on deposits, interest on federal funds purchased and securities sold under repurchase agreements and other interest expense. Interest on
41
deposits increased $216.9 million, while the rate on interest-bearing deposits increased to 2.16% compared to 0.28% when 2023 is compared to 2022, primarily due to increases in interest on all categories of interest checking accounts, CDs and MMDAs, reflecting rising interest rates and higher average balances. Other interest expense increased $47.7 million, while the rate on other borrowings increased to 5.09% compared to 3.11%, when 2023 is compared to 2022, principally due to an increase in the amount of short-term FHLB advances obtained from the FHLB of Dallas during the year as well as the interest rate paid on short-term FHLB advances. Interest expense on federal funds purchased and securities sold under repurchase agreements increased $14.3 million, while the rate on federal funds purchased and securities sold under repurchase agreements increased to 4.97% compared to 2.16%, when 2023 is compared to 2022, principally due to the FRB’s increase in the target range for the federal funds rate as well as an increase in upstream federal funds purchased during the year.
The following table provides the tax equivalent basis yield or rate for each component of the tax equivalent net interest margin for the periods presented ($ in thousands):
|
|
Years Ended December 31, |
|
|||||||||||||||||||||||||||||||||
|
|
2023 |
|
|
2022 |
|
|
2021 |
|
|||||||||||||||||||||||||||
|
|
Average |
|
|
|
|
|
Yield/ |
|
|
Average |
|
|
|
|
|
Yield/ |
|
|
Average |
|
|
|
|
|
Yield/ |
|
|||||||||
|
|
Balance |
|
|
Interest |
|
|
Rate |
|
|
Balance |
|
|
Interest |
|
|
Rate |
|
|
Balance |
|
|
Interest |
|
|
Rate |
|
|||||||||
Assets |
|
|
|
|
|
|
|
|
|
|
|
|
|
|
|
|
|
|
|
|
|
|
|
|
|
|
|
|||||||||
Interest-earning assets: |
|
|
|
|
|
|
|
|
|
|
|
|
|
|
|
|
|
|
|
|
|
|
|
|
|
|
|
|||||||||
Federal funds sold and securities |
|
$ |
1,492 |
|
|
$ |
80 |
|
|
|
5.36 |
% |
|
$ |
1,753 |
|
|
$ |
74 |
|
|
|
4.22 |
% |
|
$ |
79 |
|
|
$ |
— |
|
|
|
— |
|
Securities available for sale: |
|
|
|
|
|
|
|
|
|
|
|
|
|
|
|
|
|
|
|
|
|
|
|
|
|
|
|
|||||||||
Taxable |
|
|
2,090,201 |
|
|
|
35,359 |
|
|
|
1.69 |
% |
|
|
2,932,054 |
|
|
|
38,799 |
|
|
|
1.32 |
% |
|
|
2,573,533 |
|
|
|
30,453 |
|
|
|
1.18 |
% |
Nontaxable |
|
|
4,657 |
|
|
|
182 |
|
|
|
3.91 |
% |
|
|
4,997 |
|
|
|
195 |
|
|
|
3.90 |
% |
|
|
5,166 |
|
|
|
199 |
|
|
|
3.85 |
% |
Securities held to maturity: |
|
|
|
|
|
|
|
|
|
|
|
|
|
|
|
|
|
|
|
|
|
|
|
|
|
|
|
|||||||||
Taxable |
|
|
1,454,450 |
|
|
|
30,741 |
|
|
|
2.11 |
% |
|
|
911,010 |
|
|
|
20,918 |
|
|
|
2.30 |
% |
|
|
423,763 |
|
|
|
8,245 |
|
|
|
1.95 |
% |
Nontaxable |
|
|
1,854 |
|
|
|
81 |
|
|
|
4.37 |
% |
|
|
5,623 |
|
|
|
227 |
|
|
|
4.04 |
% |
|
|
12,765 |
|
|
|
495 |
|
|
|
3.88 |
% |
PPP loans |
|
|
— |
|
|
|
— |
|
|
|
— |
|
|
|
14,868 |
|
|
|
639 |
|
|
|
4.30 |
% |
|
|
350,668 |
|
|
|
36,726 |
|
|
|
10.47 |
% |
Loans (LHFS and LHFI) |
|
|
12,801,531 |
|
|
|
788,719 |
|
|
|
6.16 |
% |
|
|
11,236,388 |
|
|
|
485,246 |
|
|
|
4.32 |
% |
|
|
10,377,941 |
|
|
|
375,330 |
|
|
|
3.62 |
% |
Other earning assets |
|
|
728,181 |
|
|
|
37,135 |
|
|
|
5.10 |
% |
|
|
907,414 |
|
|
|
8,080 |
|
|
|
0.89 |
% |
|
|
1,825,134 |
|
|
|
2,767 |
|
|
|
0.15 |
% |
Total interest-earning assets |
|
|
17,082,366 |
|
|
|
892,297 |
|
|
|
5.22 |
% |
|
|
16,014,107 |
|
|
|
554,178 |
|
|
|
3.46 |
% |
|
|
15,569,049 |
|
|
|
454,215 |
|
|
|
2.92 |
% |
Other assets |
|
|
1,718,058 |
|
|
|
|
|
|
|
|
|
1,567,921 |
|
|
|
|
|
|
|
|
|
1,599,114 |
|
|
|
|
|
|
|
||||||
Allowance for credit losses |
|
|
(125,942 |
) |
|
|
|
|
|
|
|
|
(104,138 |
) |
|
|
|
|
|
|
|
|
(110,170 |
) |
|
|
|
|
|
|
||||||
Total Assets |
|
$ |
18,674,482 |
|
|
|
|
|
|
|
|
$ |
17,477,890 |
|
|
|
|
|
|
|
|
$ |
17,057,993 |
|
|
|
|
|
|
|
||||||
|
|
|
|
|
|
|
|
|
|
|
|
|
|
|
|
|
|
|
|
|
|
|
|
|
|
|
|
|||||||||
Liabilities and Shareholders' Equity |
|
|
|
|
|
|
|
|
|
|
|
|
|
|
|
|
|
|
|
|
|
|
|
|
|
|
|
|||||||||
Interest-bearing liabilities: |
|
|
|
|
|
|
|
|
|
|
|
|
|
|
|
|
|
|
|
|
|
|
|
|
|
|
|
|||||||||
Interest-bearing demand deposits |
|
$ |
4,871,977 |
|
|
|
121,138 |
|
|
|
2.49 |
% |
|
$ |
4,585,955 |
|
|
|
16,409 |
|
|
|
0.36 |
% |
|
$ |
4,096,746 |
|
|
|
4,906 |
|
|
|
0.12 |
% |
Savings deposits |
|
|
3,838,791 |
|
|
|
28,605 |
|
|
|
0.75 |
% |
|
|
4,579,742 |
|
|
|
9,654 |
|
|
|
0.21 |
% |
|
|
4,622,167 |
|
|
|
7,912 |
|
|
|
0.17 |
% |
Time deposits |
|
|
2,691,682 |
|
|
|
96,208 |
|
|
|
3.57 |
% |
|
|
1,153,983 |
|
|
|
3,006 |
|
|
|
0.26 |
% |
|
|
1,287,663 |
|
|
|
4,127 |
|
|
|
0.32 |
% |
Federal funds purchased and |
|
|
410,945 |
|
|
|
20,419 |
|
|
|
4.97 |
% |
|
|
283,328 |
|
|
|
6,127 |
|
|
|
2.16 |
% |
|
|
172,782 |
|
|
|
232 |
|
|
|
0.13 |
% |
Other borrowings |
|
|
984,315 |
|
|
|
50,441 |
|
|
|
5.12 |
% |
|
|
198,672 |
|
|
|
4,963 |
|
|
|
2.50 |
% |
|
|
125,554 |
|
|
|
1,037 |
|
|
|
0.83 |
% |
Subordinated notes |
|
|
123,364 |
|
|
|
4,751 |
|
|
|
3.85 |
% |
|
|
123,144 |
|
|
|
4,751 |
|
|
|
3.86 |
% |
|
|
122,933 |
|
|
|
4,752 |
|
|
|
3.87 |
% |
Junior subordinated debt securities |
|
|
61,856 |
|
|
|
4,392 |
|
|
|
7.10 |
% |
|
|
61,856 |
|
|
|
2,215 |
|
|
|
3.58 |
% |
|
|
61,856 |
|
|
|
1,194 |
|
|
|
1.93 |
% |
Total interest-bearing liabilities |
|
|
12,982,930 |
|
|
|
325,954 |
|
|
|
2.51 |
% |
|
|
10,986,680 |
|
|
|
47,125 |
|
|
|
0.43 |
% |
|
|
10,489,701 |
|
|
|
24,160 |
|
|
|
0.23 |
% |
Noninterest-bearing demand deposits |
|
|
3,532,134 |
|
|
|
|
|
|
|
|
|
4,452,046 |
|
|
|
|
|
|
|
|
|
4,531,642 |
|
|
|
|
|
|
|
||||||
Other liabilities |
|
|
589,320 |
|
|
|
|
|
|
|
|
|
434,310 |
|
|
|
|
|
|
|
|
|
266,499 |
|
|
|
|
|
|
|
||||||
Shareholders' equity |
|
|
1,570,098 |
|
|
|
|
|
|
|
|
|
1,604,854 |
|
|
|
|
|
|
|
|
|
1,770,151 |
|
|
|
|
|
|
|
||||||
Total Liabilities and |
|
$ |
18,674,482 |
|
|
|
|
|
|
|
|
$ |
17,477,890 |
|
|
|
|
|
|
|
|
$ |
17,057,993 |
|
|
|
|
|
|
|
||||||
|
|
|
|
|
|
|
|
|
|
|
|
|
|
|
|
|
|
|
|
|
|
|
|
|
|
|
|
|||||||||
Net Interest Margin |
|
|
|
|
|
566,343 |
|
|
|
3.32 |
% |
|
|
|
|
|
507,053 |
|
|
|
3.17 |
% |
|
|
|
|
|
430,055 |
|
|
|
2.76 |
% |
|||
|
|
|
|
|
|
|
|
|
|
|
|
|
|
|
|
|
|
|
|
|
|
|
|
|
|
|
|
|||||||||
Less tax equivalent adjustments: |
|
|
|
|
|
|
|
|
|
|
|
|
|
|
|
|
|
|
|
|
|
|
|
|
|
|
|
|||||||||
Investments |
|
|
|
|
|
55 |
|
|
|
|
|
|
|
|
|
89 |
|
|
|
|
|
|
|
|
|
146 |
|
|
|
|
||||||
Loans |
|
|
|
|
|
13,410 |
|
|
|
|
|
|
|
|
|
12,256 |
|
|
|
|
|
|
|
|
|
11,558 |
|
|
|
|
||||||
Net Interest Margin per |
|
|
|
|
$ |
552,878 |
|
|
|
|
|
|
|
|
$ |
494,708 |
|
|
|
|
|
|
|
|
$ |
418,351 |
|
|
|
|
||||||
42
The table below shows the change from year to year for each component of the tax equivalent net interest margin in the amount generated by volume changes and the amount generated by changes in the yield or rate (tax equivalent basis) for the periods presented ($ in thousands):
|
|
2023 Compared to 2022 |
|
|
2022 Compared to 2021 |
|
||||||||||||||||||
|
|
Increase (Decrease) Due To: |
|
|
Increase (Decrease) Due To: |
|
||||||||||||||||||
|
|
|
|
|
Yield/ |
|
|
|
|
|
|
|
|
Yield/ |
|
|
|
|
||||||
|
|
Volume |
|
|
Rate |
|
|
Net |
|
|
Volume |
|
|
Rate |
|
|
Net |
|
||||||
Interest earned on: |
|
|
|
|
|
|
|
|
|
|
|
|
|
|
|
|
|
|
||||||
Federal funds sold and securities purchased under |
|
$ |
(12 |
) |
|
$ |
18 |
|
|
$ |
6 |
|
|
$ |
— |
|
|
$ |
74 |
|
|
$ |
74 |
|
Securities available for sale: |
|
|
|
|
|
|
|
|
|
|
|
|
|
|
|
|
|
|
||||||
Taxable |
|
|
(12,720 |
) |
|
|
9,280 |
|
|
|
(3,440 |
) |
|
|
4,508 |
|
|
|
3,838 |
|
|
|
8,346 |
|
Nontaxable |
|
|
(13 |
) |
|
|
— |
|
|
|
(13 |
) |
|
|
(7 |
) |
|
|
3 |
|
|
|
(4 |
) |
Securities held to maturity: |
|
|
|
|
|
|
|
|
|
|
|
|
|
|
|
|
|
|
||||||
Taxable |
|
|
11,669 |
|
|
|
(1,846 |
) |
|
|
9,823 |
|
|
|
10,962 |
|
|
|
1,711 |
|
|
|
12,673 |
|
Nontaxable |
|
|
(164 |
) |
|
|
18 |
|
|
|
(146 |
) |
|
|
(287 |
) |
|
|
19 |
|
|
|
(268 |
) |
PPP loans |
|
|
(319 |
) |
|
|
(320 |
) |
|
|
(639 |
) |
|
|
(22,339 |
) |
|
|
(13,748 |
) |
|
|
(36,087 |
) |
Loans, net of unearned income (LHFS and LHFI) |
|
|
74,788 |
|
|
|
228,685 |
|
|
|
303,473 |
|
|
|
32,932 |
|
|
|
76,984 |
|
|
|
109,916 |
|
Other earning assets |
|
|
(1,898 |
) |
|
|
30,953 |
|
|
|
29,055 |
|
|
|
(2,008 |
) |
|
|
7,321 |
|
|
|
5,313 |
|
Total interest-earning assets |
|
|
71,331 |
|
|
|
266,788 |
|
|
|
338,119 |
|
|
|
23,761 |
|
|
|
76,202 |
|
|
|
99,963 |
|
|
|
|
|
|
|
|
|
|
|
|
|
|
|
|
|
|
|
|
||||||
Interest paid on: |
|
|
|
|
|
|
|
|
|
|
|
|
|
|
|
|
|
|
||||||
Interest-bearing demand deposits |
|
|
1,093 |
|
|
|
103,636 |
|
|
|
104,729 |
|
|
|
648 |
|
|
|
10,855 |
|
|
|
11,503 |
|
Savings deposits |
|
|
(1,806 |
) |
|
|
20,757 |
|
|
|
18,951 |
|
|
|
(73 |
) |
|
|
1,815 |
|
|
|
1,742 |
|
Time deposits |
|
|
8,831 |
|
|
|
84,371 |
|
|
|
93,202 |
|
|
|
(399 |
) |
|
|
(722 |
) |
|
|
(1,121 |
) |
Federal funds purchased and securities sold under |
|
|
3,676 |
|
|
|
10,616 |
|
|
|
14,292 |
|
|
|
233 |
|
|
|
5,662 |
|
|
|
5,895 |
|
Other borrowings |
|
|
35,951 |
|
|
|
9,527 |
|
|
|
45,478 |
|
|
|
881 |
|
|
|
3,045 |
|
|
|
3,926 |
|
Subordinated notes |
|
|
10 |
|
|
|
(10 |
) |
|
|
— |
|
|
|
9 |
|
|
|
(10 |
) |
|
|
(1 |
) |
Junior subordinated debt securities |
|
|
— |
|
|
|
2,177 |
|
|
|
2,177 |
|
|
|
— |
|
|
|
1,021 |
|
|
|
1,021 |
|
Total interest-bearing liabilities |
|
|
47,755 |
|
|
|
231,074 |
|
|
|
278,829 |
|
|
|
1,299 |
|
|
|
21,666 |
|
|
|
22,965 |
|
Change in net interest income on a tax |
|
$ |
23,576 |
|
|
$ |
35,714 |
|
|
$ |
59,290 |
|
|
$ |
22,462 |
|
|
$ |
54,536 |
|
|
$ |
76,998 |
|
The change in interest due to both volume and yield or rate has been allocated to change due to volume and change due to yield or rate in proportion to the absolute value of the change in each. Tax-exempt income has been adjusted to a tax equivalent basis using the federal statutory corporate tax rate in effect for each of the three years presented. The balances of nonaccrual loans and the related income recognized have been included for purposes of these computations.
Provision for Credit Losses
The PCL, LHFI is the amount necessary to maintain the ACL, LHFI at the amount of expected credit losses inherent within the LHFI portfolio. The amount of PCL and the related ACL for LHFI are based on Trustmark’s ACL methodology. The PCL, LHFI totaled $27.4 million for 2023, compared to a PCL, LHFI of $21.7 million for 2022 and a negative PCL, LHFI of $21.5 million for 2021. The PCL, LHFI for 2023 primarily reflected an increase in required reserves as a result of loan growth, net changes in the qualitative reserve factors, changes in the macroeconomic forecasts and extended maturities on the secured by 1-4 family residential properties portfolio resulting from lower prepayment speeds, partially offset by a decline in specific reserves for individually analyzed LHFI.
FASB ASC Topic 326 requires Trustmark to estimate expected credit losses for off-balance sheet credit exposures which are not unconditionally cancellable by Trustmark. Trustmark maintains a separate ACL on off-balance sheet credit exposures, including unfunded commitments and letters of credit. Adjustments to the ACL on off-balance sheet credit exposures are recorded to the PCL, off-balance sheet credit exposures. The PCL, off-balance sheet credit exposures totaled a negative $2.8 million for 2023 compared to $1.2 million for 2022, and a negative $2.9 million for 2021. The release in PCL on off-balance sheet credit exposures for 2023 primarily reflected a decrease in required reserves due to a decline in unfunded commitments partially offset by an increase in required reserves as a result of changes in the total reserve rate.
See the section captioned “Allowance for Credit Losses” for information regarding Trustmark’s ACL methodology as well as further analysis of the PCL.
43
Noninterest Income
Noninterest income represented 27.2%, 29.3% and 34.7% of total revenue, before securities gains (losses), net in 2023, 2022 and 2021, respectively. The following table provides the comparative components of noninterest income for the periods presented ($ in thousands):
|
|
Years Ended December 31, |
|
|||||||||||||||||||||
|
|
2023 |
|
|
2022 |
|
|
2021 |
|
|||||||||||||||
|
|
Amount |
|
|
% Change |
|
|
Amount |
|
|
% Change |
|
|
Amount |
|
|
% Change |
|
||||||
Service charges on deposit accounts |
|
$ |
43,416 |
|
|
|
3.0 |
% |
|
$ |
42,157 |
|
|
|
26.8 |
% |
|
$ |
33,246 |
|
|
|
3.0 |
% |
Bank card and other fees |
|
|
33,439 |
|
|
|
-7.4 |
% |
|
|
36,105 |
|
|
|
4.2 |
% |
|
|
34,662 |
|
|
|
11.7 |
% |
Mortgage banking, net |
|
|
26,216 |
|
|
|
-7.4 |
% |
|
|
28,306 |
|
|
|
-55.6 |
% |
|
|
63,750 |
|
|
|
-49.3 |
% |
Insurance commissions |
|
|
57,569 |
|
|
|
7.2 |
% |
|
|
53,721 |
|
|
|
10.7 |
% |
|
|
48,511 |
|
|
|
7.4 |
% |
Wealth management |
|
|
35,092 |
|
|
|
0.2 |
% |
|
|
35,013 |
|
|
|
-0.5 |
% |
|
|
35,190 |
|
|
|
11.3 |
% |
Other, net |
|
|
11,187 |
|
|
|
13.7 |
% |
|
|
9,842 |
|
|
|
50.2 |
% |
|
|
6,551 |
|
|
|
-24.3 |
% |
Total noninterest income before securities |
|
|
206,919 |
|
|
|
0.9 |
% |
|
|
205,144 |
|
|
|
-7.6 |
% |
|
|
221,910 |
|
|
|
-19.2 |
% |
Securities gains (losses), net |
|
|
39 |
|
|
n/m |
|
|
|
— |
|
|
|
— |
|
|
|
— |
|
|
|
— |
|
|
Total noninterest income |
|
$ |
206,958 |
|
|
|
0.9 |
% |
|
$ |
205,144 |
|
|
|
-7.6 |
% |
|
$ |
221,910 |
|
|
|
-19.2 |
% |
n/m - percentage changes greater than +/- 100% are not considered meaningful
Changes in various components of noninterest income for the year ended December 31, 2023 are discussed in further detail below. For analysis of Trustmark’s insurance commissions and wealth management income, please see the section captioned “Results of Segment Operations.”
Service Charges on Deposit Accounts
The increase in service charges on deposit accounts when 2023 is compared to 2022 was principally due to an increase in service charges on personal interest checking accounts partially offset by a decline in NSF and overdraft charges on consumer deposit accounts.
Bank Card and Other Fees
The decrease in bank card and other fees when 2023 is compared to 2022 was principally due to declines in customer derivatives revenue and miscellaneous other bank fees.
Mortgage Banking, Net
The following table illustrates the components of mortgage banking, net included in noninterest income for the periods presented ($ in thousands):
|
|
Years Ended December 31, |
|
|||||||||||||||||||||
|
|
2023 |
|
|
2022 |
|
|
2021 |
|
|||||||||||||||
|
|
Amount |
|
|
% Change |
|
|
Amount |
|
|
% Change |
|
|
Amount |
|
|
% Change |
|
||||||
Mortgage servicing income, net |
|
$ |
27,196 |
|
|
|
3.4 |
% |
|
$ |
26,291 |
|
|
|
3.2 |
% |
|
$ |
25,476 |
|
|
|
7.6 |
% |
Change in fair value-MSR from runoff |
|
|
(10,030 |
) |
|
|
-28.5 |
% |
|
|
(14,034 |
) |
|
|
-30.4 |
% |
|
|
(20,160 |
) |
|
|
21.5 |
% |
Gain on sales of loans, net |
|
|
15,345 |
|
|
|
-24.0 |
% |
|
|
20,178 |
|
|
|
-64.0 |
% |
|
|
55,976 |
|
|
|
-49.5 |
% |
Mortgage banking income before net hedge |
|
|
32,511 |
|
|
|
0.2 |
% |
|
|
32,435 |
|
|
|
-47.1 |
% |
|
|
61,292 |
|
|
|
-48.1 |
% |
Change in fair value-MSR from market changes |
|
|
(1,489 |
) |
|
n/m |
|
|
|
38,181 |
|
|
n/m |
|
|
|
13,258 |
|
|
n/m |
|
|||
Change in fair value of derivatives |
|
|
(4,806 |
) |
|
|
-88.6 |
% |
|
|
(42,310 |
) |
|
n/m |
|
|
|
(10,800 |
) |
|
n/m |
|
||
Net hedge ineffectiveness |
|
|
(6,295 |
) |
|
|
52.5 |
% |
|
|
(4,129 |
) |
|
n/m |
|
|
|
2,458 |
|
|
|
-68.6 |
% |
|
Mortgage banking, net |
|
$ |
26,216 |
|
|
|
-7.4 |
% |
|
$ |
28,306 |
|
|
|
-55.6 |
% |
|
$ |
63,750 |
|
|
|
-49.3 |
% |
n/m - percentage changes greater than +/- 100% are not considered meaningful
The decrease in mortgage banking, net when 2023 is compared to 2022 was principally due to a decline in the gain on sales of loans, net and an increase in the net negative hedge ineffectiveness, partially offset by a decline in the run-off of the MSR. Mortgage loan production totaled $1.454 billion for 2023, a decrease of $670.7 million, or 31.6%, when compared to 2022. Mortgage loan production totaled $2.125 billion for 2022, a decrease of $678.1 million, or 24.2%, when compared to 2021. Loans serviced for others totaled $8.477 billion at December 31, 2023, compared with $8.116 billion at December 31, 2022, and $7.953 billion at December 31, 2021.
44
Representing a significant component of mortgage banking income is gain on sales of loans, net. The decrease in the gain on sales of loans, net when 2023 is compared to 2022 was primarily the result of decreases in the volume of loans sold as well as lower profit margins in secondary marketing activities partially offset by an increase in the mortgage valuation adjustment. Loan sales decreased $107.0 million, or 8.6%, during 2023 to total $1.136 billion compared to a decrease of $1.043 billion, or 45.6%, during 2022 to total $1.243 billion. The decrease in loan sales during 2023 and 2022 was principally due to a decline in mortgage lending activity as result of rising interest rates.
Other Income, Net
The following table illustrates the components of other income, net included in noninterest income for the periods presented ($ in thousands):
|
|
Years Ended December 31, |
|
|||||||||||||||||||||
|
|
2023 |
|
|
2022 |
|
|
2021 |
|
|||||||||||||||
|
|
Amount |
|
|
% Change |
|
|
Amount |
|
|
% Change |
|
|
Amount |
|
|
% Change |
|
||||||
Partnership amortization for tax credit purposes |
|
$ |
(7,988 |
) |
|
|
28.6 |
% |
|
$ |
(6,211 |
) |
|
|
-22.5 |
% |
|
$ |
(8,011 |
) |
|
|
40.5 |
% |
Increase in life insurance cash surrender value |
|
|
7,018 |
|
|
|
5.2 |
% |
|
|
6,673 |
|
|
|
0.6 |
% |
|
|
6,630 |
|
|
|
-3.6 |
% |
Other miscellaneous income |
|
|
12,157 |
|
|
|
29.6 |
% |
|
|
9,380 |
|
|
|
18.3 |
% |
|
|
7,932 |
|
|
|
6.1 |
% |
Total other, net |
|
$ |
11,187 |
|
|
|
13.7 |
% |
|
$ |
9,842 |
|
|
|
50.2 |
% |
|
$ |
6,551 |
|
|
|
-24.3 |
% |
The increase in other income, net when 2023 is compared to 2022 was primarily due to an increase in other miscellaneous income partially offset by an increase in the amortization of tax credit partnerships as a result of investment in new tax credit partnerships. The increase in other miscellaneous income when 2023 is compared with 2022 was principally due to increases in cash management service charges partially offset by declines in gains on the sales of premises and equipment and gain on non-qualified benefit plans.
Noninterest Expense
The following table illustrates the comparative components of noninterest expense for the periods presented ($ in thousands):
|
|
Years Ended December 31, |
|
|||||||||||||||||||||
|
|
2023 |
|
|
2022 |
|
|
2021 |
|
|||||||||||||||
|
|
Amount |
|
|
% Change |
|
|
Amount |
|
|
% Change |
|
|
Amount |
|
|
% Change |
|
||||||
Salaries and employee benefits |
|
$ |
304,665 |
|
|
|
6.0 |
% |
|
$ |
287,440 |
|
|
|
1.2 |
% |
|
$ |
284,158 |
|
|
|
4.4 |
% |
Services and fees (2) |
|
|
109,478 |
|
|
|
3.8 |
% |
|
|
105,469 |
|
|
|
14.3 |
% |
|
|
92,282 |
|
|
|
10.1 |
% |
Net occupancy-premises |
|
|
29,482 |
|
|
|
0.7 |
% |
|
|
29,264 |
|
|
|
8.2 |
% |
|
|
27,043 |
|
|
|
2.1 |
% |
Equipment expense |
|
|
26,142 |
|
|
|
6.9 |
% |
|
|
24,448 |
|
|
|
0.5 |
% |
|
|
24,337 |
|
|
|
4.6 |
% |
Litigation settlement expense |
|
|
6,500 |
|
|
|
-93.5 |
% |
|
|
100,750 |
|
|
n/m |
|
|
|
— |
|
|
|
— |
|
|
Other expense (1)(2) |
|
|
61,652 |
|
|
|
10.4 |
% |
|
|
55,842 |
|
|
|
-9.2 |
% |
|
|
61,476 |
|
|
|
1.7 |
% |
Total noninterest expense |
|
$ |
537,919 |
|
|
|
-10.8 |
% |
|
$ |
603,213 |
|
|
|
23.3 |
% |
|
$ |
489,296 |
|
|
|
4.9 |
% |
n/m - percentage changes greater than +/- 100% are not considered meaningful
Changes in the various components of noninterest expense for the year ended December 31, 2023 are discussed in further detail below. Management considers disciplined expense management a key area of focus in the support of improving shareholder value.
Salaries and Employee Benefits
The increase in salaries and employee benefits expense when 2023 is compared to 2022 was principally due to increases in salaries expense, primarily due to general merit increases, accrued management performance incentives and commission expense due to improvements in insurance production, partially offset by a decline in commission expense due to the decline in mortgage originations.
Services and Fees
The increase in services and fees when 2023 is compared to 2022 was principally due to increases in data processing charges related to software and business process outsourcing fees, partially offset by a decrease in other services and fees.
45
Equipment Expense
The increase in equipment expense when 2023 is compared to 2022 was principally due to increases in data processing equipment expenses, depreciation on furniture and equipment and personal property taxes.
Other Expense
The following table illustrates the comparative components of other noninterest expense for the periods presented ($ in thousands):
|
|
Years Ended December 31, |
|
|||||||||||||||||||||
|
|
2023 |
|
|
2022 |
|
|
2021 |
|
|||||||||||||||
|
|
Amount |
|
|
% Change |
|
|
Amount |
|
|
% Change |
|
|
Amount |
|
|
% Change |
|
||||||
Loan expense (2) |
|
$ |
11,114 |
|
|
|
-9.3 |
% |
|
$ |
12,249 |
|
|
|
-0.6 |
% |
|
$ |
12,329 |
|
|
|
-18.8 |
% |
Amortization of intangibles |
|
|
675 |
|
|
|
-52.9 |
% |
|
|
1,434 |
|
|
|
-38.1 |
% |
|
|
2,316 |
|
|
|
-24.1 |
% |
FDIC assessment expense |
|
|
13,529 |
|
|
|
83.2 |
% |
|
|
7,385 |
|
|
|
33.9 |
% |
|
|
5,515 |
|
|
|
-9.4 |
% |
Regulatory settlement charge |
|
|
— |
|
|
|
— |
|
|
|
— |
|
|
|
-100.0 |
% |
|
|
5,000 |
|
|
n/m |
|
|
Other real estate expense, net (1) |
|
|
119 |
|
|
|
-89.9 |
% |
|
|
1,173 |
|
|
|
-66.8 |
% |
|
|
3,528 |
|
|
|
80.4 |
% |
Other miscellaneous expense |
|
|
36,215 |
|
|
|
7.8 |
% |
|
|
33,601 |
|
|
|
2.5 |
% |
|
|
32,788 |
|
|
|
-4.1 |
% |
Total other expense |
|
$ |
61,652 |
|
|
|
10.4 |
% |
|
$ |
55,842 |
|
|
|
-9.2 |
% |
|
$ |
61,476 |
|
|
|
1.7 |
% |
n/m - percentage changes greater than +/- 100% are not considered meaningful
The increase in other expense when 2023 is compared to 2022 was principally due to an increase in FDIC assessment expense, primarily due to an increase in the assessment rate, partially offset by a decline in loan expense.
For additional analysis of other real estate and foreclosure expenses, please see the section captioned “Nonperforming Assets.”
Results of Segment Operations
Trustmark’s operations are managed along three operating segments: General Banking, Wealth Management and Insurance. A description of each segment and the methodologies used to measure financial performance and financial information by reportable segment are included in Note 20 – Segment Information located in Part II. Item 8. – Financial Statements and Supplementary Data of this report.
The following table provides the net income by reportable segment for the periods presented ($ in thousands):
|
|
Years Ended December 31, |
|
|||||||||
|
|
2023 |
|
|
2022 |
|
|
2021 |
|
|||
General banking |
|
$ |
145,204 |
|
|
$ |
55,121 |
|
|
$ |
131,247 |
|
Wealth management |
|
|
7,958 |
|
|
|
5,671 |
|
|
|
6,650 |
|
Insurance |
|
|
12,327 |
|
|
|
11,095 |
|
|
|
9,468 |
|
Consolidated net income |
|
$ |
165,489 |
|
|
$ |
71,887 |
|
|
$ |
147,365 |
|
General Banking
Net interest income for the General Banking Segment for 2023 increased $57.6 million, or 11.8%, when compared with 2022, principally due to increases in interest and fees on LHFS and LHFI, other interest income and interest on securities, partially offset by an increase in total interest expense. Net interest income for the General Banking Segment for 2022 increased $76.2 million, or 18.4%, when compared with 2021, principally due to increases in interest and fees on LHFS and LHFI and interest on securities, partially offset by a decline in interest and fees on PPP loans and an increase in total interest expense. The PCL (LHFI and off-balance sheet credit exposures) for the General Banking Segment for 2023 totaled $26.7 million compared to a PCL of $22.9 million during 2022 and a negative PCL of $24.4 million during 2021. For more information on these net interest income items, please see the sections captioned “Financial Highlights” and “Results of Operations.”
46
Noninterest income for the General Banking Segment decreased $2.9 million, or 2.5%, during 2023 compared to a decrease of $21.5 million, or 15.6%, during 2022. The decrease in noninterest income for the General Banking Segment during 2023 was primarily due to the decreases in bank card and other fees and mortgage banking, net, partially offset by increases in service charges on deposit accounts and other income, net. The decrease in noninterest income for the General Banking Segment during 2022 was primarily due to the decrease in mortgage banking, net, partially offset by increases in service charges on deposit accounts and other income, net. Noninterest income for the General Banking Segment represented 17.2% of total revenue for 2023, 19.2% for 2022 and 25.0% for 2021. Noninterest income for the General Banking Segment includes service charges on deposit accounts; wealth management; bank card and other fees; mortgage banking, net; other income, net and securities gains (losses), net. For more information on these noninterest income items, please see the analysis included in the section captioned “Noninterest Income.”
Noninterest expense for the General Banking Segment decreased $67.9 million, or 12.8%, during 2023 compared to an increase of $109.8 million, or 26.1%, during 2022. The decrease in noninterest expense for the General Banking Segment for 2023 was principally due to decreases in litigation settlement expense, outside services and fees and loan expenses, partially offset by increases in salaries and employee benefits, data processing expenses related to software and FDIC assessment expense. During 2023, Trustmark recognized litigation settlement expense of $6.5 million as a result of the settlement relating to the litigation involving the Adams/Madison timber compared to litigation settlement expense of $100.0 million and legal fees of $750 thousand recognized in 2022 as a result of the settlement relating to the litigation involving the Stanford Financial Group. The increase in noninterest expense for the General Banking Segment for 2022 was principally due to increases in litigation settlement expense, services and fees, net occupancy-premises and salaries and employee benefits, partially offset by non-routine transaction expenses incurred during 2021. For more information on these noninterest expense items, please see the analysis included in the section captioned “Noninterest Expense.”
Wealth Management
During 2023, net income for the Wealth Management Segment increased $2.3 million, or 40.3%, compared to a decrease of $979 thousand, or 14.7%, during 2022. The increase in net income for the Wealth Management Segment during 2023 was principally due to an increase in the negative PCL. The decrease in net income for the Wealth Management Segment during 2022 was principally due to an increase in noninterest expense.
Net interest income for the Wealth Management Segment increased $558 thousand, or 10.5%, during 2023 compared to an increase of $160 thousand, or 3.1%, during 2022. The increase in net interest income for the Wealth Management Segment during 2023 and 2022 was principally due to an increase in interest and fees on loans partially offset by an increase in interest on deposits generated by the Private Banking Group. The PCL for the Wealth Management Segment for 2023 totaled a negative $2.1 million compared to a negative PCL of $21 thousand during 2022 and a negative PCL of $9 thousand during 2021.
Noninterest income for the Wealth Management Segment, which includes income related to investment management, trust and brokerage services, decreased $136 thousand, or 0.4%, during 2023, principally due to declines in income from brokerage services and other miscellaneous income partially offset by increases in income from trust management and annuity services and indirect income allocated to the Wealth Management Segment. Noninterest income for the Wealth Management Segment decreased $348 thousand, or 1.0%, during 2022, principally due to declines in income from brokerage services and trust management services, partially offset by an increase in income from annuity services. Noninterest expense decreased $534 thousand, or 1.6%, during 2023 compared to an increase of $1.2 million, or 3.6%, during 2022. The decrease in noninterest expense for the Wealth Management Segment for 2023 was principally due to a decrease in data processing charges related to software, partially offset by an increase in business process outsourcing expenses. The increase in noninterest expense for the Wealth Management Segment for 2022 was principally due to an increase in salary and employee benefit expense, primarily due to increases in commissions expense and annual performance incentives, and data processing charges related to software, partially offset by a decline in other miscellaneous expenses.
At December 31, 2023 and 2022, Trustmark held assets under management and administration of $8.250 billion and $16.913 billion and brokerage assets of $2.592 billion and $2.327 billion, respectively.
Insurance
Net income for the Insurance Segment during 2023 increased $1.2 million, or 11.1%, compared to an increase of $1.6 million, or 17.2%, during 2022. Noninterest income for the Insurance Segment, which predominately consists of insurance commissions, increased $4.8 million, or 8.9%, during 2023, compared to an increase of $5.1 million, or 10.5%, during 2022. The increase in noninterest income for the Insurance Segment during 2023 was principally due to increases in commercial property and casualty commissions, other commission income and other miscellaneous income. The increase in noninterest income for the Insurance Segment during 2022 was principally due to increases in property and casualty commissions, other commission income and group health commissions.
47
Noninterest expense for the Insurance Segment increased $3.1 million, or 8.1%, during 2023 and $2.9 million, or 8.1%, during 2022. The increase in noninterest expense for the Insurance Segment for 2023 was principally due to higher salaries expense resulting from modest general merit increases and higher commission expense due to improvements in business volumes. The increase in noninterest expense for the Insurance Segment for 2022 was principally due to higher salaries expense resulting from modest general merit increases and higher commission expense due to improvements in business volumes, partially offset by a decrease in outside services and fees.
Trustmark performed an annual impairment test of the book value of goodwill held in the Insurance Segment as of October 1, 2023, 2022, and 2021. Based on this analysis, Trustmark concluded that no impairment charge was required. An extended period of falling prices and suppressed demand for the products of the Insurance Segment could result in impairment of goodwill in the future. FBBI’s ability to maintain the current income trend is dependent on the success of the subsidiary’s continued initiatives to attract new business through cross referrals between practice units and bank relationships and seeking new business in other markets.
Income Taxes
For the year ended December 31, 2023, Trustmark’s combined effective tax rate was 16.1% compared to 2.5% in 2022 and 16.0% in 2021. The decline in the effective tax rate for 2022 was principally due to the net loss recorded for 2022 as a result of the $100.8 million of litigation settlement expense. Trustmark’s effective tax rate continues to be less than the statutory rate primarily due to various tax-exempt income items and its utilization of income tax credit programs. Trustmark invests in partnerships that provide income tax credits on a Federal and/or State basis (i.e., new market tax credits, low income housing tax credits or historical tax credits). The income tax credits related to these partnerships are utilized as specifically allowed by income tax law and are recorded as a reduction in income tax expense.
Financial Condition
Earning assets serve as the primary revenue streams for Trustmark and are comprised of securities, loans, federal funds sold, securities purchased under reverse repurchase agreements and other earning assets. Average earning assets totaled $17.082 billion, or 91.5% of total average assets, at December 31, 2023, compared with $16.014 billion, or 91.6% of total average assets, at December 31, 2022, an increase of $1.068 billion, or 6.7%.
Securities
The securities portfolio is utilized by Management to manage interest rate risk, generate interest income, provide liquidity and use as collateral for public and wholesale funding. Risk and return can be adjusted by altering duration, composition and/or balance of the portfolio. The weighted-average life of the portfolio at December 31, 2023 and 2022 was 4.5 and 4.9 years, respectively.
When compared with December 31, 2022, total investment securities decreased by $329.4 million, or 9.4%, during 2023. This decrease resulted primarily from calls, maturities and pay-downs of the underlying loans of GSE guaranteed securities partially offset by an increase in the fair market value of securities available for sale. Trustmark sold $4.8 million of available for sale securities during 2023, generating a net gain of $39 thousand, compared to no securities sold during 2022.
During 2022, Trustmark reclassified approximately $766.0 million of securities available for sale to securities held to maturity to mitigate the potential adverse impact of a rising interest rate environment on the fair value of the available for sale securities and the related impact on tangible common equity. At the date of these transfers, the net unrealized holding loss on the available for sale securities totaled approximately $91.9 million ($68.9 million net of tax). The resulting net unrealized holding losses are being amortized over the remaining life of the securities as a yield adjustment in a manner consistent with the amortization or accretion of the original purchase premium or discount on the associated security.
At December 31, 2023, the net unamortized, unrealized loss on all transferred securities included in accumulated other comprehensive income (loss) (AOCI) in the accompanying consolidated balance sheets totaled $57.6 million compared to $69.2 million at December 31, 2022.
Available for sale securities are carried at their estimated fair value with unrealized gains or losses recognized, net of taxes, in AOCI, a separate component of shareholders’ equity. At December 31, 2023, available for sale securities totaled $1.763 billion, which represented 55.3% of the securities portfolio, compared to $2.024 billion, or 57.5%, at December 31, 2022. At December 31, 2023, unrealized losses, net on available for sale securities totaled $196.1 million compared to unrealized losses, net of $246.6 million at December 31, 2022. At December 31, 2023, available for sale securities consisted of U.S. Treasury securities, GSE guaranteed mortgage-related securities and direct obligations of government agencies and GSEs.
48
Held to maturity securities are carried at amortized cost and represent those securities that Trustmark both intends and has the ability to hold to maturity. At December 31, 2023, held to maturity securities totaled $1.426 billion and represented 44.7% of the total securities portfolio, compared with $1.495 billion, or 42.5%, at December 31, 2022.
The following table details the weighted-average yield for each range of maturities of securities available for sale and held to maturity using the amortized cost at December 31, 2023 (tax equivalent basis):
|
|
Maturing |
|
|||||||||||||||||
|
|
Within |
|
|
After One, |
|
|
After Five, |
|
|
After |
|
|
Total |
|
|||||
Securities Available for Sale |
|
|
|
|
|
|
|
|
|
|
|
|
|
|
|
|||||
U.S. Treasury securities |
|
|
1.08 |
% |
|
|
1.18 |
% |
|
|
— |
|
|
|
— |
|
|
|
1.17 |
% |
U.S. Government agency obligations |
|
|
8.58 |
% |
|
|
7.00 |
% |
|
|
2.27 |
% |
|
|
7.22 |
% |
|
|
5.34 |
% |
Mortgage-backed securities |
|
|
|
|
|
|
|
|
|
|
|
|
|
|
|
|||||
Residential mortgage pass-through securities |
|
|
|
|
|
|
|
|
|
|
|
|
|
|
|
|||||
Guaranteed by GNMA |
|
|
0.93 |
% |
|
|
1.65 |
% |
|
|
3.75 |
% |
|
|
2.51 |
% |
|
|
2.51 |
% |
Issued by FNMA and FHLMC |
|
|
2.83 |
% |
|
|
2.04 |
% |
|
|
1.95 |
% |
|
|
1.44 |
% |
|
|
1.49 |
% |
Other residential mortgage-backed securities |
|
|
|
|
|
|
|
|
|
|
|
|
|
|
|
|||||
Issued or guaranteed by FNMA, FHLMC, or GNMA |
|
|
— |
|
|
|
2.37 |
% |
|
|
2.40 |
% |
|
|
2.13 |
% |
|
|
2.26 |
% |
Commercial mortgage-backed securities |
|
|
|
|
|
|
|
|
|
|
|
|
|
|
|
|||||
Issued or guaranteed by FNMA, FHLMC, or GNMA |
|
|
4.88 |
% |
|
|
3.41 |
% |
|
|
5.63 |
% |
|
|
3.57 |
% |
|
|
5.56 |
% |
Total securities available for sale |
|
|
1.10 |
% |
|
|
1.35 |
% |
|
|
3.93 |
% |
|
|
1.50 |
% |
|
|
1.69 |
% |
|
|
|
|
|
|
|
|
|
|
|
|
|
|
|
|
|||||
Securities Held to Maturity |
|
|
|
|
|
|
|
|
|
|
|
|
|
|
|
|||||
U.S. Treasury securities |
|
|
— |
|
|
|
1.04 |
% |
|
|
— |
|
|
|
— |
|
|
|
1.04 |
% |
Obligations of states and political subdivisions |
|
|
5.17 |
% |
|
|
— |
|
|
|
— |
|
|
|
— |
|
|
|
5.17 |
% |
Mortgage-backed securities |
|
|
|
|
|
|
|
|
|
|
|
|
|
|
|
|||||
Residential mortgage pass-through securities |
|
|
|
|
|
|
|
|
|
|
|
|
|
|
|
|||||
Guaranteed by GNMA |
|
|
— |
|
|
|
— |
|
|
|
— |
|
|
|
4.49 |
% |
|
|
4.49 |
% |
Issued by FNMA and FHLMC |
|
|
— |
|
|
|
1.91 |
% |
|
|
1.90 |
% |
|
|
1.68 |
% |
|
|
1.68 |
% |
Other residential mortgage-backed securities |
|
|
|
|
|
|
|
|
|
|
|
|
|
|
|
|||||
Issued or guaranteed by FNMA, FHLMC, or GNMA |
|
|
— |
|
|
|
— |
|
|
|
1.95 |
% |
|
|
1.95 |
% |
|
|
1.95 |
% |
Commercial mortgage-backed securities |
|
|
|
|
|
|
|
|
|
|
|
|
|
|
|
|||||
Issued or guaranteed by FNMA, FHLMC, or GNMA |
|
|
— |
|
|
|
2.53 |
% |
|
|
2.09 |
% |
|
|
2.96 |
% |
|
|
2.32 |
% |
Total securities held to maturity |
|
|
5.17 |
% |
|
|
2.41 |
% |
|
|
2.06 |
% |
|
|
1.81 |
% |
|
|
2.07 |
% |
Mortgage-backed securities and collateralized mortgage obligations are included in maturity categories based on their stated maturity date. Expected maturities may differ from contractual maturities because issuers may have the right to call or prepay obligations.
Management continues to focus on asset quality as one of the strategic goals of the securities portfolio, which is evidenced by the investment of approximately 99.99% of the portfolio in GSE-backed obligations and other Aaa-rated securities as determined by Moody’s Investors Services (Moody’s). None of the securities owned by Trustmark are collateralized by assets which are considered sub-prime. Furthermore, outside of stock ownership in the FHLB of Dallas, FHLB of Atlanta and FRBA, Trustmark does not hold any other equity investment in a GSE.
At December 31, 2023, Trustmark did not hold securities of any one issuer with a carrying value exceeding ten percent of total shareholders’ equity, other than certain GSEs which are exempt from inclusion. Management continues to closely monitor the credit quality as well as the ratings of the debt and mortgage-backed securities issued by the GSEs and held in Trustmark’s securities portfolio.
49
The following table presents Trustmark’s securities portfolio by amortized cost and estimated fair value and by credit rating, as determined by Moody’s, at December 31, 2023 ($ in thousands):
|
|
December 31, 2023 |
|
|||||||||||||
|
|
Amortized Cost |
|
|
Estimated Fair Value |
|
||||||||||
|
|
Amount |
|
|
% |
|
|
Amount |
|
|
% |
|
||||
Securities Available for Sale |
|
|
|
|
|
|
|
|
|
|
|
|
||||
Aaa |
|
$ |
1,959,007 |
|
|
|
100.0 |
% |
|
$ |
1,762,878 |
|
|
|
100.0 |
% |
Total securities available for sale |
|
$ |
1,959,007 |
|
|
|
100.0 |
% |
|
$ |
1,762,878 |
|
|
|
100.0 |
% |
|
|
|
|
|
|
|
|
|
|
|
|
|
||||
Securities Held to Maturity |
|
|
|
|
|
|
|
|
|
|
|
|
||||
Aaa |
|
$ |
1,425,939 |
|
|
|
100.0 |
% |
|
$ |
1,355,164 |
|
|
|
100.0 |
% |
Not Rated (1) |
|
|
340 |
|
|
|
— |
|
|
|
340 |
|
|
|
— |
|
Total securities held to maturity |
|
$ |
1,426,279 |
|
|
|
100.0 |
% |
|
$ |
1,355,504 |
|
|
|
100.0 |
% |
The table above presenting the credit rating of Trustmark’s securities is formatted to show the securities according to the credit rating category, and not by category of the underlying security. At December 31, 2023, approximately 100.0% of the available for sale securities, measured at the estimated fair value, and the held to maturity securities, measured at amortized cost, were rated Aaa.
LHFS
At December 31, 2023, LHFS totaled $184.8 million, consisting of $106.0 million of residential real estate mortgage loans in the process of being sold to third parties and $78.8 million of Government National Mortgage Association (GNMA) optional repurchase loans. At December 31, 2022, LHFS totaled $135.2 million, consisting of $64.4 million of residential real estate mortgage loans in the process of being sold to third parties and $70.8 million of GNMA optional repurchase loans. Please refer to the nonperforming assets table that follows for information on GNMA loans eligible for repurchase which are past due 90 days or more.
Trustmark did not exercise its buy-back option on any delinquent loans serviced for GNMA during 2023 or 2022.
For additional information regarding the GNMA optional repurchase loans, please see the section captioned “Past Due LHFS” included in Note 4 – LHFI and Allowance for Credit Losses, LHFI of Part II. Item 8. – Financial Statements and Supplementary Data of this report.
LHFI
The table below provides the carrying value of the LHFI portfolio by loan class for the years ended December 31, 2023 and 2022 ($ in thousands):
|
|
December 31, |
|
|||||||||||||
|
|
2023 |
|
|
2022 |
|
||||||||||
|
|
Amount |
|
|
% |
|
|
Amount |
|
|
% |
|
||||
Loans secured by real estate: |
|
|
|
|
|
|
|
|
|
|
|
|
||||
Construction, land development and other land |
|
$ |
642,886 |
|
|
|
5.0 |
% |
|
$ |
690,616 |
|
|
|
5.7 |
% |
Other secured by 1-4 family residential properties |
|
|
622,397 |
|
|
|
4.8 |
% |
|
|
590,790 |
|
|
|
4.8 |
% |
Secured by nonfarm, nonresidential properties |
|
|
3,489,434 |
|
|
|
26.9 |
% |
|
|
3,278,830 |
|
|
|
26.9 |
% |
Other real estate secured |
|
|
1,312,551 |
|
|
|
10.1 |
% |
|
|
742,538 |
|
|
|
6.1 |
% |
Other loans secured by real estate: |
|
|
|
|
|
|
|
|
|
|
|
|
||||
Other construction |
|
|
867,793 |
|
|
|
6.7 |
% |
|
|
1,028,926 |
|
|
|
8.4 |
% |
Secured by 1-4 family residential properties |
|
|
2,282,318 |
|
|
|
17.6 |
% |
|
|
2,185,057 |
|
|
|
17.9 |
% |
Commercial and industrial loans |
|
|
1,922,910 |
|
|
|
14.9 |
% |
|
|
1,821,259 |
|
|
|
14.9 |
% |
Consumer loans |
|
|
165,734 |
|
|
|
1.3 |
% |
|
|
170,230 |
|
|
|
1.4 |
% |
State and other political subdivision loans |
|
|
1,088,466 |
|
|
|
8.4 |
% |
|
|
1,223,863 |
|
|
|
10.0 |
% |
Other commercial loans and leases |
|
|
556,035 |
|
|
|
4.3 |
% |
|
|
471,930 |
|
|
|
3.9 |
% |
LHFI |
|
$ |
12,950,524 |
|
|
|
100.0 |
% |
|
$ |
12,204,039 |
|
|
|
100.0 |
% |
LHFI at December 31, 2023 increased $746.5 million, or 6.1%, compared to December 31, 2022. The increase in LHFI during 2023 was primarily due to net growth in LHFI secured by real estate, commercial and industrial LHFI and other commercial LHFI and leases partially offset by a decline in state and other political subdivision LHFI.
50
LHFI secured by real estate (loans secured by real estate and other loans secured by real estate) increased $700.6 million, or 8.2%, during 2023, principally due to net growth in Trustmark's Alabama, Mississippi and Texas market regions. LHFI secured by other real estate increased $570.0 million, or 76.8%, during 2023, primarily due to other construction loans that moved to LHFI secured by multi-family residential properties in the Alabama, Texas and Mississippi market regions, partially offset by pay-offs of LHFI secured by multi-family residential properties. Excluding other construction loan reclassifications, LHFI secured by other real estate declined by $160.8 million, or 21.7%. LHFI secured by nonfarm, nonresidential properties (NFNR LHFI) increased $210.6 million, or 6.4%, during 2023, principally due to movement from the other construction loans category. Excluding other construction loan reclassifications, the NFNR LHFI portfolio decreased $286.0 million, or 8.7%, during 2023 primarily due to declines in nonowner-occupied loans in the Mississippi, Alabama, Florida and Tennessee market regions as well as declines in owner-occupied loans in the Texas and Alabama market regions, which were partially offset by growth in owner-occupied loans in the Mississippi market region and nonowner-occupied loans in the Texas market region. Other construction loans decreased $161.1 million, or 15.7%, during 2023 primarily due to other construction loans moved to other loan categories upon the completion of the related construction project partially offset by new construction loans across all five market regions. During 2023, $1.227 billion loans were moved from other construction to other loan categories, including $730.8 million to multi-family residential loans, $419.1 million to nonowner-occupied loans and $77.5 million to owner-occupied loans. Excluding all reclassifications between loan categories, other construction loans increased $1.060 billion during 2023, reflecting growth in the Alabama, Texas, Mississippi and Florida market regions. LHFI secured by 1-4 family residential properties increased $97.3 million, or 4.5%, during 2023, primarily in the Mississippi market region. Trustmark's LHFI secured by 1-4 family residential properties are primarily included in the Mississippi market region because these loans are centrally analyzed and approved as part of the mortgage line of business which is located in Jackson, Mississippi. LHFI secured by construction, land development and other land decreased $47.7 million, or 6.9%, during 2023 principally due to declines in 1-4 family construction loans in Trustmark's Alabama, Florida, Tennessee and Mississippi market regions. LHFI secured by other 1-4 family residential properties, which primarily consists of revolving home equity lines of credit, increased $31.6 million, or 5.4%, during 2023 reflecting growth across all five market regions.
Commercial and industrial LHFI increased $101.7 million, or 5.6%, during 2023, primarily due to growth in Trustmark’s Alabama market region, principally due to the growth in equipment finance (EF) loans, partially offset by a decline in the Tennessee market region. Other commercial LHFI and leases increased $84.1 million, or 17.8%, during 2023, principally due to an increase in the Alabama market region, primarily due to growth in EF leases, partially offset by declines in the Mississippi and Tennessee market regions. During 2023, Trustmark introduced the EF lending line of business through its Georgia LPO providing commercial customers with loans and leases for equipment and machinery. At December 31, 2023, EF loans totaled $130.5 million and were included in the commercial and industrial LHFI loan portfolio in Trustmark's Alabama market region. At December 31, 2023, EF leases, which include sales-type and direct financing leases, totaled $137.7 million and were included in the other commercial LHFI and leases portfolio in Trustmark's Alabama market region. For additional information regarding the EF leases, please see the sections captioned “Lessor Arrangements” included in Note 1 - Significant Accounting Policies and Note 9 – Leases of Part II. Item 8. – Financial Statements and Supplementary Data of this report.
State and other political subdivision LHFI decreased $135.4 million, or 11.1%, during 2023 reflecting declines across all five market regions.
The following table provides information regarding Trustmark’s home equity loans and home equity lines of credit which are included in the LHFI secured by 1-4 family residential properties at December 31, 2023 and 2022 ($ in thousands):
|
|
December 31, |
|
|||||
|
|
2023 |
|
|
2022 |
|
||
Home equity loans |
|
$ |
58,176 |
|
|
$ |
45,532 |
|
Home equity lines of credit |
|
|
430,933 |
|
|
|
412,013 |
|
Percentage of loans and lines for which Trustmark holds first lien |
|
|
47.8 |
% |
|
|
51.7 |
% |
Percentage of loans and lines for which Trustmark does not hold first lien |
|
|
52.2 |
% |
|
|
48.3 |
% |
Due to the increased risk associated with second liens, loan terms and underwriting guidelines differ from those used for products secured by first liens. Loan amounts and loan-to-value ratios are limited and are lower for second liens than first liens. Also, interest rates and maximum amortization periods are adjusted accordingly. In addition, regardless of lien position, the passing credit score for approval of all home equity lines of credit is higher than that of term loans. The ACL on LHFI is also reflective of the increased risk related to second liens through application of a greater loss factor to this portion of the portfolio.
In the following tables, LHFI reported by region (along with related nonperforming assets and net charge-offs) are associated with location of origination except for loans secured by 1-4 family residential properties (representing traditional mortgages) and credit cards. These loans are included in the Mississippi market region because they are centrally analyzed and approved as part of a specific line of business located at Trustmark’s headquarters in Jackson, Mississippi.
51
The following table presents the LHFI composition by region at December 31, 2023 and reflects a diversified mix of loans by region ($ in thousands):
|
|
December 31, 2023 |
|
|||||||||||||||||||||
LHFI Composition by Region |
|
Total |
|
|
Alabama |
|
|
Florida |
|
|
Mississippi |
|
|
Tennessee |
|
|
Texas |
|
||||||
Loans secured by real estate: |
|
|
|
|
|
|
|
|
|
|
|
|
|
|
|
|
|
|
||||||
Construction, land development and other land |
|
$ |
642,886 |
|
|
$ |
286,345 |
|
|
$ |
35,567 |
|
|
$ |
185,817 |
|
|
$ |
37,194 |
|
|
$ |
97,963 |
|
Other secured by 1-4 family residential |
|
|
622,397 |
|
|
|
151,446 |
|
|
|
54,998 |
|
|
|
304,167 |
|
|
|
79,875 |
|
|
|
31,911 |
|
Secured by nonfarm, nonresidential properties |
|
|
3,489,434 |
|
|
|
960,656 |
|
|
|
233,908 |
|
|
|
1,431,968 |
|
|
|
153,226 |
|
|
|
709,676 |
|
Other real estate secured |
|
|
1,312,551 |
|
|
|
583,165 |
|
|
|
1,761 |
|
|
|
396,715 |
|
|
|
7,587 |
|
|
|
323,323 |
|
Other loans secured by real estate: |
|
|
|
|
|
|
|
|
|
|
|
|
|
|
|
|
|
|
||||||
Other construction |
|
|
867,793 |
|
|
|
402,093 |
|
|
|
2,059 |
|
|
|
249,589 |
|
|
|
— |
|
|
|
214,052 |
|
Secured by 1-4 family residential properties |
|
|
2,282,318 |
|
|
|
— |
|
|
|
— |
|
|
|
2,278,162 |
|
|
|
4,156 |
|
|
|
— |
|
Commercial and industrial loans |
|
|
1,922,910 |
|
|
|
658,573 |
|
|
|
25,406 |
|
|
|
780,949 |
|
|
|
217,729 |
|
|
|
240,253 |
|
Consumer loans |
|
|
165,734 |
|
|
|
22,752 |
|
|
|
7,491 |
|
|
|
105,502 |
|
|
|
20,306 |
|
|
|
9,683 |
|
State and other political subdivision loans |
|
|
1,088,466 |
|
|
|
71,882 |
|
|
|
52,759 |
|
|
|
813,291 |
|
|
|
25,999 |
|
|
|
124,535 |
|
Other commercial loans and leases |
|
|
556,035 |
|
|
|
209,731 |
|
|
|
8,494 |
|
|
|
219,470 |
|
|
|
46,646 |
|
|
|
71,694 |
|
LHFI |
|
$ |
12,950,524 |
|
|
$ |
3,346,643 |
|
|
$ |
422,443 |
|
|
$ |
6,765,630 |
|
|
$ |
592,718 |
|
|
$ |
1,823,090 |
|
|
|
|
|
|
|
|
|
|
|
|
|
|
|
|
|
|
|
|
||||||
Construction, Land Development and Other Land Loans by Region |
|
|||||||||||||||||||||||
Lots |
|
$ |
71,875 |
|
|
$ |
30,186 |
|
|
$ |
8,353 |
|
|
$ |
17,257 |
|
|
$ |
4,714 |
|
|
$ |
11,365 |
|
Development |
|
|
146,655 |
|
|
|
74,015 |
|
|
|
1,262 |
|
|
|
36,690 |
|
|
|
12,649 |
|
|
|
22,039 |
|
Unimproved land |
|
|
101,941 |
|
|
|
17,432 |
|
|
|
12,853 |
|
|
|
36,573 |
|
|
|
8,094 |
|
|
|
26,989 |
|
1-4 family construction |
|
|
322,415 |
|
|
|
164,712 |
|
|
|
13,099 |
|
|
|
95,297 |
|
|
|
11,737 |
|
|
|
37,570 |
|
Construction, land development and |
|
$ |
642,886 |
|
|
$ |
286,345 |
|
|
$ |
35,567 |
|
|
$ |
185,817 |
|
|
$ |
37,194 |
|
|
$ |
97,963 |
|
|
|
|
|
|
|
|
|
|
|
|
|
|
|
|
|
|
|
|
||||||
Loans Secured by Nonfarm, Nonresidential (NFNR) Properties by Region |
|
|||||||||||||||||||||||
Nonowner-occupied: |
|
|
|
|
|
|
|
|
|
|
|
|
|
|
|
|
|
|
||||||
Retail |
|
$ |
346,844 |
|
|
$ |
128,743 |
|
|
$ |
25,732 |
|
|
$ |
91,057 |
|
|
$ |
17,721 |
|
|
$ |
83,591 |
|
Office |
|
|
286,511 |
|
|
|
104,114 |
|
|
|
19,857 |
|
|
|
94,294 |
|
|
|
1,649 |
|
|
|
66,597 |
|
Hotel/motel |
|
|
270,740 |
|
|
|
144,403 |
|
|
|
47,111 |
|
|
|
53,227 |
|
|
|
25,999 |
|
|
|
— |
|
Mini-storage |
|
|
157,938 |
|
|
|
32,452 |
|
|
|
1,917 |
|
|
|
103,500 |
|
|
|
756 |
|
|
|
19,313 |
|
Industrial |
|
|
382,737 |
|
|
|
57,386 |
|
|
|
19,762 |
|
|
|
123,306 |
|
|
|
9,730 |
|
|
|
172,553 |
|
Health care |
|
|
97,783 |
|
|
|
69,352 |
|
|
|
688 |
|
|
|
25,021 |
|
|
|
333 |
|
|
|
2,389 |
|
Convenience stores |
|
|
26,254 |
|
|
|
3,315 |
|
|
|
425 |
|
|
|
13,777 |
|
|
|
249 |
|
|
|
8,488 |
|
Nursing homes/senior living |
|
|
508,665 |
|
|
|
229,352 |
|
|
|
— |
|
|
|
160,359 |
|
|
|
4,901 |
|
|
|
114,053 |
|
Other |
|
|
110,828 |
|
|
|
31,370 |
|
|
|
9,232 |
|
|
|
52,521 |
|
|
|
8,321 |
|
|
|
9,384 |
|
Total nonowner-occupied loans |
|
|
2,188,300 |
|
|
|
800,487 |
|
|
|
124,724 |
|
|
|
717,062 |
|
|
|
69,659 |
|
|
|
476,368 |
|
|
|
|
|
|
|
|
|
|
|
|
|
|
|
|
|
|
|
|
||||||
Owner-occupied: |
|
|
|
|
|
|
|
|
|
|
|
|
|
|
|
|
|
|
||||||
Office |
|
|
152,053 |
|
|
|
44,028 |
|
|
|
38,401 |
|
|
|
39,790 |
|
|
|
11,459 |
|
|
|
18,375 |
|
Churches |
|
|
62,217 |
|
|
|
17,098 |
|
|
|
4,178 |
|
|
|
34,899 |
|
|
|
3,541 |
|
|
|
2,501 |
|
Industrial warehouses |
|
|
159,227 |
|
|
|
11,619 |
|
|
|
4,618 |
|
|
|
40,837 |
|
|
|
16,330 |
|
|
|
85,823 |
|
Health care |
|
|
125,304 |
|
|
|
11,031 |
|
|
|
6,274 |
|
|
|
87,507 |
|
|
|
2,269 |
|
|
|
18,223 |
|
Convenience stores |
|
|
142,537 |
|
|
|
12,593 |
|
|
|
29,299 |
|
|
|
65,031 |
|
|
|
14 |
|
|
|
35,600 |
|
Retail |
|
|
89,174 |
|
|
|
9,606 |
|
|
|
15,644 |
|
|
|
37,340 |
|
|
|
17,694 |
|
|
|
8,890 |
|
Restaurants |
|
|
48,172 |
|
|
|
4,010 |
|
|
|
3,503 |
|
|
|
22,316 |
|
|
|
15,095 |
|
|
|
3,248 |
|
Auto dealerships |
|
|
43,556 |
|
|
|
5,533 |
|
|
|
201 |
|
|
|
21,383 |
|
|
|
16,439 |
|
|
|
— |
|
Nursing homes/senior living |
|
|
345,108 |
|
|
|
31,644 |
|
|
|
— |
|
|
|
287,264 |
|
|
|
— |
|
|
|
26,200 |
|
Other |
|
|
133,786 |
|
|
|
13,007 |
|
|
|
7,066 |
|
|
|
78,539 |
|
|
|
726 |
|
|
|
34,448 |
|
Total owner-occupied loans |
|
|
1,301,134 |
|
|
|
160,169 |
|
|
|
109,184 |
|
|
|
714,906 |
|
|
|
83,567 |
|
|
|
233,308 |
|
Loans secured by NFNR properties |
|
$ |
3,489,434 |
|
|
$ |
960,656 |
|
|
$ |
233,908 |
|
|
$ |
1,431,968 |
|
|
$ |
153,226 |
|
|
$ |
709,676 |
|
52
Trustmark’s variable rate LHFI are based primarily on various prime and SOFR interest rate bases. The following table provides information regarding Trustmark’s LHFI maturities by loan class and interest rate terms at December 31, 2023 ($ in thousands):
|
|
Maturing |
|
|||||||||||||||||
|
|
|
|
|
One Year |
|
|
Five Years |
|
|
|
|
|
|
|
|||||
|
|
Within |
|
|
Through |
|
|
Through |
|
|
After |
|
|
|
|
|||||
|
|
One Year |
|
|
Five |
|
|
Fifteen |
|
|
Fifteen |
|
|
|
|
|||||
|
|
or Less |
|
|
Years |
|
|
Years |
|
|
Years |
|
|
Total |
|
|||||
Loans secured by real estate: |
|
|
|
|
|
|
|
|
|
|
|
|
|
|
|
|||||
Construction, land development and other land |
|
$ |
412,967 |
|
|
$ |
192,672 |
|
|
$ |
19,576 |
|
|
$ |
17,671 |
|
|
$ |
642,886 |
|
Other secured by 1-4 family residential properties |
|
|
56,969 |
|
|
|
238,281 |
|
|
|
310,411 |
|
|
|
16,736 |
|
|
|
622,397 |
|
Secured by nonfarm, nonresidential properties |
|
|
754,572 |
|
|
|
2,134,093 |
|
|
|
589,766 |
|
|
|
11,003 |
|
|
|
3,489,434 |
|
Other real estate secured |
|
|
467,767 |
|
|
|
783,585 |
|
|
|
61,183 |
|
|
|
16 |
|
|
|
1,312,551 |
|
Other loans secured by real estate: |
|
|
|
|
|
|
|
|
|
|
|
|
|
|
|
|||||
Other construction |
|
|
85,609 |
|
|
|
756,987 |
|
|
|
25,197 |
|
|
|
— |
|
|
|
867,793 |
|
Secured by 1-4 family residential properties |
|
|
32,907 |
|
|
|
173,694 |
|
|
|
1,042,746 |
|
|
|
1,032,971 |
|
|
|
2,282,318 |
|
Commercial and industrial loans |
|
|
394,100 |
|
|
|
1,407,426 |
|
|
|
121,384 |
|
|
|
— |
|
|
|
1,922,910 |
|
Consumer loans |
|
|
47,201 |
|
|
|
112,881 |
|
|
|
5,652 |
|
|
|
— |
|
|
|
165,734 |
|
State and other political subdivision loans |
|
|
166,048 |
|
|
|
481,354 |
|
|
|
395,030 |
|
|
|
46,034 |
|
|
|
1,088,466 |
|
Other commercial loans and leases |
|
|
82,096 |
|
|
|
353,230 |
|
|
|
120,298 |
|
|
|
411 |
|
|
|
556,035 |
|
LHFI |
|
$ |
2,500,236 |
|
|
$ |
6,634,203 |
|
|
$ |
2,691,243 |
|
|
$ |
1,124,842 |
|
|
$ |
12,950,524 |
|
|
|
|
|
|
|
|
|
|
|
|
|
|
|
|
|
|||||
Loans with Fixed Interest Rates |
|
|
|
|
|
|
|
|
|
|
|
|
|
|
|
|||||
Loans secured by real estate: |
|
|
|
|
|
|
|
|
|
|
|
|
|
|
|
|||||
Construction, land development and other land |
|
$ |
66,290 |
|
|
$ |
55,541 |
|
|
$ |
18,641 |
|
|
$ |
17,671 |
|
|
$ |
158,143 |
|
Other secured by 1-4 family residential properties |
|
|
27,414 |
|
|
|
112,902 |
|
|
|
39,957 |
|
|
|
392 |
|
|
|
180,665 |
|
Secured by nonfarm, nonresidential properties |
|
|
331,490 |
|
|
|
988,144 |
|
|
|
167,304 |
|
|
|
317 |
|
|
|
1,487,255 |
|
Other real estate secured |
|
|
46,600 |
|
|
|
90,350 |
|
|
|
10,145 |
|
|
|
16 |
|
|
|
147,111 |
|
Other loans secured by real estate: |
|
|
|
|
|
|
|
|
|
|
|
|
|
|
|
|||||
Other construction |
|
|
5,530 |
|
|
|
3,509 |
|
|
|
1,201 |
|
|
|
— |
|
|
|
10,240 |
|
Secured by 1-4 family residential properties |
|
|
1,944 |
|
|
|
38,959 |
|
|
|
306,835 |
|
|
|
1,026,761 |
|
|
|
1,374,499 |
|
Commercial and industrial loans |
|
|
89,144 |
|
|
|
568,126 |
|
|
|
99,542 |
|
|
|
— |
|
|
|
756,812 |
|
Consumer loans |
|
|
28,349 |
|
|
|
103,423 |
|
|
|
5,652 |
|
|
|
— |
|
|
|
137,424 |
|
State and other political subdivision loans |
|
|
164,702 |
|
|
|
454,756 |
|
|
|
376,780 |
|
|
|
25,854 |
|
|
|
1,022,092 |
|
Other commercial loans and leases |
|
|
21,019 |
|
|
|
159,494 |
|
|
|
119,506 |
|
|
|
75 |
|
|
|
300,094 |
|
LHFI |
|
$ |
782,482 |
|
|
$ |
2,575,204 |
|
|
$ |
1,145,563 |
|
|
$ |
1,071,086 |
|
|
$ |
5,574,335 |
|
|
|
|
|
|
|
|
|
|
|
|
|
|
|
|
|
|||||
Loans with Variable Interest Rates |
|
|
|
|
|
|
|
|
|
|
|
|
|
|
|
|||||
Loans secured by real estate: |
|
|
|
|
|
|
|
|
|
|
|
|
|
|
|
|||||
Construction, land development and other land |
|
$ |
346,677 |
|
|
$ |
137,131 |
|
|
$ |
935 |
|
|
$ |
— |
|
|
$ |
484,743 |
|
Other secured by 1-4 family residential properties |
|
|
29,555 |
|
|
|
125,379 |
|
|
|
270,454 |
|
|
|
16,344 |
|
|
|
441,732 |
|
Secured by nonfarm, nonresidential properties |
|
|
423,082 |
|
|
|
1,145,949 |
|
|
|
422,462 |
|
|
|
10,686 |
|
|
|
2,002,179 |
|
Other real estate secured |
|
|
421,167 |
|
|
|
693,235 |
|
|
|
51,038 |
|
|
|
— |
|
|
|
1,165,440 |
|
Other loans secured by real estate: |
|
|
|
|
|
|
|
|
|
|
|
|
|
|
|
|||||
Other construction |
|
|
80,079 |
|
|
|
753,478 |
|
|
|
23,996 |
|
|
|
— |
|
|
|
857,553 |
|
Secured by 1-4 family residential properties |
|
|
30,963 |
|
|
|
134,735 |
|
|
|
735,911 |
|
|
|
6,210 |
|
|
|
907,819 |
|
Commercial and industrial loans |
|
|
304,956 |
|
|
|
839,300 |
|
|
|
21,842 |
|
|
|
— |
|
|
|
1,166,098 |
|
Consumer loans |
|
|
18,852 |
|
|
|
9,458 |
|
|
|
— |
|
|
|
— |
|
|
|
28,310 |
|
State and other political subdivision loans |
|
|
1,346 |
|
|
|
26,598 |
|
|
|
18,250 |
|
|
|
20,180 |
|
|
|
66,374 |
|
Other commercial loans and leases |
|
|
61,077 |
|
|
|
193,736 |
|
|
|
792 |
|
|
|
336 |
|
|
|
255,941 |
|
LHFI |
|
$ |
1,717,754 |
|
|
$ |
4,058,999 |
|
|
$ |
1,545,680 |
|
|
$ |
53,756 |
|
|
$ |
7,376,189 |
|
53
Allowance for Credit Losses
LHFI
Trustmark’s ACL methodology for LHFI is based upon guidance within FASB ASC Subtopic 326-20, “Financial Instruments – Credit Losses – Measured at Amortized Cost,” as well as regulatory guidance from its primary regulator. The ACL is a valuation account that is deducted from the loans’ amortized cost basis to present the net amount expected to be collected on the loans. Credit quality within the LHFI portfolio is continuously monitored by Management and is reflected within the ACL for loans. The ACL is an estimate of expected losses inherent within Trustmark’s existing LHFI portfolio. The ACL on LHFI is adjusted through the PCL, LHFI and reduced by the charge off of loan amounts, net of recoveries.
The loan loss estimation process involves procedures to appropriately consider the unique characteristics of Trustmark’s LHFI portfolio segments. These segments are further disaggregated into loan classes, the level at which credit risk is estimated. When computing allowance levels, credit loss assumptions are estimated using a model that categorizes loan pools based on loss history, delinquency status and other credit trends and risk characteristics, including current conditions and reasonable and supportable forecasts about the future. Evaluations of the portfolio and individual credits are inherently subjective, as they require estimates, assumptions and judgments as to the facts and circumstances of particular situations.
The econometric models currently in production reflect segment or pool level sensitivities of probability of default (PD) to changes in macroeconomic variables. By measuring the relationship between defaults and changes in the economy, the quantitative reserve incorporates reasonable and supportable forecasts of future conditions that will affect the value of its assets, as required by FASB ASC Topic 326. Under stable forecasts, these linear regressions will reasonably predict a pool’s PD. However, due to the COVID-19 pandemic, the macroeconomic variables used for reasonable and supportable forecasting changed rapidly. At the current levels, it is not clear that the models currently in production will produce reasonably representative results since the models were originally estimated using data beginning in 2004 through 2019. During this period, a traditional, albeit severe, economic recession occurred. Thus, econometric models are sensitive to similar future levels of PD.
In order to prevent the econometric models from extrapolating beyond reasonable boundaries of their input variables, Trustmark chose to establish an upper and lower limit process when applying the periodic forecasts. In this way, Management will not rely upon unobserved and untested relationships in the setting of the quantitative reserve. This approach applies to all input variables, including: Southern Unemployment, National Unemployment, National Gross Domestic Product (GDP), Southern GDP, Southern Vacancy Rate and the Prime Rate. The upper and lower limits are based on the distribution of the macroeconomic variable by selecting extreme percentiles at the upper and lower limits of the distribution, the 1st and 99th percentiles, respectively. These upper and lower limits are then used to calculate the PD for the forecast time period in which the forecasted values are outside of the upper and lower limit range. Due to multiple periods having a PD or loss given default (LGD) at or near zero as a result of the improving macroeconomic forecasts, Management implemented PD and LGD floors to account for the risk associated with each portfolio. The PD and LGD floors are based on Trustmark's historical loss experience and applied at a portfolio level.
The external factors qualitative factor is Management’s best judgment on the loan or pool level impact of all factors that affect the portfolio that are not accounted for using any other part of the ACL methodology (i.e., natural disasters, changes in legislation, impacts due to technology and pandemics). Trustmark's External Factor – Pandemic ensures reserve adequacy for collectively evaluated loans most likely to be impacted by the unique economic and behavioral conditions created by the COVID-19 pandemic. Additional qualitative reserves are derived based on two principles. The first is the disconnect of economic factors to Trustmark’s modeled PD (derived from the econometric models underpinning the quantitative pooled reserves). During the pandemic, extraordinary measures by the federal government were made available to consumers and businesses, including COVID-19 loan payment concessions, direct transfer payments to households, tax deferrals and reduced interest rates, among others. These government interventions may have extended the lag between economic conditions and default, relative to what was captured in the model development data. Because Trustmark’s econometric PD models rely on the observed relationship from the economic downturn from 2007 to 2009 in both timing and severity, Management does not expect the models to reflect these current conditions. For example, while the models would predict contemporaneous unemployment peaks and loan defaults, this may not occur when borrowers can request payment deferrals. Thus, for the affected population, economic conditions are not fully considered as a part of Trustmark’s quantitative reserve. The second principle is the change in risk that is identified by rating changes. As a part of Trustmark’s credit review process, loans in the affected population have been given more frequent screening to ensure accurate ratings are maintained through this dynamic period. Trustmark’s quantitative reserve does not directly address changes in ratings; thus, a migration qualitative factor was designed to work in concert with the quantitative reserve.
As discussed above, the disconnect of economic factors means that changes in rating caused by deteriorating and weak economic conditions as a result of the pandemic are not being captured in the quantitative reserve. During 2020, due to unforeseen pandemic conditions that varied from Management’s expectations, additional reserves were further dimensioned in order to appropriately reflect the risk within the portfolio related to the COVID-19 pandemic. In an effort to ensure the External Factor – Pandemic qualitative factor
54
is reasonable and supportable, historical Trustmark loss data was leveraged to construct a framework that is quantitative in nature. To dimension the additional reserve, Management uses the sensitivity of the quantitative commercial loan reserve to changes in macroeconomic conditions to apply to loans rated acceptable or better (risk rates 1-4). In addition, to account for the known changes in risk, a weighted average of the commercial loan portfolio loss rate, derived from the performance trends qualitative factor, is used to dimension additional reserves for downgraded credits. Loans rated acceptable with risk (risk rate 5) or watch (risk rate 6) received the additional reserves based on the average of the macroeconomic conditions and weighted average of the commercial loan portfolio loss rate while the loans rated special mention (risk rate 7) and substandard (risk rate 8) received additional reserves based on the weighted-average described above. During 2022, Management noted that all pass rate loans (risk rate 5 and 6) related to the External Factor - Pandemic qualitative factor either did not experience significant stress related to the pandemic or have since recovered and does not expect future stresses attributed to the pandemic that may affect these loans. As a result, Management decided to accelerate the release of the additional pandemic reserves on all pass rate loans as a result of pandemic conditions resolving. During the fourth quarter of 2023, Management decided to resolve the External Factor-Pandemic qualitative factor as a result of the remaining loan balances that were identified as COVID affected loans were immaterial from both a reserve and balance perspective. The remaining loans were incorporated back into the performance qualitative factor as a result of this resolution. Further, due to this resolution there is no longer any active External Factor as of December 31, 2023.
During the first quarter of 2022, in order to account for the potential uncertainty related to higher prices and low economic growth, Trustmark chose to enact a portion of the qualitative framework, External Factor - Stagflation. Management calculated the reserve using a third-party stagflation forecast and compared it to the third-party baseline forecast used in the quantitative modeling. The weighted differential was added as qualitative reserves to account for potential uncertainty. During the fourth quarter of 2022, Management determined that the likelihood of a stagflation scenario had sufficiently diminished. Management identified that the potential had already been reduced and effectively captured within a nominally more negative baseline economic forecast. As a result, Management elected to resolve the External Factor - Stagflation and fully release the reserves.
During 2022, Management elected to activate the nature and volume of the portfolio qualitative factor as a result of a sub-pool of the secured by 1-4 family residential properties growing to a significant size along with the underlying nature being different as well. The nature and volume of the portfolio qualitative factor utilizes a WARM methodology that uses industry data for the assumptions to support the qualitative adjustment. The industry data is used to compile a PD based on credit score ranges along with using the industry data to compile an LGD. The sub-pool of credits is then aggregated into the appropriate credit score bands in which a weighted average loss rate is calculated based on the PD and LGD for each credit score range. This weighted average loss rate is then applied to the expected balance for the sub-segment of credits. This total is then used as the qualitative reserve adjustment.
Trustmark's current quantitative methodologies do not completely incorporate changes in credit quality. As a result, Trustmark utilizes the performance trends factor. This factor is based on migration analyses, that allocates additional ACL to non-pass/delinquent loans within each pool. In this way, Management believes the ACL will directly reflect changes in risk, based on the performance of the loans with a pool, whether declining or improving.
The performance trends qualitative factor is estimated by properly segmenting loan pools into risk levels by risk rating for commercial credits and delinquency status for consumer credits. A migration analysis is then performed quarterly using a third-party software and the results for each risk level are compiled to calculate the historical PD average for each loan portfolio based on risk levels. This average historical PD rate is updated annually. For the mortgage portfolio, Trustmark uses an internal report to incorporate a roll rate method for the calculation of the PD rate. In addition, to the PD rate for each portfolio, Management incorporates the quantitative rate and the k value derived from the Frye-Jacobs method to calculate a loss estimate that includes both PD and LGD. The quantitative rate is used to eliminate any additional reserve that the quantitative reserve already includes. Finally, the loss estimate rate is then applied to the total balances for each risk level for each portfolio to calculate a qualitative reserve
Determining the appropriateness of the allowance is complex and requires judgment by Management about the effect of matters that are inherently uncertain. In future periods, evaluations of the overall LHFI portfolio, in light of the factors and forecasts then prevailing, may result in significant changes in the allowance and credit loss expense.
For a complete description of Trustmark’s ACL methodology and the quantitative and qualitative factors included in the calculation, please see Note 4 – LHFI and Allowance for Credit Losses, LHFI included in Part II. Item 8. – Financial Statements and Supplementary Data of this report.
At December 31, 2023, the ACL, LHFI was $139.4 million, an increase of $19.2 million, or 15.9%, when compared with December 31, 2022. The increase in the ACL, LHFI during 2023 was principally due to loan growth, net changes in the qualitative reserve factors, changes in the macroeconomic forecasts and extended maturities on the secured by 1-4 family residential properties portfolio resulting from lower prepayment speeds, partially offset by a decline in specific reserves for individually analyzed LHFI. Allocation of Trustmark’s ACL, LHFI represented 0.85% of commercial LHFI and 1.81% of consumer and home mortgage LHFI, resulting in an
55
ACL to total LHFI of 1.08% at December 31, 2023. This compares with an ACL to total LHFI of 0.99% at December 31, 2022, which was allocated to commercial LHFI at 0.85% and to consumer and home mortgage LHFI at 1.41%.
The table below illustrates the changes in Trustmark’s ACL on LHFI as well as Trustmark’s loan loss experience for the periods presented ($ in thousands):
|
|
Years Ended December 31, |
|
|||||||||
|
|
2023 |
|
|
2022 |
|
|
2021 |
|
|||
Balance at beginning of period |
|
$ |
120,214 |
|
|
$ |
99,457 |
|
|
$ |
117,306 |
|
LHFI charged off |
|
|
(17,515 |
) |
|
|
(11,332 |
) |
|
|
(10,275 |
) |
Recoveries |
|
|
9,306 |
|
|
|
10,412 |
|
|
|
13,925 |
|
Net (charge-offs) recoveries |
|
|
(8,209 |
) |
|
|
(920 |
) |
|
|
3,650 |
|
PCL, LHFI |
|
|
27,362 |
|
|
|
21,677 |
|
|
|
(21,499 |
) |
Balance at end of period |
|
$ |
139,367 |
|
|
$ |
120,214 |
|
|
$ |
99,457 |
|
Charge-offs exceeded recoveries for 2023 resulting in net charge-offs of $8.2 million, or 0.06% of average loans (LHFS and LHFI), compared to net charge-offs of $920 thousand, or 0.01% of average loans (LHFS and LHFI), in 2022, and net recoveries of $3.7 million, or -0.04% of average loans (LHFS and LHFI), in 2021. The increase in net charge-offs during 2023 was principally due to increases in charge-offs in the Texas, Mississippi and Alabama market regions as well as declines in recoveries in the Alabama, Mississippi and Florida market regions, partially offset by an increase in recoveries in the Tennessee market region.
The following table presents the net (charge-offs) recoveries by geographic market region for the periods presented ($ in thousands):
|
|
Years Ended December 31, |
|
|||||||||
|
|
2023 |
|
|
2022 |
|
|
2021 |
|
|||
Alabama |
|
$ |
(873 |
) |
|
$ |
2,019 |
|
|
$ |
1,299 |
|
Florida |
|
|
130 |
|
|
|
652 |
|
|
|
521 |
|
Mississippi |
|
|
(5,347 |
) |
|
|
(2,713 |
) |
|
|
(111 |
) |
Tennessee |
|
|
1,644 |
|
|
|
(790 |
) |
|
|
940 |
|
Texas |
|
|
(3,763 |
) |
|
|
(88 |
) |
|
|
1,001 |
|
Total net (charge-offs) recoveries |
|
$ |
(8,209 |
) |
|
$ |
(920 |
) |
|
$ |
3,650 |
|
56
The following table presents selected credit ratios for the periods presented ($ in thousands):
|
|
Years Ended December 31, |
|
|||||||||
|
|
2023 |
|
|
2022 |
|
|
2021 |
|
|||
ACL, LHFI to Total LHFI |
|
|
1.08 |
% |
|
|
0.99 |
% |
|
|
0.97 |
% |
ACL, LHFI |
|
$ |
139,367 |
|
|
$ |
120,214 |
|
|
$ |
99,457 |
|
LHFI |
|
|
12,950,524 |
|
|
|
12,204,039 |
|
|
|
10,247,829 |
|
|
|
|
|
|
|
|
|
|
|
|||
Nonaccrual LHFI to Total LHFI |
|
|
0.77 |
% |
|
|
0.53 |
% |
|
|
0.61 |
% |
Nonaccrual LHFI |
|
$ |
100,008 |
|
|
$ |
65,972 |
|
|
$ |
62,698 |
|
LHFI |
|
|
12,950,524 |
|
|
|
12,204,039 |
|
|
|
10,247,829 |
|
|
|
|
|
|
|
|
|
|
|
|||
ACL, LHFI to Nonaccrual LHFI |
|
|
139.36 |
% |
|
|
182.22 |
% |
|
|
158.63 |
% |
ACL, LHFI |
|
$ |
139,367 |
|
|
$ |
120,214 |
|
|
$ |
99,457 |
|
Nonaccrual LHFI |
|
|
100,008 |
|
|
|
65,972 |
|
|
|
62,698 |
|
|
|
|
|
|
|
|
|
|
|
|||
Net (Charge-offs) Recoveries to Average LHFI |
|
|
|
|
|
|
|
|
|
|||
Construction, land development and other land loans |
|
|
-0.02 |
% |
|
|
0.16 |
% |
|
|
0.28 |
% |
Net (charge-offs) recoveries |
|
$ |
(100 |
) |
|
$ |
1,054 |
|
|
$ |
1,525 |
|
Average LHFI |
|
|
652,922 |
|
|
|
655,680 |
|
|
|
551,266 |
|
Other loans secured by 1-4 family residential properties |
|
|
0.02 |
% |
|
|
0.07 |
% |
|
|
0.08 |
% |
Net (charge-offs) recoveries |
|
$ |
119 |
|
|
$ |
372 |
|
|
$ |
396 |
|
Average LHFI |
|
|
599,723 |
|
|
|
541,383 |
|
|
|
505,063 |
|
Loans secured by nonfarm, nonresidential properties |
|
|
0.06 |
% |
|
|
0.05 |
% |
|
|
0.04 |
% |
Net (charge-offs) recoveries |
|
$ |
2,050 |
|
|
$ |
1,418 |
|
|
$ |
1,076 |
|
Average LHFI |
|
|
3,455,308 |
|
|
|
3,094,532 |
|
|
|
2,846,103 |
|
Other loans secured by real estate |
|
|
— |
|
|
|
-0.02 |
% |
|
|
— |
|
Net (charge-offs) recoveries |
|
$ |
28 |
|
|
$ |
(117 |
) |
|
$ |
20 |
|
Average LHFI |
|
|
1,079,402 |
|
|
|
636,658 |
|
|
|
971,881 |
|
Other construction loans |
|
|
-0.35 |
% |
|
|
0.01 |
% |
|
|
0.01 |
% |
Net (charge-offs) recoveries |
|
$ |
(3,380 |
) |
|
$ |
69 |
|
|
$ |
47 |
|
Average LHFI |
|
|
976,849 |
|
|
|
831,435 |
|
|
|
757,716 |
|
Loans secured by 1-4 family residential properties |
|
|
-0.06 |
% |
|
|
— |
|
|
|
— |
|
Net (charge-offs) recoveries |
|
$ |
(1,419 |
) |
|
$ |
13 |
|
|
$ |
(49 |
) |
Average LHFI |
|
|
2,250,931 |
|
|
|
1,881,006 |
|
|
|
1,328,220 |
|
Commercial and industrial loans |
|
|
-0.06 |
% |
|
|
0.02 |
% |
|
|
0.03 |
% |
Net (charge-offs) recoveries |
|
$ |
(1,095 |
) |
|
$ |
284 |
|
|
$ |
336 |
|
Average LHFI |
|
|
1,867,199 |
|
|
|
1,603,499 |
|
|
|
1,331,537 |
|
Consumer loans |
|
|
-2.48 |
% |
|
|
-0.35 |
% |
|
|
0.02 |
% |
Net (charge-offs) recoveries |
|
$ |
(4,098 |
) |
|
$ |
(562 |
) |
|
$ |
25 |
|
Average LHFI |
|
|
165,241 |
|
|
|
161,145 |
|
|
|
156,826 |
|
State and other political subdivision loans |
|
|
— |
|
|
|
— |
|
|
|
— |
|
Net (charge-offs) recoveries |
|
$ |
— |
|
|
$ |
— |
|
|
$ |
— |
|
Average LHFI |
|
|
1,104,444 |
|
|
|
1,159,939 |
|
|
|
1,098,190 |
|
Other commercial loans and leases |
|
|
-0.06 |
% |
|
|
-0.72 |
% |
|
|
0.06 |
% |
Net (charge-offs) recoveries |
|
$ |
(314 |
) |
|
$ |
(3,451 |
) |
|
$ |
274 |
|
Average LHFI |
|
|
486,518 |
|
|
|
477,296 |
|
|
|
474,291 |
|
Total LHFI |
|
|
-0.06 |
% |
|
|
-0.01 |
% |
|
|
0.04 |
% |
Net (charge-offs) recoveries |
|
$ |
(8,209 |
) |
|
$ |
(920 |
) |
|
$ |
3,650 |
|
Average LHFI |
|
|
12,638,537 |
|
|
|
11,042,573 |
|
|
|
10,021,093 |
|
The PCL, LHFI for 2023 totaled 0.21% of average loans (LHFS and LHFI), compared to 0.19% of average loans (LHFS and LHFI) in 2022 and -0.21% of average loans (LHFS and LHFI) in 2021. The PCL, LHFI for 2023 primarily reflected an increase in required reserves as a result of loan growth, net changes in the qualitative reserve factors, changes in the macroeconomic forecasts and extended maturities on the secured by 1-4 family residential properties portfolio resulting from lower prepayment speeds, partially offset by a decline in specific reserves for individually analyzed LHFI.
57
Off-Balance Sheet Credit Exposures
Trustmark maintains a separate ACL on off-balance sheet credit exposures, including unfunded loan commitments and letters of credit, which is included on the accompanying consolidated balance sheets. Expected credit losses for off-balance sheet credit exposures are estimated by calculating a commitment usage factor over the contractual period for exposures that are not unconditionally cancellable by Trustmark. Trustmark calculates a loan pool level unfunded amount for the period. Trustmark calculates an expected funding rate each period which is applied to each pool’s unfunded commitment balances to ensure that reserves will be applied to each pool based upon balances expected to be funded based upon historical levels. Additionally, a reserve rate is applied to the unfunded commitment balance, which incorporates both quantitative and qualitative aspects of the current period’s expected credit loss rate. The reserve rate is loan pool specific and is applied to the unfunded amount to ensure loss factors, both quantitative and qualitative, are being considered on the unfunded portion of the loan pool, consistent with the methodology applied to the funded loan pools. See the section captioned “Lending Related” in Note 16 – Commitments and Contingencies included in Part II. Item 8. – Financial Statements and Supplementary Data of this report for complete description of Trustmark’s ACL methodology on off-balance sheet credit exposures.
Adjustments to the ACL on off-balance sheet credit exposures are recorded to PCL, off-balance sheet credit exposures. At December 31, 2023, the ACL on off-balance sheet credit exposures totaled $34.1 million compared to $36.8 million at December 31, 2022, a decrease of $2.8 million, or 7.5%. The PCL, off-balance sheet credit exposures totaled a negative $2.8 million for 2023, compared to a PCL, off-balance sheet credit exposures totaled $1.2 million for 2022 and a negative PCL, off-balance sheet credit exposures of $2.9 million for 2021. The release in PCL, off-balance sheet credit exposures for 2023 primarily reflected a decrease in required reserves due to a decline in unfunded commitments partially offset by an increase in required reserves as a result of changes in the total reserve rate.
Nonperforming Assets
The table below provides the components of the nonperforming assets by geographic market region at December 31, 2023 and 2022 ($ in thousands):
|
|
December 31, |
|
|||||
|
|
2023 |
|
|
2022 |
|
||
Nonaccrual LHFI |
|
|
|
|
|
|
||
Alabama |
|
$ |
23,271 |
|
|
$ |
12,300 |
|
Florida |
|
|
170 |
|
|
|
227 |
|
Mississippi |
|
|
54,615 |
|
|
|
24,683 |
|
Tennessee |
|
|
1,802 |
|
|
|
5,566 |
|
Texas |
|
|
20,150 |
|
|
|
23,196 |
|
Total nonaccrual LHFI |
|
|
100,008 |
|
|
|
65,972 |
|
Other real estate |
|
|
|
|
|
|
||
Alabama |
|
|
1,397 |
|
|
|
194 |
|
Mississippi |
|
|
1,242 |
|
|
|
1,769 |
|
Tennessee |
|
|
— |
|
|
|
23 |
|
Texas |
|
|
4,228 |
|
|
|
— |
|
Total other real estate |
|
|
6,867 |
|
|
|
1,986 |
|
Total nonperforming assets |
|
$ |
106,875 |
|
|
$ |
67,958 |
|
|
|
|
|
|
|
|
||
Nonperforming assets/total loans (LHFS and LHFI) |
|
|
0.81 |
% |
|
|
0.55 |
% |
|
|
|
|
|
|
|
||
Loans Past Due 90 Days or More |
|
|
|
|
|
|
||
LHFI |
|
$ |
5,790 |
|
|
$ |
3,929 |
|
LHFS - Guaranteed GNMA services loans (1) |
|
$ |
51,243 |
|
|
$ |
49,320 |
|
For additional information regarding the Trustmark’s serviced GNMA loans eligible for repurchase, please see the section captioned “Loans Held for Sale (LHFS)” included in Note 1 – Significant Accounting Policies of Part II. Item 8. – Financial Statements and Supplementary Data of this report.
58
Nonaccrual LHFI
At December 31, 2023, nonaccrual LHFI totaled $100.0 million, or 0.76% of total LHFS and LHFI, reflecting an increase of $34.0 million, or 51.6%, relative to December 31, 2022. The increase in nonaccrual LHFI was primarily as a result of three large commercial credits placed on nonaccrual as well as an increase in mortgage nonaccruals that were partially offset by other commercial credits that were foreclosed, charged off, returned to accrual or paid off.
For additional information regarding nonaccrual LHFI, see the section captioned “Nonaccrual and Past Due LHFI” in Note 4 – LHFI and Allowance for Credit Losses, LHFI included in Part II. Item 8. – Financial Statements and Supplementary Data of this report.
Other Real Estate
Other real estate at December 31, 2023 increased $4.9 million when compared with December 31, 2022, principally due to properties foreclosed in the Texas, Mississippi and Alabama market regions partially offset by properties sold in Trustmark’s Mississippi market region.
The following tables illustrate changes in other real estate by geographic market region for the periods presented ($ in thousands):
|
|
Year Ended December 31, 2023 |
|
|||||||||||||||||
|
|
Total |
|
|
Alabama |
|
|
Mississippi |
|
|
Tennessee |
|
|
Texas |
|
|||||
Balance at beginning of period |
|
$ |
1,986 |
|
|
$ |
194 |
|
|
$ |
1,769 |
|
|
$ |
23 |
|
|
$ |
— |
|
Additions |
|
|
7,237 |
|
|
|
1,073 |
|
|
|
1,706 |
|
|
|
230 |
|
|
|
4,228 |
|
Disposals |
|
|
(2,555 |
) |
|
|
(194 |
) |
|
|
(2,108 |
) |
|
|
(253 |
) |
|
|
— |
|
Net (write-downs) recoveries |
|
|
199 |
|
|
|
324 |
|
|
|
(125 |
) |
|
|
— |
|
|
|
— |
|
Balance at end of period |
|
$ |
6,867 |
|
|
$ |
1,397 |
|
|
$ |
1,242 |
|
|
$ |
— |
|
|
$ |
4,228 |
|
|
|
Year Ended December 31, 2022 |
|
|||||||||||||||||
|
|
Total |
|
|
Alabama |
|
|
Mississippi |
|
|
Tennessee |
|
|
Texas |
|
|||||
Balance at beginning of period |
|
$ |
4,557 |
|
|
$ |
— |
|
|
$ |
4,557 |
|
|
$ |
— |
|
|
$ |
— |
|
Additions |
|
|
1,533 |
|
|
|
151 |
|
|
|
1,359 |
|
|
|
23 |
|
|
|
— |
|
Disposals |
|
|
(4,142 |
) |
|
|
(48 |
) |
|
|
(4,094 |
) |
|
|
— |
|
|
|
— |
|
Net (write-downs) recoveries |
|
|
38 |
|
|
|
91 |
|
|
|
(53 |
) |
|
|
— |
|
|
|
— |
|
Balance at end of period |
|
$ |
1,986 |
|
|
$ |
194 |
|
|
$ |
1,769 |
|
|
$ |
23 |
|
|
$ |
— |
|
|
|
Year Ended December 31, 2021 |
|
|||||||||||||||||
|
|
Total |
|
|
Alabama |
|
|
Mississippi |
|
|
Tennessee |
|
|
Texas |
|
|||||
Balance at beginning of period |
|
$ |
11,651 |
|
|
$ |
3,271 |
|
|
$ |
8,330 |
|
|
$ |
50 |
|
|
$ |
— |
|
Additions |
|
|
770 |
|
|
|
— |
|
|
|
717 |
|
|
|
53 |
|
|
|
— |
|
Disposals |
|
|
(6,932 |
) |
|
|
(3,063 |
) |
|
|
(3,741 |
) |
|
|
(128 |
) |
|
|
— |
|
Net (write-downs) recoveries |
|
|
(932 |
) |
|
|
(208 |
) |
|
|
(749 |
) |
|
|
25 |
|
|
|
— |
|
Balance at end of period |
|
$ |
4,557 |
|
|
$ |
— |
|
|
$ |
4,557 |
|
|
$ |
— |
|
|
$ |
— |
|
Net recoveries of other real estate increased $161 thousand during 2023 compared to a decrease in net write-downs of other real estate of $970 thousand during 2022. The increase in net recoveries of other real estate during 2023 compared to 2022 was primarily due to a decline in write-downs on foreclosed properties in the Mississippi market region as well as an increase in recoveries at foreclosure for properties in the Alabama market region, partially offset by reserves released during 2022 as a result of properties sold in the Mississippi and Alabama market regions.
The following table illustrates other real estate by type of property at December 31, 2023 and 2022 ($ in thousands):
|
|
December 31, |
|
|||||
|
|
2023 |
|
|
2022 |
|
||
1-4 family residential properties |
|
$ |
1,977 |
|
|
$ |
1,128 |
|
Nonfarm, nonresidential properties |
|
|
4,835 |
|
|
|
561 |
|
Other real estate properties |
|
|
55 |
|
|
|
297 |
|
Total other real estate |
|
$ |
6,867 |
|
|
$ |
1,986 |
|
59
Deposits
Trustmark’s deposits are its primary source of funding and consist primarily of core deposits from the communities Trustmark serves. Deposits include interest-bearing and noninterest-bearing demand accounts, savings, MMDA, certificates of deposit and individual retirement accounts. Total deposits were $15.570 billion at December 31, 2023 compared to $14.438 billion at December 31, 2022, an increase of $1.132 billion, or 7.8%, primarily reflecting an increase in interest-bearing deposits partially offset by a decrease in noninterest-bearing deposit accounts. During 2023, noninterest-bearing deposits decreased $896.2 million, or 21.9%, as a result of declines in all categories of noninterest-bearing deposits reflecting customers' desire for higher-yielding deposit accounts. Interest-bearing deposits increased $2.028 billion, or 19.6%, during 2023, primarily due to growth in CDs, which was principally attributable to deposit campaigns offered during 2023 and the addition of $578.8 million of brokered CDs, business and consumer MMDA and business interest checking accounts, partially offset by declines in consumer and public interest checking accounts and consumer savings accounts.
At December 31, 2023, Trustmark's total uninsured deposits were $5.601 billion, or 36.0% of total deposits, compared to $5.831 billion, or 40.4% of total deposits, at December 31, 2022.
The maturities of time deposits that exceed the FDIC insurance limit of $250 thousand at December 31, 2023 are as follows ($ in thousands):
Three months or less |
|
$ |
355,175 |
|
Over three months through six months |
|
|
286,191 |
|
Over six months through twelve months |
|
|
153,104 |
|
Over twelve months |
|
|
27,961 |
|
Total time deposits in excess of FDIC insurance limit |
|
$ |
822,431 |
|
Borrowings
Trustmark uses short-term borrowings, such as federal funds purchased, securities sold under repurchase agreements and short-term FHLB advances, to fund growth of earning assets in excess of deposit growth. See the section captioned “Liquidity” for further discussion of the components of Trustmark’s excess funding capacity.
Federal funds purchased and repurchase agreements totaled $405.7 million at December 31, 2023 compared to $449.3 million at December 31, 2022, a decrease of $43.6 million, or 9.7%. At December 31, 2023 and 2022, $35.7 million and $66.3 million, respectively, represented customer related transactions, such as commercial sweep repurchase balances. Trustmark had $370.0 million of upstream federal funds purchased at December 31, 2023, compared to $383.0 million at December 31, 2022.
Other borrowings totaled $483.2 million at December 31, 2023, a decrease of $567.7 million, or 54.0%, when compared with $1.051 billion at December 31, 2022, principally due to a decline in outstanding short-term FHLB advances obtained from the FHLB of Dallas.
Benefit Plans
Defined Benefit Plans
As disclosed in Note 14 – Defined Benefit and Other Postretirement Benefits included in Part II. Item 8. – Financial Statements and Supplementary Data of this report, Trustmark maintains a noncontributory tax-qualified defined benefit pension plan titled the Trustmark Corporation Pension Plan for Certain Employees of Acquired Financial Institutions (the Continuing Plan) to satisfy commitments made by Trustmark to associates covered through plans obtained in acquisitions.
At December 31, 2023, the fair value of the Continuing Plan’s assets totaled $2.4 million and was exceeded by the projected benefit obligation of $5.9 million by $3.5 million. Net periodic benefit cost equaled $262 thousand in 2023, compared to $410 thousand in 2022 and $1.1 million in 2021.
The fair value of plan assets is determined utilizing current market quotes, while the benefit obligation and periodic benefit costs are determined utilizing actuarial methodology with certain weighted-average assumptions. For 2023, 2022 and 2021, the process used to select the discount rate assumption under FASB ASC Topic 715, "Compensation-Retirement Benefits," takes into account the benefit cash flow and the segmented yields on high-quality corporate bonds that would be available to provide for the payment of the benefit cash flow. Assumptions, which have been chosen to represent the estimate of a particular event as required by GAAP, have been reviewed and approved by Management based on recommendations from its actuaries.
60
The range of potential contributions to the Continuing Plan is determined annually by the Continuing Plan’s actuary in accordance with applicable IRS rules and regulations. Trustmark’s policy is to fund amounts that are sufficient to satisfy the annual minimum funding requirements and do not exceed the maximum that is deductible for federal income tax purposes. The actual amount of the contribution is determined annually based on the Continuing Plan’s funded status and return on plan assets as of the measurement date, which is December 31. For the plan year ending December 31, 2023, Trustmark’s minimum required contribution to the Continuing Plan was $154 thousand; however, Trustmark contributed $609 thousand, $455 thousand in excess of the minimum required. For the plan year ending December 31, 2024, Trustmark’s minimum required contribution to the Continuing Plan is expected to be $128 thousand; however, Management and the Board of Directors of Trustmark will monitor the Continuing Plan throughout 2024 to determine any additional funding requirements by the plan’s measurement date.
Supplemental Retirement Plans
As disclosed in Note 14 – Defined Benefit and Other Postretirement Benefits included in Part II. Item 8. – Financial Statements and Supplementary Data of this report, Trustmark maintains a nonqualified supplemental retirement plan covering key executive officers and senior officers as well as directors who have elected to defer fees. The plan provides for retirement and/or death benefits based on a participant’s covered salary or deferred fees. Although plan benefits may be paid from Trustmark’s general assets, Trustmark has purchased life insurance contracts on the participants covered under the plan, which may be used to fund future benefit payments under the plan. The annual measurement date for the plan is December 31. As a result of mergers prior to 2014, Trustmark became the administrator of nonqualified supplemental retirement plans, for which the plan benefits were frozen prior to the merger dates.
At December 31, 2023, the accrued benefit obligation for the supplemental retirement plans equaled $41.6 million, while the net periodic benefit cost equaled $2.5 million in 2023, $2.4 million in 2022 and $2.5 million in 2021. The net periodic benefit cost and projected benefit obligation are determined using actuarial assumptions as of the plans’ measurement date. The process used to select the discount rate assumption under FASB ASC Topic 715 takes into account the benefit cash flow and the segmented yields on high-quality corporate bonds that would be available to provide for the payment of the benefit cash flow. At December 31, 2023, unrecognized actuarial losses and unrecognized prior service costs continue to be amortized over future service periods.
Legal Environment
Information required in this section is set forth under the heading “Legal Proceedings” of Note 16 – Commitments and Contingencies in Part II. Item 8. – Financial Statements and Supplementary Data of this report.
Off-Balance Sheet Arrangements
Information required in this section is set forth under the heading “Lending Related” of Note 16 – Commitments and Contingencies in Part II. Item 8. – Financial Statements and Supplementary Data of this report.
Capital Resources and Liquidity
At December 31, 2023, Trustmark’s total shareholders’ equity was $1.662 billion, an increase of $169.6 million, or 11.4%, when compared to December 31, 2022. The increase in shareholders’ equity during 2023 was primarily as a result of net income of $165.5 million as well as an increase in the fair market value of available for sale securities, net of tax, of $38.1 million and a decrease in the unrealized net holding losses on securities transferred from available for sale to held to maturity, net of tax, of $11.7 million, partially offset by common stock dividends of $56.7 million. Trustmark utilizes a capital model in order to provide Management with a monthly tool for analyzing changes in its strategic capital ratios. This allows Management to hold sufficient capital to provide for growth opportunities and protect the balance sheet against sudden adverse market conditions, while maintaining an attractive return on equity to shareholders.
Regulatory Capital
Trustmark and TNB are subject to minimum risk-based capital and leverage capital requirements, as described in the section captioned “Capital Adequacy” included in Part I. Item 1. – Business of this report, which are administered by the federal bank regulatory agencies. These capital requirements, as defined by federal regulations, involve quantitative and qualitative measures of assets, liabilities and certain off-balance sheet instruments. Trustmark’s and TNB’s minimum risk-based capital requirements include a capital conservation buffer of 2.5%. AOCI is not included in computing regulatory capital. Trustmark has elected the five-year phase-in transition period (through December 31, 2024) related to adopting FASB ASU 2016-13 for regulatory capital purposes. Failure to meet minimum capital requirements can result in certain mandatory and possibly additional discretionary actions by regulators that, if undertaken, could have a direct material effect on the financial statements of Trustmark and TNB and limit Trustmark’s and TNB’s ability to pay dividends. At December 31, 2023, Trustmark and TNB exceeded all applicable minimum capital standards. In addition, Trustmark and TNB met
61
applicable regulatory guidelines to be considered well-capitalized at December 31, 2023. To be categorized in this manner, Trustmark and TNB maintained minimum common equity Tier 1 risk-based capital, Tier 1 risk-based capital, total risk-based capital and Tier 1 leverage ratios, and were not subject to any written agreement, order or capital directive, or prompt corrective action directive issued by their primary federal regulators to meet and maintain a specific capital level for any capital measures. There are no significant conditions or events that have occurred since December 31, 2023, which Management believes have affected Trustmark’s or TNB’s present classification.
In 2020, Trustmark enhanced its capital structure with the issuance of $125.0 million of subordinated notes. At December 31, 2023 and 2022, the carrying amount of the subordinated notes was $123.5 million and $123.3 million, respectively. The subordinated notes mature December 1, 2030 and are redeemable at Trustmark’s option under certain circumstances. For regulatory capital purposes, the subordinated notes qualified as Tier 2 capital for Trustmark at December 31, 2023 and 2022. Trustmark may utilize the full carrying value of the subordinated notes as Tier 2 capital until December 1, 2025 (five years prior to maturity). Beginning December 1, 2025, the subordinated notes will phase out of Tier 2 capital 20.0% each year until maturity.
In 2006, Trustmark enhanced its capital structure with the issuance of trust preferred securities. For regulatory capital purposes, the trust preferred securities qualified as Tier 1 capital at December 31, 2023 and 2022. Trustmark intends to continue to utilize $60.0 million in trust preferred securities issued by the Trust as Tier 1 capital up to the regulatory limit, as permitted by the grandfather provision in the Dodd-Frank Act and the Basel III Final Rule.
Refer to the section captioned “Regulatory Capital” included in Note 17 – Shareholders’ Equity in Part II. Item 8. – Financial Statements and Supplementary Data of this report for an illustration of Trustmark’s and TNB’s actual regulatory capital amounts and ratios under regulatory capital standards in effect at December 31, 2023 and 2022.
Dividends on Common Stock
Dividends per common share for each of the years ended December 31, 2023, 2022 and 2021 were $0.92. Trustmark’s dividend payout ratio for 2023, 2022 and 2021 was 33.95%, 78.63%, and 39.15%, respectively. The increase in the dividend payout ratio for 2022 was principally due to the $100.8 million of litigation settlement expense recorded during the fourth quarter of 2022. Since Trustmark is a holding company and does not conduct operations, its primary source of liquidity are dividends paid from TNB and borrowings from outside sources. Approval by TNB’s regulators is required if the total of all dividends declared in any calendar year exceeds the total of its net income for that year combined with its retained net income of the preceding two years. In 2024, TNB will have available approximately $95.1 million plus its net income for that year to pay as dividends to Trustmark. The actual amount of any dividends declared in 2024 by Trustmark will be determined by Trustmark’s Board of Directors. Trustmark’s Board of Directors declared a quarterly cash dividend of $0.23 per share payable of March 15, 2024, to shareholders of record on March 1, 2024.
Stock Repurchase Plan
From time to time, Trustmark’s Board of Directors has authorized stock repurchase plans. In general, stock repurchase plans allow Trustmark to proactively manage its capital position and return excess capital to shareholders. Shares purchased also provide Trustmark with shares of common stock necessary to satisfy obligations related to stock compensation awards. Under the stock repurchase plan effective April 1, 2020 through December 31, 2021, Trustmark repurchased approximately 1.9 million shares of its common stock valued at $61.8 million. Under the stock repurchase plan effective January 1, 2022 through December 31, 2022, Trustmark repurchased approximately 789 thousand shares of its common stock valued at $24.6 million. Under the stock repurchase plan effective January 1, 2023 through December 31, 2023, Trustmark did not repurchase any of its outstanding common stock. On December 5, 2023, the Board of Directors of Trustmark authorized a new stock repurchase program, effective January 1, 2024, under which $50.0 million of Trustmark’s outstanding common stock may be acquired through December 31, 2024. The repurchase program, which is subject to market conditions and management discretion, will be implemented through open market repurchases or privately negotiated transactions. No shares have been repurchased under this stock repurchase program.
Liquidity
Liquidity is the ability to ensure that sufficient cash flow and liquid assets are available to satisfy current and future financial obligations, including demand for loans and deposit withdrawals, funding operating costs and other corporate purposes. Consistent cash flows from operations and adequate capital provide internally generated liquidity. Furthermore, Management maintains funding capacity from a variety of external sources to meet daily funding needs, such as those required to meet deposit withdrawals, loan disbursements and security settlements. Liquidity strategy also includes the use of wholesale funding sources to provide for the seasonal fluctuations of deposit and loan demand and the cyclical fluctuations of the economy that impact the availability of funds. Management keeps excess funding capacity available to meet potential demands associated with adverse circumstances.
62
The asset side of the balance sheet provides liquidity primarily through maturities and cash flows from loans and securities as well as the ability to pledge or sell certain loans and securities. The liability portion of the balance sheet provides liquidity primarily through noninterest and interest-bearing deposits. Trustmark utilizes federal funds purchased, FHLB advances, securities sold under repurchase agreements, the Discount Window and brokered deposits to provide additional liquidity. Access to these additional sources represents Trustmark’s incremental borrowing capacity.
Trustmark’s liquidity position is continuously monitored and adjustments are made to manage the balance as deemed appropriate. Liquidity risk management is an important element to Trustmark’s asset/liability management process. Trustmark regularly models liquidity stress scenarios to assess potential liquidity outflows or funding problems resulting from economic disruptions or other significant occurrences as deemed appropriate by Management. These scenarios are incorporated into Trustmark’s contingency funding plan, which provides the basis for the identification of its liquidity needs.
Deposit accounts represent Trustmark’s largest funding source. Average deposits totaled to $14.935 billion for 2023 and represented approximately 80.0% of average liabilities and shareholders’ equity, compared to average deposits of $14.772 billion, which represented 84.5% of average liabilities and shareholders’ equity for 2022.
Trustmark had $712.0 million held in an interest-bearing account at the FRBA at December 31, 2023, compared to $434.0 million at December 31, 2022. The increase in Trustmark's balance held at the FRBA was principally due to cash balance management at year-end.
Trustmark utilizes brokered deposits to supplement other wholesale funding sources. At December 31, 2023, brokered sweep MMDA deposits totaled $10.6 million compared to $15.1 million at December 31, 2022. In addition, Trustmark had $578.8 million of brokered CDs at December 31, 2023 compared to none at December 31, 2022. The increase in brokered CDs during 2023 was primarily due to leveraging comparatively attractive brokered CD pricing as a component of funding loan growth.
At December 31, 2023, Trustmark had $370.0 million of upstream federal funds purchased compared to $383.0 million of upstream federal funds purchased at December 31, 2022. Trustmark maintains adequate federal funds lines to provide sufficient short-term liquidity.
Trustmark maintains a relationship with the FHLB of Dallas, which provided $400.0 million of outstanding short-term advances and no long-term advances at December 31, 2023, compared to $975.0 million of short-term and no long-term FHLB advances outstanding at December 31, 2022. Trustmark had no letters of credit outstanding with the FHLB of Dallas at December 31, 2023, and 2022. Under the existing borrowing agreement, Trustmark had sufficient qualifying collateral to increase FHLB advances with the FHLB of Dallas by $4.003 billion at December 31, 2023.
In addition, at December 31, 2023, Trustmark had no short-term and $58 thousand in long-term FHLB advances outstanding with the FHLB of Atlanta, which were acquired in the BancTrust merger, compared to no short-term and $78 thousand in long-term FHLB advances outstanding at December 31, 2022. Trustmark has non-member status and thus no additional borrowing capacity with the FHLB of Atlanta.
Additionally, Trustmark has the ability to leverage its unencumbered investment securities as collateral. At December 31, 2023, Trustmark had approximately $842.0 million available in unencumbered Treasury and agency securities compared to $797.0 million at December 31, 2022.
Another borrowing source is the Discount Window. At December 31, 2023, Trustmark had approximately $1.374 billion available in collateral capacity at the Discount Window primarily from pledges of commercial and industrial LHFI, compared with $1.345 billion at December 31, 2022.
Additionally, on March 15, 2020, in response to the COVID-19 pandemic, the FRB reduced reserve requirements for insured depository institutions to zero percent, which increased TNB’s available liquidity.
On March 12, 2023, the U.S. Treasury Department, the FRB and the FDIC jointly announced the establishment of the Bank Term Funding Program (BTFP), in response to recent liquidity concerns within the banking industry in part due to recent deposit runs that resulted in a few large bank failures. The BTFP was designed to provide available additional funding to eligible depository institutions to help assure that banks have the ability to meet the needs of all their depositors. Under the program, eligible depository institutions can obtain loans of up to one year in length by pledging U.S. Treasuries, agency debt and mortgage-backed securities and other qualifying assets (valued at par) as collateral. The BTFP is intended to eliminate the need for depository institutions to quickly sell their securities when they are experiencing stress on their liquidity. As of December 31, 2023, Trustmark had not accessed the BTFP.
63
During 2020, Trustmark issued $125.0 million aggregate principal amount of its 3.625% fixed-to-floating rate subordinated notes. The subordinated notes. At December 31, 2023 and 2022, the carrying amount of the subordinated notes was $123.5 million and $123.3 million, respectively. The subordinated notes mature December 1, 2030 and are redeemable at Trustmark’s option under certain circumstances. The subordinated notes are unsecured obligations and are subordinated in right of payment to all of Trustmark’s existing and future senior indebtedness, whether secured or unsecured. The subordinated notes are obligations of Trustmark only and are not obligations of, and are not guaranteed by, any of its subsidiaries, including TNB.
During 2006, Trustmark completed a private placement of $60.0 million of trust preferred securities through a newly formed Delaware trust affiliate, the Trust. The trust preferred securities mature September 30, 2036 and are redeemable at Trustmark’s option. The proceeds from the sale of the trust preferred securities were used by the Trust to purchase $61.9 million in aggregate principal amount of Trustmark’s junior subordinated debentures.
The Board of Directors of Trustmark currently has the authority to issue up to 20.0 million preferred shares with no par value. The ability to issue preferred shares in the future will provide Trustmark with additional financial and management flexibility for general corporate and acquisition purposes. At December 31, 2023, Trustmark had no shares of preferred stock issued and outstanding.
Management believes that Trustmark has sufficient liquidity and capital resources to meet presently known cash flow requirements arising from ongoing business transactions. As of December 31, 2023, Management is not aware of any events that are reasonably likely to have a material adverse effect on our liquidity, capital resources or operations. In addition, Management is not aware of any regulatory recommendations regarding liquidity that would have a material adverse effect on Trustmark.
In the ordinary course of business, Trustmark has entered into contractual obligations and has made other commitments to make future payments. Please refer to the accompanying notes to the consolidated financial statements included in Part II. Item 8. – Financial Statements and Supplementary Data of this report for the expected timing of such payments as of December 31, 2023. These include payments related to (i) short-term and long-term borrowings (Note 11 – Borrowings), (ii) operating and finance leases (Note 9 – Leases), (iii) time deposits with stated maturity dates (Note 10 – Deposits) and (iv) commitments to extend credit and standby letters of credit (Note 16 – Commitments and Contingencies).
Asset/Liability Management
Overview
Market risk reflects the potential risk of loss arising from adverse changes in interest rates and market prices. Trustmark has risk management policies to monitor and limit exposure to market risk. Trustmark’s primary market risk is interest rate risk created by core banking activities. Interest rate risk is the potential variability of the income generated by Trustmark’s financial products or services, which results from changes in various market interest rates. Market rate changes may take the form of absolute shifts, variances in the relationships between different rates and changes in the shape or slope of the interest rate term structure.
Following the LIBOR cessation date of June 30, 2023, the nationwide process for replacing LIBOR in financial contracts that mature thereafter and that do not provide for an effective means to replace LIBOR upon its cessation took effect pursuant to the Adjustable Interest Rate (LIBOR) Act. For contracts in which a party has the discretion to identify a replacement rate, the Adjustable Interest Rate (LIBOR) Act also provides a safe harbor to parties if they choose the SOFR-based benchmark replacement rate to be identified by the FRB. Trustmark had a significant number of loans, derivative contracts, borrowings and other financial instruments with attributes that were either directly or indirectly dependent on LIBOR. As December 31, 2023, all of Trustmark’s LIBOR exposure was remediated or in the process of being remediated. The transition from LIBOR could create costs and additional risk. Trustmark cannot predict what the ultimate impact of the transition from LIBOR will be; however, Trustmark has implemented various measures to manage the transition and mitigate risks. For additional information regarding the transition from LIBOR and Trustmark’s management of this transition, please see the respective risk factor included in Part I. Item 1A. – Risk Factors of this report.
Management continually develops and applies cost-effective strategies to manage these risks. Management’s Asset/Liability Committee sets the day-to-day operating guidelines, approves strategies affecting net interest income and coordinates activities within policy limits established by the Board of Directors of Trustmark. A key objective of the asset/liability management program is to quantify, monitor and manage interest rate risk and to assist Management in maintaining stability in the net interest margin under varying interest rate environments.
Derivatives
Trustmark uses financial derivatives for management of interest rate risk. Management’s Asset/Liability Committee, in its oversight role for the management of interest rate risk, approves the use of derivatives in balance sheet hedging strategies. The most common
64
derivatives employed by Trustmark are interest rate lock commitments, forward contracts (both futures contracts and options on futures contracts), interest rate swaps, interest rate caps and interest rate floors. As a general matter, the values of these instruments are designed to be inversely related to the values of the assets that they hedge (i.e., if the value of the hedged asset falls, the value of the related hedge rises). In addition, Trustmark has entered into derivatives contracts as counterparty to one or more customers in connection with loans extended to those customers. These transactions are designed to hedge interest rate, currency or other exposures of the customers and are not entered into by Trustmark for speculative purposes. Increased federal regulation of the derivatives markets may increase the cost to Trustmark to administer derivatives programs.
Derivatives Designated as Hedging Instruments
During 2022, Trustmark initiated a cash flow hedging program. Trustmark's objectives in initiating this hedging program were to add stability to interest income and to manage its exposure to interest rate movements. Interest rate swaps designated as cash flow hedges involve the receipt of fixed-rate amounts from a counterparty in exchange for Trustmark making variable-rate payments over the life of the agreements without exchange of the underlying notional amount. Interest rate floor spreads designated as cash flow hedges involve the receipt of variable-rate amounts if interest rates fall below the purchased floor strike rate on the contract and payments of variable-rate amounts if interest rates fall below the sold floor strike rate on the contract. Trustmark uses such derivatives to hedge the variable cash flows associated with existing and anticipated variable-rate loan assets. At December 31, 2023, the aggregate notional value of Trustmark's interest rate swaps and floor spreads designated as cash flow hedges totaled $1.125 billion compared to $825.0 million at December 31, 2022.
Trustmark records any gains or losses on these cash flow hedges in AOCI. Gains and losses on derivatives representing hedge components excluded from the assessment of effectiveness are recognized over the life of the hedge on a systematic and rational basis, as documented at hedge inception in accordance with Trustmark’s accounting policy election. The earnings recognition of excluded components totaled $57 thousand of amortization expense for the year ended December 31, 2023, and is included in interest and fees on LHFS and LHFI. As interest payments are received on Trustmark's variable-rate assets, amounts reported in AOCI are reclassified into interest and fees on LHFS and LHFI in the accompanying consolidated statements of income during the same period. For the years ended December 31, 2023 and 2022, Trustmark reclassified a loss, net of tax, of $12.3 million and $345 thousand, respectively, into interest and fees on LHFS and LHFI. During the next twelve months, Trustmark estimates that $13.2 million will be reclassified as a reduction to interest and fees on LHFS and LHFI. This amount could differ due to changes in interest rates, hedge de-designations or the addition of other hedges.
Derivatives Not Designated as Hedging Instruments
As part of Trustmark’s risk management strategy in the mortgage banking business, various derivative instruments such as interest rate lock commitments and forward sales contracts are utilized. Rate lock commitments are residential mortgage loan commitments with customers, which guarantee a specified interest rate for a specified period of time. Trustmark’s obligations under forward contracts consist of commitments to deliver mortgage loans, originated and/or purchased, in the secondary market at a future date. The gross notional amount of Trustmark’s off-balance sheet obligations under these derivative instruments totaled $171.4 million at December 31, 2023, with a negative valuation adjustment of $150 thousand, compared to $165.4 million, with a positive valuation adjustment of $325 thousand at December 31, 2022.
Trustmark utilizes a portfolio of exchange-traded derivative instruments, such as Treasury note futures contracts and option contracts, to achieve a fair value return that economically hedges changes in the fair value of the MSR attributable to interest rates. These transactions are considered freestanding derivatives that do not otherwise qualify for hedge accounting under GAAP. The total notional amount of these derivative instruments was $285.0 million at December 31, 2023 compared to $277.0 million at December 31, 2022. These exchange-traded derivative instruments are accounted for at fair value with changes in the fair value recorded as noninterest income in mortgage banking, net and are offset by the changes in the fair value of the MSR. The MSR fair value represents the present value of future cash flows, which among other things includes decay and the effect of changes in interest rates. Ineffectiveness of hedging the MSR fair value is measured by comparing the change in value of hedge instruments to the change in the fair value of the MSR asset attributable to changes in interest rates and other market driven changes in valuation inputs and assumptions. The impact of this strategy resulted in a net negative ineffectiveness of $6.3 million for the year ended December 31, 2023, compared to a net negative ineffectiveness of $4.1 million for the year ended December 31, 2022 and a net positive ineffectiveness of $2.5 million for the year ended December 31, 2021.
Trustmark offers certain interest rate derivatives products directly to qualified commercial lending clients seeking to manage their interest rate risk under loans they have entered into with TNB. Trustmark economically hedges interest rate swap transactions executed with commercial lending clients by entering into offsetting interest rate swap transactions with institutional derivatives market participants. Derivatives transactions executed as part of this program are not designated as qualifying hedging relationships under GAAP and are, therefore, carried on Trustmark’s financial statements at fair value with the change in fair value recorded as noninterest
65
income in bank card and other fees. Because these derivatives have mirror-image contractual terms, in addition to collateral provisions which mitigate the impact of non-performance risk, the changes in fair value are expected to substantially offset. The Chicago Mercantile Exchange rules legally characterize variation margin collateral payments made or received for centrally cleared interest rate swaps as settlements rather than collateral. As a result, centrally cleared interest rate swaps included in other assets and other liabilities are presented on a net basis in the accompanying consolidated balance sheets. At December 31, 2023, Trustmark had interest rate swaps with an aggregate notional amount of $1.500 billion related to this program, compared to $1.391 billion at December 31, 2022.
Credit-Risk-Related Contingent Features
Trustmark has agreements with its financial institution counterparties that contain provisions where if Trustmark defaults on any of its indebtedness, including default where repayment of the indebtedness has not been accelerated by the lender, then Trustmark could also be deemed to be in default on its derivatives obligations.
At December 31, 2023, the termination value of interest rate swaps in a liability position, which includes accrued interest but excludes any adjustment for nonperformance risk, related to these agreements was $1.4 million compared to none at December 31, 2022. At December 31, 2023 and 2022, Trustmark had posted collateral of $2.0 million and $740 thousand, respectively, against its obligations because of negotiated thresholds and minimum transfer amounts under these agreements. If Trustmark had breached any of these triggering provisions at December 31, 2023, it could have been required to settle its obligations under the agreements at the termination value (which is expected to approximate fair market value).
Credit risk participation agreements arise when Trustmark contracts with other financial institutions, as a guarantor or beneficiary, to share credit risk associated with certain interest rate swaps. These agreements provide for reimbursement of losses resulting from a third-party default on the underlying swap. At December 31, 2023, Trustmark had entered into six risk participation agreements as a beneficiary with and aggregate notional amount of $40.1 million compared to five risk participation agreements as a beneficiary with an aggregate notional amount of $50.2 million at December 31, 2022. At December 31, 2023, Trustmark had entered into thirty-five risk participation agreements as a guarantor with an aggregate notional amount of $304.7 million, compared to twenty-nine risk participation agreements as a guarantor with an aggregate notional amount of $235.8 million at December 31, 2022. The aggregate fair values of these risk participation agreements were immaterial at December 31, 2023 and 2022.
Trustmark’s participation in the derivatives markets is subject to increased federal regulation of these markets. Trustmark believes that it may continue to use financial derivatives to manage interest rate risk and also to offer derivatives products to certain qualified commercial lending clients in compliance with the Volcker Rule. However, the increased federal regulation of the derivatives markets has increased the cost to Trustmark of administering its derivatives programs. Some of these costs (particularly compliance costs related to the Volcker Rule and other federal regulations) are expected to recur in the future.
ITEM 7A. QUANTITATIVE AND QUALITATIVE DISCLOSURES ABOUT MARKET RISK
Market/Interest Rate Risk Management
The primary purpose in managing interest rate risk is to invest capital effectively and preserve the value created by the core banking business. This is accomplished through the development and implementation of lending, funding, pricing and hedging strategies designed to maximize net interest income performance under varying interest rate environments subject to specific liquidity and interest rate risk guidelines.
Financial simulation models are the primary tools used by Management’s Asset/Liability Committee to measure interest rate exposure. The significant increase in short-term market interest rates and the overall interest rate environment is likely to affect the balance sheet composition and rates. The simulation incorporates assumptions regarding the effects of such changes based on a combination of historical analysis and expected behavior. Using a wide range of scenarios, Management is provided with extensive information on the potential impact on net interest income caused by changes in interest rates. Models are structured to simulate cash flows and accrual characteristics of Trustmark’s balance sheet. Assumptions are made about the direction and volatility of interest rates, the slope of the yield curve and the changing composition of Trustmark’s balance sheet, resulting from both strategic plans and customer behavior. In addition, the model incorporates Management’s assumptions and expectations regarding such factors as loan and deposit growth, pricing, prepayment speeds and spreads between interest rates.
Based on the results of the simulation models using static balances, the table below summarizes the effect various one-year interest rate shift scenarios would have on net interest income compared to a base case, flat scenario at December 31, 2023 and 2022. Given the
66
substantial increase in market rates, the down 200 basis points scenario has been added to the table below for the year ended December 31, 2023.
|
|
Estimated % Change |
|
|||||
|
|
in Net Interest Income |
|
|||||
Change in Interest Rates |
|
2023 |
|
|
2022 |
|
||
+200 basis points |
|
|
0.5 |
% |
|
|
3.3 |
% |
+100 basis points |
|
|
0.3 |
% |
|
|
1.7 |
% |
-100 basis points |
|
|
-0.4 |
% |
|
|
-1.8 |
% |
-200 basis points |
|
|
-1.0 |
% |
|
|
— |
|
Management cannot provide any assurance about the actual effect of changes in interest rates on net interest income. The estimates provided do not include the effects of possible strategic changes in the balances of various assets and liabilities throughout 2024 or additional actions Trustmark could undertake in response to changes in interest rates. Management will continue to prudently manage the balance sheet in an effort to control interest rate risk and maintain profitability over the long term.
Another component of interest rate risk management is measuring the economic value-at-risk for a given change in market interest rates. The economic value-at-risk may indicate risks associated with longer-term balance sheet items that may not affect net interest income at risk over shorter time periods. Trustmark uses computer-modeling techniques to determine the present value of all asset and liability cash flows (both on- and off-balance sheet), adjusted for prepayment expectations, using a market discount rate. The economic value of equity (EVE), also known as net portfolio value, is defined as the difference between the present value of asset cash flows and the present value of liability cash flows. The resulting change in EVE in different market rate environments, from the base case scenario, is the amount of EVE at risk from those rate environments.
The following table summarizes the effect that various interest rate shifts would have on net portfolio value at December 31, 2023 and 2022.
|
|
Estimated % Change |
|
|||||
|
|
in Net Portfolio Value |
|
|||||
Change in Interest Rates |
|
2023 |
|
|
2022 |
|
||
+200 basis points |
|
|
-2.3 |
% |
|
|
-1.6 |
% |
+100 basis points |
|
|
-0.9 |
% |
|
|
-0.6 |
% |
Trustmark determines the fair value of the MSR using a valuation model administered by a third party that calculates the present value of estimated future net servicing income. The model incorporates assumptions that market participants use in estimating future net servicing income, including estimates of prepayment speeds, discount rate, default rates, cost to service (including delinquency and foreclosure costs), escrow account earnings, contractual servicing fee income and other ancillary income such as late fees. Management reviews all significant assumptions quarterly. Mortgage loan prepayment speeds, a key assumption in the model, is the annual rate at which borrowers are forecasted to repay their mortgage loan principal. The discount rate used to determine the present value of estimated future net servicing income, another key assumption in the model, is an estimate of the required rate of return investors in the market would require for an asset with similar risk. Both assumptions can, and generally will, change as market conditions and interest rates change.
By way of example, an increase in either the prepayment speed or discount rate assumption will result in a decrease in the fair value of the MSR, while a decrease in either assumption will result in an increase in the fair value of the MSR. In recent years, there have been significant market-driven fluctuations in loan prepayment speeds and discount rates. These fluctuations can be rapid and may continue to be significant. Therefore, estimating prepayment speed and/or discount rates within ranges that market participants would use in determining the fair value of the MSR requires significant management judgment.
At December 31, 2023, the MSR fair value was $131.9 million, compared to $129.7 million at December 31, 2022. The impact on the MSR fair value of a 10% adverse change in prepayment speeds or a 100-basis point increase in discount rates at December 31, 2023 would be a decline in fair value of approximately $4.8 million and $5.4 million, respectively, compared to a decline in fair value of approximately $4.5 million and $5.4 million, respectively, at December 31, 2022. Changes of equal magnitude in the opposite direction would produce similar increases in fair value in the respective amounts.
67
ITEM 8. FINANCIAL STATEMENTS AND SUPPLEMENTARY DATA
Report of Independent Registered Public Accounting Firm
Shareholders and the Board of Directors of Trustmark Corporation
Jackson, Mississippi
Opinions on the Financial Statements and Internal Control over Financial Reporting
We have audited the accompanying consolidated balance sheets of Trustmark Corporation and subsidiaries (the "Company") as of December 31, 2023 and 2022, the related consolidated statements of income, comprehensive income, changes in shareholders’ equity, and cash flows for each of the years in the three-year period ended December 31, 2023, and the related notes (collectively referred to as the "financial statements"). We also have audited the Company’s internal control over financial reporting as of December 31, 2023, based on criteria established in Internal Control – Integrated Framework: (2013) issued by the Committee of Sponsoring Organizations of the Treadway Commission (COSO).
In our opinion, the financial statements referred to above present fairly, in all material respects, the financial position of the Company as of December 31, 2023 and 2022, and the results of their operations and their cash flows for each of the years in the three-year period ended December 31, 2023 in conformity with accounting principles generally accepted in the United States of America. Also in our opinion, the Company maintained, in all material respects, effective internal control over financial reporting as of December 31, 2023, based on criteria established in Internal Control – Integrated Framework: (2013) issued by COSO.
Basis for Opinions
The Company’s management is responsible for these financial statements, for maintaining effective internal control over financial reporting, and for its assessment of the effectiveness of internal control over financial reporting, included in the accompanying Management Report on Internal Control over Financial Reporting. Our responsibility is to express an opinion on the Company’s financial statements and an opinion on the Company’s internal control over financial reporting based on our audits. We are a public accounting firm registered with the Public Company Accounting Oversight Board (United States) ("PCAOB") and are required to be independent with respect to the Company in accordance with the U.S. federal securities laws and the applicable rules and regulations of the Securities and Exchange Commission and the PCAOB.
We conducted our audits in accordance with the standards of the PCAOB. Those standards require that we plan and perform the audits to obtain reasonable assurance about whether the financial statements are free of material misstatement, whether due to error or fraud, and whether effective internal control over financial reporting was maintained in all material respects.
Our audits of the financial statements included performing procedures to assess the risks of material misstatement of the financial statements, whether due to error or fraud, and performing procedures that respond to those risks. Such procedures included examining, on a test basis, evidence regarding the amounts and disclosures in the financial statements. Our audits also included evaluating the accounting principles used and significant estimates made by management, as well as evaluating the overall presentation of the financial statements. Our audit of internal control over financial reporting included obtaining an understanding of internal control over financial reporting, assessing the risk that a material weakness exists, and testing and evaluating the design and operating effectiveness of internal control based on the assessed risk. Our audits also included performing such other procedures as we considered necessary in the circumstances. We believe that our audits provide a reasonable basis for our opinions.
Definition and Limitations of Internal Control Over Financial Reporting
A company’s internal control over financial reporting is a process designed to provide reasonable assurance regarding the reliability of financial reporting and the preparation of financial statements for external purposes in accordance with generally accepted accounting principles. A company’s internal control over financial reporting includes those policies and procedures that (1) pertain to the maintenance of records that, in reasonable detail, accurately and fairly reflect the transactions and dispositions of the assets of the company; (2) provide reasonable assurance that transactions are recorded as necessary to permit preparation of financial statements in accordance with generally accepted accounting principles, and that receipts and expenditures of the company are being made only in accordance with authorizations of management and directors of the company; and (3) provide reasonable assurance regarding prevention or timely detection of unauthorized acquisition, use, or disposition of the company’s assets that could have a material effect on the financial statements.
Because of its inherent limitations, internal control over financial reporting may not prevent or detect misstatements. Also, projections of any evaluation of effectiveness to future periods are subject to the risk that controls may become inadequate because of changes in conditions, or that the degree of compliance with the policies or procedures may deteriorate.
68
Critical Audit Matter
The critical audit matter communicated below is a matter arising from the current period audit of the financial statements that was communicated or required to be communicated to the audit committee and that: (1) relates to accounts or disclosures that are material to the financial statements and (2) involved our especially challenging, subjective, or complex judgments. The communication of the critical audit matter does not alter in any way our opinion on the financial statements, taken as a whole, and we are not, by communicating the critical audit matter below, providing a separate opinion on the critical audit matter or on the accounts or disclosures to which it relates.
Allowance for Credit Losses, LHFI Reasonable and Supportable Forecasts
As described in Note 1 - Significant Accounting Policies and Note 4 – Loans Held For Investment and Allowance for Credit Losses, LHFI to the consolidated financial statements, the Company uses a third-party software application to calculate the quantitative portion of the allowance for credit losses, which employs a discounted cash flow (DCF) or weighted average remaining maturity (WARM) method by loan pool. A reasonable and supportable forecast is developed through a Loss Driver Analysis (LDA) by loan class. The LDA uses charge off data from Trustmark National Bank’s Federal Financial Institutions Examination Council (FFIEC) reports to construct a periodic default rate (PDR). The PDR is decomposed into a probability of default (PD). Regressions are run using the data for various macroeconomic variables in order to determine which correlate to the Company’s losses. These variables are then incorporated into the application to calculate a quarterly PD using a third-party baseline forecast. Loss given default (LGD) is derived from a method that traces the relationship between LGD and PD over a period of time and projects LGD based on the PD forecast. This model approach is applicable to all pools within the construction, land development and other land, other secured by 1-4 family residential properties, secured by nonfarm, nonresidential properties and other real estate secured loan classes, as well as all other consumer and other loans pools. For commercial and industrial loan pools, the Company uses its own PD and LGD data. The Company utilizes a third-party bond default study to derive the PD and LGD for the obligations of state and political subdivisions pool.
The Company determined that reasonable and supportable forecasts could be made for a twelve-month period for all of its loan pools in which models were developed through the LDA. To the extent the lives of the loans in the LHFI portfolio extend beyond this forecast period, Trustmark uses a reversion period of four quarters and reverts to the historical mean on a straight-line basis over the remaining life of the loans.
Estimating reasonable and supportable forecasts requires significant judgment and could have a material effect on the Company’s financial statements. Management leverages economic projections from an independent third party for its forecasts over the forecast period. We identified auditing the reasonableness of forecasts, including the LDA, as a critical audit matter as it involves especially subjective auditor judgment and increased audit effort, including the involvement of specialists.
The primary audit procedures we performed to address this critical audit matter included the following:
Tested the effectiveness of controls over the LDA and reasonable and supportable forecast including:
Performed substantive testing over the LDA and reasonable and supportable forecast including:
/s/ Crowe LLP
We have served as the Company’s auditor since 2015, which is the year the engagement letter was signed for the audit of the 2016 financial statements.
Fort Lauderdale, Florida
February 15, 2024
69
Trustmark Corporation and Subsidiaries
Consolidated Balance Sheets
($ in thousands)
|
|
December 31, |
|
|||||
|
|
2023 |
|
|
2022 |
|
||
Assets |
|
|
|
|
|
|
||
Cash and due from banks |
|
$ |
|
|
$ |
|
||
Federal funds sold and securities purchased under reverse repurchase agreements |
|
|
|
|
|
|
||
Securities available for sale, at fair value (amortized cost: $ |
|
|
|
|
|
|
||
Securities held to maturity, net of ACL of $ |
|
|
|
|
|
|
||
Loans held for sale (LHFS) |
|
|
|
|
|
|
||
Loans held for investment (LHFI) |
|
|
|
|
|
|
||
Less ACL, LHFI |
|
|
|
|
|
|
||
Net LHFI |
|
|
|
|
|
|
||
Premises and equipment, net |
|
|
|
|
|
|
||
Mortgage servicing rights (MSR) |
|
|
|
|
|
|
||
Goodwill |
|
|
|
|
|
|
||
Identifiable intangible assets, net |
|
|
|
|
|
|
||
Other real estate, net |
|
|
|
|
|
|
||
Operating lease right-of-use assets |
|
|
|
|
|
|
||
Other assets |
|
|
|
|
|
|
||
Total Assets |
|
$ |
|
|
$ |
|
||
|
|
|
|
|
|
|
||
Liabilities |
|
|
|
|
|
|
||
Deposits: |
|
|
|
|
|
|
||
Noninterest-bearing |
|
$ |
|
|
$ |
|
||
Interest-bearing |
|
|
|
|
|
|
||
Total deposits |
|
|
|
|
|
|
||
Federal funds purchased and securities sold under repurchase agreements |
|
|
|
|
|
|
||
Other borrowings |
|
|
|
|
|
|
||
Subordinated notes |
|
|
|
|
|
|
||
Junior subordinated debt securities |
|
|
|
|
|
|
||
ACL on off-balance sheet credit exposures |
|
|
|
|
|
|
||
Operating lease liabilities |
|
|
|
|
|
|
||
Other liabilities |
|
|
|
|
|
|
||
Total Liabilities |
|
|
|
|
|
|
||
|
|
|
|
|
|
|
||
Shareholders' Equity |
|
|
|
|
|
|
||
Common stock, |
|
|
|
|
|
|
||
Authorized: |
|
|
|
|
|
|
||
Issued and outstanding: |
|
|
|
|
|
|
||
Capital surplus |
|
|
|
|
|
|
||
Retained earnings |
|
|
|
|
|
|
||
Accumulated other comprehensive income (loss), net of tax |
|
|
( |
) |
|
|
( |
) |
Total Shareholders' Equity |
|
|
|
|
|
|
||
Total Liabilities and Shareholders' Equity |
|
$ |
|
|
$ |
|
||
See notes to consolidated financial statements.
70
Trustmark Corporation and Subsidiaries
Consolidated Statements of Income
($ in thousands, except per share data)
|
|
Years Ended December 31, |
|
|||||||||
|
|
2023 |
|
|
2022 |
|
|
2021 |
|
|||
Interest Income |
|
|
|
|
|
|
|
|
|
|||
Interest and fees on LHFS & LHFI |
|
$ |
|
|
$ |
|
|
$ |
|
|||
Interest and fees on PPP loans |
|
|
|
|
|
|
|
|
|
|||
Interest on securities: |
|
|
|
|
|
|
|
|
|
|||
Taxable |
|
|
|
|
|
|
|
|
|
|||
Tax exempt |
|
|
|
|
|
|
|
|
|
|||
Interest on federal funds sold and securities purchased under |
|
|
|
|
|
|
|
|
|
|||
Other interest income |
|
|
|
|
|
|
|
|
|
|||
Total Interest Income |
|
|
|
|
|
|
|
|
|
|||
Interest Expense |
|
|
|
|
|
|
|
|
|
|||
Interest on deposits |
|
|
|
|
|
|
|
|
|
|||
Interest on federal funds purchased and securities sold under |
|
|
|
|
|
|
|
|
|
|||
Other interest expense |
|
|
|
|
|
|
|
|
|
|||
Total Interest Expense |
|
|
|
|
|
|
|
|
|
|||
Net Interest Income |
|
|
|
|
|
|
|
|
|
|||
Provision for credit losses (PCL), LHFI |
|
|
|
|
|
|
|
|
( |
) |
||
PCL, off-balance sheet credit exposures |
|
|
( |
) |
|
|
|
|
|
( |
) |
|
Net Interest Income After PCL |
|
|
|
|
|
|
|
|
|
|||
Noninterest Income |
|
|
|
|
|
|
|
|
|
|||
Service charges on deposit accounts |
|
|
|
|
|
|
|
|
|
|||
Bank card and other fees |
|
|
|
|
|
|
|
|
|
|||
Mortgage banking, net |
|
|
|
|
|
|
|
|
|
|||
Insurance commissions |
|
|
|
|
|
|
|
|
|
|||
Wealth management |
|
|
|
|
|
|
|
|
|
|||
Other, net |
|
|
|
|
|
|
|
|
|
|||
Securities gains (losses), net |
|
|
|
|
|
|
|
|
|
|||
Total Noninterest Income |
|
|
|
|
|
|
|
|
|
|||
Noninterest Expense |
|
|
|
|
|
|
|
|
|
|||
Salaries and employee benefits |
|
|
|
|
|
|
|
|
|
|||
Services and fees (2) |
|
|
|
|
|
|
|
|
|
|||
Net occupancy - premises |
|
|
|
|
|
|
|
|
|
|||
Equipment expense |
|
|
|
|
|
|
|
|
|
|||
Litigation settlement expense |
|
|
|
|
|
|
|
|
|
|||
Other expense (1)(2) |
|
|
|
|
|
|
|
|
|
|||
Total Noninterest Expense |
|
|
|
|
|
|
|
|
|
|||
Income Before Income Taxes |
|
|
|
|
|
|
|
|
|
|||
Income taxes |
|
|
|
|
|
|
|
|
|
|||
Net Income |
|
$ |
|
|
$ |
|
|
$ |
|
|||
|
|
|
|
|
|
|
|
|
|
|||
Earnings Per Share |
|
|
|
|
|
|
|
|
|
|||
Basic |
|
$ |
|
|
$ |
|
|
$ |
|
|||
Diluted |
|
$ |
|
|
$ |
|
|
$ |
|
|||
See notes to consolidated financial statements.
71
Trustmark Corporation and Subsidiaries
Consolidated Statements of Comprehensive Income
($ in thousands)
|
|
Years Ended December 31, |
|
|||||||||
|
|
2023 |
|
|
2022 |
|
|
2021 |
|
|||
Net income per consolidated statements of income |
|
$ |
|
|
$ |
|
|
$ |
|
|||
Other comprehensive income (loss), net of tax: |
|
|
|
|
|
|
|
|
|
|||
Net unrealized gains (losses) on available for sale securities and |
|
|
|
|
|
|
|
|
|
|||
Net unrealized holding gains (losses) arising during the period |
|
|
|
|
|
( |
) |
|
|
( |
) |
|
Reclassification adjustment for net (gains) losses realized in |
|
|
( |
) |
|
|
|
|
|
|
||
Change in net unrealized holding loss on securities transferred to |
|
|
|
|
|
( |
) |
|
|
|
||
Pension and other postretirement benefit plans: |
|
|
|
|
|
|
|
|
|
|||
Change in the actuarial loss of pension and other postretirement |
|
|
( |
) |
|
|
|
|
|
|
||
Reclassification adjustments for changes realized in net income: |
|
|
|
|
|
|
|
|
|
|||
Net change in prior service costs |
|
|
|
|
|
|
|
|
|
|||
Recognized net loss due to lump sum settlements |
|
|
|
|
|
|
|
|
|
|||
Change in net actuarial loss |
|
|
|
|
|
|
|
|
|
|||
Derivatives: |
|
|
|
|
|
|
|
|
|
|||
Change in the accumulated gain (loss) on effective cash flow |
|
|
( |
) |
|
|
( |
) |
|
|
|
|
Reclassification adjustment for (gain) loss realized in net income |
|
|
|
|
|
|
|
|
|
|||
Other comprehensive income (loss), net of tax |
|
|
|
|
|
( |
) |
|
|
( |
) |
|
Comprehensive income (loss) |
|
$ |
|
|
$ |
( |
) |
|
$ |
|
||
See notes to consolidated financial statements.
72
Trustmark Corporation and Subsidiaries
Consolidated Statements of Changes in Shareholders' Equity
($ in thousands, except per share data)
|
|
|
|
|
|
|
|
|
|
|
|
|
|
Accumulated |
|
|
|
|
||||||
|
|
|
|
|
|
|
|
|
|
|
|
|
|
Other |
|
|
|
|
||||||
|
|
Common Stock |
|
|
|
|
|
|
|
|
Comprehensive |
|
|
|
|
|||||||||
|
|
Shares |
|
|
|
|
|
Capital |
|
|
Retained |
|
|
Income |
|
|
|
|
||||||
|
|
Outstanding |
|
|
Amount |
|
|
Surplus |
|
|
Earnings |
|
|
(Loss) |
|
|
Total |
|
||||||
Balance, January 1, 2021 |
|
|
|
|
$ |
|
|
$ |
|
|
$ |
|
|
$ |
( |
) |
|
$ |
|
|||||
Net income per consolidated statements of |
|
|
— |
|
|
|
— |
|
|
|
— |
|
|
|
|
|
|
— |
|
|
|
|
||
Other comprehensive income (loss), net of |
|
|
— |
|
|
|
— |
|
|
|
— |
|
|
|
— |
|
|
|
( |
) |
|
|
( |
) |
Cash dividends paid on common stock |
|
|
— |
|
|
|
— |
|
|
|
— |
|
|
|
( |
) |
|
|
— |
|
|
|
( |
) |
Shares withheld to pay taxes, long-term |
|
|
|
|
|
|
|
|
( |
) |
|
|
— |
|
|
|
— |
|
|
|
( |
) |
||
Repurchase and retirement of common |
|
|
( |
) |
|
|
( |
) |
|
|
( |
) |
|
|
— |
|
|
|
— |
|
|
|
( |
) |
Compensation expense, long-term |
|
|
— |
|
|
|
— |
|
|
|
|
|
|
— |
|
|
|
— |
|
|
|
|
||
Balance, December 31, 2021 |
|
|
|
|
|
|
|
|
|
|
|
|
|
|
( |
) |
|
|
|
|||||
Net income per consolidated statements of |
|
|
— |
|
|
|
— |
|
|
|
— |
|
|
|
|
|
|
— |
|
|
|
|
||
Other comprehensive income (loss), net of |
|
|
— |
|
|
|
— |
|
|
|
— |
|
|
|
— |
|
|
|
( |
) |
|
|
( |
) |
Cash dividends paid on common stock |
|
|
— |
|
|
|
— |
|
|
|
— |
|
|
|
( |
) |
|
|
— |
|
|
|
( |
) |
Shares withheld to pay taxes, long-term |
|
|
|
|
|
|
|
|
( |
) |
|
|
— |
|
|
|
— |
|
|
|
( |
) |
||
Repurchase and retirement of common |
|
|
( |
) |
|
|
( |
) |
|
|
( |
) |
|
|
— |
|
|
|
— |
|
|
|
( |
) |
Compensation expense, long-term |
|
|
— |
|
|
|
— |
|
|
|
|
|
|
— |
|
|
|
— |
|
|
|
|
||
Balance, December 31, 2022 |
|
|
|
|
|
|
|
|
|
|
|
|
|
|
( |
) |
|
|
|
|||||
Net income per consolidated statements of |
|
|
— |
|
|
|
— |
|
|
|
— |
|
|
|
|
|
|
— |
|
|
|
|
||
Other comprehensive income (loss), net of |
|
|
— |
|
|
|
— |
|
|
|
— |
|
|
|
— |
|
|
|
|
|
|
|
||
Cash dividends paid on common stock |
|
|
— |
|
|
|
— |
|
|
|
— |
|
|
|
( |
) |
|
|
— |
|
|
|
( |
) |
Shares withheld to pay taxes, long-term |
|
|
|
|
|
|
|
|
( |
) |
|
|
— |
|
|
|
— |
|
|
|
( |
) |
||
Compensation expense, long-term |
|
|
— |
|
|
|
— |
|
|
|
|
|
|
— |
|
|
|
— |
|
|
|
|
||
Balance, December 31, 2023 |
|
|
|
|
$ |
|
|
$ |
|
|
$ |
|
|
$ |
( |
) |
|
$ |
|
|||||
See notes to consolidated financial statements.
73
Trustmark Corporation and Subsidiaries
Consolidated Statements of Cash Flows
($ in thousands)
|
|
Years Ended December 31, |
|
|||||||||
|
|
2023 |
|
|
2022 |
|
|
2021 |
|
|||
Operating Activities |
|
|
|
|
|
|
|
|
|
|||
Net income per consolidated statements of income |
|
$ |
|
|
$ |
|
|
$ |
|
|||
Adjustments to reconcile net income to net cash provided by operating activities: |
|
|
|
|
|
|
|
|
|
|||
PCL |
|
|
|
|
|
|
|
|
( |
) |
||
Depreciation and amortization |
|
|
|
|
|
|
|
|
|
|||
Net amortization of securities |
|
|
|
|
|
|
|
|
|
|||
Securities (gains) losses, net |
|
|
( |
) |
|
|
|
|
|
|
||
Gains on sales of loans, net |
|
|
( |
) |
|
|
( |
) |
|
|
( |
) |
Compensation expense, long-term incentive plan |
|
|
|
|
|
|
|
|
|
|||
Deferred income tax provision |
|
|
( |
) |
|
|
( |
) |
|
|
|
|
Proceeds from sales of LHFS |
|
|
|
|
|
|
|
|
|
|||
Purchases and originations of LHFS |
|
|
( |
) |
|
|
( |
) |
|
|
( |
) |
Originations of MSR |
|
|
( |
) |
|
|
( |
) |
|
|
( |
) |
Earnings on bank-owned life insurance |
|
|
( |
) |
|
|
( |
) |
|
|
( |
) |
Net change in other assets |
|
|
( |
) |
|
|
( |
) |
|
|
|
|
Net change in other liabilities |
|
|
|
|
|
|
|
|
|
|||
Other operating activities, net |
|
|
|
|
|
( |
) |
|
|
( |
) |
|
Net cash from operating activities |
|
|
|
|
|
|
|
|
|
|||
|
|
|
|
|
|
|
|
|
|
|||
Investing Activities |
|
|
|
|
|
|
|
|
|
|||
Proceeds from maturities, prepayments and calls of securities held to maturity |
|
|
|
|
|
|
|
|
|
|||
Proceeds from maturities, prepayments and calls of securities available for sale |
|
|
|
|
|
|
|
|
|
|||
Proceeds from sales of securities available for sale |
|
|
|
|
|
|
|
|
|
|||
Purchases of securities held to maturity |
|
|
( |
) |
|
|
( |
) |
|
|
|
|
Purchases of securities available for sale |
|
|
|
|
|
( |
) |
|
|
( |
) |
|
Net proceeds from bank-owned life insurance |
|
|
( |
) |
|
|
|
|
|
|
||
Net change in federal funds sold and securities purchased under reverse |
|
|
|
|
|
( |
) |
|
|
|
||
Net change in member bank stock |
|
|
|
|
|
( |
) |
|
|
( |
) |
|
Net change in LHFI and PPP loans |
|
|
( |
) |
|
|
( |
) |
|
|
( |
) |
Proceeds from sales of PPP loans |
|
|
|
|
|
|
|
|
|
|||
Purchases of premises and equipment |
|
|
( |
) |
|
|
( |
) |
|
|
( |
) |
Proceeds from sales of premises and equipment |
|
|
|
|
|
|
|
|
|
|||
Proceeds from sales of other real estate |
|
|
|
|
|
|
|
|
|
|||
Purchases of software |
|
|
( |
) |
|
|
( |
) |
|
|
( |
) |
Investments in tax credit and other partnerships |
|
|
( |
) |
|
|
( |
) |
|
|
( |
) |
Net cash from investing activities |
|
|
( |
) |
|
|
( |
) |
|
|
( |
) |
|
|
|
|
|
|
|
|
|
|
|||
Financing Activities |
|
|
|
|
|
|
|
|
|
|||
Net change in deposits |
|
|
|
|
|
( |
) |
|
|
|
||
Net change in federal funds purchased and securities sold under |
|
|
( |
) |
|
|
|
|
|
|
||
Net change in other borrowings |
|
|
( |
) |
|
|
|
|
|
( |
) |
|
Payments under finance lease obligations |
|
|
( |
) |
|
|
( |
) |
|
|
( |
) |
Common stock dividends |
|
|
( |
) |
|
|
( |
) |
|
|
( |
) |
Repurchase and retirement of common stock |
|
|
|
|
|
( |
) |
|
|
( |
) |
|
Shares withheld to pay taxes, long-term incentive plan |
|
|
( |
) |
|
|
( |
) |
|
|
( |
) |
Net cash from financing activities |
|
|
|
|
|
|
|
|
|
|||
|
|
|
|
|
|
|
|
|
|
|||
Net change in cash and cash equivalents |
|
|
|
|
|
( |
) |
|
|
|
||
Cash and cash equivalents at beginning of year |
|
|
|
|
|
|
|
|
|
|||
Cash and cash equivalents at end of year |
|
$ |
|
|
$ |
|
|
$ |
|
|||
See notes to consolidated financial statements.
74
Note 1 – Significant Accounting Policies
Business
Trustmark Corporation (Trustmark) is a bank holding company headquartered in Jackson, Mississippi. Through its subsidiaries, Trustmark operates as a financial services organization providing banking and financial solutions to corporate institutions and individual customers through offices in Alabama (includes the Georgia Loan Production Office), Florida, Mississippi, Tennessee and Texas.
Basis of Financial Statement Presentation
The consolidated financial statements include the accounts of Trustmark and all other entities in which Trustmark has a controlling financial interest. All significant intercompany accounts and transactions have been eliminated in consolidation. Certain reclassifications have been made to prior period amounts to conform to the current period presentation.
The consolidated financial statements have been prepared in conformity with U.S. generally accepted accounting principles (GAAP). The preparation of financial statements in conformity with these accounting principles requires Management to make estimates and assumptions that affect the reported amounts of assets and liabilities at the date of the financial statements and income and expense during the reporting periods and the related disclosures. Although Management’s estimates contemplate current conditions and how they are expected to change in the future, it is reasonably possible that in 2024 actual conditions could vary from those anticipated, which could affect Trustmark’s financial condition and results of operations. Actual results could differ from those estimates.
Securities
Securities are classified as either held to maturity or available for sale. Securities are classified as held to maturity and carried at amortized cost when Management has the positive intent and the ability to hold them until maturity. Securities to be held for indefinite periods of time are classified as available for sale and carried at fair value, with the unrealized holding gains and losses reported as a component of other comprehensive income (loss), net of tax. Securities available for sale are used as part of Trustmark’s interest rate risk management strategy and may be sold in response to changes in interest rates, changes in prepayment rates and other factors. Management determines the appropriate classification of securities at the time of purchase.
The amortized cost of debt securities classified as securities held to maturity or securities available for sale is adjusted for amortization of premiums and accretion of discounts to maturity of the security using the interest method. Such amortization or accretion is included in interest on securities. Realized gains and losses are determined using the specific identification method and are included in noninterest income as securities gains (losses), net.
Securities transferred from the available for sale category to the held to maturity category are recorded at fair value at the date of transfer. Unrealized holding gains or losses associated with the transfer of securities from available for sale to held to maturity are included in the balance of accumulated other comprehensive income (loss), net of tax, in the consolidated balance sheets. These unrealized holding gains or losses are amortized over the remaining life of the security as a yield adjustment in a manner consistent with the amortization or accretion of the original purchase premium or discount on the associated security.
Allowance for Credit Losses (ACL)
Financial Accounting Standards Board (FASB) Accounting Standard Codification (ASC) Topic 326 requires a current expected credit losses methodology for estimating allowances for credit losses and applies to all financial instruments carried at amortized cost, including securities held to maturity, and makes targeted improvements to the accounting for credit losses on securities available for sale.
Under FASB ASC Topic 326, the ACL is an estimate measured using relevant information about past events, including historical credit loss experience on financial assets with similar risk characteristics, current conditions, and reasonable and supportable forecasts that affect the collectability of the remaining cash flows over the contractual term of the financial assets.
Trustmark adopted a zero-credit loss assumption for certain classes of securities. This zero-credit loss assumption applies to debt issuances of the U.S. Treasury and agencies and instrumentalities of the United States government. The reasons behind the adoption of the zero-credit loss assumption were as follows:
75
Trustmark continuously monitors any changes in economic conditions, credit downgrades, changes to explicit or implicit guarantees granted to certain debt issuers, and any other relevant information that would indicate potential credit deterioration and prompt Trustmark to reconsider its zero-credit loss assumption.
Securities Available for Sale
FASB ASC Subtopic 326-30, “Financial Instruments-Credit Losses-Available-for-Sale Debt Securities,” replaced the concept of other-than-temporarily impaired with the ACL. Unlike securities held to maturity, securities available for sale are evaluated on an individual level and pooling of securities is not allowed.
Quarterly, Trustmark evaluates if any security has a fair value less than its amortized cost. Once these securities are identified, in order to determine whether a decline in fair value resulted from a credit loss or other factors, Trustmark performs further analysis as outlined below:
The DCF analysis utilizes contractual maturities, as well as third-party credit ratings and cumulative default rates published annually by Moody’s Investor Service (Moody’s).
Accrued interest receivable is excluded from the estimate of credit losses for securities available for sale and reported in other assets on the consolidated balance sheets.
Securities Held to Maturity
FASB ASC Subtopic 326-20, “Financial Instruments-Credit Losses-Measured at Amortized Cost,” requires institutions to measure expected credit losses on financial assets carried at amortized cost on a collective or pool basis when similar risks exist. Trustmark uses several levels of segmentation to measure expected credit losses for its held to maturity securities:
As discussed above, Trustmark has determined that for certain classes of securities it would be appropriate to assume the expected credit loss to be
Accrued interest receivable is excluded from the estimate of credit losses for securities held to maturity and included in other assets on the consolidated balance sheets.
Trustmark monitors the credit quality of securities held to maturity on a monthly basis through credit ratings.
76
Loans Held for Sale (LHFS)
Trustmark's LHFS portfolio consists of mortgage loans purchased from wholesale customers or originated in Trustmark’s General Banking Segment. Trustmark has elected to account for its LHFS under the fair value option permitted by FASB ASC Topic 825, “Financial Instruments,” with interest income on the LHFS reported in interest and fees on LHFS and LHFI. Trustmark reports unrealized gains and losses resulting from changes in the fair value of the LHFS accounted for under the fair value option as noninterest income in mortgage banking, net. LHFS are actively managed and monitored and certain market risks of the loans may be mitigated through the use of derivatives. These derivative instruments are carried at fair value with changes in the fair value reported as noninterest income in mortgage banking, net. Changes in the fair value of the LHFS are largely offset by changes in the fair value of the derivative instruments. Election of the fair value option allows Trustmark to reduce the accounting volatility that would otherwise result from the asymmetry created by accounting for its LHFS at the lower of cost or fair value and the derivative instruments at fair value. Realized gains and losses upon ultimate sale of the loans are reported as noninterest income in mortgage banking, net.
Government National Mortgage Association (GNMA) optional repurchase programs allow financial institutions to buy back individual delinquent mortgage loans that meet certain criteria from the securitized loan pool for which the institution provides servicing. At the servicer’s option and without GNMA’s prior authorization, the servicer may repurchase such a delinquent loan for an amount equal to
Trustmark defers the upfront loan fees and costs related to the LHFS. In general, the LHFS are only retained on Trustmark’s balance sheet for
Loans Held for Investment (LHFI)
LHFI are loans that management has the intent and ability to hold for the foreseeable future or until maturity or pay-off and are reported at amortized cost net of the ACL. Amortized cost is the amount of unpaid principal, adjusted for the net amount of direct costs and nonrefundable loan fees associated with lending. The net amount of nonrefundable loan origination fees and direct costs associated with the lending process, including commitment fees, is deferred and accreted to interest income over the lives of the loans using a method that approximates the interest method. Interest on LHFI is accrued and recorded as interest income based on the outstanding principal balance.
Past due LHFI are loans contractually past due
Purchased Credit Deteriorated (PCD) Loans
Purchased loans which have experienced more than insignificant credit deterioration since origination are considered PCD loans. An initial ACL for PCD loans is determined at acquisition using the same ACL methodology as the LHFI. The initial ACL determined on a collective basis is allocated to individual loans. PCD loans are reported at the amortized cost, which equals the loan purchased price plus the initial ACL. The difference between the amortized cost basis of the PCD loan and the par value of the loan is the noncredit premium or discount, which is amortized into interest income over the life of the loan. Subsequent changes to the ACL are recorded through the PCL, LHFI.
77
Upon adoption of FASB ASC Topic 326, Trustmark elected to maintain pools of loans that were previously accounted for under FASB ASC Subtopic 310-30, “Receivables-Loans and Debt Securities Acquired with Deteriorated Credit Quality,” and will continue to account for these pools as a unit of account. Loans are only removed from the existing loan pools if they are written off, paid off or sold. Upon adoption of FASB ASC Topic 326, the ACL was determined for each pool and added to the pool’s carrying value to establish a new amortized cost basis. The difference between the unpaid principal balance of the pool and the new amortized cost basis is the noncredit premium or discount which will be amortized into interest income over the remaining life of the pool. Changes to the ACL after adoption of FASB ASC Topic 326 are recorded through the PCL, LHFI.
ACL
LHFI
Trustmark’s ACL methodology for LHFI is based upon guidance within FASB ASC Subtopic 326-20 as well as applicable regulatory guidance. The ACL on LHFI is a valuation account that is deducted from the loans’ amortized cost basis to present the net amount expected to be collected on the loans. Credit quality within the LHFI portfolio is continuously monitored by Management and is reflected within the ACL on LHFI. The ACL on LHFI is an estimate of expected losses inherent within Trustmark’s existing LHFI portfolio. The ACL on LHFI is adjusted through the PCL, LHFI and reduced by the charge off of loan amounts, net of recoveries.
The loan loss estimation process involves procedures to appropriately consider the unique characteristics of Trustmark’s LHFI portfolio segments. These segments are further disaggregated into loan classes, the level at which credit risk is estimated. When computing allowance levels, credit loss assumptions are estimated using a model that categorizes loan pools based on loss history, delinquency status and other credit trends and risk characteristics, including current conditions and reasonable and supportable forecasts about the future. Evaluations of the portfolio and individual credits are inherently subjective, as they require estimates, assumptions and judgments as to the facts and circumstances of particular situations. Determining the appropriateness of the allowance is complex and requires judgment by Management about the effect of matters that are inherently uncertain. In future periods, evaluations of the overall LHFI portfolio, in light of the factors and forecasts then prevailing, may result in significant changes in the allowance and credit loss expense.
Trustmark estimates the ACL on LHFI using relevant available information, from internal and external sources, relating to past events, current conditions and reasonable and supportable forecasts. Trustmark uses a third-party software application to calculate the quantitative portion of the ACL on LHFI using a methodology and assumptions specific to each loan pool. The qualitative portion of the allowance is based on general economic conditions and other internal and external factors affecting Trustmark as a whole as well as specific LHFI. Factors considered include the following: lending policies and procedures, economic conditions and concentrations of credit, nature and volume of the portfolio, performance trends, and external factors. The quantitative and qualitative portions of the allowance are added together to determine the total ACL on LHFI, which reflects Management’s expectations of future conditions based on reasonable and supportable forecasts.
The methodology for estimating the amount of expected credit losses reported in the ACL on LHFI has two basic components: a collective, or pooled, component for estimated expected credit losses for pools of loans that share similar risk characteristics, and an asset-specific component involving individual loans that do not share risk characteristics with other loans and the measurement of expected credit losses for such individual loans. In estimating the ACL for the collective component, loans are segregated into loan pools based on loan product types and similar risk characteristics.
Trustmark determined that reasonable and supportable forecasts could be made for a twelve-month period for all of its loan pools. To the extent the lives of the loans in the LHFI portfolio extend beyond this forecast period, Trustmark uses a reversion period of four quarters and reverts to the historical mean on a straight-line basis over the remaining life of the loans.
The ACL for individual loans that do not share risk characteristics with other loans is measured as the difference between the discounted value of expected future cash flows, based on the effective interest rate at origination, and the amortized cost basis of the loan, or the net realizable value. The ACL is the difference between the loan’s net realizable value and its amortized cost basis (net of previous charge-offs and deferred loan fees and costs), except for collateral-dependent loans. A loan is collateral dependent when the borrower is experiencing financial difficulty and repayment of the loan is expected to be provided substantially through the sale of the collateral. The expected credit loss for collateral-dependent loans is measured as the difference between the amortized cost basis of the loan and the fair value of the collateral, adjusted for the estimated cost to sell. Fair value estimates for collateral-dependent loans are derived from appraised values based on the current market value or the ‘as is’ value of the collateral, normally from recently received and reviewed appraisals. Current appraisals are ordered on an annual basis based on the inspection date or more often if market conditions necessitate. Appraisals are obtained from state-certified appraisers and are based on certain assumptions, which may include construction or development status and the highest and best use of the property. These appraisals are reviewed by Trustmark’s Appraisal Review Department to ensure they are acceptable, and values are adjusted down for costs associated with asset disposal. If the calculated expected credit loss is determined to be permanent or not recoverable, the amount of the expected credit loss is charged off.
78
Accrued interest receivable is not included in the amortized cost basis of Trustmark’s LHFI and, therefore, excluded from the estimate of credit losses for LHFI.
LHFI are charged off against the ACL on LHFI, with any subsequent recoveries credited back to the ACL on LHFI account. Recoveries may not exceed the aggregate of amounts previously charged off. Trustmark’s Loan Policy Manual dictates the guidelines to be followed in determining when a loan is charged off. Commercial purpose LHFI are charged off when a determination is made that the loan is uncollectible and continuance as a bankable asset is not warranted. Consumer LHFI secured by 1-4 family residential real estate are generally charged off or written down to the fair value of the collateral less cost to sell at no later than
ACL on Off-Balance Sheet Credit Exposures
Under FASB ASC Subtopic 326-20, Trustmark is required to estimate expected credit losses for off-balance sheet credit exposures which are not unconditionally cancellable. Trustmark maintains a separate ACL on off-balance sheet credit exposures, including unfunded loan commitments and letters of credit.
Expected credit losses for off-balance sheet credit exposures are estimated by calculating a commitment usage factor over the contractual period for exposures that are not unconditionally cancellable by Trustmark. Trustmark calculates a loan pool level unfunded amount for the period. Trustmark views the loan pools as either closed-ended or open-ended. Closed-ended loan pools are those that typically fund up to 100% such as other construction and nonowner-occupied. Open-ended loan pools are those that behave similar to a revolver such as the commercial and industrial and home equity line of credit loan pools. In addition to the unfunded balances, Trustmark uses a funding rate for loan pools that are considered open-ended. Trustmark calculates the funding rate of the open-ended loan pools each period. In order to mitigate volatility and incorporate historical experience in the funding rate, Trustmark uses a twelve-quarter moving average. For the closed-ended loan pools, Trustmark takes a conservative approach and uses a 100% funding rate. The expected funding rate is applied to each pool’s unfunded commitment balances to ensure that reserves will be applied to each pool based on balances expected to be funded based upon historical levels. In addition to the funding rate being applied to the unfunded commitment balance, a reserve rate is applied that incorporates both quantitative and qualitative aspects of the current period’s expected credit loss rate. The reserve rate is loan pool specific and is applied to the unfunded amount to ensure loss factors, both quantitative and qualitative, are being considered on the unfunded portion of the loan pool, consistent with the methodology applied to the funded loan pools. Adjustments to the ACL on off-balance sheet credit exposures are recorded to the PCL, off-balance sheet credit exposures.
No credit loss estimate is reported for off-balance sheet credit exposures that are unconditionally cancellable by Trustmark or for undrawn amounts under such arrangements that may be drawn prior to the cancellation of the arrangement.
Premises and Equipment, Net
Premises and equipment are reported at cost, less accumulated depreciation and amortization. Depreciation is charged to expense over the estimated useful lives of the assets, which are up to
Branch closures and purchased land held for future branch expansion for more than five years are evaluated to determine if the related land, buildings and building improvements should be transferred to assets held for sale in accordance with FASB ASC Topic 360, “Property, Plant and Equipment.” The property is transferred to assets held for sale at the lower of its carrying value or fair value less cost to sell. An impairment loss is recorded at the time of transfer if the carrying value of the assets exceeds the fair value. Impairment losses are recorded as noninterest expense in other expense.
Mortgage Servicing Rights (MSR)
Trustmark recognizes as assets the rights to service mortgage loans based on the estimated fair value of the MSR when loans are sold and the associated servicing rights are retained. Trustmark has elected to account for the MSR at fair value.
The fair value of the MSR is determined using a valuation model administered by a third party that calculates the present value of estimated future net servicing income. Estimates of fair value involve several assumptions, including the key valuation assumptions
79
about market expectations of future prepayment rates, interest rates and discount rates which are provided by a third-party firm. Prepayment rates are projected using an industry standard prepayment model. The model considers other key factors, such as a wide range of standard industry assumptions tied to specific portfolio characteristics such as remittance cycles, escrow payment requirements, geographic factors, foreclosure loss exposure, VA no-bid exposure, delinquency rates and cost of servicing, including base cost and cost to service delinquent mortgages. Prevailing market conditions at the time of analysis are factored into the accumulation of assumptions and determination of servicing value.
Trustmark economically hedges changes in the fair value of the MSR attributable to interest rates. See the section titled “Derivative Financial Instruments – Derivatives Not Designated as Hedging Instruments” of this note for information regarding these derivative instruments.
Trustmark receives annual servicing fee income for loans serviced, which is recorded as noninterest income in mortgage banking, net. The fees are based on a contractual percentage of the outstanding principal or a fixed amount per loan and are recorded as income when earned. Late fees and ancillary fees related to loan servicing are not considered material.
Goodwill and Identifiable Intangible Assets
Trustmark accounts for goodwill and other intangible assets in accordance with FASB ASC Topic 350, “Intangibles – Goodwill and Other.” Goodwill, which represents the excess of cost over the fair value of the net assets of an acquired business, is not amortized but tested for impairment on an annual basis, which is October 1 for Trustmark, or more often if events or circumstances indicate that there may be impairment.
Identifiable intangible assets are acquired assets that lack physical substance but can be distinguished from goodwill because of contractual or legal rights or because the assets are capable of being sold or exchanged either on their own or in combination with a related contract, asset or liability. Trustmark’s identifiable intangible assets primarily relate to core deposits, insurance customer relationships and borrower relationships. These intangibles, which have definite useful lives, are amortized on an accelerated basis over their estimated useful lives. In addition, these intangibles are evaluated for impairment whenever events and changes in circumstances indicate that the carrying amount should be reevaluated. Trustmark also purchased banking charters in order to facilitate its entry into the states of Florida and Texas. These identifiable intangible assets are being amortized on a straight-line method over
Other Real Estate
Other real estate includes assets that have been acquired in satisfaction of debt through foreclosure and is recorded at the fair value less cost to sell (estimated fair value) at the time of foreclosure. Fair value is based on independent appraisals and other relevant factors. When foreclosed real estate is received in full satisfaction of a loan, the amount, if any, by which the recorded amount of the loan exceeds the estimated fair value of the property is a loss charged against the ACL at the time of foreclosure. If the recorded amount of the loan is less than the estimated fair value of the property, a credit is recorded to write-downs of other real estate at the time of foreclosure.
Other real estate is revalued on an annual basis or more often if market conditions necessitate. An other real estate specific reserve may be recorded through other real estate expense for declines in fair value subsequent to foreclosure based on recent appraisals or changes in market conditions. Subsequent to foreclosure, losses on the periodic revaluation of the property are charged against an existing other real estate specific reserve or as noninterest expense in other real estate expense if a reserve does not exist. Costs of operating and maintaining the properties as well as gains or losses on their disposition are also included in other real estate expense as incurred. Improvements made to properties are capitalized if the expenditures are expected to be recovered upon the sale of the properties.
Leases
Lessor Arrangements
Trustmark leases certain types of machinery and equipment to its commercial customers through sales-type and direct financing leases as part of its equipment financing portfolio. Sales-type and direct financing leases are similar to other forms of installment lending in that lessors generally do not retain benefits and risks incidental to ownership of the property subject to the leases. Such arrangements are essentially financing transactions that permit lessees to acquire and use property. Trustmark does not have any significant operating leases in which it is the lessor.
As lessor, the sum of all minimum lease payments over the lease term and the estimated residual value, less unearned interest income, is recorded as the net investment in the lease on the commencement date and is included in LHFI on the consolidated balance sheets. Interest income is accrued as earned over the term of the lease based on the net investment in the leases and is recognized in
80
interest and fees on LHFS and LHFI on the consolidated statements of income. Certain fees or costs associated with lease originations are deferred and accreted or amortized to interest income over the life of the lease using the effective interest method.
Trustmark’s portfolio of sales-type and direct financing leases generally have remaining lease terms of three to ten years, some of which include renewal options and/or options for the lessee to purchase the leased property near or at the end of the lease term at either the residual value or a specified price. Trustmark expects to sell or release the equipment at the end of the lease term. Due to the structure of these leases, there is no selling profit or loss on these transactions.
Lessee Arrangements
Trustmark has certain contracts that it has identified as leases according to FASB ASC Topic 842, "Leases". Trustmark classifies these leases as either operating or finance leases and recognizes a right-of-use asset and a lease liability at the lease commencement date. The lease liability represents the present value of the lease payments that remain unpaid as of the commencement date and the right-of-use asset is the initial lease liability recognized for the lease plus any lease payments made to the lessor at or before the commencement date as well as any initial direct costs less any lease incentives received. Trustmark accounts for the lease and nonlease components separately as such amounts are readily determinable.
Trustmark’s finance leases consist of building and equipment leases. Trustmark recognizes interest expense based on the discount rate of the lease as interest expense in other interest expense and recognizes depreciation expense on a straight-line basis over the lease term as noninterest expense in net occupancy – premises for building leases and in equipment expense for equipment leases. Trustmark amortizes the right-of-use asset over the life of the lease term on a straight-line basis. Trustmark’s lease liabilities are measured as the present value of the remaining lease payments throughout the lease term. Trustmark records its finance lease right-of-use assets in premises and equipment, net and its finance lease liabilities in other borrowings.
Trustmark’s operating leases primarily consist of building and land leases. Trustmark recognizes lease rent expense on a straight-line basis over the term of the lease contract and records it as noninterest expense in net occupancy – premises for building and land leases and in equipment expense for equipment leases. Trustmark’s amortization of the right-of-use asset is the difference between the straight-line lease expense and the interest expense recognized on the lease liability during the period. Trustmark’s lease liabilities are measured as the present value of the remaining lease payments throughout the lease term.
Trustmark’s leases typically have one or more renewal options included in the lease contract. Due to the nature of Trustmark’s leases, for leases with renewal options available, Trustmark considers the first renewal option as reasonably certain to renew and is therefore included in the measurement of the right-of-use assets and lease liabilities.
In order to calculate its right-of-use assets and lease liabilities, FASB ASC Topic 842 requires Trustmark to use the rate of interest implicit in the lease when readily determinable. If the rate implicit in the lease is not readily determinable, Trustmark is required to use its incremental borrowing rate, which is the rate of interest Trustmark would have to pay to borrow on a collateralized basis over a similar term in a similar economic environment. Trustmark was able to determine the implicit interest rate for its equipment leases and used that rate as its discount rate. Since the implicit interest rate for most of its building and land leases were not readily determinable, Trustmark used its incremental borrowing rate.
Trustmark made an accounting policy election to not recognize short-term leases (12 months or less) on the balance sheet. Trustmark’s short-term leases primarily include automated teller machines. For short-term leases, Trustmark recognizes lease expense on a straight-line basis over the lease term.
Federal Home Loan Bank (FHLB) and Federal Reserve Bank of Atlanta Stock
Trustmark accounts for its investments in FHLB and Federal Reserve Bank of Atlanta stock in accordance with FASB ASC Subtopic 942-325, “Financial Services-Depository and Lending-Investments-Other.” FHLB and Federal Reserve Bank stock are equity securities that do not have a readily determinable fair value because its ownership is restricted and it lacks a market. FHLB and Federal Reserve Bank stock are carried at cost and evaluated for impairment. Trustmark’s investment in member bank stock is included in other assets in the accompanying consolidated balance sheets. At December 31, 2023 and 2022, Trustmark’s investment in member bank stock totaled $
Revenue from Contracts with Customers
Trustmark accounts for revenue from contracts with customers in accordance with FASB ASC Topic 606, “Revenue from Contracts with Customers,” which provides that revenue be recognized in a manner that depicts the transfer of goods or services to a customer in
81
an amount that reflects the consideration Trustmark expects to be entitled to in exchange for those goods or services. Revenue from contracts with customers is recognized either over time in a manner that depicts Trustmark’s performance, or at a point in time when control of the goods or services are transferred to the customer. Trustmark’s noninterest income, excluding all of mortgage banking, net and securities gains (losses), net and portions of bank card and other fees and other income, are considered within the scope of FASB ASC Topic 606. Gains or losses on the sale of other real estate, which are included in Trustmark’s noninterest expense as other real estate expense, are also within the scope of FASB ASC Topic 606.
General Banking Segment
Service Charges on Deposit Accounts
In general, deposit accounts represent contracts with customers with no fixed duration and can be terminated or modified by either party at any time without compensation to the other party. According to FASB ASC Topic 606, a contract that can be terminated by either party without compensation does not exist for periods beyond the then-current period. Therefore, deposit contracts are considered to renew day-to-day if not minute-to-minute.
Deposit contracts have a single continuous or stand-ready service obligation whereby Trustmark makes customer funds available for use by the customer as and when the customer chooses as well as other services such as statement rendering and online banking. The specific services provided vary based on the type of deposit account. These services are not individually distinct, but are distinct as a group, and therefore, constitute a single performance obligation which is satisfied over time and qualifies as a series of distinct service periods.
Trustmark receives a fixed service charge amount as consideration monthly for services rendered. The service charge amount varies based on the type of deposit account. Some of the service charge revenue is subject to refund provisions, which is variable consideration under the guidelines of FASB ASC Topic 606. Trustmark has elected the ‘as-invoiced’ practical expedient permitted under FASB ASC Topic 606 for recognition of service charge revenue. Therefore, revenue is recognized at the time and in the amount the customer is charged. The service charge revenue is presented net of refunded amounts on Trustmark’s consolidated statements of income.
Services related to non-sufficient funds, overdrafts, excess account activity, stop payments, dormant accounts, etc. are considered optional purchases for a deposit contract because there is no performance obligation for Trustmark until the service is requested by the customer or the occurrence of a triggering event. Fees for these services are fixed amounts and are charged to the customer when the service is performed. Revenue is recognized at the time the customer is charged.
Bank Card and Other Fees
Revenue from contracts with customers in bank card and other fees includes income related to interchange fees and various other contracts which primarily consists of contracts with a single performance obligation that is satisfied at a point in time. Trustmark receives a fixed consideration amount once the performance obligation is completed for these contracts. Trustmark reports revenue from these contracts net of amounts refunded or due to a third party.
As both a debit and credit card issuer, Trustmark receives an interchange fee for every card transaction completed by its customers with a merchant. Trustmark receives
Trustmark, as the card issuing or settlement bank, has a contract (implied based on customary business practices) with the payment network in which Trustmark has a single continuous service obligation to make funds available for settlement of the card transaction. Trustmark’s service obligation is satisfied over time and qualifies as a series of distinct service periods. Trustmark receives interchange fees as consideration for services rendered in the amount established by the respective payment network. The interchange fees are established by the payment network based on the type of transaction and is posted on their website. Trustmark receives and records interchange fee revenue from the payment networks daily net of all fees and amounts due to the payment network.
Other Income
Revenue from contracts with customers in other income includes income related to cash management services and other contracts with a single performance obligation that is satisfied at a point in time. Trustmark receives a fixed consideration amount once the performance obligation is completed for these contracts. Trustmark reports revenue from these contracts net of amounts refunded or due to a third party.
82
Trustmark provides cash management services through the delivery of various products and services offered to its business and municipal customers including various departments of state, city and local governments, universities and other non-profit entities. Similar to the deposit account contracts, the cash management contracts primarily represent contracts with customers with no fixed duration and can be terminated or modified by either party at any time without compensation to the other party. Therefore, cash management contracts are generally considered to renew day-to-day if not minute-to-minute.
Cash management contracts have a single continuous or stand-ready service obligation whereby Trustmark makes a specific service or group of services available for use by the customer as and when the customer chooses. The specific services provided vary based on the type of account or product. These services are not individually distinct, but are distinct as a group, and therefore, constitute a single performance obligation which is satisfied over time and qualifies as a series of distinct service periods.
Trustmark receives a set service charge or maintenance fee amount as consideration monthly for services rendered. However, some of the fees are based on the number of transactions that occur (i.e., flat fee for a set number of transactions per month then an additional charge for each transaction after that) or the average daily account balance maintained by the customer during the month and a small amount of the cash management fee revenue is subject to refund provisions. These fees represent variable consideration under the guidelines of FASB ASC Topic 606. Trustmark has elected the ‘as-invoiced’ practical expedient permitted under FASB ASC Topic 606 for recognition of cash management fee revenue. The cash management revenue is presented net of any refunded amounts on Trustmark’s consolidated statements of income.
Trustmark’s merchant services provider contracts directly with Trustmark business customers and provides Trustmark’s merchant customers card processing equipment and transaction processing services. Trustmark’s contract with the merchant services provider has a single-continuous service obligation to provide customer referrals for potential new accounts which is satisfied over time and qualifies as a series of distinct service periods. Trustmark receives a flat fee for each new account established and a percentage of the residual income related to transactions processed for Trustmark’s merchant customers each month as provided in the contract. Under the guidelines of FASB ASC Topic 606, the fee received for each new account and the profit sharing represent variable consideration. Revenue from merchant card services contracts is recognized monthly using a time-elapsed measure of progress. Trustmark has elected the ‘as-invoiced’ practical expedient permitted under FASB ASC Topic 606 for recognition of the merchant card services revenue.
Other Real Estate
Trustmark records a gain or loss from the sale of other real estate when control of the property transfers to the buyer. Trustmark records the gain or loss from the sale of other real estate in noninterest expense as other expense. Other real estate sales for the year ended December 31, 2023 resulted in a net loss of $
In general, purchases of Trustmark’s other real estate property are not financed by Trustmark. Financing the purchase of other real estate is evaluated based upon the same lending policies and procedures as all other types of loans. Under FASB ASC Subtopic 610-20, “Other Income – Gains and Losses from the Derecognition of Nonfinancial Assets,” when Trustmark finances the sale of its other real estate to a buyer, Trustmark is required to assess whether the buyer is committed to perform their obligations under the contract and whether collectability of the transaction price is probable. Once these two criteria are met, Trustmark derecognizes the other real estate asset and records a gain or loss on the sale once control of the property is transferred to the buyer.
Wealth Management Segment
Trust Management
There are
Assets under administration held by Trustmark in a fiduciary or agency capacity for customers are not included in Trustmark’s consolidated balance sheets.
83
Investment Services
Investment services includes both brokerage and annuity income. Trustmark has a contract with a third-party investment services company which contains a single continuous service obligation, to provide broker-dealer and advisory services to customers on behalf of the third-party, which is satisfied over time and qualifies as a series of distinct service periods. Trustmark serves as the agent between the third-party investment services company, the principle, and the customer. In accordance with the contract, Trustmark receives a monthly payment from the investment services company for commissions and advisory fees (asset management fees) earned on transactions completed in the prior month net of all charges and fees due to the investment services company. Trustmark recognizes revenue from the investment services company, net of the revenue sharing expense due to the investment services company, when the payments are received. Commissions vary from month-to-month based on the specific products and transactions completed. The advisory fees vary based on the average daily balance of the managed assets for the period. The commissions and advisory fees represent variable consideration under FASB ASC Topic 606. Trustmark has elected the ‘as-invoiced’ practical expedient allowed under FASB ASC Topic 606 to recognize revenue from the investment services company.
Insurance Segment
Fisher Brown Bottrell Insurance, Inc. (FBBI), a wholly-owned subsidiary of Trustmark National Bank (TNB), operates as an insurance broker representing the policyholder and has no allegiance with any one insurance provider. FBBI serves as the agent between the insurance provider (either insurance carrier or broker), the principal, and the policy holder, the customer. FBBI has
In addition to policy placement, FBBI provides various other periodic services to the policyholders for which no additional fee is charged. These additional services are not considered material to the overall contract. Trustmark has elected the immaterial promises practical expedient allowed under FASB ASC Topic 606, which allows Trustmark to not assess whether promised services are performance obligations if the promised services are immaterial in the context of the contract. Therefore, the immaterial additional services offered to policyholders are not considered a performance obligation and no amount of the contract transaction price is allocated to these services.
In general, the transaction price for the insurance contracts is an established commission amount agreed upon by FBBI and the insurance provider. The commission amount varies based on the insurance provider and the type of policy. There are a small number of insurance contracts which FBBI does not receive a commission but charges a fee directly to the policyholder.
Most of the commissions from insurance contracts are subject to clawback provisions which require FBBI to refund a prorated amount of the commissions received as a result of policy cancellations or lapses. Commissions subject to clawback provisions are considered variable consideration under FASB ASC Topic 606. Trustmark believes the expected value method of estimating the commissions subject to clawback provisions would best predict the amount of commissions FBBI will be entitled to because of the large number of insurance contracts with similar characteristics and the number of possible outcomes. FBBI calculates a separate weighted-average percentage (returned commissions percentage) based on actual cancellations over the previous three years for commercial lines, bonds, and personal lines. FBBI applies the respective returned commissions percentage to the commission revenue earned related to insurance contracts within these three lines each month to calculate the estimated returned commissions amount, which represents the variable consideration subject to variable constraint. Revenue from insurance contracts is reported net of the variable consideration subject to variable constraint. FBBI performs an analysis of the returned commissions reserve quarterly and adjusts the reserve balance based on all available information including actual cancellations and the remaining term of the contract. The returned commission percentage is updated annually.
Insurance Producers at FBBI earn commission as compensation for each policy they are responsible for placing. FBBI utilizes a ‘pay when paid’ system. Under the ‘pay when paid’ system, Producers receive the commissions for which they are entitled at the end of the month following the month in which FBBI receives payment from the insurance provider or customer. Under FASB ASC Subtopic 340-40, “Other Assets and Deferred Costs: Contracts with Customers,” the commission paid to the Producers is an incremental cost of obtaining a contract, which should be capitalized and amortized in a manner consistent with the pattern of transfer of the service related to the contract acquisition asset. Insurance contracts have a term of
84
Commercial Insurance
Revenue from FBBI’s commercial insurance contracts (both agency billed and direct billed) consists of a set commission amount, which is subject to clawback provisions. Revenue from commercial installment insurance contracts consists of a set commission amount, which is not subject to clawback provisions. An estimated commission amount is entered in the agency management system when a commercial insurance contract is placed. FBBI records a top line receivable based on the estimated commission amount entered in the system each month, along with a corresponding amount recognized as revenue, and then adjusts the estimated receivable when the commissions are received from the insurance provider or customer.
Personal Insurance
Revenue from FBBI’s personal insurance contracts consists of a set commission amount, which is subject to clawback provisions, and is recognized when payment is received (generally
Employee Benefits Insurance
Revenue from FBBI’s employee benefits insurance contracts consists of a variable commission amount, which is not subject to clawback provisions, and is recognized when payment is received, typically on a monthly basis. Employee benefits insurance contracts have a set commission rate, but can vary from period to period based on changes in the number of employees covered by the policy (i.e., new hires and terminations). FBBI generally receives twelve monthly commission payments for these contracts with the initial payment being received approximately
Contingency Commission Insurance
In addition to the insurance contracts discussed above, FBBI has contracts with various insurance providers for which it receives contingency income based on volume of business and claims experience. FBBI is the principal and the insurance provider is the customer for these contingency commission insurance contracts. The contingency commission contracts have a single continuous or stand-ready service obligation whereby FBBI places policies with policyholders when acceptable to the insurance provider, which is satisfied over time. The contract term for these contingency commission contracts is
Under the guidelines of FASB ASC Topic 606, revenue from contingency commission insurance contracts represents variable consideration and should be estimated using one of the two allowable methods subject to the variable consideration constraint. FBBI believes the most likely amount method to be the most appropriate method for estimating the variable consideration as there are only a few possible outcomes for each contract.
Derivative Financial Instruments
Trustmark maintains an overall interest rate risk management strategy that incorporates the use of derivative instruments to minimize significant unplanned fluctuations in earnings and cash flows caused by interest rate volatility. Trustmark’s interest rate risk management strategy involves modifying the repricing characteristics of certain assets and liabilities so that changes in interest rates do not adversely affect the net interest margin and cash flows. Under the guidelines of FASB ASC Topic 815, “Derivatives and Hedging,” all derivative instruments are required to be recognized as either assets or liabilities and carried at fair value on the balance sheet. The fair value of derivative positions outstanding is included in other assets and/or other liabilities in the accompanying consolidated balance sheets and in the net change in these financial statement line items in the accompanying consolidated statements of cash flows as well as included in noninterest income in the accompanying consolidated statements of income and other comprehensive income (loss), net
85
of tax in the accompanying consolidated statements of comprehensive income. Trustmark’s interest rate derivative instruments are subject to master netting agreements, and therefore, eligible for offsetting in the consolidated balance sheets. Trustmark has elected to not offset any derivative instruments in its consolidated balance sheets.
Derivatives Designated as Hedging Instruments
FASB ASC Topic 815, Derivatives and Hedging (ASC 815), provides the disclosure requirements for derivatives and hedging activities with the intent to provide users of financial statements with an enhanced understanding of: (a) how and why an entity uses derivative instruments, (b) how the entity accounts for derivative instruments and related hedged items, and (c) how derivative instruments and related hedged items affect an entity’s financial position, financial performance, and cash flows. Further, qualitative disclosures are required that explain the objectives and strategies for using derivatives, as well as quantitative disclosures about the fair value of and gains and losses on derivative instruments, and disclosures about credit-risk-related contingent features in derivative instruments.
Derivatives designated and qualifying as a hedge of the exposure to changes in the fair value of an asset, liability, or firm commitment attributable to a particular risk, such as interest rate risk, are considered fair value hedges. Derivatives designated and qualifying as a hedge of the exposure to variability in expected future cash flows, or other types of forecasted transactions, are considered cash flow hedges. Hedge accounting generally provides for the matching of the timing of gain or loss recognition on the hedging instrument with the recognition of the changes in the fair value of the hedged asset or liability that are attributable to the hedged risk in a fair value hedge or the earnings effect of the hedged forecasted transactions in a cash flow hedge.
When entering into a hedge transaction, Trustmark formally documents the relationship between the hedging instrument and the hedged item, as well as the risk management objective and strategy for undertaking the hedge transaction, which includes designating the derivative instrument as a fair value or cash flow hedge to a specific asset or liability on the balance sheet or to specific forecasted transactions and the risk being hedged, along with a formal assessment at the inception of the hedge as to the effectiveness of the derivative instrument in offsetting changes in fair values or cash flows of the hedged item. Trustmark continues to assess hedge effectiveness on an ongoing basis using either a qualitative or a quantitative assessment (regression analysis).
As required by ASC 815, Trustmark records all derivatives on the balance sheet at fair value. The accounting for changes in the fair value of derivatives depends on the intended use of the derivative, whether Trustmark has elected to designate a derivative in a hedging relationship and apply hedge accounting and whether the hedging relationship has satisfied the criteria necessary to apply hedge accounting. For cash flow hedges, changes in the fair value of the derivative instrument are recorded in accumulated other comprehensive income (loss) and subsequently reclassified to net income in the same period that the hedged transaction impacts net income. Upon discontinuation of hedge accounting for cash flow hedges, any amounts in accumulated other comprehensive income (loss) related to that relationship affects earnings at the same time and in the same manner in which the hedged transaction affects earnings. If it becomes probable that the forecasted transaction will not occur, any related amounts in accumulated other comprehensive income (loss) are reclassified to earnings immediately.
Derivatives Not Designated as Hedging Instruments
As part of Trustmark’s risk management strategy in the mortgage banking area, derivative instruments such as forward sales contracts are utilized. Trustmark’s obligations under forward contracts consist of commitments to deliver mortgage loans, originated and/or purchased, in the secondary market at a future date. Changes in the fair value of these derivative instruments are recorded as noninterest income in mortgage banking, net and are offset by changes in the fair value of LHFS. See Note 1 – Significant Accounting Policies, “Loans Held for Sale (LHFS)” for information regarding the fair value option election.
Trustmark also utilizes derivative instruments such as interest rate lock commitments in its mortgage banking area. Rate lock commitments are residential mortgage loan commitments with customers, which guarantee a specified interest rate for a specified time period. Changes in the fair value of these derivative instruments are recorded as noninterest income in mortgage banking, net and are offset by the changes in the fair value of forward sales contracts.
Trustmark utilizes a portfolio of exchange-traded derivative instruments, such as Treasury note futures contracts and option contracts, to achieve a fair value return that economically hedges changes in the fair value of the MSR attributable to interest rates. These transactions are considered freestanding derivatives that do not otherwise qualify for hedge accounting. These exchange-traded derivative instruments are accounted for at fair value with changes in the fair value recorded as noninterest income in mortgage banking, net and are offset by changes in the fair value of the MSR. The MSR fair value represents the present value of future cash flows, which among other things includes decay and the effect of changes in interest rates. Ineffectiveness of hedging the MSR fair value is measured by comparing the change in the fair value of the hedge instruments to the change in the fair value of the MSR asset attributable to changes in interest rates and other market driven changes in valuation inputs and assumptions.
86
Trustmark offers certain derivatives products directly to qualified commercial lending clients seeking to manage their interest rate risk. Trustmark economically hedges interest rate swap transactions executed with commercial lending clients by entering into offsetting interest rate swap transactions with institutional derivatives market participants. Derivative transactions executed as part of this program are not designated as qualifying hedging relationships and are, therefore, carried at fair value with the change in fair value recorded as noninterest income in bank card and other fees. Because these derivatives have mirror-image contractual terms, in addition to collateral provisions which mitigate the impact of non-performance risk, the changes in fair value are expected to substantially offset. The offsetting interest rate swap transactions are either cleared through the Chicago Mercantile Exchange for clearable transactions or booked directly with institutional derivatives market participants for non-clearable transactions. The Chicago Mercantile Exchange rules legally characterize variation margin collateral payments made or received for centrally cleared interest rate swaps as settlements rather than collateral. As a result, centrally cleared interest rate swaps included in other assets and other liabilities are presented on a net basis in the accompanying consolidated balance sheets.
Income Taxes
Trustmark accounts for uncertain tax positions in accordance with FASB ASC Topic 740, “Income Taxes,” which clarifies the accounting and disclosure for uncertainty in tax positions. Under the guidance of FASB ASC Topic 740, Trustmark accounts for deferred income taxes using the liability method. Deferred tax assets and liabilities are based on temporary differences between the financial statement carrying amounts and the tax basis of Trustmark’s assets and liabilities. Deferred tax assets and liabilities are measured using the enacted tax rates expected to apply to taxable income in the years in which those temporary differences are expected to be realized or settled and are presented net in the accompanying consolidated balance sheets in other assets.
Stock-Based Compensation
Trustmark accounts for the stock and incentive compensation under the provisions of FASB ASC Topic 718, “Compensation – Stock Compensation.” Under this accounting guidance, fair value is established as the measurement objective in accounting for stock awards and requires the application of a fair value based measurement method in accounting for compensation cost, which is recognized over the requisite service period. Trustmark has elected to account for forfeitures of stock awards as they occur.
Statements of Cash Flows
For purposes of reporting cash flows, cash and cash equivalents include cash on hand and amounts due from banks. The following table reflects specific transaction amounts for the periods presented ($ in thousands):
|
|
Years Ended December 31, |
|
|||||||||
|
|
2023 |
|
|
2022 |
|
|
2021 |
|
|||
Income taxes paid |
|
$ |
|
|
$ |
|
|
$ |
|
|||
Interest paid on deposits and borrowings |
|
|
|
|
|
|
|
|
|
|||
Noncash transfers from loans to other real estate |
|
|
|
|
|
|
|
|
|
|||
Securities transferred from available for sale to held to maturity |
|
|
|
|
|
|
|
|
|
|||
Investment in tax credit partnership not funded |
|
|
|
|
|
|
|
|
|
|||
Finance right-of-use assets resulting from lease liabilities |
|
|
|
|
|
|
|
|
|
|||
Operating right-of-use assets resulting from lease liabilities |
|
|
|
|
|
|
|
|
|
|||
Per Share Data
Trustmark accounts for per share data in accordance with FASB ASC Topic 260, “Earnings Per Share,” which provides that unvested share-based payment awards that contain non-forfeitable rights to dividends or dividend equivalents (whether paid or unpaid) are participating securities and shall be included in the computation of earnings per share (EPS) pursuant to the two-class method. Trustmark has determined that its outstanding unvested stock awards are not participating securities. Based on this determination, no change has been made to Trustmark’s current computation for basic and diluted EPS.
Basic EPS is computed by dividing net income by the weighted-average shares of common stock outstanding. Diluted EPS is computed by dividing net income by the weighted-average shares of common stock outstanding, adjusted for the effect of potentially dilutive stock awards outstanding during the period.
87
The following table reflects weighted-average shares used to calculate basic and diluted EPS for the periods presented (in thousands):
|
|
Years Ended December 31, |
|
|||||||||
|
|
2023 |
|
|
2022 |
|
|
2021 |
|
|||
Basic shares |
|
|
|
|
|
|
|
|
|
|||
Dilutive shares |
|
|
|
|
|
|
|
|
|
|||
Diluted shares |
|
|
|
|
|
|
|
|
|
|||
Weighted-average antidilutive stock awards were excluded in determining diluted EPS. The following table reflects weighted-average antidilutive stock awards for the periods presented (in thousands):
|
|
Years Ended December 31, |
|
|||||||||
|
|
2023 |
|
|
2022 |
|
|
2021 |
|
|||
Weighted-average antidilutive stock awards |
|
|
|
|
|
|
|
|
|
|||
Fair Value Measurements
FASB ASC Topic 820, “Fair Value Measurements and Disclosures,” defines fair value, establishes a framework for measuring fair value in generally accepted accounting principles, and requires certain disclosures about fair value measurements. The fair value of an asset or liability is the price that would be received to sell that asset or paid to transfer that liability in an orderly transaction occurring in the principal market (or most advantageous market in the absence of a principal market) for such asset or liability. Depending on the nature of the asset or liability, Trustmark uses various valuation techniques and assumptions when estimating fair value. Inputs to valuation techniques include the assumptions that market participants would use in pricing an asset or liability. FASB ASC Topic 820 establishes a fair value hierarchy for valuation inputs that gives the highest priority to quoted prices in active markets for identical assets or liabilities and the lowest priority to unobservable inputs. The fair value hierarchy is as follows:
Level 1 Inputs – Valuation is based upon quoted prices (unadjusted) in active markets for identical assets or liabilities that Trustmark has the ability to access at the measurement date.
Level 2 Inputs – Valuation is based upon quoted prices in active markets for similar assets or liabilities, quoted prices for identical or similar assets or liabilities in markets that are not active, inputs other than quoted prices that are observable for the asset or liability such as interest rates, yield curves, volatilities and default rates and inputs that are derived principally from or corroborated by observable market data.
Level 3 Inputs – Unobservable inputs reflecting the reporting entity’s own determination about the assumptions that market participants would use in pricing the asset or liability based on the best information available.
In instances where the determination of the fair value measurement is based on inputs from different levels of the fair value hierarchy, the level in the fair value hierarchy within which the fair value measurement in its entirety is classified is based on the lowest level input that is significant to the fair value measurement in its entirety. Trustmark’s assessment of the significance of a particular input to the fair value measurement in its entirety requires judgment and considers factors specific to the asset or liability. Transfers between levels of the fair value hierarchy are recognized on the actual date of the event or circumstances that caused the transfer.
Accounting Policies Recently Adopted
Except for the changes detailed below, Trustmark has consistently applied its accounting policies to all periods presented in the accompanying consolidated financial statements.
ASU 2022-02, “Financial Instruments-Credit Losses (Topic 326): Trouble Debt Restructurings and Vintage Disclosures.” Issued in March 2022, ASU 2022-02 seeks to improve the decision usefulness of information provided to investors concerning certain loan refinancings, restructurings and write-offs. In regard to troubled debt restructurings (TDRs) by creditors, investors and preparers observed that the additional designation of a loan modification as a TDR and the related accounting are unnecessarily complex and no longer provide decision-useful information. The amendments of ASU 2022-02 eliminate the accounting guidance for TDRs by creditors in FASB ASC Subtopic 310-40, “Receivables-Troubled Debt Restructurings by Creditors,” as it is no longer meaningful due to the implementation of FASB ASC Topic 326, which requires an entity to consider lifetime expected credit losses on loans when establishing an allowance for credit losses. Therefore, most losses that would have been realized for a TDR under FASB ASC Subtopic 310-40 are now captured by the accounting required under FASB ASC Topic 326. The amendments of ASU 2022-02 also enhanced disclosure requirements for certain loan refinancings and restructurings by creditors when a borrower is experiencing financial difficulty. Stakeholders also noted inconsistency in the requirement for a public business entity (PBE) to disclose gross write-offs and gross recoveries by class of financing receivable and major security type in certain vintage disclosures. Financial statement users expressed that, in addition to the existing vintage disclosures in FASB ASC Topic 326, information about gross write-offs by year of origination
88
would be helpful in understanding credit quality changes in an entity’s loan portfolio and underwriting performance. For PBEs, the amendments of ASU 2022-02 require that an entity disclose current period gross write-offs by year of origination for financing receivables and net investments in leases within the scope of FASB ASC Subtopic 326-20, “Financial Instruments-Credit Losses-Measured at Amortized Cost.” For write-offs associated with origination dates that are more than five annual periods before the reporting period, an entity may present aggregate amounts in the current period for financing receivables and net investment in leases. The amendments of ASU 2022-02 were effective for fiscal years and interim periods within those fiscal years beginning after December 15, 2022 for entities that have already adopted the amendments of ASU 2016-13, such as Trustmark. Trustmark
ASU 2023-07, “Segment Reporting (Topic 280): Improvements to Reportable Segment Disclosures.” Issued in November 2023, ASU 2023-07 is intended to improve disclosures about a public entity’s reportable segments and address requests from investors and other allocators of capital for additional, more detailed information about a reportable segment’s expenses. The amendments of ASU 2023-07 require a public entity to disclose, on an annual and interim basis, significant segment expenses that are regularly provided to the chief operating decision maker (CODM) and included within each reported measure of segment profit or loss, and an amount for other segment items by reportable segment and a description of its composition. The other segment items category is the difference between segment revenue less the significant expenses disclosed and each reported measure of segment profit or loss. ASU 2023-07 also requires a public entity to provide all annual disclosures about a reportable segment’s profit or loss and assets currently required under FASB ASC Topic 280 in interim periods. The amendments of ASU 2023-07 clarify that if the CODM uses more than one measure of a segment's profit or loss in assessing segment performance and deciding how to allocate resources, a public entity may report one or more of those additional measures of segment profit. However, at least one of the reported segment profit or loss measures (or the single reported measure if only one is disclosed) should be the measure that is most consistent with the measurement principles used in measuring the corresponding amounts in the public entity's consolidated financial statements. ASU 2023-07 requires a public entity to disclose the title and position of the CODM, together with an explanation of how the CODM uses the reported measure(s) of segment profit or loss in assessing segment performance and deciding how to allocate resources. In addition, ASU 2023-07 requires that a public entity with a single reportable segment provide all the disclosures required by the amendments of ASU 2023-07 and all existing segment disclosures in FASB ASC Topic 280. The amendments of ASU 2023-07 are effective for fiscal years beginning after December 15, 2023, and for interim periods within fiscal years beginning after December 15, 2024, with early adoption permitted. The amendments in ASU 2023-07 should be applied retrospectively to all periods presented on the financial statements. Upon implementation, the segment expense categories and amounts disclosed in the prior periods should be based on the significant segment expense categories identified and disclosed in the period of adoption. Trustmark has adopted the amendments of ASU 2023-07 related to annual disclosure requirements effective January 1, 2024, and will present any newly required annual disclosures in its Annual Report of Form 10-K for the year ending December 31, 2024. Trustmark intends to adopt the amendments of ASU 2023-07 related to interim disclosure requirements effective January 1, 2025, and will present any newly required interim disclosures beginning with its Quarterly Report on Form 10-Q for the period ending March 31, 2025. Adoption of ASU 2023-07 is not expected to have a material impact to Trustmark’s consolidated financial statements or results of operations.
Pending Accounting Pronouncements
ASU 2023-09, “Income Taxes (Topic 740): Improvements to Income Tax Disclosures.” Issued in December 2023, ASU 2023-09 is intended to improve the disclosures for income taxes to address requests from investors, lenders, creditors and other allocators of capital (collectively, "investors") that use the financial statements to make capital allocation decisions. During the FASB's 2021 agenda consultation process and other stakeholder outreach, investors highlighted that the current system of income tax disclosures does not provide enough information to understand the tax provision for an entity that operates in multiple jurisdictions. Investors currently rely on the rate reconciliation table and other disclosures, including total income taxes paid in the statement of cash flows, to evaluate income tax risks and opportunities. The amendments in ASU 2023-09 will require consistent categories and greater disaggregation of information in the rate reconciliation disclosure as well as disclosure of income taxes paid disaggregated by jurisdiction. The amendments of ASU 2023-09 are effective for annual periods beginning after December 15, 2024, and early adoption is permitted for annual financial statements that have not yet been issued or made available for issuance. Trustmark intends to adopt the amendments of ASU 2023-09 effective January 1, 2025, and will include the required disclosures in its Annual Report on Form 10-K for the year ending December 31, 2025. Trustmark is currently evaluating the changes to disclosures required by ASU 2023-09; however, adoption of ASU 2023-09 is not expected to have a material impact to Trustmark’s consolidated financial statements or results of operations.
Note 2 – Cash and Due from Banks
Trustmark is no longer required to maintain average reserve balances with the Federal Reserve Bank of Atlanta based on a percentage of deposits. Effective March 26, 2020, the Federal Reserve reduced reserve requirement ratios to
89
requirements for all depository institutions, in order to provide liquidity in the banking system to support lending to households and businesses due to the COVID-19 pandemic.
Note 3 – Securities Available for Sale and Held to Maturity
The following tables are a summary of the amortized cost and estimated fair value of securities available for sale and held to maturity at December 31, 2023 and 2022 ($ in thousands):
|
|
Securities Available for Sale |
|
|
Securities Held to Maturity |
|
||||||||||||||||||||||||||
|
|
|
|
|
Gross |
|
|
Gross |
|
|
Estimated |
|
|
|
|
|
Gross |
|
|
Gross |
|
|
Estimated |
|
||||||||
|
|
Amortized |
|
|
Unrealized |
|
|
Unrealized |
|
|
Fair |
|
|
Amortized |
|
|
Unrealized |
|
|
Unrealized |
|
|
Fair |
|
||||||||
December 31, 2023 |
|
Cost |
|
|
Gains |
|
|
Losses |
|
|
Value |
|
|
Cost |
|
|
Gains |
|
|
Losses |
|
|
Value |
|
||||||||
U.S. Treasury securities |
|
$ |
|
|
$ |
|
|
$ |
( |
) |
|
$ |
|
|
$ |
|
|
$ |
|
|
$ |
( |
) |
|
$ |
|
||||||
U.S. Government agency obligations |
|
|
|
|
|
|
|
|
( |
) |
|
|
|
|
|
|
|
|
|
|
|
|
|
|
|
|||||||
Obligations of states and political |
|
|
|
|
|
|
|
|
|
|
|
|
|
|
|
|
|
|
|
|
|
|
|
|
||||||||
Mortgage-backed securities |
|
|
|
|
|
|
|
|
|
|
|
|
|
|
|
|
|
|
|
|
|
|
|
|
||||||||
Residential mortgage pass-through |
|
|
|
|
|
|
|
|
|
|
|
|
|
|
|
|
|
|
|
|
|
|
|
|
||||||||
Guaranteed by GNMA |
|
|
|
|
|
|
|
|
( |
) |
|
|
|
|
|
|
|
|
|
|
|
( |
) |
|
|
|
||||||
Issued by FNMA and FHLMC |
|
|
|
|
|
|
|
|
( |
) |
|
|
|
|
|
|
|
|
|
|
|
( |
) |
|
|
|
||||||
Other residential mortgage-backed |
|
|
|
|
|
|
|
|
|
|
|
|
|
|
|
|
|
|
|
|
|
|
|
|
||||||||
Issued or guaranteed by FNMA, |
|
|
|
|
|
|
|
|
( |
) |
|
|
|
|
|
|
|
|
|
|
|
( |
) |
|
|
|
||||||
Commercial mortgage-backed |
|
|
|
|
|
|
|
|
|
|
|
|
|
|
|
|
|
|
|
|
|
|
|
|
||||||||
Issued or guaranteed by FNMA, |
|
|
|
|
|
|
|
|
( |
) |
|
|
|
|
|
|
|
|
|
|
|
( |
) |
|
|
|
||||||
Total |
|
$ |
|
|
$ |
|
|
$ |
( |
) |
|
$ |
|
|
$ |
|
|
$ |
|
|
$ |
( |
) |
|
$ |
|
||||||
|
|
|
|
|
|
|
|
|
|
|
|
|
|
|
|
|
|
|
|
|
|
|
|
|
||||||||
December 31, 2022 |
|
|
|
|
|
|
|
|
|
|
|
|
|
|
|
|
|
|
|
|
|
|
|
|
||||||||
U.S. Treasury securities |
|
$ |
|
|
$ |
|
|
$ |
( |
) |
|
$ |
|
|
$ |
|
|
$ |
|
|
$ |
( |
) |
|
$ |
|
||||||
U.S. Government agency obligations |
|
|
|
|
|
|
|
|
( |
) |
|
|
|
|
|
|
|
|
|
|
|
|
|
|
|
|||||||
Obligations of states and political |
|
|
|
|
|
|
|
|
( |
) |
|
|
|
|
|
|
|
|
|
|
|
( |
) |
|
|
|
||||||
Mortgage-backed securities |
|
|
|
|
|
|
|
|
|
|
|
|
|
|
|
|
|
|
|
|
|
|
|
|
||||||||
Residential mortgage pass-through |
|
|
|
|
|
|
|
|
|
|
|
|
|
|
|
|
|
|
|
|
|
|
|
|
||||||||
Guaranteed by GNMA |
|
|
|
|
|
|
|
|
( |
) |
|
|
|
|
|
|
|
|
|
|
|
( |
) |
|
|
|
||||||
Issued by FNMA and FHLMC |
|
|
|
|
|
|
|
|
( |
) |
|
|
|
|
|
|
|
|
|
|
|
( |
) |
|
|
|
||||||
Other residential mortgage-backed |
|
|
|
|
|
|
|
|
|
|
|
|
|
|
|
|
|
|
|
|
|
|
|
|
||||||||
Issued or guaranteed by FNMA, |
|
|
|
|
|
|
|
|
( |
) |
|
|
|
|
|
|
|
|
|
|
|
( |
) |
|
|
|
||||||
Commercial mortgage-backed |
|
|
|
|
|
|
|
|
|
|
|
|
|
|
|
|
|
|
|
|
|
|
|
|
||||||||
Issued or guaranteed by FNMA, |
|
|
|
|
|
|
|
|
( |
) |
|
|
|
|
|
|
|
|
|
|
|
( |
) |
|
|
|
||||||
Total |
|
$ |
|
|
$ |
|
|
$ |
( |
) |
|
$ |
|
|
$ |
|
|
$ |
|
|
$ |
( |
) |
|
$ |
|
||||||
During 2022, Trustmark reclassified a total of $
The securities were transferred at fair value, which became the cost basis for the securities held to maturity. The net unrealized holding loss will be amortized over the remaining life of the securities as a yield adjustment in a manner consistent with the amortization or accretion of the original purchase premium or discount on the associated security. There were no gains or losses recognized as a result of these transfers. At December 31, 2023, the net unamortized, unrealized loss on transferred securities included in accumulated other comprehensive income (loss) in the accompanying balance sheet totaled $
ACL on Securities
Securities Available for Sale
Quarterly, Trustmark evaluates if any security has a fair value less than its amortized cost. Once these securities are identified, in order to determine whether a decline in fair value resulted from a credit loss or other factors, Trustmark performs further analysis. If Trustmark determines that a credit loss exists, the credit portion of the allowance is measured using a DCF analysis using the effective interest rate as of the security’s purchase date. The amount of credit loss Trustmark records will be limited to the amount by which the amortized
90
cost exceeds the fair value. The DCF analysis utilizes contractual maturities, as well as third-party credit ratings and cumulative default rates published annually by Moody’s.
At both December 31, 2023 and 2022, the results of the loss analysis performed did not identify any securities that warranted DCF analysis and
Accrued interest receivable is excluded from the estimate of credit losses for securities available for sale. At December 31, 2023 and 2022, accrued interest receivable totaled $
Securities Held to Maturity
At December 31, 2023 and 2022, the potential credit loss exposure for Trustmark’s securities held to maturity was $
Accrued interest receivable is excluded from the estimate of credit losses for securities held to maturity. At December 31, 2023 and 2022, accrued interest receivable totaled $
At both December 31, 2023 and 2022, Trustmark had
Trustmark monitors the credit quality of securities held to maturity on a monthly basis through credit ratings.
|
|
December 31, 2023 |
|
|
December 31, 2022 |
|
||
Aaa |
|
$ |
|
|
$ |
|
||
Aa1 to Aa3 |
|
|
|
|
|
|
||
Not Rated (1) |
|
|
|
|
|
|
||
Total |
|
$ |
|
|
$ |
|
||
91
The table below includes securities with gross unrealized losses for which an ACL has not been recorded and segregated by length of impairment at December 31, 2023 and 2022 ($ in thousands):
|
|
Less than 12 Months |
|
|
12 Months or More |
|
|
Total |
|
|||||||||||||||
|
|
|
|
|
Gross |
|
|
|
|
|
Gross |
|
|
|
|
|
Gross |
|
||||||
|
|
Estimated |
|
|
Unrealized |
|
|
Estimated |
|
|
Unrealized |
|
|
Estimated |
|
|
Unrealized |
|
||||||
December 31, 2023 |
|
Fair Value |
|
|
Losses |
|
|
Fair Value |
|
|
Losses |
|
|
Fair Value |
|
|
Losses |
|
||||||
U.S. Treasury securities |
|
$ |
|
|
$ |
( |
) |
|
$ |
|
|
$ |
( |
) |
|
$ |
|
|
$ |
( |
) |
|||
U.S. Government agency obligations |
|
|
|
|
|
|
|
|
|
|
|
( |
) |
|
|
|
|
|
( |
) |
||||
Mortgage-backed securities |
|
|
|
|
|
|
|
|
|
|
|
|
|
|
|
|
|
|
||||||
Residential mortgage pass-through |
|
|
|
|
|
|
|
|
|
|
|
|
|
|
|
|
|
|
||||||
Guaranteed by GNMA |
|
|
|
|
|
( |
) |
|
|
|
|
|
( |
) |
|
|
|
|
|
( |
) |
|||
Issued by FNMA and FHLMC |
|
|
|
|
|
( |
) |
|
|
|
|
|
( |
) |
|
|
|
|
|
( |
) |
|||
Other residential mortgage-backed |
|
|
|
|
|
|
|
|
|
|
|
|
|
|
|
|
|
|
||||||
Issued or guaranteed by FNMA, |
|
|
|
|
|
|
|
|
|
|
|
( |
) |
|
|
|
|
|
( |
) |
||||
Commercial mortgage-backed |
|
|
|
|
|
|
|
|
|
|
|
|
|
|
|
|
|
|
||||||
Issued or guaranteed by FNMA, |
|
|
|
|
|
( |
) |
|
|
|
|
|
( |
) |
|
|
|
|
|
( |
) |
|||
Total |
|
$ |
|
|
$ |
( |
) |
|
$ |
|
|
$ |
( |
) |
|
$ |
|
|
$ |
( |
) |
|||
|
|
|
|
|
|
|
|
|
|
|
|
|
|
|
|
|
|
|
||||||
December 31, 2022 |
|
|
|
|
|
|
|
|
|
|
|
|
|
|
|
|
|
|
||||||
U.S. Treasury securities |
|
$ |
|
|
$ |
( |
) |
|
$ |
|
|
$ |
( |
) |
|
$ |
|
|
$ |
( |
) |
|||
U.S. Government agency obligations |
|
|
|
|
|
( |
) |
|
|
|
|
|
( |
) |
|
|
|
|
|
( |
) |
|||
Obligations of states and political |
|
|
|
|
|
( |
) |
|
|
|
|
|
( |
) |
|
|
|
|
|
( |
) |
|||
Mortgage-backed securities |
|
|
|
|
|
|
|
|
|
|
|
|
|
|
|
|
|
|
||||||
Residential mortgage pass-through |
|
|
|
|
|
|
|
|
|
|
|
|
|
|
|
|
|
|
||||||
Guaranteed by GNMA |
|
|
|
|
|
( |
) |
|
|
|
|
|
( |
) |
|
|
|
|
|
( |
) |
|||
Issued by FNMA and FHLMC |
|
|
|
|
|
( |
) |
|
|
|
|
|
( |
) |
|
|
|
|
|
( |
) |
|||
Other residential mortgage-backed |
|
|
|
|
|
|
|
|
|
|
|
|
|
|
|
|
|
|
||||||
Issued or guaranteed by FNMA, |
|
|
|
|
|
( |
) |
|
|
|
|
|
( |
) |
|
|
|
|
|
( |
) |
|||
Commercial mortgage-backed |
|
|
|
|
|
|
|
|
|
|
|
|
|
|
|
|
|
|
||||||
Issued or guaranteed by FNMA, |
|
|
|
|
|
( |
) |
|
|
|
|
|
( |
) |
|
|
|
|
|
( |
) |
|||
Total |
|
$ |
|
|
$ |
( |
) |
|
$ |
|
|
$ |
( |
) |
|
$ |
|
|
$ |
( |
) |
|||
The unrealized losses shown above are due to increases in market rates over the yields available at the time of purchase of the underlying securities and not credit quality. Trustmark does not intend to sell these securities and it is more likely than not that Trustmark will not be required to sell the investments before recovery of their amortized cost bases, which may be at maturity.
Securities Gains and Losses
Realized gains and losses are determined using the specific identification method and are included in noninterest income as securities gains (losses), net.
|
|
Years Ended December 31, |
|
|||||||||
Available for Sale |
|
2023 |
|
|
2022 |
|
|
2021 |
|
|||
Proceeds from calls and sales of securities |
|
$ |
|
|
$ |
|
|
$ |
|
|||
Gross realized gains |
|
|
|
|
|
|
|
|
|
|||
Gross realized losses |
|
|
( |
) |
|
|
|
|
|
|
||
92
Securities Pledged
Securities with a carrying value of $
Contractual Maturities
The amortized cost and estimated fair value of securities available for sale and held to maturity at December 31, 2023, by contractual maturity, are shown below ($ in thousands). Expected maturities may differ from contractual maturities because borrowers may have the right to call or prepay obligations with or without call or prepayment penalties.
|
|
Securities |
|
|
Securities |
|
||||||||||
|
|
Available for Sale |
|
|
Held to Maturity |
|
||||||||||
|
|
Amortized |
|
|
Estimated |
|
|
Amortized |
|
|
Estimated |
|
||||
|
|
Cost |
|
|
Fair Value |
|
|
Cost |
|
|
Fair Value |
|
||||
Due in one year or less |
|
$ |
|
|
$ |
|
|
$ |
|
|
$ |
|
||||
Due after one year through five years |
|
|
|
|
|
|
|
|
|
|
|
|
||||
Due after five years through ten years |
|
|
|
|
|
|
|
|
|
|
|
|
||||
Due after ten years |
|
|
|
|
|
|
|
|
|
|
|
|
||||
|
|
|
|
|
|
|
|
|
|
|
|
|
||||
Mortgage-backed securities |
|
|
|
|
|
|
|
|
|
|
|
|
||||
Total |
|
$ |
|
|
$ |
|
|
$ |
|
|
$ |
|
||||
Note 4 – LHFI and ACL, LHFI
At December 31, 2023 and 2022, LHFI consisted of the following ($ in thousands):
|
|
December 31, |
|
|||||
|
|
2023 |
|
|
2022 |
|
||
Loans secured by real estate: |
|
|
|
|
|
|
||
Construction, land development and other land |
|
$ |
|
|
$ |
|
||
Other secured by 1-4 family residential properties |
|
|
|
|
|
|
||
Secured by nonfarm, nonresidential properties |
|
|
|
|
|
|
||
Other real estate secured |
|
|
|
|
|
|
||
Other loans secured by real estate: |
|
|
|
|
|
|
||
Other construction |
|
|
|
|
|
|
||
Secured by 1-4 family residential properties |
|
|
|
|
|
|
||
Commercial and industrial loans |
|
|
|
|
|
|
||
Consumer loans |
|
|
|
|
|
|
||
State and other political subdivision loans |
|
|
|
|
|
|
||
Other commercial loans and leases |
|
|
|
|
|
|
||
LHFI |
|
|
|
|
|
|
||
Less ACL |
|
|
|
|
|
|
||
Net LHFI |
|
$ |
|
|
$ |
|
||
Accrued interest receivable is not included in the amortized cost basis of Trustmark’s LHFI. At December 31, 2023 and 2022, accrued interest receivable for LHFI totaled $
Loan Concentrations
Trustmark does not have any loan concentrations other than those reflected in the preceding table, which exceed
93
Related Party Loans
At December 31, 2023 and 2022, loans to certain executive officers and directors, including their immediate families and companies in which they are principal owners, totaled $
Nonaccrual and Past Due LHFI
No material interest income was recognized in the income statement on nonaccrual LHFI for each of the years in the three-year period ended December 31, 2023.
The following tables provide the amortized cost basis of loans on nonaccrual status and loans past due 90 days or more still accruing interest at December 31, 2023 and 2022 ($ in thousands):
|
|
December 31, 2023 |
|
|||||||||
|
|
Nonaccrual With No ACL |
|
|
Total Nonaccrual |
|
|
Loans Past Due 90 Days or More Still Accruing |
|
|||
Loans secured by real estate: |
|
|
|
|
|
|
|
|
|
|||
Construction, land development and other land |
|
$ |
|
|
$ |
|
|
$ |
— |
|
||
Other secured by 1-4 family residential properties |
|
|
|
|
|
|
|
|
|
|||
Secured by nonfarm, nonresidential properties |
|
|
|
|
|
|
|
|
|
|||
Other real estate secured |
|
|
— |
|
|
|
|
|
|
|
||
Other loans secured by real estate: |
|
|
|
|
|
|
|
|
|
|||
Other construction |
|
|
|
|
|
|
|
|
— |
|
||
Secured by 1-4 family residential properties |
|
|
|
|
|
|
|
|
|
|||
Commercial and industrial loans |
|
|
|
|
|
|
|
|
|
|||
Consumer loans |
|
|
— |
|
|
|
|
|
|
|
||
Other commercial loans and leases |
|
|
— |
|
|
|
|
|
|
|
||
Total |
|
$ |
|
|
$ |
|
|
$ |
|
|||
|
|
December 31, 2022 |
|
|||||||||
|
|
Nonaccrual With No ACL |
|
|
Total Nonaccrual |
|
|
Loans Past Due 90 Days or More Still Accruing |
|
|||
Loans secured by real estate: |
|
|
|
|
|
|
|
|
|
|||
Construction, land development and other land |
|
$ |
|
|
$ |
|
|
$ |
— |
|
||
Other secured by 1-4 family residential properties |
|
|
|
|
|
|
|
|
|
|||
Secured by nonfarm, nonresidential properties |
|
|
|
|
|
|
|
|
— |
|
||
Other real estate secured |
|
|
|
|
|
|
|
|
— |
|
||
Other loans secured by real estate: |
|
|
|
|
|
|
|
|
|
|||
Other construction |
|
|
— |
|
|
|
|
|
|
— |
|
|
Secured by 1-4 family residential properties |
|
|
|
|
|
|
|
|
|
|||
Commercial and industrial loans |
|
|
|
|
|
|
|
|
— |
|
||
Consumer loans |
|
|
— |
|
|
|
|
|
|
|
||
Other commercial loans |
|
|
|
|
|
|
|
|
— |
|
||
Total |
|
$ |
|
|
$ |
|
|
$ |
|
|||
94
The following tables provide an aging analysis of the amortized cost basis of past due LHFI (including nonaccrual loans) at December 31, 2023 and 2022 ($ in thousands):
|
|
December 31, 2023 |
|
|||||||||||||||||||||
|
|
Past Due |
|
|
|
|
|
|
|
|||||||||||||||
|
|
|
|
|
|
|
|
90 Days |
|
|
Total |
|
|
Current |
|
|
|
|
||||||
|
|
30-59 Days |
|
|
60-89 Days |
|
|
or More |
|
|
Past Due |
|
|
Loans |
|
|
Total LHFI |
|
||||||
Loans secured by real estate: |
|
|
|
|
|
|
|
|
|
|
|
|
|
|
|
|
|
|
||||||
Construction, land development and other land |
|
$ |
|
|
$ |
|
|
$ |
|
|
$ |
|
|
$ |
|
|
$ |
|
||||||
Other secured by 1-4 family residential properties |
|
|
|
|
|
|
|
|
|
|
|
|
|
|
|
|
|
|
||||||
Secured by nonfarm, nonresidential properties |
|
|
|
|
|
|
|
|
|
|
|
|
|
|
|
|
|
|
||||||
Other real estate secured |
|
|
|
|
|
|
|
|
|
|
|
|
|
|
|
|
|
|
||||||
Other loans secured by real estate: |
|
|
|
|
|
|
|
|
|
|
|
|
|
|
|
|
|
|
||||||
Other construction |
|
|
|
|
|
|
|
|
|
|
|
|
|
|
|
|
|
|
||||||
Secured by 1-4 family residential properties |
|
|
|
|
|
|
|
|
|
|
|
|
|
|
|
|
|
|
||||||
Commercial and industrial loans |
|
|
|
|
|
|
|
|
|
|
|
|
|
|
|
|
|
|
||||||
Consumer loans |
|
|
|
|
|
|
|
|
|
|
|
|
|
|
|
|
|
|
||||||
State and other political subdivision loans |
|
|
|
|
|
|
|
|
|
|
|
|
|
|
|
|
|
|
||||||
Other commercial loans and leases |
|
|
|
|
|
|
|
|
|
|
|
|
|
|
|
|
|
|
||||||
Total |
|
$ |
|
|
$ |
|
|
$ |
|
|
$ |
|
|
$ |
|
|
$ |
|
||||||
|
|
December 31, 2022 |
|
|||||||||||||||||||||
|
|
Past Due |
|
|
|
|
|
|
|
|||||||||||||||
|
|
|
|
|
|
|
|
90 Days |
|
|
Total |
|
|
Current |
|
|
|
|
||||||
|
|
30-59 Days |
|
|
60-89 Days |
|
|
or More |
|
|
Past Due |
|
|
Loans |
|
|
Total LHFI |
|
||||||
Loans secured by real estate: |
|
|
|
|
|
|
|
|
|
|
|
|
|
|
|
|
|
|
||||||
Construction, land development and other land |
|
$ |
|
|
$ |
|
|
$ |
|
|
$ |
|
|
$ |
|
|
$ |
|
||||||
Other secured by 1-4 family residential properties |
|
|
|
|
|
|
|
|
|
|
|
|
|
|
|
|
|
|
||||||
Secured by nonfarm, nonresidential properties |
|
|
|
|
|
|
|
|
|
|
|
|
|
|
|
|
|
|
||||||
Other real estate secured |
|
|
|
|
|
|
|
|
|
|
|
|
|
|
|
|
|
|
||||||
Other loans secured by real estate: |
|
|
|
|
|
|
|
|
|
|
|
|
|
|
|
|
|
|
||||||
Other construction |
|
|
|
|
|
|
|
|
|
|
|
|
|
|
|
|
|
|
||||||
Secured by 1-4 family residential properties |
|
|
|
|
|
|
|
|
|
|
|
|
|
|
|
|
|
|
||||||
Commercial and industrial loans |
|
|
|
|
|
|
|
|
|
|
|
|
|
|
|
|
|
|
||||||
Consumer loans |
|
|
|
|
|
|
|
|
|
|
|
|
|
|
|
|
|
|
||||||
State and other political subdivision loans |
|
|
|
|
|
|
|
|
|
|
|
|
|
|
|
|
|
|
||||||
Other commercial loans |
|
|
|
|
|
|
|
|
|
|
|
|
|
|
|
|
|
|
||||||
Total |
|
$ |
|
|
$ |
|
|
$ |
|
|
$ |
|
|
$ |
|
|
$ |
|
||||||
Modified LHFI
Occasionally, Trustmark modifies loans for borrowers experiencing financial difficulties by providing payment concessions, interest-only payments for an extended period of time, maturity extensions or interest rate reductions. Other concessions may arise from court proceedings or may be imposed by law. In some cases, Trustmark provides multiple types of concessions on one loan.
The following tables present the amortized cost of LHFI at the end of each of the periods presented of loans modified to borrowers experiencing financial difficulty disaggregated by class of loan and type of modification ($ in thousands). The percentage of the amortized cost basis of LHFI that were modified to borrowers in financial distress as compared to the amortized cost basis of each class of LHFI is also presented below:
|
|
Year Ended December 31, 2023 |
|
|||||||||||||
|
|
Payment Concessions |
|
|
Term Extensions |
|
|
Total |
|
|
% of Total Class of Loan |
|
||||
Loans secured by real estate: |
|
|
|
|
|
|
|
|
|
|
|
|
||||
Other secured by 1-4 family residential properties |
|
$ |
— |
|
|
$ |
|
|
$ |
|
|
|
% |
|||
Secured by nonfarm, nonresidential properties |
|
|
— |
|
|
|
|
|
|
|
|
|
% |
|||
Other loans secured by real estate: |
|
|
|
|
|
|
|
|
|
|
|
|
||||
Secured by 1-4 family residential properties |
|
|
— |
|
|
|
|
|
|
|
|
|
% |
|||
Commercial and industrial loans |
|
|
|
|
|
— |
|
|
|
|
|
|
% |
|||
Consumer loans |
|
|
— |
|
|
|
|
|
|
|
|
|
% |
|||
Other commercial loans and leases |
|
|
|
|
|
|
|
|
|
|
|
% |
||||
Total |
|
$ |
|
|
$ |
|
|
$ |
|
|
|
% |
||||
95
The following table details the financial effect of the loan modifications presented above to borrowers experiencing financial difficulty for the periods presented:
|
|
Year Ended December 31, 2023 |
||
|
|
Financial Effect |
||
|
|
Payment Concessions |
|
Term Extensions |
Loans secured by real estate: |
|
|
|
|
Other secured by 1-4 family residential properties |
|
|
|
|
Secured by nonfarm, nonresidential properties |
|
|
|
|
Other loans secured by real estate: |
|
|
|
|
Secured by 1-4 family residential properties |
|
|
|
|
Commercial and industrial loans |
|
|
|
|
Consumer loans |
|
|
|
|
Other commercial loans and leases |
|
|
||
Trustmark had no unused commitments on modified loans to borrowers experiencing financial difficulty at December 31, 2023.
During the year ended December 31, 2023, Trustmark had payment concession balances of $
Trustmark has utilized loans 90 days or more past due to define payment default in determining modified loans that have subsequently defaulted. If Trustmark determines that a modified loan (or a portion of a loan) has subsequently been deemed uncollectible, the loan (or a portion of the loan) is charged off against the ACL, LHFI.
Trustmark closely monitors the performance of loans that are modified to borrowers experiencing financial difficulty to understand the effectiveness of its modification efforts.
|
|
Year Ended December 31, 2023 |
|
|||||||||||||||||||||
|
|
Past Due |
|
|
|
|
|
|
|
|||||||||||||||
|
|
|
|
|
|
|
|
90 Days |
|
|
Total |
|
|
Current |
|
|
|
|
||||||
|
|
30-59 Days |
|
|
60-89 Days |
|
|
or More |
|
|
Past Due |
|
|
Loans |
|
|
Total |
|
||||||
Loans secured by real estate: |
|
|
|
|
|
|
|
|
|
|
|
|
|
|
|
|
|
|
||||||
Other secured by 1-4 family residential properties |
|
$ |
|
|
$ |
|
|
$ |
— |
|
|
$ |
|
|
$ |
|
|
$ |
|
|||||
Secured by nonfarm, nonresidential properties |
|
|
— |
|
|
|
— |
|
|
|
— |
|
|
|
— |
|
|
|
|
|
|
|
||
Other loans secured by real estate: |
|
|
|
|
|
|
|
|
|
|
|
|
|
|
|
|
|
|
||||||
Secured by 1-4 family residential properties |
|
|
|
|
|
— |
|
|
|
— |
|
|
|
|
|
|
|
|
|
|
||||
Commercial and industrial loans |
|
|
— |
|
|
|
— |
|
|
|
— |
|
|
|
— |
|
|
|
|
|
|
|
||
Consumer loans |
|
|
|
|
|
— |
|
|
|
— |
|
|
|
|
|
|
|
|
|
|
||||
Other commercial loans and leases |
|
|
— |
|
|
|
— |
|
|
|
— |
|
|
|
— |
|
|
|
|
|
|
|
||
Total |
|
$ |
|
|
$ |
|
|
$ |
— |
|
|
$ |
|
|
$ |
|
|
$ |
|
|||||
96
Collateral-Dependent Loans
The following tables present the amortized cost basis of collateral-dependent loans by class of loans and collateral type at December 31, 2023 and 2022 ($ in thousands):
|
|
December 31, 2023 |
|
|||||||||||||
|
|
Real Estate |
|
|
Vehicles |
|
|
Miscellaneous |
|
|
Total |
|
||||
Loans secured by real estate: |
|
|
|
|
|
|
|
|
|
|
|
|
||||
Construction, land development and |
|
$ |
|
|
$ |
— |
|
|
$ |
— |
|
|
$ |
|
||
Other secured by 1-4 family |
|
|
|
|
|
— |
|
|
|
— |
|
|
|
|
||
Secured by nonfarm, nonresidential |
|
|
|
|
|
— |
|
|
|
— |
|
|
|
|
||
Other loans secured by real estate: |
|
|
|
|
|
|
|
|
|
|
|
|
||||
Secured by 1-4 family residential |
|
|
|
|
|
— |
|
|
|
— |
|
|
|
|
||
Commercial and industrial loans |
|
|
|
|
|
|
|
|
|
|
|
|
||||
Other commercial loans and leases |
|
|
— |
|
|
|
— |
|
|
|
|
|
|
|
||
Total |
|
$ |
|
|
$ |
|
|
$ |
|
|
$ |
|
||||
|
|
December 31, 2022 |
|
|||||||||||||||||
|
|
Real Estate |
|
|
Inventory and Receivables |
|
|
Vehicles |
|
|
Miscellaneous |
|
|
Total |
|
|||||
Loans secured by real estate: |
|
|
|
|
|
|
|
|
|
|
|
|
|
|
|
|||||
Construction, land development and |
|
$ |
|
|
$ |
— |
|
|
$ |
— |
|
|
$ |
— |
|
|
$ |
|
||
Other secured by 1-4 family |
|
|
|
|
|
— |
|
|
|
— |
|
|
|
— |
|
|
|
|
||
Secured by nonfarm, nonresidential |
|
|
|
|
|
— |
|
|
|
— |
|
|
|
— |
|
|
|
|
||
Other loans secured by real estate: |
|
|
|
|
|
|
|
|
|
|
|
|
|
|
|
|||||
Other construction |
|
|
|
|
|
|
|
|
— |
|
|
|
— |
|
|
|
|
|||
Secured by 1-4 family residential |
|
|
|
|
|
— |
|
|
|
— |
|
|
|
— |
|
|
|
|
||
Commercial and industrial loans |
|
|
|
|
|
|
|
|
|
|
|
|
|
|
|
|||||
Total |
|
$ |
|
|
$ |
|
|
$ |
|
|
$ |
|
|
$ |
|
|||||
A loan is collateral dependent when the borrower is experiencing financial difficulty and repayment of the loan is expected to be provided substantially through the sale of the collateral. The following provides a qualitative description by class of loan of the collateral that secures Trustmark’s collateral-dependent LHFI:
97
Credit Quality Indicators
Trustmark’s loan portfolio credit quality indicators focus on
In addition to monitoring portfolio credit quality indicators, Trustmark also measures how effectively the lending process is being managed and risks are being identified. As part of an ongoing monitoring process, Trustmark grades the commercial portfolio segment as it relates to credit file completion and financial statement exceptions, underwriting, collateral documentation and compliance with law as shown below:
Commercial Credits
Trustmark has established a loan grading system that consists of ten individual credit risk grades (risk ratings) that encompass a range from loans where the expectation of loss is negligible to loans where loss has been established. The model is based on the risk of default for an individual credit and establishes certain criteria to delineate the level of risk across the ten unique credit risk grades. Credit risk grade definitions are as follows:
By definition, credit risk grades special mention (RR 7), substandard (RR 8), doubtful (RR 9) and loss (RR 10) are criticized loans while substandard (RR 8), doubtful (RR 9) and loss (RR 10) are classified loans. These definitions are standardized by all bank regulatory agencies and are generally equally applied by each individual lending institution. The remaining credit risk grades are considered pass credits and are solely defined by Trustmark.
98
To enhance this process, Trustmark has determined that certain loans will be individually assessed, and a formal analysis will be performed and based upon the analysis the loan will be written down to net realizable value. Trustmark will individually assess and remove loans from the pool in the following circumstances:
Each loan officer assesses the appropriateness of the internal risk rating assigned to their credits on an ongoing basis. Trustmark’s Asset Review area conducts independent credit quality reviews of the majority of Trustmark’s commercial loan portfolio both on the underlying credit quality of each individual loan class as well as the adherence to Trustmark’s loan policy and the loan administration process.
In addition to the ongoing internal risk rate monitoring described above, Trustmark’s Credit Quality Review Committee meets monthly and performs a review of all loans of $
In addition, periodic reviews of significant development, commercial construction, multi-family and nonowner-occupied projects are performed. These reviews assess each particular project with respect to location, project valuations, progress of completion, leasing status, current financial information, rents, operating expenses, cash flow, adherence to budget and projections and other information as applicable. Summary results are reviewed by Senior and Regional Credit Officers in addition to the Chief Credit Officer with a determination made as to the appropriateness of existing risk ratings and accrual status.
Consumer Credits
The Retail Credit Review Committee, Management Credit Policy Committee and the Enterprise Risk Committee review the volume and percentage of consumer loan delinquencies and losses to monitor the overall quality of the consumer portfolio.
Trustmark monitors the levels and severity of past due consumer LHFI on a daily basis through its collection activities. A detailed assessment of consumer LHFI delinquencies is performed monthly at both a product and market level.
99
The tables below present the amortized cost basis of loans by credit quality indicator and class of loans based on analyses performed at December 31, 2023 and 2022 ($ in thousands):
|
|
Term Loans by Origination Year |
|
|
|
|
|
|
|
|||||||||||||||||||||||
|
|
2023 |
|
|
2022 |
|
|
2021 |
|
|
2020 |
|
|
2019 |
|
|
Prior |
|
|
Revolving Loans |
|
|
Total |
|
||||||||
As of December 31, 2023 |
|
Commercial LHFI |
|
|||||||||||||||||||||||||||||
Loans secured by real estate: |
|
|
|
|
|
|
|
|
|
|
|
|
|
|
|
|
|
|
|
|
|
|
|
|
||||||||
Construction, land development |
|
|
|
|
|
|
|
|
|
|
|
|
|
|
|
|
|
|
|
|
|
|
|
|
||||||||
Pass - RR 1 through RR 6 |
|
$ |
|
|
$ |
|
|
$ |
|
|
$ |
|
|
$ |
|
|
$ |
|
|
$ |
|
|
$ |
|
||||||||
Special Mention - RR 7 |
|
|
— |
|
|
|
— |
|
|
|
|
|
|
— |
|
|
|
— |
|
|
|
— |
|
|
|
— |
|
|
|
|
||
Substandard - RR 8 |
|
|
|
|
|
|
|
|
|
|
|
|
|
|
— |
|
|
|
|
|
|
— |
|
|
|
|
||||||
Doubtful - RR 9 |
|
|
— |
|
|
|
— |
|
|
|
— |
|
|
|
— |
|
|
|
— |
|
|
|
|
|
|
— |
|
|
|
|
||
Total |
|
|
|
|
|
|
|
|
|
|
|
|
|
|
|
|
|
|
|
|
|
|
|
|
||||||||
Current period gross |
|
|
— |
|
|
|
( |
) |
|
|
( |
) |
|
|
— |
|
|
|
( |
) |
|
|
— |
|
|
|
— |
|
|
|
( |
) |
|
|
|
|
|
|
|
|
|
|
|
|
|
|
|
|
|
|
|
|
|
|
|
|
|
||||||||
Other secured by 1-4 family residential |
|
|
|
|
|
|
|
|
|
|
|
|
|
|
|
|
|
|
|
|
|
|
|
|
||||||||
Pass - RR 1 through RR 6 |
|
$ |
|
|
$ |
|
|
$ |
|
|
$ |
|
|
$ |
|
|
$ |
|
|
$ |
|
|
$ |
|
||||||||
Special Mention - RR 7 |
|
|
— |
|
|
|
|
|
|
|
|
|
|
|
|
— |
|
|
|
— |
|
|
|
— |
|
|
|
|
||||
Substandard - RR 8 |
|
|
|
|
|
|
|
|
|
|
|
|
|
|
|
|
|
|
|
|
|
|
|
|
||||||||
Doubtful - RR 9 |
|
|
— |
|
|
|
— |
|
|
|
— |
|
|
|
— |
|
|
|
— |
|
|
|
— |
|
|
|
— |
|
|
|
— |
|
Total |
|
|
|
|
|
|
|
|
|
|
|
|
|
|
|
|
|
|
|
|
|
|
|
|
||||||||
Current period gross |
|
|
— |
|
|
|
— |
|
|
|
( |
) |
|
|
— |
|
|
|
— |
|
|
|
( |
) |
|
|
— |
|
|
|
( |
) |
|
|
|
|
|
|
|
|
|
|
|
|
|
|
|
|
|
|
|
|
|
|
|
|
|
||||||||
Secured by nonfarm, nonresidential |
|
|
|
|
|
|
|
|
|
|
|
|
|
|
|
|
|
|
|
|
|
|
|
|
||||||||
Pass - RR 1 through RR 6 |
|
$ |
|
|
$ |
|
|
$ |
|
|
$ |
|
|
$ |
|
|
$ |
|
|
$ |
|
|
$ |
|
||||||||
Special Mention - RR 7 |
|
|
|
|
|
|
|
|
— |
|
|
|
|
|
|
|
|
|
— |
|
|
|
— |
|
|
|
|
|||||
Substandard - RR 8 |
|
|
|
|
|
|
|
|
|
|
|
|
|
|
|
|
|
|
|
|
|
|
|
|
||||||||
Doubtful - RR 9 |
|
|
|
|
|
— |
|
|
|
— |
|
|
|
— |
|
|
|
|
|
|
|
|
|
— |
|
|
|
|
||||
Total |
|
|
|
|
|
|
|
|
|
|
|
|
|
|
|
|
|
|
|
|
|
|
|
|
||||||||
Current period gross |
|
|
— |
|
|
|
( |
) |
|
|
( |
) |
|
|
— |
|
|
|
( |
) |
|
|
( |
) |
|
|
— |
|
|
|
( |
) |
|
|
|
|
|
|
|
|
|
|
|
|
|
|
|
|
|
|
|
|
|
|
|
|
|
||||||||
Other real estate secured: |
|
|
|
|
|
|
|
|
|
|
|
|
|
|
|
|
|
|
|
|
|
|
|
|
||||||||
Pass - RR 1 through RR 6 |
|
$ |
|
|
$ |
|
|
$ |
|
|
$ |
|
|
$ |
|
|
$ |
|
|
$ |
|
|
$ |
|
||||||||
Special Mention - RR 7 |
|
|
|
|
|
|
|
|
— |
|
|
|
— |
|
|
|
|
|
|
— |
|
|
|
— |
|
|
|
|
||||
Substandard - RR 8 |
|
|
— |
|
|
|
|
|
|
— |
|
|
|
|
|
|
— |
|
|
|
|
|
|
— |
|
|
|
|
||||
Doubtful - RR 9 |
|
|
|
|
|
— |
|
|
|
— |
|
|
|
— |
|
|
|
— |
|
|
|
— |
|
|
|
— |
|
|
|
|
||
Total |
|
|
|
|
|
|
|
|
|
|
|
|
|
|
|
|
|
|
|
|
|
|
|
|
||||||||
Current period gross |
|
|
— |
|
|
|
— |
|
|
|
— |
|
|
|
— |
|
|
|
— |
|
|
|
— |
|
|
|
— |
|
|
|
— |
|
100
|
|
Term Loans by Origination Year |
|
|
|
|
|
|
|
|||||||||||||||||||||||
|
|
2023 |
|
|
2022 |
|
|
2021 |
|
|
2020 |
|
|
2019 |
|
|
Prior |
|
|
Revolving Loans |
|
|
Total |
|
||||||||
As of December 31, 2023 |
|
Commercial LHFI |
|
|||||||||||||||||||||||||||||
Other loans secured by real estate: |
|
|
|
|
|
|
|
|
|
|
|
|
|
|
|
|
|
|
|
|
|
|
|
|
||||||||
Other construction |
|
|
|
|
|
|
|
|
|
|
|
|
|
|
|
|
|
|
|
|
|
|
|
|
||||||||
Pass - RR 1 through RR 6 |
|
$ |
|
|
$ |
|
|
$ |
|
|
$ |
|
|
$ |
— |
|
|
$ |
|
|
$ |
|
|
$ |
|
|||||||
Special Mention - RR 7 |
|
|
— |
|
|
|
— |
|
|
|
— |
|
|
|
— |
|
|
|
— |
|
|
|
— |
|
|
|
— |
|
|
|
— |
|
Substandard - RR 8 |
|
|
|
|
|
— |
|
|
|
— |
|
|
|
— |
|
|
|
— |
|
|
|
— |
|
|
|
— |
|
|
|
|
||
Doubtful - RR 9 |
|
|
— |
|
|
|
— |
|
|
|
— |
|
|
|
— |
|
|
|
— |
|
|
|
— |
|
|
|
— |
|
|
|
— |
|
Total |
|
|
|
|
|
|
|
|
|
|
|
|
|
|
— |
|
|
|
|
|
|
|
|
|
|
|||||||
Current period gross |
|
|
( |
) |
|
|
— |
|
|
|
( |
) |
|
|
— |
|
|
|
— |
|
|
|
— |
|
|
|
— |
|
|
|
( |
) |
|
|
|
|
|
|
|
|
|
|
|
|
|
|
|
|
|
|
|
|
|
|
|
|
|
||||||||
Commercial and industrial loans: |
|
|
|
|
|
|
|
|
|
|
|
|
|
|
|
|
|
|
|
|
|
|
|
|
||||||||
Pass - RR 1 through RR 6 |
|
$ |
|
|
$ |
|
|
$ |
|
|
$ |
|
|
$ |
|
|
$ |
|
|
$ |
|
|
$ |
|
||||||||
Special Mention - RR 7 |
|
|
|
|
|
|
|
|
|
|
|
|
|
|
|
|
|
— |
|
|
|
|
|
|
|
|||||||
Substandard - RR 8 |
|
|
|
|
|
|
|
|
|
|
|
|
|
|
|
|
|
|
|
|
|
|
|
|
||||||||
Doubtful - RR 9 |
|
|
|
|
|
|
|
|
|
|
|
— |
|
|
|
— |
|
|
|
|
|
|
|
|
|
|
||||||
Total |
|
|
|
|
|
|
|
|
|
|
|
|
|
|
|
|
|
|
|
|
|
|
|
|
||||||||
Current period gross |
|
|
( |
) |
|
|
( |
) |
|
|
( |
) |
|
|
( |
) |
|
|
( |
) |
|
|
( |
) |
|
|
( |
) |
|
|
( |
) |
|
|
|
|
|
|
|
|
|
|
|
|
|
|
|
|
|
|
|
|
|
|
|
|
|
||||||||
State and other political subdivision loans: |
|
|
|
|
|
|
|
|
|
|
|
|
|
|
|
|
|
|
|
|
|
|
|
|
||||||||
Pass - RR 1 through RR 6 |
|
$ |
|
|
$ |
|
|
$ |
|
|
$ |
|
|
$ |
|
|
$ |
|
|
$ |
|
|
$ |
|
||||||||
Special Mention - RR 7 |
|
|
— |
|
|
|
— |
|
|
|
— |
|
|
|
— |
|
|
|
— |
|
|
|
— |
|
|
|
— |
|
|
|
— |
|
Substandard - RR 8 |
|
|
— |
|
|
|
— |
|
|
|
— |
|
|
|
— |
|
|
|
— |
|
|
|
— |
|
|
|
— |
|
|
|
— |
|
Doubtful - RR 9 |
|
|
— |
|
|
|
— |
|
|
|
— |
|
|
|
— |
|
|
|
— |
|
|
|
— |
|
|
|
— |
|
|
|
— |
|
Total |
|
|
|
|
|
|
|
|
|
|
|
|
|
|
|
|
|
|
|
|
|
|
|
|
||||||||
Current period gross |
|
|
— |
|
|
|
— |
|
|
|
— |
|
|
|
— |
|
|
|
— |
|
|
|
— |
|
|
|
— |
|
|
|
— |
|
|
|
|
|
|
|
|
|
|
|
|
|
|
|
|
|
|
|
|
|
|
|
|
|
|
||||||||
Other commercial loans and leases: |
|
|
|
|
|
|
|
|
|
|
|
|
|
|
|
|
|
|
|
|
|
|
|
|
||||||||
Pass - RR 1 through RR 6 |
|
$ |
|
|
$ |
|
|
$ |
|
|
$ |
|
|
$ |
|
|
$ |
|
|
$ |
|
|
$ |
|
||||||||
Special Mention - RR 7 |
|
|
— |
|
|
|
— |
|
|
|
— |
|
|
|
|
|
|
— |
|
|
|
— |
|
|
|
|
|
|
|
|||
Substandard - RR 8 |
|
|
|
|
|
|
|
|
|
|
|
— |
|
|
|
— |
|
|
|
— |
|
|
|
|
|
|
|
|||||
Doubtful - RR 9 |
|
|
— |
|
|
|
— |
|
|
|
— |
|
|
|
— |
|
|
|
— |
|
|
|
|
|
|
— |
|
|
|
|
||
Total |
|
|
|
|
|
|
|
|
|
|
|
|
|
|
|
|
|
|
|
|
|
|
|
|
||||||||
Current period gross |
|
|
( |
) |
|
|
( |
) |
|
|
— |
|
|
|
( |
) |
|
|
— |
|
|
|
— |
|
|
|
— |
|
|
|
( |
) |
|
|
|
|
|
|
|
|
|
|
|
|
|
|
|
|
|
|
|
|
|
|
|
|
|
||||||||
Total commercial LHFI |
|
$ |
|
|
$ |
|
|
$ |
|
|
$ |
|
|
$ |
|
|
$ |
|
|
$ |
|
|
$ |
|
||||||||
Total commercial LHFI |
|
$ |
( |
) |
|
$ |
( |
) |
|
$ |
( |
) |
|
$ |
( |
) |
|
$ |
( |
) |
|
$ |
( |
) |
|
$ |
( |
) |
|
$ |
( |
) |
101
|
|
Term Loans by Origination Year |
|
|
|
|
|
|
|
|||||||||||||||||||||||
|
|
2023 |
|
|
2022 |
|
|
2021 |
|
|
2020 |
|
|
2019 |
|
|
Prior |
|
|
Revolving Loans |
|
|
Total |
|
||||||||
As of December 31, 2023 |
|
Consumer LHFI |
|
|||||||||||||||||||||||||||||
Loans secured by real estate: |
|
|
|
|
|
|
|
|
|
|
|
|
|
|
|
|
|
|
|
|
|
|
|
|
||||||||
Construction, land development and |
|
|
|
|
|
|
|
|
|
|
|
|
|
|
|
|
|
|
|
|
|
|
|
|
||||||||
Current |
|
$ |
|
|
$ |
|
|
$ |
|
|
$ |
|
|
$ |
|
|
$ |
|
|
$ |
|
|
$ |
|
||||||||
Past due 30-89 days |
|
|
— |
|
|
|
|
|
|
— |
|
|
|
— |
|
|
|
|
|
|
|
|
|
— |
|
|
|
|
||||
Past due 90 days or more |
|
|
— |
|
|
|
— |
|
|
|
— |
|
|
|
— |
|
|
|
— |
|
|
|
— |
|
|
|
— |
|
|
|
— |
|
Nonaccrual |
|
|
— |
|
|
|
— |
|
|
|
|
|
|
— |
|
|
|
— |
|
|
|
|
|
|
— |
|
|
|
|
|||
Total |
|
|
|
|
|
|
|
|
|
|
|
|
|
|
|
|
|
|
|
|
|
|
|
|
||||||||
Current period gross |
|
|
— |
|
|
|
— |
|
|
|
— |
|
|
|
— |
|
|
|
— |
|
|
|
— |
|
|
|
— |
|
|
|
— |
|
|
|
|
|
|
|
|
|
|
|
|
|
|
|
|
|
|
|
|
|
|
|
|
|
|
||||||||
Other secured by 1-4 family residential |
|
|
|
|
|
|
|
|
|
|
|
|
|
|
|
|
|
|
|
|
|
|
|
|
||||||||
Current |
|
$ |
|
|
$ |
|
|
$ |
|
|
$ |
|
|
$ |
|
|
$ |
|
|
$ |
|
|
$ |
|
||||||||
Past due 30-89 days |
|
|
|
|
|
|
|
|
|
|
|
|
|
|
|
|
|
|
|
|
|
|
|
|
||||||||
Past due 90 days or more |
|
|
— |
|
|
|
|
|
|
— |
|
|
|
— |
|
|
|
— |
|
|
|
|
|
|
|
|
|
|
||||
Nonaccrual |
|
|
|
|
|
|
|
|
|
|
|
|
|
|
— |
|
|
|
|
|
|
|
|
|
|
|||||||
Total |
|
|
|
|
|
|
|
|
|
|
|
|
|
|
|
|
|
|
|
|
|
|
|
|
||||||||
Current period gross |
|
|
— |
|
|
|
( |
) |
|
|
( |
) |
|
|
( |
) |
|
|
( |
) |
|
|
( |
) |
|
|
( |
) |
|
|
( |
) |
|
|
|
|
|
|
|
|
|
|
|
|
|
|
|
|
|
|
|
|
|
|
|
|
|
||||||||
Secured by nonfarm, nonresidential |
|
|
|
|
|
|
|
|
|
|
|
|
|
|
|
|
|
|
|
|
|
|
|
|
||||||||
Current |
|
$ |
— |
|
|
$ |
— |
|
|
$ |
|
|
$ |
— |
|
|
$ |
— |
|
|
$ |
— |
|
|
$ |
— |
|
|
$ |
|
||
Past due 30-89 days |
|
|
— |
|
|
|
— |
|
|
|
— |
|
|
|
— |
|
|
|
— |
|
|
|
— |
|
|
|
— |
|
|
|
— |
|
Past due 90 days or more |
|
|
— |
|
|
|
— |
|
|
|
— |
|
|
|
— |
|
|
|
— |
|
|
|
— |
|
|
|
— |
|
|
|
— |
|
Nonaccrual |
|
|
— |
|
|
|
— |
|
|
|
— |
|
|
|
— |
|
|
|
— |
|
|
|
— |
|
|
|
— |
|
|
|
— |
|
Total |
|
|
— |
|
|
|
— |
|
|
|
|
|
|
— |
|
|
|
— |
|
|
|
— |
|
|
|
— |
|
|
|
|
||
Current period gross |
|
|
— |
|
|
|
— |
|
|
|
— |
|
|
|
— |
|
|
|
— |
|
|
|
— |
|
|
|
— |
|
|
|
— |
|
|
|
|
|
|
|
|
|
|
|
|
|
|
|
|
|
|
|
|
|
|
|
|
|
|
||||||||
Other real estate secured: |
|
|
|
|
|
|
|
|
|
|
|
|
|
|
|
|
|
|
|
|
|
|
|
|
||||||||
Current |
|
$ |
— |
|
|
$ |
— |
|
|
$ |
— |
|
|
$ |
|
|
$ |
— |
|
|
$ |
|
|
$ |
— |
|
|
$ |
|
|||
Past due 30-89 days |
|
|
— |
|
|
|
— |
|
|
|
— |
|
|
|
— |
|
|
|
— |
|
|
|
— |
|
|
|
— |
|
|
|
— |
|
Past due 90 days or more |
|
|
— |
|
|
|
— |
|
|
|
— |
|
|
|
— |
|
|
|
— |
|
|
|
— |
|
|
|
— |
|
|
|
— |
|
Nonaccrual |
|
|
— |
|
|
|
— |
|
|
|
— |
|
|
|
— |
|
|
|
— |
|
|
|
— |
|
|
|
— |
|
|
|
— |
|
Total |
|
|
— |
|
|
|
— |
|
|
|
— |
|
|
|
|
|
|
— |
|
|
|
|
|
|
— |
|
|
|
|
|||
Current period gross |
|
|
— |
|
|
|
— |
|
|
|
— |
|
|
|
— |
|
|
|
— |
|
|
|
— |
|
|
|
— |
|
|
|
— |
|
102
|
|
Term Loans by Origination Year |
|
|
|
|
|
|
|
|||||||||||||||||||||||
|
|
2023 |
|
|
2022 |
|
|
2021 |
|
|
2020 |
|
|
2019 |
|
|
Prior |
|
|
Revolving Loans |
|
|
Total |
|
||||||||
As of December 31, 2023 |
|
Consumer LHFI |
|
|||||||||||||||||||||||||||||
Other loans secured by real estate: |
|
|
|
|
|
|
|
|
|
|
|
|
|
|
|
|
|
|
|
|
|
|
|
|
||||||||
Secured by 1-4 family residential properties |
|
|
|
|
|
|
|
|
|
|
|
|
|
|
|
|
|
|
|
|
|
|
|
|
||||||||
Current |
|
$ |
|
|
$ |
|
|
$ |
|
|
$ |
|
|
$ |
|
|
$ |
|
|
$ |
— |
|
|
$ |
|
|||||||
Past due 30-89 days |
|
|
|
|
|
|
|
|
|
|
|
|
|
|
|
|
|
|
|
|
— |
|
|
|
|
|||||||
Past due 90 days or more |
|
|
|
|
|
|
|
|
|
|
|
|
|
|
— |
|
|
|
|
|
|
— |
|
|
|
|
||||||
Nonaccrual |
|
|
|
|
|
|
|
|
|
|
|
|
|
|
|
|
|
|
|
|
— |
|
|
|
|
|||||||
Total |
|
|
|
|
|
|
|
|
|
|
|
|
|
|
|
|
|
|
|
|
— |
|
|
|
|
|||||||
Current period gross |
|
|
( |
) |
|
|
( |
) |
|
|
( |
) |
|
|
( |
) |
|
|
— |
|
|
|
( |
) |
|
|
— |
|
|
|
( |
) |
|
|
|
|
|
|
|
|
|
|
|
|
|
|
|
|
|
|
|
|
|
|
|
|
|
||||||||
Consumer loans: |
|
|
|
|
|
|
|
|
|
|
|
|
|
|
|
|
|
|
|
|
|
|
|
|
||||||||
Current |
|
$ |
|
|
$ |
|
|
$ |
|
|
$ |
|
|
$ |
|
|
$ |
|
|
$ |
|
|
$ |
|
||||||||
Past due 30-89 days |
|
|
|
|
|
|
|
|
|
|
|
|
|
|
|
|
|
|
|
|
|
|
|
|
||||||||
Past due 90 days or more |
|
|
|
|
|
|
|
|
|
|
|
|
|
|
— |
|
|
|
— |
|
|
|
|
|
|
|
||||||
Nonaccrual |
|
|
|
|
|
|
|
|
|
|
|
|
|
|
— |
|
|
|
— |
|
|
|
|
|
|
|
||||||
Total |
|
|
|
|
|
|
|
|
|
|
|
|
|
|
|
|
|
|
|
|
|
|
|
|
||||||||
Current period gross |
|
|
( |
) |
|
|
( |
) |
|
|
( |
) |
|
|
( |
) |
|
|
( |
) |
|
|
( |
) |
|
|
( |
) |
|
|
( |
) |
|
|
|
|
|
|
|
|
|
|
|
|
|
|
|
|
|
|
|
|
|
|
|
|
|
||||||||
Total consumer LHFI |
|
$ |
|
|
$ |
|
|
$ |
|
|
$ |
|
|
$ |
|
|
$ |
|
|
$ |
|
|
$ |
|
||||||||
Total consumer LHFI |
|
$ |
( |
) |
|
$ |
( |
) |
|
$ |
( |
) |
|
$ |
( |
) |
|
$ |
( |
) |
|
$ |
( |
) |
|
$ |
( |
) |
|
$ |
( |
) |
|
|
|
|
|
|
|
|
|
|
|
|
|
|
|
|
|
|
|
|
|
|
|
|
|
||||||||
Total LHFI |
|
$ |
|
|
$ |
|
|
$ |
|
|
$ |
|
|
$ |
|
|
$ |
|
|
$ |
|
|
$ |
|
||||||||
Total current period |
|
$ |
( |
) |
|
$ |
( |
) |
|
$ |
( |
) |
|
$ |
( |
) |
|
$ |
( |
) |
|
$ |
( |
) |
|
$ |
( |
) |
|
$ |
( |
) |
|
|
Term Loans by Origination Year |
|
|
|
|
|
|
|
|||||||||||||||||||||||
|
|
2022 |
|
|
2021 |
|
|
2020 |
|
|
2019 |
|
|
2018 |
|
|
Prior |
|
|
Revolving Loans |
|
|
Total |
|
||||||||
As of December 31, 2022 |
|
Commercial LHFI |
|
|||||||||||||||||||||||||||||
Loans secured by real estate: |
|
|
|
|
|
|
|
|
|
|
|
|
|
|
|
|
|
|
|
|
|
|
|
|
||||||||
Construction, land development |
|
|
|
|
|
|
|
|
|
|
|
|
|
|
|
|
|
|
|
|
|
|
|
|
||||||||
Pass - RR 1 through RR 6 |
|
$ |
|
|
$ |
|
|
$ |
|
|
$ |
|
|
$ |
|
|
$ |
|
|
$ |
|
|
$ |
|
||||||||
Special Mention - RR 7 |
|
|
— |
|
|
|
— |
|
|
|
— |
|
|
|
— |
|
|
|
— |
|
|
|
— |
|
|
|
— |
|
|
|
— |
|
Substandard - RR 8 |
|
|
|
|
|
|
|
|
— |
|
|
|
|
|
|
— |
|
|
|
— |
|
|
|
|
|
|
|
|||||
Doubtful - RR 9 |
|
|
— |
|
|
|
— |
|
|
|
— |
|
|
|
— |
|
|
|
— |
|
|
|
|
|
|
— |
|
|
|
|
||
Total |
|
|
|
|
|
|
|
|
|
|
|
|
|
|
|
|
|
|
|
|
|
|
|
|
||||||||
|
|
|
|
|
|
|
|
|
|
|
|
|
|
|
|
|
|
|
|
|
|
|
|
|
||||||||
Other secured by 1-4 family residential |
|
|
|
|
|
|
|
|
|
|
|
|
|
|
|
|
|
|
|
|
|
|
|
|
||||||||
Pass - RR 1 through RR 6 |
|
$ |
|
|
$ |
|
|
$ |
|
|
$ |
|
|
$ |
|
|
$ |
|
|
$ |
|
|
$ |
|
||||||||
Special Mention - RR 7 |
|
|
|
|
|
|
|
|
|
|
|
— |
|
|
|
— |
|
|
|
— |
|
|
|
— |
|
|
|
|
||||
Substandard - RR 8 |
|
|
|
|
|
|
|
|
|
|
|
|
|
|
|
|
|
|
|
|
— |
|
|
|
|
|||||||
Doubtful - RR 9 |
|
|
|
|
|
— |
|
|
|
— |
|
|
|
— |
|
|
|
— |
|
|
|
— |
|
|
|
— |
|
|
|
|
||
Total |
|
|
|
|
|
|
|
|
|
|
|
|
|
|
|
|
|
|
|
|
|
|
|
|
||||||||
|
|
|
|
|
|
|
|
|
|
|
|
|
|
|
|
|
|
|
|
|
|
|
|
|
||||||||
Secured by nonfarm, nonresidential |
|
|
|
|
|
|
|
|
|
|
|
|
|
|
|
|
|
|
|
|
|
|
|
|
||||||||
Pass - RR 1 through RR 6 |
|
$ |
|
|
$ |
|
|
$ |
|
|
$ |
|
|
$ |
|
|
$ |
|
|
$ |
|
|
$ |
|
||||||||
Special Mention - RR 7 |
|
|
|
|
|
— |
|
|
|
— |
|
|
|
|
|
|
— |
|
|
|
— |
|
|
|
— |
|
|
|
|
|||
Substandard - RR 8 |
|
|
|
|
|
|
|
|
|
|
|
|
|
|
|
|
|
|
|
|
|
|
|
|
||||||||
Doubtful - RR 9 |
|
|
|
|
|
— |
|
|
|
— |
|
|
|
|
|
|
— |
|
|
|
|
|
|
— |
|
|
|
|
||||
Total |
|
|
|
|
|
|
|
|
|
|
|
|
|
|
|
|
|
|
|
|
|
|
|
|
||||||||
|
|
|
|
|
|
|
|
|
|
|
|
|
|
|
|
|
|
|
|
|
|
|
|
|
||||||||
Other real estate secured: |
|
|
|
|
|
|
|
|
|
|
|
|
|
|
|
|
|
|
|
|
|
|
|
|
||||||||
Pass - RR 1 through RR 6 |
|
$ |
|
|
$ |
|
|
$ |
|
|
$ |
|
|
$ |
|
|
$ |
|
|
$ |
|
|
$ |
|
||||||||
Special Mention - RR 7 |
|
|
— |
|
|
|
— |
|
|
|
— |
|
|
|
— |
|
|
|
— |
|
|
|
— |
|
|
|
— |
|
|
|
— |
|
Substandard - RR 8 |
|
|
|
|
|
— |
|
|
|
|
|
|
— |
|
|
|
|
|
|
|
|
|
|
|
|
|
||||||
Doubtful - RR 9 |
|
|
— |
|
|
|
— |
|
|
|
— |
|
|
|
— |
|
|
|
— |
|
|
|
— |
|
|
|
— |
|
|
|
— |
|
Total |
|
|
|
|
|
|
|
|
|
|
|
|
|
|
|
|
|
|
|
|
|
|
|
|
||||||||
103
|
|
Term Loans by Origination Year |
|
|
|
|
|
|
|
|||||||||||||||||||||||
|
|
2022 |
|
|
2021 |
|
|
2020 |
|
|
2019 |
|
|
2018 |
|
|
Prior |
|
|
Revolving Loans |
|
|
Total |
|
||||||||
As of December 31, 2022 |
|
Commercial LHFI |
|
|||||||||||||||||||||||||||||
Other loans secured by real estate: |
|
|
|
|
|
|
|
|
|
|
|
|
|
|
|
|
|
|
|
|
|
|
|
|
||||||||
Other construction |
|
|
|
|
|
|
|
|
|
|
|
|
|
|
|
|
|
|
|
|
|
|
|
|
||||||||
Pass - RR 1 through RR 6 |
|
$ |
|
|
$ |
|
|
$ |
|
|
$ |
|
|
$ |
— |
|
|
$ |
— |
|
|
$ |
|
|
$ |
|
||||||
Special Mention - RR 7 |
|
|
— |
|
|
|
— |
|
|
|
— |
|
|
|
— |
|
|
|
— |
|
|
|
— |
|
|
|
— |
|
|
|
— |
|
Substandard - RR 8 |
|
|
— |
|
|
|
|
|
|
— |
|
|
|
— |
|
|
|
— |
|
|
|
— |
|
|
|
— |
|
|
|
|
||
Doubtful - RR 9 |
|
|
— |
|
|
|
— |
|
|
|
— |
|
|
|
— |
|
|
|
— |
|
|
|
— |
|
|
|
— |
|
|
|
— |
|
Total |
|
|
|
|
|
|
|
|
|
|
|
|
|
|
— |
|
|
|
— |
|
|
|
|
|
|
|
||||||
|
|
|
|
|
|
|
|
|
|
|
|
|
|
|
|
|
|
|
|
|
|
|
|
|
||||||||
Commercial and industrial loans: |
|
|
|
|
|
|
|
|
|
|
|
|
|
|
|
|
|
|
|
|
|
|
|
|
||||||||
Pass - RR 1 through RR 6 |
|
$ |
|
|
$ |
|
|
$ |
|
|
$ |
|
|
$ |
|
|
$ |
|
|
$ |
|
|
$ |
|
||||||||
Special Mention - RR 7 |
|
|
— |
|
|
|
— |
|
|
|
|
|
|
— |
|
|
|
— |
|
|
|
— |
|
|
|
|
|
|
|
|||
Substandard - RR 8 |
|
|
|
|
|
|
|
|
|
|
|
|
|
|
|
|
|
— |
|
|
|
|
|
|
|
|||||||
Doubtful - RR 9 |
|
|
|
|
|
|
|
|
|
|
|
|
|
|
|
|
|
— |
|
|
|
|
|
|
|
|||||||
Total |
|
|
|
|
|
|
|
|
|
|
|
|
|
|
|
|
|
|
|
|
|
|
|
|
||||||||
|
|
|
|
|
|
|
|
|
|
|
|
|
|
|
|
|
|
|
|
|
|
|
|
|
||||||||
State and other political subdivision loans: |
|
|
|
|
|
|
|
|
|
|
|
|
|
|
|
|
|
|
|
|
|
|
|
|
||||||||
Pass - RR 1 through RR 6 |
|
$ |
|
|
$ |
|
|
$ |
|
|
$ |
|
|
$ |
|
|
$ |
|
|
$ |
|
|
$ |
|
||||||||
Special Mention - RR 7 |
|
|
— |
|
|
|
— |
|
|
|
— |
|
|
|
— |
|
|
|
— |
|
|
|
|
|
|
— |
|
|
|
|
||
Substandard - RR 8 |
|
|
— |
|
|
|
— |
|
|
|
— |
|
|
|
— |
|
|
|
— |
|
|
|
— |
|
|
|
— |
|
|
|
— |
|
Doubtful - RR 9 |
|
|
— |
|
|
|
— |
|
|
|
— |
|
|
|
— |
|
|
|
— |
|
|
|
— |
|
|
|
— |
|
|
|
— |
|
Total |
|
|
|
|
|
|
|
|
|
|
|
|
|
|
|
|
|
|
|
|
|
|
|
|
||||||||
|
|
|
|
|
|
|
|
|
|
|
|
|
|
|
|
|
|
|
|
|
|
|
|
|
||||||||
Other commercial loans: |
|
|
|
|
|
|
|
|
|
|
|
|
|
|
|
|
|
|
|
|
|
|
|
|
||||||||
Pass - RR 1 through RR 6 |
|
$ |
|
|
$ |
|
|
$ |
|
|
$ |
|
|
$ |
|
|
$ |
|
|
$ |
|
|
$ |
|
||||||||
Special Mention - RR 7 |
|
|
|
|
|
— |
|
|
|
— |
|
|
|
— |
|
|
|
— |
|
|
|
— |
|
|
|
— |
|
|
|
|
||
Substandard - RR 8 |
|
|
|
|
|
|
|
|
— |
|
|
|
— |
|
|
|
|
|
|
|
|
|
|
|
|
|
||||||
Doubtful - RR 9 |
|
|
|
|
|
— |
|
|
|
— |
|
|
|
— |
|
|
|
— |
|
|
|
— |
|
|
|
— |
|
|
|
|
||
Total |
|
|
|
|
|
|
|
|
|
|
|
|
|
|
|
|
|
|
|
|
|
|
|
|
||||||||
|
|
|
|
|
|
|
|
|
|
|
|
|
|
|
|
|
|
|
|
|
|
|
|
|
||||||||
Total commercial LHFI |
|
$ |
|
|
$ |
|
|
$ |
|
|
$ |
|
|
$ |
|
|
$ |
|
|
$ |
|
|
$ |
|
||||||||
104
|
|
Term Loans by Origination Year |
|
|
|
|
|
|
|
|||||||||||||||||||||||
|
|
2022 |
|
|
2021 |
|
|
2020 |
|
|
2019 |
|
|
2018 |
|
|
Prior |
|
|
Revolving Loans |
|
|
Total |
|
||||||||
As of December 31, 2022 |
|
Consumer LHFI |
|
|||||||||||||||||||||||||||||
Loans secured by real estate: |
|
|
|
|
|
|
|
|
|
|
|
|
|
|
|
|
|
|
|
|
|
|
|
|
||||||||
Construction, land development and |
|
|
|
|
|
|
|
|
|
|
|
|
|
|
|
|
|
|
|
|
|
|
|
|
||||||||
Current |
|
$ |
|
|
$ |
|
|
$ |
|
|
$ |
|
|
$ |
|
|
$ |
|
|
$ |
— |
|
|
$ |
|
|||||||
Past due 30-89 days |
|
|
— |
|
|
|
|
|
|
— |
|
|
|
|
|
|
|
|
|
|
|
|
— |
|
|
|
|
|||||
Past due 90 days or more |
|
|
— |
|
|
|
— |
|
|
|
— |
|
|
|
— |
|
|
|
— |
|
|
|
— |
|
|
|
— |
|
|
|
— |
|
Nonaccrual |
|
|
— |
|
|
|
|
|
|
— |
|
|
|
— |
|
|
|
— |
|
|
|
|
|
|
— |
|
|
|
|
|||
Total |
|
|
|
|
|
|
|
|
|
|
|
|
|
|
|
|
|
|
|
|
— |
|
|
|
|
|||||||
|
|
|
|
|
|
|
|
|
|
|
|
|
|
|
|
|
|
|
|
|
|
|
|
|
||||||||
Other secured by 1-4 family residential |
|
|
|
|
|
|
|
|
|
|
|
|
|
|
|
|
|
|
|
|
|
|
|
|
||||||||
Current |
|
$ |
|
|
$ |
|
|
$ |
|
|
$ |
|
|
$ |
|
|
$ |
|
|
$ |
|
|
$ |
|
||||||||
Past due 30-89 days |
|
|
|
|
|
|
|
|
|
|
|
|
|
|
|
|
|
|
|
|
|
|
|
|
||||||||
Past due 90 days or more |
|
|
— |
|
|
|
— |
|
|
|
— |
|
|
|
|
|
|
— |
|
|
|
— |
|
|
|
|
|
|
|
|||
Nonaccrual |
|
|
|
|
|
|
|
|
|
|
|
|
|
|
|
|
|
|
|
|
|
|
|
|
||||||||
Total |
|
|
|
|
|
|
|
|
|
|
|
|
|
|
|
|
|
|
|
|
|
|
|
|
||||||||
|
|
|
|
|
|
|
|
|
|
|
|
|
|
|
|
|
|
|
|
|
|
|
|
|
||||||||
Secured by nonfarm, nonresidential |
|
|
|
|
|
|
|
|
|
|
|
|
|
|
|
|
|
|
|
|
|
|
|
|
||||||||
Current |
|
$ |
— |
|
|
$ |
|
|
$ |
— |
|
|
$ |
— |
|
|
$ |
— |
|
|
$ |
— |
|
|
$ |
— |
|
|
$ |
|
||
Past due 30-89 days |
|
|
— |
|
|
|
— |
|
|
|
— |
|
|
|
— |
|
|
|
— |
|
|
|
— |
|
|
|
— |
|
|
|
— |
|
Past due 90 days or more |
|
|
— |
|
|
|
— |
|
|
|
— |
|
|
|
— |
|
|
|
— |
|
|
|
— |
|
|
|
— |
|
|
|
— |
|
Nonaccrual |
|
|
— |
|
|
|
— |
|
|
|
— |
|
|
|
— |
|
|
|
— |
|
|
|
— |
|
|
|
— |
|
|
|
— |
|
Total |
|
|
— |
|
|
|
|
|
|
— |
|
|
|
— |
|
|
|
— |
|
|
|
— |
|
|
|
— |
|
|
|
|
||
|
|
|
|
|
|
|
|
|
|
|
|
|
|
|
|
|
|
|
|
|
|
|
|
|
||||||||
Other real estate secured: |
|
|
|
|
|
|
|
|
|
|
|
|
|
|
|
|
|
|
|
|
|
|
|
|
||||||||
Current |
|
$ |
— |
|
|
$ |
— |
|
|
$ |
|
|
$ |
— |
|
|
$ |
|
|
$ |
|
|
$ |
— |
|
|
$ |
|
||||
Past due 30-89 days |
|
|
— |
|
|
|
— |
|
|
|
— |
|
|
|
— |
|
|
|
— |
|
|
|
— |
|
|
|
— |
|
|
|
— |
|
Past due 90 days or more |
|
|
— |
|
|
|
— |
|
|
|
— |
|
|
|
— |
|
|
|
— |
|
|
|
— |
|
|
|
— |
|
|
|
— |
|
Nonaccrual |
|
|
— |
|
|
|
— |
|
|
|
— |
|
|
|
— |
|
|
|
— |
|
|
|
— |
|
|
|
— |
|
|
|
— |
|
Total |
|
|
— |
|
|
|
— |
|
|
|
|
|
|
— |
|
|
|
|
|
|
|
|
|
— |
|
|
|
|
||||
|
|
Term Loans by Origination Year |
|
|
|
|
|
|
|
|||||||||||||||||||||||
|
|
2022 |
|
|
2021 |
|
|
2020 |
|
|
2019 |
|
|
2018 |
|
|
Prior |
|
|
Revolving Loans |
|
|
Total |
|
||||||||
As of December 31, 2022 |
|
Consumer LHFI |
|
|||||||||||||||||||||||||||||
Other loans secured by real estate: |
|
|
|
|
|
|
|
|
|
|
|
|
|
|
|
|
|
|
|
|
|
|
|
|
||||||||
Secured by 1-4 family residential properties |
|
|
|
|
|
|
|
|
|
|
|
|
|
|
|
|
|
|
|
|
|
|
|
|
||||||||
Current |
|
$ |
|
|
$ |
|
|
$ |
|
|
$ |
|
|
$ |
|
|
$ |
|
|
$ |
— |
|
|
$ |
|
|||||||
Past due 30-89 days |
|
|
|
|
|
|
|
|
|
|
|
|
|
|
— |
|
|
|
|
|
|
— |
|
|
|
|
||||||
Past due 90 days or more |
|
|
|
|
|
|
|
|
|
|
|
— |
|
|
|
|
|
|
|
|
|
— |
|
|
|
|
||||||
Nonaccrual |
|
|
|
|
|
|
|
|
|
|
|
|
|
|
|
|
|
|
|
|
— |
|
|
|
|
|||||||
Total |
|
|
|
|
|
|
|
|
|
|
|
|
|
|
|
|
|
|
|
|
— |
|
|
|
|
|||||||
|
|
|
|
|
|
|
|
|
|
|
|
|
|
|
|
|
|
|
|
|
|
|
|
|
||||||||
Consumer loans: |
|
|
|
|
|
|
|
|
|
|
|
|
|
|
|
|
|
|
|
|
|
|
|
|
||||||||
Current |
|
$ |
|
|
$ |
|
|
$ |
|
|
$ |
|
|
$ |
|
|
$ |
|
|
$ |
|
|
$ |
|
||||||||
Past due 30-89 days |
|
|
|
|
|
|
|
|
|
|
|
|
|
|
|
|
|
|
|
|
|
|
|
|
||||||||
Past due 90 days or more |
|
|
|
|
|
|
|
|
|
|
|
|
|
|
|
|
|
— |
|
|
|
|
|
|
|
|||||||
Nonaccrual |
|
|
|
|
|
|
|
|
|
|
|
|
|
|
|
|
|
— |
|
|
|
|
|
|
|
|||||||
Total |
|
|
|
|
|
|
|
|
|
|
|
|
|
|
|
|
|
|
|
|
|
|
|
|
||||||||
|
|
|
|
|
|
|
|
|
|
|
|
|
|
|
|
|
|
|
|
|
|
|
|
|
||||||||
Total consumer LHFI |
|
$ |
|
|
$ |
|
|
$ |
|
|
$ |
|
|
$ |
|
|
$ |
|
|
$ |
|
|
$ |
|
||||||||
|
|
|
|
|
|
|
|
|
|
|
|
|
|
|
|
|
|
|
|
|
|
|
|
|
||||||||
Total LHFI |
|
$ |
|
|
$ |
|
|
$ |
|
|
$ |
|
|
$ |
|
|
$ |
|
|
$ |
|
|
$ |
|
||||||||
Past Due LHFS
LHFS past due
Trustmark did not exercise its buy-back option on any delinquent loans serviced for GNMA during 2023 or 2022.
105
ACL, LHFI
Trustmark’s ACL methodology for LHFI is based upon guidance within FASB ASC Subtopic 326-20 as well as applicable regulatory guidance. The ACL is a valuation account that is deducted from the loans’ amortized cost basis to present the net amount expected to be collected on the loans. Credit quality within the LHFI portfolio is continuously monitored by Management and is reflected within the ACL for LHFI. The ACL is an estimate of expected losses inherent within Trustmark’s existing LHFI portfolio. The ACL for LHFI is adjusted through the PCL, LHFI and reduced by the charge off of loan amounts, net of recoveries.
The methodology for estimating the amount of expected credit losses reported in the ACL has two basic components: a collective, or pooled, component for estimated expected credit losses for pools of loans that share similar risk characteristics, and an asset-specific component involving individual loans that do not share risk characteristics with other loans and the measurement of expected credit losses for such individual loans. In estimating the ACL for the collective component, loans are segregated into loan pools based on loan product types and similar risk characteristics.
The loans secured by real estate and other loans secured by real estate portfolio segments include loans for both commercial and residential properties. The underwriting process for these loans includes analysis of the financial position and strength of both the borrower and guarantor, experience with similar projects in the past, market demand and prospects for successful completion of the proposed project within the established budget and schedule, values of underlying collateral, availability of permanent financing, maximum loan-to-value ratios, minimum equity requirements, acceptable amortization periods and minimum debt service coverage requirements, based on property type. The borrower’s financial strength and capacity to repay their obligations remain the primary focus of underwriting. Financial strength is evaluated based upon analytical tools that consider historical and projected cash flows and performance in addition to analysis of the proposed project for income-producing properties. Additional support offered by guarantors is also considered. Ultimate repayment of these loans is sensitive to interest rate changes, general economic conditions, liquidity and availability of long-term financing.
The commercial and industrial LHFI portfolio segment includes loans within Trustmark’s geographic markets made to many types of businesses for various purposes, such as short-term working capital loans that are usually secured by accounts receivable and inventory and term financing for equipment and fixed asset purchases that are secured by those assets. Trustmark’s credit underwriting process for commercial and industrial loans includes analysis of historical and projected cash flows and performance, evaluation of financial strength of both borrowers and guarantors as reflected in current and detailed financial information and evaluation of underlying collateral to support the credit.
The consumer LHFI portfolio segment is comprised of loans that are centrally underwritten based on the borrower's credit bureau score as well as an evaluation of the borrower’s repayment capacity, credit, and collateral. Property appraisals are obtained to assist in evaluating collateral. Loan-to-value and debt-to-income ratios, loan amount, and lien position are also considered in assessing whether to originate a loan. These borrowers are particularly susceptible to downturns in economic trends such as conditions that negatively affect housing prices and demand and levels of unemployment.
The state and other political subdivision LHFI and the other commercial LHFI portfolio segments primarily consist of loans to non-depository financial institutions, such as mortgage companies, finance companies and other financial intermediaries, loans to state and political subdivisions, and loans to non-profit and charitable organizations. These loans are underwritten based on the specific nature or purpose of the loan and underlying collateral with special consideration given to the specific source of repayment for the loan.
106
The following table provides a description of each of Trustmark’s portfolio segments, loan classes, loan pools and the ACL methodology and loss drivers:
Portfolio Segment |
|
Loan Class |
|
Loan Pool |
|
Methodology |
|
Loss Drivers |
Loans secured by real estate |
|
Construction, land |
|
1-4 family residential |
|
|
||
|
|
|
|
Lots and development |
|
|
||
|
|
|
|
Unimproved land |
|
|
||
|
|
|
|
All other consumer |
|
|
||
|
|
Other secured by 1-4 |
|
Consumer 1-4 family - 1st liens |
|
|
||
|
|
|
|
All other consumer |
|
|
||
|
|
|
|
Nonresidential owner-occupied |
|
|
||
|
|
Secured by nonfarm, |
|
Nonowner-occupied - |
|
|
||
|
|
|
|
Nonowner-occupied - office |
|
|
||
|
|
|
|
Nonowner-occupied- Retail |
|
|
||
|
|
|
|
Nonowner-occupied - senior |
|
|
||
|
|
|
|
Nonowner-occupied - |
|
|
||
|
|
|
|
Nonresidential owner-occupied |
|
|
||
|
|
Other real estate secured |
|
Nonresidential nonowner |
|
|
||
|
|
|
|
Nonresidential owner-occupied |
|
|
||
|
|
|
|
Nonowner-occupied - |
|
|
||
Other loans secured by |
|
Other construction |
|
Other construction |
|
|
||
|
|
Secured by 1-4 family |
|
Trustmark mortgage |
|
|
||
Commercial and |
|
Commercial and |
|
Commercial and industrial - |
|
|
||
|
|
|
|
Commercial and industrial - |
|
|
||
|
|
|
|
Equipment finance loans |
|
|
||
|
|
|
|
Credit cards |
|
|
||
Consumer loans |
|
Consumer loans |
|
Credit cards |
|
|
||
|
|
|
|
Overdrafts |
|
|
||
|
|
|
|
All other consumer |
|
|
||
State and other political |
|
State and other political |
|
Obligations of state and |
|
|
||
Other commercial loans and leases |
|
Other commercial loans and leases |
|
Other loans |
|
|
||
|
|
|
|
Commercial and industrial - |
|
|
||
|
|
|
|
Commercial and industrial - |
|
|
||
|
|
|
|
Equipment finance leases |
|
|
In general, Trustmark utilizes a DCF method to estimate the quantitative portion of the ACL for loan pools. The DCF model consists of two key components, a loss driver analysis (LDA) and a cash flow analysis. For loan pools utilizing the DCF methodology, multiple assumptions are in place, depending on the loan pool. A reasonable and supportable forecast is utilized for each loan pool by developing a LDA for each loan class. The LDA uses charge off data from Federal Financial Institutions Examination Council (FFIEC) reports to construct a periodic default rate (PDR). The PDR is decomposed into a PD. Regressions are run using the data for various
107
macroeconomic variables in order to determine which ones correlate to Trustmark’s losses. These variables are then incorporated into the application to calculate a quarterly PD using a third-party baseline forecast. In addition to the PD, a LGD is derived using a method referred to as Frye Jacobs. The Frye Jacobs method is a mathematical formula that traces the relationship between LGD and PD over time and projects the LGD based on the levels of PD forecasts. This model approach is applicable to all pools within the construction, land development and other land, other secured by 1-4 family residential properties, secured by nonfarm, nonresidential properties and other real estate secured loan classes as well as consumer loans and other commercial loans.
During the first quarter of 2022, Management elected to incorporate a methodology change related to the other construction pool. Components of this change include management utilizing an alternative LDA to support the PD and LGD assumptions necessary to apply a DCF methodology to the other construction pool. Fundamentally, this approach utilizes publicly reported default balances and leverages a generalized linear model (GLM) framework to estimate PD. Taken together, these differences allow for results to be scaled to be specific and directly applicable to the other construction segment. LGD is assumed to be a through-the-cycle constant based on the actual performance of Trustmark’s other construction segment. These assumptions are then input into the DCF model and used in conjunction with prepayment data to calculate the cash flows at the individual loan level. Previously, the other construction pool used the weighted average remaining maturity (WARM) method. Management believes this change is commensurate with the level of risk in the pool.
For the commercial and industrial loans related pools, Trustmark uses its own PD and LGD data, instead of the macroeconomic variables and the Frye Jacobs method described above, to calculate the PD and LGD as there were no defensible macroeconomic variables that correlated to Trustmark’s losses. Trustmark utilizes a third-party Bond Default Study to derive the PD and LGD for the obligations of state and political subdivisions pool. Due to the lack of losses within this pool, no defensible macroeconomic factors were identified to correlate.
The PD and LGD measures are used in conjunction with prepayment data as inputs into the DCF model to calculate the cash flows at the individual loan level. Contractual cash flows based on loan terms are adjusted for PD, LGD and prepayments to derive loss cash flows. These loss cash flows are discounted by the loan’s coupon rate to arrive at the discounted cash flow based quantitative loss. The prepayment studies are updated quarterly by a third-party for each applicable pool.
An alternate method of estimating the ACL is used for certain loan pools due to specific characteristics of these loans. For the non-DCF pools, specifically, those using the WARM method, the remaining life is incorporated into the ACL quantitative calculation.
Trustmark determined that reasonable and supportable forecasts could be made for a twelve-month period for all of its loan pools. To the extent the lives of the loans in the LHFI portfolio extend beyond this forecast period, Trustmark uses a reversion period of four quarters and reverts to the historical mean on a straight-line basis over the remaining life of the loans. The econometric models currently in production reflect segment or pool level sensitivities of PD to changes in macroeconomic variables. By measuring the relationship between defaults and changes in the economy, the quantitative reserve incorporates reasonable and supportable forecasts of future conditions that will affect the value of its assets, as required by FASB ASC Topic 326. Under stable forecasts, these linear regressions will reasonably predict a pool’s PD. However, due to the COVID-19 pandemic, the macroeconomic variables used for reasonable and supportable forecasting changed rapidly. At the macroeconomic levels experienced during the COVID-19 pandemic, it is not clear that the models currently in production will produce reasonably representative results since the models were originally estimated using data beginning in 2004 through 2019. During this period, a traditional, albeit severe, economic recession occurred. Thus, econometric models are sensitive to similar future levels of PD.
In order to prevent the econometric models from extrapolating beyond reasonable boundaries of their input variables, Trustmark chose to establish an upper and lower limit process when applying the periodic forecasts. In this way, Management will not rely upon unobserved and untested relationships in the setting of the quantitative reserve. This approach applies to all input variables, including: Southern Unemployment, National Unemployment, National Gross Domestic Product (GDP), Southern GDP, Southern Vacancy Rate and the Prime Rate. The upper and lower limits are based on the distribution of the macroeconomic variable by selecting extreme percentiles at the upper and lower limits of the distribution, the 1st and 99th percentiles, respectively. These upper and lower limits are then used to calculate the PD for the forecast time period in which the forecasted values are outside of the upper and lower limit range. Due to multiple periods having a PD or LGD at or near zero as a result of the improving macroeconomic forecasts, Management implemented PD and LGD floors to account for the risk associated with each portfolio. The PD and LGD floors are based on Trustmark’s historical loss experience and applied at a portfolio level.
Qualitative factors used in the ACL methodology include the following:
108
While all these factors are incorporated into the overall methodology, only three are currently considered active at December 31, 2023: (i) economic conditions and concentrations of credit, (ii) nature and volume of the portfolio and (iii) performance trends.
Two of Trustmark’s largest loan classes are the loans secured by nonfarm, nonresidential properties and the loans secured by other real estate. Trustmark elected to create a qualitative factor specifically for these loan classes which addresses changes in the economic conditions of metropolitan areas and applies additional pool level reserves. This qualitative factor is based on third-party market data and forecast trends and is updated quarterly as information is available, by market and by loan pool.
Trustmark's current quantitative methodologies do not completely incorporate changes in credit quality. As a result Trustmark utilizes the performance trends factor. This factor is based on migration analyses, that allocates additional ACL to non-pass/delinquent loans within each pool. In this way, Management believes the ACL will directly reflect changes in risk, based on the performance of the loans within a pool, whether declining or improving.
The performance trends qualitative factor is estimated by properly segmenting loan pools into risk levels by risk rating for commercial credits and delinquency status for consumer credits. A migration analysis is then performed quarterly using a third-party software and the results for each risk level is compiled to calculate the historical PD average for each loan portfolio based on risk levels. This average historical PD rate is updated annually. For the mortgage portfolio, Trustmark uses an internal report to incorporate a roll rate method for the calculation of the PD rate. In addition, to the PD rate for each portfolio, Management incorporates the quantitative rate and the k value derived from the Frye-Jacobs method to calculate a loss estimate that includes both PD and LGD. The quantitative rate is used to eliminate any additional reserve that the quantitative reserve already includes. Finally, the loss estimate rate is then applied to the total balances for each risk level for each portfolio to calculate a qualitative reserve.
During the second quarter of 2022, Management elected to activate the nature and volume of the portfolio qualitative factor as a result of a sub-pool of the secured by 1-4 family residential properties growing to a significant size along with the underlying nature being different as well. The nature and volume of the portfolio qualitative factor utilizes a WARM methodology that uses industry data for the assumptions to support the qualitative adjustment. The industry data is used to compile a PD based on credit score ranges along with using the industry data to compile an LGD. The sub-pool of credits are then aggregated into the appropriate credit score bands in which a weighted average loss rate is calculated based on the PD and LGD for each credit score range. This weighted average loss rate is then applied to the expected balance for the sub-segment of credits. This total is then used as the qualitative reserve adjustment.
The external factors qualitative factor is Management’s best judgment on the loan or pool level impact of all factors that affect the portfolio that are not accounted for using any other part of the ACL methodology (e.g., natural disasters, changes in legislation, impacts due to technology and pandemics). Trustmark's External Factor – Pandemic ensures reserve adequacy for collectively evaluated loans most likely to be impacted by the unique economic and behavioral conditions created by the COVID-19 pandemic. Additional qualitative reserves are derived based on two principles. The first is the disconnect of economic factors to Trustmark’s modeled PD (derived from the econometric models underpinning the quantitative pooled reserves). During the pandemic, extraordinary measures by the federal government were made available to consumers and businesses, including COVID-19 loan payment concessions, direct transfer payments to households, tax deferrals, and reduced interest rates, among others. These government interventions may have extended the lag between economic conditions and default, relative to what was captured in the model development data. Because Trustmark’s econometric PD models rely on the observed relationship from the economic downturn from 2007 to 2009 in both timing and severity, Management does not expect the models to reflect these current conditions. For example, while the models would predict contemporaneous unemployment peaks and loan defaults, this may not occur when borrowers can request payment deferrals. Thus, for the affected population, economic conditions are not fully considered as a part of Trustmark’s quantitative reserve. The second principle is the change in risk that is identified by rating changes. As a part of Trustmark’s credit review process, loans in the affected population have been given more frequent screening to ensure accurate ratings are maintained through this dynamic period. Trustmark’s quantitative reserve does not directly address changes in ratings, thus a migration qualitative factor was designed to work in concert with the quantitative reserve.
As discussed above, the disconnect of economic factors means that changes in rating caused by deteriorating and weak economic conditions as a result of the pandemic were not being captured in the quantitative reserve. During 2020, due to unforeseen pandemic conditions that varied from Management’s expectations, additional reserves were further dimensioned in order to appropriately reflect the risk within the portfolio related to the COVID-19 pandemic. In an effort to ensure the External Factor-Pandemic qualitative factor is reasonable and supportable, historical Trustmark loss data was leveraged to construct a framework that is quantitative in nature. To dimension the additional reserve, Management uses the sensitivity of the quantitative commercial loan reserve to changes in
109
macroeconomic conditions to apply to loans rated acceptable or better (RR 1-4). In addition, to account for the known changes in risk, a weighted average of the commercial loan portfolio loss rate, derived from the performance trends qualitative factor, is used to dimension additional reserves for downgraded credits. Loans rated acceptable with risk (RR 5) or watch (RR 6) received the additional reserves based on the average of the macroeconomic conditions and weighted-average of the commercial loan portfolio loss rate while the loans rated special mention and substandard received additional reserves based on the weighted-average described above. During the fourth quarter of 2022, Management noted that all pass rated loans (RR 5 & RR 6) related to the External Factor-Pandemic qualitative factor either did not experience significant stress related to the pandemic or have since recovered and does not expect future stresses attributed to the pandemic that may affect these loans. As a result, Management decided to accelerate the release of the additional pandemic reserves on all pass rated loans. During the fourth quarter of 2023, Management decided to resolve the External Factor-Pandemic qualitative factor as a result of the remaining loan balances that were identified as COVID affected loans were immaterial from both a reserve and balance perspective. The remaining loans were incorporated back into the performance qualitative factor as a result of this resolution. Further, due to this resolution there is no longer any active External Factor as of December 31, 2023.
The following tables disaggregate the ACL, LHFI and the amortized cost basis of the loans by the measurement methodology used at December 31, 2023 and 2022 ($ in thousands):
|
|
December 31, 2023 |
|
|||||||||||||||||||||
|
|
ACL |
|
|
LHFI |
|
||||||||||||||||||
|
|
Individually Evaluated for Credit Loss |
|
|
Collectively Evaluated for Credit Loss |
|
|
Total ACL |
|
|
Individually Evaluated for Credit Loss |
|
|
Collectively Evaluated for Credit Loss |
|
|
Total LHFI |
|
||||||
Loans secured by real estate: |
|
|
|
|
|
|
|
|
|
|
|
|
|
|
|
|
|
|
||||||
Construction, land development and other land |
|
$ |
|
|
$ |
|
|
$ |
|
|
$ |
|
|
|
|
|
$ |
|
||||||
Other secured by 1-4 family residential properties |
|
|
— |
|
|
|
|
|
|
|
|
|
|
|
|
|
|
|
|
|||||
Secured by nonfarm, nonresidential properties |
|
|
— |
|
|
|
|
|
|
|
|
|
|
|
|
|
|
|
|
|||||
Other real estate secured |
|
|
— |
|
|
|
|
|
|
|
|
|
|
|
|
|
|
|
|
|||||
Other loans secured by real estate: |
|
|
|
|
|
|
|
|
|
|
|
|
|
|
|
|
|
|
||||||
Other construction |
|
|
|
|
|
|
|
|
|
|
|
|
|
|
|
|
|
|
||||||
Secured by 1-4 family residential properties |
|
|
— |
|
|
|
|
|
|
|
|
|
|
|
|
|
|
|
|
|||||
Commercial and industrial loans |
|
|
|
|
|
|
|
|
|
|
|
|
|
|
|
|
|
|
||||||
Consumer loans |
|
|
— |
|
|
|
|
|
|
|
|
|
|
|
|
|
|
|
|
|||||
State and other political subdivision loans |
|
|
|
|
|
|
|
|
|
|
|
|
|
|
|
|
|
|
||||||
Other commercial loans and leases |
|
|
|
|
|
|
|
|
|
|
|
|
|
|
|
|
|
|
||||||
Total |
|
$ |
|
|
$ |
|
|
$ |
|
|
$ |
|
|
$ |
|
|
$ |
|
||||||
|
|
December 31, 2022 |
|
|||||||||||||||||||||
|
|
ACL |
|
|
LHFI |
|
||||||||||||||||||
|
|
Individually Evaluated |
|
|
Collectively Evaluated for Credit Loss |
|
|
Total |
|
|
Individually Evaluated for Credit Loss |
|
|
Collectively Evaluated for Credit Loss |
|
|
Total |
|
||||||
Loans secured by real estate: |
|
|
|
|
|
|
|
|
|
|
|
|
|
|
|
|
|
|
||||||
Construction, land development and other land |
|
$ |
|
|
$ |
|
|
$ |
|
|
$ |
|
|
$ |
|
|
$ |
|
||||||
Other secured by 1-4 family residential properties |
|
|
— |
|
|
|
|
|
|
|
|
|
|
|
|
|
|
|
|
|||||
Secured by nonfarm, nonresidential properties |
|
|
— |
|
|
|
|
|
|
|
|
|
|
|
|
|
|
|
|
|||||
Other real estate secured |
|
|
— |
|
|
|
|
|
|
|
|
|
|
|
|
|
|
|
|
|||||
Other loans secured by real estate: |
|
|
|
|
|
|
|
|
|
|
|
|
|
|
|
|
|
|
||||||
Other construction |
|
|
|
|
|
|
|
|
|
|
|
|
|
|
|
|
|
|
||||||
Secured by 1-4 family residential properties |
|
|
— |
|
|
|
|
|
|
|
|
|
|
|
|
|
|
|
|
|||||
Commercial and industrial loans |
|
|
|
|
|
|
|
|
|
|
|
|
|
|
|
|
|
|
||||||
Consumer loans |
|
|
— |
|
|
|
|
|
|
|
|
|
— |
|
|
|
|
|
|
|
||||
State and other political subdivision loans |
|
|
|
|
|
|
|
|
|
|
|
|
|
|
|
|
|
|
||||||
Other commercial loans |
|
|
|
|
|
|
|
|
|
|
|
|
|
|
|
|
|
|
||||||
Total |
|
$ |
|
|
$ |
|
|
$ |
|
|
$ |
|
|
$ |
|
|
$ |
|
||||||
110
Changes in the ACL, LHFI were as follows for the periods presented ($ in thousands):
|
|
Years Ended December 31, |
|
|||||||||
|
|
2023 |
|
|
2022 |
|
|
2021 |
|
|||
Balance at beginning of period |
|
$ |
|
|
$ |
|
|
$ |
|
|||
Loans charged-off |
|
|
( |
) |
|
|
( |
) |
|
|
( |
) |
Recoveries |
|
|
|
|
|
|
|
|
|
|||
Net (charge-offs) recoveries |
|
|
( |
) |
|
|
( |
) |
|
|
|
|
PCL, LHFI |
|
|
|
|
|
|
|
|
( |
) |
||
Balance at end of period |
|
$ |
|
|
$ |
|
|
$ |
|
|||
The following tables detail changes in the ACL, LHFI by loan class for the years ended December 31, 2023 and 2022 ($ in thousands):
|
|
2023 |
|
|||||||||||||||||
|
|
Balance |
|
|
|
|
|
|
|
|
|
|
|
Balance |
|
|||||
|
|
January 1, |
|
|
Charge-offs |
|
|
Recoveries |
|
|
PCL |
|
|
December 31, |
|
|||||
Loans secured by real estate: |
|
|
|
|
|
|
|
|
|
|
|
|
|
|
|
|||||
Construction, land development and other land |
|
$ |
|
|
$ |
( |
) |
|
$ |
|
|
$ |
|
|
$ |
|
||||
Other secured by 1-4 family residential properties |
|
|
|
|
|
( |
) |
|
|
|
|
|
|
|
|
|
||||
Secured by nonfarm, nonresidential properties |
|
|
|
|
|
( |
) |
|
|
|
|
|
|
|
|
|
||||
Other real estate secured |
|
|
|
|
|
|
|
|
|
|
|
( |
) |
|
|
|
||||
Other loans secured by real estate: |
|
|
|
|
|
|
|
|
|
|
|
|
|
|
|
|||||
Other construction |
|
|
|
|
|
( |
) |
|
|
|
|
|
( |
) |
|
|
|
|||
Secured by 1-4 family residential properties |
|
|
|
|
|
( |
) |
|
|
|
|
|
|
|
|
|
||||
Commercial and industrial loans |
|
|
|
|
|
( |
) |
|
|
|
|
|
|
|
|
|
||||
Consumer loans |
|
|
|
|
|
( |
) |
|
|
|
|
|
|
|
|
|
||||
State and other political subdivision loans |
|
|
|
|
|
|
|
|
|
|
|
( |
) |
|
|
|
||||
Other commercial loans and leases |
|
|
|
|
|
( |
) |
|
|
|
|
|
|
|
|
|
||||
Total |
|
$ |
|
|
$ |
( |
) |
|
$ |
|
|
$ |
|
|
$ |
|
||||
The PCL, LHFI for the year ended December 31, 2023 was primarily attributable to loan growth, extended maturities on the secured by 1-4 family residential properties resulting from lower prepayment speeds, changes in the macroeconomic forecast and net adjustments to the qualitative factors.
The negative PCL, LHFI for the other construction portfolio for the year ended December 31, 2023 was primarily due to the transfer of a fully-reserved nonaccrual loan to other real estate, net.
|
|
2022 |
|
|||||||||||||||||
|
|
|
|
|
|
|
|
|
|
|
|
|
|
|
|
|||||
|
|
Balance |
|
|
Charge-offs |
|
|
Recoveries |
|
|
PCL |
|
|
Balance |
|
|||||
Loans secured by real estate: |
|
|
|
|
|
|
|
|
|
|
|
|
|
|
|
|||||
Construction, land development and other land |
|
$ |
|
|
$ |
( |
) |
|
$ |
|
|
$ |
|
|
$ |
|
||||
Other secured by 1-4 family residential properties |
|
|
|
|
|
( |
) |
|
|
|
|
|
|
|
|
|
||||
Secured by nonfarm, nonresidential properties |
|
|
|
|
|
( |
) |
|
|
|
|
|
( |
) |
|
|
|
|||
Other real estate secured |
|
|
|
|
|
( |
) |
|
|
|
|
|
|
|
|
|
||||
Other loans secured by real estate: |
|
|
|
|
|
|
|
|
|
|
|
|
|
|
|
|||||
Other construction |
|
|
|
|
|
( |
) |
|
|
|
|
|
|
|
|
|
||||
Secured by 1-4 family residential properties |
|
|
|
|
|
( |
) |
|
|
|
|
|
|
|
|
|
||||
Commercial and industrial loans |
|
|
|
|
|
( |
) |
|
|
|
|
|
|
|
|
|
||||
Consumer loans |
|
|
|
|
|
( |
) |
|
|
|
|
|
|
|
|
|
||||
State and other political subdivision loans |
|
|
|
|
|
|
|
|
|
|
|
( |
) |
|
|
|
||||
Other commercial loans |
|
|
|
|
|
( |
) |
|
|
|
|
|
|
|
|
|
||||
Total |
|
$ |
|
|
$ |
( |
) |
|
$ |
|
|
$ |
|
|
$ |
|
||||
The increases in the PCL, LHFI for the year ended December 31, 2022 were primarily due to loan growth, the weakening of the macroeconomic forecast and the nature and volume of the portfolio.
The decrease in the PCL, LHFI for the secured by nonfarm, nonresidential properties portfolio for the year ended December 31, 2022 was primarily due to adjustments to the External Factor - Pandemic qualitative factor. The decrease in the PCL, LHFI for the state and
111
other political subdivision loans portfolio was due to the release of specific reserves on individually analyzed credits coupled with the adjustments to the External Factor - Pandemic qualitative factor and routine modeling assumption updates.
Note 5 – Premises and Equipment, Net
At December 31, 2023 and 2022, premises and equipment, net consisted of the following ($ in thousands):
|
|
December 31, |
|
|||||
|
|
2023 |
|
|
2022 |
|
||
Land |
|
$ |
|
|
$ |
|
||
Buildings and leasehold improvements |
|
|
|
|
|
|
||
Furniture and equipment |
|
|
|
|
|
|
||
Total cost of premises and equipment |
|
|
|
|
|
|
||
Less accumulated depreciation and amortization |
|
|
|
|
|
|
||
Premises and equipment, net |
|
|
|
|
|
|
||
Finance lease right-of-use assets |
|
|
|
|
|
|
||
Assets held for sale |
|
|
|
|
|
|
||
Total premises and equipment, net |
|
$ |
|
|
$ |
|
||
There were
Depreciation and amortization of premises and equipment totaled $
Note 6 – Mortgage Banking
MSR
The activity in the MSR is detailed in the table below for the periods presented ($ in thousands):
|
|
Years Ended December 31, |
|
|||||
|
|
2023 |
|
|
2022 |
|
||
Balance at beginning of period |
|
$ |
|
|
$ |
|
||
Origination of servicing assets |
|
|
|
|
|
|
||
Change in fair value: |
|
|
|
|
|
|
||
Due to market changes |
|
|
( |
) |
|
|
|
|
|
|
( |
) |
|
|
( |
) |
|
Balance at end of period |
|
$ |
|
|
$ |
|
||
Trustmark determines the fair value of the MSR using a valuation model administered by a third party that calculates the present value of estimated future net servicing income. Trustmark considers the conditional prepayment rate (CPR), which is an estimated loan prepayment rate that uses historical prepayment rates for previous loans similar to the loans being evaluated, the float rate, which is the interest rate earned on escrow balances, and the discount rate as some of the primary assumptions used in determining the fair value of the MSR. An increase in either the CPR or discount rate assumption will result in a decrease in the fair value of the MSR, while a decrease in either assumption will result in an increase in the fair value of the MSR. An increase in the float rate will result in an increase in the fair value of the MSR, while a decrease in the float rate will result in a decrease in the fair value of the MSR. At December 31, 2023, the fair value of the MSR included an assumed average prepayment speed of
Mortgage Loans Sold/Serviced
During 2023, 2022 and 2021, Trustmark sold $
112
are both recorded to noninterest income in mortgage banking, net in the accompanying consolidated statements of income. The investors and the securitization trusts have no recourse to the assets of Trustmark for failure of debtors to pay when due.
The table below details the mortgage loans sold and serviced for others at December 31, 2023 and 2022 ($ in thousands):
|
|
December 31, |
|
|||||
|
|
2023 |
|
|
2022 |
|
||
Federal National Mortgage Association |
|
$ |
|
|
$ |
|
||
Government National Mortgage Association |
|
|
|
|
|
|
||
Federal Home Loan Mortgage Corporation |
|
|
|
|
|
|
||
Other |
|
|
|
|
|
|
||
Total mortgage loans sold and serviced for others |
|
$ |
|
|
$ |
|
||
Trustmark is subject to losses in its loan servicing portfolio due to loan foreclosures. Trustmark has obligations to either repurchase the outstanding principal balance of a loan or make the purchaser whole for the economic benefits of a loan if it is determined that the loan sold was in violation of representations or warranties made by Trustmark at the time of the sale, herein referred to as mortgage loan servicing putback expenses. Such representations and warranties typically include those made regarding loans that had missing or insufficient file documentation, loans that do not meet investor guidelines, loans in which the appraisal does not support the value and/or loans obtained through fraud by the borrowers or other third parties. Generally, putback requests may be made until the loan is paid in full. However, mortgage loans delivered to Federal National Mortgage Association (FNMA) and Federal Home Loan Mortgage Corporation (FHLMC) on or after January 1, 2013 are subject to the Representations and Warranties Framework, which provides that FNMA and FHLMC will not exercise their remedies, including a putback request, for breaches of certain selling representations and warranties, such as payment history or quality control review.
When a putback request is received, Trustmark evaluates the request and takes appropriate actions based on the nature of the request. Trustmark is required by FNMA and FHLMC to provide a response to putback requests within
There is inherent uncertainty in reasonably estimating the requirement for reserves against potential future mortgage loan servicing putback expenses. Future putback expenses are dependent on many subjective factors, including the review procedures of the purchasers and the potential refinance activity on loans sold with servicing released and the subsequent consequences under the representations and warranties. Trustmark believes that it has appropriately reserved for potential mortgage loan servicing putback requests.
Note 7 – Goodwill and Identifiable Intangible Assets
Goodwill
The table below illustrates goodwill by segment for the years ended December 31, 2023 and 2022 ($ in thousands):
|
|
General |
|
|
|
|
|
|
|
|||
|
|
Banking |
|
|
Insurance |
|
|
Total |
|
|||
Balance as of January 1, 2022 |
|
$ |
|
|
$ |
|
|
$ |
|
|||
Adjustment during 2022 |
|
|
|
|
|
|
|
|
|
|||
Balance as of December 31, 2022 |
|
|
|
|
|
|
|
|
|
|||
Adjustment during 2023 |
|
|
|
|
|
|
|
|
|
|||
Balance as of December 31, 2023 |
|
$ |
|
|
$ |
|
|
$ |
|
|||
Trustmark’s General Banking Segment delivers a full range of banking services to consumer, corporate, small and middle-market businesses through its extensive branch network. The Insurance Segment includes TNB’s wholly-owned retail insurance subsidiary that offers a diverse mix of insurance products and services. Trustmark performed goodwill impairment tests for the General Banking and Insurance Segments during 2023, 2022 and 2021. Based on these tests, Trustmark concluded that the fair value of both the General Banking and Insurance Segments exceeded the book value and
113
Identifiable Intangible Assets
At December 31, 2023 and 2022, identifiable intangible assets consisted of the following ($ in thousands):
|
|
December 31, 2023 |
|
|
December 31, 2022 |
|
||||||||||||||||||
|
|
Gross Carrying |
|
|
Accumulated |
|
|
Net Carrying |
|
|
Gross Carrying |
|
|
Accumulated |
|
|
Net Carrying |
|
||||||
|
|
Amount |
|
|
Amortization |
|
|
Amount |
|
|
Amount |
|
|
Amortization |
|
|
Amount |
|
||||||
Core deposit intangibles |
|
$ |
|
|
$ |
|
|
$ |
|
|
$ |
|
|
$ |
|
|
$ |
|
||||||
Insurance intangibles |
|
|
|
|
|
|
|
|
|
|
|
|
|
|
|
|
|
|
||||||
Banking charters |
|
|
|
|
|
|
|
|
|
|
|
|
|
|
|
|
|
|
||||||
Total |
|
$ |
|
|
$ |
|
|
$ |
|
|
$ |
|
|
$ |
|
|
$ |
|
||||||
Trustmark recorded $
The following table illustrates the carrying amounts and remaining weighted-average amortization periods of identifiable intangible assets at December 31, 2023 ($ in thousands):
|
|
|
|
|
Remaining |
|
||
|
|
|
|
|
Weighted- |
|
||
|
|
|
|
|
Average |
|
||
|
|
Net Carrying |
|
|
Amortization |
|
||
|
|
Amount |
|
|
Period in Years |
|
||
Core deposit intangibles |
|
$ |
|
|
|
|
||
Insurance intangibles |
|
|
|
|
|
|
||
Total |
|
$ |
|
|
|
|
||
Note 8 – Other Real Estate
At December 31, 2023, Trustmark’s geographic other real estate distribution was primarily concentrated in its Alabama, Mississippi and Texas market regions. The ultimate recovery of a substantial portion of the carrying amount of other real estate is susceptible to changes in market conditions in this area.
For the periods presented, changes and gains (losses), net on other real estate were as follows ($ in thousands):
|
|
Years Ended December 31, |
|
|||||||||
|
|
2023 |
|
|
2022 |
|
|
2021 |
|
|||
Balance at beginning of period |
|
$ |
|
|
$ |
|
|
$ |
|
|||
Additions |
|
|
|
|
|
|
|
|
|
|||
Disposals |
|
|
( |
) |
|
|
( |
) |
|
|
( |
) |
(Write-downs) recoveries |
|
|
|
|
|
|
|
|
( |
) |
||
Balance at end of period |
|
$ |
|
|
$ |
|
|
$ |
|
|||
|
|
|
|
|
|
|
|
|
|
|||
Gains (losses), net on the sale of other real estate |
|
$ |
( |
) |
|
$ |
( |
) |
|
$ |
( |
) |
At December 31, 2023 and 2022, other real estate by type of property consisted of the following ($ in thousands):
|
|
December 31, |
|
|||||
|
|
2023 |
|
|
2022 |
|
||
1-4 family residential properties |
|
$ |
|
|
$ |
|
||
Nonfarm, nonresidential properties |
|
|
|
|
|
|
||
Other real estate properties |
|
|
|
|
|
|
||
Total other real estate |
|
$ |
|
|
$ |
|
||
114
At December 31, 2023 and 2022, other real estate by geographic location consisted of the following ($ in thousands):
|
|
December 31, |
|
|||||
|
|
2023 |
|
|
2022 |
|
||
Alabama |
|
$ |
|
|
$ |
|
||
Mississippi (1) |
|
|
|
|
|
|
||
Tennessee (2) |
|
|
|
|
|
|
||
Texas |
|
|
|
|
|
|
||
Total other real estate |
|
$ |
|
|
$ |
|
||
At December 31, 2023 and 2022, the balance of other real estate included $
Note 9 – Leases
Lessor Arrangements
Trustmark leases certain types of machinery and equipment to its customers through sales-type and direct financing leases as part of its equipment financing portfolio. These leases generally have remaining lease terms of to
The table below summarizes the components of Trustmark's net investment in its sales-type and direct financing leases at December 31, 2023 ($ in thousands):
|
|
December 31, 2023 |
|
|
Leases receivable |
|
$ |
|
|
Unearned income |
|
|
( |
) |
Initial direct costs |
|
|
|
|
Unguaranteed lease residual |
|
|
|
|
Total net investment |
|
$ |
|
|
The table below details the minimum future lease payments for Trustmark's leases receivable at December 31, 2023 ($ in thousands):
|
|
December 31, 2023 |
|
|
2024 |
|
$ |
|
|
2025 |
|
|
|
|
2026 |
|
|
|
|
2027 |
|
|
|
|
2028 |
|
|
|
|
Thereafter |
|
|
|
|
Total leases receivable |
|
$ |
|
|
115
Lessee Arrangements
The table below details the components of net lease cost for the periods presented ($ in thousands):
|
|
Years Ended December 31, |
|
|||||||||
|
|
2023 |
|
|
2022 |
|
|
2021 |
|
|||
Finance leases |
|
|
|
|
|
|
|
|
|
|||
Amortization of right-of-use assets |
|
$ |
|
|
$ |
|
|
$ |
|
|||
Interest on lease liabilities |
|
|
|
|
|
|
|
|
|
|||
Operating lease cost |
|
|
|
|
|
|
|
|
|
|||
Short-term lease cost |
|
|
|
|
|
|
|
|
|
|||
Variable lease cost |
|
|
|
|
|
|
|
|
|
|||
Sublease income |
|
|
( |
) |
|
|
( |
) |
|
|
( |
) |
Net lease cost |
|
$ |
|
|
$ |
|
|
$ |
|
|||
The table below details the cash payments included in the measurement of lease liabilities during the periods presented ($ in thousands):
|
|
Years Ended December 31, |
|
|||||||||
|
|
2023 |
|
|
2022 |
|
|
2021 |
|
|||
Finance leases |
|
|
|
|
|
|
|
|
|
|||
Operating cash flows included in operating activities |
|
$ |
|
|
$ |
|
|
$ |
|
|||
Financing cash flows included in payments under finance lease |
|
|
|
|
|
|
|
|
|
|||
Operating leases |
|
|
|
|
|
|
|
|
|
|||
Operating cash flows (fixed payments) included in other operating |
|
|
|
|
|
|
|
|
|
|||
Operating cash flows (liability reduction) included in other operating |
|
|
|
|
|
|
|
|
|
|||
The table below details balance sheet information, as well as weighted-average lease terms and discount rates, related to leases at December 31, 2023 and 2022 ($ in thousands):
|
|
December 31, |
|
|||||
|
|
2023 |
|
|
2022 |
|
||
|
$ |
|
|
$ |
|
|||
|
|
|
|
|
|
|||
Operating lease right-of-use assets |
|
|
|
|
|
|
||
Operating lease liabilities |
|
|
|
|
|
|
||
|
|
|
|
|
|
|
||
Weighted-average lease term |
|
|
|
|
|
|
||
Finance leases |
|
|
|
|
||||
Operating leases |
|
|
|
|
||||
|
|
|
|
|
|
|
||
Weighted-average discount rate |
|
|
|
|
|
|
||
Finance leases |
|
|
% |
|
|
% |
||
Operating leases |
|
|
% |
|
|
% |
||
At December 31, 2023, future minimum rental commitments under finance and operating leases were as follows ($ in thousands):
|
|
Finance Leases |
|
|
Operating Leases |
|
||
2024 |
|
$ |
|
|
$ |
|
||
2025 |
|
|
|
|
|
|
||
2026 |
|
|
|
|
|
|
||
2027 |
|
|
|
|
|
|
||
2028 |
|
|
|
|
|
|
||
Thereafter |
|
|
|
|
|
|
||
Total minimum lease payments |
|
|
|
|
|
|
||
Less imputed interest |
|
|
( |
) |
|
|
( |
) |
Lease liabilities |
|
$ |
|
|
$ |
|
||
116
Note 10 – Deposits
At December 31, 2023 and 2022, deposits consisted of the following ($ in thousands):
|
|
December 31, |
|
|||||
|
|
2023 |
|
|
2022 |
|
||
Noninterest-bearing demand |
|
$ |
|
|
$ |
|
||
Interest-bearing demand |
|
|
|
|
|
|
||
Savings |
|
|
|
|
|
|
||
Time |
|
|
|
|
|
|
||
Total |
|
$ |
|
|
$ |
|
||
Interest expense on deposits by type consisted of the following for the periods presented ($ in thousands):
|
|
Years Ended December 31, |
|
|||||||||
|
|
2023 |
|
|
2022 |
|
|
2021 |
|
|||
Interest-bearing demand |
|
$ |
|
|
$ |
|
|
$ |
|
|||
Savings |
|
|
|
|
|
|
|
|
|
|||
Time |
|
|
|
|
|
|
|
|
|
|||
Total |
|
$ |
|
|
$ |
|
|
$ |
|
|||
Time deposits that exceed the FDIC insurance limit of $250 thousand totaled $
The maturities of interest-bearing deposits at December 31, 2023, are as follows ($ in thousands):
2024 |
|
$ |
|
|
2025 |
|
|
|
|
2026 |
|
|
|
|
2027 |
|
|
|
|
2028 |
|
|
|
|
Thereafter |
|
|
|
|
Total time deposits |
|
|
|
|
Interest-bearing deposits with no stated maturity |
|
|
|
|
Total interest-bearing deposits |
|
$ |
|
Note 11 - Borrowings
Securities Sold Under Repurchase Agreements
Trustmark utilizes securities sold under repurchase agreements as a source of borrowing in connection with overnight repurchase agreements offered to commercial deposit customers by using its unencumbered investment securities as collateral. Trustmark accounts for its securities sold under repurchase agreements as secured borrowings in accordance with FASB ASC Subtopic 860-30, “Transfers and Servicing – Secured Borrowing and Collateral.” Securities sold under repurchase agreements are stated at the amount of cash received in connection with the transaction. Trustmark monitors collateral levels on a continual basis and may be required to provide additional collateral based on the fair value of the underlying securities. Securities sold under repurchase agreements are secured by securities with a carrying amount of $
117
The following table presents the securities sold under repurchase agreements by collateral pledged at December 31, 2023 and 2022 ($ in thousands):
|
|
December 31, |
|
|||||
|
|
2023 |
|
|
2022 |
|
||
Mortgage-backed securities |
|
|
|
|
|
|
||
Residential mortgage pass-through securities |
|
|
|
|
|
|
||
Issued by FNMA and FHLMC |
|
$ |
|
|
$ |
|
||
Other residential mortgage-backed securities |
|
|
|
|
|
|
||
Issued or guaranteed by FNMA, FHLMC or GNMA |
|
|
|
|
|
|
||
Commercial mortgage-backed securities |
|
|
|
|
|
|
||
Issued or guaranteed by FNMA, FHLMC or GNMA |
|
|
|
|
|
|
||
Total securities sold under repurchase agreements |
|
$ |
|
|
$ |
|
||
Other Borrowings
At December 31, 2023 and 2022, other borrowings consisted of the following ($ in thousands):
|
|
December 31, |
|
|||||
|
|
2023 |
|
|
2022 |
|
||
FHLB advances |
|
$ |
|
|
$ |
|
||
Serviced GNMA loans eligible for repurchase |
|
|
|
|
|
|
||
Finance lease liabilities |
|
|
|
|
|
|
||
Total other borrowings |
|
$ |
|
|
$ |
|
||
FHLB Advances
At both December 31, 2023 and 2022, Trustmark had
At both December 31, 2023 and 2022, Trustmark had
At December 31, 2023, Trustmark had
Trustmark incurred $
At December 31, 2023 and 2022, Trustmark had $
Subordinated Notes
During 2020, Trustmark agreed to issue and sell $
118
rate, which is the
Junior Subordinated Debt Securities
On August 18, 2006, Trustmark completed a private placement of $
The debentures were issued pursuant to a Junior Subordinated Indenture, dated August 18, 2006, between Trustmark, as issuer, and Wilmington Trust Company, National Association, as trustee. Like the trust preferred securities, the debentures bear interest at a variable rate per annum equal to the three-month CME SOFR plus a spread adjustment of
The debentures are subordinated to the prior payment of any other indebtedness of Trustmark that, by its terms, is not similarly subordinated. The trust preferred securities are recorded as a long-term liability on Trustmark’s balance sheet; however, for regulatory purposes the trust preferred securities are treated as Tier 1 capital under the rules of the Federal Reserve Board (FRB), Trustmark’s primary federal regulatory agency.
Trustmark also entered into a Guarantee Agreement, dated August 18, 2006, pursuant to which it has agreed to guarantee the payment by the Trust of distributions on the trust preferred securities and the payment of principal of the trust preferred securities when due, either at maturity or on redemption, but only if and to the extent that the Trust fails to pay distributions on or principal of the trust preferred securities after having received interest payments or principal payments on the junior subordinated debentures from Trustmark for the purpose of paying those distributions or the principal amount of the trust preferred securities.
As defined in applicable accounting standards, the Trust, a wholly-owned subsidiary of Trustmark, is considered a variable interest entity for which Trustmark is not the primary beneficiary. Accordingly, the accounts of the Trust are not included in Trustmark’s consolidated financial statements.
At both December 31, 2023 and 2022, assets for the Trust totaled $
119
Note 12 – Revenue from Contracts with Customers
The following table presents noninterest income disaggregated by reportable operating segment and revenue stream for the periods presented ($ in thousands):
|
|
Year Ended December 31, 2023 |
|
|
Year Ended December 31, 2022 |
|
|
Year Ended December 31, 2021 |
|
|||||||||||||||||||||||||||
|
|
Topic 606 |
|
|
Not Topic |
|
|
Total |
|
|
Topic 606 |
|
|
Not Topic |
|
|
Total |
|
|
Topic 606 |
|
|
Not Topic |
|
|
Total |
|
|||||||||
General Banking |
|
|
|
|
|
|
|
|
|
|
|
|
|
|
|
|
|
|
|
|
|
|
|
|
|
|
|
|||||||||
Service charges on |
|
$ |
|
|
$ |
— |
|
|
$ |
|
|
$ |
|
|
$ |
— |
|
|
$ |
|
|
$ |
|
|
$ |
— |
|
|
$ |
|
||||||
Bank card and other fees |
|
|
|
|
|
|
|
|
|
|
|
|
|
|
|
|
|
|
|
|
|
|
|
|
|
|
|
|||||||||
Mortgage banking, net |
|
|
— |
|
|
|
|
|
|
|
|
|
— |
|
|
|
|
|
|
|
|
|
— |
|
|
|
|
|
|
|
||||||
Wealth management |
|
|
|
|
|
— |
|
|
|
|
|
|
|
|
|
— |
|
|
|
|
|
|
|
|
|
— |
|
|
|
|
||||||
Other, net |
|
|
|
|
|
( |
) |
|
|
|
|
|
|
|
|
|
|
|
|
|
|
|
|
|
( |
) |
|
|
|
|||||||
Security gains (losses), |
|
|
— |
|
|
|
|
|
|
|
|
|
— |
|
|
|
— |
|
|
|
— |
|
|
|
— |
|
|
|
— |
|
|
|
— |
|
||
Total noninterest |
|
$ |
|
|
$ |
|
|
$ |
|
|
$ |
|
|
$ |
|
|
$ |
|
|
$ |
|
|
$ |
|
|
$ |
|
|||||||||
|
|
|
|
|
|
|
|
|
|
|
|
|
|
|
|
|
|
|
|
|
|
|
|
|
|
|
|
|||||||||
Wealth Management |
|
|
|
|
|
|
|
|
|
|
|
|
|
|
|
|
|
|
|
|
|
|
|
|
|
|
|
|||||||||
Service charges on |
|
$ |
|
|
$ |
— |
|
|
$ |
|
|
$ |
|
|
$ |
— |
|
|
$ |
|
|
$ |
|
|
$ |
— |
|
|
$ |
|
||||||
Bank card and other fees |
|
|
|
|
|
— |
|
|
|
|
|
|
|
|
|
— |
|
|
|
|
|
|
|
|
|
— |
|
|
|
|
||||||
Wealth management |
|
|
|
|
|
— |
|
|
|
|
|
|
|
|
|
— |
|
|
|
|
|
|
|
|
|
— |
|
|
|
|
||||||
Other, net |
|
|
|
|
|
|
|
|
|
|
|
|
|
|
|
|
|
|
|
|
|
|
|
|
|
|
|
|||||||||
Total noninterest |
|
$ |
|
|
$ |
|
|
$ |
|
|
$ |
|
|
$ |
|
|
$ |
|
|
$ |
|
|
$ |
|
|
$ |
|
|||||||||
|
|
|
|
|
|
|
|
|
|
|
|
|
|
|
|
|
|
|
|
|
|
|
|
|
|
|
|
|||||||||
Insurance Segment |
|
|
|
|
|
|
|
|
|
|
|
|
|
|
|
|
|
|
|
|
|
|
|
|
|
|
|
|||||||||
Insurance commissions |
|
$ |
|
|
$ |
— |
|
|
$ |
|
|
$ |
|
|
$ |
— |
|
|
$ |
|
|
$ |
|
|
$ |
— |
|
|
$ |
|
||||||
Other, net |
|
|
|
|
|
— |
|
|
|
|
|
|
|
|
|
— |
|
|
|
|
|
|
|
|
|
— |
|
|
|
|
||||||
Total noninterest |
|
$ |
|
|
$ |
|
|
$ |
|
|
$ |
|
|
$ |
|
|
$ |
|
|
$ |
|
|
$ |
|
|
$ |
|
|||||||||
|
|
|
|
|
|
|
|
|
|
|
|
|
|
|
|
|
|
|
|
|
|
|
|
|
|
|
|
|||||||||
Consolidated |
|
|
|
|
|
|
|
|
|
|
|
|
|
|
|
|
|
|
|
|
|
|
|
|
|
|
|
|||||||||
Service charges on |
|
$ |
|
|
$ |
— |
|
|
$ |
|
|
$ |
|
|
$ |
— |
|
|
$ |
|
|
$ |
|
|
$ |
— |
|
|
$ |
|
||||||
Bank card and other fees |
|
|
|
|
|
|
|
|
|
|
|
|
|
|
|
|
|
|
|
|
|
|
|
|
|
|
|
|||||||||
Mortgage banking, net |
|
|
— |
|
|
|
|
|
|
|
|
|
— |
|
|
|
|
|
|
|
|
|
— |
|
|
|
|
|
|
|
||||||
Insurance commissions |
|
|
|
|
|
— |
|
|
|
|
|
|
|
|
|
— |
|
|
|
|
|
|
|
|
|
— |
|
|
|
|
||||||
Wealth management |
|
|
|
|
|
— |
|
|
|
|
|
|
|
|
|
— |
|
|
|
|
|
|
|
|
|
— |
|
|
|
|
||||||
Other, net |
|
|
|
|
|
( |
) |
|
|
|
|
|
|
|
|
|
|
|
|
|
|
|
|
|
( |
) |
|
|
|
|||||||
Security gains (losses), |
|
|
— |
|
|
|
|
|
|
|
|
|
— |
|
|
|
— |
|
|
|
— |
|
|
|
— |
|
|
|
— |
|
|
|
— |
|
||
Total noninterest |
|
$ |
|
|
$ |
|
|
$ |
|
|
$ |
|
|
$ |
|
|
$ |
|
|
$ |
|
|
$ |
|
|
$ |
|
|||||||||
120
Note 13 – Income Taxes
The income tax provision included in the consolidated statements of income was as follows for the periods presented ($ in thousands):
|
|
Years Ended December 31, |
|
|||||||||
|
|
2023 |
|
|
2022 |
|
|
2021 |
|
|||
Current |
|
|
|
|
|
|
|
|
|
|||
Federal |
|
$ |
|
|
$ |
|
|
$ |
|
|||
State |
|
|
|
|
|
|
|
|
|
|||
Deferred |
|
|
|
|
|
|
|
|
|
|||
Federal |
|
|
( |
) |
|
|
( |
) |
|
|
|
|
State |
|
|
( |
) |
|
|
( |
) |
|
|
|
|
Income tax provision |
|
$ |
|
|
$ |
|
|
$ |
|
|||
For the periods presented, the income tax provision differs from the amount computed by applying the statutory federal income tax rate in effect for each respective period to income before income taxes as a result of the following ($ in thousands):
|
|
Years Ended December 31, |
|
|||||||||
|
|
2023 |
|
|
2022 |
|
|
2021 |
|
|||
Income tax computed at statutory tax rate |
|
$ |
|
|
$ |
|
|
$ |
|
|||
Tax exempt interest |
|
|
( |
) |
|
|
( |
) |
|
|
( |
) |
Nondeductible interest expense |
|
|
|
|
|
|
|
|
|
|||
State income taxes, net |
|
|
|
|
|
|
|
|
|
|||
Income tax credits, net |
|
|
( |
) |
|
|
( |
) |
|
|
( |
) |
Death benefit gains |
|
|
( |
) |
|
|
( |
) |
|
|
( |
) |
Other |
|
|
|
|
|
( |
) |
|
|
|
||
Income tax provision |
|
$ |
|
|
$ |
|
|
$ |
|
|||
Temporary differences between the financial statement carrying amounts and the tax basis of assets and liabilities gave rise to the following net deferred tax assets at December 31, 2023 and 2022, which are included in other assets on the accompanying consolidated balance sheets ($ in thousands):
|
|
December 31, |
|
|||||
|
|
2023 |
|
|
2022 |
|
||
Deferred tax assets: |
|
|
|
|
|
|
||
Litigation losses |
|
$ |
|
|
$ |
|
||
Other real estate |
|
|
|
|
|
|
||
Accumulated credit losses |
|
|
|
|
|
|
||
Deferred compensation |
|
|
|
|
|
|
||
Finance and operating lease liabilities |
|
|
|
|
|
|
||
Realized built-in losses |
|
|
|
|
|
|
||
Securities |
|
|
|
|
|
|
||
Pension and other postretirement benefit plans |
|
|
|
|
|
|
||
Interest on nonaccrual loans |
|
|
|
|
|
|
||
LHFS |
|
|
|
|
|
|
||
Stock-based compensation |
|
|
|
|
|
|
||
Derivatives |
|
|
|
|
|
|
||
Other |
|
|
|
|
|
|
||
Gross deferred tax asset |
|
|
|
|
|
|
||
|
|
|
|
|
|
|
||
Deferred tax liabilities: |
|
|
|
|
|
|
||
Goodwill and other identifiable intangibles |
|
|
|
|
|
|
||
Premises and equipment |
|
|
|
|
|
|
||
Finance and operating lease right-of-use assets |
|
|
|
|
|
|
||
MSR |
|
|
|
|
|
|
||
Securities |
|
|
|
|
|
|
||
Other |
|
|
|
|
|
|
||
Gross deferred tax liability |
|
|
|
|
|
|
||
Net deferred tax asset |
|
$ |
|
|
$ |
|
||
121
The following table provides a summary of the changes during the calendar years presented in the amount of unrecognized tax benefits that are included in other liabilities in the consolidated balance sheet ($ in thousands):
|
|
December 31, |
|
|||||||||
|
|
2023 |
|
|
2022 |
|
|
2021 |
|
|||
Balance at beginning of period |
|
$ |
|
|
$ |
|
|
$ |
|
|||
Change due to tax positions taken during the current year |
|
|
|
|
|
|
|
|
|
|||
Change due to tax positions taken during a prior year |
|
|
( |
) |
|
|
( |
) |
|
|
|
|
Change due to the lapse of applicable statute of limitations during the |
|
|
( |
) |
|
|
( |
) |
|
|
( |
) |
Balance at end of period |
|
$ |
|
|
$ |
|
|
$ |
|
|||
|
|
|
|
|
|
|
|
|
|
|||
Accrued interest, net of federal benefit |
|
$ |
|
|
$ |
|
|
$ |
|
|||
|
|
|
|
|
|
|
|
|
|
|||
Unrecognized tax benefits that would impact the effective |
|
$ |
|
|
$ |
|
|
$ |
|
|||
Interest and penalties related to unrecognized tax benefits, if any, are recorded in income tax expense. With limited exception, Trustmark is no longer subject to U.S. federal, state and local audits by tax authorities for 2017 and earlier tax years. Trustmark does not anticipate a significant change to the total amount of unrecognized tax benefits within the next twelve months.
Note 14 – Defined Benefit and Other Postretirement Benefits
Qualified Pension Plan
Trustmark maintains a noncontributory tax-qualified defined benefit pension plan titled the Trustmark Corporation Pension Plan for Certain Employees of Acquired Financial Institutions (the Continuing Plan) to satisfy commitments made by Trustmark to associates covered through plans obtained in acquisitions.
122
The following tables present information regarding the benefit obligation, plan assets, funded status, amounts recognized in accumulated other comprehensive loss, net periodic benefit cost and other statistical disclosures for the Continuing Plan for the periods presented ($ in thousands):
|
|
December 31, |
|
|||||
|
|
2023 |
|
|
2022 |
|
||
Change in benefit obligation: |
|
|
|
|
|
|
||
Benefit obligation, beginning of year |
|
$ |
|
|
$ |
|
||
Service cost |
|
|
|
|
|
|
||
Interest cost |
|
|
|
|
|
|
||
Actuarial (gain) loss |
|
|
|
|
|
( |
) |
|
Benefits paid |
|
|
( |
) |
|
|
( |
) |
Benefit obligation, end of year |
|
$ |
|
|
$ |
|
||
|
|
|
|
|
|
|
||
Change in plan assets: |
|
|
|
|
|
|
||
Fair value of plan assets, beginning of year |
|
$ |
|
|
$ |
|
||
Actual return on plan assets |
|
|
|
|
|
( |
) |
|
Employer contributions |
|
|
|
|
|
|
||
Benefit payments |
|
|
( |
) |
|
|
( |
) |
Fair value of plan assets, end of year |
|
$ |
|
|
$ |
|
||
|
|
|
|
|
|
|
||
Funded status at end of year - net liability |
|
$ |
( |
) |
|
$ |
( |
) |
|
|
|
|
|
|
|
||
Amounts recognized in accumulated other comprehensive loss: |
|
|
|
|
|
|
||
Net (gain) loss - amount recognized |
|
$ |
( |
) |
|
$ |
( |
) |
|
|
|
|
|
|
|
||
Actuarial (gain) loss included in benefit obligation: |
|
|
|
|
|
|
||
Change in discount rate |
|
$ |
|
|
$ |
( |
) |
|
Change in mortality table |
|
|
( |
) |
|
|
|
|
Other |
|
|
|
|
|
|
||
Actuarial (gain) loss |
|
$ |
|
|
$ |
( |
) |
|
|
|
Years Ended December 31, |
|
|||||||||
|
|
2023 |
|
|
2022 |
|
|
2021 |
|
|||
Net periodic benefit cost: |
|
|
|
|
|
|
|
|
|
|||
Service cost |
|
$ |
|
|
$ |
|
|
$ |
|
|||
Interest cost |
|
|
|
|
|
|
|
|
|
|||
|
|
( |
) |
|
|
( |
) |
|
|
( |
) |
|
|
|
|
|
|
|
|
|
|
||||
|
|
|
|
|
|
|
|
|
||||
Net periodic benefit cost |
|
$ |
|
|
$ |
|
|
$ |
|
|||
|
|
|
|
|
|
|
|
|
|
|||
Other changes in plan assets and benefit obligation recognized in other |
|
|
|
|
|
|
|
|
|
|||
Net loss - Total recognized in other comprehensive income (loss) |
|
$ |
|
|
$ |
( |
) |
|
$ |
( |
) |
|
Total recognized in net periodic benefit cost and other comprehensive |
|
$ |
|
|
$ |
( |
) |
|
$ |
( |
) |
|
|
|
|
|
|
|
|
|
|
|
|||
Weighted-average assumptions as of end of year: |
|
|
|
|
|
|
|
|
|
|||
Discount rate for benefit obligation |
|
|
% |
|
|
% |
|
|
% |
|||
Discount rate for net periodic benefit cost |
|
|
% |
|
|
% |
|
|
% |
|||
Expected long-term return on plan assets |
|
|
% |
|
|
% |
|
|
% |
|||
123
Plan Assets
The weighted-average asset allocations by asset category are presented below for the Continuing Plan at December 31, 2023 and 2022.
|
|
December 31, |
|
|||||
|
|
2023 |
|
|
2022 |
|
||
Money market fund |
|
|
% |
|
|
% |
||
Exchange traded funds: |
|
|
|
|
|
|
||
Equity securities |
|
|
% |
|
|
% |
||
Fixed income |
|
|
% |
|
|
% |
||
International |
|
|
% |
|
|
% |
||
Total |
|
|
% |
|
|
% |
||
The strategic objective of the investments of the assets in the Continuing Plan aims to provide long-term capital growth with moderate income. The allocation is managed on a total return basis with the average participant age in mind. It is constructed with an intermediate investment time frame with a moderate to high risk tolerance or a long-term investment time frame with a low to moderate risk tolerance. The plan allocation is typically balanced between equity and fixed income. The equity exposure has the potential to earn a return greater than inflation while the fixed income exposure may reduce the risk and volatility of the portfolio to which the equity allocation contributes.
Fair Value Measurements
At this time, Trustmark presents no fair values that are derived through internal modeling. Should positions requiring fair valuation arise that are not relevant to existing methodologies, Trustmark will make every reasonable effort to obtain market participant assumptions, or independent evaluation.
The following tables set forth by level, within the fair value hierarchy, the Continuing Plan’s assets measured at fair value at December 31, 2023 and 2022 ($ in thousands):
|
|
December 31, 2023 |
|
|||||||||||||
|
|
Total |
|
|
Level 1 |
|
|
Level 2 |
|
|
Level 3 |
|
||||
Money market fund |
|
$ |
|
|
$ |
|
|
$ |
— |
|
|
$ |
— |
|
||
Exchange traded funds: |
|
|
|
|
|
|
|
|
|
|
|
|
||||
Equity securities |
|
|
|
|
|
|
|
|
— |
|
|
|
— |
|
||
Fixed income |
|
|
|
|
|
|
|
|
— |
|
|
|
— |
|
||
International |
|
|
|
|
|
|
|
|
— |
|
|
|
— |
|
||
Total assets at fair value |
|
$ |
|
|
$ |
|
|
$ |
— |
|
|
$ |
— |
|
||
|
|
December 31, 2022 |
|
|||||||||||||
|
|
Total |
|
|
Level 1 |
|
|
Level 2 |
|
|
Level 3 |
|
||||
Money market fund |
|
$ |
|
|
$ |
|
|
$ |
— |
|
|
$ |
— |
|
||
Exchange traded funds: |
|
|
|
|
|
|
|
|
|
|
|
|
||||
Equity securities |
|
|
|
|
|
|
|
|
— |
|
|
|
— |
|
||
Fixed income |
|
|
|
|
|
|
|
|
— |
|
|
|
— |
|
||
International |
|
|
|
|
|
|
|
|
— |
|
|
|
— |
|
||
Total assets at fair value |
|
$ |
|
|
$ |
|
|
$ |
— |
|
|
$ |
— |
|
||
There have been no changes in the methodologies used in estimating the fair value of plan assets at December 31, 2023. The money market fund approximates fair value due to its immediate maturity.
The preceding methods described may produce a fair value calculation that may not be indicative of net realizable value or reflective of future fair values. Furthermore, although Trustmark believes their valuation methods are appropriate and consistent with other market participants, the use of different methodologies or assumptions to determine the fair value of certain financial instruments could result in a different fair value measurement at the reporting date.
Contributions
The range of potential contributions to the Continuing Plan is determined annually by the Continuing Plan’s actuary in accordance with applicable IRS rules and regulations. Trustmark’s policy is to fund amounts that are sufficient to satisfy the annual minimum funding requirements and do not exceed the maximum that is deductible for federal income tax purposes. The actual amount of the contribution is determined annually based on the Continuing Plan’s funded status and return on plan assets as of the measurement date, which is
124
December 31. For the plan year ending December 31, 2023, Trustmark’s minimum required contribution to the Continuing Plan was $
Estimated Future Benefit Payments and Other Disclosures
The following table presents the expected benefit payments, which reflect expected future service, for the Continuing Plan ($ in thousands):
Year |
|
Amount |
|
|
2024 |
|
$ |
|
|
2025 |
|
|
|
|
2026 |
|
|
|
|
2027 |
|
|
|
|
2028 |
|
|
|
|
2029 - 2033 |
|
|
|
|
No net gain or loss is expected to be recognized as components of net periodic benefit cost during 2024 in accumulated other comprehensive income (loss).
Supplemental Retirement Plans
Trustmark maintains a nonqualified supplemental retirement plan covering key executive officers and senior officers as well as directors who have elected to defer fees. The plan provides for retirement and/or death benefits based on a participant’s covered salary or deferred fees. Although plan benefits may be paid from Trustmark’s general assets, Trustmark has purchased life insurance contracts on the participants covered under the plan, which may be used to fund future benefit payments under the plan. The annual measurement date for the plan is December 31. As a result of mergers prior to 2014, Trustmark became the administrator of nonqualified supplemental retirement plans, for which the plan benefits were frozen prior to the merger date.
125
The following tables present information regarding the benefit obligation, plan assets, funded status, amounts recognized in accumulated other comprehensive loss, net periodic benefit cost and other statistical disclosures for Trustmark’s nonqualified supplemental retirement plans for the periods presented ($ in thousands):
|
|
December 31, |
|
|||||
|
|
2023 |
|
|
2022 |
|
||
Change in benefit obligation: |
|
|
|
|
|
|
||
Benefit obligation, beginning of year |
|
$ |
|
|
$ |
|
||
Service cost |
|
|
|
|
|
|
||
Interest cost |
|
|
|
|
|
|
||
Actuarial (gain) loss |
|
|
|
|
|
( |
) |
|
Benefits paid |
|
|
( |
) |
|
|
( |
) |
Benefit obligation, end of year |
|
$ |
|
|
$ |
|
||
Change in plan assets: |
|
|
|
|
|
|
||
Fair value of plan assets, beginning of year |
|
$ |
— |
|
|
$ |
— |
|
Employer contributions |
|
|
|
|
|
|
||
Benefit payments |
|
|
( |
) |
|
|
( |
) |
Fair value of plan assets, end of year |
|
$ |
— |
|
|
$ |
— |
|
|
|
|
|
|
|
|
||
Funded status at end of year - net liability |
|
$ |
( |
) |
|
$ |
( |
) |
|
|
|
|
|
|
|
||
Amounts recognized in accumulated other comprehensive loss: |
|
|
|
|
|
|
||
Net loss |
|
$ |
|
|
$ |
|
||
Prior service cost |
|
|
|
|
|
|
||
Amounts recognized |
|
$ |
|
|
$ |
|
||
|
|
|
|
|
|
|
||
Actuarial (gain) loss included in benefit obligation: |
|
|
|
|
|
|
||
Change in discount rate |
|
$ |
|
|
$ |
( |
) |
|
Change in mortality table |
|
|
( |
) |
|
|
|
|
Other |
|
|
|
|
|
|
||
Actuarial (gain) loss |
|
$ |
|
|
$ |
( |
) |
|
|
|
Years Ended December 31, |
|
|||||||||
|
|
2023 |
|
|
2022 |
|
|
2021 |
|
|||
Net periodic benefit cost: |
|
|
|
|
|
|
|
|
|
|||
Service cost |
|
$ |
|
|
$ |
|
|
$ |
|
|||
Interest cost |
|
|
|
|
|
|
|
|
|
|||
Amortization of prior service cost |
|
|
|
|
|
|
|
|
|
|||
|
|
|
|
|
|
|
|
|
||||
Net periodic benefit cost |
|
$ |
|
|
$ |
|
|
$ |
|
|||
|
|
|
|
|
|
|
|
|
|
|||
Other changes in plan assets and benefit obligation recognized in other |
|
|
|
|
|
|
|
|
|
|||
Net (gain) loss |
|
$ |
|
|
$ |
( |
) |
|
$ |
( |
) |
|
Amortization of prior service cost |
|
|
( |
) |
|
|
( |
) |
|
|
( |
) |
Total recognized in other comprehensive income (loss) |
|
$ |
|
|
$ |
( |
) |
|
$ |
( |
) |
|
Total recognized in net periodic benefit cost and other comprehensive |
|
$ |
|
|
$ |
( |
) |
|
$ |
( |
) |
|
|
|
|
|
|
|
|
|
|
|
|||
Weighted-average assumptions as of end of year: |
|
|
|
|
|
|
|
|
|
|||
Discount rate for benefit obligation |
|
|
% |
|
|
% |
|
|
% |
|||
Discount rate for net periodic benefit cost |
|
|
% |
|
|
% |
|
|
% |
|||
126
Estimated Supplemental Retirement Plan Payments and Other Disclosures
The following table presents the expected benefits payments for Trustmark’s supplemental retirement plans ($ in thousands):
Year |
|
Amount |
|
|
2024 |
|
$ |
|
|
2025 |
|
|
|
|
2026 |
|
|
|
|
2027 |
|
|
|
|
2028 |
|
|
|
|
2029 - 2033 |
|
|
|
|
Amounts in accumulated other comprehensive income (loss) expected to be recognized as components of net periodic benefit cost during 2024 include a loss of $
Other Benefit Plans
Defined Contribution Plan
Trustmark provides associates with a self-directed 401(k) retirement plan that allows associates to contribute a percentage of eligible compensation, within limits provided by the Internal Revenue Code and accompanying regulations, into the plan. Trustmark matches
Note 15 – Stock and Incentive Compensation Plans
Trustmark has granted restricted stock units subject to the provisions of the Stock and Incentive Compensation Plan (the Stock Plan). Current outstanding and future grants of restricted stock units are subject to the provisions of the Stock Plan, which is designed to provide flexibility to Trustmark regarding its ability to motivate, attract and retain the services of key associates and directors. The Stock Plan also allows Trustmark to grant nonqualified stock options, incentive stock options, stock appreciation rights, restricted stock, restricted stock units and performance units to key associates and directors. At December 31, 2023, the maximum number of shares of Trustmark’s common stock available for issuance under the Stock Plan was
Restricted Stock Grants
Performance Units
Trustmark’s performance units vest over
The following table summarizes Trustmark’s performance unit activity for the periods presented:
|
|
Years Ended December 31, |
|
|||||||||||||||||||||
|
|
2023 |
|
|
2022 |
|
|
2021 |
|
|||||||||||||||
|
|
|
|
|
Weighted- |
|
|
|
|
|
Weighted- |
|
|
|
|
|
Weighted- |
|
||||||
|
|
|
|
|
Average |
|
|
|
|
|
Average |
|
|
|
|
|
Average |
|
||||||
|
|
|
|
|
Grant-Date |
|
|
|
|
|
Grant-Date |
|
|
|
|
|
Grant-Date |
|
||||||
|
|
Shares |
|
|
Fair Value |
|
|
Shares |
|
|
Fair Value |
|
|
Shares |
|
|
Fair Value |
|
||||||
Nonvested shares, beginning of year |
|
|
|
|
$ |
|
|
|
|
|
$ |
|
|
|
|
|
$ |
|
||||||
Granted |
|
|
|
|
|
|
|
|
|
|
|
|
|
|
|
|
|
|
||||||
Released from restriction |
|
|
( |
) |
|
|
|
|
|
( |
) |
|
|
|
|
|
( |
) |
|
|
|
|||
Forfeited |
|
|
( |
) |
|
|
|
|
|
( |
) |
|
|
|
|
|
( |
) |
|
|
|
|||
Nonvested shares, end of year |
|
|
|
|
$ |
|
|
|
|
|
$ |
|
|
|
|
|
$ |
|
||||||
127
Time-based Units
Trustmark’s time-based units granted to Trustmark’s executive and senior management teams vest over
The following table summarizes Trustmark’s time-based unit activity for the periods presented:
|
|
Years Ended December 31, |
|
|||||||||||||||||||||
|
|
2023 |
|
|
2022 |
|
|
2021 |
|
|||||||||||||||
|
|
|
|
|
Weighted- |
|
|
|
|
|
Weighted- |
|
|
|
|
|
Weighted- |
|
||||||
|
|
|
|
|
Average |
|
|
|
|
|
Average |
|
|
|
|
|
Average |
|
||||||
|
|
|
|
|
Grant-Date |
|
|
|
|
|
Grant-Date |
|
|
|
|
|
Grant-Date |
|
||||||
|
|
Shares |
|
|
Fair Value |
|
|
Shares |
|
|
Fair Value |
|
|
Shares |
|
|
Fair Value |
|
||||||
Nonvested shares, beginning of year |
|
|
|
|
$ |
|
|
|
|
|
$ |
|
|
|
|
|
$ |
|
||||||
Granted |
|
|
|
|
|
|
|
|
|
|
|
|
|
|
|
|
|
|
||||||
Released from restriction |
|
|
( |
) |
|
|
|
|
|
( |
) |
|
|
|
|
|
( |
) |
|
|
|
|||
Forfeited |
|
|
( |
) |
|
|
|
|
|
( |
) |
|
|
|
|
|
( |
) |
|
|
|
|||
Nonvested shares, end of year |
|
|
|
|
$ |
|
|
|
|
|
$ |
|
|
|
|
|
$ |
|
||||||
The following table presents information regarding compensation expense for units under the Stock Plan for the periods presented ($ in thousands):
|
|
|
|
|
|
|
|
|
|
|
At December 31, 2023 |
|
||||||||
|
|
Recognized Compensation Expense |
|
|
Unrecognized |
|
|
Weighted Average |
|
|||||||||||
|
|
for Years Ended December 31, |
|
|
Compensation |
|
|
Life of Unrecognized |
|
|||||||||||
|
|
2023 |
|
|
2022 |
|
|
2021 |
|
|
Expense |
|
|
Compensation Expense |
|
|||||
Performance awards |
|
$ |
|
|
$ |
|
|
$ |
|
|
$ |
|
|
|
|
|||||
Time-based awards |
|
|
|
|
|
|
|
|
|
|
|
|
|
|
|
|||||
Total |
|
$ |
|
|
$ |
|
|
$ |
|
|
$ |
|
|
|
|
|||||
Note 16 – Commitments and Contingencies
Lending Related
Trustmark makes commitments to extend credit and issues standby and commercial letters of credit (letters of credit) in the normal course of business in order to fulfill the financing needs of its customers. The carrying amount of commitments to extend credit and letters of credit approximates the fair value of such financial instruments.
Commitments to extend credit are agreements to lend money to customers pursuant to certain specified conditions. Commitments generally have fixed expiration dates or other termination clauses. Because many of these commitments are expected to expire without being fully drawn upon, the total commitment amounts do not necessarily represent future cash requirements. The exposure to credit loss in the event of nonperformance by the other party to the commitments to extend credit is represented by the contract amount of those instruments. Trustmark applies the same credit policies and standards as it does in the lending process when making these commitments. The collateral obtained is based upon the nature of the transaction and the assessed creditworthiness of the borrower. At December 31, 2023 and 2022, Trustmark had unused commitments to extend credit of $
Letters of credit are conditional commitments issued by Trustmark to insure the performance of a customer to a third-party. A financial standby letter of credit irrevocably obligates Trustmark to pay a third-party beneficiary when a customer fails to repay an outstanding loan or debt instrument. A performance standby letter of credit irrevocably obligates Trustmark to pay a third-party beneficiary when a customer fails to perform some contractual, nonfinancial obligation. When issuing letters of credit, Trustmark uses the same policies regarding credit risk and collateral, which are followed in the lending process. At December 31, 2023 and 2022, Trustmark’s maximum exposure to credit loss in the event of nonperformance by the other party for letters of credit was $
128
ACL on Off-Balance Sheet Credit Exposures
Trustmark maintains a separate ACL on off-balance sheet credit exposures, including unfunded loan commitments and letters of credit, which is included on the accompanying consolidated balance sheets.
Changes in the ACL on off-balance sheet credit exposures were as follows for the periods presented ($ in thousands):
|
|
Years Ended December 31, |
|
|||||||||
|
|
2023 |
|
|
2022 |
|
|
2021 |
|
|||
Balance at beginning of period |
|
$ |
|
|
$ |
|
|
$ |
|
|||
PCL, off-balance sheet credit exposures |
|
|
( |
) |
|
|
|
|
|
( |
) |
|
Balance at end of period |
|
$ |
|
|
$ |
|
|
$ |
|
|||
Adjustments to the ACL on off-balance sheet credit exposures are recorded to PCL, off-balance sheet credit exposures. The decrease in the ACL on off-balance sheet credit exposures for the year ended December 31, 2023 was primarily due to decreases in unfunded commitments for the construction, land development and other land portfolio and other construction loan portfolio. The increase in the ACL on off-balance sheet credit exposures for the year ended December 31, 2022 was primarily due to the overall increase in the total reserve rates applied to off-balance sheet credit exposures as a result of the weakening in the macroeconomic forecasts and an increase in unfunded balances.
Legal Proceedings
As previously announced, on December 31, 2022, Trustmark National Bank (TNB) agreed to a settlement in principle (the Stanford Settlement) relating to litigation involving the Stanford Financial Group. On January 13, 2023, TNB entered into a Settlement Agreement (the Stanford Settlement Agreement) reflecting the terms of the Stanford Settlement. The parties to the Stanford Settlement Agreement are, on the one hand, (i) Ralph S. Janvey, solely in his capacity as the court-appointed receiver (the Stanford Receiver) for the Stanford Receivership Estate; (ii) the Official Stanford Investors Committee; (iii) each of the plaintiffs in the Rotstain and Smith Actions; and, on the other hand, (iv) TNB. Under the terms of the Stanford Settlement Agreement, the parties agreed to settle and dismiss the Rotstain Action, the Smith Action, and all current or future claims by plaintiffs in either such Action arising from or related to Stanford. In addition, the Stanford Settlement Agreement provided that the parties would request dismissal of the Jackson Action pursuant to the terms of the bar orders described below. The Court’s approval of the Stanford Settlement Agreement, including the bar orders described below, has occurred and has been upheld on appeal, as described below. As a result, pursuant to the Stanford Settlement, TNB made a one-time cash payment of $
The Stanford Settlement Agreement included the parties’ agreement to seek the Northern District of Texas District Court’s entry of bar orders prohibiting any continued or future claims by the plaintiffs in the Actions or by any other person or entity against TNB and its related parties relating to Stanford, whether asserted to date or not. The bar orders prohibit all litigation relating to Stanford described herein, including not only the Actions and any pending matters but also any actions that may be brought in the future. Final Court approval of these bar orders was a condition of the Stanford Settlement.
The Stanford Settlement Agreement was also subject to notice to Stanford’s investor claimants (which has been provided) and final, non-appealable approval by the U.S. District Court for the Northern District of Texas (which has occurred).
The Stanford Settlement Agreement also provides that TNB denies and makes no admission of liability or wrongdoing in connection with any Stanford matter. As has been the case throughout the pendency of the Actions, TNB expressly denies any liability or wrongdoing with respect to any matter alleged in regard to the multi-billion dollar Ponzi scheme operated by Stanford for almost 20 years. TNB’s relationship with Stanford began as a result of TNB’s acquisition of a Houston-based bank in August 2006, and consisted of ordinary banking services provided to business deposit customers.
The foregoing description of the terms of the Stanford Settlement Agreement does not purport to be complete and is qualified in its entirety by reference to the full text of the Stanford Settlement Agreement, a copy of which is filed as Exhibit 10.ai to the 2022 Annual Report and is incorporated herein by reference.
On January 20, 2023, the U.S. District Court for the Northern District of Texas entered an order preliminarily finding that the Stanford Settlement is fair, reasonable, and equitable; has no obvious deficiencies; and is the product of serious, informed, good faith, and arm’s-length negotiations. Following the provision of notice as required by the Stanford Settlement Agreement and by the Court’s preliminary order, the Court (Judge David C. Godbey, presiding) held a Final Approval Hearing on May 3, 2023, at which the Court approved the Stanford Settlement from the bench. On May 4, 2023, Judge Godbey signed the written orders confirming his oral ruling, including the bar order contemplated by the Stanford Settlement Agreement and the judgment and bar order with respect to the Jackson Action.
129
On May 10, 2023, Robert Allen Stanford, writing from prison, appealed the District Court’s approval of the Stanford Settlement to the Fifth Circuit Court of Appeals. On June 12, 2023, the Stanford Receiver moved to dismiss the appeal as frivolous. On July 25, 2023, a three-judge panel of the Fifth Circuit issued a per curiam order dismissing Stanford’s appeal as frivolous. In July and August 2023, Mr. Stanford filed, then subsequently withdrew, a motion seeking panel rehearing of the Fifth Circuit’s July 25, 2023, decision.
When Stanford’s deadline to appeal the Fifth Circuit’s ruling to the Supreme Court of the United States passed without his filing a petition for certiorari, the trial court’s ruling approving the Stanford Settlement and entering the bar orders became final and non-appealable, as defined in the Stanford Settlement Agreement (the Stanford Settlement Effective Date). On November 14, the parties to the Rotstain and Smith Actions filed agreed dismissals of those cases, which were granted on November 27, 2023 (Smith Action) and December 18, 2023 (Rotstain Action). Those dismissals were final and non-appealable as of December 27, 2023 (Smith Action) and January 17, 2024 (Rotstain Action). Accordingly, pursuant to the Stanford Settlement Agreement, TNB made the settlement payment on February 2, 2024, concluding the Stanford Settlement.
TNB and Trustmark Corporation determined that it was in the best interest of TNB, Trustmark Corporation and the shareholders of Trustmark Corporation to enter into the Stanford Settlement and the Stanford Settlement Agreement to eliminate the risk, ongoing expense, uncertainty as to ultimate outcome, and imposition on management and the business of TNB of further litigation of the Actions and related Stanford claims.
As previously announced, on August 30, 2023, TNB agreed to a settlement in principle (the Adams/Madison Timber Settlement) relating to litigation and claims involving Arthur Lamar Adams and Madison Timber Properties, LLC (collectively, Adams/Madison Timber). On October 9, 2023, TNB entered into a Settlement Agreement (the Adams/Madison Timber Settlement Agreement) reflecting the terms of the Adams/Madison Timber Settlement. The parties to the Adams/Madison Timber Settlement are, on the one hand, Alysson Mills in her capacity as Court-appointed Receiver (the Adams/Madison Timber Receiver); and, on the other hand, TNB. Under the terms of the Adams/Madison Timber Settlement Agreement, the parties agreed to settle and dismiss the Adams/Madison Timber Action, and the Adams/Madison Timber Receiver agreed to fully release all claims against TNB and any of its employees, agents and representatives. The Adams/Madison Timber Settlement included the parties’ agreement to seek the Court’s entry of bar orders prohibiting any continued or future claims by anyone against TNB and its related parties relating to Adams/Madison Timber, whether asserted to date or not. Final Court approval of a bar order was a condition of the Adams/Madison Timber Settlement. On November 14, 2023, the Court entered a Partial Final Judgment and Final Bar Order approving the settlement. The bar order therefore is expected to prohibit all litigation relating to Adams/Madison Timber described herein.
The Adams/Madison Timber Settlement was subject to notice to Adams/Madison Timber investors, and final, non-appealable approval by the Court and entry of a judgment dismissing the Lawsuit against TNB. No investor or other interested parties appealed the bar order before the appeal deadline passed. Accordingly, TNB made the settlement payment to the Adams/Madison Timber Receiver on January 22, 2024, concluding the Adams/Madison Timber Settlement.
Trustmark and its subsidiaries are also parties to other lawsuits and other claims that arise in the ordinary course of business. Some of the lawsuits assert claims related to the lending, collection, servicing, investment, trust and other business activities, and some of the lawsuits allege substantial claims for damages.
All pending legal proceedings described above are being vigorously contested, with the exception of the TD Bank Declaratory Action that, as noted above, TNB was not served in connection with. In accordance with FASB ASC Subtopic 450-20, “Loss Contingencies,” TNB will establish an accrued liability for any litigation matter if and when such matter presents loss contingencies that are both probable and reasonably estimable. As a result of the entry into the Stanford Settlement as described above, Trustmark Corporation recognized a $
Note 17 – Shareholders’ Equity
Regulatory Capital
Trustmark and TNB are subject to minimum risk-based capital and leverage capital requirements, as described in the section captioned “Capital Adequacy” included in Part I. Item 1. – Business of this report, which are administered by the federal bank regulatory agencies. These capital requirements, as defined by federal regulations, involve quantitative and qualitative measures of assets, liabilities and
130
certain off-balance sheet instruments. Trustmark’s and TNB’s minimum risk-based capital requirements include a capital conservation buffer of
The following table provides Trustmark’s and TNB’s actual regulatory capital amounts and ratios under regulatory capital standards in effect at December 31, 2023 and 2022 ($ in thousands):
|
|
Actual |
|
|
|
|
|
|
|
|||||||
|
|
Regulatory Capital |
|
|
Minimum |
|
|
To Be Well |
|
|||||||
|
|
Amount |
|
|
Ratio |
|
|
Requirement |
|
|
Capitalized |
|
||||
At December 31, 2023: |
|
|
|
|
|
|
|
|
|
|
|
|
||||
Common Equity Tier 1 Capital (to Risk Weighted Assets) |
|
|
|
|
|
|
|
|
|
|
|
|
||||
Trustmark Corporation |
|
$ |
|
|
|
% |
|
|
% |
|
|
|||||
Trustmark National Bank |
|
|
|
|
|
% |
|
|
% |
|
|
% |
||||
|
|
|
|
|
|
|
|
|
|
|
|
|
||||
Tier 1 Capital (to Risk Weighted Assets) |
|
|
|
|
|
|
|
|
|
|
|
|
||||
Trustmark Corporation |
|
$ |
|
|
|
% |
|
|
% |
|
|
|||||
Trustmark National Bank |
|
|
|
|
|
% |
|
|
% |
|
|
% |
||||
|
|
|
|
|
|
|
|
|
|
|
|
|
||||
Total Capital (to Risk Weighted Assets) |
|
|
|
|
|
|
|
|
|
|
|
|
||||
Trustmark Corporation |
|
$ |
|
|
|
% |
|
|
% |
|
|
|||||
Trustmark National Bank |
|
|
|
|
|
% |
|
|
% |
|
|
% |
||||
|
|
|
|
|
|
|
|
|
|
|
|
|
||||
Tier 1 Leverage (to Average Assets) |
|
|
|
|
|
|
|
|
|
|
|
|
||||
Trustmark Corporation |
|
$ |
|
|
|
% |
|
|
% |
|
|
|||||
Trustmark National Bank |
|
|
|
|
|
% |
|
|
% |
|
|
% |
||||
|
|
|
|
|
|
|
|
|
|
|
|
|
||||
At December 31, 2022: |
|
|
|
|
|
|
|
|
|
|
|
|
||||
Common Equity Tier 1 Capital (to Risk Weighted Assets) |
|
|
|
|
|
|
|
|
|
|
|
|
||||
Trustmark Corporation |
|
$ |
|
|
|
% |
|
|
% |
|
|
|||||
Trustmark National Bank |
|
|
|
|
|
% |
|
|
% |
|
|
% |
||||
|
|
|
|
|
|
|
|
|
|
|
|
|
||||
Tier 1 Capital (to Risk Weighted Assets) |
|
|
|
|
|
|
|
|
|
|
|
|
||||
Trustmark Corporation |
|
$ |
|
|
|
% |
|
|
% |
|
|
|||||
Trustmark National Bank |
|
|
|
|
|
% |
|
|
% |
|
|
% |
||||
|
|
|
|
|
|
|
|
|
|
|
|
|
||||
Total Capital (to Risk Weighted Assets) |
|
|
|
|
|
|
|
|
|
|
|
|
||||
Trustmark Corporation |
|
$ |
|
|
|
% |
|
|
% |
|
|
|||||
Trustmark National Bank |
|
|
|
|
|
% |
|
|
% |
|
|
% |
||||
|
|
|
|
|
|
|
|
|
|
|
|
|
||||
Tier 1 Leverage (to Average Assets) |
|
|
|
|
|
|
|
|
|
|
|
|
||||
Trustmark Corporation |
|
$ |
|
|
|
% |
|
|
% |
|
|
|||||
Trustmark National Bank |
|
|
|
|
|
% |
|
|
% |
|
|
% |
||||
131
Dividends on Common Stock
Dividends paid by Trustmark are substantially funded from dividends received from TNB. Approval by TNB’s regulators is required if the total of all dividends declared in any calendar year exceeds the total of its net income for that year combined with its retained net income of the preceding
Stock Repurchase Program
On January 28, 2020, the Board of Directors of Trustmark authorized a stock repurchase program effective April 1, 2020 under which $
On December 7, 2021, Trustmark’s Board of Directors authorized a stock repurchase program effective January 1, 2022, under which $
On December 6, 2022, Trustmark’s Board of Directors authorized a stock repurchase program effective January 1, 2023, under which $
On December 5, 2023, Trustmark’s Board of Directors authorized a stock repurchase program effective January 1, 2024, under which $
Other Comprehensive Income (Loss) and Accumulated Other Comprehensive Income (Loss)
The following tables present the net change in the components of accumulated other comprehensive income (loss) and the related tax effects allocated to each component for the years ended December 31, 2023, 2022 and 2021 ($ in thousands). The amortization of prior service cost, recognized net loss due to lump sum settlements and change in net actuarial loss are included in the computation of net periodic benefit cost (see Note 14 – Defined Benefit and Other Postretirement Benefits for additional details). Reclassification adjustments related to pension and other postretirement benefit plans are included in salaries and employee benefits and other expense in the accompanying consolidated statements of income. Reclassification adjustments related to the cash flow hedge derivatives are included in interest and fees on LHFS and LHFI in the accompanying consolidated statements of income.
132
|
|
Before Tax |
|
|
Tax (Expense) |
|
|
Net of Tax |
|
|||
|
|
Amount |
|
|
Benefit |
|
|
Amount |
|
|||
Year Ended December 31, 2023 |
|
|
|
|
|
|
|
|
|
|||
Securities available for sale and transferred securities: |
|
|
|
|
|
|
|
|
|
|||
Net unrealized holding gains (losses) arising during the period |
|
$ |
|
|
$ |
( |
) |
|
$ |
|
||
Reclassification adjustment for net (gains) losses realized in net income |
|
|
( |
) |
|
|
|
|
|
( |
) |
|
Change in net unrealized holding loss on securities transferred to held to maturity |
|
|
|
|
|
( |
) |
|
|
|
||
Total securities available for sale and transferred securities |
|
|
|
|
|
( |
) |
|
|
|
||
Pension and other postretirement benefit plans: |
|
|
|
|
|
|
|
|
|
|||
Change in the actuarial loss of pension and other postretirement |
|
|
( |
) |
|
|
|
|
|
( |
) |
|
Reclassification adjustments for changes realized in net income: |
|
|
|
|
|
|
|
|
|
|||
Net change in prior service costs |
|
|
|
|
|
( |
) |
|
|
|
||
Recognized net loss due to lump sum settlements |
|
|
|
|
|
( |
) |
|
|
|
||
Change in net actuarial loss |
|
|
|
|
|
( |
) |
|
|
|
||
Total pension and other postretirement benefit plans |
|
|
( |
) |
|
|
|
|
|
( |
) |
|
Cash flow hedge derivatives: |
|
|
|
|
|
|
|
|
|
|||
Change in accumulated gain (loss) on effective cash flow hedge derivatives |
|
|
( |
) |
|
|
|
|
|
( |
) |
|
Reclassification adjustment for (gain) loss realized in net income |
|
|
|
|
|
( |
) |
|
|
|
||
Total cash flow hedge derivatives |
|
|
|
|
|
( |
) |
|
|
|
||
Total other comprehensive income (loss) |
|
$ |
|
|
$ |
( |
) |
|
$ |
|
||
|
|
|
|
|
|
|
|
|
|
|||
Year Ended December 31, 2022 |
|
|
|
|
|
|
|
|
|
|||
Securities available for sale and transferred securities: |
|
|
|
|
|
|
|
|
|
|||
Net unrealized holding gains (losses) arising during the period |
|
$ |
( |
) |
|
$ |
|
|
$ |
( |
) |
|
Change in net unrealized holding loss on securities transferred to held to maturity |
|
|
( |
) |
|
|
|
|
|
( |
) |
|
Total securities available for sale and transferred securities |
|
|
( |
) |
|
|
|
|
|
( |
) |
|
Pension and other postretirement benefit plans: |
|
|
|
|
|
|
|
|
|
|||
Change in the actuarial loss of pension and other postretirement |
|
|
|
|
|
( |
) |
|
|
|
||
Reclassification adjustments for changes realized in net income: |
|
|
|
|
|
|
|
|
|
|||
Net change in prior service costs |
|
|
|
|
|
( |
) |
|
|
|
||
Change in net actuarial loss |
|
|
|
|
|
( |
) |
|
|
|
||
Total pension and other postretirement benefit plans |
|
|
|
|
|
( |
) |
|
|
|
||
Cash flow hedge derivatives: |
|
|
|
|
|
|
|
|
|
|||
Change in accumulated gain (loss) on effective cash flow hedge derivatives |
|
|
( |
) |
|
|
|
|
|
( |
) |
|
Reclassification adjustment for (gain) loss realized in net income |
|
|
|
|
|
( |
) |
|
|
|
||
Total cash flow hedge derivatives |
|
|
( |
) |
|
|
|
|
|
( |
) |
|
Total other comprehensive income (loss) |
|
$ |
( |
) |
|
$ |
|
|
$ |
( |
) |
|
|
|
|
|
|
|
|
|
|
|
|||
Year Ended December 31, 2021 |
|
|
|
|
|
|
|
|
|
|||
Securities available for sale and transferred securities: |
|
|
|
|
|
|
|
|
|
|||
Net unrealized holding gains (losses) arising during the period |
|
$ |
( |
) |
|
$ |
|
|
$ |
( |
) |
|
Change in net unrealized holding loss on securities transferred to held to maturity |
|
|
|
|
|
( |
) |
|
|
|
||
Total securities available for sale and transferred securities |
|
|
( |
) |
|
|
|
|
|
( |
) |
|
Pension and other postretirement benefit plans: |
|
|
|
|
|
|
|
|
|
|||
Change in the actuarial loss of pension and other postretirement |
|
|
|
|
|
( |
) |
|
|
|
||
Reclassification adjustments for changes realized in net income: |
|
|
|
|
|
|
|
|
|
|||
Net change in prior service costs |
|
|
|
|
|
( |
) |
|
|
|
||
Recognized net loss due to lump sum settlements |
|
|
|
|
|
( |
) |
|
|
|
||
Change in net actuarial loss |
|
|
|
|
|
( |
) |
|
|
|
||
Total pension and other postretirement benefit plans |
|
|
|
|
|
( |
) |
|
|
|
||
Total other comprehensive income (loss) |
|
$ |
( |
) |
|
$ |
|
|
$ |
( |
) |
|
133
The following table presents the changes in the balances of each component of accumulated other comprehensive income (loss) for the periods presented ($ in thousands). All amounts are presented net of tax.
|
|
Securities |
|
|
Defined |
|
|
Cash Flow Hedge Derivative |
|
|
Total |
|
||||
Balance, January 1, 2021 |
|
$ |
|
|
$ |
( |
) |
|
$ |
|
|
$ |
( |
) |
||
Other comprehensive income (loss) before |
|
|
( |
) |
|
|
|
|
|
|
|
|
( |
) |
||
Amounts reclassified from accumulated other |
|
|
|
|
|
|
|
|
|
|
|
|
||||
Net other comprehensive income (loss) |
|
|
( |
) |
|
|
|
|
|
|
|
|
( |
) |
||
Balance, December 31, 2021 |
|
|
( |
) |
|
|
( |
) |
|
|
|
|
|
( |
) |
|
Other comprehensive income (loss) before |
|
|
( |
) |
|
|
|
|
|
( |
) |
|
|
( |
) |
|
Amounts reclassified from accumulated other |
|
|
|
|
|
|
|
|
|
|
|
|
||||
Net other comprehensive income (loss) |
|
|
( |
) |
|
|
|
|
|
( |
) |
|
|
( |
) |
|
Balance, December 31, 2022 |
|
|
( |
) |
|
|
( |
) |
|
|
( |
) |
|
|
( |
) |
Other comprehensive income (loss) before reclassification |
|
|
|
|
|
( |
) |
|
|
( |
) |
|
|
|
||
Amounts reclassified from accumulated other |
|
|
( |
) |
|
|
|
|
|
|
|
|
|
|||
Net other comprehensive income (loss) |
|
|
|
|
|
( |
) |
|
|
|
|
|
|
|||
Balance, December 31, 2023 |
|
$ |
( |
) |
|
$ |
( |
) |
|
$ |
( |
) |
|
$ |
( |
) |
Note 18 – Fair Value
Financial Instruments Measured at Fair Value
The methodologies Trustmark uses in determining the fair values are based primarily on the use of independent, market-based data to reflect a value that would be reasonably expected upon exchange of the position in an orderly transaction between market participants at the measurement date. The predominant portion of assets that are stated at fair value are of a nature that can be valued using prices or inputs that are readily observable through a variety of independent data providers. The providers selected by Trustmark for fair valuation data are widely recognized and accepted vendors whose evaluations support the pricing functions of financial institutions, investment and mutual funds, and portfolio managers. Trustmark has documented and evaluated the pricing methodologies used by the vendors and maintains internal processes that regularly test valuations for anomalies.
Trustmark utilizes an independent pricing service to advise it on the carrying value of the securities available for sale portfolio. As part of Trustmark’s procedures, the price provided from the service is evaluated for reasonableness given market changes. When a questionable price exists, Trustmark investigates further to determine if the price is valid. If needed, other market participants may be utilized to determine the correct fair value. Trustmark has also reviewed and confirmed its determinations in thorough discussions with the pricing source regarding their methods of price discovery.
Mortgage loan commitments are valued based on the securities prices of similar collateral, term, rate and delivery for which the loan is eligible to deliver in place of the particular security. Trustmark acquires a broad array of mortgage security prices that are supplied by a market data vendor, which in turn accumulates prices from a broad list of securities dealers. Prices are processed through a mortgage pipeline management system that accumulates and segregates all loan commitment and forward-sale transactions according to the similarity of various characteristics (maturity, term, rate, and collateral). Prices are matched to those positions that are deemed to be an eligible substitute or offset (i.e., “deliverable”) for a corresponding security observed in the marketplace.
Trustmark estimates fair value of the MSR through the use of prevailing market participant assumptions and market participant valuation processes. This valuation is periodically tested and validated against other third-party firm valuations.
Trustmark obtains the fair value of interest rate swaps from a third-party pricing service that uses an industry standard discounted cash flow methodology. In addition, credit valuation adjustments are incorporated in the fair values to account for potential nonperformance risk. In adjusting the fair value of its interest rate swap contracts for the effect of nonperformance risk, Trustmark has considered any applicable credit enhancements such as collateral postings, thresholds, mutual puts, and guarantees. In conjunction with the FASB’s
134
fair value measurement guidance, Trustmark made an accounting policy election to measure the credit risk of these derivative financial instruments, which are subject to master netting agreements, on a net basis by counterparty portfolio.
Trustmark has determined that the majority of the inputs used to value its interest rate swaps offered to qualified commercial borrowers fall within Level 2 of the fair value hierarchy, while the credit valuation adjustments associated with these derivatives utilize Level 3 inputs, such as estimates of current credit spreads. Trustmark has assessed the significance of the impact of the credit valuation adjustments on the overall valuation of its interest rate swaps and has determined that the credit valuation adjustment is not significant to the overall valuation of these derivatives. As a result, Trustmark classifies its interest rate swap valuations in Level 2 of the fair value hierarchy.
Trustmark also utilizes exchange-traded derivative instruments such as Treasury note futures contracts and option contracts to achieve a fair value return that offsets the changes in fair value of the MSR attributable to interest rates. Fair values of these derivative instruments are determined from quoted prices in active markets for identical assets therefore allowing them to be classified within Level 1 of the fair value hierarchy. In addition, Trustmark utilizes derivative instruments such as interest rate lock commitments in its mortgage banking area which lack observable inputs for valuation purposes resulting in their inclusion in Level 3 of the fair value hierarchy.
At this time, Trustmark presents no fair values that are derived through internal modeling. Should positions requiring fair valuation arise that are not relevant to existing methodologies, Trustmark will make every reasonable effort to obtain market participant assumptions, or independent evaluation.
Financial Assets and Liabilities
The following tables summarize financial assets and financial liabilities measured at fair value on a recurring basis at December 31, 2023 and 2022, segregated by the level of valuation inputs within the fair value hierarchy utilized to measure fair value ($ in thousands). There were no transfers between fair value levels for the years ended December 31, 2023 and 2022.
|
|
December 31, 2023 |
|
|||||||||||||
|
|
Total |
|
|
Level 1 |
|
|
Level 2 |
|
|
Level 3 |
|
||||
U.S. Treasury securities |
|
$ |
|
|
$ |
|
|
$ |
|
|
$ |
|
||||
U.S. Government agency obligations |
|
|
|
|
|
|
|
|
|
|
|
|
||||
Obligations of states and political subdivisions |
|
|
|
|
|
|
|
|
|
|
|
|
||||
Mortgage-backed securities |
|
|
|
|
|
|
|
|
|
|
|
|
||||
Securities available for sale |
|
|
|
|
|
|
|
|
|
|
|
|
||||
LHFS |
|
|
|
|
|
|
|
|
|
|
|
|
||||
MSR |
|
|
|
|
|
|
|
|
|
|
|
|
||||
|
|
|
|
|
|
|
|
|
|
|
|
|||||
|
|
|
|
|
|
|
|
|
|
|
|
|||||
|
|
December 31, 2022 |
|
|||||||||||||
|
|
Total |
|
|
Level 1 |
|
|
Level 2 |
|
|
Level 3 |
|
||||
U.S. Treasury securities |
|
$ |
|
|
$ |
|
|
$ |
|
|
$ |
|
||||
U.S. Government agency obligations |
|
|
|
|
|
|
|
|
|
|
|
|
||||
Obligations of states and political subdivisions |
|
|
|
|
|
|
|
|
|
|
|
|
||||
Mortgage-backed securities |
|
|
|
|
|
|
|
|
|
|
|
|
||||
Securities available for sale |
|
|
|
|
|
|
|
|
|
|
|
|
||||
LHFS |
|
|
|
|
|
|
|
|
|
|
|
|
||||
MSR |
|
|
|
|
|
|
|
|
|
|
|
|
||||
Other assets - derivatives |
|
|
|
|
|
|
|
|
|
|
|
|
||||
Other liabilities - derivatives |
|
|
|
|
|
|
|
|
|
|
|
|
||||
135
The changes in Level 3 assets measured at fair value on a recurring basis for the years ended December 31, 2023 and 2022 are summarized as follows ($ in thousands):
|
|
MSR |
|
|
Other Assets - |
|
||
Balance, January 1, 2023 |
|
$ |
|
|
$ |
|
||
(1) |
|
|
( |
) |
|
|
|
|
Additions |
|
|
|
|
|
|
||
Sales |
|
|
|
|
|
( |
) |
|
Balance, December 31, 2023 |
|
$ |
|
|
$ |
|
||
|
|
|
|
|
|
|
||
The amount of total gains (losses) for the period included in earnings that are |
|
$ |
( |
) |
|
$ |
|
|
|
|
|
|
|
|
|
||
Balance, January 1, 2022 |
|
$ |
|
|
$ |
|
||
(1) |
|
|
|
|
|
( |
) |
|
Additions |
|
|
|
|
|
|
||
Sales |
|
|
|
|
|
( |
) |
|
Balance, December 31, 2022 |
|
$ |
|
|
$ |
|
||
|
|
|
|
|
|
|
||
The amount of total gains (losses) for the period included in earnings that are |
|
$ |
|
|
$ |
( |
) |
|
Trustmark may be required, from time to time, to measure certain assets at fair value on a nonrecurring basis in accordance with GAAP. Assets at December 31, 2023, which have been measured at fair value on a nonrecurring basis, include collateral-dependent LHFI. A loan is collateral dependent when the borrower is experiencing financial difficulty and repayment of the loan is expected to be provided substantially through the sale of the collateral. The expected credit loss for collateral-dependent loans is measured as the difference between the amortized cost basis of the loan and the fair value of the collateral, adjusted for the estimated cost to sell. Fair value estimates for collateral-dependent loans are derived from appraised values based on the current market value or as is value of the collateral, normally from recently received and reviewed appraisals. Current appraisals are ordered on an annual basis based on the inspection date or more often if market conditions necessitate. Appraisals are obtained from state-certified appraisers and are based on certain assumptions, which may include construction or development status and the highest and best use of the property. These appraisals are reviewed by Trustmark’s Appraisal Review Department to ensure they are acceptable, and values are adjusted down for costs associated with asset disposal. At December 31, 2023, Trustmark had outstanding balances of $
Nonfinancial Assets and Liabilities
Certain nonfinancial assets measured at fair value on a nonrecurring basis include foreclosed assets (upon initial recognition or subsequent impairment), nonfinancial assets and nonfinancial liabilities measured at fair value in the second step of a goodwill impairment test, and intangible assets and other nonfinancial long-lived assets measured at fair value for impairment assessment.
Other real estate includes assets that have been acquired in satisfaction of debt through foreclosure and is recorded at the fair value less cost to sell (estimated fair value) at the time of foreclosure. Fair value is based on independent appraisals and other relevant factors. In the determination of fair value subsequent to foreclosure, Management also considers other factors or recent developments, such as changes in market conditions from the time of valuation and anticipated sales values considering plans for disposition, which could result in an adjustment to lower the collateral value estimates indicated in the appraisals. Periodic revaluations are classified as Level 3 in the fair value hierarchy since assumptions are used that may not be observable in the market.
Foreclosed assets of $
136
Fair Value of Financial Instruments
FASB ASC Topic 825 requires disclosure of the fair value of financial assets and financial liabilities, including those financial assets and financial liabilities that are not measured and reported at fair value on a recurring basis or non-recurring basis.
The carrying amounts and estimated fair values of financial instruments at December 31, 2023 and 2022 were as follows ($ in thousands):
|
|
December 31, 2023 |
|
|
December 31, 2022 |
|
||||||||||
|
|
Carrying |
|
|
Estimated |
|
|
Carrying |
|
|
Estimated |
|
||||
Financial Assets: |
|
|
|
|
|
|
|
|
|
|
|
|
||||
Level 2 Inputs: |
|
|
|
|
|
|
|
|
|
|
|
|
||||
Cash and short-term investments |
|
$ |
|
|
$ |
|
|
$ |
|
|
$ |
|
||||
Securities held to maturity |
|
|
|
|
|
|
|
|
|
|
|
|
||||
Level 3 Inputs: |
|
|
|
|
|
|
|
|
|
|
|
|
||||
Net LHFI |
|
|
|
|
|
|
|
|
|
|
|
|
||||
|
|
|
|
|
|
|
|
|
|
|
|
|
||||
Financial Liabilities: |
|
|
|
|
|
|
|
|
|
|
|
|
||||
Level 2 Inputs: |
|
|
|
|
|
|
|
|
|
|
|
|
||||
Deposits |
|
|
|
|
|
|
|
|
|
|
|
|
||||
Federal funds purchased and securities sold under |
|
|
|
|
|
|
|
|
|
|
|
|
||||
Other borrowings |
|
|
|
|
|
|
|
|
|
|
|
|
||||
Subordinated notes |
|
|
|
|
|
|
|
|
|
|
|
|
||||
Junior subordinated debt securities |
|
|
|
|
|
|
|
|
|
|
|
|
||||
Fair Value Option
Trustmark has elected to account for its LHFS under the fair value option, with interest income on these LHFS reported in interest and fees on LHFS and LHFI. The fair value of the LHFS is determined using quoted prices for a similar asset, adjusted for specific attributes of that loan. The LHFS are actively managed and monitored and certain market risks of the loans may be mitigated through the use of derivatives. These derivative instruments are carried at fair value with changes in fair value recorded as noninterest income in mortgage banking, net. The changes in the fair value of the LHFS are largely offset by changes in the fair value of the derivative instruments. For the year ended December 31, 2023, a net gain of $
The following table provides information about the fair value and the contractual principal outstanding of the LHFS accounted for under the fair value option at December 31, 2023 and 2022 ($ in thousands):
|
|
December 31, |
|
|||||
|
|
2023 |
|
|
2022 |
|
||
Fair value of LHFS |
|
$ |
|
|
$ |
|
||
LHFS contractual principal outstanding |
|
|
|
|
|
|
||
Fair value less unpaid principal |
|
$ |
|
|
$ |
|
||
Note 19 – Derivative Financial Instruments
Derivatives Designated as Hedging Instruments
During the third quarter of 2022, Trustmark initiated a cash flow hedging program. Trustmark's objectives in initiating this hedging program were to add stability to interest income and to manage its exposure to interest rate movements. Interest rate swaps designated as cash flow hedges involve the receipt of fixed-rate amounts from a counterparty in exchange for Trustmark making variable-rate
137
payments over the life of the agreements without exchange of the underlying notional amount. Interest rate floor spreads designated as cash flow hedges involve the receipt of variable-rate amounts if interest rates fall below the purchased floor strike rate on the contract and payments of variable-rate amounts if interest rates fall below the sold floor strike rate on the contract. Trustmark uses such derivatives to hedge the variable cash flows associated with existing and anticipated variable-rate loan assets. At December 31, 2023, the aggregate notional value of Trustmark's interest rate swaps and floor spreads designated as cash flow hedges totaled $
Trustmark records any gains or losses on these cash flow hedges in accumulated other comprehensive income (loss). Gains and losses on derivatives representing hedge components excluded from the assessment of effectiveness are recognized over the life of the hedge on a systematic and rational basis, as documented at hedge inception in accordance with Trustmark’s accounting policy election. The earnings recognition of excluded components totaled $
Derivatives not Designated as Hedging Instruments
Trustmark utilizes a portfolio of exchange-traded derivative instruments, such as Treasury note futures contracts and option contracts, to achieve a fair value return that economically hedges changes in the fair value of the MSR attributable to interest rates. These transactions are considered freestanding derivatives that do not otherwise qualify for hedge accounting. The total notional amount of these derivative instruments was $
As part of Trustmark’s risk management strategy in the mortgage banking area, derivative instruments such as forward sales contracts are utilized. Trustmark’s obligations under forward sales contracts consist of commitments to deliver mortgage loans, originated and/or purchased, in the secondary market at a future date. Changes in the fair value of these derivative instruments are recorded as noninterest income in mortgage banking, net and are offset by changes in the fair value of LHFS. Trustmark’s off-balance sheet obligations under these derivative instruments totaled $
Trustmark also utilizes derivative instruments such as interest rate lock commitments in its mortgage banking area. Interest rate lock commitments are residential mortgage loan commitments with customers, which guarantee a specified interest rate for a specified time period. Changes in the fair value of these derivative instruments are recorded as noninterest income in mortgage banking, net and are offset by the changes in the fair value of forward sales contracts. Trustmark’s off-balance sheet obligations under these derivative instruments totaled $
Trustmark offers certain derivatives products directly to qualified commercial lending clients seeking to manage their interest rate risk. Trustmark economically hedges interest rate swap transactions executed with commercial lending clients by entering into offsetting interest rate swap transactions with institutional derivatives market participants. Derivatives transactions executed as part of this program are not designated as qualifying hedging relationships and are, therefore, carried at fair value with the change in fair value recorded as noninterest income in bank card and other fees. Because these derivatives have mirror-image contractual terms, in addition to collateral provisions which mitigate the impact of non-performance risk, the changes in fair value are expected to substantially offset. The offsetting interest rate swap transactions are either cleared through the Chicago Mercantile Exchange for clearable transactions or booked directly with institutional derivatives market participants for non-clearable transactions. The Chicago Mercantile Exchange rules legally characterize variation margin collateral payments made or received for centrally cleared interest rate swaps as settlements rather than collateral. As a result, centrally cleared interest rate swaps included in other assets and other liabilities are presented on a net basis in the accompanying consolidated balance sheets. At December 31, 2023, Trustmark had interest rate swaps with an aggregate notional amount of $
138
Credit-risk-related Contingent Features
Trustmark has agreements with its financial institution counterparties that contain provisions where if Trustmark defaults on any of its indebtedness, including default where repayment of the indebtedness has not been accelerated by the lender, then Trustmark could also be declared in default on its derivatives obligations.
At December 31, 2023, the termination value of interest rate swaps in a liability position, which includes accrued interest but excludes any adjustment for nonperformance risk, related to these agreements was $
Credit risk participation agreements arise when Trustmark contracts with other financial institutions, as a guarantor or beneficiary, to share credit risk associated with certain interest rate swaps. These agreements provide for reimbursement of losses resulting from a third-party default on the underlying swap. At December 31, 2023, Trustmark had entered into
Tabular Disclosures
The following tables disclose the fair value of derivative instruments in Trustmark’s consolidated balance sheets at December 31, 2023 and 2022 as well as the effect of these derivative instruments on Trustmark’s results of operations for the periods presented ($ in thousands):
|
|
December 31, |
|
|||||
|
|
2023 |
|
|
2022 |
|
||
Derivatives in hedging relationships |
|
|
|
|
|
|
||
Interest rate contracts: |
|
|
|
|
|
|
||
Interest rate swaps included in other assets (1) |
|
$ |
|
|
$ |
|
||
Interest rate floors included in other assets |
|
|
|
|
|
|
||
Interest rate swaps included in other liabilities (1) |
|
|
|
|
|
|
||
|
|
|
|
|
|
|
||
Derivatives not designated as hedging instruments |
|
|
|
|
|
|
||
Interest rate contracts: |
|
|
|
|
|
|
||
Exchange traded purchased options included in other assets |
|
$ |
|
|
$ |
|
||
OTC written options (rate locks) included in other assets |
|
|
|
|
|
|
||
Futures contracts included in other assets |
|
|
|
|
|
|
||
Interest rate swaps included in other assets (1) |
|
|
|
|
|
|
||
Credit risk participation agreements included in other assets |
|
|
|
|
|
|
||
Futures contracts included in other liabilities |
|
|
|
|
|
|
||
Forward contracts included in other liabilities |
|
|
|
|
|
( |
) |
|
Exchange traded written options included in other liabilities |
|
|
|
|
|
|
||
Interest rate swaps included in other liabilities (1) |
|
|
|
|
|
|
||
Credit risk participation agreements included in other liabilities |
|
|
|
|
|
|
||
139
|
|
Years Ended December 31, |
|
|||||||||
|
|
2023 |
|
|
2022 |
|
|
2021 |
|
|||
Derivatives in hedging relationships |
|
|
|
|
|
|
|
|
|
|||
|
$ |
( |
) |
|
$ |
( |
) |
|
$ |
|
||
|
|
|
|
|
|
|
|
|
|
|||
Derivatives not designated as hedging instruments |
|
|
|
|
|
|
|
|
|
|||
Amount of gain (loss) recognized in mortgage banking, net |
|
$ |
( |
) |
|
$ |
( |
) |
|
$ |
( |
) |
Amount of gain (loss) recognized in bank card and other fees |
|
|
|
|
|
|
|
|
|
|||
The following table discloses the amount included in other comprehensive income (loss), net of tax, for derivative instruments designated as cash flow hedges for the periods presented ($ in thousands):
|
|
Years Ended December 31, |
|
|||||||||
|
|
2023 |
|
|
2022 |
|
|
2021 |
|
|||
Derivatives in cash flow hedging relationship |
|
|
|
|
|
|
|
|
|
|||
Amount of gain (loss) recognized in other comprehensive |
|
$ |
( |
) |
|
$ |
( |
) |
|
$ |
|
|
Information about financial instruments that are eligible for offset in the consolidated balance sheets at December 31, 2023 and 2022 is presented in the following tables ($ in thousands):
Offsetting of Derivative Assets |
|
|||||||||||||||||||||||
As of December 31, 2023 |
|
|||||||||||||||||||||||
|
|
|
|
|
|
|
|
|
|
|
Gross Amounts Not Offset in the |
|
|
|
|
|||||||||
|
|
Gross |
|
|
Gross Amounts |
|
|
Net Amounts of |
|
|
Financial |
|
|
Cash Collateral |
|
|
Net Amount |
|
||||||
Derivatives |
|
$ |
|
|
$ |
|
|
$ |
|
|
$ |
( |
) |
|
$ |
|
|
$ |
|
|||||
Offsetting of Derivative Liabilities |
|
|||||||||||||||||||||||
As of December 31, 2023 |
|
|||||||||||||||||||||||
|
|
|
|
|
|
|
|
|
|
|
Gross Amounts Not Offset in the |
|
|
|
|
|||||||||
|
|
Gross |
|
|
Gross Amounts |
|
|
Net Amounts of |
|
|
Financial |
|
|
Cash Collateral |
|
|
Net Amount |
|
||||||
Derivatives |
|
$ |
|
|
$ |
|
|
$ |
|
|
$ |
( |
) |
|
$ |
( |
) |
|
$ |
|
||||
Offsetting of Derivative Assets |
|
|||||||||||||||||||||||
As of December 31, 2022 |
|
|||||||||||||||||||||||
|
|
|
|
|
|
|
|
|
|
|
Gross Amounts Not Offset in the |
|
|
|
|
|||||||||
|
|
Gross |
|
|
Gross Amounts |
|
|
Net Amounts of |
|
|
Financial |
|
|
Cash Collateral |
|
|
Net Amount |
|
||||||
Derivatives |
|
$ |
|
|
$ |
|
|
$ |
|
|
$ |
|
|
$ |
( |
) |
|
$ |
|
|||||
Offsetting of Derivative Liabilities |
|
|||||||||||||||||||||||
As of December 31, 2022 |
|
|||||||||||||||||||||||
|
|
|
|
|
|
|
|
|
|
|
Gross Amounts Not Offset in the |
|
|
|
|
|||||||||
|
|
Gross |
|
|
Gross Amounts |
|
|
Net Amounts of |
|
|
Financial |
|
|
Cash Collateral |
|
|
Net Amount |
|
||||||
Derivatives |
|
$ |
|
|
$ |
|
|
$ |
|
|
$ |
|
|
$ |
( |
) |
|
$ |
|
|||||
140
Note 20 – Segment Information
Trustmark’s management reporting structure includes
The accounting policies of each reportable segment are the same as those of Trustmark except for its internal allocations. Noninterest expenses for back-office operations support are allocated to segments based on estimated uses of those services. Trustmark measures the net interest income of its business segments with a process that assigns cost of funds or earnings credit on a matched-term basis. This process, called “funds transfer pricing”, charges an appropriate cost of funds to assets held by a business unit, or credits the business unit for potential earnings for carrying liabilities. The net of these charges and credits flows through to the General Banking Segment, which contains the management team responsible for determining TNB’s funding and interest rate risk strategies.
141
The following table discloses financial information by reportable segment for the periods presented ($ in thousands):
|
|
Years Ended December 31, |
|
|||||||||
|
|
2023 |
|
|
2022 |
|
|
2021 |
|
|||
General Banking |
|
|
|
|
|
|
|
|
|
|||
Net interest income |
|
$ |
|
|
$ |
|
|
$ |
|
|||
PCL |
|
|
|
|
|
|
|
|
( |
) |
||
Noninterest income |
|
|
|
|
|
|
|
|
|
|||
Noninterest expense |
|
|
|
|
|
|
|
|
|
|||
Income before income taxes |
|
|
|
|
|
|
|
|
|
|||
Income taxes |
|
|
|
|
|
( |
) |
|
|
|
||
General banking net income |
|
$ |
|
|
$ |
|
|
$ |
|
|||
|
|
|
|
|
|
|
|
|
|
|||
Selected Financial Information |
|
|
|
|
|
|
|
|
|
|||
Total assets |
|
$ |
|
|
$ |
|
|
$ |
|
|||
Depreciation and amortization |
|
$ |
|
|
$ |
|
|
$ |
|
|||
|
|
|
|
|
|
|
|
|
|
|||
Wealth Management |
|
|
|
|
|
|
|
|
|
|||
Net interest income |
|
$ |
|
|
$ |
|
|
$ |
|
|||
PCL |
|
|
( |
) |
|
|
( |
) |
|
|
( |
) |
Noninterest income |
|
|
|
|
|
|
|
|
|
|||
Noninterest expense |
|
|
|
|
|
|
|
|
|
|||
Income before income taxes |
|
|
|
|
|
|
|
|
|
|||
Income taxes |
|
|
|
|
|
|
|
|
|
|||
Wealth Management net income |
|
$ |
|
|
$ |
|
|
$ |
|
|||
|
|
|
|
|
|
|
|
|
|
|||
Selected Financial Information |
|
|
|
|
|
|
|
|
|
|||
Total assets |
|
$ |
|
|
$ |
|
|
$ |
|
|||
Depreciation and amortization |
|
$ |
|
|
$ |
|
|
$ |
|
|||
|
|
|
|
|
|
|
|
|
|
|||
Insurance |
|
|
|
|
|
|
|
|
|
|||
Net interest income |
|
$ |
( |
) |
|
$ |
( |
) |
|
$ |
( |
) |
Noninterest income |
|
|
|
|
|
|
|
|
|
|||
Noninterest expense |
|
|
|
|
|
|
|
|
|
|||
Income before income taxes |
|
|
|
|
|
|
|
|
|
|||
Income taxes |
|
|
|
|
|
|
|
|
|
|||
Insurance net income |
|
$ |
|
|
$ |
|
|
$ |
|
|||
|
|
|
|
|
|
|
|
|
|
|||
Selected Financial Information |
|
|
|
|
|
|
|
|
|
|||
Total assets |
|
$ |
|
|
$ |
|
|
$ |
|
|||
Depreciation and amortization |
|
$ |
|
|
$ |
|
|
$ |
|
|||
|
|
|
|
|
|
|
|
|
|
|||
Consolidated |
|
|
|
|
|
|
|
|
|
|||
Net interest income |
|
$ |
|
|
$ |
|
|
$ |
|
|||
PCL |
|
|
|
|
|
|
|
|
( |
) |
||
Noninterest income |
|
|
|
|
|
|
|
|
|
|||
Noninterest expense |
|
|
|
|
|
|
|
|
|
|||
Income before income taxes |
|
|
|
|
|
|
|
|
|
|||
Income taxes |
|
|
|
|
|
|
|
|
|
|||
Consolidated net income |
|
$ |
|
|
$ |
|
|
$ |
|
|||
|
|
|
|
|
|
|
|
|
|
|||
Selected Financial Information |
|
|
|
|
|
|
|
|
|
|||
Total assets |
|
$ |
|
|
$ |
|
|
$ |
|
|||
Depreciation and amortization |
|
$ |
|
|
$ |
|
|
$ |
|
|||
142
Note 21 – Parent Company Only Financial Information
($ in thousands)
Condensed Balance Sheets |
|
December 31, |
|
|||||
|
|
2023 |
|
|
2022 |
|
||
Assets: |
|
|
|
|
|
|
||
Investment in banks |
|
$ |
|
|
$ |
|
||
Other assets |
|
|
|
|
|
|
||
Total Assets |
|
$ |
|
|
$ |
|
||
|
|
|
|
|
|
|
||
Liabilities and Shareholders' Equity: |
|
|
|
|
|
|
||
Accrued expense |
|
$ |
|
|
$ |
|
||
Subordinated notes |
|
|
|
|
|
|
||
Junior subordinated debt securities |
|
|
|
|
|
|
||
Shareholders' equity |
|
|
|
|
|
|
||
Total Liabilities and Shareholders' Equity |
|
$ |
|
|
$ |
|
||
Condensed Statements of Income |
|
Years Ended December 31, |
|
|||||||||
|
|
2023 |
|
|
2022 |
|
|
2021 |
|
|||
Revenue: |
|
|
|
|
|
|
|
|
|
|||
Dividends received from banks |
|
$ |
|
|
$ |
|
|
$ |
|
|||
Earnings of subsidiaries over distributions |
|
|
|
|
|
( |
) |
|
|
|
||
Other income |
|
|
|
|
|
|
|
|
|
|||
Total Revenue |
|
|
|
|
|
|
|
|
|
|||
Expense: |
|
|
|
|
|
|
|
|
|
|||
Other expense |
|
|
|
|
|
|
|
|
|
|||
Total Expense |
|
|
|
|
|
|
|
|
|
|||
Net Income |
|
$ |
|
|
$ |
|
|
$ |
|
|||
Condensed Statements of Cash Flows |
|
Years Ended December 31, |
|
|||||||||
|
|
2023 |
|
|
2022 |
|
|
2021 |
|
|||
Operating Activities: |
|
|
|
|
|
|
|
|
|
|||
Net income |
|
$ |
|
|
$ |
|
|
$ |
|
|||
Adjustments to reconcile net income to net cash provided |
|
|
|
|
|
|
|
|
|
|||
Net change in investment in subsidiaries |
|
|
( |
) |
|
|
|
|
|
( |
) |
|
Other |
|
|
( |
) |
|
|
( |
) |
|
|
( |
) |
Net cash from operating activities |
|
|
|
|
|
|
|
|
|
|||
|
|
|
|
|
|
|
|
|
|
|||
Financing Activities: |
|
|
|
|
|
|
|
|
|
|||
Common stock dividends |
|
|
( |
) |
|
|
( |
) |
|
|
( |
) |
Repurchase and retirement of common stock |
|
|
|
|
|
( |
) |
|
|
( |
) |
|
Net cash from financing activities |
|
|
( |
) |
|
|
( |
) |
|
|
( |
) |
Net change in cash and cash equivalents |
|
|
|
|
|
|
|
|
( |
) |
||
Cash and cash equivalents at beginning of year |
|
|
|
|
|
|
|
|
|
|||
Cash and cash equivalents at end of year |
|
$ |
|
|
$ |
|
|
$ |
|
|||
Trustmark paid income taxes of approximately $
143
ITEM 9. CHANGES IN AND DISAGREEMENTS WITH ACCOUNTANTS ON ACCOUNTING AND FINANCIAL DISCLOSURE
There has been no change of accountants within the two-year period prior to December 31, 2023.
ITEM 9A. CONTROLS AND PROCEDURES
Evaluation of Disclosure Controls and Procedures
As of the end of the period covered by this Annual Report on Form 10-K, an evaluation was carried out by Trustmark’s management, with the participation of its Chief Executive Officer and Treasurer and Principal Financial Officer (Principal Financial Officer), of the effectiveness of Trustmark’s disclosure controls and procedures (as defined in Rule 13a-15(e) under the Securities Exchange Act of 1934). Based upon that evaluation, the Chief Executive Officer and Principal Financial Officer concluded that the disclosure controls and procedures were effective as of the end of the period covered by this report. No changes were made to Trustmark’s internal control over financial reporting (as defined in Rule 13a-15(f) under the Securities Exchange Act of 1934) during the last fiscal quarter that materially affected, or are reasonably likely to materially affect, Trustmark’s internal control over financial reporting.
Management Report on Internal Control over Financial Reporting
The management of Trustmark is responsible for establishing and maintaining adequate internal control over financial reporting. Trustmark’s internal control over financial reporting was designed under the supervision of the Chief Executive Officer and Treasurer (Principal Financial Officer) to provide reasonable assurance regarding the reliability of financial reporting and the preparation of published financial statements in accordance with GAAP.
Management assessed the effectiveness of internal control over financial reporting as of December 31, 2023. In making this assessment, it used the criteria set forth by the Committee of Sponsoring Organizations of the Treadway Commission (COSO) in Internal Control – Integrated Framework (2013). Based on our assessment, we believe that, as of December 31, 2023, Trustmark’s internal control over financial reporting was effective based on those criteria.
The effectiveness of Trustmark’s internal control over financial reporting as of December 31, 2023 was audited by
ITEM 9B. OTHER INFORMATION
None.
ITEM 9C. DISCLOSURE REGARDING FOREIGN JURISDICTIONS THAT PREVENT INSPECTIONS
Not applicable.
144
PART III
ITEM 10. DIRECTORS, EXECUTIVE OFFICERS AND CORPORATE GOVERNANCE
Certain information regarding executive officers is included under the section captioned “Information about Executive Officers of Trustmark” in Part I. Item 1. - Business, elsewhere in this Annual Report on Form 10-K. Other information required by this Item is incorporated herein by reference to Trustmark Corporation’s (Trustmark’s) Proxy Statement (Schedule 14A) for its 2024 Annual Meeting of Shareholders to be filed with the SEC within 120 days of Trustmark’s fiscal year-end.
ITEM 11. EXECUTIVE COMPENSATION
The information required by this Item is incorporated herein by reference to Trustmark’s Proxy Statement (Schedule 14A) for its 2024 Annual Meeting of Shareholders to be filed with the SEC within 120 days of Trustmark’s fiscal year-end.
ITEM 12. SECURITY OWNERSHIP OF CERTAIN BENEFICIAL OWNERS AND MANAGEMENT AND RELATED STOCKHOLDER MATTERS
The information required by this Item is incorporated herein by reference to Trustmark’s Proxy Statement (Schedule 14A) for its 2024 Annual Meeting of Shareholders to be filed with the SEC within 120 days of Trustmark’s fiscal year-end.
The information required by this Item is incorporated herein by reference to Trustmark’s Proxy Statement (Schedule 14A) for its 2024 Annual Meeting of Shareholders to be filed with the SEC within 120 days of Trustmark’s fiscal year-end.
ITEM 14. PRINCIPAL ACCOUNTING FEES AND SERVICES
The information required by this Item is incorporated herein by reference to Trustmark’s Proxy Statement (Schedule 14A) for its 2024 Annual Meeting of Shareholders to be filed with the SEC within 120 days of Trustmark’s fiscal year-end.
PART IV
ITEM. 15. EXHIBITS, FINANCIAL STATEMENT SCHEDULES
A-1. Financial Statements
The report of Crowe LLP, independent registered public accounting firm, and the following consolidated financial statements of Trustmark Corporation (Trustmark) and subsidiaries are included in the Registrant’s 2023 Annual Report on Form 10-K and are incorporated into Part II. Item 8. – Financial Statements and Supplementary Data herein by reference:
Consolidated Balance Sheets as of December 31, 2023 and 2022
Consolidated Statements of Income for the Years Ended December 31, 2023, 2022 and 2021
Consolidated Statements of Comprehensive Income for the Years Ended December 31, 2023, 2022 and 2021
Consolidated Statements of Changes in Shareholders’ Equity for the Years Ended December 31, 2023, 2022 and 2021
Consolidated Statements of Cash Flows for the Years Ended December 31, 2023, 2022 and 2021
Notes to Consolidated Financial Statements (Notes 1 through 21)
A-2. Financial Statement Schedules
The schedules to the consolidated financial statements set forth by Article 9 of Regulation S-X are not required under the related instructions or are inapplicable and therefore have been omitted.
A-3. Exhibits
The exhibits to this Annual Report on Form 10-K listed below have been included only with the copy of this report filed with the Securities and Exchange Commission. Copies of individual exhibits will be furnished to shareholders upon written request to Trustmark and payment of a reasonable fee.
145
ITEM. 16. SUMMARY
None.
146
EXHIBIT INDEX
2-a |
|
|
|
|
|
2-b |
|
|
|
|
|
3-a |
|
|
|
|
|
3-b |
|
|
|
|
|
4-a |
|
|
|
|
|
4-b |
|
|
|
|
|
4-c |
|
|
|
|
|
4-d |
|
|
|
|
|
10-a |
|
|
|
|
|
10-b |
|
|
|
|
|
10-c |
|
|
|
|
|
10-d |
|
|
|
|
|
10-e |
|
|
|
|
|
10-f |
|
|
|
|
|
10-g |
|
|
|
|
|
10-h |
|
|
|
|
|
10-i |
|
|
|
|
|
10-j |
|
|
|
|
|
10-k |
|
147
10-l |
|
|
|
|
|
10-m |
|
|
|
|
|
10-n |
|
|
|
|
|
10-o |
|
|
|
|
|
10-p |
|
|
|
|
|
10-q |
|
|
|
|
|
10-r |
|
|
|
|
|
10-s |
|
|
|
|
|
10-t |
|
|
|
|
|
10-u |
|
|
|
|
|
10-v |
|
|
|
|
|
10-w |
|
|
|
|
|
10-x |
|
|
|
|
|
10-y |
|
|
|
|
|
10-z |
|
|
|
|
|
10-aa |
|
|
|
|
|
10-ab |
|
|
|
|
|
10-ac |
|
148
10-ad |
|
|
|
|
|
10-ae |
|
|
|
|
|
10-ag |
|
|
|
|
|
10-ah |
|
|
|
|
|
10-ai |
|
|
|
|
|
10-aj |
|
|
|
|
|
10-ak |
|
Form of Compensation Clawback Policy, adopted on October 24, 2023 and revised on January 23, 2024. * |
|
|
|
10-al |
|
|
|
|
|
10-am |
|
|
|
|
|
21 |
|
|
|
|
|
23 |
|
|
|
|
|
31-a |
|
Certification by Chief Executive Officer pursuant to Section 302 of the Sarbanes-Oxley Act of 2002. |
|
|
|
31-b |
|
|
|
|
|
32-a |
|
|
|
|
|
32-b |
|
|
|
|
|
101.INS |
|
Inline XBRL Instance Document |
|
|
|
101.SCH |
|
Inline XBRL Taxonomy Extension Schema with Embedded Linkbases Document |
|
|
|
104 |
|
Cover Page Interactive Data File (embedded within the Inline XBRL document). |
|
|
|
|
|
|
* - Denotes management contract.
All other exhibits are omitted, as they are inapplicable or not required by the related instructions.
149
SIGNATURES
Pursuant to the requirements of Section 13 or 15 (d) of the Securities Exchange Act of 1934, the Registrant has duly caused this report to be signed on its behalf by the undersigned, thereunto duly authorized.
TRUSTMARK CORPORATION
BY: |
|
/s/ Duane A. Dewey |
|
|
|
|
|
|
Duane A. Dewey |
|
|
|
|
|
|
President and Chief Executive Officer |
|
|
|
|
|
|
|
|
|
|
|
DATE: |
|
February 15, 2024 |
|
|
|
|
150
SIGNATURES
Pursuant to the requirements of the Securities Exchange Act of 1934, this report has been signed by the following persons on behalf of the Registrant and in the capacities and on the dates indicated:
DATE: |
|
February 15, 2024 |
|
BY: |
|
/s/ Adolphus B. Baker |
|
|
|
|
|
|
Adolphus B. Baker, Director |
|
|
|
|
|
|
|
DATE: |
|
February 15, 2024 |
|
BY: |
|
/s/ William A. Brown |
|
|
|
|
|
|
William A. Brown, Director |
|
|
|
|
|
|
|
DATE: |
|
February 15, 2024 |
|
BY: |
|
/s/ Augustus L. Collins |
|
|
|
|
|
|
Augustus L. Collins, Director |
|
|
|
|
|
|
|
DATE: |
|
February 15, 2024 |
|
BY: |
|
/s/ George T. Chambers, Jr. |
|
|
|
|
|
|
George T. Chambers, Jr., Principal Accounting Officer |
|
|
|
|
|
|
|
DATE: |
|
February 15, 2024 |
|
BY: |
|
/s/ Tracy T. Conerly |
|
|
|
|
|
|
Tracy T. Conerly, Director |
|
|
|
|
|
|
|
DATE: |
|
February 15, 2024 |
|
BY: |
|
/s/ Duane A. Dewey |
|
|
|
|
|
|
Duane A. Dewey, President, Chief Executive Officer and Director |
|
|
|
|
|
|
|
DATE: |
|
February 15, 2024 |
|
BY: |
|
/s/ Marcelo Eduardo |
|
|
|
|
|
|
Marcelo Eduardo, Director |
|
|
|
|
|
|
|
DATE: |
|
February 15, 2024 |
|
BY: |
|
/s/ J. Clay Hays, Jr., M.D. |
|
|
|
|
|
|
J. Clay Hays, Jr., M.D., Director |
|
|
|
|
|
|
|
DATE: |
|
February 15, 2024 |
|
BY: |
|
/s/ Gerard R. Host |
|
|
|
|
|
|
Gerard R. Host, Chair and Director |
|
|
|
|
|
|
|
DATE: |
|
February 15, 2024 |
|
BY: |
|
/s/ Harris V. Morrissette |
|
|
|
|
|
|
Harris V. Morrissette, Director |
|
|
|
|
|
|
|
DATE: |
|
February 15, 2024 |
|
BY: |
|
/s/ Thomas C. Owens |
|
|
|
|
|
|
Thomas C. Owens, Treasurer and Principal Financial Officer |
|
|
|
|
|
|
|
DATE: |
|
February 15, 2024 |
|
BY: |
|
/s/ Richard H. Puckett |
|
|
|
|
|
|
Richard H. Puckett, Director |
|
|
|
|
|
|
|
DATE: |
|
February 15, 2024 |
|
BY: |
|
/s/ William G. Yates III |
|
|
|
|
|
|
William G. Yates III, Director |
|
|
|
|
|
|
|
151