UNITED STATES
SECURITIES AND EXCHANGE COMMISSION
Washington, D.C. 20549
FORM
(Mark One)
or
for the fiscal year ended
or
or
Commission file number:
(Exact name of Registrant as specified in its charter)
N/A
(Translation of Registrant’s name into English)
(Jurisdiction of incorporation or organization)
(Address of principal )
Tel. +
Fax. + (352) 26 47 89 79
e-mail: investors@tenaris.com
(Name, Telephone, E-Mail and/or Facsimile number and Contact Person)
Securities registered or to be registered pursuant to Section 12(b) of the Act:
|
|
|
|---|---|
|
Title of Each Class
|
Name of Each Exchange On Which Registered
|
|
|
|
|
|
|
* Ordinary shares of Tenaris S.A. are not directly listed for trading but only in connection with the registration of American Depositary Shares which are evidenced by American Depositary Receipts.
Securities registered or to be registered pursuant to Section 12(g) of the Act:
None
Securities for which there is a reporting obligation pursuant to Section 15(d) of the Act:
None
Indicate the number of outstanding shares of each of the issuer’s classes of capital or common stock as of the close of the period covered by the annual report.
** Includes
Indicate by check mark if the registrant is a well-known seasoned issuer, as defined in Rule 405 of the Securities Act. Yes
If this report is an annual or transition report, indicate by check mark if the registrant is not required to file reports pursuant to Section 13 or 15(d) of the Securities Exchange Act of 1934. Yes
Note – checking the box above will not relieve any registrant required to file reports pursuant to Section 13 or 15(d) of the Securities Exchange Act of 1934 from their obligations under those Sections.
Indicate by check mark whether the registrant (1) has filed all reports required to be filed by Section 13 or 15(d) of the Securities Exchange Act of 1934 during the preceding 12 months (or for such shorter period that the registrant was required to file such reports), and (2) has been subject to such filing requirements for the past 90 days. Yes
Indicate by check mark whether the registrant has submitted electronically, every Interactive Data File required to be submitted and posted pursuant to Rule 405 of Regulation S-T (§232.405 of this chapter) during the preceding 12 months (or for such shorter period that the registrant was required to submit and post such files). Yes
Indicate by check mark whether the registrant is a large accelerated filer, an accelerated filer, a non-accelerated filer, or an emerging growth company. See definition of “large accelerated filer,” “accelerated filer,” and “emerging growth company” in Rule 12b-2 of the Exchange Act:
|
|
|
|
|
|
Accelerated Filer |
Non-accelerated filer |
|
|
|
Emerging growth company |
If an emerging growth company that prepares its financial statements in accordance with U.S. GAAP, indicate by check mark if the registrant has elected not to use the extended transition period for complying with any new or revised financial accounting standards† provided pursuant to Section 13(a) of the Exchange Act.
† The term “new or revised financial accounting standard” refers to any update issued by the Financial Accounting Standards Board to its Accounting Standards Codification after April 5, 2012.
Indicate by check mark whether the registrant has filed a report on and attestation to its management’s assessment of the effectiveness of its internal control over financial reporting under Section 404(b) of the Sarbanes-Oxley Act (15 U.S.C. 7262(b)) by the registered public accounting firm that prepared or issued its audit report.
If securities are registered pursuant to Section 12(b) of the Act, indicate by check mark whether the financial statements of the registrant included in the filing reflect the correction of an error to previously issued financial statements.
Indicate by check mark whether any of those error corrections are restatements that required a recovery analysis of incentive based compensation received by any of the registrant’s executive officers during the relevant recovery period pursuant to §240.10D-1(b).
Indicate by check mark which basis of accounting the registrant has used to prepare the financial statements included in this filing:
|
|
|
|
|
U.S. GAAP |
|
Other |
If “Other” has been checked in response to the previous question indicate by check mark which financial statement item the registrant has elected to follow. Item 17 Item 18
If this is an annual report, indicate by check mark whether the registrant is a shell company (as defined in Rule 12b-2 of the Exchange Act). Yes
Please send copies of notices and communications from the Securities and Exchange Commission to:
|
|
|
|
Diego E. Parise Mitrani, Caballero & Ruiz Moreno Abogados Bouchard 680, 13th Floor (C1106ABJ) Buenos Aires, Argentina (54 11) 4590-8600 |
Patrick S. Brown, Esq. Sullivan & Cromwell LLP 1888 Century Park East Los Angeles, California 90067-1725 (310) 712-6600 |
TABLE OF CONTENTS
|
|
 |
| Annual Report 2023 |
FORM 20-F CROSS REFERENCE GUIDE
|
Item |
Item in Form 20-F |
Cross-reference to consolidated management report |
|
|
|
|
|
Part I |
|
|
|
Item 1 |
Identity of Directors , Senior Management and Advisors |
None - Not applicable |
|
Item 2 |
Offer Statistics and Expected Timetable |
None - Not applicable |
|
Item 3 |
Key Information |
Key Information |
|
3.A |
[Reserved] |
|
|
3.B |
Capitalization and Indebtedness |
None - Not applicable |
|
3.C |
Reasons for the Offer and Use of Proceeds |
None - Not applicable |
|
3.D |
Risk Factors |
Key Information - Risk Factors |
|
Item 4 |
Information on the Company |
Information on the Company |
|
4.A |
History and Development of the Company |
Information on the Company - History and Development of the Company |
|
4.B |
Business Overview |
Information on the Company - Business Overview |
|
4.C |
Organizational Structure and Subsidiaries |
Information on the Company - Organizational Structure and Subsidiaries |
|
4.D |
Property, Plant and Equipment |
Information on the Company - Business Overview |
|
Item 4A |
Unresolved Staff Comments |
None - Not applicable |
|
Item 5 |
Operating and Financial Review and Prospects |
Operating and Financial Review and Prospects - Overview |
|
5.A |
Operating Results |
Operating and Financial Review and Prospects - Operating Results |
|
5.B |
Liquidity and Capital Resources |
Operating and Financial Review and Prospects - Liquidity and Capital Resources |
|
5.C |
Research and Developments, Patents and Licenses, Etc. |
Information on the Company - Business Overview |
|
5.D |
Trend Information |
Operating and Financial Review and Prospects - Trend Information |
|
5.E |
Critical Accounting Estimates |
Operating and Financial Review and Prospects - Critical Accounting Estimates |
|
Item 6 |
Directors, Senior Management and Employees |
Directors, Senior Management and Employees |
|
6.A |
Directors and Senior Management |
Directors, Senior Management and Employees - Directors and Senior Management |
|
6.B |
Compensation |
Directors, Senior Management and Employees - Compensation |
|
6.C |
Board Practices |
Directors, Senior Management and Employees - Board Practices |
|
6.D |
Employees |
Directors, Senior Management and Employees - Employees |
|
6.E |
Share Ownership |
Directors, Senior Management and Employees - Share Ownership |
|
6.F |
Disclosure of a Registrant’s Action to Recover Erroneously Awarded Compensation |
None - Not applicable |
|
Item 7 |
Major Shareholders and Related Party Transactions |
Major Shareholders and Related Party Transactions |
|
7.A |
Major Shareholders |
Major Shareholders and Related Party Transactions - Major Shareholders |
|
7.B |
Related Party Transactions |
Major Shareholders and Related Party Transactions - Related Party Transactions |
|
7.C |
Interest of Experts and Counsel |
None - Not applicable |
|
Item 8 |
Financial Information |
Financial Information |
|
8.A |
Consolidated Statements and Other Financial Information |
Financial Information - Consolidated Statements and Other Financial Information |
|
8.B |
Significant Changes |
None - Not applicable |
|
Item 9 |
The Offer and Listing |
The Offer and Listing |
|
9.A |
Offer and Listing Details |
The Offer and Listing - Offer and Listing Details |
|
|
|
|
|
9.B |
Plan of Distribution |
None - Not applicable |
|
9.C |
Markets |
The Offer and Listing - Offer and Listing Details |
|
9.D |
Selling Shareholders |
None - Not applicable |
|
9.E |
Dilution |
None - Not applicable |
|
9.F |
Expenses of the Issue |
None - Not applicable |
|
Item 10 |
Additional Information |
Additional Information |
|
10.A |
Share Capital |
None - Not applicable |
|
10.B |
Memorandum and Articles of Association |
Corporate Governance Statement - Corporate Governance |
|
10.C |
Material Contracts |
Information on the Company - Business Overview |
|
10.D |
Exchange Controls |
Additional Information - Exchange Controls |
|
10.E |
Taxation |
Additional Information - Taxation |
|
10.F |
Dividends and Paying Agents |
None - Not applicable |
|
10.G |
Statement by Experts |
None - Not applicable |
|
10.H |
Documents on Display |
Additional Information - Documents on Display |
|
10.I |
Subsidiary Information |
None - Not applicable |
|
10.J |
Annual Report to Security Holders |
None - Not applicable |
|
Item 11 |
Quantitative and Qualitative Disclosure about Market Risk |
Quantitative and Qualitative Disclosure about Market Risk |
|
Item 12 |
Description of Securities Other Than Equity Securities |
Description of Securities Other Than Equity Securities |
|
12.A |
Debt Securities |
None - Not applicable |
|
12.B |
Warrants and Rights |
None - Not applicable |
|
12.C |
Other Securities |
None - Not applicable |
|
12.D |
American Depositary Shares |
Description of Securities Other Than Equity Securities - American Depositary Shares |
|
|
|
|
|
|
|
|
|
Part II |
|
|
|
Item 13 |
Defaults, Dividend Arrearages and Delinquencies |
None - Not applicable |
|
Item 14 |
Material Modifications to the Rights of Security Holders and Use of Products |
None - Not applicable |
|
Item 15 |
Controls and Procedures |
Controls and Procedures |
|
Item 16 |
[Reserved] |
|
|
Item 16A |
Audit Committee Financial Expert |
Audit Committee Financial Expert |
|
Item 16B |
Code of Ethics |
Code of Ethics |
|
Item 16C |
Principal Accountant Fees and Services |
Principal Accountant Fees and Services |
|
Item 16D |
Exemption from the Listing Standards for Audit Committee |
None - Not applicable |
|
Item 16E |
Purchases of Equity Securities by the Issuer and Affiliated Purchasers |
Purchases of Equity Securities by the Issuer and Affiliated Purchasers |
|
Item 16F |
Change in Registrant's Certifying Accountant |
Change in Registrant's Certifying Accountant |
|
Item 16G |
Corporate Governance |
Corporate Governance Statement |
|
Item 16H |
Mine Safety Disclosure |
None - Not applicable |
|
Item 16I |
Disclosure Regarding Foreign Jurisdictions that Prevent Inspections |
None - Not applicable |
|
Item 16K |
Cybersecurity |
Cybersecurity |
|
|
|
|
|
Part III |
|
|
|
Item 17 |
Financial Statements |
Financial Statements |
|
Item 18 |
Financial Statements |
Financial Statements |
|
Item 19 |
Exhibits |
Exhibits |
 | |
| Annual Report 2023 |
2023 has been an outstanding year for Tenaris with record financial results under most metrics: net sales of $14.9 billion, EBITDA of $4.9 billion, net income of $4.0 billion, operating cash flow of $4.4 billion. As a global supplier of pipes to the energy industry, we have developed a unique presence in the most challenging developments in the oil and gas industry, serving its most important players.
With these results and net cash of $3.4 billion in our balance sheet, we are increasing returns to shareholders. We are proposing to increase our annual dividend to 60 cents per share. Together with the share buyback program we initiated in November, this would imply an 8% yield to shareholders for the year at current prices.
We have extended the perimeter of our operations through a series of acquisitions. In Saudi Arabia, we increased our stake in GPC to gain a controlling position in this large diameter welded pipe mill that produces conductor casing and large diameter line pipe. With the acquisition of the Shawcor pipe coating business, we are strengthening our line pipe business, especially for offshore line pipe, where Shawcor has a leading position in anti-corrosive and insulation coatings. In the United States, we increased the flexibility and overall capacity of our US industrial system by acquiring additional heat treatment and threading facilities. Each of these integrations to our global industrial system enhances our capacity to serve our wide customer base with a growing range of products and services.
Our globally integrated industrial and supply chain systems produced and shipped over four million tons of pipes to customers around the world last year. Many of these pipes are delivered directly to our customer operations in the field under our Rig Direct® service program that now serves over 500 rigs worldwide.
Under this program, which requires investment in working capital, service yard infrastructure, logistics and digital systems, we are enhancing customer intimacy and differentiation, adding services to simplify customer operations and reduce on-site labor requirements. With our Rig Direct® program, which now incorporates our RunReadyTM service, we are reducing inventories in North America and transforming the supply chain. We are also extending our Rig Direct® service to other regions around the world.
In the U.S. and Canada, we have strengthened our positioning among large operators. We were recently awarded a long-term agreement by ExxonMobil to serve their unconventional operations in the United States which confirms the preference that large operators are giving to our industrial footprint, specialized products and supply service. We are now serving the ten largest operators in the country, who have maintained a stable level of operations even as the overall rig count in the U.S. has declined.
Our sales for offshore operations and projects grew more than 50% during the year. In Guyana, where the development of prolific deepwater reserves is transforming the country, we are serving ExxonMobil’s operations under a long-term contract, while in Brazil we are supplying Petrobras with a wide range of products for the Buzios development. We are also supplying a number of offshore gas pipeline projects around the world.
Our sales are growing in the Middle East, where we have increased our local content and presence. In Saudi Arabia, Aramco, while postponing some of offshore oil expansion plans, is expanding its conventional and unconventional gas drilling activity. We are supplying premium seamless OCTG following a tender awarded to replenish depleted stocks and are ramping up deliveries of conductor and surface casing from our local welded pipe subsidiaries. The growth in gas drilling activity will also provide valuable opportunities for sales of line pipe as Aramco proceeds with its master gas pipeline program.
We recently inaugurated a new industrial complex in Abu Dhabi, along with officials from ADNOC and the Ministry of Industry and Advanced Technology. This includes a new premium threading facility, training facilities and an expanded service yard, which will support the Rig Direct® service we are providing to ADNOC under our long-term agreement, and contribute to industrial development in the Emirates.
Our industrial system, operating at a high level through the year, has performed well in supporting our global positioning. In relation to safety, however, we had three fatalities in our operations after four years with none. We deeply regret the loss of life and are reinforcing our preventive actions with a particular focus on the activities of contractors working in our system.
| |
| Annual Report 2023 |
We made a significant advance in our decarbonization program, when, after a $200 million investment, we successfully put into operation our first wind farm in Argentina. The Buena Ventura wind farm now supplies 100 MW of power, through the interconnected grid, to our industrial facilities in Campana, meeting close to 50% of its total electric power requirements and contributing to a lower energy costs. We are now moving forward with a similar investment to build a second wind farm.
Our community education programs, which reach 10,500 students, are also enjoying success in improving education standards and outcomes. The Roberto Rocca Technical School in Campana, in its tenth year, was nominated as one of the top ten schools in the world for innovation. Its students, who benefit from the school’s inclusive approach, comfortably outperform the national private school average in subjects like Maths. Over 90% of those graduating from the school have entered university and many have additionally obtained attractive job placements while furthering their education.
As we look forward to 2024, Tenaris, with its extended global reach, enhanced competitive differentiation and exceptional financial position, is well placed to strengthen its positioning around the world. The current favorable market conditions in the Middle East and offshore, are expected to continue through the year while, in the Americas, we are consolidating a solid position ready to seize further opportunities as they arise.
Around the world, demand for primary energy is growing and will continue to grow to meet the needs of developing countries. The energy transition is advancing with increasing levels of investment in clean energy and decarbonization of supply chains. Continued investment in oil and gas will also be required for many more years to accompany this transition and secure affordable energy for all.
I would like to give a special thanks to our employees, without whose continuous efforts and commitment, our many achievements during 2023 would not have been possible. I would also like to thank our customers, shareholders and suppliers for the confidence they continue to place in us.
Sincerely,
| /s/Paolo Rocca | |
| Paolo Rocca | |
| March 27, 2024 |
| |
| Annual Report 2023 |
Unless otherwise specified or if the context so requires:
- References in this annual report to “the Company” are exclusively to Tenaris S.A., a Luxembourg société anonyme.
- References in this annual report to “Tenaris”, “we”, “us” or “our” are to Tenaris S.A. and its consolidated subsidiaries. See “II. Accounting Policies A. Basis of presentation” and “II. Accounting Policies B. Group accounting” to our audited consolidated financial statements included in this annual report.
- References in this annual report to “San Faustin” are to San Faustin S.A., a Luxembourg société anonyme and the Company’s controlling shareholder.
- “shares” refers to ordinary shares, par value $1.00, of the Company.
- “ADSs” refers to the American Depositary Shares, which are evidenced by American Depositary Receipts, and represent two shares each.
- “OCTG” refers to oil country tubular goods. See “Information on the Company – Business Overview – Our Products”.
- “tons” refers to metric tons; one metric ton is equal to 1,000 kilograms, 2,204.62 pounds, or 1.102 U.S. (short) tons.
- “billion” refers to one thousand million, or 1,000,000,000.
- “U.S. dollars”, “US$”, “USD” or “$” each refers to the United States dollar.
- “EUR” refers to the Euro.
- “ARS” refers to the Argentine peso.
- “BRL” refers to the Brazilian real.
| |
| Annual Report 2023 |
Accounting Principles
We prepare our consolidated financial statements in accordance with International Financial Reporting Standards (“IFRS” or “IFRS Accounting Standards”), as issued by the International Accounting Standards Board (“IASB”), and in accordance with IFRS, as adopted by the European Union. IFRS differs in certain significant aspects from generally accepted accounting principles in the United States, commonly referred to as U.S. GAAP. Additionally, this annual report includes certain non-IFRS alternative performance measures such as EBITDA, Net cash/debt position and Free Cash Flow. See Exhibit 15.2 for more details on these alternative performance measures.
We publish consolidated financial statements presented in increments of a thousand U.S. dollars. This annual report includes our audited consolidated statements of financial position as of 31 December 2023 and 2022, and the related consolidated income statements, consolidated statements of comprehensive income, consolidated statements of changes in equity and consolidated statements of cash flows for each of the three years in the period ended 31 December 2023, including the related notes (collectively referred to as the “consolidated financial statements”).
Rounding
Certain monetary amounts, percentages and other figures included in this annual report have been subject to rounding adjustments. Accordingly, figures shown as totals in certain tables may not be the arithmetic aggregation of the figures that precede them, and figures expressed as percentages in the text may not total 100% or, as applicable, when aggregated may not be the arithmetic aggregation of the percentages that precede them.
Our Internet Website is Not Part of this Annual Report
We maintain an Internet website at www.tenaris.com. Information contained in or otherwise accessible through our Internet website is not a part of this annual report. All references in this annual report to this Internet site are inactive textual references to these URLs, or “uniform resource locators” and are for informational reference only. We assume no responsibility for the information contained on our Internet website.
Industry Data
Unless otherwise indicated, industry data and statistics (including historical information, estimates or forecasts) in this annual report are contained in or derived from internal or industry sources believed by Tenaris to be reliable. Industry data and statistics are inherently predictive and are not necessarily reflective of actual industry conditions. Such statistics are based on market research, which itself is based on sampling and subjective judgments by both the researchers and the respondents, including judgments about what types of products and transactions should be included in the relevant market. In addition, the value of comparisons of statistics for different markets is limited by many factors, including that (i) the markets are defined differently, (ii) the underlying information was gathered by different methods and (iii) different assumptions were applied in compiling the data. Such data and statistics have not been independently verified, and the Company makes no representation as to the accuracy or completeness of such data or any assumptions relied upon therein.
| |
| Annual Report 2023 |
This annual report and any other oral or written statements made by us to the public may contain “forward-looking statements” within the meaning of and subject to the “safe harbor” provisions of the Private Securities Litigation Reform Act of 1995. This annual report contains forward-looking statements, including with respect to certain of our plans and current goals and expectations relating to Tenaris’s future financial condition and performance.
Sections of this annual report that by their nature contain forward-looking statements include, but are not limited to, “Key Information”, “Information on the Company”, “Operating and Financial Review and Prospects”, “Financial Information” and “Quantitative and Qualitative Disclosure About Market Risk”.
We use words and terms such as “aim”, “will likely result”, “will continue”, “contemplate”, “seek to”, “future”, “objective”, “goal”, “should”, “will pursue”, “anticipate”, “estimate”, “expect”, “project”, “intend”, “plan”, “believe” and words and terms of similar substance to identify forward-looking statements, but they are not the only way we identify such statements. All forward-looking statements are management’s present expectations of future events and are subject to a number of factors and uncertainties that could cause actual results to differ materially from those described in the forward-looking statements. These factors include the risks related to our business and industry discussed under “Key Information – Risk Factors”, including among them, the following:
- our ability to implement our business strategy and to adapt it adequately to the energy transition;
- our ability to grow through acquisitions, joint ventures and other investments, or integrate newly acquired businesses or assets;
- our ability to provide value added products and services and price such products and services in accordance with our strategy;
- trends in the levels of investment in oil and gas exploration and drilling worldwide;
- the competitive environment or level of consolidation in our business and our industry;
- the impact of climate change legislation, including increasing regulatory requirements and extensive technology and market changes aimed at transitioning to a lower-carbon economy and reducing greenhouse gas (“GHG”) emissions;
- the physical risks resulting from climate change, including natural disasters, increased severity of extreme weather events, chronic climate changes and long-term shifts in weather patterns;
- our ability to absorb cost increases and to secure supplies of essential raw materials and energy;
- our ability to adjust fixed and semi-fixed costs to fluctuations in product demand;
- the impact of the world’s economy on the energy sector in general, or our business and operations;
- general macroeconomic changes, including high inflation rates, inflation containment measures and foreign exchange measures, as well as, international conflicts, public health epidemics and other political, social, or economic conditions and developments in the countries in which we operate or distribute pipes, including developments in connection with the Russia-Ukraine and Middle East armed conflicts; and
- changes to applicable laws and regulations, including the imposition of tariffs or quotas or other trade barriers.
By their nature, certain disclosures relating to these and other risks are only estimates and could be materially different from what actually occurs in the future. As a result, actual future gains or losses or other occurrences or developments that may affect our financial condition and results of operations could differ materially from those that have been estimated. You should not place undue reliance on forward-looking statements, which speak only as of the date of this annual report. Except as required by law, we are not under any obligation, and expressly disclaim any obligation to, update or alter any forward-looking statements, whether as a result of new information, future events or otherwise.
| |
| Annual Report 2023 |
You should carefully consider the risks and uncertainties described below, together with all other information contained in this annual report, before making any investment decision. Any of these risks and uncertainties could have a material adverse effect on our business, revenues, financial condition and results of operations, which could in turn affect the price of shares and ADSs.
Risks Relating to Our Business and Industry
Sales and profitability may fall as a result of downturns in the international price of oil and gas and other factors and circumstances affecting the oil and gas industry
We are a global steel pipe manufacturer with a strong focus on manufacturing products and providing related services for the oil and gas industry. The oil and gas industry is a major consumer of steel pipe products worldwide, particularly for products manufactured under high quality standards and demanding specifications. Demand for steel pipe products from the oil and gas industry has historically been volatile and depends primarily upon the number of oil and natural gas wells being drilled, completed and reworked, and the depth, length and drilling conditions of these wells. The level of exploration, development and production activities of, and the corresponding capital spending by, oil and gas companies, including national oil companies, depends primarily on current and expected future prices of oil and natural gas and is sensitive to the industry’s view of future economic growth and the resulting impact on demand for oil and natural gas. Several factors, such as the supply and demand for oil and gas, the development and availability of new drilling technology, political and global economic conditions, and government regulations affect these prices. Among others, the following factors have had or are likely to have an impact on oil and gas prices:
- drilling technology has allowed producers in the United States and Canada to increase production from their reserves of tight oil and shale gas in response to changes in market conditions more rapidly than in the past;
- consolidation in the oil and gas industry is likely to impact prices, with 2023 marking a year of rapid consolidation in the U.S. oil and gas industry. In October 2023, ExxonMobil (“Exxon”) agreed to acquire Pioneer Natural Resources for $60 billion, a transaction that would make Exxon the largest operator in the Permian Basin, the highest producing oil field in the United States; Chevron followed suit by striking a deal to acquire Hess in a $53 billion transaction that would provide the company with access to reserves in Guyana. Upstream operators such as Diamondback Energy, Permian Resources, and Ovintiv have also announced acquisitions in recent months to expand their North American footprint and shale inventory;
- government initiatives to reduce GHG emissions, such as the introduction of a carbon tax or carbon-pricing systems (such as the EU Carbon Border Adjustment Mechanism), the adoption of “cap-and-trade” systems (such as the EU Emissions Trading System (“ETS”)) or other measures to promote the use of renewable energy sources, or electric vehicles, are also expected to affect oil and gas prices. For more information on risks relating to climate change regulations, see “Key Information – Risk Factors – Risks Relating to Our Business and Industry - Climate change legislation and increasing regulatory requirements aimed at transitioning to a lower-carbon economy may reduce demand for our products and services and result in unexpected capital expenditures and costs, and negatively affect our reputation.”
When the price of oil and gas falls, oil and gas companies generally reduce spending on production and exploration activities and, accordingly, make fewer purchases of steel pipe products. Major oil-and gas-producing nations and companies have frequently collaborated to balance the supply (and thus the price) of oil in the international markets. A major vehicle for this collaboration has been the Organization of Petroleum Exporting Countries (“OPEC”) and many of our customers are state-owned companies in member countries of OPEC, which plays a significant role in trying to counter falling prices, as was the case in 2020, when the industry was hit by the effects of the COVID-19 pandemic.
| |
| Annual Report 2023 |
Climate change legislation and increasing regulatory requirements aimed at transitioning to a lower-carbon economy may reduce demand for our products and services and result in unexpected capital expenditures and costs, and negatively affect our reputation
There is an increased attention on GHG emissions and climate change from different sectors of society. The Paris Agreement, adopted at the 2015 United Nations Climate Conference, sets out the global framework to limit the rising temperature of the planet and to strengthen the countries’ ability to deal with the effects of climate change. The EU ETS signaled a major EU energy policy to combat global warming based on a “cap & trade” program, and the European Green Deal, launched in 2019, focuses on adopting the required policies and measures aimed at reaching zero GHG emissions in Europe by 2050. The EU taxonomy classification system, which establishes a list of environmentally sustainable economic activities, is designed to help the EU scale up sustainable investment and implement the European Green Deal. More recently, the EU adopted the Corporate Sustainability Reporting Directive (“CSRD”), which requires European large and medium companies and listed issuers to disclose information on their risks and opportunities arising from social and environmental issues, and on the impacts of their activities on people and the environment (which, in the case of the Company, will apply with respect to its 2024 annual report). In the United States, the U.S. Inflation Reduction Act of 2022 calls for a reduction of carbon emissions by roughly 40% by 2030. Also, in response to an increasing investor focus and reliance on climate and Environmental, Social and Governance (“ESG”) related disclosure and investment, the U.S. Securities and Exchange Commission (“SEC”) adopted, in March 2024, climate-related disclosure rules that will require registrants, including Tenaris from fiscal year 2025, to significantly expand the climate-related disclosures in their periodic reports, including information about climate-related risks that are reasonably likely to have a material impact on their business, results of operations, or financial condition, and certain climate-related financial statement metrics in a note to their audited financial statements. Other countries are introducing or considering similar measures or regulations, which aim at lowering emissions or which enhance disclosure of climate-related matters, including carbon emissions. If there is no meaningful progress in lowering emissions in the years ahead, there is an increased likelihood of abrupt policy interventions as governments attempt to meet their environmental goals by adopting policy, legal, technology and market changes in the transition to a low-carbon global economy.
We provide products and services to the oil and gas industry, which accounts, directly and indirectly, for a significant portion of GHG emissions. Existing and future legislation and regulations related to GHG emissions (such as increased pricing of GHG emissions and enhanced emissions-reporting obligations) and climate change, as well as government initiatives to promote the use of alternative energy sources and substitute existing products and services with lower emissions options (with many jurisdictions implementing tax advantages and other subsidies to promote the development of renewable energy sources, or even requiring minimum thresholds for power generation from renewable sources) may significantly curtail demand for and production of fossil fuels, such as oil and natural gas. These initiatives, together with the growing social awareness regarding climate change and other environmental matters, have resulted in increased investor and consumer demand for renewable energy and additional compliance requirements for fossil energy projects, which are likely to become more stringent over time and to result in substantial increases in costs for the oil and natural gas industry, potentially leading to write-offs and early retirement of existing assets. Furthermore, ongoing technological developments in the renewable energy industry are making renewable energy increasingly competitive with fossil-fuels. If this trend continues, energy demand could shift increasingly towards more environmentally sustainable sources such as hydroelectrical, solar, wind and other renewable energies, which would, in turn, reduce demand for oil and natural gas, thus negatively affecting demand for our products and services and, ultimately, our future results of operations. In addition, adoption of new climate change legislation in the countries in which Tenaris operates could result in incremental operating costs (such as incremental compliance costs and increased insurance premiums) and unexpected capital expenditures and, eventually, affect our competitiveness and reduce our market share. Also, shifts in customer preferences and failure to respond to shareholders’ demand for climate-related measures and environmental standards could harm our reputation, adversely affect the ability or willingness of our customers or suppliers to do business with us, negatively impact workforce management and planning, erode stakeholder support and restrict or reduce access to financial resources. For more information on Tenaris’s climate change initiatives, please see “Operating and Financial Review and Prospects – Overview – Climate Change”.
| |
| Annual Report 2023 |
The physical risks resulting from climate change, including extreme weather conditions and shifts in weather patterns, have in the past and may in the future adversely affect our operations and financial results
Our business has been, and in the future could be, affected by severe weather in areas where we operate, which could materially affect our operations and financial results. Extreme weather conditions and natural disasters such as hurricanes, extreme wind, flooding or coastal storm surges have resulted, and may in the future result, in the shutdown of our facilities, evacuation of our employees, and activity disruptions at our clients’ well-sites or in our supply chain. For example, the severe freeze in the United States and Mexico in early 2021, caused gas and power shortages in Texas, resulting in additional costs and production disruptions and losses.
Chronic climate changes, such as changes in precipitation patterns and rises in average temperatures and sea levels, may result in increased operating costs or capital expenditures due to supply shortages or damage to facilities, higher insurance premiums or reduced availability of insurance, decreases in revenue derived from lower production capacity, and write-offs or early retirement of assets, all of which could adversely affect our financial condition, results of operations and cash flows. For more information on Tenaris’s climate change initiatives, please see “Operating and Financial Review and Prospects – Overview – Climate Change”.
Competition in the global market for steel pipe products may cause us to lose market share and hurt our sales and profitability
The global market for steel pipe products is highly competitive, with the primary competitive factors being price, quality, service and technology. In recent years, substantial investments have been made, especially in China but also in the United States and the Middle East, to increase production capacity of seamless steel pipe products, and as a result there is significant excess production capacity, particularly for “commodity” or standard product grades. Production capacity of more specialized product grades has also increased. At the same time, the high cost and long lead times required to develop the most complex projects, particularly deepwater projects, led to a slowdown in new developments in a context of low and more volatile oil prices. Despite our efforts to develop products and services that differentiate us from our competitors, reduced demand for steel pipe products from these complex projects means that the competitive environment is expected to remain intense in the coming years and our effective competitive differentiation, together with our ability to vertically integrate and to provide value added services, will be key success factors. In addition, there is a risk of unfairly traded steel pipe imports in markets in which Tenaris produces and sells its products, and we can give no assurance with respect to the application of antidumping duties and tariffs or the effectiveness of any such measures.
Our sales may be affected as a result of antidumping and countervailing duty proceedings or by the imposition of other import restrictions or local content requirements
Because of the global nature of our operations, we export and import products from several countries and, in many jurisdictions, we supplement domestic production with imported products. We import OCTG from Argentina and Mexico to complement our significant and growing production in the United States. From time to time, local producers seek the imposition of import restrictions or the initiation of antidumping or countervailing duty proceedings. For example, in October 2021, the U.S. Department of Commerce (“DOC”) initiated antidumping duty investigations of OCTG imports from Argentina, Mexico, and Russia and countervailing duty investigations of OCTG imports from Russia and South Korea, which resulted in a determination by the International Trade Commission (“ITC”), issued in October 2022, that the imports under investigation caused injury to the U.S. OCTG industry, bringing the investigation phase to a conclusion. Although Tenaris and other parties have appealed the agencies’ determinations from the investigation to the Court of International Trade, Tenaris is required to pay antidumping duty deposits while the order is in effect. For more information on this matter, please refer to note 27 “Contingencies, commitments and restrictions to the distribution of profits” to our audited consolidated financial statements included in this annual report. Antidumping or countervailing duty proceedings, any resulting penalties or any other form of import restriction have in the past impeded, and may in the future restrict, our access to important export markets for our products, thereby adversely impacting our sales or limiting our opportunities for growth.
| |
| Annual Report 2023 |
In addition, several jurisdictions have begun to impose or expand local content requirements. For example, in recent years Saudi Arabia has implemented various measures aimed at increasing local content particularly from suppliers to state-owned companies such as Saudi Arabian Oil Company (“Saudi Aramco”) and we can expect that measures favoring the development of local production will increase as Saudi Arabia seeks to create employment opportunities for its citizens and diversify its economy away from its dependence on oil and gas production. Other countries, such as Brazil, Ecuador, Indonesia, Nigeria and the United Arab Emirates, have also put in place significant local content requirements. Other mechanisms, such as Europe’s Carbon Border Adjustment Mechanism (“CBAM"), could have a similar impact. For more information, see “Key Information – Risk Factors – Risks Relating to Our Business and Industry - The cost of complying with environmental regulations and potential environmental and product liabilities may increase our operating costs and negatively impact our business, financial condition, results of operations and prospects”. If countries impose or expand local content requirements or put in place regulations limiting our ability to import certain products, our competitive position could be negatively affected. Therefore, if any of these risks materialize, we may not continue to compete effectively against existing or potential producers and preserve our current shares of geographic or product markets, and increased competition may have a material impact on the pricing of our products and services, which could in turn adversely affect our revenues, profitability and financial condition.
Our sales may also be affected as a result of other international trade regulations
The shipment of goods and services across international borders subjects us to extensive trade laws and regulations. Our import and export activities are governed by customs laws and regulations in each of the countries where we operate. Moreover, the European Union, the United States and other countries control the import and export of certain goods and services and impose related import and export recordkeeping and reporting obligations. Those governments have also imposed economic sanctions against certain countries, persons and other entities, such as sanctions that restrict or prohibit transactions involving Iran, Syria, Venezuela and Russia or their citizens or companies. For more information on the impact on our business of the sanctions on Russia as a result of the armed conflict in Ukraine, see “Risks Relating to Our Business and Industry – An escalation of the Russia-Ukraine war and other armed conflicts may adversely affect our operations”. Similarly, we are subject to the U.S. anti-boycott laws. Trade laws and regulations are complex and frequently changing, and they may be enacted, amended, enforced or interpreted in a manner that could materially impact our operations. For example, in March 2018, under Section 232 of the Trade Expansion Act of 1962 (“Section 232”), the United States imposed a 25% tariff on steel articles imported from all countries, with the exemption of Canada and Mexico, as member states of the USMCA, and imports of steel tubes from Australia, Argentina, Brazil and South Korea (the latter three with specific quotas per product). The U.S. government has granted successive exemptions on imports from Italy, Mexico, Romania and Argentina, of steel billets to be used at our Bay City mill, with the latest being granted in December 2023 for the import of 200,000 tons from Argentina, Italy and Romania. Exemptions are granted only for a one-year term and future requests might not be granted, thus adversely affecting our operations or revenues. On October 31, 2021, the United States and the EU reached an agreement whereby Section 232 tariffs were replaced with tariff-rate quotas for steel melted and poured in Europe starting on January 1, 2022, and steel products imported from the EU for a period of two calendar years (i.e., until 31 December 2023) without the need to reapply. This agreement allows Tenaris to import, through December 31, 2023, up to 299,376 tons of billets from Italy and Romania without paying the 25% annual tariff. On December 28, 2023, the United States renewed this agreement allowing Tenaris to import, through December 31, 2025, up to 419,749 tons of billets from Italy and Romania per year without paying the 25% tariff. There is no guarantee that additional tariffs on steel exports to the U.S. market will not be reimposed in the future. Failure to comply with applicable trade regulations could also result in criminal and civil penalties and sanctions.
Increases in the cost of raw materials, energy and other costs, limitations or disruptions to the supply of raw materials and energy, and price mismatches between raw materials and our products may hurt our profitability
The manufacture of seamless steel pipe products requires substantial amounts of steelmaking raw materials and energy; welded steel pipe products, in turn, are processed from steel coils and plates. The availability and pricing of a significant portion of the raw materials and energy we require are subject to supply and demand conditions, which can be volatile, and to tariffs and other government regulations, which can affect continuity of supply and prices. In addition, disruptions, restrictions or limited availability of energy resources in markets where we have significant operations could lead to higher costs of production and eventually to production cutbacks at our facilities in such markets. For example, in early 2021 we suffered gas and power shortages in Texas caused by a severe freeze affecting the United States and Mexico, which resulted in additional costs and production losses. Also, the Russian invasion of Ukraine in 2022, resulted in a spike in European energy costs. Additionally, in early 2024, we experienced some delays in the delivery times to our customers in relation to orders that had to be diverted because of the ongoing shipping crisis in the Red Sea.
| |
| Annual Report 2023 |
At any given time, we may be unable to obtain an adequate supply of critical raw materials with price and other terms acceptable to us. The availability and prices of raw materials may also be negatively affected by new laws and regulations, including import controls, sanctions and other trade restrictions, allocation by suppliers, interruptions in production, accidents or natural disasters, armed conflicts, chronic climate change, changes in exchange rates, worldwide price fluctuations, and the availability and cost of transportation. For further information related to the impact on our business of the armed conflict in Ukraine, see “Key Information – Risk Factors – Risks Relating to Our Business and Industry – An escalation of the Russia-Ukraine war and other armed conflicts may adversely affect our operations”. Raw material and energy prices could also be affected by the introduction of carbon prices or taxes, or as a result of changes in production processes, such as an increased use of metal scrap, adopted by steelmaking companies seeking to reduce carbon emissions. In addition, we may not be able to recover, partially or fully, increased costs of raw materials and energy through increased selling prices for our products, or it may take an extended period of time to do so, and limited availability could force us to curtail production, which could adversely affect our sales and profitability.
Our results of operations and financial condition could be adversely affected by low levels of capacity utilization or failure to retain qualified workforce
Like other manufacturers of steel-related products, we have fixed and semi-fixed costs (e.g., labor and other operating and maintenance costs) that cannot adjust rapidly to fluctuations in product demand for several reasons, including operational constraints and regulatory restrictions. If demand for our products falls significantly, or if we are unable to operate due to, for example, governmental measures or unavailability of workforce, these costs may adversely affect our profitability and financial condition. For example, in response to the abrupt and steep downturn of the oil and gas industry resulting from the oil crisis and the COVID-19 pandemic in 2020, we were required to implement cost-containment measures and liquidity preservation initiatives, including reduction of our operating activities in several jurisdictions, temporary closure of facilities in the United States and review of our capital expenditure plans. Temporary suspensions of operations or closure of facilities generally lead to layoffs of employees, as was our case during the oil crisis and the COVID-19 pandemic, which may in turn give rise to labor conflicts and impact operations. Cost containment measures may also affect profitability and result in charges for asset impairments. In turn, in times of economic growth and high demand for our products we may not be able to retain qualified workforce or hire additional employees soon enough. For example, during the post-pandemic recovery period, when we brought production at our Bay City mill to full capacity, we faced some difficulties in hiring skilled workers. Moreover, certain consequences of climate change, such as shifts in customer preferences, stigmatization of our industry or failure to respond to shareholder demands for climate-related measures could negatively impact workforce management and planning, adversely affecting employee attraction and retention.
Adverse economic or political conditions in the countries where we operate or sell our products and services may decrease our sales or disrupt our manufacturing operations, thereby adversely affecting our revenues, profitability and financial condition
We have significant operations in various countries, including Argentina, Brazil, Canada, China, Colombia, Indonesia, Italy, Mexico, Nigeria, Romania, Saudi Arabia, the United Arab Emirates and the United States, and we sell our products and services throughout the world. Therefore, like other companies with worldwide operations, our business and operations have been, and could in the future be, affected from time to time to varying degrees by political, economic, social and public health developments and changes in laws and regulations. These developments and changes may include, among others, nationalization, expropriation or forced divestiture of assets; restrictions on production, imports and exports; antidumping or countervailing duties; travel, transportation or trade bans; interruptions in the supply of essential energy inputs; currency exchange and/or transfer restrictions, inability or increasing difficulties to repatriate income or capital or to make contract payments; inflation; devaluation; war or other armed conflicts (including the Russia-Ukraine armed conflict and regional conflicts in the Middle East and Africa); civil unrest and local security concerns, including high incidences of crime and violence involving drug trafficking organizations that threaten the safe operation of our facilities and operations; direct and indirect price controls; tax increases (including retroactive) and changes in the interpretation, application or enforcement of tax laws and other claims or challenges; cancellation of contract or property rights; and delays or denials of governmental approvals. Both the likelihood of such occurrences and their overall impact upon us vary greatly from country to country and are not predictable. Realization of these risks could have an adverse impact on the results of operations and financial condition of our subsidiaries located in the affected country and, depending on their materiality, on the results of operations and financial condition of Tenaris as a whole.
| |
| Annual Report 2023 |
More specifically, Argentina and Mexico are countries in which we have significant operations and relevant risks.
Our business and operations in Argentina may be materially and adversely affected by economic, political, social, fiscal and regulatory developments, including the following:
- Macroeconomic and political conditions in Argentina may adversely affect our business and operations. In December 2023, a new administration, led by President Javier Milei, took office in Argentina and announced a series of emergency measures to address the current critical economic situation with the objective of improving the macroeconomic situation and opening the Argentine economy. Certain measures were challenged in court by affected sectors. In addition, the new administration is struggling to get Congress’s approval for most of its reform proposals. It is uncertain the extent to which the Argentine government will be able to implement its program, which requires major structural reforms, or adopt the announced measures, marked by a majority in the Congress unwilling to endorse and support the new government’s reforms, heightened conflict between the national government and provincial governors, court decisions setting aside some of the governmental measures, resistance by social and union leaders and general social and political unrest. Adverse economic and political conditions could cause a drop in demand for our products in the domestic market, adversely affecting our operations and financial results. Similarly, they could also negatively impact the business and operations of our customers (oil and gas companies operating in Argentina) and consequently our revenues and profitability.
- Our business and operations in Argentina may be adversely affected by high inflation or by the measures that may be adopted by the government to address inflation. In particular, increases in services and labor costs could affect cost-competitiveness and margins, negatively impacting our results of operations. An economic environment characterized by high inflation could undermine Argentina’s foreign competitiveness in international markets and negatively affect economic activity and employment levels. Argentine inflation rate volatility makes it impossible to estimate with reasonable certainty the extent to which our activity levels and results of operations could be affected in the future. In addition, an increased level of labor demands in response to spiraling inflation could trigger higher levels of labor conflict, and eventually result in strikes or work stoppages involving our operations or those of our suppliers and customers. Any such disruption of operations could have an adverse effect on our operations and financial results.
- Other events that may have an adverse effect on our operations and financial results include increased taxes, currency devaluation, exchange controls, restrictions on capital flows and export and import taxes or restrictions. Between September 2019 and December 2023, the Argentine government imposed significant restrictions on foreign exchange transactions; however, the new administration eased certain restrictions and other changes to such regulations are expected. At the date of this annual report, the application of existing foreign exchange regulations remains uncertain, as is the scope and timing of upcoming changes. Currently, Argentine companies are required to repatriate export proceeds from sales of goods and services (including U.S. dollars obtained through advance payment and pre-financing facilities) and convert such proceeds into ARS at the official exchange rate. As from December 13, 2023, up to 20% of export proceeds can be sold for Argentine pesos through securities transactions resulting in a higher implicit exchange rate. This percentage has changed and is expected to change over time. Sovereign bonds were issued to pay imports of goods cleared and services rendered on or prior to December 12, 2023, but such bonds cover only a portion of the total import debts. Import payments for services rendered and goods cleared after December 12, 2023, do not require government approval but cannot be paid in advance or at sight and are subject to deferred payment schedules. In addition, import payments are subject to import taxes that significantly increase prices of imported goods and services. Argentine companies must still obtain prior Central Bank authorization, which is rarely (if ever) granted, to access the foreign exchange market to make dividend payments. For additional information on current Argentine exchange controls and restrictions, see “Additional Information – Exchange Controls – Argentina” and note 29 “Foreign exchange control measures in Argentina” of our audited consolidated financial statements included in this annual report. The existing measures limit the ability of Argentine companies to obtain foreign currency and make certain payments and distributions out of Argentina at the official exchange rate. If control systems are maintained or are tightened, our operations could be adversely affected. Given that the volatile and uncertain environment remains as of the date of this annual report, additional regulations or restrictions could further restrict our ability to access the official foreign exchange market, expose us to the risk of losses arising from fluctuations in the exchange rate between the ARS and the USD, cause disruptions to our operations due to lack of imported raw materials and other inputs, affect our ability to finance and even carry out major investments in Argentina, and/or impair our ability to convert and transfer outside the country funds generated by Argentine subsidiaries to pay dividends or royalties or make other offshore payments.
- In recent years, our operations in Argentina experienced constraints in their electricity and natural gas supply requirements on many occasions. Shortages of energy and natural gas in Argentina have led in the past (and could lead in the future) to production cutbacks negatively affecting our revenues and profitability; we could also face increased costs when using alternative sources of energy.
| |
| Annual Report 2023 |
In Mexico, our business could be materially and adversely affected by economic, political, social, fiscal and regulatory developments, including the following:
- The Mexican government exercises significant influence over the Mexican economy and, therefore, governmental actions concerning the economy and state-owned enterprises could have a significant impact on Mexico’s private sector and on our Mexican-related operations.
- We maintain a strong, longstanding relationship with Petróleos Mexicanos (“Pemex”), one of the world’s largest crude oil and condensates producers and one of our largest customers. Over the past several months, Pemex has delayed payments beyond the agreed-upon due dates, resulting in a significant credit exposure to Pemex, which represented approximately 20% of our overall credit exposure as of December 31, 2023. Historically we have not had any material write-offs due to uncollectible accounts receivable relating to this customer. Although we are in continuous conversations and Pemex is making partial payments on a periodic basis, at this stage we cannot predict whether or not our exposure to Pemex will be reduced, or the timing for any such reduction. If we are not able to reduce our exposure to Pemex and Pemex defaults on its payments, our revenues and profitability would be adversely affected.
- Our Mexican operations could also be affected by criminal violence, primarily due to the activities of drug cartels and related organized crime which has been increasing in Mexico over the last years. Although the Mexican government has implemented various security measures and has strengthened its military and police forces, drug-related crime continues to exist in Mexico. Our business may be materially and adversely affected by these activities, their possible escalation and the violence associated with them.
- In the last few years, the Mexican government made various attempts to modify rules and regulations governing the energy market in Mexico with potential impact on energy supply and its cost. Since December 2018, the Mexican government has introduced numerous changes to electricity regulations, including a March 2021 amendment to the Energy Industry Law (“LIE”), and a bill to reform the Constitution, filed in October 2021 but then rejected by the Mexican Congress, which would have practically nationalized the electricity industry. These changes are part of Mr. López Obrador’s crusade against the previous administration’s 2013 energy reform and seek to grant priority to Mexico’s state-owned electric power generation and distribution company (“CFE”), over private generators in the supply of electric power to the Mexican market and mandate a revision of power generation and transaction agreements between CFE and independent electric power suppliers. The intended reforms were challenged in court by certain members of the Senate and by affected companies, many of which sought and obtained injunctive relief. In January 2024, the Supreme Court ruled against the constitutionality of certain provisions of the LIE reform. In response, the Mexican President announced a new proposal for an ambitious constitutional reform, which covers a wide range of topics, including energy matters, with the intention of granting state-owned companies, particularly CFE and Pemex, priority over private companies on electricity dispatch. Uncertainty remains as to whether this new constitutional reform will be approved or if any new reforms will be introduced to the energy market rules and regulations, particularly in the context of the upcoming presidential elections. Any such new amendment or measures could negatively affect the operations of Tubos de Acero de Mexico S.A. (“Tamsa”) or Techgen S.A. de C.V. (“Techgen”), the power plant in which Tenaris holds a 22% equity interest and which supplies electricity for most of our Mexican operations. At this stage, we cannot assess the potential effects of any new governmental initiative on the Mexican economy in general, and particularly on our local operations and, consequently, on the results of operations and financial conditions of our businesses in Mexico.
- In the past, our operations in Mexico were disrupted due to union-led stoppages resulting from an internal dispute within the local union. Although our Mexican operations have not experienced any further disruptions caused by employee stoppages since 2020, we cannot assure that further disruptions will not occur in the future. Any future stoppage, strike, disruption of operations or new collective bargaining agreements could result in lost sales and could increase our costs, thereby affecting our results of operations.
| |
| Annual Report 2023 |
An escalation of the Russia-Ukraine war and other armed conflicts may adversely affect our operations
In February, 2022, Russia launched a military attack on Ukraine. In response, the United States, the European Union and the United Kingdom, among other countries, have imposed a wave of sanctions against certain Russian institutions, companies and citizens. The Russian Government has retaliated by banning airlines from its airspace and has ordered economic counter measures, including restrictions on residents transferring foreign currency abroad. It has been two years since the conflict began and any resolution and timing thereof still remains uncertain. Russia is a major supplier of oil and gas in Europe and worldwide, and Russia and Ukraine are both major global suppliers of internationally traded steelmaking raw materials and semi-finished steel products. As a result of the armed conflict and related sanctions, energy and commodity prices spiked upwards and foreign trade transactions involving Russian and Ukrainian counterparties have been severely affected. A long-standing conflict makes it hard to predict how energy and commodity prices will continue to behave as higher prices and possible shortages of energy and raw materials used in our steelmaking operations (including natural gas and electric energy, particularly in Europe, steel scrap, pig iron, direct reduced iron (“DRI”), hot briquetted iron (“HBI”), ferroalloys, steel bars, coils and plates) would result in higher production costs and potential plant stoppages, affecting our profitability and results of operations. As a result of existing or future economic sanctions imposed on Russia, we or our contractors (including shipping companies) may not be able to continue purchasing products from, or making payments to, Ukrainian or Russian suppliers or counterparties; and we may not be able to promptly procure such raw materials from other suppliers, or we may be required to purchase raw materials at increased prices.
We have suspended any sales to Russian customers or purchases from Russian suppliers that would breach applicable sanctions, and we have closed our representative office in Moscow. Furthermore, in March 2022, we recorded an impairment in the amount of approximately $14.9 million, fully impairing our investment in our joint venture in Russia with Severstal.
Other ongoing armed conflicts, including the Middle East conflict and the ongoing shipping crisis in the Red Sea, may disrupt our operations, increase our costs, and adversely affect our delivery times.
If we do not successfully implement our business strategy, our ability to grow, our competitive position and our sales and profitability may suffer
We plan to continue implementing our business strategy of consolidating our position as a leading global supplier of integrated product and service solutions to the energy and other industries and adapting to the energy transition through reducing the carbon emissions in our operations and developing and supplying products and services for low-carbon energy applications, as well as continuing to pursue strategic investment opportunities. Any of the components of our overall business strategy could cost more than anticipated (including as a result of increasing regulatory requirements aimed at transitioning to a lower-carbon economy), may not be successfully implemented or could be delayed or abandoned. For example, we may fail to create sufficient differentiation in our Rig Direct® services to compensate the added costs of providing such services, or fail to find suitable investment opportunities, including acquisition targets that enable us to continue to grow and maintain or improve our competitive position.
In addition, acquisitions may be subject to challenges or investigations by governmental authorities, including antitrust and consumer-protection authorities. The costs of complying with authorization or investigation procedures may be significant. Also, antitrust authorities are looking very closely at the effects of acquisitions and may deny authorizations, impose conditions that may result in significant costs or deprive Tenaris of the advantages and expected synergies of acquisitions, or initiate investigation upon challenges brought by third parties. Challenges to acquisitions or other investments, and failure to obtain, or conditions imposed for the granting of, authorizations may prevent or delay transactions, which could have an adverse effect on our financial condition and results of operations.
Even if we successfully implement our business strategy, it may not yield the expected results, or decisions by our joint venture partners may frustrate our initiatives. For example, we were forced to terminate our joint venture with JFE Holdings Inc. (“JFE”) with respect to NKKTubes K.K. (“NKKTubes”) as a result of JFE’s unilateral decision to close down operations at one of its steel complexes. For further information on the termination of the NKKTubes joint venture, please refer to note 36 “Termination of NKKTubes joint venture” to our audited consolidated financial statements included in this annual report.
| |
| Annual Report 2023 |
Future acquisitions, strategic partnerships and capital investments may not perform in accordance with expectations or may disrupt our operations and hurt our profits
One element of our business strategy is to identify and pursue growth-enhancing strategic opportunities. As part of that strategy, we regularly make significant capital investments and acquire interests in, or businesses of, various companies. Consistent with our growth strategy, we intend to continue considering strategic acquisitions, investments and partnerships from time to time to expand our operations and establish a local presence in our markets. We must necessarily base any assessment of potential acquisitions, joint ventures and capital investments on assumptions with respect to timing, profitability, market and customer behavior and other matters that may subsequently prove to be incorrect. For example, we negotiated the terms for our $1.0 billion acquisition of IPSCO Tubulars Inc. (“IPSCO”) in early 2019 based on assumptions made at that time, but due to the length of the antitrust review process, we were able to complete the acquisition only in 2020 under materially worse market circumstances. Our past or future acquisitions, significant investments and alliances may not perform in accordance with our expectations and could adversely affect our operations and profitability. In addition, new demands on our existing organization and personnel resulting from the integration of new acquisitions could disrupt our operations and adversely affect our operations and profitability. Moreover, as part of future acquisitions, we may acquire assets that are unrelated to our business, and we may not be able to integrate these assets or sell them under favorable terms and conditions. For example, in November 2023, Tenaris completed the acquisition of Mattr Corporation’s (“Mattr”) pipe coating business unit. The acquired business includes nine plants located in Canada, Mexico, Norway, Indonesia, the United Arab Emirates and the United States, and several mobile concrete plants. The business also includes world-class R&D facilities in Toronto and Norway and a wide intellectual property product portfolio. The integration of the newly acquired business is expected to present particular challenges considering that the acquired business operations are spread over many jurisdictions, the acquisition results in the addition of nearly 2,800 employees to our workforce, and existing systems and processes need to be integrated into those of Tenaris.
Disruptions to our manufacturing processes could adversely impact our operations, affect customer service levels or our reputation, or expose us to liability and, consequently, adversely affect our financial results
Our steel pipe manufacturing processes depend on the operation of critical steelmaking equipment, such as electric arc furnaces (“EAF”), continuous casters, rolling mills, heat treatment and various operations that support them, such as our power generation facilities. Despite the investments we make to maintain critical production equipment, such equipment may incur downtime as a result of unanticipated failures or other events, such as fires, explosions, floods, earthquakes, accidents and severe weather conditions.
Similarly, natural disasters or severe weather conditions, including those related to climate change, could significantly damage our production facilities and general infrastructure or affect the normal course of business. For example, our Mexican production facility located in Veracruz is located in a region prone to earthquakes, and our Bay City facility in Texas, United States is located in an area prone to strong winds and hurricanes, and occasional floods. More generally, changing weather patterns and climatic conditions in recent years have added to the unpredictability and frequency of natural disasters. For more information on the risks associated with climate-change, see “Key Information – Risk Factors – Risks Relating to Our Business and Industry – The physical risks resulting from climate change, including extreme weather conditions and shifts in weather patterns, have in the past and may in the future adversely affect our operations and financial results”.
Our operations may also be adversely affected as a result of work stoppages or other labor conflicts. In the past, our operations in Mexico were disrupted due to union-led stoppages resulting from an internal dispute within the local union. Although our Mexican operations have not experienced any further disruptions caused by employee stoppages since 2020, we cannot assure that further disruptions will not occur in the future. In addition, in some of the countries in which we have significant production facilities (e.g., Argentina and Brazil), significant inflationary pressures and higher tax burdens could increase labor demands and could eventually generate higher levels of labor conflicts, which may result in operational disruptions.
In addition, epidemics and other public health crises may disrupt our operations, as was the case during 2020 as a result of the COVID-19 outbreak when some of our facilities or production lines were closed or shutdown.
Some of the previously described emergency situations could result, and in some cases have resulted, in damage to property, delays in production or shipments and death or injury to persons.
| |
| Annual Report 2023 |
Any of the foregoing could expose us to liability and affect our reputation. To the extent that lost production or delays in shipments cannot be compensated for by unaffected facilities, such events could have an adverse effect on our profitability and financial condition. Additionally, we do not carry business interruption insurance, and the insurance we maintain for property damage and general liability may not be adequate or available to protect us under such events, its coverage may be limited, or the amount of our insurance may be less than the related loss. For more information on our insurance coverage, see “Information on the Company – Business overview – Insurance”.
We may be required to record a significant charge to earnings if we must reassess our goodwill or other assets as a result of changes in assumptions underlying the carrying value of certain assets, particularly as a consequence of deteriorating market conditions
Assets that are subject to amortization are reviewed for impairment whenever events or changes in circumstances indicate that the carrying amount may not be recoverable. Intangible assets with indefinite useful life, including goodwill, are subject to impairment tests following IAS 36. Impairment tests have resulted in impairment charges. Impairment charges for the last three years are shown below:
- In December 2021, we recorded a charge of $57 million in connection with the expected termination of the NKKTubes joint venture.
- In March 2022, in light of the armed conflict in Ukraine and the designation of Severstal’s controlling shareholder as a person subject to EU and UK sanctions, we recorded an impairment in the amount of approximately $14.9 million, fully impairing our investment in our joint venture in Russia with Severstal. For more information on Tenaris’s operations involving Russia, see “Key Information – Risk Factors – Risks Relating to Our Business and Industry – An escalation of the Russia-Ukraine war and other armed conflicts may adversely affect our operations”.
- In September 2022, mainly due to the lower expectations for steel demand and market steel prices in Brazil, together with a worsened global macroeconomic situation that derived in an increase in discount rates, we wrote down our investment in Usinas Siderúrgicas de Minas Gerais S.A.(“Usiminas”) by $19.1 million, and in September 2023, we recorded a net loss of $25.5 million, related to the participation increase in Usiminas.
- In December 2022, in the presence of impairment indicators, the Company conducted impairment tests, reviewed the values of certain idle assets in its subsidiaries and recorded impairment charges of $76.7 million.
As of December 31, 2023, goodwill amounted to $1,104 million corresponding mainly ($920 million) to the acquisition of Hydril Company (“Hydril”) in 2007 and is allocated to Hydril, Siderca and Tamsa cash generating units (“CGU”).
For more information on impairment charges, please refer to note 5 “Impairment charge”, note 8 “Equity in earnings of non-consolidated companies” and note 14 “Investments in non-consolidated companies” to our audited consolidated financial statements included in this annual report.
Our results of operations and financial condition could be adversely affected by movements in exchange rates
As a global company, we manufacture and sell products throughout the world and a portion of our business is carried out in currencies other than the U.S. dollar, which is the Company’s functional and presentation currency. As a result, we are exposed to foreign exchange rate risk. Changes in currency values and foreign exchange regulations could adversely affect our financial condition and results of operations. For information on our foreign exchange rate risk, please see “Quantitative and Qualitative Disclosure About Market Risk – Foreign Exchange Rate Risk”.
Changes in applicable tax regulations and resolutions of tax disputes could negatively affect our financial results
We are subject to tax laws in numerous foreign jurisdictions where we operate. The integrated nature of our worldwide operations can produce conflicting claims from revenue authorities in different countries as to the profits to be taxed in the individual countries, including disputes relating to transfer pricing. Most of the jurisdictions in which we operate have double tax treaties with foreign jurisdictions, which provide a framework for mitigating the impact of double taxation on our results. However, mechanisms developed to resolve such conflicting claims are largely untried and can be expected to be very lengthy.
| |
| Annual Report 2023 |
In 2019, the OECD launched a new initiative on behalf of the G20 under the format of a two pillars solution: Pillar One, aimed at minimizing profit shifting by working towards a global tax framework that ensures that corporate income taxes are paid where consumption takes place, and Pillar Two, aimed at introducing a global standard on minimum taxation, both combined with new tax dispute resolution processes. This project achieved OECD political consensus in October 2021. Detailed principles on Pillar One are still under discussion.
In December 2021, the OECD released the Pillar Two model rules (the Global Anti-Base Erosion rules, or “GloBE”) to reform international corporate taxation. Following Pillar Two OECD’s initiative, the European Union adopted in December 2022 a directive to impose a global minimum taxation for multinational companies in the Union, to be effective as from January 1, 2024.
On December 20, 2023, the Luxembourg Parliament approved the Pillar Two law transposing the EU Pillar Two Directive into domestic legislation. The law takes effect beginning in fiscal years starting on or after December 31, 2023.
The Company is within the scope of the rules, and therefore will be required to calculate its GloBE effective tax rate for each jurisdiction where it operates and will be liable to pay a top-up tax for the difference between its GloBE effective tax rate per jurisdiction and the 15% minimum rate, beginning in fiscal year 2024.
The Company is in the process of assessing its exposure to the Pillar Two legislation and testing its situation under the OECD transitional safe harbor rules and expects no major impact from the top-up tax due to the application of one or more of the transitional safe harbor rules.
Due to the complexities in applying the legislation and calculating GloBE income, the quantitative impact of the legislation is not yet reasonably estimable.
At the EU level, the European Commission adopted in 2016 its Anti-Tax Avoidance Directive (“ATAD”), later updated, modified and expanded by ATAD 2, which seeks to prevent tax avoidance by companies and to ensure that companies pay appropriate taxes in the markets where profits are effectively made and business is effectively performed. In addition, the European Commission drafted a directive aiming to avoid the use of shell entities (ATAD 3), which, if approved and adopted by all EU members, is expected to become effective during 2024.
Changes to tax laws and regulations in the countries where we operate require us to continually assess our organizational structure and could lead to increased risk of international tax disputes.
Our interpretation and application of the tax laws could differ from that of the relevant governmental taxing authority, which could result in the payment of additional taxes, penalties or interest, negatively affecting our profitability and financial condition. Significant uncertainties remain in relation to the potential adoption of the new regulations that might result from evolving initiatives like those launched by the OECD and the EU in relation to international taxation that could impact negatively our financial condition, results of operations and cash flows.
If we do not comply with laws and regulations designed to combat corruption in countries in which we sell our products, we could become subject to governmental investigations, fines, penalties or other sanctions and to private lawsuits and our sales and profitability could suffer
We operate and conduct business globally, including in certain countries known to experience high levels of corruption. Although we are committed to conducting business in a legal and ethical manner in compliance with local and international statutory requirements and standards applicable to our business, there is a risk that our employees, representatives, associates, affiliates, or other persons may take actions that violate applicable laws and regulations that generally prohibit offering or making of improper payments to any individual, including to government officials, for the purpose of obtaining a benefit or undue advantage or keeping business, as stated by the U.S. Foreign Corrupt Practices Act (“FCPA”) and other anti-corruption laws adopted by the main countries in which we operate, which impose strict criminal liability on companies for corrupt practices undertaken by their employees or representatives. In addition, we cannot give any assurance that we will detect all illegal activity that may have been conducted in the past at any acquired business.
| |
| Annual Report 2023 |
Investigations by government authorities may occupy considerable management time and attention, weaken company compliance culture and result in significant expenditures, fines, penalties or other sanctions, as well as private lawsuits. For information on matters related to the Company Business Conduct Compliance Program, please refer to our website on the matter https://www.tenaris.com/en/sustainability/governance-and-ethics/.
For example, upon learning that Brazilian, Italian and Swiss authorities were investigating whether certain payments were made prior to 2014 from accounts of entities presumably associated with affiliates of the Company to accounts allegedly linked to individuals related to Petróleo Brasileiro S.A. (“Petrobras”) and whether any such payments were intended to benefit Confab Industrial S.A. (“Confab”), the Audit Committee of the Company's board of directors engaged external counsel in connection with the Company’s review of these matters. In addition, the Company voluntarily notified the SEC and the U.S. Department of Justice (“DOJ”) in October 2016. The Company conducted, with the assistance of external counsel, an internal investigation and found no evidence corroborating any involvement by the Company or its directors, officers or employees in respect of improper payments. An internal investigation commissioned by Petrobras also found no evidence that Confab obtained any unfair commercial benefit or advantage from Petrobras in return for payments, including improperly obtained contracts. On June 2, 2022, the Company resolved the investigation by the SEC and the DOJ informed that it had closed its parallel inquiry without taking action. Under the settlement with the SEC, the Company neither admitted nor denied the SEC’s findings and on June 24, 2022, paid $53.1 million in disgorgement and prejudgment interest and $25 million as a civil penalty to conclude the matter.
For information on matters related to the Petrobras-related proceedings and claims, please see note 27 “Contingencies, commitments and restrictions of profits” to our audited consolidated financial statements included in this annual report.
The cost of complying with environmental regulations and potential environmental and product liabilities may increase our operating costs and negatively impact our business, financial condition, results of operations and prospects
We are subject to a wide range of local, state, provincial and national laws, local and international regulations, permit requirements and decrees relating to the protection of human health and the environment, including laws and regulations relating to hazardous materials and radioactive materials and environmental protection governing air emissions, water discharges and waste management. Laws and regulations protecting the environment have become increasingly complex and more stringent and expensive to implement in recent years. Additionally, international environmental requirements vary. While standards in the European Union, Canada, and Japan are generally comparable to (or more stringent than) U.S. standards, other nations, particularly developing nations, including China, have substantially fewer or less rigorous requirements that may give competitors in such nations a competitive advantage. It is possible that any international agreement to regulate emissions may provide exemptions and lesser standards for developing nations. In such case, we may be at a competitive disadvantage relative to competitors having more or all of their production in such developing nations.
Environmental laws and regulations may, in some cases, impose strict liability rendering a person liable for damages to natural resources or threats to public health and safety without regard to negligence or fault. Some environmental laws provide for joint and several strict liability for remediation of spills and releases of hazardous substances. These laws and regulations may expose us to liability for the conduct of or conditions caused by others or for acts that were in compliance with all applicable laws at the time they were performed.
Compliance with applicable requirements and the adoption of new requirements could have a material adverse effect on our consolidated financial condition, results of operations or cash flows. The costs and ultimate impact of complying with environmental laws and regulations are not always clearly known or determinable since regulations under some of these laws have not yet been promulgated or are undergoing revision. The expenditures necessary to remain in compliance with these laws and regulations, including site or other remediation costs, or costs incurred as a result of potential violations of environmental laws could have a material adverse effect on our financial condition and profitability. While we incur and will continue to incur expenditures to comply with applicable laws and regulations, there always remains a risk that environmental incidents or accidents may occur that may negatively affect our reputation or our operations.
The European CBAM aims at promoting emissions reductions worldwide by subjecting the import of certain products, including steel, from countries outside of the European Union to a carbon levy linked to the carbon price payable for goods produced in EU countries. CBAM entered into application in its transitional phase, on October 1, 2023, with the first reporting period for importers ending January 31, 2024. Starting on January 1, 2026, CBAM will enter into full force and importers will need to obtain an authorization to import goods covered by CBAM, make annual statements on the quantity of goods imported into the EU and their embedded GHG emissions and purchase CBAM certificates to cover their declared emissions.
| |
| Annual Report 2023 |
Our oil and gas casing, tubing and line pipe products are sold primarily for use in oil and gas drilling, gathering, transportation, processing and power generation facilities, which are subject to inherent risks, including well failures, line pipe leaks, blowouts, bursts and fires, that could result in death, personal injury, property damage, environmental pollution or loss of production. Any of these hazards and risks can result in environmental liabilities, personal injury claims and property damage from the release of hydrocarbons.
Defects in specialty tubing products could result in death, personal injury, property damage, environmental pollution, damage to equipment and facilities or loss of production.
We normally warrant the oilfield products and specialty tubing products we sell or distribute in accordance with customer specifications, but as we pursue our business strategy of providing customers with additional services, such as Rig Direct®, we may be required to warrant that the goods we sell and services we provide are fit for their intended purpose. Actual or claimed defects in our products may give rise to claims against us for losses suffered by our customers and expose us to claims for damages. The insurance we maintain will not be available in cases of gross negligence or willful misconduct, in other cases may not be adequate or available to protect us in the event of a claim, its coverage may be limited, canceled, or otherwise terminated, or the amount of our insurance may be less than the related impact on enterprise value after a loss. Similarly, our sales of tubes and components for the automotive industry subject us to potential product liability risks that could extend to being held liable for the costs of the recall of automobiles sold by car manufacturers and their distributors.
Limitations on our ability to protect our intellectual property rights, including our trade secrets, could cause a loss in revenue and any competitive advantage we hold
Some of our products or services, and the processes we use to produce or provide them, have been granted patent protection, have patent applications pending, or are trade secrets. Our business may be adversely affected if our patents are unenforceable, the claims allowed under our patents are not sufficient to protect our technology, our patent applications are denied, or our trade secrets are not adequately protected. Our competitors may be able to independently develop technology that is similar to ours without infringing on our patents or gaining access to our trade secrets, which could adversely affect our financial condition, results of operations and cash flows.
Cyberattacks could have a material adverse impact on our business and results of operations
We rely heavily on information systems to conduct our operations, and digital technologies have an increasingly significant role across our business. Although we devote significant resources to protect our systems and data and we continually monitor and evaluate the actual or potential impact of external developments and available information on threats and security incidents, we have experienced and will continue to experience varying degrees of cyber incidents in the normal conduct of our business, which may occasionally include sophisticated cybersecurity threats such as unauthorized access to data and systems, loss or destruction of data, computer viruses or other malicious code, phishing, ransomware, spoofing, cyberattacks and/or cybersecurity risks arising from service providers. These threats often arise from numerous sources, not all of which are within our control, such as fraud or malice from third parties, including fraud involving business email compromises, failures of computer servers or other accidental technological failures, electrical or telecommunication outages or other damage to our property or assets.
Cybersecurity threats represent one of the most significant risks for most businesses. Cyberattack attempts continued to increase throughout 2023. In particular, Microsoft has reported that the manufacturing sector was the industry most subject to ransomware attacks in 2023. Experts agree that cyberattacks are increasing in sophistication and frequency and call for a global response to cybersecurity threats, and regulators are placing increased focus on cybersecurity and its effects.
Cyber ecosystem risk is becoming more problematic. According to the World Economic Forum’s 2024 Global Cybersecurity Outlook, the gap between organizations that are cyber resilient and those that are fighting to survive is widening at an alarming rate and this phenomenon is particularly alarming in light of the interconnected nature of the cyber ecosystem. According to data set forth in that report, 41% of the organizations that suffered a material incident in the past twelve months attributed the incidents to a third party, and 54% of the organizations have insufficient visibility into the vulnerabilities of their supply chain.
In addition, emerging technologies, like generative artificial intelligence (“AI”), which are becoming available more widely and faster, are expected to exacerbate cyber resilience challenges. Approximately half of executives surveyed at the World Economic Forum’s annual meeting on cybersecurity stated that advances in adversarial capabilities (phishing, malware, deepfakes) present the most concerning impact of generative AI on cyber and fewer than one in ten respondents believe that in the next two years generative AI will give the advantage to defenders over attackers.
| |
| Annual Report 2023 |
In 2023, we continued improving cybersecurity controls, processes and procedures to monitor, detect, evaluate and respond to hacking, malware infection, cybersecurity compromise and other risks. In addition, we continued with cybersecurity awareness and ethical phishing campaigns aimed at protecting us against cyberthreats, and tailored cybersecurity training programs addressed to our executives and employees.
Given the rapidly evolving nature of cyberthreats, there can be no assurance that the systems we have designed to prevent or limit the effects of cyber incidents or attacks will be adequate, and such incidents or attacks could have a material adverse impact on our systems. While we attempt to mitigate these risks, we remain vulnerable to additional known or unknown threats, including theft, misplacement or loss of data, programming errors, employee errors and/or dishonest behavior that could potentially lead to the compromising of sensitive information, improper use of our systems or networks, as well as unauthorized access, use, disclosure, modification or destruction of such information, systems and/or networks. If our systems for protecting against cybersecurity risks are circumvented or breached, this could also result in disruptions to our business operations (including but not limited to, defective products, production downtimes or loss of productivity), access to our financial reporting systems, the loss of access to critical data or systems, misuse or corruption of critical data and proprietary information (including our intellectual property and customer data), as well as damage to our reputation with our customers and the market, failure to meet customer requirements, customer dissatisfaction and/or regulatory fines and penalties (including for inadequate protection of personal data and/or failure to notify the competent authorities for such breach), damages and harm to the environment and people, or other financial costs and losses. In addition, given that cybersecurity threats continue to evolve, we will be required to devote additional resources in the future to enhance our protective measures or to investigate and/or remediate any cybersecurity vulnerabilities. Additionally, although we periodically consider cyber insurance coverage options, we do not currently maintain cybersecurity insurance, and the insurance we carry for property damage and general liability may not be adequate or available to protect us from damages derived from cyberthreats or coverage may be limited. Moreover, any investigation of a cyberattack would take time before completion, during which we would not necessarily know the extent of the actual or potential harm or how best to remediate it, and certain errors or actions could be repeated or compounded before duly discovered and remediated (all or any of which could further increase the costs and consequences arising out of such cyberattack). In addition, failure to adequately and timely monitor and evaluate our hardware and software systems and applications to prevent or manage technology obsolescence risks may result in increased costs, increased operational risk of service failure, loss of technology competitiveness and reputation.
For more information on cybersecurity, please refer to “Cybersecurity”.
Risks Relating to the Structure of the Company
The Company’s dividend payments depend on the results of operations and financial condition of its subsidiaries and could be restricted by legal, contractual or other limitations or tax changes
The Company is a holding company and conducts all its operations through subsidiaries. Dividends or other intercompany transfers of funds from those subsidiaries are the Company’s primary source of funds to pay its expenses, debt service and dividends and to repurchase shares or ADSs.
The ability of the Company’s subsidiaries to pay dividends and make other payments to us will depend on their results of operations and financial condition. If earnings and cash flows of the Company’s operating subsidiaries are substantially reduced, the Company may not be in a position to meet its operational needs or to pay dividends. In addition, such dividends and other payments could be restricted by applicable corporate and other laws and regulations, including those imposing foreign exchange controls or restrictions on the repatriation of capital or the making of dividend payments, and agreements and commitments of such subsidiaries. For information concerning potential restrictions on our ability to collect dividends from certain subsidiaries, see “Key Information – Risk Factors – Risks Relating to Our Business and Industry – Adverse economic or political conditions in the countries where we operate or sell our products and services may decrease our sales or disrupt our manufacturing operations, thereby adversely affecting our revenues, profitability and financial condition” and “Financial Information – Consolidated Statements and Other Financial Information – Dividend Policy”.
| |
| Annual Report 2023 |
The Company’s ability to pay dividends to shareholders is subject to legal and other requirements and restrictions in effect at the holding company level. For example, the Company may only pay dividends out of net profits, retained earnings and distributable reserves and premiums, each as defined and calculated in accordance with Luxembourg law and regulations. In addition, the Company’s dividend distributions (which are currently imputed to a special tax reserve and are therefore not subject to Luxembourg withholding tax) may be subject to Luxembourg withholding tax if current Luxembourg tax law were to change.
The Company’s controlling shareholder may be able to take actions that do not reflect the will or best interests of other shareholders
As of December 31, 2023, San Faustin beneficially owned 60.45% of the Company’s issued share capital. San Faustin’s share percentage ownership will increase if the cancellation of the shares repurchased by the Company under its share buyback program is approved at the upcoming extraordinary general meeting of shareholders, scheduled to be held on April 30, 2024. Rocca & Partners Stichting Administratiekantoor Aandelen San Faustin (“RP STAK”) holds voting rights in San Faustin sufficient to control San Faustin. As a result, RP STAK is indirectly able to elect a substantial majority of the members of the Company’s board of directors and has the power to determine the outcome of most actions requiring shareholder approval, including, subject to the requirements of Luxembourg law, the payment of dividends. The decisions of the controlling shareholder may not reflect the will or best interest of other shareholders. In addition, the Company’s articles of association permit the Company’s board of directors to waive, limit or suppress preemptive rights in certain cases. Accordingly, the Company’s controlling shareholder may cause its board of directors to approve in certain cases an issuance of shares for consideration without preemptive rights, thereby diluting the minority interest in the Company. See “Key Information – Risk Factors – Risks Relating to shares and ADSs – Holders of shares and ADSs in the United States may not be able to exercise preemptive rights in certain cases”.
Risks Relating to shares and ADSs
Holders of shares or ADSs may not have access to as much information about the Company as they would in the case of a U.S. domestic issuer
There may be less publicly available information about the Company than is regularly published by or about U.S. domestic issuers. Also, corporate and securities regulations governing Luxembourg companies may not be as extensive as those in effect in other jurisdictions and U.S. securities regulations applicable to foreign private issuers, such as the Company, differ in certain respects from those applicable to U.S. domestic issuers. Furthermore, IFRS, the accounting standards in accordance with which the Company prepares its consolidated financial statements, differ in certain material aspects from U.S. GAAP. For a summary of the significant ways in which the Company’s corporate governance practices differ from the corporate governance standards required for domestic companies by the New York Stock Exchange (“NYSE”), see “Corporate Governance Statement – Summary of differences with NYSE standards”.
| |
| Annual Report 2023 |
Holders of ADSs may not be able to exercise, or may encounter difficulties in the exercise of, certain rights afforded to shareholders
Certain shareholders’ rights under Luxembourg law, including the rights to participate and vote at general meetings of shareholders, to include items on the agenda for the general meetings of shareholders, to receive dividends and distributions, to bring actions, to examine our books and records and to exercise appraisal rights may not be available to holders of ADSs, or may be subject to restrictions and special procedures for their exercise, as holders of ADSs only have those rights that are expressly granted to them in the deposit agreement. Deutsche Bank Trust Company Americas, as depositary under the ADS deposit agreement, or the Depositary, through its custodian agent, is the registered shareholder of the deposited shares underlying the ADSs, and therefore only the Depositary can exercise the shareholders’ rights in connection with the deposited shares. For example, if the Company makes a distribution in the form of securities, the Depositary is allowed, at its discretion, to sell the right to acquire those securities on your behalf and to instead distribute the net proceeds to you. Also, under certain circumstances, such as the Company’s failure to provide the Depositary with voting materials on a timely basis, you may not be able to vote at general meetings of shareholders by giving instructions to the Depositary. If the Depositary does not receive voting instructions from the holder of ADSs by the prescribed deadline, or the instructions are not in proper form, then the Depositary shall deem such holder of ADSs to have instructed the Depositary to vote the underlying shares represented by ADSs in favor of any proposals or recommendations of the Company (including any recommendation by the Company to vote such underlying shares on any given issue in accordance with the majority shareholder vote on that issue), for which purposes the Depositary shall issue a proxy to a person appointed by the Company to vote such underlying shares represented by ADSs in favor of any proposals or recommendations of the Company. Under the ADS deposit agreement, no instruction shall be deemed given and no proxy shall be given with respect to any matter as to which the Company informs the Depositary that (i) it does not wish such proxy given, (ii) it has knowledge that substantial opposition exists with respect to the action to be taken at the meeting, or (iii) the matter materially and adversely affects the rights of the holders of ADSs.
Holders of shares and ADSs in the United States may not be able to exercise preemptive rights in certain cases
Pursuant to Luxembourg corporate law, existing shareholders of the Company are generally entitled to preferential subscription rights (preemptive rights) in the event of capital increases and issues of shares against cash contributions. Under the Company’s articles of association, the board of directors has been authorized to waive, limit or suppress such preemptive subscription rights. Notwithstanding the waiver of any preemptive subscription rights, any issuance of shares for cash within the limits of the authorized share capital shall be subject to the preemptive subscription rights of existing shareholders, except (i) any issuance of shares (including without limitation, the direct issuance of shares or upon the exercise of options, rights convertible into shares, or similar instruments convertible or exchangeable into shares) against a contribution other than in cash; and (ii) any issuance of shares (including by way of free shares or at discount), up to an amount of 1.5% of the issued share capital of the Company, to directors, officers, agents, employees of the Company, its direct or indirect subsidiaries or its affiliates (or, collectively, the beneficiaries), including without limitation, the direct issuance of shares or upon the exercise of options, rights convertible into shares or similar instruments convertible or exchangeable into shares, issued for the purpose of compensation or incentive of the beneficiaries or in relation thereto (which the board of directors shall be authorized to issue upon such terms and conditions as it deems fit). For further details, see “Corporate Governance Statement – Corporate Governance”.
Holders of ADSs in the United States may, in any event, not be able to exercise any preemptive rights, if granted, for shares underlying their ADSs unless additional shares and ADSs are registered under the U.S. Securities Act of 1933, as amended, (“Securities Act”), with respect to those rights, or an exemption from the registration requirements of the Securities Act is available. The Company intends to evaluate, at the time of any rights offering, the costs and potential liabilities associated with the exercise by holders of shares and ADSs of the preemptive rights for shares, and any other factors it considers appropriate at the time, and then to make a decision as to whether to register additional shares. The Company may decide not to register any additional shares, requiring a sale by the Depositary of the holders’ rights and a distribution of the proceeds thereof. Should the Depositary not be permitted or otherwise be unable to sell preemptive rights, the rights may be allowed to lapse with no consideration to be received by the holders of the ADSs.
It may be difficult to obtain or enforce judgments against the Company outside Luxembourg
The Company is a société anonyme organized under the laws of the Grand Duchy of Luxembourg, and most of its assets are located in other jurisdictions. Furthermore, most of the Company’s directors and officers reside in other jurisdictions. As a result, investors may not be able to effect service of process upon the Company or its directors or officers. Investors may also not be able to enforce against the Company or its directors or officers in the investors’ domestic courts, judgments predicated upon the civil liability provisions of the domestic laws of the investors’ home countries. Likewise, it may be difficult for investors not domiciled in Luxembourg to bring an original action in a Luxembourg court predicated upon the civil liability provisions of other securities laws, including U.S. federal securities laws, against the Company, its directors or its officers. There is also uncertainty with regard to the enforceability of original actions of civil liabilities predicated upon the civil liability provisions of securities laws, including U.S. federal securities laws, outside the jurisdiction where such judgments have been rendered; and enforceability will be subject to compliance with procedural requirements under applicable local law, including the condition that the judgment does not violate the public policy of the applicable jurisdiction.
| |
| Annual Report 2023 |
Tenaris is a leading global manufacturer and supplier of steel pipe products and related services for the world’s energy industry and other industrial applications. Our customers include most of the world’s leading oil & gas companies, and we operate an integrated network of steel pipe manufacturing, research, finishing and service facilities with industrial operations in the Americas, Europe, the Middle East, Asia and Africa.
Although our operations are focused on serving the oil & gas industry, we also supply pipes and tubular components for non-energy applications. We develop and supply products and services for low-carbon energy applications such as geothermal wells, waste-to-energy (bioenergy) power plants, hydrogen storage and transportation, and carbon capture and storage.
Through an integrated global network of R&D, manufacturing, and service facilities, and a team of more than 29,000 people worldwide, we work with our customers to meet their needs in a timely manner, observing the highest levels of product performance and reliability.
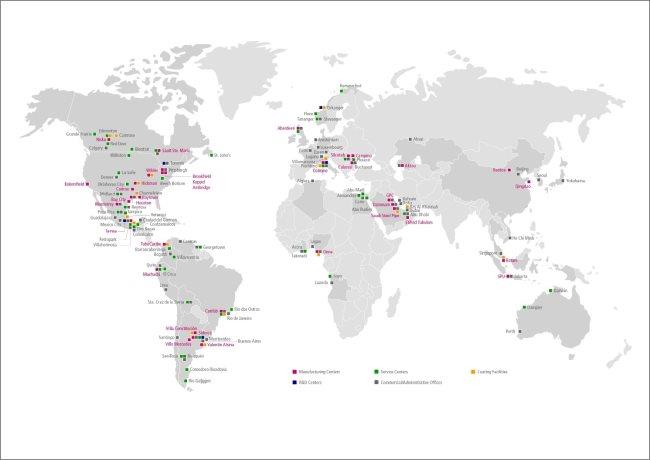
| |
| Annual Report 2023 |
The Company
The Company is a société anonyme organized under the laws of the Grand Duchy of Luxembourg established on December 17, 2001. The Company’s registered office is located at 26 Boulevard Royal, 4th Floor, L-2449, Luxembourg. Its agent for U.S. federal securities law purposes is Tenaris Global Services (U.S.A.) Corporation (“TEUS”), located at 2200 West Loop South, Suite 800, Houston, TX 77027.
Tenaris
Tenaris began with the formation of Siderca, the sole Argentine producer of seamless steel pipe products, by San Faustin’s predecessor in Argentina in 1948. We grew organically in Argentina and then, in the early 1990s, began to evolve beyond this initial base into a global business through a series of strategic investments. As of the date of this annual report, our investments include controlling interests in several manufacturing companies:
- Siat S.A., an Argentine welded steel pipe manufacturer;
- Tamsa, the sole Mexican producer of seamless steel pipe products;
- Dalmine S.p.A. (“Dalmine”), a leading Italian producer of seamless steel pipe products;
- Confab, the leading Brazilian producer of welded steel pipe products;
- Algoma Tubes Inc. (“AlgomaTubes”), a Canadian producer of seamless and welded steel pipe products;
- S.C. Silcotub S.A. (“Silcotub”), a leading Romanian producer of seamless steel pipe products;
- Maverick Tube Corporation (“Maverick”), a U.S. producer of seamless and welded steel pipe products;
- Tenaris TuboCaribe Ltda. (“TuboCaribe”), a welded pipe mill producing OCTG products including finishing of welded and seamless pipes, line pipe products, and couplings in Colombia;
- Hydril, a North American manufacturer of premium connection products for oil and gas drilling production;
- PT Seamless Pipe Indonesia Jaya (“SPIJ”), an Indonesian OCTG processing business with heat treatment and premium connection threading facilities;
- Tenaris Qingdao Steel Pipes Ltd. (“Tenaris Qingdao”), a Chinese producer of premium joints, couplings and tubular components for airbags;
- Pipe Coaters Nigeria Ltd. (“Pipe Coaters”), a leading company in the Nigerian coating industry;
- Tenaris Bay City Inc. (“Tenaris Bay City”), a state-of-the-art seamless pipe mill in Bay City, Texas;
- Saudi Steel Pipe Company (“SSPC”), a Saudi producer of welded steel pipe products;
- IPSCO, a North American manufacturer of seamless and welded steel pipes;
- Tenaris Baogang Baotou Steel Pipes, Ltd. (“TBSP”), a Chinese company that owns a premium connection threading facility in Baotou, China, in which we have a 60% interest;
- Global Pipe Company (“GPC”), a Saudi company which manufactures longitudinal submerged arc welded (“LSAW”) pipes;
| |
| Annual Report 2023 |
- Bredero Shaw International BV (“BSIBV”) and its subsidiaries, which hold the pipe coating business recently acquired from Mattr; and
- sucker rods businesses in various countries.
In addition, we own a 50% participation in Exiros B.V. (“Exiros”), a Dutch company that holds a network of specialized procurement companies, with our affiliate Ternium S.A. (“Ternium”) holding the remaining 50%.
We also own strategic interests in:
- Ternium, one of the leading flat steel producers of the Americas with operating facilities in Mexico, Brazil, Argentina, Colombia, the southern United States and Central America;
- Usiminas, a Brazilian producer of high quality flat steel products used in the energy, automotive and other industries; and
- Techgen, an electric power plant in Mexico.
In addition, we have established a global network of pipe finishing, distribution and service facilities with a direct presence in most major oil and gas markets and a global network of R&D centers.
For information on Tenaris’s principal capital expenditures and divestitures, see “Information on the Company – Business Overview – Capital Expenditure Program”.
Our business strategy is to consolidate our position as a leading global supplier of integrated product and service solutions to the energy and other industries and to adapt to the energy transition through reducing the carbon emissions in our operations and on developing and supplying products and services for low-carbon energy applications by:
- pursuing strategic investment opportunities in order to further strengthen our presence in local and global markets;
- expanding our comprehensive range of products and developing new products designed to meet the needs of customers operating in challenging environments, including low carbon energy applications, such as hydrogen and carbon capture and storage;
- enhancing our offering of technical, digital and supply chain integration services designed to enable customers to optimize well planning and integrity, simplify operations and reduce overall operating costs; and
- securing an adequate supply of production inputs and reducing the manufacturing costs and carbon intensity of our core products.
| |
| Annual Report 2023 |
Pursuing strategic investment opportunities and alliances
We have a solid record of growth through strategic investments and acquisitions. We pursue selective strategic investments and acquisitions as a means to expand our operations and presence in select markets, enhance our global competitive position and capitalize on potential operational synergies. During 2023, for example:
- We completed the construction of a wind farm in Argentina at a cost of approximately $200 million, which is expected to reduce Tenaris’s CO2 emissions in that country by 152,000 tons per year and supply close to 50% of the energy requirements at the integrated seamless pipe mill in Campana, Argentina.
- The Company’s board of directors approved, an investment plan to build a second wind farm in Argentina at a cost of approximately $214 million, which would supply a further 30% of the current energy requirements of the facilities in Campana and reduce the CO2 emissions a further 102,500 tons per year. This investment is expected to be completed during 2025.
- Our subsidiary SSPC completed the acquisition of an additional 22.3% interest in GPC from Erndtebruecker Eisenwerk, a German company that owned a 35% interest in GPC, for a purchase price of $6.3 million paid in cash. SSPC already owned a 35% interest in GPC, and following the completion of this transaction, SSPC holds a 57.3% aggregate interest in GPC and we began to consolidate its balances and results of operations since May 2023.
- Confab completed the acquisition of 11.0 million ordinary shares of Usiminas for approximately BRL110 million (approximately $23 million) in cash, increasing Tenaris’s participation in Usiminas’ share capital to 3.96%.
- An Italian subsidiary of the Company acquired all of the assets and related rights, duties, liabilities and contracts of Isoplus Mediterranean S.r.l.’s (“Isoplus”) anticorrosion coating division, renamed “Tenaris Coating”, for EUR9.0 million (approximately $9.8 million).
- A U.S. subsidiary of the Company acquired all of the assets and related rights, duties, liabilities and contracts of Republic Tube’s OCTG pipe processing facility in Houston, Texas for $90.5 million.
- One of the Company’s subsidiaries acquired from Mattr, 100% of the shares of BSIBV, which holds Mattr’s pipe coating business (“Shawcor”), for $182.6 million, subject to a customary price adjustment.
Our track record on the acquisition of companies is described above in “History and Development of the Company – Tenaris”.
Expanding our range of products including the development of new products for the energy transition
We have developed an extensive range of high-value products suitable for most of our customers’ operations using our network of specialized R&D facilities and by investing in our manufacturing facilities. As our customers expand their operations, we seek to supply high-value products that reduce costs and enable them to operate safely in challenging environments, including those for low-carbon applications associated with the energy transition.
As suppliers of tubular products and services to the energy industry, the energy transition currently underway provides an important opportunity to develop new products and services for potentially fast-growing segments like hydrogen transportation and storage, carbon capture and storage (“CCS”) and geothermal installations. We have developed a range of technologies that are particularly suited for use in hydrogen storage and transportation, where we are seeing growth in demand for large, high-pressure vessels used in the build out of hydrogen refueling stations for heavy-duty vehicles and buses in Europe and California. We are also seeing increasing interest from customers for developing CCS and geothermal projects.
| |
| Annual Report 2023 |
Enhancing our offering of technical, digital and supply chain integration services - Rig Direct® - and extending their global deployment
We continue to enhance our offering of Rig Direct® services and extend their deployment worldwide. For many years, we have provided these services, managing customer inventories and directly supplying pipes to their rigs on a just-in-time basis, complemented by technical advice and assistance on the selection of materials and their use in the field, in markets like Mexico and Argentina. In response to changes in market conditions and the increased focus of customers on reducing costs and improving the efficiency of their operations, the extent and deployment of our Rig Direct® services has been extended throughout North America and in other markets around the world (e.g., Colombia, North Sea, Romania and the United Arab Emirates) and now include digital and more extensive supply chain integration services. Through the provision of Rig Direct® services, we seek to integrate our operations with those of our customers using digital technologies to shorten the supply chain and simplify operational and administrative processes, as well as technical services for well planning and well integrity, to reduce costs, improve safety and minimize environmental impact. They are also intended to differentiate us from our competitors and further strengthen our relationships with customers worldwide under long-term agreements.
In addition, the acquisition of Mattr’s pipe coating business unit, with nine plants located in Canada, Mexico, Norway, Indonesia, the United Arab Emirates and the United States, and several mobile concrete plants, and of Isoplus’s anticorrosion coating division is expected to complement Tenaris’s products and solutions providing greater capabilities and specialization in end-to-end concrete weight, anti-corrosion, and flow assurance coating solutions for offshore and onshore pipelines.
Securing inputs for our manufacturing operations
We seek to secure our existing sources of raw material and energy inputs, and to gain access to new sources of low-cost inputs which can help us maintain or reduce the cost of manufacturing our core products and reduce the carbon emissions intensity of our operations over the long term. We aim to achieve a vertically integrated value chain for our production. To this end, we purchase most of our supplies through Exiros, a specialized procurement company the ownership of which we share with Ternium. Exiros offers us integral procurement solutions, supplier sourcing activities; category organized purchasing; suppliers’ performance administration; and inventory management.
Our Competitive Strengths
We believe our main competitive strengths include:
- our global production, commercial, distribution and service capabilities, offering a full product range with flexible supply options backed up by local service capabilities in important oil and gas producing and industrial regions around the world;
- our ability to develop, design and manufacture technologically advanced products and provide value-added services;
- our solid and diversified customer base and historic relationships with major international oil and gas companies around the world, and our strong and stable market shares in most of the countries in which we have manufacturing operations;
- our proximity to our customers;
- our human resources around the world with their diverse knowledge and skills;
- our low-cost operations, primarily at state-of-the-art, strategically located production facilities with favorable access to raw materials, energy and labor, and a solid track-record of operating experience; and
- our strong financial condition.
| |
| Annual Report 2023 |
Business Segments
Tenaris has one major business segment, “Tubes”, which is also the reportable operating segment. All other business activities and operating segments that are not required to be separately reported, are disclosed in the “Others” segment.
The Tubes segment includes the production and sale of both seamless and welded steel tubular products and related services mainly for the energy industry, particularly casing and tubing used in oil and gas drilling operations, and line pipe used in the transportation and processing of oil and gas, but also other industrial applications. Our production processes include the production of steel and its transformation into tubular products. Business activities included in this segment are mainly dependent on the worldwide oil and gas industry, as this industry is a major consumer of steel pipe products. Demand for steel pipe products and services from the energy industry has historically been volatile and depends primarily upon the number of oil and natural gas wells being drilled, completed and reworked, and the depth and drilling conditions of such wells. Major oil and gas companies are beginning to adapt their strategies and increase their investments in renewable energies to address the energy transition while maintaining their capability to meet market demand for oil and gas and reducing the emissions from their operations. As the energy transition advances, demand for our products and services from low-carbon energy applications, such as geothermal, hydrogen and carbon capture and storage, is expected to increase while demand for oil and gas applications may decrease.
Sales are generally made to end users, with exports being done through a centrally managed global distribution network and domestic sales made through local subsidiaries.
The “Others” segment includes all other business activities and operating segments related to the production and sale of sucker rods, tubes used for plumbing and construction applications, coiled tubing used in oil and gas extraction activities, oil and gas services including fracking and coiled tubing services in Argentina, the recently acquired pipe coating business and others, such as the sale of energy and raw materials that exceed our internal requirements.
For more information on our business segments, see “II C. Accounting Policies – Segment information” to our audited consolidated financial statements included in this annual report.
Our Products
Our principal finished products are seamless and welded steel casing and tubing, line pipe and various other mechanical and structural steel pipes for different uses. Casing and tubing are also known as oil country tubular goods (“OCTG”). We manufacture our steel pipe products in a wide range of specifications, which vary in diameter, length, thickness, finishing, steel grades, coating, threading and coupling. For more complex applications, including high pressure and high temperature applications, seamless steel pipes are usually specified and, for some standard applications, welded steel pipes can also be used. In addition to oil and gas applications, many of our products can also be used in low-carbon energy applications, such as geothermal, hydrogen and carbon capture and storage.
Casing. Steel casing is used to sustain the walls of oil and gas wells during and after drilling.
Tubing. Steel tubing is used to conduct crude oil and natural gas to the surface after drilling has been completed.
Line pipe. Steel line pipe is used to transport crude oil and natural gas from wells to refineries, storage tanks and loading and distribution centers.
Mechanical and structural pipes. Mechanical and structural pipes are used by general industry for various applications, including the transportation of other forms of gas and liquids under high pressure.
Cold-drawn pipe. The cold-drawing process permits the production of pipes with the diameter and wall thickness required for use in boilers, superheaters, condensers, heat exchangers, automobile production and several other industrial applications.
Premium joints and couplings. Premium joints and couplings are specially designed connections used to join lengths of steel casing and tubing for use in high temperature or high pressure environments. A significant portion of our steel casing and tubing products are supplied with premium joints and couplings. We own an extensive range of premium connections, and following the integration of the premium connections business of Hydril, we have marketed our premium connection products under the “TenarisHydril” brand name. In addition, we hold licensing rights to manufacture and sell the “Atlas Bradford” range of premium connections outside the United States and we own the “Ultra” and “TORQ” ranges of premium connections.
| |
| Annual Report 2023 |
Coiled tubing. Coiled tubing is used for oil and gas drilling and well workovers and for subsea pipelines.
Other products and services. We also manufacture sucker rods used in oil extraction activities, tubes used for plumbing and construction applications, oilfield / hydraulic fracturing services and coating services, which are expected to be enhanced following our recent acquisitions, and we engage in other activities, such as the sale of energy and raw materials that exceed our internal requirements.
Production Process and Facilities
We operate relatively low-cost production facilities, which we believe is the result of:
- state-of-the-art, strategically located plants;
- favorable access to high quality raw materials, energy and labor at competitive costs;
- operating history of almost 70 years, which translates into solid industrial know-how;
- constant benchmarking and best-practices sharing among the different facilities;
- increasing specialization of each of our facilities in specific product ranges; and
- extensive use of digital technologies in our production processes.
Our seamless pipes production and processing facilities are located in North and South America, Europe and Asia. Our welded pipes production facilities are located in North and South America and in Saudi Arabia. We also produce steel bars in the United States, Mexico, Argentina, Italy and Romania using the scrap-based electric arc furnace process that results in relatively low carbon emissions compared to primary steelmaking processes. In addition to our pipe threading and finishing facilities at our integrated pipe production facilities, we have additional pipe and/or pipe accessory threading facilities that manufacture products in accordance with the specifications of the American Petroleum Institute (“API”), and premium joints in Canada, China, Ecuador, Indonesia, Kazakhstan, Nigeria, Saudi Arabia, the United Kingdom and the United States, and a new premium OCTG threading facility in Abu Dhabi, United Arab Emirates. We produce couplings in Argentina, China, Colombia, Indonesia, Mexico and Romania, and pipe fittings in Mexico. In addition, we have sucker rods production facilities in Argentina, Brazil, Mexico, Romania, and the United States and a coiled tubing production facility in the United States. We also have a global network of pipe coating plants in United States, Canada, Mexico, Norway, Indonesia, United Arab Emirates, Brazil, Argentina, Nigeria, Italy and Colombia.
| |
| Annual Report 2023 |
The following table shows our aggregate installed production capacity of seamless and welded steel pipes and steel bars at the dates indicated as well as the aggregate actual production volumes for the periods indicated.
|
|
At or for the year ended December 31, | ||
|
|
2023 |
2022 |
2021 |
|
Thousands of tons |
|
|
|
|
Steel Bars |
|
|
|
|
Effective Capacity (annual) (1) |
4,485 |
4,485 |
4,485 |
|
Actual Production |
3,726 |
3,746 |
3,141 |
|
Tubes – Seamless |
|
|
|
|
Effective Capacity (annual) (1) |
4,677 |
4,937 |
4,937 |
|
Actual Production |
3,188 |
3,347 |
2,736 |
|
Tubes – Welded |
|
|
|
|
Effective Capacity (annual) (1) |
4,190 |
3,977 |
3,778 |
|
Actual Production |
953 |
527 |
237 |
| (1) Effective annual production capacity is calculated based on standard productivity of production lines, theoretical product mix allocations, the maximum number of possible working shifts and a continued flow of supplies to the production process. In 2023 the calculation of annual production capacity was revised and comparative figures were restated to adapt them to the new methodology. | |
In 2023, the capacity of seamless tubes decreased due to the closure of NKKTubes and the capacity of welded tubes increased due to the consolidation of GPC.
Production Facilities – Tubes
North America
In Mexico, we have a fully integrated seamless pipe manufacturing facility, a threading plant and a pipe fittings facility; in the United States, one steel shop, two seamless pipe rolling mills, four welded pipe manufacturing facilities and five threading plants; and in Canada an integrated facility with capacity for seamless and welded pipes plus a threading plant.
Mexico
In Mexico, our fully integrated seamless pipe manufacturing facility is located near the major exploration and drilling operations of Pemex, about 13 kilometers from the port of Veracruz on the Gulf of Mexico. Situated on an area of 650 hectares, the plant includes two state-of-the-art seamless pipe mills and has an installed annual production capacity of approximately 1,230,000 tons of seamless steel pipes (with an outside diameter range of 2 to 20 inches) and 1,200,000 tons of steel bars. The plant is served by two highways and a railroad and is close to the port of Veracruz, which reduces transportation costs and facilitates product shipments to export markets.
| |
| Annual Report 2023 |
The Veracruz facility comprises:
- a steel shop, including an electric arc furnace, refining equipment, vacuum degassing, five-strand continuous caster and a cooling bed;
- a multi-stand pipe mill, including a rotary furnace, direct piercing equipment, mandrel mill with retained mandrel, sizing mill and a cooling bed;
- a premium quality finishing (“PQF”) technology mill (2 3⁄8 to 7 inches), including a rotary furnace, direct piercing equipment, mandrel mill with retained mandrel, sizing mill and a cooling bed;
- a pilger pipe mill, including a rotary furnace, direct piercing equipment, a reheating furnace, sizing mill and a cooling bed;
- six finishing lines, including heat treatment lines, upsetting machines and threading and inspection equipment;
- a cold-drawing mill; and
- an automotive components production center.
In Veracruz, located near our fully integrated seamless pipe manufacturing facility, we have a threading plant, which produces premium connections and accessories.
In addition to the Veracruz facilities, we operate a manufacturing facility near Monterrey in the state of Nuevo León, Mexico, for the production of weldable pipe fittings. This facility has an annual production capacity of approximately 15,000 tons.
United States
In the United States we have the following production facilities:
Koppel, Pennsylvania: Acquired in 2020, the facility is located on an area of 89 hectares and consists of a steel shop with an annual production capacity of approximately 430,000 tons of steel bars and a heat treatment line. This facility supplies steel bars both to our Bay City and Ambridge seamless pipe rolling mills.
Bay City, Texas: Our 1.2 million square feet greenfield seamless mill is located on an area of 552 hectares. The facility is the result of an investment of $1.8 billion and includes a state-of-the-art rolling mill with a capacity of approximately 757,000 tons per year (with an outside diameter range of 4 ½ to 9 5/8 inches), as well as a heat treatment line, a finishing line and a logistics center.
The Bay City facility comprises:
- a retained mandrel mill PQF;
- a fully automated intermediate warehouse;
- a heat treatment line; and
- a finishing line.
Ambridge, Pennsylvania: A seamless rolling mill located on an area of 19 hectares, with a capacity of approximately 357,000 tons per year (with an outside diameter range of 2 3⁄8 through 5 1⁄2 inches).
| |
| Annual Report 2023 |
Hickman, Arkansas: This facility, which is our main U.S. welded production facility and covers an area of 78 hectares, processes steel coils to produce electric resistance welded (“ERW”) OCTG and line pipe with an outside diameter range from 2 3⁄8 to 16 inches and has an annual production capacity of approximately 1,104,000 tons. It includes:
- a plant comprising two welding lines producing 2 3⁄8 through 5 1⁄2 inches API products with two finishing lines and two heat treatment lines;
- a plant comprising of a welding line producing 6 through 16 inches API products and a finishing line; and
- a coating facility coating sizes up to 16 inches.
Blytheville, Arkansas: Located 2.5 miles from our Hickman facility; this facility produces ERW OCTG and performs finishing operations including heat treatment, inspection, upsetting and threading. The facility has four lines: one welding line producing 2 3⁄8 to 4 ½ inches outside diameter pipes with an annual production capacity of approximately 200,000 tons; one heat treatment line, one inspection line and one threading line for pipes between 2 3⁄8 and 5 ½ inches outside diameter.
Conroe, Texas: Located in an area of approximately 26 hectares north of Houston, Texas and has a capability of processing pipes with an outside diameter from 4 ½ to 8 5⁄8 inches. The plant has four production lines: one ERW welding line with a capacity of approximately 222,000 tons; one heat treatment line, one inspection line and one threading line.
Baytown, Texas: Located in an area of approximately 25 hectares east of Houston, Texas the facility heat-treats and finishes OCTG. The facility has six lines: one heat treatment, and one inspection line with outside diameter capability from 4 ½ to 7 5⁄8 inches and four threading lines capable of processing pipes 4 ½ to 13 5⁄8 inches outside diameter with a capacity of 220,000 tons.
Wilder, Kentucky: Located near the natural gas deposits of the Marcellus Shale, this 113 hectares facility produces both ERW casing and line pipe from 7 to 16 inches outside diameter. The facility has two lines: one welding line with annual capacity of 360,000 tons; and one finishing line. Additionally this facility has a coating line. This facility is currently idle.
In addition, we have facilities for heat treatment, threading and finishing pipes in Houston, Texas and Brookfield, Ohio.
Canada
In Canada, we have a manufacturing facility located in an area of approximately 45 hectares in Sault Ste. Marie, near the mouth of Lake Superior in the province of Ontario. The facility includes a seamless pipe hot rolling mill (retained mandrel mill and stretch reducing mill), a welded pipe ERW mill, a heat treatment line, three finishing lines (one with threaders for API and semi-premium connections) and a premium threading line.
For seamless, the effective annual production capacity is 371,000 tons with an outside diameter range of 3 1⁄2 to 9 7⁄8 inches. We mainly use steel bars produced by our facilities in Romania, Italy, Mexico, Argentina and the United States.
For welded, the effective annual production capacity is 200,000 tons. The outside diameter range of the line is from 4 1⁄2 to 12 3⁄4 inches. The facility includes a slitter, which cuts the master coils into the required dimensions for each outside diameter. The line commenced operations in the second half of 2022 as part of an investment plan to reposition our industrial footprint and strengthen the competitiveness and domestic production capabilities of the Canadian market.
In addition, we have a threading facility in Nisku, Alberta, near the center of Western Canadian drilling area. The facility has twelve computer numerical control (“CNC”) lathes dedicated to premium connections and accessories, including related repairs.
| |
| Annual Report 2023 |
South America
In Argentina, we have a fully integrated seamless pipe facility. In addition, we have welded pipe manufacturing facilities in Argentina, Brazil and Colombia.
Argentina
Our principal manufacturing facility in South America is a fully integrated plant on the banks of the Paraná river, near the city of Campana, approximately 80 kilometers north from the city of Buenos Aires, Argentina. Situated on over 300 hectares, the plant includes a state-of-the-art seamless pipe facility and has an effective annual production capacity of approximately 794,000 tons of seamless steel pipe (with an outside diameter range of 1 1⁄4 to 10 3⁄4 inches) and 1,300,000 tons of steel bars.
The Campana facility comprises:
- a DRI production plant;
- a steel shop with two production lines, each including an electric arc furnace, refining equipment, four-strand continuous caster and a cooling bed;
- two continuous mandrel mills, each including a rotary furnace, direct piercing equipment and a cooling bed and, one of them, also including a stretch reducing mill;
- seven finishing lines, including heat treatment lines, upsetting machines, threading and inspection equipment and make-up facilities;
- a cold-drawing mill; and
- a port on the Paraná river for the supply of raw materials and the shipment of finished products.
Our local electric energy requirements are satisfied through purchases in the local market and by a 35 megawatts power generating plant located within the Campana facility and, since October 2023, from our new wind farm, which required an investment of approximately $200 million and is able to supply close to 50% of the energy requirements at the integrated seamless pipe mill in Campana, Argentina. The new wind farm is expected to reduce Tenaris’s CO2 emissions in that country by 152,000 tons per year.
On November 1, 2023, the Company’s board of directors approved an investment plan to build a second wind farm in Argentina at a cost of approximately $214 million, which would supply a further 30% of the current energy requirements of the facilities in Campana and reduce the CO2 emissions by a further 102,500 tons per year. This investment is expected to be completed during 2025.
In addition to our main integrated seamless pipe facility, we also have two welded pipe manufacturing facilities in Argentina. One is located at Valentín Alsina, south of the city of Buenos Aires. This facility includes ERW, submerged arc welding (“SAW”) rolling mills with one spiral line and a coating line. The facility processes steel coils and plates to produce welded steel pipes with an outside diameter range of 4 1⁄2 to 80 inches, which are used for the conveying of fluids at low, medium and high pressure and for mechanical and structural purposes. The facility has an annual production capacity of approximately 620,000 tons. The other welded facility, located at Villa Constitución in the province of Santa Fe, has an annual production capacity of approximately 123,000 tons of welded pipes with an outside diameter range of 1 to 8 inches.
Brazil
In Brazil, we have the Confab welded pipe manufacturing facility, located in Pindamonhangaba and Moreira Cesar, 160 kilometers northeast from the city of São Paulo. The two sites have a combined area of around 150 hectares and include an ERW rolling mill, a SAW longitudinal rolling mill as well as pipe finishing and coating lines. The facility processes steel coils and plates to produce welded steel pipes with an outside diameter range from 5 1⁄2 to 48 inches for various applications, including OCTG and Line Pipe for oil, petrochemical and gas applications. In addition to weld-on connectors for conductor casings, the facility also supplies anticorrosive coating made of extruded polyethylene or polypropylene, external fusion bonded epoxy, thermal insulation, concrete weight coating and paint for internal pipe coating. The facility has an annual production capacity of approximately 654,000 tons.
| |
| Annual Report 2023 |
Colombia and Ecuador
In Colombia, we have TuboCaribe, a welded pipe manufacturing facility in Cartagena, on an area of 60 hectares, with an estimated annual ERW production capacity of approximately 105,000 tons. The facility also includes a state-of-the-art finishing plant for seamless pipes, with a total estimated annual finishing capacity of approximately 250,000 tons.
This facility produces OCTG and line pipe products with an outside diameter range of 2 3⁄8 to 9 5⁄8 inches, and includes two ERW mills, one heat treatment line, one slotting line and three threading lines, including premium connections capacity. Inspection lines and materials testing laboratories complete the production facility. A 2 to 24 inches diameter multilayer coating facility complements our line pipe production facilities.
In addition, we have a coupling shop with inspection and finishing lines. The shop has an estimated annual production capacity of 2.3 million pieces, including API and premium threads.
In Ecuador, we have a threading and finishing facility with an annual capacity of 35,000 tons, and a service center which is designed to support our Rig Direct® strategy, both situated in Machachi.
Europe
In Europe, we have several seamless pipe manufacturing facilities in Italy and one in Romania, and a premium connection threading facility in the United Kingdom.
Italy
Our principal manufacturing facility in Europe is an integrated plant located in the town of Dalmine, in the industrial area of Bergamo, about 40 kilometers from Milan in northern Italy. Situated on an area of 150 hectares, the plant includes a state-of-the-art seamless pipe mill and has an annual production capacity of approximately 766,000 tons of seamless steel pipes with an outside diameter range of 5.7 to 28 inches, mainly from carbon, low alloy and high alloy steels for diverse applications. The facility also includes a steel shop with a capacity of 935,000 tons of steel bars for processing at our facilities in Italy and elsewhere.
The Dalmine facility comprises:
- a steel shop, including an electric arc furnace, three ladle furnaces, two vacuum degassing and two continuous casters with their own cooling beds;
- a retained mandrel mill with two in-line-high-productivity finishing lines including one heat treatment;
- a rotary expander with a finishing line including a heat treatment; and
- two premium connection threading lines.
We also have a production facility, located in Arcore, about 25 kilometers from Milan in northern Italy. The Arcore facility, which covers an area of approximately 26 hectares and comprises a Diescher mill with associated finishing lines. Production is concentrated in heavy-wall mechanical pipes with an outside diameter range of 1.89 to 8.62 inches. The Arcore facility has an annual production capacity of approximately 144,000 tons.
| |
| Annual Report 2023 |
In addition to the main facility mentioned above, we also have:
- the Costa Volpino facility, which comprises a cold-drawing mill and an auto components facility producing cold-drawn carbon, low alloy and high alloy steel pipes with an outside diameter range of 0.47 to 15 inches, mainly for automotive, mechanical and machinery companies in Europe. The Costa Volpino facility has an annual production capacity of approximately 55,000 tons;
- a facility at Sabbio, which manufactures gas cylinders with an annual production capacity of approximately 14,000 tons or 270,000 pieces, and a large vessels plant inside the Dalmine facility, with a production capacity of around 2,500 finished pieces per year; and
- the newly acquired Isoplus facility located in Villamarzana, comprising land, anticorrosion equipment and utilities. This facility is located approximately 200 kilometers from our Dalmine plant and is close to the main Adriatic ports used for our exports. The facility covers an area of approximately 5 hectares and covers the full range of anticorrosion solutions for the oil and gas industry.
In order to reduce the cost of electrical energy at our operations in Dalmine, we operate a gas-fired, combined heat and power station with a capacity of 120 megawatts in Dalmine. Our operations in Dalmine consume a share of the power generated at the power station, which has sufficient capacity to meet almost the entire electric power requirements of these operations. The additional energy needed to cover consumption peaks and the excess energy produced are purchased from and sold to the market, while heat is sold for district heating.
Romania
We have a seamless steel pipe manufacturing facility in northwest Romania, on an area of approximately 37 hectares, located in the city of Zalau, 530 kilometers from Bucharest. The seamless facility includes a hot rolling mill and has an annual production capacity of approximately 258,000 tons of seamless pipes. The plant produces carbon and alloy steel tubes with an outside diameter range of 0.84 to 6.26 inches for hot rolled tubes and 0.32 to 4.72 inches for cold drawn tubes.
We have a steelmaking facility in southern Romania, on an area of approximately 19 hectares, located in the city of Calarasi, with an annual steelmaking capacity of 620,000 tons, supplying steel bars for European operations as well as to other rolling mills in our industrial system.
The industrial facilities in Romania comprise:
- a steel shop including an electric arc furnace, a ladle furnace and a continuous caster;
- a floating mandrel mill;
- four finishing lines, including heat treatment lines, upsetting machine, line pipe, threading, make-up and inspection equipment facilities;
- a coupling shop;
- an accessories line;
- a cold-drawing plant with finishing area; and
- automotive and hydraulic cylinders components’ production machinery.
United Kingdom
We have a premium line threading facility, located in Aberdeen, in the northern United Kingdom. The facility covers an area of 2 hectares. Production is concentrated in corrosion resistant alloys (“CRA”) grade, local accessories original equipment manufacturing and a hub to service customers working in the North Sea region. The facility has an annual production capacity of approximately 24,000 pieces, with a production range of 2 3⁄8 to 20 inches.
| |
| Annual Report 2023 |
Asia Pacific, Middle East and Africa
In Asia Pacific, Middle East and Africa, we have two welded pipe manufacturing facilities in Saudi Arabia. We also have threading facilities in Saudi Arabia, United Arab Emirates, China, Indonesia, Kazakhstan and Nigeria, and premium joints and couplings facilities in China and Nigeria.
Saudi Arabia
We have a controlling participation in SSPC, a welded steel pipe producer, which operates five production lines and produces welded pipes for the local oil & gas industry (OCTG and line pipe) and for the industrial and construction sectors. The facility is situated in Dammam, Saudi Arabia on a surface of approximately 100 hectares. Annual capacity is 390,000 tons covering a diameter range from ½ to 20 inches. We also have a threading facility for the production of premium joints and accessories in Saudi Arabia, with an annual production capacity of 120,000 tons.
SSPC holds a 57.3% interest in GPC, a company established in 2010 and located in Jubail, Saudi Arabia, which manufactures LSAW pipes, with an annual capacity of approximately 213,000 tons.
United Arab Emirates
In the United Arab Emirates, we have a new state-of-the-art threading facility in Abu Dhabi, on an area of approximately 20 hectares, with an annual finishing capacity of approximately 70,000 tons. Tenaris’s facility is the first local OCTG threading facility of its scale in the United Arab Emirates that can cater to Abu Dhabi National Oil Company’s (“ADNOC”) premium technology demand.
China
We own a facility for the production of premium joints and couplings in Qingdao, on the east coast of China. The facility has an annual production capacity of approximately 40,000 tons of premium joints. Additionally, we have a facility that produces components for the local automotive industry.
Additionally, under our agreement with Baogang Steel Pipes (“Baogang”), we operate TBSP, which owns a steel pipe premium connection threading plant to produce OCTG products in Baotou, China, with an annual capacity of approximately 45,000 tons. Tenaris holds 60% of the shares of TBSP, while Baogang owns the remaining 40%.
Indonesia
We hold 89.17% of SPIJ, an OCTG processing business situated in Cilegon, Indonesia, with heat treatment, premium connection threading facilities, coupling shop and a quality-testing laboratory, including an ultrasonic testing machine, which has an annual processing capacity of approximately 120,000 tons. We also have a premium joints accessories threading facility in the state of Batam.
Kazakhstan
We have a premium threading facility in Aktau, Kazakhstan. This state-of-the-art facility has the capacity to produce 45,000 tons of OCTG annually for threading seamless pipes and gas-tight premium connections to serve the local market.
Nigeria
We have a facility dedicated to the production of premium joints and couplings located in Onne, Nigeria, which comprises a threading facility for both API and premium connections with an annual production capacity of approximately 40,000 tons, inspection facilities and a stockyard. In addition, we own a 40% participation in Pipe Coaters, a leading company in the Nigerian pipe coating industry, located in Onne, which supplies a wide variety of products and services for the oil and gas industry, such as internal, anticorrosion, concrete and thermal insulation coatings for onshore and offshore (including deepwater) applications.
Production Facilities – Others
We have facilities for the manufacturing of sucker rods in Villa Mercedes (San Luis, Argentina), Moreira Cesar (São Paulo, Brazil), Veracruz (Mexico), Campina (Romania) and Conroe (Texas, United States). Our total annual manufacturing capacity of sucker rods is approximately 3.1 million units.
In Argentina, we have equipment to provide oil and gas services, including fracking and coiled tubing services. In the first half of 2024, we plan to invest $65 million to double our service capacity by incorporating new equipment and developing a new operating base.
| |
| Annual Report 2023 |
In Italy, we have the Piombino facility, which covers an area of approximately 67 hectares and comprises a hot-dip galvanizing line and associated finishing facilities. Production is focused on small diameter seamless pipes finishing for construction and plumbing applications in the domestic market, such as residential water, gas transport and firefighting. The Piombino facility has an annual production capacity of approximately 100,000 tons.
In addition, we have specialized facilities in the Houston area producing coiled tubing and umbilical tubing:
- A coiled tubing facility of approximately 150,000 square feet of manufacturing space on 4 hectares. The plant consists of two mills and coating operations capable of producing coiled tubing products in various grades, sizes and wall thicknesses. A new continuous heat treatment line has been recently installed.
- An umbilical tubing facility of approximately 85,000 square feet of manufacturing space on 6 hectares. While this facility is currently idle, it has the capacity to produce stainless or carbon steel tubing in various grades, sizes and wall thickness.
In November 2023, we acquired Mattr’s pipe coating business unit, with nine plants located in Canada (Edmonton, Alberta), Mexico (Veracruz), Norway (Orkanger), Indonesia (Batam City), the United Arab Emirates (Ras Al Khaimah) and the United States (Channelview, Texas), and several mobile concrete plants, which complement Tenaris’s global industrial footprint. The business also includes world-class R&D facilities in Toronto and Norway and a wide intellectual property product portfolio.
Sales and Marketing
Net Sales
Our total net sales amounted to $14,869 million in 2023, compared to $11,763 million in 2022 and $6,521 million in 2021. For further information on our net sales see “Operating and Financial Review and Prospects – Results of Operations”.
The following table shows our net sales by business segment for the periods indicated therein:
|
Millions of U.S. dollars |
For the year ended December 31, | |||||
|
|
2023 |
2022 |
2021 | |||
|
|
|
|
|
|
|
|
|
Tubes |
14,185 |
95% |
11,133 |
95% |
5,994 |
92% |
|
Others |
684 |
5% |
630 |
5% |
528 |
8% |
|
Total |
14,869 |
100% |
11,763 |
100% |
6,521 |
100% |
Tubes
The following table indicates, for our Tubes business segment, net sales by geographic region:
|
Millions of U.S. dollars |
For the year ended December 31, | |||||
|
|
2023 |
2022 |
2021 | |||
|
Tubes |
|
|
|
|
|
|
|
- North America |
7,572 |
53% |
6,796 |
61% |
3,240 |
54% |
|
- South America |
3,067 |
22% |
2,213 |
20% |
1,051 |
18% |
|
- Europe |
1,055 |
7% |
867 |
8% |
622 |
10% |
|
- Asia Pacific, Middle East & Africa |
2,491 |
18% |
1,257 |
11% |
1,081 |
18% |
|
Total Tubes |
14,185 |
100% |
11,133 |
100% |
5,994 |
100% |
| |
| Annual Report 2023 |
North America
Sales to customers in North America accounted for 53% of our sales of tubular products and services in 2023, compared to 61% in 2022 and 54% in 2021.
We have significant sales and production facilities in each of the United States, Canada and Mexico, where we provide customers with an integrated product and service offering based on local production capabilities supported by our global industrial system. In the past few years, we have extended our integrated product and service model, which we call Rig Direct®, throughout North America, and we operate a seamless pipe mill at Bay City, Texas, which is strategically located to serve the Eagle Ford and Permian regions. On January 2, 2020, we acquired IPSCO, a U.S. seamless and welded pipe producer, and, in September 2023, we acquired Republic Tube’s OCGT pipe processing facility in Houston with heat treatment and threading operations, further strengthening our local production capabilities and capacity to provide Rig Direct® services in the United States. Under Rig Direct®, we manage the whole supply chain from the mill to the rig for customers under long-term agreements, integrating mill production with customer drilling programs, reducing overall inventory levels and simplifying operational and administrative processes. We first introduced the Rig Direct® model to Pemex in Mexico in 1994, and since then we have supplied them with pipes on a just-in-time basis.
Today, we supply a large majority of our U.S. and Canadian customers for OCTG products with Rig Direct® services.
Sales to our oil and gas customers in the United States and Canada are highly sensitive to oil prices and regional natural gas prices. Over the past fifteen years, the drilling of productive shale gas and tight oil reserves, made possible by new drilling technology, has transformed drilling activity and oil and gas production in the United States and Canada. The United States has gone from being the largest global importer of oil to the largest global producer of crude oil and LNG. U.S. crude oil production has increased from 5.6 million b/d in 2011 to 13.3 million b/d at the end of 2013 and has been the largest contributor to meeting growth in global oil demand during this period as well as bringing the United States close to becoming a net exporter. This rapid increase in production, however, has contributed, at times, to an excess of supply in the global oil market and consequent fall in the price of oil. In 2020, the impact of the COVID-19 pandemic led to a sudden and substantial reduction in global oil demand in the first half of 2020 and a collapse in oil prices. Global oil demand and prices have now effectively recovered, along with economic activity, as COVID-19 vaccination programs were rolled out, and OPEC and other producer countries, including Russia, implemented production cuts to lower supply below demand and reduce inventory levels. At the same time, U.S. shale producers have restrained investments in response to the post COVID-19 recovery of oil prices as they face financial market pressures to increase returns to shareholders and limit investments in production growth.
Similarly, U.S. natural gas production has risen rapidly over the past decade and the United States became a net exporter of natural gas for the first time in 2017 and in 2023 became the largest exporter of LNG to global markets. In Canada, there has been a similar shift towards drilling of shale gas and tight oil reserves.
The drop in oil prices with the onset of the COVID-19 pandemic in the first half of 2020 resulted in a collapse in U.S. drilling activity, with the number of active rigs falling to the lowest level recorded in over 40 years. Crude oil production also fell back to 11.3 million b/d in each of 2020 and 2021, from 12.3 million b/d in 2019. However, since then, there was a steady recovery in U.S. drilling activity through 2021 and 2022 with the number of active rigs plateauing below pre-pandemic levels at the end of 2022. In 2023, however, drilling activity declined moderately in the second half of the year reflecting lower oil prices compared to the levels reached in 2022, while North American natural gas prices also declined due to increasing production, a low level of demand in the winter heating season and capacity limits on LNG exports.
The level of drilling activity in North America, and consequently demand for our products and services, could also be affected by actions taken by the governments of the region to accelerate the energy transition by reducing demand for oil and gas and restricting drilling activity.
During 2020, demand for, and sales of, our OCTG products in the United States and Canada collapsed along with drilling activity. As a result, we closed down many of our facilities in the United States and, we dismantled our Prudential welded pipe mill in Calgary, Canada, and integrated welded pipe production at our seamless pipe mill in Sault Ste. Marie, Ontario. Towards the end of 2020, demand for and sales of OCTG in the United States and Canada began a recovery which continued throughout 2021 and 2022. During this recovery period we reopened many of the facilities we had shut down in 2020 and brought production at our Bay City mill to full capacity. A particular feature of this recovery was the exceptional price levels for hot rolled coil in the North American market which made the production of welded pipes uneconomic throughout 2021 and delayed the restart of U.S. welded pipe production into 2022. The ramp up of production capacity in the United States was further affected by difficulties in hiring qualified workforce in the post-COVID economy. In 2023, despite the slowdown in drilling activity, demand and consumption of OCTG products remained close to the levels seen in 2022, as average OCTG consumption per rig increased along with drilling efficiencies.
During 2018, the U.S. government introduced, under Section 232, tariffs and quotas on the imports of steel products, including steel pipes, with the objective of strengthening domestic production capacity utilization and investment. The proportion of the OCTG market supplied by imports initially declined from around 60% prior to the imposition of tariffs and quotas to around 40% at the end of 2018. OCTG imports subsequently rose to around 50% during the recovery from the pandemic when U.S. production was constrained but has fallen to 40% during 2023 as distributors reacted to a rise in inventory levels by cutting back on OCTG import purchases.
| |
| Annual Report 2023 |
On October 27, 2021, the DOC initiated antidumping duty investigations on OCTG imports from Argentina, Mexico, and Russia and countervailing duty investigations of OCTG from Russia and South Korea. On October 27, 2022, the ITC determined that the imports under investigation caused injury to the U.S. OCTG industry. Tenaris and other parties have appealed the agency determinations from the investigation to the Court of International Trade. In addition, in response to a request from the Government of Argentina, the World Trade Organization (“WTO”) established a panel of experts to consider whether the DOC’s antidumping order applicable to Argentina is consistent with the international obligations of the United States. As a result of the investigation, and unless overturned on appeal, Tenaris is required to pay antidumping duties (at a rate of 78.30% for imports from Argentina and 44.93% for imports from Mexico) while the order is in effect. Tenaris has been paying antidumping duty deposits since May 11, 2022, reflecting the amount of such deposits in its costs. The deposit rates may be reset periodically based on the results of the administrative review process. It is possible that, through the periodic review process, the deposits may be either returned to Tenaris, in whole or in part, or may be increased.
Our sales in the United States are also affected by the level of investment of oil and gas companies in exploration and production in offshore projects.
Oil and gas drilling in Canada is subject to strong seasonality, with the peak drilling season in Western Canada being during the winter months when the ground is frozen. During the spring, as the ice melts, drilling activity is severely restricted by the difficulty of moving equipment in muddy terrain.
On June 30, 2021, Canada initiated an antidumping investigation on OCTG from Mexico. A full investigation was conducted and on January 26, 2022, the Canadian International Trade Tribunal found that Mexican imports were not injuring the Canadian OCTG industry and closed the inquiry without imposing any duties.
In Mexico, we have enjoyed a long and mutually beneficial relationship with Pemex, the Mexican state-owned oil company, and one of the world’s largest crude oil and condensate producers. In 1994, we began supplying Pemex with Rig Direct® services. At the end of 2022, we renewed our long-term agreement with Pemex for an additional three-year period.
At the end of 2013, Mexico reformed its constitution to allow increased private and foreign investment in the energy industry, including through participation in profit and production sharing contracts and licenses, and Pemex has been transformed into a state-owned production company but ceased to have a monopoly on production. In the last few years, the Mexican government made various attempts to modify rules and regulations governing the energy market in Mexico with potential impact on the energy supply and its cost. Recently, the Mexican President announced a new proposal for an ambitious constitutional reform, which covers a wide range of topics, including energy matters, with the intention of granting state-owned enterprises, particularly CFE and Pemex, priority over private companies on electricity dispatch. Pemex is charged with reversing production declines and in response, has been delaying payments to suppliers, including Tenaris. For more information on the proposed reform to the energy market in Mexico and our credit exposure to Pemex, see “Key Information – Risk Factors – Risks Relating to Our Business and Industry – Adverse economic or political conditions in the countries where we operate or sell our products and services may decrease our sales or disrupt our manufacturing operations, thereby adversely affecting our revenues, profitability and financial condition”.
Drilling activity in Mexico and demand for our OCTG products dropped only slightly in 2020 as the country was protected from lower oil prices by a price hedging program. Over the past three years, drilling activity in Mexico has increased moderately as the Mexican government and Pemex implemented measures to reverse production decline while some investments pursuant to the energy reform process are being implemented cautiously.
South America
Sales to customers in South America accounted for 22% of our sales of tubular products and services in 2023, compared to 20% in 2022 and 18% in 2021.
Our largest market in South America is Argentina. We also have significant sales in Brazil, Colombia and Guyana. We have manufacturing subsidiaries in Argentina, Brazil, Colombia and Ecuador, while in Guyana, we provide in-country services.
Our sales in South America are sensitive to the international price of oil and its impact on the drilling activity of participants in the oil and gas sectors, as well as to general economic conditions in these countries. In addition, sales in Argentina, as well as export sales from our manufacturing facilities in Argentina, are affected by governmental actions and policies, such as the taxation of oil and gas exports, measures affecting gas and gasoline prices in the domestic market and other matters affecting the investment climate. Sales in Brazil are also affected by governmental actions and policies and their consequences, such as measures relating to the taxation and ownership of oil and gas production activities and the operations of Petrobras. For more information, please see “Key Information – Risk Factors – Risks Relating to Our Business and Industry – Adverse economic or political conditions in the countries where we operate or sell our products and services may decrease our sales or disrupt our manufacturing operations, thereby adversely affecting our revenues, profitability and financial condition”.
| |
| Annual Report 2023 |
A principal component of our marketing strategy in South American markets is the establishment of long-term supply agreements and Rig Direct® services with national and international oil and gas companies operating in those markets.
In Argentina, we have a significant share of the market for OCTG products. We have longstanding business relationships with YPF S.A. (“YPF”), the Argentine state-controlled company, and with other operators in the oil and gas sector. We strengthened our relationship with YPF in 2013 through a long-term agreement, which was renewed for an additional five-year term at the beginning of 2022, under which we provide Rig Direct® services with the objective of reducing YPF’s operational costs as it aims to increase production through investments in Argentina’s shale oil and gas reserves. Drilling activity fell significantly during 2019 after an electoral process in Argentina. In 2020, our sales were affected by ongoing uncertainties regarding the energy policies that would be adopted by the incoming government as well as the onset of the COVID-19 pandemic. Activity recovered during the last three years. The principal restraint on further increases in activity, particularly in the Vaca Muerta shale play, is the lack of pipeline capacity for exporting oil and for transporting gas to the main consumption centers in Buenos Aires. New pipeline infrastructure is being installed; the first phase of a new gas pipeline and two oil export pipelines were completed in 2023 and further pipeline infrastructure is expected over the next years. We reactivated our welded pipe mill in Valentin Alsina, province of Buenos Aires, to supply pipes for the pipelines already constructed and supplemented deliveries with welded pipes from our mill in Brazil.
In Brazil, we have a longstanding business relationship with Petrobras. We supply Petrobras with casing and tubing (including premium connections) and line pipe products, many of which are produced in our Brazilian welded pipe facility, for both offshore and onshore applications. More recently, we have increased the sale of imported seamless products to Petrobras for offshore use, including the supply of seamless casing with premium connections, accessories and Rig Direct® services for use in the pre-salt area and seamless line pipe for use in offshore risers. With the development of Brazil’s deepwater pre-salt complex, our mix of products sold in Brazil has evolved from one including mainly line pipe for onshore pipeline projects to one which includes large diameter conductor and surface casing, intermediate and production casing and line pipe for use in deepwater applications. In 2020, with the onset of the COVID-19 pandemic and the collapse in oil prices, Petrobras reduced its onshore drilling operations to focus on pre-salt offshore developments. In 2022 and particularly in 2023, offshore drilling activity increased as a result of the development of the Buzios and other pre-salt fields by Petrobras as well as other investments by major oil companies. Consumption of OCTG products in Brazil, which had been at a relatively low level for several years as Petrobras reduced its investments in response to budgetary constraints, concentrating on developing its most productive reserves in the pre-salt fields, doubled in 2023 and is expected to remain at a similar level in 2024. Demand for line pipe for pipeline projects also declined to very low levels with only one major project implemented in the past seven years, but line pipe demand is expected to pick up in 2024 with a major offshore pipeline authorized. In response to market-opening measures and the attractiveness of the deepwater reserves, major oil companies have increased their investments in Brazil, while Petrobras is focusing investments in world class assets in deepwater.
In Colombia, we have established a leading position in the market for OCTG products since 2006, following our acquisition of TuboCaribe, a welded pipe manufacturing facility located in Cartagena. Although the market was deeply affected by low oil prices between 2014 and 2016, it has grown over the past decade as the country encouraged investment in its hydrocarbon industry and opened its national oil company to private investment. In 2020, the pandemic-related collapse in oil prices resulted in a drop of drilling activity which recovered in 2021 and 2022. In 2023, however, drilling activity has been affected as the new government introduced policies aimed at reducing exploration activity while local protests and security concerns increased at some drilling locations. Our principal customer in Colombia is Ecopetrol S.A. (“Ecopetrol”), to which we supply Rig Direct® services. In 2022 we renewed our agreement with Ecopetrol for two years.
In Guyana and neighboring Suriname, offshore drilling activity has been increasing rapidly over the past few years following the discovery of large, cost competitive oil reserves. We are supplying casing for many of the exploration wells and, at the end of 2021, we were awarded a 10-year contract to supply large and medium diameter casing with Rig Direct®-alike services to the main deepwater offshore development projects in the Starbroek block.
These developments are transforming the Guyana economy and are yielding a significant new source of oil to global markets.
We also have sales in Ecuador, supplying Petroamazonas Ecuador S.A., which merged with EP PetroEcuador, the national oil company, as well as private operators. To increase local content, we have established a local OCTG threading facility in Machachi.
We were present in the Venezuelan OCTG market for many years and we maintained business relationships with Petróleos de Venezuela S.A. and the joint venture operators in the oil and gas sector until the imposition of economic sanctions by the Office of Foreign Assets Control (“OFAC”). Additionally, we maintained business relationships with Chevron in Venezuela until April 22, 2020, when their sanctions license expired. Our sales in Venezuela declined to low levels in 2020, with no sales in 2021 and 2022. Recently, Chevron has been authorized to resume certain operations, which is leading to a limited resumption of sales in Venezuela but uncertainty remains about the course of future sanctions.
| |
| Annual Report 2023 |
Europe
Sales to customers in Europe accounted for 7% of our sales of tubular products and services in 2023, compared to 8% in 2022 and 10% in 2021.
Our single largest country market in Europe is Italy. The market for steel pipes in Italy (as in much of the European Union) is affected by general industrial production trends, especially in the mechanical and automotive industry, and by investment in power generation, petrochemical and oil refining facilities. Sales to the mechanical and automotive industries and for HPI and power generation projects in Italy and the rest of Europe in 2020 were affected by lower prices reflecting increased competitive pressures, but volumes were relatively stable. In 2021, activity and our sales increased. In 2022, although activity was affected by the Russian invasion, our sales increased as prices rose to compensate higher costs, while in 2023, although activity declined, our sales remained stable reflecting a change in the competitive environment.
In Europe we also have significant sales to the oil and gas sector, particularly in the North Sea. Demand from this market is affected by oil and gas prices in the international markets and their consequent impact on oil and gas drilling activities in the North Sea and other areas, like Romania. In addition, we ceased sales to Russia that would breach applicable sanctions imposed by the U.S., and the EU following the Russian invasion of Ukraine. Sales in the North Sea rose during 2023 as drilling and gas pipeline construction activity increased.
Europe is also a region which we expect will be at the forefront of developments in low-carbon energy, including hydrogen storage and transportation, CCS, geothermal and waste-to-energy power generation. We are participating in these market segments where we expect to see growth in sales in the coming years.
Asia Pacific, Middle East and Africa
Sales to customers in the Asia Pacific, Middle East and Africa accounted for 18% of our sales of tubular products and services in 2023, compared to 11% in 2022 and 18% in 2021.
Our largest single country markets in the region are Saudi Arabia and the United Arab Emirates. In Saudi Arabia, in response to policies that have been implemented to diversify the economy and increase local manufacturing, we have developed a substantial local manufacturing presence, first through the establishment of local premium threading facilities, and, more recently, through the acquisition of controlling participations in two welded pipe producers. In January 2019, we acquired 47.8% of SSPC, a listed ERW steel pipe producer. With the acquisition of SSPC, we also acquired a 35% share interest in GPC, a Saudi-German joint venture, established in 2010 and located in Jubail, Saudi Arabia, which manufactures LSAW pipes. In May 2023, we increased our participation in GPC to 57.3% when the German shareholder in GPC decided to exit. In 2022, we entered into a long-term agreement with Saudi Aramco for the supply of seamless OCTG products that prioritizes local production where possible. In 2023, we entered into a similar long-term agreement for LSAW OCTG products, while we also have medium-term supply agreements with Saudi Aramco for ERW OCTG and line pipe products.
In the United Arab Emirates, we inaugurated an industrial complex with a newly-constructed premium threading facility, dedicated training facilities and an expanded service yard in February 2024. This followed the award, in August 2019, of a long-term agreement with Rig Direct® conditions, valued at $1.9 billion, to supply approximately half of the OCTG requirements of ADNOC in Abu Dhabi over the following five to seven years.
We have a wide-ranging presence in the rest of the region, with industrial facilities in Indonesia, China, Kazakhstan and Nigeria and service centers in various additional countries.
Our sales in this region remain sensitive to international prices of oil and gas and their impact on drilling activities as well as to the production policies pursued by OPEC, and, more recently, OPEC+ countries, many of whose members are located in this region. In the past few years, oil and gas producing countries in the Middle East, led by Saudi Arabia, have increased investments to develop gas reserves to fuel regional gas-based industrial development, which have positively affected their consumption of premium OCTG products. Saudi Arabia, in particular, is pursuing strong growth in conventional and unconventional gas drilling activity. The main national oil companies in the Gulf have also increased investments to add oil and LNG production capacity as they seek to accelerate the monetization of their oil and gas reserves, although Saudi Arabia recently announced that it would curtail its oil production capacity expansion plans.
In North Africa, there have been significant discoveries and development of offshore gas reserves in the Mediterranean in recent years and international oil companies have increased their investments in the region. In sub-Saharan Africa, after several years of limited investments, international oil companies began to increase their investments in exploration and production in offshore projects in 2022.
In the Caspian region, major oil companies operating in Kazakhstan and Azerbaijan increased their investments and drilling activity following a recovery of oil prices in 2017. In 2020 and 2021, however, our sales were affected by the impact of the COVID-19 pandemic on the operations of our customers and the impact on drilling activity of adherence to the production cuts agreed by the OPEC+ countries in response to the collapse of oil demand due to the pandemic. Since then, drilling activity and our sales have remained at low levels.
| |
| Annual Report 2023 |
In the past few years, uprisings affected drilling activity in countries such as Syria, Libya and Yemen. In addition, for a number of years, U.S. and E.U. sanctions have affected production and exports in Iran.
In Indonesia and other markets in South East Asia and Oceania, drilling activity, particularly offshore drilling activity, is mainly affected by demand and prices for natural gas and LNG. The region is a major producer of natural gas and LNG particularly for the energy-hungry economies of China and North-East Asia.
Our sales in China are concentrated on premium OCTG products used in oil and gas drilling activities. Over the past 15 years, China has significantly reduced its imports of OCTG products as local producers compete ferociously in an oversupplied market. We continue, however, to seek new markets in niche applications and in 2016 we opened a components facility for processing pipes for use in airbags for automobiles, which we recently expanded for the second time. In 2020, we established a joint venture with Baotou Steel, a major domestic supplier of seamless pipes to the onshore oil and gas fields, for the construction of a premium threading facility located within our partner’s steelmaking facilities in Inner Mongolia. The new facility, which finishes pipes produced mainly by our joint venture partner, began production during the first quarter of 2022. Our participation in the joint venture is 60%. During 2022, Baotou Steel and Baosteel International Group (“Baosteel”) merged their seamless pipe businesses, but at the end of 2023, this merger was reversed, and we are resuming operations with our original joint venture partner.
In Japan, our former subsidiary, NKKTubes, competed against other domestic producers. In November 2022 we entered into a definitive wrap-up agreement with JFE to terminate our joint venture and cease NKKTubes’ operations. The market for steel pipe products in Japan is mostly industrial and depends on general factors affecting domestic investment, including production activity. With the closure of manufacturing and production operations of NKKTubes in June 2022, we have largely ceased to serve this market.
Our sales in the greater region could be adversely affected by political and other events in the region, such as armed conflicts, terrorist attacks and social unrest, which could materially impact the operations of companies active in the region’s oil and gas industry. Our sales in the region can also be affected by the levels of inventories held by the principal national oil companies and their effect on purchasing requirements. For more information, please see “Key Information – Risk Factors – Risks Relating to Our Business and Industry – Adverse economic or political conditions in the countries where we operate or sell our products and services may decrease our sales or disrupt our manufacturing operations, thereby adversely affecting our revenues, profitability and financial condition”.
Sales in the region declined to a low level in 2021 as a result of various factors, including the slowdown in investments in drilling activity as a result of the pandemic and reduction in oil demand and prices and ongoing inventory reductions at some of the region’s largest consumers such as Saudi Arabia and the United Arab Emirates. In 2022, our sales in the region began to recover marginally while in 2023 our sales benefited from a strong recovery in activity and inventory shortages. We expect sales will increase further in 2024 led by Saudi Arabia where we won a major tender to help Saudi Aramco to replenish inventory levels.
Others
Our other products and services include sucker rods used in oil extraction activities, oil and gas services, namely fracking and coiled tubing services in Argentina, sales of pipe for plumbing applications from our Italian Piombino mill, coiled tubes used in oil and gas extraction activities, and sales of raw materials and energy that exceed our internal requirements.
On November 30, 2023, we acquired the pipe coating business from Mattr, which has nine pipe coating facilities and two R&D centers around the world, and is a global leader in anti-corrosion and insulation coating for offshore pipelines. The acquired plants are located close to our coating plants in Argentina, Brazil, the United States, Italy and Saudi Arabia and are largely complementary to our operations. Since December 1, 2023, we started to report the sales and results of the newly acquired business in the “Others” segment, because most of the coating service from such business is performed on third party pipes. Sales and results of pipe coating services on Tenaris’s own tubes are reported in our “Tubes” segment.
Net sales of other products and services amounted to 5% of total net sales in 2023, compared to 5% in 2022 and 8% in 2021.
During 2022, we closed down our Brazilian industrial equipment business and, in 2021, we sold our Geneva mill (pipes for construction activities) in the United States as well as a small Saudi equipment manufacturing and erection business that we acquired during our SSPC acquisition.
| |
| Annual Report 2023 |
Competition
The global market for steel pipe products is highly competitive. Seamless steel pipe products, which are used extensively in the energy industry particularly for offshore, high pressure, high stress, corrosive and other complex applications, are produced in specialized mills using round steel billets and specially produced ingots. Welded steel pipe products are produced in mills which process steel coils and plates into steel pipes. Steel companies that manufacture steel coils and other steel products but do not operate specialized seamless steel mills are generally not competitors in the market for seamless steel pipe products, although they often produce welded steel pipes or sell steel coils and plates used to produce welded steel pipes.
The production of steel pipe products following the stringent requirements of major oil and gas companies operating in offshore and other complex operations requires the development of specific skills and significant investments in manufacturing facilities. By contrast, steel pipe products for standard applications can be produced in most seamless pipe mills worldwide and sometimes compete with welded pipe products for such applications including OCTG applications. Welded pipe, however, is not generally considered a satisfactory substitute for seamless steel pipe in high-pressure or high-stress applications.
Over the past two decades, substantial investments have been made, especially in China but also in other regions around the world, to increase production capacity of seamless steel pipe products. Production capacity for more specialized product grades has also increased. With the downturn between 2014 and 2016 in the price of oil and demand for tubes for oil and gas drilling, the overcapacity in steel pipe and seamless steel pipe production worldwide became acute, extending beyond commodity grades. This situation is accentuated by the prospect of an accelerated energy transition. Effective competitive differentiation and industry capacity closures will be key factors for Tenaris.
Our principal competitors in steel pipe markets worldwide are described below.
- Vallourec S.A. (“Vallourec”), a French company, has mills in Brazil, China, and the United States. Vallourec has a strong presence in the U.S. and Brazilian markets for OCTG and line pipe products and the Brazilian market for industrial products, as well as a significant market share in the international market with customers primarily in the Middle East, Africa and Asia Pacific. Vallourec is an important competitor in the international OCTG market, particularly for high-value premium joint products, where it operates a technology partnership for VAM® premium connections with Nippon Steel Corporation (“NSC”). Prior to the collapse in oil prices in 2014 to 2016, Vallourec increased its production capacity by building mills in Brazil (jointly with NSC) and Youngstown, Ohio, acquiring tubular businesses in the United States and Saudi Arabia, and acquiring a Chinese seamless steel producer. Since then, Vallourec has carried out two major financial restructuring processes and is now emerging as a financially stable company with a reduced industrial perimeter under new management and owners. In the second financial restructuring, Vallourec’s creditors, including Apollo, a private equity house, assumed effective control. Under the same restructuring, Vallourec closed its German mills during 2023 and invested EUR100 million in its Brazilian mills to enable the transfer of its specialized products for oil and gas customers from Germany to Brazil. On March 12, 2024, Vallourec announced that ArcelorMittal S.A. (“ArcelorMittal”) had agreed to acquire Apollo’s entire shareholding (28.4% of voting rights and 27.5% of the share capital) and that ArcelorMittal would become its reference shareholder.
- U.S. Steel Corporation (“U.S. Steel”), a large U.S. steel manufacturer, has long been a significant player in the U.S. market for seamless OCTG and line pipe. During the pandemic-induced downturn, it closed its large diameter seamless pipe mill in Lorain and the welded pipe facilities it acquired from Lone Star in 2008 to focus its pipe business on its medium range seamless pipe mill in Fairfield, Alabama where it also constructed an EAF steel mill to have a fully integrated facility. In December 2023, U.S. Steel and NSC announced that they had entered into a definitive agreement pursuant to which NSC will acquire U.S. Steel; the transaction remains subject to approval by U.S. Steel’s shareholders and regulatory approvals.
- Japanese companies NSC and, to a lesser extent, JFE together enjoy a significant share of the international market, having established strong positions in markets in the Far East and the Middle East. They are internationally recognized for their supply of high-alloy grade pipe products. Over the previous decade, NSC had increased its capacity to serve international markets through the construction with Vallourec of a new seamless pipe mill in Brazil, and further strengthened its ties with Vallourec through participating in Vallourec’s 2016 capital increase and combining their respective Brazilian operations. As part of the latest financial restructuring of Vallourec, NSC relinquished its participation in the Brazilian operation and ceded its reference shareholder position in Vallourec. In 2022, NSC, as part of a general restructuring of its steelmaking operations, closed one of its three seamless pipe production mills and announced the closure of its large diameter welded pipe mill and its exit from the large diameter welded line pipe market. However, in December 2023, U.S. Steel and NSC announced that they had entered into a definitive agreement pursuant to which NSC would acquire U.S. Steel (including its steel pipe operations); the transaction remains subject to approval by U.S. Steel’s shareholders and regulatory approvals.
| |
| Annual Report 2023 |
- Over the past two decades, TMK, a Russian company, led the consolidation of the Russian steel pipe industry, invested to modernize and expand its production capacity in Russia and expanded internationally through acquisitions into Eastern Europe and the United States. TMK also expanded in the Middle East through the acquisition of a controlling interest in Gulf International Pipe Industry LLC, a welded pipe producer in Oman. More recently, however, TMK adopted a strategy of monetizing its international assets by reducing its participation in Gulf International Pipe and selling IPSCO to Tenaris, as well as strengthening its position in its domestic market by acquiring Chelpipe, the second Russian producer of seamless pipes in 2021. In 2022, following the Russian invasion of Ukraine, the American Petroleum Institute (“API”) withdrew its license for products produced in TMK’s mills in Russia. Russian producers or their controlling shareholders are now subject to U.S., EU and UK sanctions, among others, and are now largely prevented from competing in several markets.
- In the Middle East, particularly in Saudi Arabia, which has implemented policies to encourage local production for its oil and gas industry, several pipe mills were established, including a seamless pipe mill built by Jubail Energy Services Company (“JESCO”), a company established with majority participation from a state-backed industrial development company, and a seamless pipe mill originally built by a joint venture of ArcelorMittal and local shareholders (“AMTJ”). These local players have been strengthening their capabilities and are taking an increasing share of the pipes supplied to Saudi Aramco as well as exporting to other countries in the Middle East and the rest of the world. In 2021, JESCO and AMTJ, who were both operating with losses, combined their operations at the behest of the Saudi Public Investment Fund.
- Over the past two decades, Chinese producers increased production capacity substantially and strongly increased their exports of steel pipe products around the world. Due to unfair trading practices, many countries, including the United States, the European Union, Canada, Mexico and Colombia, have imposed anti-dumping restrictions on Chinese imports to those regions. In 2009, the largest Chinese producer of seamless steel pipes, Tianjin Pipe (Group) Corporation Limited (“TPCO”), announced a plan to build a new seamless pipe facility in the United States in Corpus Christi, Texas; heat treatment and pipe finishing facilities were constructed but steelmaking and hot rolling facilities have not been completed. As part of a financial restructuring, a 51% shareholding in TPCO was sold to Shanghai Electric Group and has now been sold on to Citic Group Corporation Ltd. (“Citic”), a state-owned conglomerate. Although producers from China compete primarily in the “commodity” sector of the market, several of these producers, including Baosteel and TPCO, have developed and are selling more sophisticated products, particularly in the domestic market.
- Although the tubes and pipes business in the United States and Canada has experienced significant consolidation over the years, many new players have built pipe mills in the United States. These include, in addition to TPCO, Boomerang LLC, a company formed by a former Maverick executive that opened a welded pipe mill in Liberty, Texas, now known as PTC Liberty Tubulars and part of the PTC Alliance; Benteler A.G. (“Benteler”), a European seamless pipe producer that built a new seamless pipe mill in Louisiana, which opened in September 2015; and a plethora of welded pipe mills established by subsidiaries of foreign pipe producers, such as SeAH Steel (“SeAH”), of Korea and JSW Group (“JSW”), of India. North American pipe producers, including U.S. Steel, are largely focused on supplying the U.S. and Canadian markets, where they have their production facilities.
- Korean welded pipe producers, who have a limited domestic market, have targeted the U.S. market for standard applications. They have gained a significant market position, despite the application of anti-dumping duties for unfair trading practices and being subject to Section 232 quotas. One of them, SeAH, has acquired and built local welded pipe production facilities in the United States.
- Benteler, Tubos Reunidos S.A. of Spain (“Tubos Reunidos”), and Voest Alpine A.G. of Austria (“Voest Alpine”) each have a significant presence in the European market for seamless steel pipes for industrial applications. Voest Alpine also has a relevant presence in the U.S. and Canadian OCTG markets and some other international OCTG markets. In 2016, Tubos Reunidos opened an OCTG threading facility targeting international markets, including the United States.
- ArcelorMittal has seamless pipe mills in Romania and South Africa as well as a 33.3% participation as technical partner in AMTPJ in Saudi Arabia. It also has a number of welded pipe mills in North America and Europe, supplying the industrial and automotive sectors. On March 12, 2024, ArcelorMittal announced that it had agreed to acquire 28.4% of the voting rights (representing a 27.5% of the share capital) in Vallourec, expecting to become its reference shareholder.
| |
| Annual Report 2023 |
Producers of steel pipe products can maintain strong competitive positions in markets where they have their pipe manufacturing facilities due to logistical and other advantages that permit them to offer value-added services and maintain strong relationships with domestic customers, particularly in the oil and gas sectors. Our subsidiaries have established strong ties with major consumers of steel pipe products in their home markets, reinforced by Rig Direct® services, as discussed above.
Capital Expenditure Program
During 2023, our capital expenditures, including investments at our plants and information systems (“IT”), amounted to $619 million, compared to $378 million in 2022 and $240 million in 2021. Of all capital expenditures made during 2023, $571 million were invested in tangible assets, compared to $346 million in 2022 and $214 million in 2021.
In 2023, we focused on improvements with environmental impact in line with our target of reducing carbon emissions intensity by 30% by 2030, compared to a 2018 baseline, enhancing efficiency in our industrial plants, improving automation and digitalization of our processes, and increasing product differentiation.
The major highlights of our capital spending program during 2023 included:
- the completion of our first wind farm in Argentina;
- the upgrade of the Koppel steel shop exhaust fumes system, to reduce emissions and improve health and safety conditions in the mill (investment ongoing and expected to be completed in 2024);
- the construction of a new threading line, service center and offices in Abu Dhabi, consolidating our position in the country;
- the revamping and upgrade of our existing lines to improve the standards of industrial efficiency, including the heat treatment capacity increase in our Dalmine facility in Italy, coupling shops in Argentina, Mexico and Colombia;
- investments in connection with our differentiation strategy, including to increase capacity on special steel grades in our mills;
- automation of existing lines in our Tamsa (Mexico), Conroe and Koppel (United States) and Siderca in (Argentina) facilities; and
- offices redesign project, aligning workspace to our new way of working.
Investments in information systems and other intangible assets totaled $48 million in 2023, compared to $32 million in 2022 and $26 million in 2021.
As planned, our 2023 IT capital expenditure program focused on:
- operational continuity, with an increased investment in updating infrastructure to mitigate the effects of obsolescence;
- industrial infrastructure and cybersecurity, continuing with our multi-year program to strengthen cybersecurity and mitigate risks to our operational technology, with particular focus on our Veracruz, Campana and Zalau mills; and
- increased efficiency and productivity in our business cycle, including through standardization of our manufacturing execution systems in the United States (allowing our U.S. multi-site industrial landscape to operate as a single plant) and through continuous advancement on our new production programming and scheduling system (“SIP”) in Mexico and Romania.
We have completed the technological integration of the IPSCO facilities, and our investment portfolio for 2024 is expected to focus on IT synchronization of newly acquired businesses.
Capital expenditures are expected to increase to around $700 million in 2024. Around 30% of our capex, will be directed to projects that are expected to contribute to our 2030 target for reducing the carbon emission intensity of our operations and other environmental objectives. In particular, our investment program for 2024 includes:
| |
| Annual Report 2023 |
- the construction of a second wind farm in Argentina;
- the revamping and upgrade of Siderca’s electric arc furnace with energy efficient Consteel® technology;
- the completion of the upgrade of the Koppel steelmaking exhaust fumes system, to reduce emissions and improve the mill’s health and safety conditions;
- the revamping and upgrade of our existing lines to improve the standards of industrial efficiency, including the revamping of 20” medium tubes mill finishing line in Dalmine, Italy, and the increase of capacity in coupling shops in Mexico;
- the upgrading of Dopeless® production capabilities in Dalmine, Italy and Silcotub, Romania; and
- offices redesign project aligning workspace to our new way of working.
Raw Materials and Energy
The majority of our seamless steel pipe products are manufactured in integrated steelmaking operations using the electric arc furnace route, with the principal raw materials being steel scrap, DRI, HBI, pig iron and ferroalloys. In Argentina we produce our own DRI from iron ore using natural gas as a reductant. Our integrated steelmaking operations consume significant quantities of electric energy, mostly purchased from the local electricity markets, though in part sourced from our own renewable, natural gas and thermal-electric power production. Our welded steel pipe products are processed from purchased steel coils and plates.
The weight of the different steelmaking raw materials and steel vary with the proportion of seamless and welded pipes in the total production mix and among the different production facilities in our industrial system, as well as the specifications of the final products and other factors. On average, in 2023, steel scrap, pig iron, HBI and DRI represented approximately 23% of our steel pipe products’ costs, while purchased steel in the form of billets, coils or plates represented approximately 17%, with direct energy accounting for approximately 4%.
The above raw material inputs are subject to price volatility caused by supply, political and economic situations, financial variables and other unpredictable factors. For further information on price volatility, see “Key Information – Risk Factors – Risks Relating to Our Business and Industry – Increases in the cost of raw materials, energy and other costs, limitations or disruptions to the supply of raw materials and energy, and price mismatches between raw materials and our products may hurt our profitability”. The costs of steelmaking raw materials and of steel coils and plates increased on average in 2021 compared to 2020 and were subject to high levels of volatility during 2022 as they were affected by the Russian-Ukraine armed conflict, and the sanctions being imposed on Russian individuals, companies and institutions. They returned to more stable levels in 2023. For more information, see “Key Information – Risk Factors – Risks Relating to Our Business and Industry – An escalation of the Russia-Ukraine war and other armed conflicts may adversely affect our operations”.
Steel scrap, pig iron and HBI
Steel scrap, pig iron and HBI for our steelmaking operations are sourced from local, regional and international suppliers. In Argentina we produce our own DRI and source ferrous scrap domestically through a wholly owned scrap collecting and processing subsidiary. In Italy we purchase pig iron and ferrous scrap from local and regional markets. In Mexico we import our pig iron and HBI requirements and purchase scrap from domestic and international markets. In Romania we source ferrous scrap mainly from the domestic market and we import pig iron. In the United States, we source scrap from the local market to supply our steelmaking facility, and also source pig iron from international markets.
International prices for steel scrap, pig iron and HBI can vary substantially in accordance with supply and demand conditions.
Annual scrap prices decreased slightly in 2023. As a reference, prices for Scrap Shredded U.S. East Coast, published by Platts, averaged $376 per ton in 2023 and $429 per ton in 2022, while they averaged $441 per ton in 2021. Scrap prices had spiked following the Russian invasion of Ukraine as both countries are significant exporters of semi-finished steel and pig iron.
New decarbonization efforts, including new regulation impacting the oil industry, as well as the increasing preference of EAF over BF has supported prices and this trend is expected to continue as scrap availability becomes increasingly scarce.
In 2022 and 2023, Brazil was the largest pig iron supplier to the United States because supply from Russia and Ukraine decreased significantly. As global economic growth began to decelerate, prices decreased during the second half of 2022. This decrease is attributed also to more availability as supply chains have rebalanced and, contrary to scrap, decarbonization efforts are resulting in decreased demand for pig iron. Prices remained relatively stable during 2023, reaching levels around $400 per ton in early 2024.
| |
| Annual Report 2023 |
Iron ore
We consume iron ore in the form of pellets for production of DRI in Argentina. Siderca’s consumption of iron ore during 2023 was approximately 971 thousand tons, supplied by Vale International S.A. and Samarco Mineração S.A. from Brazil, and Iron Ore Company (“IOC”) from Canada. Annual iron ore prices remained stable during 2023 in comparison to 2022, but remain at high levels compared to historical averages. As a reference, prices for IODEX 62% Fe Index, published by Platts, averaged $120 per ton in 2023 and $120 per ton in 2022, in comparison to $160 per ton in 2021. After reaching $136 per ton in December 2023, iron ore prices have fallen back to $125 per ton in February 2024.
Pellet premiums price averaged $45 per ton in 2023, and $72 per ton in 2022, while they averaged $60 per ton in 2021. The DRI pellet market started with a supply squeeze in 2022 as Ukrainian exports were affected by the conflict and India imposed heavy export tariffs. In the second half of 2022, the market suffered from weak demand mainly by European and Asian purchasers. In 2023 prices decreased as India removed the export tariffs, and demand from Europe remained weak throughout the year.
Round steel bars
We mainly satisfy our steel bars and ingots requirements with materials produced in our steelmaking facilities in Argentina, Italy, Mexico, Romania and the United States. We complement this internal supply with limited purchases of steel bars and ingots from third parties as required, and particularly for use in our seamless steel pipe facilities in Canada and the United States and to supplement production from our steel shop in Mexico.
In Canada, we mainly source our steel bars requirements from our integrated facilities in Argentina, Italy, Mexico, Romania and United States.
In the United States, we own a steel shop facility in Koppel, Pennsylvania. After having completed certain investments in 2021, this facility provides a significant portion of the steel bars required by our Bay City and Ambridge mills. We also use steel bars imported from our integrated facilities in Romania, Italy, Argentina and Mexico. These imports have been excluded from Section 232 tariffs, by application of certain commercial agreements (between the U.S. and the EU, and between the U.S. and Mexico).Additionally, we have contracts in place with Nucor Steel and U.S. Steel to purchase a portion of the steel bar requirements in our Bay City mill.
In Japan, following the termination of our joint venture and the closure of the NKKTubes plant, JFE agreed to provide us with 13 Chrome alloy products for a two-year period, that was extended for an additional five year period, while we advance with the investments required to produce such materials in the rest of our industrial system. For further information on the termination of the NKKTubes joint venture, please refer to note 36 “Termination of NKKTubes joint venture” of our audited consolidated financial statements included in this annual report.
Steel coils and plates
For the production of welded steel pipe products, we purchase steel coils and steel plates principally from domestic producers for processing into welded steel pipes. We have welded pipe operations in Argentina, Brazil, Canada, Colombia, Saudi Arabia and the United States.
Steel coil market prices in 2023 decreased 12%. As a reference, prices for hot rolled coils, HRC Midwest USA Mill, published by CRU, averaged $991 per metric ton in 2023 and $1,128 per metric ton in 2022 in comparison to $1,734 in 2021.
For our welded pipe operations in the United States, a significant part of our requirements for steel coils are supplied by Nucor Steel which is our principal supplier in the United States. Nucor Steel has a steel coil manufacturing facility in Hickman, Arkansas, near to our principal welded pipe facility in the United States. During 2023, Nucor Steel supplied steel coils under a long-term purchase agreement, which is due to expire at the end of 2024.
In Canada, we have restarted negotiations with the main local suppliers to reach long-term agreements for our welded pipe operations. Among such suppliers are ArcelorMittal Dofasco, which has steel coil manufacturing facilities in Hamilton, Ontario, and Algoma Steel, which has steel coil manufacturing facilities in Sault Ste. Marie, Ontario.
We also purchase steel coils and plates for our welded pipe operations in South America (Colombia, Brazil and Argentina). In Brazil, principally from Gerdau S.A., ArcelorMittal Tubarão and Usiminas, a subsidiary of Ternium. In Argentina from Ternium Argentina S.A. (“Ternium Argentina”), a subsidiary of Ternium, and from Ternium’s facilities in Mexico. In addition, in Brazil we also source plates and coils from international suppliers when not produced domestically. In Saudi Arabia, we mainly purchase steel coils from the local market for SSPC and plates from China for GPC.
| |
| Annual Report 2023 |
Energy
We consume substantial quantities of electric energy, mainly at our electric steel shops in Argentina, Italy, Mexico, Romania and the United States.
In Argentina, our local electric energy requirements are satisfied through purchases in the local market, by a 35-megawatt thermo-electric power generating plant located within the Campana facility and since October 2023, from our wind farm. In Dalmine, Italy, we have a 120-megawatt power generation facility which is designed to have sufficient capacity to meet most of the electric power requirements of the operations. The additional energy needed to cover the peaks of consumption and the excess energy produced are purchased and sold to the market while heat is sold for district heating or used internally. In Mexico, our electric power requirements are mainly satisfied by Techgen, a natural gas-fired combined cycle electric power plant in the Pesquería area of the State of Nuevo León, while a small portion of our energy requirements are furnished by the Mexican government-owned CFE. In the last few years, the Mexican government made various attempts to modify rules and regulations governing the energy market in Mexico with potential impact on the energy supply and its cost. For more information, see “Key Information – Risk Factors – Risks Relating to Our Business and Industry – Adverse economic or political conditions in the countries where we operate or sell our products and services may decrease our sales or disrupt our manufacturing operations, thereby adversely affecting our revenues, profitability and financial condition”. In Romania and the United States, we source electric energy from the local market.
We consume substantial volumes of natural gas in Argentina, for the generation of DRI in addition to the requirements for producing seamless pipes. Tecpetrol S.A. (“Tecpetrol”), a San Faustin subsidiary, is our main natural gas supplier in Argentina under market conditions and according to local regulations.
We have transportation capacity agreements with Transportadora de Gas del Norte S.A. (“TGN”), a company in which San Faustin holds a significant but non-controlling interest, corresponding to capacity of 1,000,000 cubic meters per day until April 2027. In order to meet our transportation requirements for natural gas above volumes contracted with TGN, we also have agreements with Naturgy S.A. (“Naturgy”), for a maximum transportation capacity corresponding to approximately 970,000 cubic meters per day. For the final transportation phase, we also have a supply contract with Naturgy. Both contracts with Naturgy are in place until April 2024 and are expected to be renewed.
In addition to the amount of gas consumed at our Italian plants, we also require a substantial volume of natural gas to feed our power generation facility in Italy. Our natural gas requirements for the power generation facility are currently supplied by Edison Energia S.p.A while the natural gas consumed at our Italian plants is supplied by Eni S.p.A.
Our costs for electric energy and natural gas vary from country to country. Prior to late 2021, energy costs remained generally flat due to the increasing availability of natural gas from shale plays and additional renewable energy generation at more competitive prices. In a context of uncertainty regarding future energy prices, in December 2020, the Argentine government launched a new gas plan to increase natural gas supply following a drop from the maximum levels reached in 2019. Because winter demand for natural gas continues to outpace supply, Argentina is required to import natural gas from Bolivia and Chile and LNG from the international market at high prices, in addition to using liquid fuel to generate electricity. In mid-2023, the Gasoducto Presidente Nestor Kirchner was completed increasing the supply and improving costs through lower use of LNG and/or liquid fuel. In late 2021, energy and gas prices increased, particularly in Europe. The Russian invasion of Ukraine led to renewed volatility in energy commodity prices, accelerated by the low level of inventories throughout the first half 2022, reaching a peak in late August and then slowly stabilizing at high levels. In early 2023, European electricity prices fell to pre-war levels, thanks to lower gas prices, mainly due to a particularly mild winter, and have remained relatively stable throughout 2023. Due to milder temperatures, a decrease in demand for gas and the activation of alternative energy, the filling of gas storage facilities in the EU countries remains high. See “Key Information – Risk Factors – Risks Relating to Our Business and Industry – Increases in the cost of raw materials, energy and other costs, limitations or disruptions to the supply of raw materials and energy; and price mismatches between raw materials and our products may hurt our profitability”, “Key Information – Risk Factors – Risks Relating to Our Business and Industry – Adverse economic or political conditions in the countries where we operate or sell our products and services may decrease our sales or disrupt our manufacturing operations, thereby adversely affecting our revenues, profitability and financial condition”, and for more information on the impact on our business of the armed conflict in Ukraine, see “Key Information – Risk Factors – Risks Relating to Our Business and Industry – An escalation of the Russia-Ukraine war and other armed conflicts may adversely affect our operations”.
On November 1, 2023, the Company’s board of directors, approved an investment plan to build a second wind farm in Argentina at a cost of approximately $214 million, which would supply a further 30% of the current energy requirements of the facilities in Campana and reduce the CO2 emissions by a further 102,500 tons per year. This investment is expected to be completed during 2025.
| |
| Annual Report 2023 |
Ferroalloys
The purchase of ferroalloys is coordinated globally to ensure supply for each of our steel shops. International prices of ferroalloys can vary substantially within a short period of time.
Prices for the main ferroalloys consumed by Tenaris increased sharply during the first half of 2022 (reaching the highest levels since 2008). In the second half of 2022 prices suffered a sharp drop and continued decreasing steadily during most of 2023.
The main drivers for the price peak seen in the first half of 2022 were the world’s economic recovery after the COVID-19 pandemic, supporting increased steel production coupled with supply disruptions due to the Russia-Ukraine conflict (as both are significant ferroalloy producers).
During the second half of 2022 global steel production slowed, especially in Europe as several mills shut down their furnaces due to high energy costs and lower steel demand. In China, demand was also affected by the country’s restrictive COVID-19 policies. As a result, ferroalloy prices decreased on lower demand. The further decline in ferroalloys prices in 2023, was mainly related to the world’s economic instability, with high rates of inflation and deceleration in GDP growth, putting pressure over global steel prices and steel mills curtailing production due to tighter margins.
The demand for ferroalloys during 2023 was weak to the point some materials traded beneath the production costs of many producers, forcing them to curtail production mainly in Europe and India. Lower material availability and rising production costs such as electricity supported a rebound in ferroalloys’ prices from September levels to the end of the year.
Molybdenum prices, however, remained strong and rose considerably in early 2023, mainly due to supply shortages from many mining companies that are struggling with quality issues and labor shortages, the political situation in Peru, as well as stronger demand from both the oil and gas industry and the automotive sector´s continued production recovery as component shortages subside. Prices remained volatile throughout the rest of the year with demand greatly exceeding supply.
Product Quality Standards
Our steel products (tubular products, accessories, coiled tubing, sucker rods and pipe coating) are manufactured in accordance with the applicable specifications of the American Petroleum Institute (“API”), the American Society for Testing and Materials (“ASTM”), the International Standardization Organization (“ISO”), and European Standards (“EN”), among other standards. The products must also satisfy our proprietary standards as well as our customers’ requirements. We maintain an extensive quality control and assurance program to guarantee that our products and services consistently meet proprietary and industry standards bringing a high level of competitiveness.
We currently maintain, for all our manufacturing facilities and service centers, a Quality Management System (“QMS”) certified to ISO 9001 by Lloyd’s Register Quality Assurance and API product licenses granted by API, which are requirements for selling to the major oil and gas companies and have rigorous quality standards. Additionally, we have certified the QMS to API Q2 at certain locations, a certification specifically developed for companies that offer services in the oil and gas industry.
All of our mills involved in the manufacturing of material for the automotive market are certified according to the standard IATF 16949 by Lloyd’s Register Quality Assurance.
In addition, the majority of our testing laboratories are certified to ISO 17025. Our QMS, based on ISO 9001, API Q1 and API Q2 specifications, as well as IATF 16049 when applicable, guarantees that products and services comply with customer requirements from the acquisition of raw materials to the delivery of the final product and services. The QMS is designed to ensure the reliability and improvement of the product and the manufacturing operations processes as well as the associated services.
This year we updated our Quality, Health, Safety and Environment policy with the aim of reflecting excellence in all Tenaris’s processes, products, and services with an aligned vision that quality is Tenaris’s main competitive advantage.
Tenaris recently acquired Mattr’s pipe coating business including nine plants located in Canada, Mexico, Norway, Indonesia, the United Arab Emirates and the United States, several mobile concrete plants, and world-class R&D facilities in Canada and Norway, and a wide IP/product portfolio. Its ISO 9001 certified QMS is being integrated to our QMS, a process to be completed by 2025.
| |
| Annual Report 2023 |
Research and Development
R&D of new products and processes to meet the increasingly stringent requirements of our customers is an important aspect of our business.
R&D activities are carried out primarily at our global R&D network managed and coordinated through its main office in Amsterdam, the Netherlands and specialized research and testing facilities located in Campana, Argentina, in Veracruz, Mexico and in Dalmine, Italy. Additionally, we have a Technology Center in Houston, Texas, where we develop our TenarisHydril Wedge technology. Our R&D capabilities are expanded through the engagement and collaboration with some of the world’s leading industrial research institutions to solve the problems posed by the complexities of oil and gas, automotive and mechanical pipe projects with innovative applications. In addition, our global Product Engineering and Technical Sales team is made up of experienced engineers who work with our customers to identify solutions for each particular oil and gas drilling environment.
Product R&D currently being undertaken is focused on the challenging energy markets, which are lately characterized by increasingly efficient oil and gas activities together with growing energy transition related initiatives.
Product R&D includes:
- proprietary Premium Joint products OCTG including Dopeless® technology;
- proprietary steels for various applications (oil and gas drilling and transportation, hydrogen transportation and storage, carbon dioxide transportation and injection, automotive, etc.);
- heavy-wall deepwater line pipe, risers and welding technology;
- tubes and components for the automotive industry and other mechanical applications;
- large vessels for hydrogen storage and refueling stations;
- tubes for boilers;
- welded pipes for oil and gas and other applications;
- sucker rods;
- coiled tubing;
- coatings; and
- new low-carbon products and services for potentially fast-growing segments like hydrogen transportation and storage, CCS and geothermal energy.
In addition to R&D aimed at new or improved products, we continuously study opportunities to optimize our manufacturing processes. Recent projects in this area include hardware, algorithms and numerical modeling applied to rolling, heat treatment, non-destructive testing and finishing processes and the development of different process controls, with the goal of reducing energy consumption, reducing rejects, improving product quality and productivity at our facilities.
We seek to protect our innovations and developments in products and processes through patents, trade secrets, trademarks and other intellectual property tools that allow us to keep our competitiveness and differentiate ourselves from our competitors.
We spent $60.0 million in R&D in 2023, compared to $50.7 million in 2022 and $45.3 million in 2021.
Capitalized costs were not material for the years 2023, 2022 and 2021.
| |
| Annual Report 2023 |
Environmental, Social and Governance Regulation
We are subject to a wide range of local, provincial and national laws, regulations, permit requirements and decrees relating to environmental, social and governance matters, including laws and regulations relating to climate-change mitigation, use of resources, hazardous materials and radioactive materials, and air emissions, water discharges and waste management; legislation on human rights and modern slavery; human capital, including equal opportunity, gender and disabilities equality, working conditions, work-life balance, and labor market access; and applicable rules on internal control and risk management, anti-corruption, business partner relationship management and other governance issues. For more information on the Company’s governance practices and applicable regulation, see “Directors, Senior Management and Employees” and “Corporate Governance Statement – Corporate Governance”.
ESG regulation has been evolving over the past years and is expected to continue to evolve in the future, particularly with respect to environmental matters. Laws and regulations protecting the environment have become increasingly complex and more stringent and expensive to implement in recent years. Environmental requirements vary from one jurisdiction to another adding complexity to the operations of global companies, such as Tenaris.
The Paris Agreement, adopted at the 2015 United Nations Climate Conference, sets out the global framework to limit the rising temperature of the planet and to strengthen the countries’ ability to deal with the effects of climate change. In order to achieve climate neutrality by the year 2050, the European Commission has laid out several action plans, such as the EU climate adaptation strategy, sustainable finance policies and the raw materials alliance. In addition, the EU Non-Financial Reporting Directive provides the legal framework for annual disclosure of non-financial information and, the EU Taxonomy Regulation establishes a classification system for environmentally sustainable economic activities, laying out definitions to businesses, stakeholders and policymakers on which economic undertakings can be considered environmentally sustainable and requiring companies to disclose, in the annual reports, how environmentally sustainable their economic activities are. More recently, as part of the European Green Deal, the EU adopted CSRD, which requires European large companies and listed issuers to disclose information on their risks and opportunities arising from social and environmental issues, and on the impacts of their activities on people and the environment. In the case of Tenaris, the EU CSRD will apply with respect to the Company’s 2024 annual report and will replace non-financial disclosure obligations under the EU Non-Financial Reporting Directive.
Similarly, in response to an increasing investor focus and reliance on climate and ESG-related disclosure and investment, the SEC announced in March 2021 the creation of a Climate and ESG Task Force to identify ESG-related misconduct and potential violations, and in March 2022, the SEC released a proposal to amend its disclosures rules on climate change matters. In March 2024, the SEC adopted the final rule on climate-related disclosure, which will require registrants, including Tenaris from fiscal year 2025, to significantly expand the climate-related disclosures in their periodic reports, including information about climate-related risks that are reasonably likely to have a material impact on their business, results of operations, or financial condition, and certain climate-related financial statement metrics in a note to their audited financial statements.
For more information on the impact of climate change legislations, increasing regulatory requirements and significant technology and market changes, see “Key Information – Risk Factors – Risks Relating to Our Business and Industry – Climate change legislation and increasing regulatory requirements aimed at transitioning to a lower-carbon economy may reduce demand for our products and services and result in unexpected capital expenditures and costs, and negatively affect our reputation”. For more information on the steps taken by Tenaris to address climate change challenges, see “Operating and Financial Review and Prospects – Overview – Climate Change”.
The ultimate impact of complying with ESG regulations, in particular with applicable environmental regulation, is not always clearly known or determinable because certain laws and regulations have been evolving in the past years or are under constant review by competent authorities. The expenditure required to comply with these laws and regulations, including site or other remediation costs, or costs incurred from potential environmental liabilities, could have a material adverse effect on our financial condition and profitability. While we incur, and will continue to incur, expenditures to comply with applicable laws and regulations, there always remains a risk that environmental incidents or accidents may occur that may negatively affect our reputation or our operations. For more information on risks and costs related to compliance with environmental regulation and product liability, see “Key Information – Risk Factors – Risks Relating to Our Business and Industry – The cost of complying with environmental regulations and potential environmental and product liabilities may increase our operating costs and negatively impact our business, financial condition, results of operations and prospects”.
Compliance with applicable ESG regulation is of utmost importance to Tenaris and a significant factor in our industry and business. We have not been subject to any significant penalty for any material violation of applicable ESG regulations, including for any material violation of environmental laws and regulations in 2023, 2022 and 2021 and we are not aware of any current material legal or administrative proceedings pending against us with respect to ESG matters, which could have an adverse material impact on our financial condition or results of operations.
| |
| Annual Report 2023 |
Insurance
We carry property damage, general liability and certain other insurance coverage in line with industry practices. However, we do not carry business interruption insurance. Our current general liability coverage includes third party, employers, sudden and accidental seepage and pollution and product liability, up to a limit of $300 million. Our current property insurance has an indemnification cap up to $250 million for direct damage, considering all plants; and a deductible of $75 million.
Disclosure Pursuant to Section 13(r) of the Exchange Act
Tenaris
The Iran Threat Reduction and Syria Human Rights Act of 2012, added a new paragraph (r) in Section 13 of the U.S. Securities Exchange Act of 1934, as amended (the “Exchange Act”), which requires a reporting issuer to provide disclosure if the issuer or any of its affiliates knowingly engaged in certain enumerated activities relating to Iran, including activities involving the Government of Iran. The Company is providing the following disclosure pursuant to Section 13(r) of the Exchange Act.
In July 2015, the Islamic Republic of Iran entered into the Joint Comprehensive Plan of Action (“JCPOA”) with China, France, Germany, Russia, the United Kingdom and the United States, which resulted in the partial lifting in January 2016 of certain sanctions and restrictions against Iran, including most U.S. secondary sanctions against such country. On May 8, 2018, the United States announced that it would cease participation in the JCPOA and would begin re-imposing nuclear-related sanctions against Iran after a wind-down period. Following the U.S. withdrawal from the JCPOA, the European Union updated Council Regulation (EC) No. 2271/96 of 22 November 1996 (the “EU Blocking Statute”), to expand its scope to cover the re-imposed U.S. nuclear-related sanctions. The EU Blocking Statute aims to counteract the effects of the U.S. secondary sanctions.
As previously reported, Tenaris ceased all deliveries of products and services to Iran by the end of October 2018, that is, during the wind-down period and before the full reinstatement of U.S. secondary sanctions on November 5, 2018. Tenaris did not, directly or indirectly, deliver any goods or services to Iran or Iranian companies during 2023 and does not intend to explore any commercial opportunities in Iran, nor does it intend to participate in tender offers by, or issue offers to provide products or services to, Iranian companies or their subsidiaries.
As of December 31, 2023, the Company’s subsidiary, Tenaris Global Services S.A., maintains an open balance for an advance made by Toos Payvand Co. for approximately EUR0.04 million (approximately $0.04 million) for goods that remained undelivered following the reinstatement of U.S. secondary sanctions.
All revenue and profit derived from Tenaris’s sales to Iran was recorded in the fiscal year in which such sales were performed and, therefore, no revenue and profit has been reported in connection with commercial activities related to Iran for the year ended December 31, 2023.
The Company has procedures in place designed to ensure that its activities comply with all applicable U.S. and other international export control and economic sanctions laws and regulations.
Tenaris’s Affiliates
Pursuant to Section 13(r) of the Exchange Act, the Company is also required to disclose whether any of its affiliates have engaged in certain Iran-related activities and transactions. No affiliate of the Company reported any Iran related activity for the year ended December 31, 2023.
| |
| Annual Report 2023 |
We conduct all our operations through subsidiaries. The following table shows the principal subsidiaries of the Company and its direct and indirect ownership in each subsidiary as of December 31, 2023, 2022 and 2021.
|
Company |
Country of Incorporation |
Main activity |
Percentage of ownership at December 31, (*) |
||||||||
|
2023 |
2022 |
2021 |
|||||||||
|
ALGOMA TUBES INC. |
Canada |
Manufacturing of welded and seamless steel pipes |
100% |
100% |
100% |
||||||
|
BREDERO SHAW INTERNATIONAL B.V. and subsidiaries |
Netherlands |
Holding company and supplier of pipe coating services |
100% |
NA |
NA |
||||||
|
CONFAB INDUSTRIAL S.A. and subsidiaries |
Brazil |
Manufacturing of welded steel pipes |
100% |
100% |
100% |
||||||
|
DALMINE S.p.A. and subsidiaries |
Italy |
Manufacturing of seamless steel pipes |
100% |
100% |
100% |
||||||
|
EXIROS B.V. and subsidiaries (a) |
Netherlands |
Procurement and trading services |
50% |
50% |
50% |
||||||
|
HYDRIL COMPANY and subsidiaries |
USA |
Manufacture and marketing of premium connections |
100% |
100% |
100% |
||||||
|
MAVERICK TUBE CORPORATION and subsidiaries |
USA |
Manufacturing of welded and seamless steel pipes |
100% |
100% |
100% |
||||||
|
P.T. SEAMLESS PIPE INDONESIA JAYA |
Indonesia |
Manufacturing of seamless steel products |
89% |
89% |
89% |
||||||
|
S.C. SILCOTUB S.A. |
Romania |
Manufacturing of seamless steel pipes |
100% |
100% |
100% |
||||||
|
SAUDI STEEL PIPE CO. and subsidiaries (b) |
Saudi Arabia |
Manufacturing of welded steel pipes |
48% |
48% |
48% |
||||||
|
SIAT SOCIEDAD ANONIMA |
Argentina |
Manufacturing of welded steel pipes |
100% |
100% |
100% |
||||||
|
SIDERCA SOCIEDAD ANONIMA INDUSTRIAL Y COMERCIAL and subsidiaries (c) |
Argentina |
Manufacturing of seamless steel pipes |
100% |
100% |
100% |
||||||
|
TALTA - TRADING E MARKETING SOCIEDADE UNIPESSOAL LDA. |
Portugal |
Holding company |
100% |
100% |
100% |
||||||
|
TENARIS BAY CITY, INC. |
USA |
Manufacturing of welded and seamless steel pipes |
100% |
100% |
100% |
||||||
|
TENARIS CONNECTIONS BV |
Netherlands |
Development, management and licensing of intellectual property |
100% |
100% |
100% |
||||||
|
TENARIS FINANCIAL SERVICES S.A. |
Uruguay |
Financial company |
100% |
100% |
100% |
||||||
|
TENARIS GLOBAL SERVICES (CANADA) INC. |
Canada |
Marketing of steel products |
100% |
100% |
100% |
||||||
|
TENARIS GLOBAL SERVICES (U.S.A.) CORPORATION |
USA |
Marketing of steel products |
100% |
100% |
100% |
||||||
|
TENARIS GLOBAL SERVICES (UK) LTD |
United Kingdom |
Holding company and marketing of steel products |
100% |
100% |
100% |
||||||
|
TENARIS GLOBAL SERVICES S.A. and subsidiaries |
Uruguay |
Holding company, marketing and distribution of steel products |
100% |
100% |
100% |
||||||
|
TENARIS INVESTMENTS (NL) B.V. and subsidiaries |
Netherlands |
Holding company |
100% |
100% |
100% |
||||||
|
TENARIS GLOBAL SERVICES and INVESTMENTS S.àr.l. and subsidiaries |
Luxembourg |
Holding company |
100% |
100% |
100% |
||||||
|
TENARIS QINGDAO STEEL PIPES LTD. |
China |
Processing of premium joints, couplings and automotive components |
100% |
100% |
100% |
||||||
|
TENARIS TUBOCARIBE LTDA. |
Colombia |
Manufacturing of welded and seamless steel pipes |
100% |
100% |
100% |
||||||
|
TUBOS DE ACERO DE MEXICO, S.A. and subsidiaries |
Mexico |
Manufacturing of seamless steel pipes |
100% |
100% |
100% |
||||||
|
(*) All percentages rounded. |
|
Tenaris holds 40% of Tubular Technical Services Ltd. and Pipe Coaters Nigeria Ltd., 49% of Tubulars Finishing Nigeria Limited, 49% of Amaja Tubular Services Limited, 60% of Tenaris Baogang Baotou Steel Pipes Ltd. Until 2022 held 98.4% of Tenaris Supply Chain S.A. and, until 2021 held 49% of Tubular Services Angola Lda, after which years it started holding 100% of each of both companies. |
|
(a) Tenaris holds 50% of the voting rights. The Company recognizes the assets, liabilities, revenue and expenses in relation to its interest in the joint operation. |
|
(b) Saudi Steel Pipe Co. is a public company listed in the Saudi Arabian Stock Exchange (Tadāwul), Tenaris holds 47.79% and has the right to nominate the majority of the votes of the board of directors, therefore Tenaris has control over SSPC. Since May, 2023, Saudi Steel Pipe Co. holds 57.3% of Global Pipe Company, therefore Tenaris has control over GPC. |
|
(c) Until its liquidation in April 2023 Siderca held 51% of NKKTubes. |
| |
| Annual Report 2023 |
Other Investments
Ternium
We have a significant investment in Ternium, a Luxembourg company controlled by San Faustin, whose securities are listed on the NYSE. As of December 31, 2023, the Company held 11.46% of Ternium’s share capital (including treasury shares).
The Company is a party to a shareholders’ agreement with Techint Holdings S.àr.l. (“Techint Holdings”), a wholly owned subsidiary of San Faustin and Ternium’s main shareholder, dated January 9, 2006, pursuant to which Techint Holdings is required to take actions within its power to cause one of the members of Ternium’s board of directors to be nominated by the Company and any directors nominated by the Company to be removed only pursuant to previous written instructions from the Company. The Company and Techint Holdings also agreed to cause any vacancies on Ternium’s board of directors to be filled with new directors nominated by either the Company or Techint Holdings, as applicable. The shareholders’ agreement will remain in effect so long as each of the parties holds at least 5% of the shares of Ternium or until it is terminated by either the Company or Techint Holdings pursuant to its terms. Carlos Condorelli was nominated by the Company as a director of Ternium pursuant to this shareholders’ agreement.
The following factors and circumstances evidence that Tenaris has significant influence over Ternium:
- both the Company and Ternium are under the indirect common control of San Faustin;
- four out of eight members of Ternium’s board of directors (including Ternium’s Chairman) are also members of the Company’s board of directors;
- the Company is entitled to nominate one director to Ternium’s board of directors pursuant to the shareholders’ agreement between the Company and Techint Holdings described above.
Usiminas
At December 31, 2023, Tenaris held, through its Brazilian subsidiary, Confab, 47.5 million ordinary shares and 1.3 million preferred shares of Usiminas, representing 6.76% of its shares with voting rights, 3.96% of its total share capital, and 9.8% of Usiminas’ control group.
Confab’s participation in Usiminas share capital is the result of a series of acquisitions, the first of which was completed on January 16, 2012, pursuant to which Ternium (through its subsidiaries Ternium Investments and Ternium Argentina) and Confab acquired a large block of Usiminas ordinary shares and joined Usiminas’ existing control group. Subsequently, in 2016, Ternium and Confab subscribed to additional ordinary shares and to preferred shares.
More recently, on March 30, 2023, Confab, together with Ternium (through its subsidiaries Ternium Investments and Ternium Argentina), acquired an additional 68.7 million ordinary shares of Usiminas, at a price of BRL10 per ordinary share. The transaction closed on July 3, 2023, and was financed with cash on hand. Tenaris paid approximately BRL110 million (approximately $22.7 million) in cash, for 11 million ordinary shares, increasing its participation in the Usiminas control group to 9.8%.
The Usiminas control group comprises the T/T Group that is formed by Ternium Investments, Ternium Argentina and Confab; the NSC Group, comprising NSC, Mitsubishi and MetalOne; and Usiminas’ employee pension fund, Previdência Usiminas.
At December 31, 2023, the Usiminas control group held, in the aggregate, 483.6 million ordinary shares, representing approximately 68.6% of Usiminas’ voting capital and the T/T Group held an aggregate participation of 61.3% in the control group (with 51.5% of the Usiminas’ control group’s participation corresponding to Ternium’s subsidiaries, and the remaining 9.8% corresponding to Confab); the NSC Group and Previdência Usiminas held 31.7% and 7%, respectively, in Usiminas’ control group.
Upon closing of the July 3, 2023 acquisition, the then existing Usiminas shareholders agreement governing the relationship between the T/T Group, the NSC Group and Previdência Usiminas was replaced by a new shareholders agreement setting forth a new governance structure for Usiminas. The T/T Group is now entitled to nominate a majority of the Usiminas board of directors, the chief executive officer and four other members of Usiminas’ board of officers. Of the positions allocated to the T/T Group, Tenaris retains the right to nominate one member of Usiminas’ board of directors and one member of Usiminas’ board of officers. Ordinary decisions may be approved with a 55% majority of Usiminas’ control group shares.
| |
| Annual Report 2023 |
At any time after the second anniversary of the closing of the transaction, the T/T Group will have the right to buy the NSC Group’s remaining interest in Usiminas’ control group (153.1 million ordinary shares) at the higher of BRL10 per share and the 40-trading day average price per share immediately prior to the date of exercising the option. In addition, the NSC Group has the right, at any time after the closing of the transaction, to withdraw its remaining shares from Usiminas’ control group and sell them in the open market after giving the T/T Group the opportunity to buy them at the 40-trading day average price per share, as well as the right, at any time after the second anniversary of the closing, to sell such shares to the T/T Group at BRL10 per share. Confab will have the right (but not the obligation) to participate in each such transaction pro rata to its current participation in the T/T Group.
Confab and the Ternium entities party to the Usiminas shareholders agreement have a separate shareholders agreement governing their respective rights and obligations as members of the T/T Group. Under such separate agreement, Confab enjoys certain rights with respect to the governance of Usiminas, including, among others, the ability to nominate certain of Usiminas’ officers and directors. These facts evidence that Tenaris continues to have significant influence over Usiminas and, as a result, continues accounting for its investment under the equity method.
Techgen
Techgen is a Mexican joint venture company owned 48% by Ternium, 30% by Tecpetrol and 22% by Tenaris. Techgen operates a natural gas-fired combined cycle electric power plant in the Pesquería area of the State of Nuevo León, Mexico. Tenaris, Ternium and Tecpetrol are parties to a shareholders’ agreement relating to the governance of Techgen.
In the last few years, the Mexican government made various attempts to modify rules and regulations governing the energy market in Mexico with potential impact on the energy supply and its cost. For more information on the risks associated with the energy reform in Mexico, see “Key Information – Risk Factors – Risks Relating to Our Business and Industry – Adverse economic or political conditions in the countries where we operate or sell our products and services may decrease our sales or disrupt our manufacturing operations, thereby adversely affecting our revenues, profitability and financial condition”.
| |
| Annual Report 2023 |
Operating and Financial Review and Prospects
The following discussion and analysis of our financial condition and results of operations are based on, and should be read in conjunction with, our audited consolidated financial statements and the related notes included elsewhere in this annual report. This discussion and analysis present our financial condition and results of operations on a consolidated basis. We prepare our consolidated financial statements in conformity with IFRS. IFRS differ in certain significant respects from U.S. GAAP.
Certain information contained in this discussion and analysis and presented elsewhere in this annual report, including information with respect to our plans and strategy for our business, includes forward-looking statements that involve risks and uncertainties. See “Cautionary Statement Concerning Forward-Looking Statements”. In evaluating this discussion and analysis, you should specifically consider the various risk factors identified in “Key Information – Risk Factors”, other risk factors identified elsewhere in this annual report and other factors that could cause results to differ materially from those expressed in such forward-looking statements.
Our main source of revenue is the sale of products and services to the oil and gas industry, and the level of such sales is sensitive to international oil and gas prices and their impact on drilling activities
Demand for our products and services from the global oil and gas industry, particularly for tubular products and services used in drilling operations, represents a substantial majority of our total Tubes sales. Our sales, therefore, depend on the condition of the oil and gas industry and our customers’ willingness to invest capital in oil and gas exploration and production as well as in associated downstream processing activities. The level of these expenditures is sensitive to oil and gas prices as well as the oil and gas industry’s view of such prices in the future.
Our business is highly competitive
The global market for steel pipes is highly competitive, with the primary competitive factors being price, quality, service and technology. We sell our products in a large number of countries worldwide and compete primarily against European and Japanese producers in most markets outside North America. In the United States and Canada, we compete against a wide range of local and foreign producers. Over the past two decades, substantial investments have been made, especially in China but also in other regions around the world, to increase production capacity of seamless steel pipe products.
Our production costs are sensitive to prices of steelmaking raw materials and other steel products
We purchase substantial quantities of steelmaking raw materials, including ferrous steel scrap, DRI, pig iron, iron ore and ferroalloys, for use in the production of our seamless pipe products. In addition, we purchase substantial quantities of steel coils and plates for use in the production of our welded pipe products. Our production costs, therefore, are sensitive to prices of steelmaking raw materials and certain steel products, which reflect supply and demand factors in the global steel industry and in the countries where we have our manufacturing facilities.
Summary of results
In 2023, our net sales, EBITDA 1 and net income reached record levels. The year was characterized by a first half, in which prices in the Americas reached exceptional levels and we had a high level of pipeline shipments in Argentina, and a second half, in which prices in the Americas started to return to more normal levels while overall sales were supported by good activity and pricing levels in the Middle East and for offshore pipelines.
Operating margins expanded reflecting the higher prices realized on the sales of most of our products, which more than compensated for higher costs of goods sold.
Net income benefited from a net positive deferred tax effect of $194 million as well as positive financial results of $221 million.
Operating cash flow for the year amounted to $4,395 million (including a $182 million reduction in working capital). After capital expenditures of $619 million, business acquisitions of $266 million, dividend payments of $637 million and $214 million spent on share buybacks, our net cash position 2 increased to a record level of $3.4 billion at the end of the year.
| 1 EBITDA is a non-IFRS alternative performance measure—please see Exhibit 15.2 for more information on this measure. | |
| 2 Net cash position is a non-IFRS alternative performance measure—please see Exhibit 15.2 for more information on this measure. | |
| |
| Annual Report 2023 |
Climate change
Tenaris recognizes the profound challenges posed by climate change, both to society at large and to our business specifically, considering the markets in which we engage, how government regulations may influence our operations and those of our customers, and the geographical location of our physical assets (see “Key Information – Risk Factors – Risks Relating to Our Business and Industry”). At the same time, climate change presents strategic opportunities for us not only to strengthen our market leadership but also to explore new sales avenues.
Given the relevance of climate change for the Company’s overall business and strategy, our board of directors quarterly reviews the progress of our climate change strategy and other relevant factors.
As part of our efforts to combat climate change, we are investing in and refining our operations to reduce their carbon intensity. We are also developing products and services tailored for use in low-carbon energy applications.
We regularly assess and track global progress towards the energy transition, keeping an eye on policies, regulations, technologies and other global and national developments that could speed up or hinder the progress of this transition in the years to come, as well as other factors that could affect or pose particular risks to our operations.
We recently conducted a climate risk assessment to better understand our most relevant industrial facilitiesʼ long-term vulnerability to climate effects and physical climate risk, using the Intergovernmental Panel on Climate Change (“IPCC”) high-emissions Representative Concentration Pathway (“RCP”) 8.5 global warming scenario which showed no undue exposure for which Tenaris is unprepared.
We work closely with our customers to support their efforts to establish sustainable sourcing policies across their supply chain, thus requiring a more detailed disclosure of climate change related impacts. We thus continue to report to the Carbon Disclosure Project (“CDP”) and are using the Ecovadis and Open-es sustainability assessment platforms, among others.
Our Sustainable Purchasing Policy is a framework supporting further action towards a more sustainable supply chain, allowing us to encourage our suppliers to work in the same direction.
EAF producer
All the steel we manufacture is produced in electric arc furnaces using recycled steel scrap as the primary source of metallic feedstock. We supplement the use of steel scrap with metallics such as pig iron, DRI and ferroalloys, to meet quality, productivity and materials specifications. In Argentina, where steel scrap availability is limited, we operate a facility to produce DRI using natural gas.
Steel produced in electric arc furnaces using a high proportion of scrap in the metallic charge generally has a much lower carbon intensity than steel made using iron ore and metallurgical coal as primary feedstock.
We also purchase steel from third-party suppliers, primarily to manufacture welded pipe products. As many of these suppliers make steel products using iron ore and coal, the carbon emissions intensity of the pipes made with this steel is often far greater than that of those manufactured with our own steel.
| |
| Annual Report 2023 |
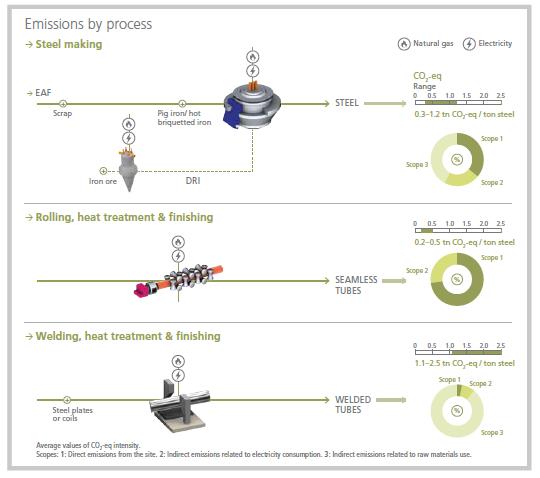
Reducing the carbon intensity of our operations
In February 2021, we set a medium-term target to reduce the carbon emissions intensity of our operations by 30% by the year 2030, compared to a 2018 baseline, considering Scopes 1, 2 and 3 emissions for purchased raw materials. Within Scope 3 emissions, the target considers emissions related to raw materials and steel purchased from third parties, by far the most relevant source of our Scope 3 emissions. The GHGs included are CO2, CH4 and N2O.
This medium-term target is a first step towards the broader objective of decarbonizing our operations and reaching net zero carbon emissions. How long it will take to achieve this goal depends on the development of emerging technologies as well as market and regulatory conditions, including carbon pricing and customer support. We are allocating substantial resources to our decarbonization strategy and will continue to do so as this will strengthen our competitive positioning.
We plan to reach our medium-term target mainly by:
- increasing the use of recycled steel scrap (and reducing that of pig iron) in our raw material mix, without compromising the quality of our products;
- implementing energy efficiency measures, particularly as regards modernizing and revamping equipment and furnaces; and
- introducing and deploying renewable energy in our industrial system where the conditions for doing so are competitive.
We also work closely with our value chain to identify opportunities for reducing carbon emissions. For instance, we are looking into shortening the supply chain through our Rig Direct® service by synchronizing production schedules and logistics for customer drilling operations. We are also studying alternative steelmaking materials, such as biomass or residues to replace coal, or biogas to replace fossil fuels.
| |
| Annual Report 2023 |
Our new Sustainability Sourcing Policy will help us to gain a better understanding of our suppliers’ real emissions levels in order to identify further opportunities for improvement.
Much of the reduction in emissions intensity that we have made to date has been achieved by increasing the use of recycled scrap and reducing pig iron in our metallic mix, thus reducing our Scope 3 emissions. Over the past two years, however, Scope 3 emissions intensity has risen due to a rise in the proportion of welded steel pipe (using steel purchased from third parties) in our production mix in order to meet the strong demand for pipeline projects in Latin America and the Middle East. This increase in Scope 3 emissions related to purchased steel has offset the reductions achieved in Scope 1 and Scope 2 emissions over the same period due to greater energy efficiency and the use of renewables, as well as by further reducing the use of pig iron in our metallic mix.
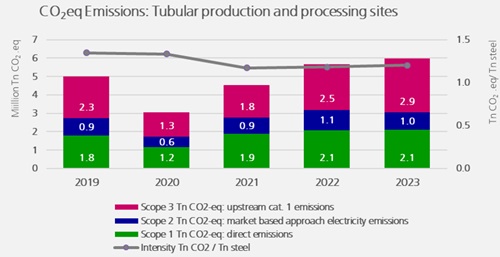
|
CO2-eq emissions intensity (CO2-eq ton / ton steel cast or processed) | |||||
|
|
|||||
|
|
2019 |
2020 |
2021 |
2022 |
2023 |
|
Scope 1 |
0.47 |
0.48 |
0.48 |
0.43 |
0.40 |
|
Scope 2 |
0.26 |
0.26 |
0.23 |
0.23 |
0.19 |
|
Scope 3 |
0.62 |
0.60 |
0.46 |
0.52 |
0.59 |
|
Total |
1.35 |
1.33 |
1.17 |
1.18 |
1.18 |
|
|
|
|
|
|
|
|
Intensity variation vs. 2018 |
(6%) |
(6%) |
(18%) |
(17%) |
(17%) |
Over the past two years, we have substantially increased capital investment in projects aimed at contributing to our decarbonization program and similar environmental goals. These investments amounted to 29% and 31% of our total capital investments in 2022 and 2023, respectively. We expect to maintain similar investment levels for related projects over the next few years.
Many of these investments are being made in developing renewable energy capacity for our operations. Following an investment of approximately $200 million, in October 2023 we began operating our wind farm in Argentina, with an installed capacity of 103.2 MW of power through the interconnected grid supplying nearly 50% of the electricity used by our industrial facilities in Campana. This will reduce our CO2 emissions at Siderca by 152,000 tons per year, compared to 2018.
| |
| Annual Report 2023 |
In November 2023, the Company’s board of directors approved a $214 million investment for a second wind farm in Argentina after winning priority connection rights to the interconnected grid. This investment is expected to be in 2025. Its output would meet another 30% of current energy needs at our Campana facilities, and reduce our CO2 emissions by another 102,500 tons per year vs 2018 baseline. Both investments take into account the exceptional wind conditions in Argentina. Other investments in renewable energy include rooftop solar panel projects in China, Romania and Italy, while in Colombia, Romania and Mexico, we are buying power from certified renewable sources. We continue to explore other options for renewables.
During 2023, 12% of the electricity we consumed was produced from renewables, taking into account own generation and certified third-party purchases.
In 2023, the proportion of recycled scrap used as raw material in our steelmaking operations came to 79%, up from 68% in 2018. The proportion of recycled scrap we can use at each facility depends on local availability, scrap quality and the steel quality requirements of our products. Our operation in Argentina has been particularly affected by the limited availability of local scrap.
We have increased our steel’s recycling content by reducing the amount of pig iron in the metallic mix. At our Tamsa steel shop in Mexico, experts are working with data science models to design the optimum charge to maximize scrap use while complying with steel quality standards and meeting other performance criteria.
We are also investing in projects to improve our scrap market sourcing ability, as well as scrap-handling and storage capabilities.
As a company dedicated to industrial excellence, prioritizing energy efficiency has long been central to our continuous improvement efforts as well as to our investment initiatives. Our aim is to modernize production lines and equipment.
Ongoing projects include:
- revamping a heat treatment furnace at our Dalmine mill in Italy, with hydrogen-ready burners using hydrogen, natural gas or blends thereof; and
- replacing one of our steel furnaces at our Siderca mill in Argentina with energy- efficient Consteel® technology. This enables the continuous charging of raw materials which are preheated with fumes produced during the melting process, and reduces electricity, natural gas and electrodes consumption compared to traditional batch-charging technologies.
As we pursue our strategy of decarbonizing our operations, we are exploring various options with different partners around the world. We know that there is no single solution, as certain alternatives are better suited to specific sites or regions based on local infrastructure and resources.
Additionally, we have the support of our parent organization, the Techint Group, owner of Tenova, which develops sustainable technologies for the metals industries, and Techenergy Ventures, a venture capital company specialized in energy transition technology.
Internal carbon price and financial considerations
To speed up the achievement of our decarbonization targets and prepare for the potential adoption of additional carbon pricing mechanisms around the world in 2021, we introduced an internal carbon price of a minimum of $80/ton. This internal carbon price is primarily used to evaluate investments in projects that could help to decarbonize our operations.
We continuously track the strategies of our major customers and their projections for future energy demand. This includes aligning with global goals to address climate change by reducing carbon emissions in accordance with the Paris Agreement, as well as supporting national objectives for a carbon-neutral world.
We also assess the future market outlook for our products, taking into account different oil and gas demand scenarios as published by our customers, international agencies like the International Energy Agency (“IEA”), and energy market consultancies, such as Rystad Energy (“Rystad”).
We pay particular attention to historical records and the potential pace of change in the adoption of new technologies, regulations and behaviors which could affect future oil and gas demand. We use these scenarios and assessments as essential input to shape and assess our business strategy, and how we address the risks and opportunities arising from climate change.
The transition from current reliance on fossil fuels, including oil and gas, to cleaner alternatives is uncertain, with a wide range of potential outcomes. This transition is further complicated by the simultaneous expectation of an overall increase in energy demand.
Tenaris takes these risks into consideration when evaluating its investments in major projects and the acquisition of equipment to produce steel pipes, factoring them into the accounting estimates and assumptions used to assess the carrying value of its assets.
| |
| Annual Report 2023 |
Products for the energy transition
As suppliers of tubular products and services to the energy industry, the energy transition provides us with an opportunity to develop new products and services for potentially fast-growing segments such as hydrogen transportation and storage, CCS, and geothermal installations. Over the past three years, we have increased our investments in R&D and sharpened our organizational focus in these areas, as they are expected to contribute a highly relevant revenue stream to the company in the future.
We have developed a range of materials technologies and products that have been tested for use in hydrogen storage and transportation, CCS injection wells, and geothermal applications. Regarding hydrogen storage and transportation, we are seeing growth in demand for large, high- pressure vessels used in the build out of hydrogen refueling stations for heavy-duty vehicles and buses. Initially in Europe and California, these stations are now becoming more common. We have also observed increasing customer interest in developing geothermal, waste-to-energy and CCS projects.
Outlook
In an environment where oil prices remain relatively stable, oil supply and demand are balanced, and the long term outlook for natural gas, especially LNG, is promising, drilling activity in North America is stabilizing, while continuing to increase in the Middle East and offshore. In this context, and considering our expanded perimeter, with our recent acquisition of the Shawcor pipe coating business, we expect that, in the first half of 2024, our sales will be in line with those of the second half of 2023.
After the exceptional levels they reached in the post-Covid recovery, tubular price levels and margins in the Americas have returned to sustainable levels and should stabilize in the coming months. Prices and margins in the rest of the world should remain at good levels supported by strong demand for offshore operations and pipeline projects.
In Latin America, fundamental conditions remain favorable for the continued expansion of drilling activity and tubular demand, but the high level of political and economic volatility may affect these prospects.
Operating Results
The following discussion and analysis of our financial condition and results of operations is based on our audited consolidated financial statements included elsewhere in this annual report. Accordingly, this discussion and analysis present our financial condition and results of operations on a consolidated basis. See “Presentation of Certain Financial and Other Information - Accounting Principles” and “II. Accounting Policies A. Basis of presentation” and “B. Group accounting” to our audited consolidated financial statements included in this annual report. The following discussion should be read in conjunction with our audited consolidated financial statements and the related notes included in this annual report.
| |
| Annual Report 2023 |
|
Thousands of U.S. dollars (except number of shares and per share amounts) |
For the year ended December 31, | ||
|
2023 |
2022 |
2021 | |
|
Selected consolidated income statement data |
|
|
|
|
|
|
|
|
|
Net sales |
14,868,860 |
11,762,526 |
6,521,207 |
|
Cost of sales |
(8,668,915) |
(7,087,739) |
(4,611,602) |
|
Gross profit |
6,199,945 |
4,674,787 |
1,909,605 |
|
Selling, general and administrative expenses |
(1,919,307) |
(1,634,575) |
(1,206,569) |
|
Impairment charge (1) |
- |
(76,725) |
(57,075) |
|
Other operating income (expenses), net |
35,770 |
(212) |
61,548 |
|
Operating income |
4,316,408 |
2,963,275 |
707,509 |
|
Finance income |
213,474 |
80,020 |
38,048 |
|
Finance cost |
(106,862) |
(45,940) |
(23,677) |
|
Other financial results |
114,365 |
(40,120) |
8,295 |
|
Income before equity in earnings of non-consolidated companies and income tax |
4,537,385 |
2,957,235 |
730,175 |
|
Equity in earnings of non-consolidated companies |
95,404 |
208,702 |
512,591 |
|
Income before income tax |
4,632,789 |
3,165,937 |
1,242,766 |
|
Income tax |
(674,956) |
(617,236) |
(189,448) |
|
Income for the year |
3,957,833 |
2,548,701 |
1,053,318 |
|
|
|
|
|
|
Income attributable to (2): |
|
|
|
|
Shareholders' equity |
3,918,065 |
2,553,280 |
1,100,191 |
|
Non-controlling interests |
39,768 |
(4,579) |
(46,873) |
|
Income for the year (2) |
3,957,833 |
2,548,701 |
1,053,318 |
|
|
|
|
|
|
Depreciation and amortization |
(548,510) |
(607,723) |
(594,721) |
|
Weighted average number of shares (3) |
1,178,737,751 |
1,180,536,830 |
1,180,536,830 |
|
Basic and diluted earnings per share |
3.32 |
2.16 |
0.93 |
|
Dividends per share (4) |
0.54 |
0.45 |
0.27 |
| (1) | Impairment charge in 2022 represents a charge of $77 million to the carrying value of certain idle assets and in 2021 represents a charge of $57 million to the carrying value of fixed assets of the CGU NKK. |
| (2) | IAS 1 (revised), requires that income for the year as shown on the income statement does not exclude non-controlling interests. Earnings per share, however, continue to be calculated on the basis of income attributable solely to Shareholders’ equity. |
| (3) | Weighted average number of shares does not include treasury shares. |
| (4) | Dividends per share correspond to the dividends paid in respect of the year. |
| |
| Annual Report 2023 |
|
Thousands of U.S. dollars (except number of shares) |
At December 31, | ||
|
2023 |
2022 |
2021 | |
|
|
|
|
|
|
Selected consolidated financial position data |
|
|
|
|
|
|
|
|
|
Current assets |
10,504,459 |
8,468,596 |
4,981,173 |
|
Property, plant and equipment, net |
6,078,179 |
5,556,263 |
5,824,801 |
|
Other non-current assets |
4,499,257 |
3,525,387 |
3,643,457 |
|
Total assets |
21,081,895 |
17,550,246 |
14,449,431 |
|
|
|
|
|
|
Current liabilities |
2,901,975 |
2,788,423 |
1,559,645 |
|
Non-current borrowings |
48,304 |
46,433 |
111,432 |
|
Deferred tax liabilities |
631,605 |
269,069 |
274,721 |
|
Other non-current liabilities |
469,574 |
411,884 |
397,931 |
|
Total liabilities |
4,051,458 |
3,515,809 |
2,343,729 |
|
|
|
|
|
|
Shareholders' equity |
16,842,972 |
13,905,709 |
11,960,578 |
|
Non-controlling interests |
187,465 |
128,728 |
145,124 |
|
Total equity |
17,030,437 |
14,034,437 |
12,105,702 |
|
|
|
|
|
|
Total liabilities and equity |
21,081,895 |
17,550,246 |
14,449,431 |
|
|
|
|
|
|
Share capital |
1,180,537 |
1,180,537 |
1,180,537 |
|
Number of issued shares (1) |
1,180,536,830 |
1,180,536,830 |
1,180,536,830 |
| (1) | Number of issued shares includes treasury shares. |
The following table sets forth our operating and other costs and expenses as a percentage of net sales for the periods indicated.
|
Percentage of net sales |
For the year ended December 31, | ||
|
|
2023 |
2022 |
2021 |
|
|
|
|
|
|
Net sales |
100.0 |
100.0 |
100.0 |
|
Cost of sales |
(58.3) |
(60.3) |
(70.7) |
|
Gross profit |
41.7 |
39.7 |
29.3 |
|
Selling, general and administrative expenses |
(12.9) |
(13.9) |
(18.5) |
|
Impairment charge |
- |
(0.7) |
(0.9) |
|
Other operating income (expenses), net |
0.2 |
(0.0) |
0.9 |
|
Operating income |
29.0 |
25.2 |
10.8 |
|
Finance income |
1.4 |
0.7 |
0.6 |
|
Finance cost |
(0.7) |
(0.4) |
(0.4) |
|
Other financial results |
0.8 |
(0.3) |
0.1 |
|
Income before equity in earnings of non-consolidated companies and income tax |
30.5 |
25.1 |
11.2 |
|
Equity in earnings of non-consolidated companies |
0.6 |
1.8 |
7.9 |
|
Income before income tax |
31.2 |
26.9 |
19.1 |
|
Income tax |
(4.5) |
(5.2) |
(2.9) |
|
Income for the year |
26.6 |
21.7 |
16.2 |
|
|
|
|
|
|
Income attributable to: |
|
|
|
|
Shareholders' equity |
26.4 |
21.7 |
16.9 |
|
Non-controlling interests |
0.3 |
(0.0) |
(0.7) |
| |
| Annual Report 2023 |
Fiscal Year Ended December 31, 2023, Compared to Fiscal Year Ended December 31, 2022
The following table shows our net sales by business segment for the periods indicated below:
|
Millions of U.S. dollars |
For the year ended December 31, |
Increase / (Decrease) | |||
|
|
2023 |
2022 | |||
|
Tubes |
14,185 |
95% |
11,133 |
95% |
27% |
|
Others |
684 |
5% |
630 |
5% |
9% |
|
Total |
14,869 |
100% |
11,763 |
100% |
26% |
Tubes
The following table indicates, for our Tubes business segment, sales volumes of seamless and welded pipes for the periods indicated below:
|
Thousands of tons |
For the year ended December 31, |
Increase / (Decrease) | |
|
|
2023 |
2022 | |
|
Seamless |
3,189 |
3,146 |
1% |
|
Welded |
953 |
387 |
146% |
|
Total |
4,141 |
3,533 |
17% |
The following table indicates, for our Tubes business segment, net sales by geographic region, operating income and operating income as a percentage of net sales for the periods indicated below:
|
Millions of U.S. dollars |
For the year ended December 31, |
Increase / (Decrease) | |
|
|
2023 |
2022 |
|
|
Net sales |
|
|
|
|
- North America |
7,572 |
6,796 |
11% |
|
- South America |
3,067 |
2,213 |
39% |
|
- Europe |
1,055 |
867 |
22% |
|
- Asia Pacific, Middle East & Africa |
2,491 |
1,257 |
98% |
|
Total net sales |
14,185 |
11,133 |
27% |
|
Operating income |
4,183 |
2,867 |
46% |
|
Operating income (% of sales) |
29.5% |
25.8% |
|
Net sales of tubular products and services increased 27% to $14,185 million in 2023, compared to $11,133 million in 2022, reflecting a 17% increase in volumes and a 9% increase in average selling prices. Volumes increased mainly in the AMEA region following an increase in activity and in South America mainly due to the delivery of welded line pipe for a gas pipeline in Argentina. Prices were higher in all regions.
Operating results from tubular products and services, amounted to a gain of $4,183 million in 2023, compared to a gain of $2,867 million in 2022 (which was net of a $63 million impairment charge). The improvement in operating results was driven by the recovery in shipment volumes and in prices which helped to compensate for an increase in costs.
| |
| Annual Report 2023 |
Others
The following table indicates, for our Others business segment, net sales, operating income and operating income as a percentage of net sales for the periods indicated below:
|
Millions of U.S. dollars |
For the year ended December 31, |
Increase / (Decrease) | |
|
|
2023 |
2022 | |
|
Net sales |
684 |
630 |
9% |
|
Operating income |
133 |
96 |
39% |
|
Operating income (% of sales) |
19.5% |
15.2% |
|
Net sales of other products and services increased 9% from $630 million in 2022 to $684 million in 2023, which includes $77 million from the pipe coating business unit acquired from Mattr on November 30, 2023. Additionally, in 2023 we had higher sales from our oilfield services business in Argentina, sucker rods and coiled tubing services, which offset the decline in sales of excess raw materials and energy and pipes for plumbing applications in Italy.
Operating results from other products and services amounted to a gain of $133 million in 2023, compared to $96 million in 2022. Results were mainly derived from our sucker rods business and our oilfield services business in Argentina.
Selling, general and administrative expenses, or SG&A, amounted to $1,919 million (12.9% of net sales) in 2023, compared to $1,635 million (13.9%) in 2022. The 2023 increase in SG&A is mainly due to higher labor costs and logistic costs (freights and taxes), although they decreased as a percentage of sales.
Financial results amounted to a gain of $221 million in 2023, compared to a loss of $6 million in 2022. 2023 results are mainly derived from net foreign exchange gains of $209 million, mainly related to the positive effect of the devaluation of the ARS over a net short exposure in that currency. These positive FX results were partially offset by a $95 million loss from the change in the fair value of U.S. dollar-denominated Argentine bonds when distributed and disposed abroad. Additionally, our net cash position 3 yielded a net interest gain of $107 million in the year.
Equity in earnings of non-consolidated companies generated a gain of $95 million in 2023, compared to $209 million in 2022. These results were mainly derived from our equity investment in Ternium (NYSE:TX). The result of 2023 includes a non-cash loss of $144 million from our investment in Usiminas ($26 million from our direct investment in Usiminas and $118 million from our indirect investment in Usiminas through Ternium), related to the fair value measurement of the shares and the result of recycling Ternium´s negative accumulated currency translation reserve to the income statement. In 2022, equity in earnings of non-consolidated companies included a $34 million impairment charges on our participations in the joint venture with Severstal ($15 million) and in Usiminas ($19 million).
Income tax charge amounted to $675 million in 2023, compared to $617 million in 2022, reflecting the improvement in results in several subsidiaries and a net positive deferred tax effect of $194 million.
Fiscal Year Ended December 31, 2022, Compared to Fiscal Year Ended December 31, 2021
The following table shows our net sales by business segment for the periods indicated below:
|
Millions of U.S. dollars |
For the year ended December 31, |
Increase / (Decrease) | |||
|
|
2022 |
2021 | |||
|
Tubes |
11,133 |
95% |
5,994 |
92% |
86% |
|
Others |
630 |
5% |
528 |
8% |
19% |
|
Total |
11,763 |
100% |
6,521 |
100% |
80% |
| 3 Net cash position is a non-IFRS alternative performance measure—please see Exhibit 15.2 for more information on this measure. | |
| |
| Annual Report 2023 |
Tubes
The following table indicates, for our Tubes business segment, sales volumes of seamless and welded pipes for the periods indicated below:
|
Thousands of tons |
For the year ended December 31, |
Increase / (Decrease) | |
|
|
2022 |
2021 | |
|
Seamless |
3,146 |
2,514 |
25% |
|
Welded |
387 |
289 |
34% |
|
Total |
3,533 |
2,803 |
26% |
The following table indicates, for our Tubes business segment, net sales by geographic region, operating income and operating income as a percentage of net sales for the periods indicated below:
|
Millions of U.S. dollars |
For the year ended December 31, |
Increase / (Decrease) | |
|
|
2022 |
2021 | |
|
Net sales |
|
|
|
|
- North America |
6,796 |
3,240 |
110% |
|
- South America |
2,213 |
1,051 |
111% |
|
- Europe |
867 |
622 |
39% |
|
- Asia Pacific, Middle East & Africa |
1,257 |
1,081 |
16% |
|
Total net sales |
11,133 |
5,994 |
86% |
|
Operating income |
2,867 |
613 |
368% |
|
Operating income (% of sales) |
25.8% |
10.2% |
|
Net sales of tubular products and services increased 86% to $11,133 million in 2022, compared to $5,994 million in 2021, reflecting a 26% increase in volumes and a 47% increase in average selling prices. Sales increased in all regions, mainly in North America where there was a recovery in volumes and prices throughout the region, led by the U.S. onshore market and in South America mainly due to higher OCTG sales in the region and deliveries for a gas pipeline in Argentina.
Operating results from tubular products and services, amounted to a gain of $2,867 million in 2022, compared to a gain of $613 million in 2021. Tubes operating income in 2022 is net of a $63 million impairment charge, while in 2021 it includes an impairment charge of $57 million. The improvement in operating results was driven by the recovery in shipment volumes and in prices and higher level of utilization of production capacity, which more than offset an increase in energy and raw material costs.
Others
The following table indicates, for our Others business segment, net sales, operating income and operating income as a percentage of net sales for the periods indicated below:
|
Millions of U.S. dollars |
For the year ended December 31, |
Increase / (Decrease) | |
|
|
2022 |
2021 | |
|
Net sales |
630 |
528 |
19% |
|
Operating income |
96 |
95 |
1% |
|
Operating income (% of sales) |
15.2% |
17.9% |
|
Net sales of other products and services increased 19% from $528 million in 2021 to $630 million in 2022, mainly due to higher sales of sucker rods, of our oilfield services business in Argentina which offers hydraulic fracturing and coiled tubing services and excess raw materials, partially offset by lower sales from the discontinued industrial equipment business in Brazil.
Operating results from other products and services, amounted to a gain of $96 million in 2022, similar to the $95 million gained in 2021. Results were mainly derived from our sucker rods business and our oilfield services business in Argentina, partially offset by a $20 million loss related to our discontinued industrial equipment business in Brazil. The operating income for other products and services in 2022 includes a $14 million impairment charge.
| |
| Annual Report 2023 |
Selling, general and administrative expenses, or SG&A, amounted to $1,635 million (13.9% of net sales) in 2022, compared to $1,207 million (18.5%) in 2021. The 2022 increase in SG&A is mainly due to higher logistic costs, while they decrease as a percentage of sales.
Impairment charge. In 2022, we recorded a $77 million impairment: $63 million in our Tubes segment and $14 million in our Others segment, while in 2021 we recorded a $57 million impairment in our Tubes segment, as a result of the termination of the NKKTubes joint venture.
Other operating results amounted to zero in 2022, compared to a gain of $62 million in 2021. Results in 2022 include a $78 million charge from the settlement with the U.S. SEC, a $71 million non-cash gain from the reclassification to the income statement of NKKTubes’s cumulative foreign exchange adjustments belonging to the shareholders due to the cease of its operations and an $18 million gain from the sale of land in Canada after the relocation of the Prudential facility. The gain in 2021 was mainly due to a $36 million recognition of fiscal credits in Brazil and the profit from the sale of assets.
Financial results amounted to a loss of $6 million in 2022, compared to a gain of $23 million in 2021. 2022 financial loss includes a loss of $10 million related to the change in fair value of certain financial instruments obtained in an operation of settlement of trade receivables and a $30 million loss related to the transfer of Argentine sovereign bonds paid as dividend from an Argentine subsidiary to its shareholders.
Equity in earnings of non-consolidated companies generated a gain of $209 million in 2022, compared to $513 million in 2021. These results were mainly derived from our equity investment in Ternium (NYSE:TX). In 2022, equity in earnings of non-consolidated companies included a $34 million impairment charges on our participations in the joint venture with Severstal ($15 million) and in Usiminas ($19 million).
Income tax charge amounted to $617 million in 2022, compared to $189 million in 2021, reflecting the improvement in results in several subsidiaries.
Liquidity and Capital Resources
The following table provides certain information related to our cash generation and changes in our cash and cash equivalents position for each of the last three years:
|
Millions of U.S. dollars |
For the year ended December 31, | ||
|
|
2023 |
2022 |
2021 |
|
|
|
|
|
|
Net cash provided by operating activities |
4,395 |
1,167 |
119 |
|
Net cash (used in) provided by investing activities |
(2,687) |
(164) |
268 |
|
Net cash used in financing activities |
(1,125) |
(178) |
(648) |
|
Increase (decrease) in cash and cash equivalents |
584 |
825 |
(261) |
|
|
|
|
|
|
Cash and cash equivalents at the beginning of year (excluding overdrafts) |
1,091 |
318 |
585 |
|
Effect of exchange rate changes |
(58) |
(52) |
(6) |
|
Increase (decrease) in cash and cash equivalents |
584 |
825 |
(261) |
|
Cash and cash equivalents at the end of year (excluding overdrafts) |
1,617 |
1,091 |
318 |
|
|
|
|
|
|
Cash and cash equivalents at the end of year (excluding overdrafts) |
1,617 |
1,091 |
318 |
|
Bank overdrafts |
21 |
0 |
0 |
|
Other current investments |
1,970 |
438 |
398 |
|
Non-current investments |
398 |
114 |
313 |
|
Derivatives hedging borrowings and investments |
- |
6 |
2 |
|
Current borrowings |
(535) |
(682) |
(220) |
|
Non-current borrowings |
(48) |
(46) |
(111) |
|
Net cash at the end of the year |
3,422 |
921 |
700 |
Our financing strategy aims to maintain adequate financial resources and access to additional liquidity. During 2023, cash flow provided by operating activities amounted to $4,395 million (including a decrease in working capital of $182 million), our capital expenditures amounted to $619 million, and we paid dividends amounting to $637 million. At the end of the year, we had a net cash position 4 of $3.4 billion, compared to $921 million at the beginning of the year.
| 4 Net cash position is a non-IFRS alternative performance measure—please see Exhibit 15.2 for more information on this measure. | |
| |
| Annual Report 2023 |
We believe that funds from operations, the availability of liquid financial assets and our access to external borrowing through the financial markets will be sufficient to satisfy our working capital needs, to finance our planned capital spending program as well as to service our debt in the future twelve months and to address short-term changes in business conditions.
We have a conservative approach to the management of our liquidity, which consists of (i) cash and cash equivalents (cash in banks, liquidity funds and investments with a maturity of less than three months at the date of purchase), and (ii) other investments (fixed income securities, time deposits, and fund investments).
As of December 31, 2023, liquid financial assets as a whole (comprising cash and cash equivalents and other investments) were 19% of total assets compared to 9% at the end of 2022.
We hold investments primarily in liquidity funds and variable or fixed-rate securities from investment grade issuers. We hold our cash and cash equivalents primarily in U.S. dollars and in major financial centers. As of December 31, 2023, and December 31, 2022, U.S. dollar denominated liquid assets represented 94% and 87% of total liquid financial assets, respectively.
Fiscal Year Ended December 31, 2023, Compared to Fiscal Year Ended December 31, 2022
Operating activities
Net cash provided by operations during 2023 was $4,395 million, compared to $1,167 million during 2022. This increase was mainly attributable to the working capital variation which amounted to a reduction of $182 million in 2023, while in 2022 there was a working capital increase of $2,131 million. The annual variation in working capital was mainly attributed to a decrease of $187 million in inventories and $154 million in trade receivables, partially offset by a decrease of $149 million in trade payables and $102 million in customer advances, compared to an increase of $1,330 million in inventories and $1,208 million in trade receivables in 2022. The increase in net cash provided by operations is also due to better results, as net income amounted to $3,958 million in 2023, compared to a net income of $2,549 million in 2022. For more information on cash flow disclosures and changes to working capital, see note 30 “Cash flow disclosures” to our audited consolidated financial statements included in this annual report.
Investing activities
Net cash used in investing activities was $2,687 million in 2023, compared to net cash used in investing activities of $164 million in 2022. In 2023, we increased our financial investments by $1,857 million compared to a decrease of $123 million in 2022, while capital expenditures amounted to $619 million in 2023 compared to $378 million in 2022. In 2023, we paid $266 million in connection with acquisitions, compared to $4 million in 2022.
Financing activities
Net cash used in financing activities, including dividends paid, proceeds and repayments of borrowings and acquisitions of non-controlling interests, was $1,125 million in 2023, compared to $178 million in 2022.
During 2023, we had net repayments of borrowings of $208 million while in 2022 we had net proceeds from borrowings of $417 million.
Dividends paid during 2023 amounted to $637 million and during 2022 amounted to $531 million.
In 2023, we repurchased Company shares, under the existing share buyback program, for an amount of $214 million. There were no share repurchases during 2022.
Our total liabilities to total assets ratio was 0.19:1 as of December 31, 2023, and 0.20:1 as of December 31, 2022.
Fiscal Year Ended December 31, 2022, Compared to Fiscal Year Ended December 31, 2021
Operating activities
Net cash provided by operations during 2022 was $1,167 million, compared to $119 million during 2021. This increase was mainly attributable to the better results during the year, as net income amounted to $2,549 million in 2022 and $1,053 million in 2021, partially offset by a higher increase in working capital, which amounted to $2,131 million in 2022, while in 2021 the increase in working capital amounted to $1,071 million. The annual variation in working capital was mainly attributed to an increase of $1,330 million in inventories and $1,208 in trade receivables, compared to an increase of $1,085 million in inventories and $356 million in trade receivables in 2021. For more information on cash flow disclosures and changes to working capital, see note 30 “Cash flow disclosures” to our audited consolidated financial statements included in this annual report.
| |
| Annual Report 2023 |
Investing activities
Net cash used in investing activities was $164 million in 2022, compared to net cash provided by investing activities of $268 million in 2021. In 2022, we decreased our financial investments by $123 million compared to a decrease of $390 million in 2021, while capital expenditures amounted to $378 million in 2022 compared to $240 in 2021.
Financing activities
Net cash used in financing activities, including dividends paid, proceeds and repayments of borrowings and acquisitions of non-controlling interests, was $178 million in 2022, compared to $648 million in 2021.
During 2022, we had net proceeds from borrowings of $417 million while in 2021 we had net repayments of borrowings of $277 million.
Dividends paid during 2022 amounted to $531 million and during 2021 amounted to $319 million.
Our total liabilities to total assets ratio was 0.20:1 as of December 31, 2022, and 0.16:1 as of December 31, 2021.
Principal Sources of Funding
During 2023, we funded our operations with operating cash flows, bank financing and available liquid financial assets. Short-term bank borrowings were used as needed throughout the year.
Financial liabilities
During 2023, borrowings decreased by $145 million to $583 million at December 31, 2023, from $729 million at December 31, 2022.
Borrowings consist mainly of bank loans. As of December 31, 2023, U.S. dollar-denominated borrowings plus borrowings denominated in other currencies swapped to the U.S. dollar represented 60% of total borrowings.
For further information about our financial debt, please see note 21 “Borrowings” to our audited consolidated financial statements included in this annual report.
The following table shows the composition of our financial debt at December 31, 2023, 2022 and 2021:
|
Millions of U.S. dollars |
2023 |
2022 |
2021 |
|
|
|
|
|
|
Bank borrowings |
562 |
729 |
331 |
|
Bank overdrafts |
21 |
0 |
0 |
|
Total borrowings |
583 |
729 |
331 |
Our weighted average interest rates before tax (considering hedge accounting) amounted to 10.56% at December 31, 2023, and to 9.45% at December 31, 2022.
The maturity of our financial debt is as follows:
|
Millions of U.S. dollars |
|
|
|
|
|
|
At December 31, 2023 |
1 year or less |
1 - 2 years |
2 - 3 years |
Over 3 Years |
Total |
|
|
|
|
|
|
|
|
Borrowings |
535 |
47 |
2 |
- |
583 |
|
Interest to be accrued |
11 |
4 |
0 |
- |
14 |
|
Total |
546 |
50 |
2 |
- |
598 |
| |
| Annual Report 2023 |
Our current borrowings to total borrowings ratio amounted to 0.92:1 as of December 31, 2023, and to 0.94:1 as of December 31, 2022. Our liquid financial assets exceeded our total borrowings, and we had a net cash position 5 (cash and cash equivalents, other current and non-current investments, derivatives hedging borrowings and investments, less total borrowings) of $3.4 billion at December 31, 2023, compared to $921 million at December 31, 2022.
As of December 31, 2023, lease liabilities amounted to approximately $134 million. The amount of remaining payments with maturities of less than 1 year, between 2 and 5 years and more than 5 years was approximately 28%, 45% and 27%, respectively, of the total remaining payments.
As of December 31, 2022, lease liabilities amounted to approximately $112 million. The amount of remaining payments with maturities of less than 1 year, between 2 and 5 years and more than 5 years was approximately 25%, 48% and 27%, respectively, of the total remaining payments.
For information on our derivative financial instruments, please see “Quantitative and Qualitative Disclosure about Market Risk – Accounting for Derivative Financial Instruments and Hedging Activities” and note 26 “Derivative financial instruments” to our audited consolidated financial statements included in this annual report.
For information regarding the extent to which borrowings are at fixed rates, please see “Quantitative and Qualitative Disclosure About Market Risk”.
Significant Borrowings
Our most significant borrowings as of December 31, 2023 were as follows:
|
Millions of U.S. dollars |
|
|
|
|
|
Disbursement date |
Borrower |
Type |
Final maturity |
Outstanding |
|
2023 |
Tubos de Acero de Mexico S.A. |
Bilateral |
2024 |
200 |
|
2023 |
Tenaris Tubocaribe Ltda. |
Bilateral |
2024 |
60 |
|
2023 |
Confab Industrial S.A. |
Bilateral |
2024 |
40 |
|
2017 |
Global Pipe Company |
Bilateral |
2024 / 2025 |
39 |
As of December 31, 2023, Tenaris was in compliance with all of its covenants, or obtained the necessary waivers from the applicable financial institution if the covenants were not met.
Principal Factors Affecting Oil and Gas Prices and Demand for Steel Pipes from the Global Oil and Gas Industry
Sales to the oil and gas industry worldwide represent a high percentage of our total sales, and demand for steel pipes from the global oil and gas industry is a significant factor affecting the general level of volumes and prices for our products. Downward pressures on oil and gas prices usually result in lower oil and gas drilling activity and investment throughout the oil and gas industry with consequently lower demand for our steel pipe products and, in some circumstances, upward pressures can result in higher demand from our oil and gas customers.
Whereas oil prices are similar in most parts of the world because oil is a fully tradable commodity, gas prices are influenced by regional factors. In North America, where gas production is extensively developed and there is an extensive regional pipeline system, these factors include available gas storage capacity and seasonal weather patterns, particularly winter temperatures in the United States. LNG prices have been traditionally established in relation to international oil prices, particularly in the largest LNG markets in Asia. However, as the market for LNG has become more global and the United States has become a major source of LNG, LNG prices are now being set increasingly in relation to gas prices prevailing at regional gas hubs. In 2022, spot LNG prices completely decoupled from oil prices as pipeline gas imports to Europe from Russia were substantially reduced consequent to the Russian invasion of Ukraine and European countries dramatically increased imports of LNG to replace Russian gas. LNG prices have since normalized and spot prices are currently below oil parity levels with high levels of gas in storage in Europe and North America following a second consecutive relatively warm winter heating season.
| 5 Net cash position is a non-IFRS alternative performance measure—please see Exhibit 15.2 for more information on this measure. | |
| |
| Annual Report 2023 |
International oil prices depend on diverse factors. On the supply side, major oil-and-gas-producing nations and companies have frequently collaborated to balance the supply (and thus the price) of oil in the international markets. A major vehicle for this collaboration has been OPEC, and more recently what has become known as OPEC+, which includes OPEC members, plus Russia and certain other countries. Many of our customers are state-owned companies in member countries of OPEC and OPEC+. Another factor that has affected the international price level of oil is the political and socioeconomic conditions of oil-producing countries, such as Libya, Nigeria and Venezuela and the persistence of geo-political and armed conflicts, such as the recent Ukraine-Russia armed conflict, and conflicts affecting the Middle East region, which is home to a substantial proportion of the world’s known oil reserves. See “Key Information – Risk Factors – Risks Relating to Our Business and Industry – An escalation of the Russia-Ukraine war and other armed conflicts may adversely affect our operations”.
On the demand side, economic conditions and the level of oil inventories have traditionally played a role in oil prices and will continue to do so. Increasingly, however, the rate of substitution of oil and gas by alternative, cleaner fuel sources such as renewables, as well as policies adopted by governments and financing entities worldwide to accelerate the energy transition and by oil and gas companies to adapt their strategies to the energy transition, will also play a significant role in oil prices.
Another factor affecting oil and gas prices has been the ability of producers in the United States and Canada to rapidly increase production from their reserves of tight oil and shale gas in response to changes in market conditions. Production from U.S. tight oil reserves has grown in recent years to represent over 10% of global liquids production, and production from shale gas plays has converted the United States into a net exporter of natural gas and a major player in the LNG market.
In 2020, the COVID-19 pandemic caused a sudden and precipitous drop in global oil demand and oil prices collapsed even entering negative territory at one point. Since then, prices have recovered above their pre-pandemic level with the recovery in demand and actions by OPEC member countries and other producers to cut and then gradually increase production levels. In addition, energy and commodity prices spiked upwards at the onset of the armed conflict involving Russia and Ukraine although they have subsequently fallen back to a large extent. LNG prices, fell back at the end of 2022 and beginning of 2023 reflecting unusually warm winter weather conditions and reduced industrial demand in Europe which resulted in far lower drawdowns from storage than is customary for this period of the year. For more information on the impact of the armed conflict in Ukraine, see “Key Information – Risk Factors – Risks Relating to Our Business and Industry – An escalation of the Russia-Ukraine war and other armed conflicts may adversely affect our operations”.
The collapse of oil prices, in March 2020 took place when oil and gas operators, particularly in the United States, were already reducing their investments and drilling activity in response to pressure from financial markets to generate positive free cash flows 6 . Oil and gas operators around the world then made further substantial reductions in their exploration and production investments, reducing them to a level around 70% of the pre-pandemic level. Investments have subsequently recovered above their pre-pandemic level in 2023.
Since the development of the prolific Marcellus shale gas play, North American gas prices have remained at low levels compared to previous decades and relative to other major gas-consuming regions and global LNG prices. For several years, production increases, primarily from productive shale gas deposits, have exceeded regional demand increases, reducing the need for imports, to the extent that, in 2017, the United States became a net exporter of natural gas. Low prices have encouraged investment in gas consuming industrial facilities and LNG export facilities as well as switching from coal to gas for electric power production, particularly with the adoption of new regulations which could force the retirement of older coal-based generating units. With continuing investments in LNG export facilities, the United States has become a major global LNG exporter, and, over the past two years, has brought more new LNG capacity to the international market than any other producer.
Until the Russian invasion of Ukraine, LNG prices used to reflect supply and demand conditions in Asia, the major LNG-consuming region, although demand had been increasing in regions like Europe, which imports LNG to supplement its traditional pipeline imports from Russia and other neighboring gas-producing regions, and South America, which imports LNG in its winter season and to supplement hydroelectric energy when rainfall is low. In 2022, however, Europe became a major competitor to Asia in the LNG market as it sought to replace Russian pipeline gas at almost any cost. As Europe phases out imports of pipeline gas from Russia, demand for LNG in Europe is likely to continue to grow in the coming years, and this is changing the price dynamics of the industry. Demand, however, has been affected by higher temperatures and lower industrial activity in Europe over the past two winter heating seasons, and spot LNG prices have fallen back to levels below oil parity. Consumption, though not necessarily prices, will continue to show seasonal fluctuations, increasing in the North Asian and European winter period and declining in the summer months. The efforts to fill European storage capacity and increase import capacity has, however, increased price volatility.
| 6 Free cash flow is a non-IFRS alternative performance measure—please see Exhibit 15.2 for more information on this measure. | |
| |
| Annual Report 2023 |
U.S. natural gas prices increased during 2021, reaching $6 per million BTU as LNG export capacity came on stream and demand increased. In late 2022 and 2023, prices returned to a level of $2-3 per million BTU as LNG export demand was capped by capacity limitations and the temporary shutdown of a facility while domestic demand during the winter heating season was lower than usual. In early 2024, as U.S. winter heating demand was affected by warmer than usual weather, prices fell below $2 per million BTU. At the same time, the Biden administration paused the issuance of permits for new LNG export facilities.
Drilling activity in the United States and Canada, following several years of high activity, fell sharply through 2015 and the first half of 2016 before beginning a recovery which ended at the end of 2018. Drilling activity declined throughout 2019 in response to a fall in oil prices at the end of 2018 and financial market pressures to produce positive cash flow returns. This decline turned into a collapse with the onset of the COVID-19 pandemic in 2020. Since then, there has been a steady recovery through 2021 and 2022. Production levels today are higher than before the 2014 collapse of oil prices but rig counts are much lower, reflecting the strong productivity gains made by the U.S. oil and gas drilling industry. In the rest of the world, drilling activity began to decline in the second half of 2014, continued to decline during 2015, 2016 and 2017 before a gradual recovery in the second half of 2018 and 2019. Following the onset of the COVID-19 pandemic in 2020, drilling activity in the Eastern Hemisphere declined more slowly and later than in Latin America but then recovered later and more gradually than in Latin America.
Prior to the 2014 downturn in oil prices, a growing proportion of exploration and production spending by oil and gas companies had been directed at offshore, deep drilling and non-conventional drilling operations in which high-value tubular products, including special steel grades and premium connections, are usually specified. The success, however, of shale drilling operators, with their inherently short investment cycles, in adapting to lower oil and gas prices and increasing production, led to a slowdown in new developments of complex offshore projects with long investment lead times in a context of low and more volatile oil prices, consequently affecting the level of product differentiation. More recently, however, offshore drilling activity has increased again as exploration has continued and cost-competitive developments, like those in Brazil, Guyana, and sub-Saharan Africa, are being sanctioned and developed.
In addition, the increasing cost competitiveness and use of alternative renewable sources of energy will limit growth in demand for oil and gas and put downward pressure on oil and gas prices in the longer term. This trend will accelerate if carbon taxes or carbon pricing instruments resulting in high prices for carbon emissions, or other regulations aimed at reducing the use of fossil fuels, are implemented around the world. There has been a substantial increase in the number of commitments to reduce carbon emissions from governments and public companies, including those operating in the oil and gas industry, and increased calls on governments and financial entities to introduce regulations and policies to accelerate the energy transition away from fossil fuels to cleaner sources of energy. Major oil and gas companies have been adapting their strategies to address the energy transition and some are even setting out commitments to reduce production as early as 2030. For more information on climate change regulations, see “Key Information – Risk Factors – Risks Relating to Our Business and Industry - Climate change legislation and increasing regulatory requirements aimed at transitioning to a lower-carbon economy may reduce demand for our products and services and result in unexpected capital expenditures and costs, and negatively affect our reputation”.
On the other hand, we expect that the energy transition will create new markets for the use of our products and services including in the transportation and storage of hydrogen and for CCS systems. We constantly monitor the evolution of the strategies of our main customers and scenarios for future energy demand, considering the global objectives for addressing climate change through the reduction of carbon emissions in accordance with the Paris Agreement and national objectives to achieve carbon-neutrality. We also assess the market outlook for our products with reference to the different scenarios for oil and gas demand published by our customers, international agencies such as the IEA and expert energy market consultancies such as Rystad. These assessments are used as fundamental input for evaluating our business strategy and how to address the risks and opportunities arising from climate change.
The tables below show the annual average number of active oil and gas drilling rigs, or rig count, in the United States, Canada, Latin America and Eastern Hemisphere (worldwide other than the United States, Canada and Latin America, excluding Iran, Sudan, onshore China, Russia and Syria) and Worldwide, as published by Baker Hughes, for the years indicated and the percentage increase or decrease over the previous year. Baker Hughes, a leading oil service company, has published its rig counts on a monthly basis since 1975 as a general indicator of activity in the oil and gas sector.
| |
| Annual Report 2023 |
Rig count
|
2023 |
2022 |
2021 |
2020 | |
|
Latin America |
178 |
168 |
137 |
107 |
|
Other International (*) |
769 |
683 |
618 |
718 |
|
Canada |
177 |
175 |
132 |
89 |
|
United States |
687 |
723 |
478 |
433 |
|
Worldwide |
1,811 |
1,749 |
1,365 |
1,347 |
(*) Excludes Iran, Sudan, onshore China, Russia and Syria (discontinued in February 2013).
Percentage increase (decrease) over the previous year
|
|
2023 |
2022 |
2021 |
|
Latin America |
6% |
23% |
28% |
|
Other International (*) |
13% |
11% |
(14%) |
|
Canada |
1% |
33% |
48% |
|
United States |
(5%) |
51% |
10% |
|
Worldwide |
4% |
28% |
1% |
(*) Excludes Iran, Sudan, onshore China, Russia and Syria (discontinued in February 2013).
This discussion and analysis of our financial condition and results of operations is based on our audited consolidated financial statements, which have been prepared in accordance with IFRS. IFRS differs in certain significant aspects from U.S. GAAP.
The preparation of our audited consolidated financial statements and related disclosures in conformity with IFRS requires us to make estimates and assumptions that might affect the reported amounts of assets and liabilities, the disclosure of contingent liabilities and the reported amounts of revenue and expenses. Management evaluates its accounting estimates and assumptions, including those related to impairment of goodwill and long-lived assets; impairment in investment in associates; income taxes including recoverability of deferred tax assets; obsolescence of inventory; contingencies; allowance for trade receivables; post-employment and other long-term benefits; business combinations; useful lives of property, plant and equipment and other long-lived assets and property title ownership restriction, and revises them when appropriate. Management bases its estimates on historical experience and on various other assumptions it believes to be reasonable under the circumstances. These estimates form the basis for making judgments about the carrying values of assets and liabilities that are not readily apparent from other sources. Although management believes that these estimates and assumptions are reasonable, they are based upon information available at the time they are made. Actual results may differ significantly from these estimates under different assumptions or conditions. For more information, see “II. Accounting Policies” to our consolidated financial statements included in this annual report.
| |
| Annual Report 2023 |
Functional and presentation currency
The functional and presentation currency of the Company is the U.S. dollar. The U.S. dollar is the currency that best reflects the economic substance of the underlying events and circumstances relevant to Tenaris’s global operations.
Starting January 1, 2023, the Company changed the functional currency of its Brazilian subsidiaries, from the Brazilian Real to the U.S. dollar.
This decision was a result of a significant increase of our Brazilian subsidiaries’ participation in the OCTG and line pipe international markets, a trend which started in recent years and has been strengthened in 2022, an increased level of integration of the local operations within Tenaris’s international commercial and supply chain system, as well as the fact that the main purchase agreement contracts and the long term sales agreement contracts with major international and local oil companies are either entered or indexed to the U.S. dollar. Local steel prices are also being affected by the U.S. dollar / Brazilian Real fluctuations.
Except for its Italian subsidiaries whose functional currency is the Euro and two recently acquired subsidiaries whose functional currencies are the Canadian Dollar and the Norwegian Krone, Tenaris determined that the functional currency of its other subsidiaries is the U.S. dollar, based on the following principal considerations:
- sales are mainly negotiated, denominated and settled in U.S. dollars. If priced in a currency other than the U.S. dollar, the sales price may consider exposure to fluctuation in the exchange rate versus the U.S. dollar;
- prices of critical raw materials and inputs are priced and settled in U.S. dollars;
- transaction and operational environment and the cash flow of these operations have the U.S. dollars as reference currency;
- significant level of integration of local operations within Tenaris’s international global distribution network;
- net financial assets and liabilities are mainly received and maintained in U.S. dollars; and
- the exchange rate of certain legal currencies has long been affected by recurring and severe economic crises.
Results of operations for subsidiaries whose functional currencies are not the U.S. dollar are translated into U.S. dollars at the average exchange rates for each quarter of the year. Financial statement positions are translated at the year-end exchange rates. Translation differences are recognized in a separate component of equity as currency translation adjustments. In the case of a sale or other disposal of any of such subsidiaries, any accumulated translation difference would be recognized in the consolidated income statement as a gain or loss from the sale or disposal.
| |
| Annual Report 2023 |
Board of Directors
Management of the Company is vested in a board of directors with the broadest power to act on behalf of the Company and accomplish or authorize all acts and transactions of management and disposal that are within its corporate purpose and not specifically reserved in the articles of association or by applicable law to the general shareholders’ meeting. The Company’s articles of association provide for a board of directors consisting of a minimum of three and a maximum of fifteen directors; however, for as long as the Company’s shares are listed on at least one regulated market, the minimum number of directors must be five. The Company’s current board of directors is composed of ten directors.
The board of directors is required to meet as often as required by the interests of the Company and at least four times per year. Board of directors’ meetings can be validly held by means of teleconference call, video conference or any other means genuinely allowing for the participation, interaction and intercommunication of the attending directors. Written decisions, signed by all the directors, are proper and valid as though they had been taken at a meeting of the board of directors duly convened and held. In 2023, the Company’s board of directors met seven times and adopted one unanimous written resolution. A majority of the members of the board of directors in office present or represented at the board of directors’ meeting constitutes a quorum, and resolutions may be adopted by the vote of a majority of the directors present or represented. In case of a tie, the chairman is entitled to cast the deciding vote.
Directors are elected at the annual ordinary general shareholders’ meeting to serve one-year renewable terms, as determined by the general shareholders’ meeting. The general shareholders’ meeting also determines the number of directors that will constitute the board and their compensation. The general shareholders’ meeting may dismiss all or any one member of the board of directors at any time, with or without cause, by resolution passed by a simple majority vote, irrespective of the number of shares represented at the meeting.
The Company’s articles of association provide that the board of directors of the Company may within the limits of applicable law, (a) delegate to one or more persons, whether or not members of the board of directors, the powers necessary to carry out its decisions and to provide day-to-day management (except for approval of material transactions with related parties, which may not be delegated and shall be approved by the board of directors prior opinion of the audit committee), (b) confer to one or more persons, whether or not members of the board of directors the powers deemed to be appropriate for the general technical, administrative and commercial management of the Company, (c) constitute an audit committee formed by directors, determining its function and authority, and (d) constitute any other committee, whose members may or may not be members of the board of directors and determine their functions and authority. On May 3, 2023, the board of directors appointed Tenaris’s chief executive officer as administrateur délégué and delegated to him the power to manage the Company’s affairs within the ordinary course of business, to the full extent permitted by Luxembourg law, to direct and supervise the business activities of the Company’s subsidiaries and to represent the Company in relation to such matters.
On May 3, 2023, the Company’s annual general shareholders’ meeting re-appointed Mr. Simon Ayat, Mr. Roberto Bonatti, Mr. Carlos Condorelli, Mr. Germán Curá, Ms. Maria Novales-Flamarique, Mr. Gianfelice Mario Rocca, Mr. Paolo Rocca, Mr. Jaime José Serra Puche, Ms. Monica Tiuba and Mr. Guillermo Vogel as members of its board of directors, each board member to serve until the next annual shareholders’ meeting that will be convened to decide on the Company’s 2023 annual accounts. The board of directors subsequently reappointed Paolo Rocca as board chairman and Tenaris’s chief executive officer and Guillermo Vogel and Germán Curá as vice chairmen of the board.
| |
| Annual Report 2023 |
The following table sets forth the name of the Company’s current directors, their respective positions on the board of directors, their principal occupation, their years of service as board members and their age.
|
Name |
Position |
Principal Occupation |
Years as Board Member |
Age at |
|
|
|
|
|
|
|
Mr. Simon Ayat |
Director |
Director of the Company |
4 |
69 |
|
Mr. Roberto Bonatti (1) |
Director |
Director of San Faustin |
21 |
74 |
|
Mr. Carlos Condorelli |
Director |
Director of the Company and Ternium |
17 |
72 |
|
Mr. Germán Curá |
Director |
Director and Vice Chairman of the Company's board of directors |
6 |
61 |
|
Mrs. Maria Novales-Flamarique |
Director |
Strategy Advisor |
2 |
47 |
|
Mr. Gianfelice Mario Rocca (1) |
Director |
Chairman of the board of directors of San Faustin |
21 |
75 |
|
Mr. Paolo Rocca (1) |
Director / CEO |
Chairman of the Company's board of directors and Tenaris's chief executive officer |
22 |
71 |
|
Mr. Jaime José Serra Puche |
Director |
Chairman of S.A.I. Derecho & Economía |
21 |
72 |
|
Ms. Monica Tiuba |
Director |
Director of the Company and chairperson of the Company's audit committee |
6 |
45 |
|
Mr. Guillermo Vogel |
Director |
Director and Vice Chairman of the Company's board of directors |
21 |
73 |
| (1) Paolo Rocca and Gianfelice Mario Rocca are brothers, and Roberto Bonatti is Paolo and Gianfelice Mario Rocca’s first cousin. |
Simon Ayat. Mr. Ayat is a member of the Company’s board of directors and of its audit committee. He served as Schlumberger’s executive vice president and chief financial officer from 2007 until early 2020 and as senior strategic advisor to the chief executive officer of Schlumberger until January 2022. Mr. Ayat has held several financial and operational positions in Schlumberger, where he commenced his career in 1982. He was based in Paris, Houston and Dallas, as well as in the Middle East and Far East regions, serving as group treasurer, controller, geomarket manager for Indonesia and drilling regional vice president for Asia Pacific. Mr. Ayat is also a member of the board of directors of Liberty Energy, a leading provider of hydraulic fracturing and wireline services to E&P companies in North America. He is a French and Lebanese citizen.
Roberto Bonatti. Mr. Bonatti is a member of the Company’s board of directors. He is a grandson of Agostino Rocca, founder of the Techint Group, a group of companies controlled by San Faustin. Throughout his career in the Techint Group he has been involved specifically in the engineering and construction and corporate sectors. He was first employed by the Techint Group in 1976, as deputy resident engineer in Venezuela. In 1984, he became a director of San Faustin, and from 2001 until 2020 he has served as its president. He is also a member of the board of directors of Ternium. Mr. Bonatti is an Italian citizen.
Carlos Condorelli. Mr. Condorelli is a member of the Company’s board of directors. He served as the Company’s chief financial officer from October 2002 until September 2007. He is also a board member of Ternium. He has held several positions within Tenaris, including also the chief financial officer position in some of the principal Tenaris Group companies and member of the Company’s audit committee between November 1, 2017 and May 2, 2018. He also served as president of the board of directors of Empresa Distribuidora La Plata S.A., an Argentine utilities company. Mr. Condorelli is an Argentine citizen.
Germán Curá. Mr. Curá is a member of the Company’s board of directors and also holds the position of Vice Chairman of the Company’s board of directors. He served as president of our operations in North America until May 2, 2018, a position held since 2006. He was first employed by Siderca in 1988. Previously, he served as Siderca’s exports director, Tamsa’s exports director and commercial director, sales and marketing manager of our Middle East subsidiary, president of AlgomaTubes, president and chief executive officer of Maverick Tubulars and president and chief executive officer of Hydril, director of our Oilfield Services global business unit and Tenaris commercial director. He was also a member of the board of directors of API and of the American Iron and Steel Institute (“AISI”). He is a marine engineer from the Instituto Tecnológico de Buenos Aires and an MBA graduated from the Massachusetts Institute of Technology. Mr. Curá is an U.S. citizen.
| |
| Annual Report 2023 |
Maria Novales-Flamarique. Ms. Novales-Flamarique is a member of the Company’s board of directors. She advises multinational institutions on a variety of strategic and transformational issues. Previously, she was country head for Generation Mexico, an NGO founded by McKinsey & Company that transforms education-to-employment systems to prepare, place, and support people into life-changing careers that would otherwise be inaccessible. She was also a partner at McKinsey & Company, leading more than 50 teams advising companies in Mexico, other Latin American countries, the United States and Europe. She began her career in asset management at Letko, Brosseau & Associates in Montreal, Canada, and worked as an investment banker at Citigroup Global Markets in New York City. She currently serves as an independent director at Scotiabank Mexico, where she is a member of the Audit and Talent committees. She also sits on advisory boards at several fintech, HRtech, insurtech start-ups and venture capital funds. She holds an MBA from London Business School, a B.A. from HEC Montreal and is a CFA Charterholder. Ms. Novales-Flamarique is a Canadian, Spanish, and U.S. citizen.
Gianfelice Mario Rocca. Mr. Rocca is a member of the Company’s board of directors. He is a grandson of Agostino Rocca. He is chairman of the board of directors of San Faustin, member of the board of directors of Ternium, president of the Humanitas Group and president of the board of directors of Tenova. Moreover, in Italy, he is member of the board of Bocconi University and of the advisory board of Politecnico di Milano. At international level, he is member of the Harvard Business School Advisory Board and member of the European Round Table of Industrialists (“ERT”). Mr. Rocca is an Italian citizen.
Paolo Rocca. Mr. Rocca is the Chairman of the Company’s board of directors and has been our chief executive officer since 2002. He is a grandson of Agostino Rocca. He is also the chairman of the board of directors of Ternium and a director and President of San Faustin. He is a member of the executive committee of the World Steel Association. Mr. Rocca is an Italian citizen.
Jaime José Serra Puche. Mr. Serra Puche is a member of the Company’s board of directors and of its audit committee. He is the chairman of SAI Derecho & Economia, a Mexican consulting firm, and a member of the board of directors of Grupo Vitro, and chairman of the board of BBVA. Mr. Serra Puche served as Mexico’s Undersecretary of Revenue, Secretary of Trade and Industry, and Secretary of Finance. He led the negotiation and implementation of NAFTA. Mr. Serra Puche is a Mexican citizen.
Monica Tiuba. Ms. Tiuba is a member of the Company’s board of directors and chairperson of the audit committee. She is a Brazilian qualified lawyer and accountant with more than 20 years of professional experience in Brazil and Luxembourg. She started her career at Barbosa, Mussnich & Aragão law firm in Rio de Janeiro, Brazil, where she practiced corporate law, M&A and tax litigation. She worked in EY and PwC, in the Brazil and Luxembourg offices, advising multinational clients, private equity houses and family offices. She gained banking experience working as international senior wealth planner at Banque Edmond de Rothschild, in Luxembourg. She currently serves as member of the board of directors of Investing for Development SICAV, a Luxembourg social impact fund and of its Forest and Climate Change Fund and she was also a member of Freyr Battery’s board of directors and chairperson of the audit and risk committee. She holds a Master of Laws in International and Comparative Law at the Vrije Universiteit Brussel, a specialization in EU tax law from Leiden University and a Master of Laws in international taxation from Vienna University of Economics. Ms. Tiuba is a Brazilian and Luxembourgish citizen.
| |
| Annual Report 2023 |
Guillermo Vogel. Mr. Vogel is a member of the Company’s board of directors and also holds the position of vice chairman of the board. He is a notable Mexican businessperson with an extensive career in various industries. He graduated from the Universidad Nacional Autónoma de México and also holds an MBA from the University of Texas at Austin. Mr. Vogel has held prominent positions in several companies, showcasing his expertise and leadership skills. He is the Chairman of GCollado S.A.B. de C.V. and Exportaciones IM Promoción, S.A. de C.V. His influence extends to multiple organizations, as he has served as president of Canacero, the Steel Chamber in Mexico, and as Vice Chairman of the American Iron and Steel Institute (“AISI”). Moreover, Mr. Vogel is actively involved in various other companies and institutions. He is a board member of Techint, S.A. de C.V., Alfa S.A.B. de C.V., Banco Santander (México) S.A; Innovare R&D, S.A., Europea Network Business Solutions S.A. de C.V; Club de Industriales, A.C., Consejo Coordinador Empresarial; and several other organizations. His roles also include contributions to the academic sector, as he is a member of the board of the Universidad Panamericana and IPADE, A.C. His international presence is marked by his membership in The Trilateral Commission and the International Board of The Manhattan School of Music. He also plays a key role in the US-Mexico CEO Dialogue as its Chairman. Vogel's career reflects a blend of leadership in business and contributions to international relations and education. Mr. Vogel is a Mexican citizen.
At the next annual general shareholders’ meeting scheduled to be held on April 30, 2024, it will be proposed that the number of directors be increased to eleven, that all of the current members of the board of directors be reappointed, and that Ms. Molly Montgomery be newly appointed to the board of directors, each to hold office until the next annual general shareholders’ meeting that will be convened to decide on the Company’s 2024 annual accounts. Below is Ms. Montgomery’s biographical information.
Molly Montgomery. Ms. Montgomery has 20 years of experience advising senior executives and government officials on geopolitical and policy issues. She currently serves as a Public Policy Director at Meta Platforms, Inc. In her 15-year career in the U.S. government, her roles included serving in the White House as Special Advisor to the Vice President for Europe and Eurasia and as the Deputy Assistant Secretary of State for the EU and Western Europe. Ms. Montgomery was previously a senior vice president at Albright Stonebridge Group, where she advised Fortune 500 clients on geopolitical risk, regulatory issues, and market entry and exit. She currently serves as a member of the board of directors of the Center for European Policy Analysis and on the Leadership Council for Women in National Security. She holds a BA in History and Political Science from Stanford University, an MPA in International Relations from Princeton University, and a life membership in the Council on Foreign Relations. Ms. Montgomery is a U.S. citizen.
Board members Ayat, Novales-Flamarique, Serra Puche and Tiuba qualify as independent directors under Exchange Act Rule 10A-3(b)(1) and the Company’s articles of association. If appointed by the next annual general meeting of shareholders, Ms. Montgomery would also qualify as an independent director for purposes of Exchange Act Rule 10A-3(b)(1) and under the Company’s articles of association.
| |
| Annual Report 2023 |
Directors’ Liability
Each director must act in the interest of the Company, and in accordance with applicable laws, regulations, and the Company’s articles of association. Directors are also bound by a general duty of care owed to the Company.
Under the Luxembourg law of August 10, 1915, on commercial companies, as amended (the “Luxembourg Company Law”), directors may be liable to the Company in accordance with general law for the execution of their mandate and for any misconduct in the management of the Company’s affairs. Directors are jointly and severally liable towards either the Company or any third parties from damages resulting from the violation of the Luxembourg Company Law or the Company’s articles of association. Directors shall be discharged from such liability in the case of a violation to which they were not a party provided no misconduct is attributable to them and such violation has been reported to the first general meeting of shareholders after they have acquired knowledge thereof.
Causes of action against directors for damages may be initiated by the Company upon a resolution of the general shareholders’ meeting passed by a simple majority vote, irrespective of the number of shares represented at the meeting. Causes of action against directors who misappropriate corporate assets or commit a breach of trust may be brought by any shareholder for personal losses different from those of the Company.
An action may also be brought against the directors on behalf of the Company by shareholders who, at the general meeting which decided to discharge such directors or members, owned voting securities representing at least ten percent of the votes attaching to all such securities.
It is customary in Luxembourg that the shareholders expressly discharge the members of the board of directors from any liability arising out of or in connection with the exercise of their mandate when approving the annual accounts of the Company at the annual general shareholders meeting. However, any such discharge will not release the directors from liability for any damage caused by unrevealed acts of mismanagement or unrevealed breaches of the Luxembourg Company Law or the Company’s articles of association, nor will it release directors from liability for any personal loss of the shareholders independent and separate from losses suffered by the Company due to a breach either revealed or unrevealed of the Luxembourg Company Law or the Company’s articles of association.
Under Luxembourg law, unless the decision of the board of directors relates to ordinary business entered into under normal conditions, any director having a direct or indirect financial interest conflicting with that of the Company in a transaction which has to be considered by the board of directors, must advise the board thereof and cause a record of her/his statement to be included in the minutes of the meeting and may not take part in the deliberations. At the next following general meeting, before any other resolution is put to vote, a special report must be made on any transactions in which any of the directors may have had an interest conflicting with that of the Company.
Auditors
The Company’s articles of association require the appointment of an independent audit firm in accordance with applicable law. The primary responsibility of the auditor is to audit the Company’s annual accounts and consolidated financial statements and to submit a report on the accounts to shareholders at the annual shareholders’ meeting. In accordance with applicable law, auditors are chosen from among the members of the Luxembourg Institute of Independent Auditors (Institut des réviseurs d’entreprises).
Auditors are appointed by the general shareholders’ meeting upon recommendation from the Company’s audit committee through a resolution passed by a simple majority vote, irrespective of the number of shares represented at the meeting, to serve one-year renewable terms. Auditors may be dismissed for reasonable cause by the general shareholders’ meeting at any time. Luxembourg law does not allow directors to serve concurrently as external auditors. As part of their duties, auditors report directly to the audit committee.
Pursuant to its charter, the Company’s audit committee is responsible for, among other things, the oversight of the independence and performance of the Company’s external auditors. The audit committee is also responsible to consider and make recommendations to the board of directors, to be put to shareholders for approval at the annual general meeting of shareholders, regarding the appointment, re-appointment or removal of the Company’s external auditors. In addition, the audit committee is responsible to review the appropriateness and provision of permitted non-audit fees and to review and approve any fees (whether for audit, audit-related and non-audit services) payable to the Company’s external auditors. On a yearly basis, in the performance of its functions, the audit committee considers the appointment of the Company’s external auditors and reviews, together with management and the external auditor, the audit plan, audit related services and other non-audit services. The audit committee requests the board of directors to submit the audit committee’s recommendation for the appointment of the Company’s external auditor for each fiscal year and the payment of applicable fees, for final approval by the general shareholders’ meeting. The general shareholders’ meeting regularly approves audit fees and authorizes the audit committee to approve any increase or reallocation of such audit fees as may be necessary, appropriate or desirable under the circumstances. No services outside the scope of the audit committee’s approval can be undertaken by the external auditor.
| |
| Annual Report 2023 |
The shareholders’ meeting held on May 3, 2023, re-appointed PricewaterhouseCoopers S.C., Réviseurs d’entreprises agréé (“PwC”), as the Company’s statutory auditor for the fiscal year ended December 31, 2023, and appointed Ernst & Young S.A. (“EY”) as the Company’s statutory auditors for the fiscal year ending December 31, 2024. Compensation
Senior Management
Our current senior management as of the date of this annual report consists of:
|
Name |
Position |
Age at |
|
|
|
|
|
Mr. Paolo Rocca |
Chairman and Chief Executive Officer |
71 |
|
Ms. Alicia Móndolo |
Chief Financial Officer |
65 |
|
Mr. Gabriel Podskubka |
Chief Operating Officer |
50 |
|
Mr. Antonio Caprera |
Chief Industrial Officer |
63 |
|
Mr. Gabriel Casanova |
Chief Supply Chain Officer |
65 |
|
Mr. Luis Scartascini |
Chief Human Resources Officer |
50 |
|
Mr. Marcelo Ramos |
Chief Technology Officer |
60 |
|
Mr. Luca Zanotti |
President, United States |
56 |
|
Mr. Sergio de la Maza |
President, Mexico |
67 |
|
Mr. Javier Martínez Alvarez |
President, Southern Cone |
57 |
|
Mr. Michele Della Briotta |
President, Europe |
51 |
Paolo Rocca. Mr. Rocca is the Chairman of the Company’s board of directors and has been our chief executive officer since 2002. He is a grandson of Agostino Rocca. He is also the chairman of the board of directors of Ternium and a director and President of San Faustin. He is a member of the executive committee of the World Steel Association. Mr. Rocca is an Italian citizen.
Alicia Móndolo. Ms. Móndolo currently serves as our Chief Financial Officer, a position she assumed in August 2019 and, since April 2023, has also assumed responsibility over the process improvement and information technology department. Ms. Móndolo joined the Techint Group in 1984 and has more than 35 years of experience in accounting and reporting, audit and finance. From 2010 to 2016, she served as Chief Audit Executive of Tenaris. Previously and from 2016 to 2019, she served as financial officer in several companies in the Techint Group. Ms. Móndolo is an Argentine and Italian citizen.
Gabriel Podskubka. Mr. Podskubka currently serves as our Chief Operating Officer, with responsibility for coordinating the company’s sales and marketing, supply chain and production operations and product and service development, a position he assumed in April 2023. After graduating as an industrial engineer in Argentina, Mr. Podskubka joined Siderca in 1995 in the marketing department. He held various positions in the marketing, commercial, and industrial areas of Tenaris until he was appointed as the head of our Eastern European operations in 2009 and, in 2013, the president of our Eastern Hemisphere operations. Mr. Podskubka is an Argentine citizen.
Antonio Caprera. Mr. Caprera currently serves as our Chief Industrial Officer, position he assumed in April 2017, and since July 2023, he also assumed responsibility over the quality department. He joined the company in 1990. From 2000 to 2006 he served as quality director at Dalmine in Italy, where he later assumed responsibilities as production director until 2012. From that year and until 2015 he served as production director at Siderca in Argentina, after which he assumed responsibilities as global industrial coordinator based in Mexico until March 2017. Mr. Caprera is an Italian citizen.
Gabriel Casanova. Mr. Casanova currently serves as our Chief Supply Chain Officer, with responsibility for the execution of all contractual deliveries to customers. After graduating as a marine and mechanical engineer, he joined Siderca’s export department in 1987. In 1995 he became Siderca’s Chief Representative in China and from 1997 to 2009 he held several positions in the commercial area in Dalmine. In 2009 he became the head of our supply chain network and in October 2012 he assumed his current position. Mr. Casanova is an Argentine citizen.
Luis Scartascini. Mr. Scartascini currently serves as our Chief Human Resources Officer, a position he assumed in January, 2022. After receiving a degree in industrial engineering, he started his career in Siderca in 1997 and then moved to Houston in 2003 to be part of the company’s commercial office in the United States. In 2005 he moved back to Argentina to serve as the director of the Global Trainee program before heading to Dubai in 2010 to lead the Middle Eastern Business Unit and later support the acquisition of Saudi Steel Pipes. He returned to the United States in 2018 as commercial vice president and played a leading role in the commercial integration of IPSCO. Mr. Scartascini is an Argentine and Italian citizen.
| |
| Annual Report 2023 |
Marcelo Ramos. Mr. Ramos currently serves as our Chief Technology Officer. Previously he served as corporate quality director and managing director of NKKTubes. He joined the Techint Group in 1987 and has held various positions within Tenaris. He assumed his current position in April 2010. Mr. Ramos is an Argentine citizen.
Luca Zanotti. Mr. Zanotti currently serves as president of our operations in the United States. In 2002, he joined Exiros, the procurement company for the Techint Group, as planning and administration director. He was later promoted to raw materials director and in July 2007 became managing director of Exiros, a position he held until 2010. He served as regional manager Europe, and managing director of Dalmine from 2011 to 2015, when he assumed his current position. Before joining the Techint Group, he was a senior manager at A.T. Kearney in Milan, where he worked from 1998 to 2002, and prior to that he held various business development positions in the Far East for Lovato Electric. Mr. Zanotti is an Italian citizen.
Sergio de la Maza. Mr. de la Maza currently serves as our president, Mexico and also serves as managing director and executive vice-president of Tamsa. He first joined Tamsa in 1980. From 1983 to 1988, Mr. de la Maza worked in several positions in Tamsa. He then became manager of Tamsa’s new pipe factory and later served as manufacturing manager and quality director of Tamsa. Subsequently, he was named manufacturing director of Siderca. He assumed his current position in 2003. Mr. de la Maza is a Mexican citizen.
Javier Martínez Álvarez. Mr. Martínez Álvarez currently serves as president of our operations in the Southern Cone, a position he assumed in June 2010, having previously served as our Andean area manager. He began his career in the Techint Group in 1990, holding several positions including planning manager of Siderar and commercial director of Ternium-Sidor. In 2006, he joined Tenaris as our Venezuela area manager. Mr. Martínez Álvarez is an Argentine citizen.
Michele Della Briotta. Mr. Della Briotta currently serves as president of our operations in Europe, a position he assumed in July 2016. He first joined Tenaris in 1997 and has worked in areas such as industrial planning, operations, supply chain and commercial in Italy, Mexico, Argentina and the United States. Most recently he served as Tenaris’s area manager for Romania. Mr. Della Briotta is an Italian citizen.
The compensation payable to the members of the Company’s board of directors for the performance of their services to the Company is determined at the annual ordinary general shareholders’ meeting. The general meeting of shareholders held on May 3, 2023, approved the compensation paid to directors for the performance of their duties during the fiscal year 2023 and resolved that (i) each director receives a fixed compensation for an amount of $115,000; (ii) each director who is also a member of the Company’s audit committee receives an additional fee of $55,000; and (iii) the chairperson of the Company’s audit committee receives an additional fee of $10,000. No variable compensation has been paid or shall be payable to directors for services rendered during the year 2023 and no long-term incentive or pension plan is available to directors.
The compensation paid to the Company’s managing director or chief executive officer is determined by the board of directors. The cash compensation paid or payable to the chief executive officer for the performance of his duties during the year 2023 amounts to $9.5 million, of which $3 million corresponds to fixed compensation and $6.5 million corresponds to variable compensation. No long-term incentive or pension plan is awarded to the chief executive officer.
The aggregate cash compensation paid to all directors and senior managers of the Company for the year 2023 amounted to $47.5 million. This amount includes cash benefits paid to certain senior managers in connection with pre-existing retirement plans. In addition, directors and senior managers received for the year 2023, 388 thousand units for a total amount of $5.6 million in connection with the employee retention and long-term incentive program described in note II.P.3 “Accounting Policies - Employee benefits - Other long-term benefits” to our audited consolidated financial statements included in this annual report.
The Luxembourg Law of August 1, 2019 (amending the Luxembourg Law of May 24, 2011) (the “Shareholders’ Rights Law”) on the exercise of certain rights of shareholders in general meetings of listed companies, which transposes EU Directive 2017/828 of the European Parliament and of the Council of May 17, 2017 (amending Directive 2007/36/EC) regarding the encouragement of long-term shareholder engagement in listed companies within the Member States of the European Union, requires EU listed companies to adopt a Compensation Policy setting forth the principles and guidelines for purposes of determining the compensation payable to the members of the Company’s board of directors and the managing director or chief executive officer and annual Compensation Reports describing the annual compensation paid to directors and the chief executive officer for the performance of their duties.
| |
| Annual Report 2023 |
The Company’s board of directors approved, at its meeting held on April 29, 2020, the Compensation Policy of the Company, which was submitted to an advisory non-binding vote at the shareholders meeting held on June 2, 2020, and approved by majority vote. At its meeting held on February 21, 2024, the Company’s board of directors approved certain amendments to the Compensation Policy, which will be submitted to an advisory non-binding vote at the shareholders meeting scheduled to be held on April 30, 2024. The Compensation Policy is available on the Company’s website and will be periodically reviewed and submitted to the non-binding vote of the shareholders every four years, to the extent required by Luxembourg law, or in the event of a material amendment thereto.
In addition, on February 21, 2024, the Company’s board of directors approved the 2023 Compensation Report, which is available on the Company’s website and will be submitted to the non-binding vote of the shareholders at the next general meeting of shareholders scheduled to be held on April 30, 2024.
On November 2, 2023, the Company’s board of directors approved a Clawback Policy, in response to the requirements of Section 303A.14 of the New York Stock Exchange Listed Company Manual, setting forth the principles for the prompt recovery or “clawback” of erroneously awarded incentive-based compensation granted to certain officers of the Company in the event of a restatement of the Company’s financial statements, as further described therein. The members of senior management listed in the section “Directors, Senior Management and Employees”, as well as Mr. Stefano Bassi, the Company’s global reporting director, are subject to the Clawback Policy.
Audit Committee
Pursuant to the Company’s articles of association, as supplemented by the audit committee’s charter, for as long as the Company’s shares are listed on at least one regulated market, the Company must have an audit committee composed of at least three members, the majority of whom must qualify as independent directors, provided, however, that the composition and membership of the audit committee shall satisfy such requirements as are applicable to, and mandatory for, audit committees of issuers such as the Company under any law, rule or regulation applicable to the Company (including, without limitation, the applicable laws, rules and regulations of such regulated market or markets).
Under the Company’s articles of association, an independent director is a director who:
| • |
is not and has not been employed by us or our subsidiaries in an executive capacity for the preceding five years; |
| • |
is not a person that controls us, directly or indirectly, and is not a member of the board of directors of a company controlling us, directly or indirectly; |
| • |
does not have (and is not affiliated with a company or a firm that has) a significant business relationship with us, our subsidiaries or our controlling shareholder; |
| • |
is not and has not been affiliated with or employed by a present or former auditor of us, our subsidiaries or our controlling shareholder for the preceding five years; and |
| • |
is not a spouse, parent, sibling or relative up to the third degree of any of the above persons. |
The audit committee of the Company’s board of directors currently consists of three members: Mr. Simon Ayat, Mr. Jaime José Serra Puche and Ms. Monica Tiuba, who were appointed to the audit committee by the Company’s board of directors on May 3, 2023. As of the date of this annual report, all members of the audit committee qualify as independent directors both for purposes of the Exchange Act Rule 10A-3(b)(1), and under the Company’s articles of association. The board of directors of the Company has determined that Ms. Tiuba qualifies as “audit committee financial expert” under applicable SEC rules and has competence in accounting or auditing matters, as required by applicable Luxembourg law. In addition, the membership of the audit committee as a whole has sufficient relevant knowledge of the business and financial experience to properly discharge its functions.
The audit committee operates under a charter amended and restated by the board of directors on October 8, 2021. The audit committee assists the board of directors in its oversight responsibilities relating to (i) the integrity of the Company’s financial statements; (ii) the effectiveness of the Company’s systems of internal control, risk management and internal audit over financial reporting; and (iii) the independence and performance of the Company’s external auditors. The audit committee also performs other duties entrusted to it by the Company’s board of directors or required to be performed by it under applicable laws and regulations.
| |
| Annual Report 2023 |
In addition, the audit committee is required to review and, where applicable, approve material transactions between the Company or its subsidiaries and related parties, as provided in the Company’s articles of association, or as may be required by any law, rule or regulation applicable to the Company, in order to determine whether their terms are consistent with the interests of the Company and all its shareholders and are consistent with market conditions or are otherwise fair to the Company and its subsidiaries. The Company has adopted a Related Party Transactions Policy and Procedure setting forth the revised, updated and consolidated guidelines and processes through which the Company identifies, approves and manages related party transactions, seeking to assure transparency and substantial and procedural fairness of such transactions, as well as compliance with the provisions in the Company’s articles of association and the audit committee charter relating to transactions with related parties, Luxembourg rules relating to the approval and disclosure of material related party transactions, and Section 314.00 of the NYSE Listed Company Manual.
Under the Company’s articles of association, as supplemented by the Related Party Transactions Policy and Procedure, a “related party” is any of the following persons: (i) any affiliate of the Company; (ii) any entity in which a controlling person owns a substantial interest or over which a controlling person can exercise significant influence; (iii) any unconsolidated entity in which the Company has significant influence; (iv) any entity or individual having significant influence over the Company, or a close family member of any such individual; (v) any individual or entity that is the beneficial owner of five percent (5%) or more of the shares of the Company, including through the ownership of any securities representing shares of the Company; (vi) any director or executive officer of any of the controlling persons, the Company or any of the subsidiaries, or a close family member of any such director or executive officer; (vii) any entity in which a substantial interest in the voting power is owned, directly or indirectly, by any person described in (iv), (v) or (vi) above or over which such a person is able to exercise significant influence; or (viii) any entity that has a member of key management in common with the Company or any of its subsidiaries (provided that key management personnel includes persons having authority and responsibility for planning, directing and controlling the activities of an entity, including directors and executive officers and close family members of any such individuals).
With respect to the materiality threshold for review and approval of related party transactions, the Company’s articles of association, as supplemented by the audit committee’s charter and the Related Party Transactions Policy and Procedure, provide that the following related party transactions, which are qualified as “Level 1” related party transactions, are subject to review by the audit committee, which shall make a recommendation to the board of directors as to either reject or approve the proposed related party transaction:
- any transaction between the Company or its subsidiaries with related parties (i) with an individual value equal to or greater than $10 million, or its equivalent in other currencies, or (ii) with an individual value lower than $10 million, or its equivalent in other currencies, when the aggregate sum reflected in the financial statements of the four fiscal quarters preceding the date of determination of any series of transactions for such lower value that can be deemed to be parts of a unique or single transaction (but excluding any transactions that were reviewed and approved by Company’s audit committee or board of directors, as applicable, or the independent members of the board of directors of any of its subsidiaries) exceeds 1.5% of the Company’s consolidated net sales made in the fiscal year preceding the year on which the determination is made; and
- any corporate reorganization transaction (including a merger, spin-off or bulk transfer of a business) affecting the Company or any of its subsidiaries for the benefit of, or involving, a related party.
In addition, any related party transaction that does not qualify as a “Level 1” related party transaction, but which has an individual value equal to or higher than $5 million (which is the value threshold determined by management to be material to the Company for disclosure purposes under “Related Parties Transactions” of this annual report), qualifies as a “Level 2” related party transaction and must be reviewed by the audit committee for purposes of making a determination as to whether any conflicts of interest exist and whether the proposed related party transaction is consistent with the interests of the Company and all shareholders, in order to either reject or approve the proposed transaction. Any related party transaction that is for less than such value qualifies as a “Level 3” related party transaction and is reviewed by the Company’s related-party transaction unit, the area within the Company responsible for centralizing and compiling the information relating to all related party transactions and performing the review, assessment and other procedures contemplated in the Related Party Transactions Policy and Procedure.
The audit committee has the power (to the maximum extent permitted by applicable laws) to request that the Company or relevant subsidiary promptly provide all information necessary for the audit committee to assess the material transactions with related parties that it is required to review. In no event may any proposed related party transaction be entered into or otherwise be given effect unless it has been reviewed and approved in accordance with the Related Party Transactions Policy and Procedure. Any executed transaction that has not been duly reviewed and approved must be promptly submitted for review in accordance with applicable procedures and, if determined appropriate, must be ratified; if the transaction is not ratified, it must be modified to make it acceptable for ratification or it must otherwise be immediately discontinued or rescinded.
| |
| Annual Report 2023 |
The audit committee has the authority to conduct any investigation appropriate to the fulfillment of its responsibilities and has direct access to the Company’s external auditors as well as anyone in the Company and, subject to applicable laws and regulations, its subsidiaries. In addition, the audit committee may engage, at the Company’s expense, independent counsel and other internal or external advisors to review, investigate or otherwise advise on, any matter as the committee may determine to be necessary to carry out its purposes and responsibilities.
The audit committee is also in charge of the interpretation, implementation, control and enforcement of the Company’s Clawback Policy, which sets forth the principles for the prompt recovery of erroneously awarded incentive-based compensation granted to certain officers of the Company in the event of a restatement of the Company’s financial statements.
In addition, the Company has established a management-level Critical Risk Committee (“CRC”) that assists the Company’s board of directors, the audit committee and the chief executive officer in connection with the monitoring, assessment and review of risks to which Tenaris is exposed and in the oversight of the risk management framework and processes, with a focus on critical risks (including accidents, cybersecurity, commercial execution, environmental, health and safety and regulatory risks), the development of mitigating actions, and the monitoring of action plans. The CRC operates under a Critical Risk Management revised charter approved by the board of directors on April 26, 2023, which sets forth the roles, composition and responsibilities of the CRC. The CRC assists the board of directors, the audit committee and the chief executive officer with the oversight of the risks to which Tenaris is exposed and monitors the risk management process, including risk mapping, mitigation and prevention, with a focus on critical risks. The CRC periodically reports to the board of directors, the audit committee and the chief executive officer on its activities.
The following table shows the number of persons employed by Tenaris and its fully consolidated subsidiaries (excluding Exiros, which is proportionally consolidated) as of December 31:
|
|
2023 |
2022 |
2021 |
|
|
|
|
|
|
Mexico |
7,500 |
5,919 |
5,474 |
|
Argentina |
6,267 |
6,444 |
5,169 |
|
USA |
3,882 |
3,509 |
2,684 |
|
Italy |
2,187 |
2,136 |
2,011 |
|
Romania |
1,884 |
1,847 |
1,725 |
|
Indonesia |
1,573 |
495 |
506 |
|
Brazil |
1,492 |
1,460 |
1,817 |
|
Canada |
1,195 |
944 |
758 |
|
Colombia |
1,112 |
1,183 |
1,009 |
|
Saudi Arabia |
849 |
427 |
408 |
|
Other |
1,193 |
928 |
1,215 |
|
|
29,134 |
25,292 |
22,776 |
From December 2022 to December 2023, we increased our headcount by 3,842 people. This increase is primarily driven by the acquisitions completed during 2023. The acquisition of the pipe coating business from Mattr, resulted in the addition of nearly 2,800 employees to our workforce, mainly in Indonesia and Mexico, but also in Canada, the United States, Norway and the United Arab Emirates. Also, the consolidation of GPC, resulted in an increase in our staff of approximately 400 employees in Saudi Arabia. We reinforced health, safety, and environment training to ensure all employees receive training to minimize incidents and accidents while keeping quality and productivity levels high on the production lines.
Approximately two-thirds of our employees are unionized. In all countries where we have presence, we operate in compliance with applicable rules and regulations. We forge our relations with the unions based on the premise of an open dialogue and a rich interchange of proposals.
Tenaris is committed to leading with care, providing a flexible and agile working environment that encourages health, safety and wellbeing, accountability, inclusion and trust, allowing employees to develop their skills and careers while contributing to our goals.
| |
| Annual Report 2023 |
In terms of human resources our goals are:
- to foster trust and empower employees to manage and promote change and innovation, providing them with the training and technological resources to succeed;
- to embed sustainability values through transparent and effective processes, helping employees shape their professional careers;
- to encourage continuous learning and feedback through concrete tools; and
- to respect and promote merit, diversity and inclusion in all its forms, focused on gender, age, culture and background.
The Company’s Code of Conduct prohibits unlawful discrimination in employment relationships, granting any person the right to apply for a position in Tenaris, or to be considered for a new position based on merit, without arbitrary discrimination. The Company’s Human Resources Policy aims at affording equal opportunities by requiring that hiring, promotion, transfer, notice periods, dialogue, rights and protection, as well as other employment decisions be taken without regard for race, color, religious belief, gender, age, disability, national origin or sexual orientation. Compensation and remuneration are based on each person’s duties, personal performance, competence and behavior. Tenaris pursues a policy of inclusive corporate culture and leadership, recognizing the range of benefits brought by embracing diversity in all its aspects, from gender to nationality and age. Specifically, we are making headway in our drive to improve the gender balance, in the knowledge that tackling the male-dominated traditions prevalent in the steel industry will contribute positively to our performance culture.
To our knowledge, as of December 31, 2023, our directors and senior management owned 858,712 Company securities (in the form of shares or ADSs) which represents 0.07% of the Company’s issued share capital.
The following table provides information regarding share ownership reported to the Company by our directors and senior management:
|
Director or Officer |
Number of Issued Shares Held |
|
|
|
|
Guillermo Vogel |
850,446 |
|
Carlos Condorelli |
4,320 |
|
Gabriel Podskubka |
3,946 |
|
Total |
858,712 |
The following table shows the beneficial ownership of the Company’s securities (in the form of shares or ADSs) by (i) the Company’s major shareholders (persons or entities that have notified the Company of holdings in excess of 5% of the Company’s issued share capital), (ii) the Company’s directors and senior management as a group, and (iii) shares repurchased under the existing share buyback program and held in treasury. The information below is as of December 31, 2023. For more recent information on share repurchases under the Company’s share buyback program, please refer to “Purchases of Equity Securities by the Issuer and Affiliated Purchasers”.
|
Identity of Person or Group |
Number of Issued Shares |
Percentage of Issued Share Capital |
|
|
|
|
|
San Faustin (1) |
713,605,187 |
60.45% |
|
Directors and senior management as a group |
858,712 |
0.07% |
|
Treasury shares (2) |
12,648,091 |
1.07% |
|
Public |
453,424,840 |
38.41% |
|
Total |
1,180,536,830 |
100.00% |
(1) San Faustin owns all of its shares in the Company, representing 60.45% of the Company’s share capital and 61.10% of the voting rights, through its wholly-owned subsidiary Techint Holdings S.à r.l, the holder of record of the above-mentioned Tenaris shares. RP STAK held voting rights in San Faustin sufficient in number to control San Faustin. No person or group of persons controls RP STAK
(2) Represents shares repurchased by the Company as of December 31, 2023, under its share buyback program.
| |
| Annual Report 2023 |
The voting rights of the Company’s major shareholders do not differ from the voting rights of other shareholders. No shares have any special control rights. The Company’s articles of association do not contain any provision that would have the effect of delaying, deferring or preventing a change in control of the Company and that would operate only with respect to a merger, acquisition or corporate restructuring involving the Company or any of its subsidiaries.
The Company does not know of any significant agreements or other arrangements to which the Company is a party and which take effect, alter or terminate in the event of a change of control of the Company. The Company does not know of any arrangements, the operation of which may at a later date result in a change of control of the Company.
Tenaris is a party to several related party transactions as described in note 31 “Related party transactions” to our Consolidated Financial Statements included in this annual report. Material related party transactions are subject to the review of the audit committee of the Company’s board of directors and the requirements of Luxembourg law. For further details on the approval process for related party transactions, see “Directors, Senior Management and Employees – Board Practices – Audit Committee”.
Purchases of Steel Products and Raw Materials
In the ordinary course of business, we purchase round steel bars, flat steel products and other raw materials from Ternium or its subsidiaries. These purchases were made on terms no less favorable to Tenaris than terms that could have been obtained from unrelated third parties. These transactions include:
- purchases of round steel bars made under a frame agreement for use in our seamless steel pipe operations in Mexico, which amounted to $12 million in 2023, $111 million in 2022 and $157 million in 2021;
- purchases of flat steel products for use in the production of welded pipes and accessories, which amounted to $77 million in 2023, $101 million in 2022 and $32 million in 2021; and
- purchases of scrap and other raw materials for use in the production of seamless pipes, which amounted to $11 million in 2023, $12 million in 2022 and $9 million in 2021.
In the ordinary course of business, we purchase flat steel products from Usiminas for use in our welded steel pipe operations. These purchases, which were made on terms no less favorable to Tenaris than terms have been obtained from unrelated third parties, amounted to $225 million in 2023, $335 million in 2022 and $27 million in 2021.
Sales of Raw Materials
In the ordinary course of business, we sell ferrous scrap and other raw materials to Ternium or its subsidiaries. These sales, which are made on similar terms and conditions as sales to other unrelated third parties, amounted to $40 million in 2023, $39 million in 2022 and $36 million in 2021.
Purchase Agency Services and Sales of Materials
Exiros, in which we have 50% share ownership and Ternium owns the remaining 50%, provides purchase agency services and raw materials and other products to various companies controlled by or under the significant influence of San Faustin. Pursuant to the Exiros shareholders’ agreement, Tenaris recognizes Exiros’ assets, liabilities, revenue and expenses in relation to its interest in the joint operation. Exiros’ total sales to companies controlled by, or under the significant influence of, San Faustin totaled $65 million in 2023, $140 million in 2022 and $76 million in 2021.
Supply of Electric Energy
Techgen, which is currently owned 48% by Ternium, 30% by Tecpetrol and 22% by Tenaris, operates an electric power plant in Pesquería, Mexico. Ternium and Tenaris currently contract 78% and 22%, respectively, of Techgen’s power capacity. Techgen sells to third parties on behalf of Tenaris the unused electricity that Tenaris purchased from Techgen.
Techgen net sales of electricity to Tenaris amounted to $73 million in 2023, $102 million in 2022 and $70 million in 2021.
| |
| Annual Report 2023 |
Supply of Natural Gas
We are party to contracts with Tecpetrol relating to the supply of natural gas to our operations in Argentina. Tecpetrol is a company controlled by San Faustin, engaged in oil and gas exploration and production and has rights to various oil and gas fields in Argentina and elsewhere in Latin America.
Tecpetrol supplies Tenaris’s Argentine subsidiaries with natural gas requirements under market conditions and according to local regulations. Tecpetrol’s sales to Tenaris amounted to $42 million in 2023, $44 million in 2022, and $32 million in 2021.
Provision of Engineering and Labor Services
Tenaris contracts with certain companies controlled by San Faustin specialized in supplying engineering services and non-specialist manual labor services, such as industrial cleaning, general maintenance, handling of by-products and construction services. Fees accrued for these services in the aggregate amounted to $69 million in 2023, $28 million in 2022 and $7 million in 2021.
Sales of Steel Pipes and Sucker Rods
In the ordinary course of business, we sell steel pipes, sucker rods and related services to other companies controlled by or under the significant influence of San Faustin. These sales, which are made principally to companies involved in the construction of gas pipelines and to Tecpetrol and joint ventures in which Tecpetrol participates, for its oil and gas drilling operations, are made on similar terms and conditions as sales to unrelated third parties. Our sales of steel pipes and sucker rods as well as logistical and certain other services to other companies controlled by or under the significant influence of San Faustin amounted to $119 million in 2023, $149 million in 2022 and $77 million in 2021.
Sales of Fracking and Coiled Tubing Services
We provide fracking and coiled tubing services to Tecpetrol and joint ventures in which Tecpetrol participates, for its oil and gas drilling operations, which amounted to $102 million in 2023, $102 million in 2022 and $45 million in 2021.
Administrative Services, Legal and Other Support Services
Finma S.A. (“Finma”), a company controlled by San Faustin in which Tenaris has a 33% interest and other affiliates of San Faustin own the remaining shares, provides administrative and legal support services to San Faustin’s affiliates in Argentina, including Tenaris. Fees accrued for these services amounted to $13 million in 2023, $14 million in 2022 and $10 million in 2021.
Loans to Related Parties
Tenaris financed the construction and operation of Techgen’s Pesquería project primarily in the form of subordinated loans to Techgen. Outstanding principal amount of loans to Techgen as of December 31, 2023, amounted to $62 million and as of December 31, 2022 and 2021 amounted to $58 million. These loans generated interest gains in favor of Tenaris in an amount of $6 million in 2023, $4 million in 2022 and $3 million in 2021.
Dividends from Related Parties
Tenaris received dividend payments from Ternium in an amount of $67 million in 2023, $62 million in 2022 and $67 million in 2021.
Tenaris received dividend payments from Usiminas in an amount of $3 million in 2023, $2 million in 2022 and $12 million in 2021.
Dividends to Related Parties
Tenaris distributed dividends to Techint Holdings in an amount of $385 million in 2023, $321 million in 2022 and $193 million in 2021.
Other Transactions
We entered into various contracts with Tenova (or certain of its subsidiaries), a company controlled by San Faustin, for the provision of furnaces, spare parts, accessories and related services for our facilities. Supplies received amounted to $19 million in 2023, $8 million in 2022 and $1 million in 2021.
In addition, in the ordinary course of business, from time to time, we carry out other transactions and enter into other arrangements with other related parties, including natural gas transport services, rental services related to the supply of coiled tubing services and information technology services, none of which are considered to be material.
| |
| Annual Report 2023 |
See “Financial Statements” and pages F-1 through F-86 for our audited consolidated financial statements.
Legal Proceedings
Tenaris is from time to time subject to various claims, lawsuits and other legal proceedings, including customer, employee, tax and environmental-related claims, in which third parties are seeking payment for alleged damages, reimbursement for losses, or indemnity. Management with the assistance of legal counsel periodically reviews the status of each significant matter and assesses potential financial exposure.
Some of these claims, lawsuits and other legal proceedings involve highly complex issues, and often these issues are subject to substantial uncertainties and, therefore, the probability of loss and an estimation of damages are difficult to ascertain. Accordingly, with respect to a large portion of such claims, lawsuits and other legal proceedings, the Company is unable to make a reliable estimate of the expected financial effect that will result from ultimate resolution of the proceeding. In those cases, the Company has not accrued a provision for the potential outcome of these cases.
If a potential loss from a claim, lawsuit or other proceeding is considered probable and the amount can be reasonably estimated, a provision is recorded. Accruals for loss contingencies reflect a reasonable estimate of the losses to be incurred based on information available to management as of the date of preparation of the financial statements and take into consideration litigation and settlement strategies. In a limited number of ongoing cases, the Company was able to make a reliable estimate of the expected loss or range of probable loss and, depending on the likelihood of occurrence, in some of such cases has accrued a provision for such loss but believes that publication of this information on a case-by-case basis would seriously prejudice the Tenaris’s position in the ongoing legal proceedings or in any related settlement discussions. Accordingly, in these cases, the Company has disclosed information with respect to the nature of the contingency but has not disclosed its estimate of the range of potential loss.
The Company believes that the aggregate provisions recorded for potential losses in its consolidated financial statements (see notes 24 “Non-current allowances and provisions” and 25 “Current allowances and provisions” to our audited consolidated financial statements included in this annual report) are adequate based upon currently available information. However, if management’s estimates prove incorrect, current reserves could be inadequate and the Company could incur a charge to earnings which could have a material adverse effect on its results of operations, financial condition, net worth and cash flows.
Material Legal Proceedings
A summary description of Tenaris’s material outstanding legal proceedings as of December 31, 2023, is included in note 27 “Contingencies, commitments and restrictions to the distribution of profits” to our audited consolidated financial statements included in this annual report, which summary description is incorporated herein by reference. In addition, Tenaris is subject to other legal proceedings, none of which is believed to be material.
Dividend Policy
The Company does not have, and has no current plans to establish, a formal dividend policy governing the amount and payment of dividends or other distributions. For a description of the shareholders’ and holders of ADS’ rights to receive dividends and the conditions to declare and pay dividends, please refer to “Corporate Governance Statement – Corporate Governance”.
The following table shows the dividends approved by the Company’s shareholders in the last five years:
|
|
Approved dividend |
Dividend payment date | |||
|
Shareholders’ meeting date |
Amount (USD million) |
Per share (USD) |
Per ADS (USD) |
Interim Dividend |
Dividend Balance |
|
May 6, 2019 |
484 |
0.41 |
0.82 |
November 2018 |
May 2019 |
|
June 2, 2020 |
153 |
0.13 |
0.26 |
November 2019 |
NA |
|
May 3, 2021 |
248 |
0.21 |
0.42 |
November 2020 |
May 2021 |
|
May 3, 2022 |
484 |
0.41 |
0.82 |
November 2021 |
May 2022 |
|
May 3, 2023 |
602 |
0.51 |
1.02 |
November 2022 |
May 2023 |
| |
| Annual Report 2023 |
On February 21, 2024, the Company’s board of directors proposed, for the approval of the annual general shareholders’ meeting scheduled to be held on April 30, 2024, the payment of an annual dividend of $0.60 per share ($1.20 per ADS), or approximately $700 million, which includes the interim dividend of $0.20 per share ($0.40 per ADS) or approximately $235 million, paid on November 22, 2023. If the annual dividend is approved by the shareholders, a dividend of $0.40 per share ($0.80 per ADS), or approximately $465 million will be paid on May 22, 2024, with an ex-dividend date of May 20, 2024. Treasury shares are not entitled to dividend distributions.
The shares are listed on the Mexican Stock Exchange and its ADSs are listed on the NYSE under the symbol “TS”. The shares are also listed on the Italian Stock Exchange under the symbol “TEN”. Trading on the NYSE and the Mexican Stock Exchange began on December 16, 2002, and trading on the Italian Stock Exchange began on December 17, 2002.
As of February 29, 2024, a total of 1,180,536,830 shares were registered in the Company’s shareholder register (including 21,870,189 shares that have been repurchased by the Company under its share buyback program). As of February 29, 2024, a total of 140,768,752 shares were registered in the name of the Depositary for the Company’s ADS program.
Many of the countries that are important markets for us or in which we have substantial assets have histories of substantial government intervention in currency markets, volatile exchange rates and government-imposed currency controls. These include mainly Argentina, Brazil, Indonesia, Mexico, Nigeria and Romania.
The exchange rate of the ARS against the U.S. dollar was subject to a devaluation of approximately 356% against the U.S. dollar during 2023.
Between September 2019 and December 2023, the Argentine government imposed significant restrictions on foreign exchange transactions; however, the new administration in Argentina eased certain restrictions and other changes to such regulations are expected. At the date of this annual report, the application of existing foreign exchange regulations remains uncertain, and the scope and timing of upcoming changes remain unknown. Currently, Argentine companies are required to repatriate export proceeds from sales of goods and services (including U.S. dollars obtained through advance payment and pre-financing facilities) and convert such proceeds into ARS at the official exchange rate. As from December 13, 2023, up to 20% of export proceeds can be sold for Argentine pesos through securities transactions resulting in a higher implicit exchange rate as explained below. This percentage has changed and is expected to change over time. Sovereign bonds were issued to pay imports of goods cleared and services rendered on or prior to December 12, 2023, but such bonds cover only a portion total import debts. Import payments for services rendered and goods cleared after December 12, 2023, do not require government approval but cannot be paid in advance or at sight and are subject to deferred payment schedules. In addition, import payments are subject to import taxes that significantly increase prices of imported goods and services. Argentine companies must still obtain prior Central Bank authorization, which is rarely (if ever) granted, to access the foreign exchange market to make dividend payments.
The existing measures substantially limit the ability of Argentine companies to obtain foreign currency and make certain payments and distributions out of Argentina at the official exchange rate. Access to foreign currency and transfers out of Argentina can be achieved, however, through securities transactions involving bonds or shares with multiple listings, resulting in a different implicit exchange rate, generally higher than the official exchange rate. Such transactions are subject to certain restrictions and limits, which change from time to time, and often result in a financial loss being generated at the time of making any such transaction.
As of December 31, 2023, the total net equity of Argentine subsidiaries represented approximately 9% of Tenaris’s total equity.
For additional information regarding factors affecting the Argentine economy, see “Key Information – Risk Factors – Risks Relating to our Business and Industry – Adverse economic or political conditions in the countries where we operate or sell our products and services may decrease our sales or disrupt our manufacturing operations, thereby adversely affecting our revenues, profitability and financial condition”. For additional information on current foreign exchange restrictions in Argentina, see note 29 “Foreign exchange control measures in Argentina” of our audited consolidated financial statements included in this annual report.
The following discussion of the material Luxembourg and U.S. federal income tax consequences of an investment in our shares and ADSs is based upon laws and relevant interpretations thereof in effect as of the date of this annual report, all of which are subject to change. This discussion does not address all possible tax consequences relating to an investment in our shares or ADSs, including the tax consequences under U.S. state and local tax laws.
| |
| Annual Report 2023 |
Grand Duchy of Luxembourg
This section describes the material Luxembourg tax consequences of owning or disposing of shares or ADSs.
It is not intended to be, nor should it be construed to be, legal or tax advice. You should, therefore, consult your own tax advisor regarding local or foreign tax consequences, including Luxembourg tax consequences of owning and disposing of shares or ADSs in your particular circumstances.
As used herein, a “Luxembourg individual” means an individual resident in Luxembourg who is subject to personal income tax (impôt sur le revenu) on his or her worldwide income from Luxembourg or foreign sources, and a “Luxembourg corporate holder” means a company (that is, a fully taxable collectivité within the meaning of Article 159 of the Luxembourg Income Tax Law) resident in Luxembourg subject to Luxembourg corporate income tax (impôt sur le revenu des collectivités) and Luxembourg municipal business tax (impôt commercial communal) on its worldwide income from Luxembourg or foreign sources. For the purposes of this summary, Luxembourg individuals and Luxembourg corporate holders are collectively referred to as “Luxembourg Holders”. A “non-Luxembourg Holder” means any investor in shares or ADSs of the Company other than a Luxembourg Holder.
Corporate Reorganization
The Company was established as a Luxembourg société anonyme holding under Luxembourg’s 1929 holding company regime. Until termination of such regime on December 31, 2010, holding companies incorporated under the 1929 regime (including the Company) were exempt from Luxembourg corporate income tax, Luxembourg municipal business tax, Luxembourg net wealth tax and Luxembourg withholding tax over dividends distributed to shareholders.
On January 1, 2011, the Company became an ordinary public limited liability company (société anonyme) and, effective as from that date, the Company is subject to all applicable Luxembourg taxes, (including, among others, Luxembourg corporate income tax on its worldwide income).
In light of the impending termination of Luxembourg’s 1929 holding company regime, in the fourth quarter of 2010, the Company carried out a multi-step corporate reorganization, which included, among other transactions, the contribution of most of the Company’s assets and liabilities to a wholly-owned, newly-incorporated Luxembourg subsidiary and the restructuring of indirect holdings in certain subsidiaries. The first phase of the corporate reorganization was completed in December 2010 and resulted in a non-taxable revaluation of the accounting value (under Luxembourg GAAP) of the Company’s assets. The second phase of the reorganization was completed in 2011.
Following the completion of the first phase of the corporate reorganization, and upon its conversion into an ordinary Luxembourg holding company, the Company recorded a special reserve in its tax balance sheet. Dividend distributions for the foreseeable future will be charged to the special reserve and therefore should not be subject to Luxembourg withholding tax.
Tax regime applicable to realized capital gains
Luxembourg Holders
Luxembourg resident individual holders
Capital gains realized by Luxembourg resident individuals who do not hold their shares or ADSs as part of a trade or business (i.e. capital gains on private assets) and who hold (together, directly or indirectly, with his or her spouse or civil partner and underage children) no more than 10% of the share capital of the Company, at any time during the five-year period preceding the disposition will only be taxable (at a progressive rate) if they are realized on a sale of shares or ADSs that takes place before their acquisition or within the first six months following their acquisition (i.e. speculative gain). After the six-month period, capital gains are not taxed unless the resident individual holds (together, directly or indirectly, with his or her spouse or civil partner and underage children) more than 10% of the share capital of the Company at any time during the five-year period preceding the disposition.
If such shares or ADSs are held as part of a commercial or industrial business, capital gains would be taxable in the same manner as income from such business.
| |
| Annual Report 2023 |
Capital gains realized by Luxembourg resident individuals holding (alone or together with the resident’s spouse or civil partner and underage children) directly or indirectly more than 10% of the capital of the Company at any time during the five years prior to the sale, (or if the Luxembourg resident individuals have received the shares for no consideration within the last five years and the former holder held at least 10% in the capital of the company at any moment during said five years) will be taxable at half of the individual’s applicable global tax rate (as determined progressively), if a holding period of six months following their acquisition elapsed (21% for 2023). Within the six-month period, progressive income tax rates apply (ranging from 0 to 42% 7 in 2023).
Luxembourg resident corporate holders
Capital gains, including currency exchange gains, realized upon the disposal of shares or ADSs by a fully taxable resident corporate holder will in principle be subject to Luxembourg corporate income tax and Luxembourg municipal business tax. The combined applicable rate (including an unemployment fund contribution) for a corporate holder established in Luxembourg-City is 24.94% for the fiscal year ending 2023. An exemption from such taxes may be available to the Luxembourg resident corporate holder pursuant to Article 1 of the Grand Ducal Decree dated December 21, 2001, as amended, in combination with article 166 of the Luxembourg Income Tax Law subject to the fulfillment of the conditions set forth therein.
Non-Luxembourg Holders
Non-Luxembourg individual holders
An individual who is a non-Luxembourg holder of shares or ADSs (and who does not have a permanent establishment, a permanent representative or a fixed place of business in Luxembourg) will only be subject to Luxembourg taxation on capital gains arising upon disposal of such shares or ADSs if such holder has (alone or together with his or her spouse, civil partner and underage children) directly or indirectly held more than 10% of the capital of the Company at any time during the past five years preceding the disposal, and either (i) such non-Luxembourg holder has been a resident of Luxembourg for tax purposes for at least 15 years and has become a non-resident within the last five years preceding the realization of the gain, subject to any applicable tax treaty, or (ii) the disposal of shares or ADSs occurs within six months from their acquisition (or prior to their actual acquisition), subject, however, to any applicable tax treaty.
Non-Luxembourg corporate holders
A corporate non-Luxembourg holder (that is, a collectivité within the meaning of Article 159 of the Luxembourg Income Tax Law), which has a permanent establishment, a permanent representative or a fixed place of business in Luxembourg to which shares or ADSs are attributable, will bear Luxembourg corporate income tax and Luxembourg municipal business tax on a gain realized on a disposal of such shares or ADSs as set forth above for a Luxembourg corporate holder. However, capital gains, including currency exchange gains, realized on the sale of the shares or ADSs may benefit from the full exemption provided for by Article 1 of the Grand Ducal Decree dated December 21, 2001, as amended, in combination with Article 166 of the Luxembourg Income Tax Law subject in each case to fulfillment of the conditions set out therein.
A corporate non-Luxembourg holder, which has no permanent establishment, permanent representative or fixed place of business in Luxembourg to which the shares or ADSs are attributable, will bear non-resident capital gains tax on a gain realized on a disposal of such shares or ADSs under the same conditions applicable to an individual non-Luxembourg holder, as set out above.
Tax regime applicable to distributions
Withholding tax
Distributions to holders are in principle subject to a 15% Luxembourg withholding tax computed on the gross amount distributed. The rate of the withholding tax may be reduced pursuant to double tax treaties existing between Luxembourg and the country of residence of the relevant holder, subject to the fulfillment of the conditions set forth therein. However, distributions imputed for tax purposes to the special reserve (please see above paragraph “corporate reorganization”) should be exempt from Luxembourg withholding tax under the current tax law.
| 7 A 7% surcharge for the Employment Fund applies on the income tax due. The surcharge for the Employment Fund amounts to 9% for taxpayer in tax class 1 or 1a with taxable income exceeding EUR 150,000 (EUR 300,000 for taxpayer in tax class 2). | |
| |
| Annual Report 2023 |
Nevertheless, a withholding tax exemption may apply if the distribution is made to (as far as relevant in the case at hand):
- a Luxembourg resident corporate holder (that is, a fully taxable collectivité within the meaning of article 159 of the Luxembourg Income Tax Law);
- an undertaking of collective character which is resident of a Member State of the European Union and is referred to by article 2 of the EU Council Directive of November 30, 2011, concerning the common fiscal regime applicable to parent and subsidiary companies of different member states (2011/96/UE) as amended, (subject to the general anti-abuse rule provided for by Council Directive 2015/121/EU as implemented into Luxembourg law);
- a capital company or a cooperative company resident in Norway, Iceland or Liechtenstein and subject to a tax comparable to corporate income tax as provided by the Luxembourg Income Tax Law;
- a capital company resident in Switzerland which is subject to corporate income tax in Switzerland without benefiting from an exemption;
- an undertaking with a collective character subject to a tax comparable to corporate income tax as provided by the Luxembourg Income Tax Law which is resident in a country that has concluded a double tax treaty with Luxembourg; and
- a Luxembourg permanent establishment of one of the above-mentioned categories, provided each time that at the date of payment, the holder holds or commits to hold directly (or through a company regarded as tax transparent from a Luxembourg tax perspective), during an uninterrupted period of at least twelve months, shares or ADSs representing at least 10% of the share capital of the Company or acquired for an acquisition price of at least EUR 1,200,000.
Luxembourg Holders
With the exception of Luxembourg corporate holders benefiting from the exemption referred to above, Luxembourg individual holders, and Luxembourg corporate holders fully subject to Luxembourg corporate tax, must include the distributions paid on the shares or ADSs in their taxable income, 50% of the amount of such dividends being exempt from tax. The applicable withholding tax can, under certain conditions, entitle the relevant Luxembourg Holder to a tax credit.
Non-Luxembourg Holders
Non-Luxembourg Holders of shares or ADSs and who do not have a permanent establishment, a permanent representative or a fixed place of business in Luxembourg to which the shares or ADSs would be attributable are not liable for any Luxembourg tax on dividends paid on the shares or ADSs, other than a potential withholding tax as described above.
Net wealth tax
Luxembourg Holders
Luxembourg net wealth tax will not be levied on a Luxembourg holder with respect to the shares or ADSs held unless (i) the Luxembourg holder is a legal entity subject to net wealth tax in Luxembourg; or (ii) the shares or ADSs are attributable to an enterprise or part thereof which is carried on through a permanent establishment, a fixed place of business or a permanent representative in Luxembourg.
Net wealth tax is levied annually at the rate of 0.5% for taxable net wealth not exceeding EUR 500,000,000 and at a rate of 0.05% for the net wealth exceeding EUR 500,000,000, of enterprises resident in Luxembourg, as determined for net wealth tax purposes. The shares or ADSs may be exempt from net wealth tax subject to the conditions set forth by Paragraph 60 of the Luxembourg Law of October 16, 1934, on the valuation of assets (Bewertungsgesetz), as amended.
A minimum net wealth tax charge applies as of January 1, 2016, for all corporate entities having their statutory seat or central administration in Luxembourg. Subject to certain conditions, the amount of minimum net wealth tax may vary.
| |
| Annual Report 2023 |
Non-Luxembourg Holders
Luxembourg net wealth tax will not be levied on a non-Luxembourg holder with respect to the shares or ADSs held unless the shares or ADSs are attributable to an enterprise or part thereof which is carried on through a permanent establishment or a permanent representative in Luxembourg. The shares or ADSs may be exempt from net wealth tax subject to the conditions set forth by Paragraph 60 of the Luxembourg Law of October 16, 1934 on the valuation of assets (Bewertungsgesetz), as amended.
Stamp and registration taxes
No registration tax or stamp duty will be payable by a holder of shares or ADSs in Luxembourg solely upon the disposal of shares or ADSs by sale or exchange.
Estate and gift taxes
No estate or inheritance tax is levied on the transfer of shares or ADSs upon the death of a holder of shares or ADSs in cases where the deceased was not a resident of Luxembourg for inheritance tax purposes and no gift tax is levied upon a gift of shares or ADSs if the gift is not passed before a Luxembourg notary or recorded in a deed registered in Luxembourg.
Where a holder of shares or ADSs is a resident of Luxembourg for tax purposes at the time of the holder’s death, the shares or ADSs are included in its taxable estate for inheritance tax or estate tax purposes.
U.S. federal income taxation
This section describes the material U.S. federal income tax consequences to a U.S. holder (as defined below) of owning shares or ADSs. It applies to you only if you hold your shares or ADSs as capital assets for U.S. federal income tax purposes. This discussion addresses only U.S. federal income taxation and does not discuss all of the tax consequences that may be relevant to you in light of your individual circumstances, including foreign, state or local tax consequences, estate and gift tax consequences, and tax consequences arising under the Medicare contribution tax on net investment income or the alternative minimum tax. This section does not apply to you if you are a member of a special class of holders subject to special rules, including:
- a dealer in securities;
- a bank;
- a trader in securities that elects to use a mark-to-market method of accounting for securities holdings;
- a tax-exempt organization;
- a person who invests through a pass-through entity, including a partnership;
- a life insurance company;
- a person that actually or constructively owns 10% or more of the combined voting power of our voting stock or of the total value of our stock (including ADSs);
- a person that holds shares or ADSs as part of a straddle or a hedging or conversion transaction for U.S. federal income tax purposes;
- a person that purchases or sells shares or ADSs as part of a wash sale for U.S. federal income tax purposes; or
- a person whose functional currency is not the U.S. dollar.
This section is based on the Internal Revenue Code of 1986, as amended, its legislative history, existing and proposed regulations, published rulings and court decisions, all as currently in effect, as well as on the Convention between the Government of the Grand Duchy of Luxembourg and the Government of the United States of America for the Avoidance of Double Taxation and the Prevention of Fiscal Evasion with respect to Taxes on Income and Capital (the “Treaty”). These laws are subject to change, possibly on a retroactive basis. In addition, this section is based in part upon the assumption that each obligation in the ADS deposit agreement and any related agreement will be performed in accordance with its terms.
| |
| Annual Report 2023 |
If an entity or arrangement that is treated as a partnership for U.S. federal income tax purposes holds the shares or ADSs, the U.S. federal income tax treatment of a partner will generally depend upon the status of the partner and the activities of the partnership. Each such partner of a partnership that holds the shares or ADSs is urged to consult his, her or its own tax advisor.
You are a U.S. holder if you are a beneficial owner of shares or ADSs and you are, for U.S. federal income tax purposes:
- an individual citizen or resident of the United States;
- a domestic corporation (or an entity treated as a domestic corporation);
- an estate whose income is subject to U.S. federal income tax regardless of its source; or
- a trust if (i) a U.S. court can exercise primary supervision over the trust’s administration and one or more U.S. persons are authorized to control all substantial decisions of the trust or (ii) the trust has a valid election in effect under applicable U.S. Treasury regulations to be treated as a U.S. person.
In general, and taking into account the earlier assumptions, for U.S. federal income tax purposes, if you hold ADSs, you will be treated as the owner of the shares represented by those ADSs. Exchanges of shares for ADSs, and ADSs for shares, generally will not be subject to U.S. federal income tax.
The tax treatment of your shares or ADSs will depend in part on whether or not we are classified as a passive foreign investment company (“PFIC”), for United States federal income tax purposes. Except as discussed below under “PFIC Rules”, this discussion assumes that we are not classified as a PFIC for United States federal income tax purposes.
You should consult your own tax advisor regarding the U.S. federal, state and local and other tax consequences of owning and disposing of shares or ADSs in your particular circumstances.
Taxation of distributions
Under the U.S. federal income tax laws, if you are a U.S. holder, the gross amount of any distribution we pay out of our current or accumulated earnings and profits (as determined for U.S. federal income tax purposes), other than certain pro-rata distributions of our shares, will be treated as a dividend that is subject to U.S. federal income taxation. If you are a non-corporate U.S. holder, dividends paid to you that constitute qualified dividend income will be taxable to you at the preferential rates applicable to long-term capital gains provided that you hold shares or ADSs for more than 60 days during the 121-day period beginning 60 days before the ex-dividend date and meet other holding period requirements. Dividends we pay with respect to the shares or ADSs generally will be qualified dividend income, provided that, in the year that you receive the dividend, we are eligible for the benefits of the Treaty. We believe that we are currently eligible for the benefits of the Treaty and therefore expect that dividends on the shares or ADSs will be qualified dividend income, but there can be no assurance that we will continue to be eligible for the benefits of the Treaty.
You must generally include any Luxembourg tax withheld from the dividend payment in this gross amount even though you do not in fact receive it. The dividend is taxable to you when you receive it, or, in the case of ADSs, when the Depositary receives the dividend, actually or constructively. The dividend will not be eligible for the dividends-received deduction generally allowed to U.S. corporations in respect of dividends received from other U.S. corporations. Distributions in excess of current and accumulated earnings and profits, as determined for U.S. federal income tax purposes, will be treated as a non-taxable return of capital to the extent of your basis in the shares or ADSs and thereafter as capital gain. However, we do not expect to calculate earnings and profits in accordance with U.S. federal income tax principles. Therefore, you should expect that a distribution will generally be treated as a dividend (as discussed above).
Dividends will generally be income from sources outside the United States and, generally, will be “passive” income for purposes of computing the foreign tax credit allowable to you.
Subject to certain limitations, the Luxembourg tax withheld in accordance with the Treaty and paid over to Luxembourg may be creditable or deductible against your U.S. federal income tax liability. However, under recently finalized U.S. Treasury regulations, it is possible that taxes may not be creditable unless you are eligible for and elect to apply the benefits of the Treaty. Special rules apply in determining the foreign tax credit limitation with respect to dividends that are subject to the preferential tax rates. To the extent a refund of the tax withheld is available to you under Luxembourg law or under the Treaty, the amount of tax withheld that is refundable will not be eligible for credit against your U.S. federal income tax liability.
| |
| Annual Report 2023 |
In certain circumstances, if you have held ADSs for less than a specified minimum period during which you are not protected from risk of loss, or are obligated to make payments related to the dividends, you will not be allowed a foreign tax credit for foreign taxes imposed on dividends that we pay.
The rules governing the foreign tax credit are complex. You are urged to consult your tax advisors regarding the availability of the foreign tax credit under your particular circumstances.
Taxation of capital gains
If you are a U.S. holder and you sell or otherwise dispose of your shares or ADSs, you will recognize capital gain or loss for U.S. federal income tax purposes equal to the difference between the U.S. dollar value of the amount that you realize and your tax basis, determined in U.S. dollars, in your shares or ADSs. Capital gain of a non-corporate U.S. holder is generally taxed at preferential rates where the property is held for more than one year. The gain or loss will generally be income or loss from sources within the United States for foreign tax credit limitation purposes. The deductibility of capital losses is subject to limitations.
PFIC rules. Based on the Company’s current and expected income and assets, we believe that the shares or ADSs should not currently be treated as stock of a PFIC for U.S. federal income tax purposes, and we do not expect to become a PFIC in the foreseeable future. However, this conclusion is a factual determination that is made annually and thus may be subject to change. It is therefore possible that we could become a PFIC in a future taxable year. If we were to be treated as a PFIC, gain realized on the sale or other disposition of your shares or ADSs would in general not be treated as capital gain. Furthermore, if you are a U.S. holder, unless you are permitted to elect and you do elect to be taxed annually on a mark-to-market basis with respect to the shares or ADSs, upon sale or disposition of your shares or ADSs, you would generally be treated as if you had realized such gain and certain “excess distributions” ratably over your holding period for the shares or ADSs and would be taxed at the highest tax rate in effect for each such year to which the gain was allocated, together with an interest charge in respect of the tax attributable to each such year. With certain exceptions, your shares or ADSs will be treated as stock in a PFIC if we were a PFIC at any time during your holding period in your shares or ADSs. Dividends that you receive from us will not be eligible for the special tax rates applicable to qualified dividend income if we are a PFIC (or are treated as a PFIC with respect to you) either in the taxable year of the distribution or the preceding taxable year, but instead will be taxable at rates applicable to ordinary income and subject to the excess distribution regime described above.
Documents on Display
The Company is subject to the reporting requirements of the Exchange Act, as applied to foreign private issuers. Accordingly, the Company is required to file annual and special reports and other information with the SEC; however, foreign private issuers are not required to deliver proxy statements or to file quarterly reports. We prepare quarterly and annual consolidated financial statements in accordance with IFRS. The Company’s annual consolidated financial statements are audited by an independent accounting firm. The Company submits quarterly financial information with the SEC on Form 6-K simultaneously with or promptly following the publication of such information in Luxembourg and any other jurisdiction in which the Company’s securities are listed. In addition, the Company files annual reports on Form 20-F within the time period required by the SEC, which is currently four months from the close of the Company’s fiscal year on December 31. Reports and other information filed electronically with the SEC are available at the SEC’s Internet website at http://www.sec.gov. In addition, such reports and other communications are made available to all shareholders and holders of ADSs on the Company’s website at: https://ir.tenaris.com/investor-relations.
For the year ended December 31, 2023, Deutsche Bank Trust Company Americas acted as depositary under the ADSs deposit agreement. As long as the deposit agreement remains in effect, the Company will furnish the Depositary with:
- its annual reports; and
- copies of all notices of shareholders’ meetings and other reports and communications that are made generally available to the Company’s shareholders.
The Depositary will, as provided in the deposit agreement and if requested in writing by the Company, arrange for the mailing of such reports, notices and communications to all record holders of ADSs, on a basis similar to that for holders of shares, or on such other basis as the Company may advise the Depositary may be required by any applicable law or regulation or any requirement of any stock exchange to which the Company may be subject. Any reports and communications, including any proxy solicitation material, shall be furnished in English to the extent such materials are required to be translated into English pursuant to any regulations of the SEC.
| |
| Annual Report 2023 |
Any record holder of ADSs may read the reports, notices, and other communications including any proxy solicitation material at the Depositary’s office located at One Columbus Circle, New York, New York 10019.
In addition, such reports, notices and other communications are made available to all shareholders and holders of ADSs on the Company’s website at: https://ir.tenaris.com/investor-relations
Whenever a reference is made in this annual report to a contract or other document, please be aware that such reference is not necessarily complete and that you should refer to the exhibits that are a part of this annual report for a copy of the contract or other document.
The multinational nature of our operations and customer base expose us to a variety of risks, including the effects of changes in foreign currency exchange rates, interest rates and commodity prices. In order to reduce the impact related to these exposures, management evaluates exposures on a consolidated basis to take advantage of natural exposure netting. For the residual exposures, we may enter into various derivative transactions in order to reduce potential adverse effects on our financial performance. Such derivative transactions are executed in accordance with internal policies and hedging practices. We do not enter into derivative financial instruments for trading or other speculative purposes, other than non-material investments in structured products.
The following information should be read together with section III, “Financial risk management” to our audited consolidated financial statements included elsewhere in this annual report.
Debt Structure
The following tables provide a breakdown of our debt instruments at December 31, 2023 and 2022 which included fixed and variable interest rate obligations, detailed by maturity date:
|
At December 31, 2023 |
Expected maturity date |
| |||||
|
(in millions of U.S. dollars) |
2024 |
2025 |
2026 |
2027 |
2028 |
Thereafter |
Total (1) |
|
|
|
|
|
|
|
|
|
|
Non-current Debt |
|
|
|
|
|
|
|
|
Fixed rate |
- |
24 |
- |
- |
- |
- |
24 |
|
Variable rate |
- |
23 |
2 |
- |
- |
- |
25 |
|
|
|
|
|
|
|
|
|
|
Current Debt |
|
|
|
|
|
|
|
|
Fixed rate |
271 |
- |
- |
- |
- |
- |
271 |
|
Variable rate |
264 |
- |
- |
- |
- |
- |
264 |
|
|
535 |
47 |
2 |
- |
- |
- |
583 |
|
At December 31, 2022 |
Expected maturity date |
| |||||
|
(in millions of U.S. dollars) |
2023 |
2024 |
2025 |
2026 |
2027 |
Thereafter |
Total (1) |
|
|
|
|
|
|
|
|
|
|
Non-current Debt |
|
|
|
|
|
|
|
|
Fixed rate |
- |
19 |
- |
- |
- |
- |
19 |
|
Variable rate |
- |
23 |
3 |
2 |
- |
- |
28 |
|
|
|
|
|
|
|
|
|
|
Current Debt |
|
|
|
|
|
|
|
|
Fixed rate |
479 |
- |
- |
- |
- |
- |
479 |
|
Variable rate |
203 |
- |
- |
- |
- |
- |
203 |
|
|
682 |
42 |
3 |
2 |
- |
- |
729 |
(1) As most borrowings are based on short-term fixed rates, or variable rates that approximate market rates, with interest rate resetting every 3 to 6 months, the fair value of the borrowings approximates its carrying amount and is not disclosed separately.
| |
| Annual Report 2023 |
Our weighted average interest rates before tax (considering hedge accounting), amounted to 10.56% at December 31, 2023 and to 9.45% at December 31, 2022.
Our financial liabilities (other than trade payables and derivative financial instruments) consist mainly of bank loans. As of December 31, 2023, U.S. dollar denominated financial debt plus debt denominated in other currencies swapped to the U.S. dollar represented 60% of total financial debt.
For further information about our financial debt, please see note 21 “Borrowings” to our audited consolidated financial statements included in this annual report.
Interest Rate Risk
Fluctuations in market interest rates create a degree of risk by affecting the amount of our interest payments. At December 31, 2023, we had variable interest rate debt of $288 million and fixed rate debt of $295 million (of the fixed rate debt, $271 million is short-term).
Foreign Exchange Rate Risk
We manufacture and sell our products in a number of countries throughout the world and consequently we are exposed to foreign exchange rate risk. Since the Company’s functional currency is the U.S. dollar, the purpose of our foreign currency hedging program is mainly to reduce the risk caused by changes in the exchange rates of other currencies against the U.S. dollar.
Most of our revenues are determined or influenced by the U.S. dollar. In addition, a relevant part of our costs corresponds to steelmaking raw materials and steel coils and plates, also determined or influenced by the U.S. dollar. However, outside the United States, a portion of our expenses is incurred in foreign currencies (e.g. labor costs). Therefore, when the U.S. dollar weakens in relation to the foreign currencies of the countries where we manufacture our products, the U.S. dollar-reported expenses increase. Had the U.S. dollar average exchange rate been weaker by 5% against the currencies of the countries where we have labor costs, operating income would have decreased approximately by $71 million in 2023, compared to $60 million in 2022.
Our consolidated exposure to currency fluctuations is reviewed on a periodic basis. A number of hedging transactions are performed in order to achieve an efficient coverage in the absence of operative or natural hedges. Almost all of these transactions are forward exchange rate contracts.
Because certain subsidiaries have functional currencies other than the U.S. dollar, the results of hedging activities as reported in the income statement under IFRS may not reflect entirely management’s assessment of its foreign exchange risk hedging needs. Also, intercompany balances between our subsidiaries may generate exchange rate results to the extent that their functional currencies differ.
The value of our financial assets and liabilities is subject to changes arising out of the variation of foreign currency exchange rates. The following table provides a breakdown of our main financial assets and liabilities (including foreign exchange derivative contracts) that impact our profit and loss as of December 31, 2023.
|
All amounts in millions of U.S. dollars |
| |
|
Currency Exposure |
Functional currency |
Long / (Short) Position |
|
|
|
|
|
Argentine Peso |
U.S. dollar |
(135) |
|
Euro |
U.S. dollar |
(204) |
|
Saudi Arabian Riyal |
U.S. dollar |
(182) |
|
|
|
|
The main relevant exposures as of December 31, 2023, were to ARS-denominated financial, trade, social and fiscal payables at our Argentine subsidiaries, for which the functional currency is the U.S. dollar, Euro-denominated intercompany liabilities at certain subsidiaries whose functional currency is the U.S. dollar and Saudi Arabian Riyal-denominated financial and trade payables. The Saudi Arabian Riyal is tied to the dollar.
Foreign Currency Derivative Contracts
The net fair value of our foreign currency derivative contracts amounted to a liability of $2 million at December 31, 2023 and an asset of $27 million at December 31, 2022. For further detail on our foreign currency derivative contracts, please see note 26 “Derivative financial instruments – Foreign exchange and commodities derivative contracts and hedge accounting” to our audited consolidated financial statements included in this annual report.
| |
| Annual Report 2023 |
Concentration of Credit Risk
No single customer comprised more than 10% of our net sales in 2023, 2022 and 2021.
Tenaris maintains a strong, longstanding relationship with Pemex, one of the world’s largest crude oil and condensates producers and one of its largest customers. Over the past several months, Pemex has delayed payments beyond the agreed-upon due dates, resulting in Tenaris having a significant credit exposure to Pemex, which represented approximately 20% of the Company’s overall credit exposure as of December 31, 2023. The Company has not historically had any material write-offs due to uncollectible accounts receivable relating to this customer. Although the parties are in continuous conversations and Pemex is making partial payments on a periodic basis, at this stage the Company cannot predict whether or not its exposure to Pemex will be reduced, or the timing for any such reduction.
Our credit policies related to sales of products and services are designed to identify customers with acceptable credit history, and to allow us to use credit insurance, letters of credit and other instruments designed to minimize credit risk whenever deemed necessary. We maintain allowances for potential credit losses.
Commodity Price Risk
In the ordinary course of its operations, Tenaris purchases commodities and raw materials that are subject to price volatility caused by supply conditions, political and economic variables and other factors. As a consequence, Tenaris is exposed to risk resulting from fluctuations in the prices of these commodities and raw materials. Tenaris fixes the prices of such raw materials and commodities for short-term periods, typically not in excess of one year, and in general hedging for these risks is performed on a limited basis.
Commodities Derivative Contracts
The net fair value of our commodities derivative contracts amounted to an asset of $0.2 million at December 31, 2023 and a liability of $3.4 million at December 31, 2022. For further detail on our commodities derivative contracts, please see note 26 “Derivative financial instruments – Foreign exchange and commodities derivative contracts and hedge accounting” to our audited consolidated financial statements included in this annual report.
Accounting for Derivative Financial Instruments and Hedging Activities
Derivative financial instruments are classified as financial assets (or liabilities) at fair value through profit or loss. Their fair value is calculated using standard pricing techniques and, as a general rule, we recognize the full amount related to the change in its fair value under financial results in the current period.
We designate for hedge accounting certain derivatives and non-derivative financial liabilities to hedge risks associated with recognized assets, liabilities or highly probable forecast transactions. These instruments are classified as cash flow hedges. The effective portion of the fair value of such derivatives is accumulated in a reserve account in equity. Amounts accumulated in equity are then recognized in the income statement in the same period when the offsetting losses and gains on the hedged item are recorded. The gain or loss relating to the ineffective portion is recognized immediately in the income statement. The fair value of our derivative financial instruments (assets or liabilities) continues to be reflected on the consolidated statement of financial position.
At December 31, 2023 and 2022 the effective portion of designated cash flow hedges, included in other reserves in shareholders’ equity amounted to a credit of $8.1 million and a credit of $13.1 million respectively.
| |
| Annual Report 2023 |
According to the Company’s deposit agreement, holders of ADSs may have to pay to the Depositary, either directly or indirectly, fees or charges up to the amounts set forth below:
- a fee of $5.00 (or less) per 100 ADSs (or portion of 100 ADSs) for: issuance of ADSs, including issuances resulting from a distribution of shares or rights or other property; and cancellation of ADSs for the purpose of withdrawal, including if the deposit agreement terminates;
- a fee of $0.02 (or less) per ADSs for any cash distribution to ADS registered holders, excluding cash dividend;
- any charges for taxes and other governmental charges that the Depositary or the custodian may be required to pay on any ADS or share underlying an ADS (e.g., share transfer taxes, stamp duty or withholding taxes); and any charges incurred by the Depositary or its agents for servicing the depositary securities;
- registration or transfer fees for transfer and registration of shares on our share register to or from the name of the Depositary or its agent when you deposit or withdraw shares;
- expenses of the Depositary for cable, telex and facsimile transmissions (when expressly provided in the deposit agreement) and conversion of foreign currency;
- a fee equivalent to the fee that would be payable if securities distributed to ADS holders had been shares and the shares had been deposited for issuance of ADSs for distribution of securities distributed to holders of deposited securities which are distributed by the Depositary to ADS registered holders; and
- as necessary, charges for any costs incurred by the Depositary or its agents for servicing the deposited securities.
The Depositary collects its fees for delivery and surrender of ADSs directly from investors depositing shares or surrendering ADSs for the purpose of withdrawal or from intermediaries acting for them. The Depositary collects fees for making distributions to investors by deducting those fees from the amounts distributed or by selling a portion of distributable property to pay the fees. The Depositary may collect its annual fee for depositary services by deduction from cash distributions or by directly billing investors or by charging the book-entry system accounts of participants acting for them. The Depositary may generally refuse to provide fee-attracting services until its fees for those services are paid.
Under the deposit agreement with the Depositary, the Depositary is not liable to holders of ADSs, except that the Depositary agrees to perform its obligations specifically set forth therein without gross negligence and willful misconduct.
Fees Payable by the Depositary to the Company
Under its agreement with the Depositary, the Company is entitled to receive certain fees from the Depositary, based on the Depositary’s revenues resulting from issuance and cancellation fees charged to ADR holders, net of custody and safe keeping costs. In addition, the Depositary has waived the cost of providing administrative and reporting services, and access charges in connection with the Company’s ADR Program.
Fees paid in 2023
In 2023, the Company received from the Depositary fees for an amount of $932,082, corresponding to the period March 13, 2022 through March 12, 2023.
Fees payable during 2024
In 2024, the Company received from the Depositary fees for an amount of $667,139, corresponding to the period March 13, 2023 through March 12, 2024.
| |
| Annual Report 2023 |
Evaluation of Disclosure Controls and Procedures
Under the supervision and with the participation of our management, including the Company’s chief executive officer and chief financial officer, we have evaluated the effectiveness of the design and operation of our disclosure controls and procedures (as such term is defined in Rules 13a-15(e) and 15d-15(e) under the Exchange Act) as of December 31, 2023.
Based on that evaluation, the Company’s chief executive officer and chief financial officer have concluded that, as of December 31, 2023, our disclosure controls and procedures are effective to ensure that information required to be disclosed by us in the reports we file or submit under the Exchange Act is recorded, processed, summarized and reported within the time periods specified in the SEC’s rules and forms and to ensure that such information is accumulated and communicated to management, including the Company’s chief executive officer and chief financial officer, to allow timely decisions regarding required disclosure. Our disclosure controls and procedures are designed to provide reasonable assurance of achieving their objectives. The Company’s chief executive officer and chief financial officer have concluded that our disclosure controls and procedures are effective at a reasonable assurance level.
Management’s Report on Internal Control over Financial Reporting
Management is responsible for establishing and maintaining adequate internal control over financial reporting (as such term is defined in Rules 13a-15(f) and 15d-15(f) under the Exchange Act). Our internal control over financial reporting was designed by management to provide reasonable assurance regarding the reliability of financial reporting and the preparation and fair presentation of its financial statements for external purposes in accordance with IFRS.
In addition, under the Company’s articles of association, as supplemented by the audit committee’s charter, the audit committee assists the board of directors in fulfilling its oversight responsibilities relating to the effectiveness of the Company’s systems of internal control, risk management and internal audit over financial reporting. In particular, the audit committee is required to review the scope and results of the activities of the Company’s external auditors and the internal audit function relating to the Company’s internal control over financial reporting, and obtain reports on significant findings and recommendations; and is also required to assess, at least annually at the time the annual accounts are approved, the effectiveness of the Company’s systems of internal control and risk management over financial reporting.
Because of its inherent limitations, internal control over financial reporting may not prevent or detect misstatements or omissions. In addition, projections of any evaluation of effectiveness to future periods are subject to the risk that controls may become inadequate because of changes in conditions, or that the degree of compliance with the policies or procedures may deteriorate.
On a yearly basis, management conducts its assessment of the effectiveness of Tenaris’s internal control over financial reporting based on the framework in Internal Control- Integrated Framework (2013) issued by the Committee of Sponsoring Organizations of the Treadway Commission.
As allowed under applicable SEC guidance, management’s assessment of internal control over financial reporting excludes the operations of BSIBV and its subsidiaries, which were acquired on November 30, 2023. BSIBV and its subsidiaries total assets and total revenues excluded from management’s assessment of internal control over financial reporting represent approximately 2% and 1%, respectively, of the related consolidated financial statement amounts as of and for the year ended December 31, 2023.
On February 20, 2024, management reported to the Audit Committee of the Company’s board of directors that management had conducted its assessment of the effectiveness of the Company’s internal controls over financial reporting for the year ended December 31, 2023, and that, based on management’s evaluation and considering the inherent limitations to the effectiveness of any internal control system, management had concluded that the Company’s internal controls over financial reporting were effective as of December 31, 2023.
The effectiveness of Tenaris’s internal control over financial reporting as of December 31, 2023, has been audited by PwC, as indicated in its “Report of Independent Registered Public Accounting Firm” included in this annual report.
Attestation Report of Registered Public Accounting Firm
See page F-1 of the audited consolidated financial statements included in this report.
Change in Internal Control over Financial Reporting
There were no changes in our internal control over financial reporting (as such term is defined in Rules 13a -15(f) and 15d -15(f) under the Exchange Act) during the year ended December 31, 2023, that have materially affected, or are reasonably likely to materially affect, our internal control over financial reporting.
| |
| Annual Report 2023 |
The Company’s board of directors has determined that Ms. Monica Tiuba, the audit committee’s chairperson, meets the attributes defined by the SEC for an “audit committee financial expert” and has competence in accounting or auditing matters, as required by applicable Luxembourg law. In addition, the audit committee, as a whole, has sufficient relevant knowledge of the business and financial experience to properly discharge its functions. The audit committee has the authority to engage, at the Company’s expense, independent counsel and other internal or external advisors to review, investigate or otherwise advise on, any matter, as the audit committee may determine to be necessary to carry out its purposes and responsibilities.
The Company has adopted a general code of conduct incorporating guidelines and standards of integrity and transparency applicable to all directors, officers and employees. As far as the nature of each relation permits, all principles detailed in the code of conduct also apply to relations with our contractors, subcontractors, suppliers and associated persons. In addition, the Company has adopted a code of ethics for senior financial officers, which is intended to supplement the Company’s code of conduct, and applies specifically to the principal executive officer, the principal financial officer, the principal accounting officer or controller, as well as persons performing similar functions.
Our code of conduct and our code of ethics for senior financial officers are posted on our website at:
https://www.tenaris.com/en/sustainability/governance-and-ethics/
Principal Accountant Fees
In 2023 and 2022, PwC served as the Company’s statutory auditor. Fees accrued to PwC and other PwC member firms for the years ended December 31, 2023 and December 31, 2022 are detailed below.
|
|
For the year ended December 31, | |
|
Thousands of U.S. dollars |
2023 |
2022 |
|
|
|
|
|
Audit Fees |
4,386 |
3,966 |
|
Audit-Related Fees |
273 |
255 |
|
Tax Fees |
148 |
- |
|
All Other Fees |
14 |
11 |
|
Total |
4,821 |
4,232 |
| |
| Annual Report 2023 |
In addition, PwC member firms rendered $242 thousand for tax services to the pipe coating business acquired from Mattr.
Audit Fees
Audit fees were paid for professional services rendered by the statutory auditors for the audit of the Company’s consolidated financial statements and internal control over financial reporting, the statutory financial statements of the Company and its subsidiaries, and any other audit services required under applicable securities laws, including SEC regulations and other regulatory requirements.
Audit-Related Fees
Audit-related fees are typically services that are reasonably related to the performance of the audit or review of the Company’s consolidated financial statements and the statutory financial statements of the Company and its subsidiaries and are not reported under the audit fee item above. This item includes fees for attestation services on financial information of the Company and its subsidiaries included in their annual reports required to be filed with competent regulators.
Tax Fees
Fees paid for tax compliance professional services.
All Other Fees
Fees paid for the support in the development of training courses.
Audit Committee’s Pre-approval Policies and Procedures
The Company’s Audit Committee is responsible for, among other things, the oversight of the Company’s external auditors. Under its charter, the audit committee is responsible to review the appropriateness of, and approve, in advance, the provision of any permissible non-audit services by the external auditors; and to review and approve any fees, whether for audit, audit-related, or non-audit services payable to the external auditors.
The audit committee makes its recommendations to the shareholders’ meeting concerning the continuing appointment or termination of the Company’s external auditors. On a yearly basis, the audit committee reviews, together with management and the external auditor, the audit plan, audit related services and other permissible non-audit services and approves, ad-referendum of the general shareholders’ meeting, the related fees. With respect to non-audit services, the audit committee annually approves an estimated amount for undetermined non-audit services, conditioned upon final review and approval of such services by the audit committee. The audit committee annually receives from the external auditor the written disclosures required by PCAOB Rule 3524 “Audit Committee Pre-Approval of Certain Tax Services”, together with a description of the scope of tax services for such year, and the external auditors’ confirmation that such non-audit services are consistent with the Sarbanes-Oxley Act, SEC Regulation S-X Rule 2-01, and applicable PCAOB rules. The Audit Committee did not approve any fees pursuant to the de minimis exception to the pre-approval requirement provided by paragraph (c)(7)(i)(C) of Rule 2-01 of Regulation S-X during 2023 or 2022.
The general shareholders’ meeting normally approves such audit fees and authorizes the audit committee to approve any increase or reallocation of such audit fees as may be necessary, appropriate or desirable under the circumstances. No services outside the scope of the audit committee’s approval may be undertaken by the external auditor.
On June 2, 2020, at the Company’s general meeting of shareholders, the Company’s shareholders authorized the Company and the Company’s subsidiaries to acquire, from time to time, shares, including shares represented by ADSs, on the following terms and conditions:
| |
| Annual Report 2023 |
- Purchases, acquisitions or receipts of securities may be made in one or more transactions as the board of directors of the Company or the board of directors or other governing bodies of the relevant entity, as applicable, considers advisable.
- The maximum number of securities acquired pursuant to this authorization may not exceed 10% of the Company’s issued shares or, in the case of acquisitions made through a stock exchange in which the securities are traded, such lower amount as may not be exceeded pursuant to any applicable laws or regulations of such market. The number of securities acquired as a block may amount to the maximum permitted amount of purchases.
- The purchase price per share to be paid in cash may not exceed 125% (excluding transaction costs and expenses), nor may it be lower than 75% (excluding transaction costs and expenses), in each case of the average of the closing prices of the Company’s securities in the stock exchange through which the Company’s securities are acquired, during the five trading days in which transactions in the securities were recorded in such stock exchange preceding (but excluding) the day on which the Company’s securities are acquired. For over-the-counter or off-market transactions, the purchase price per ADS to be paid in cash may not exceed 125% (excluding transaction costs and expenses), nor may it be lower than 75% (excluding transaction costs and expenses), in each case of the average of the closing prices of the ADSs in the NYSE during the five trading days in which transactions in ADSs were recorded in the NYSE preceding (but excluding) the day on which the ADSs are acquired; and, in the case of acquisition of securities, other than in the form of ADSs, such maximum and minimum per security purchase prices shall be equal to the prices that would have applied in case of an ADS purchase pursuant to the formula above divided by the number of underlying shares represented by an ADS at the time of the relevant purchase. Compliance with maximum and minimum purchase price requirements in any and all acquisitions made pursuant to this authorization (including, without limitation, acquisitions carried out through the use of derivative financial instruments or option strategies) shall be determined on and as of the date on which the relevant transaction is entered into, irrespective of the date on which the transaction is to be settled.
- The above maximum and minimum purchase prices shall, in the event of a change in the par value of the securities, a capital increase by means of a capitalization of reserves, a distribution of securities under compensation or similar programs, a stock split or reverse stock split, a distribution of reserves or any other assets, the redemption of capital, or any other transaction impacting on the Company’s equity, be adapted automatically, so that the impact of any such transaction on the value of the securities shall be reflected.
- The acquisitions of securities may not have the effect of reducing the Company’s net assets below the sum of the Company’s share capital plus its undistributable reserves.
- Only fully paid-up securities may be acquired pursuant to this authorization.
- The acquisitions of securities may be carried out for any purpose, as may be permitted under applicable laws and regulations, including without limitation to reduce the share capital of the Company, to offer such shares to third parties in the context of corporate mergers or acquisitions of other entities or participating interests therein, for distribution to the Company’s or the Company’s subsidiaries’ directors, officers or employees or to meet obligations arising from convertible debt instruments.
- The acquisitions of securities may be carried out by any and all means, as may be permitted under applicable laws and regulations, including through any stock exchange in which the Company’s securities are traded, through public offers to all shareholders of the Company to buy securities, through the use of derivative financial instruments or option strategies, or in over-the-counter or off-market transactions or in any other manner.
- The acquisitions of securities may be carried out at any time, during the duration of the authorization, including during a tender offer period, as may be permitted under applicable laws and regulations.
- The authorization granted to acquire securities shall be valid for such maximum period as may be provided for under applicable Luxembourg law as in effect from time to time (such maximum period being, as of to date, 5 years).
- The acquisitions of securities shall be made at such times and on such other terms and conditions as may be determined by the board of directors of the Company or the board of directors or other governing bodies of the relevant subsidiary, provided that, any such purchase shall comply with Article 430-15 et. seq. of the Luxembourg Company Law (or any successor law) and, in the case of acquisitions of securities made through a stock exchange in which the Company’s securities are traded, with any applicable laws and regulations of such market.
| |
| Annual Report 2023 |
On November 1, 2023, the Company’s board of directors approved a share buyback program of up to $1.2 billion to be completed within a one-year period and executed in the open market, with the intention to cancel the shares acquired through the program.
On November 5, 2023, the Company announced that it had entered into a non-discretionary buyback agreement with a primary financial institution, which made its trading decisions concerning the timing of the purchases of the Company’s shares independently of and uninfluenced by Tenaris and acted in compliance with applicable rules and regulations, including the Market Abuse Regulation 596/2014 and the Commission Delegated Regulation (EU) 2016/1052. Under the buyback agreement, purchases of shares could continue during any closed or blackout periods of Tenaris in accordance with applicable regulations.
This first tranche of the share buyback program commenced on November 6, 2023, and was completed on January 12, 2024. As of December 31, 2023, the Company repurchased 12,648,091 shares (equivalent to 1.07% of the issued share capital) for a total consideration of EUR198 million, equivalent to $214 million; and as at the end of the first tranche of the program, the Company repurchased 17,779,302 shares (representing 1.51% of the issued share capital) for a total consideration of EUR276 million, or $300 million. The Company intends to cancel the treasury shares repurchased as at the end of the first tranche of its share buyback program in the upcoming extraordinary general meeting of shareholders, scheduled to be held on April 30, 2024 (immediately after the annual general meeting of shareholders) and reduce the Company’s issued share capital accordingly. See “Shareholders’ Meetings; Voting Rights; Election of Directors” for more information.
On February 25, 2024, the Company announced that, in connection with the second tranche of its previously announced share buyback program, it had entered into another non-discretionary buyback agreement with a primary financial institution, which will make its trading decisions concerning the timing of the purchases of the Company’s shares independently of and uninfluenced by Tenaris and will act in compliance with applicable rules and regulations, including the Market Abuse Regulation 596/2014 and the Commission Delegated Regulation (EU) 2016/1052. Under the buyback agreement, purchases of shares may continue during any closed or blackout periods of Tenaris in accordance with applicable regulations.
This $300 million second tranche of the share buyback program commenced on February 26, 2024, and is expected to end no later than May 24, 2024. Additional shares repurchased under the share buyback program will be held in treasury and will be cancelled in due course.
For further information on the Company’s share buyback program, please refer to our corporate website under the “Share Buyback Program” section https://ir.tenaris.com/share-buyback-program.
In the future, we may, on the terms and subject to the conditions above referred, initiate another share capital repurchase or similar program or engage in other transactions pursuant to which we may repurchase, directly or indirectly, the Company’s securities. In addition, we or our subsidiaries may enter into transactions involving sales or purchases of derivatives or other instruments, either settled in cash or through physical delivery of securities, with returns linked to the Company’s securities. The timing and amount of repurchase transactions under any such future program, or sales or purchases of derivatives or other instruments, will depend on market conditions as well as other corporate and regulatory considerations.
|
2023 |
Total number of shares purchased |
Average price paid per share in USD |
Total number of shares purchased as part of publicly announced plan or program |
Approximate million USD value of shares that may yet be purchased under the plan or program |
|
November 1 - November 30 |
8,940,855 |
17.1 |
8,940,855 |
1,047 |
|
December 1 - December 31 |
3,707,236 |
16.7 |
3,707,236 |
986 |
|
Total |
12,648,091 |
|
12,648,091 |
|
| |
| Annual Report 2023 |
Since 2011, PricewaterhouseCoopers S.C., Réviseurs d’entreprises agréé (“PwC”) served as the Company’s statutory auditor. Following the completion of a tender process for the selection of a replacement audit firm for the year 2024, as required under applicable EU and Luxembourg mandatory auditor rotation rules, on November 3, 2022, the Company’s board of directors, based on the audit committee’s recommendation, recommended the annual general shareholders’ meeting to appoint Ernst & Young S.A. (“EY”) as the Company’s statutory auditors for the fiscal year ending December 31, 2024. The annual general shareholders meeting held on May 3, 2023 approved the appointment of EY as the Company’s statutory auditor for the fiscal year ending December 31, 2024.
The reports issued by PwC on our consolidated financial statements for the years 2023 and 2022 did not contain an adverse opinion or a disclaimer of opinion, and were not qualified or modified as to uncertainty, audit scope or accounting principles. During each of the years 2023 and 2022, there has not been (i) any disagreement between the Company and PwC over any matter of accounting principles or practices, financial statement disclosure, or auditing scope or procedures, which disagreement, if not resolved to PwC’s satisfaction, would have caused PwC to make reference to the subject matter of the disagreement in connection with its audit reports, nor (ii) any reportable event.
The Company has provided PwC with a copy of the foregoing disclosure and has requested that PwC furnish the Company with a letter addressed to the SEC stating whether PwC agrees with the Company’s statements in such disclosure and, if not, stating the respects in which it does not agree. A copy of PwC’s letter dated March 27, 2024, is filed as an exhibit to this annual report.
During fiscal years 2023 and 2022 and as of the date of this annual report, the Company did not consult with EY regarding: (i) the application of accounting principles to any specified transaction, either completed or proposed, or the type of audit opinion that might be rendered on the Company’s financial statements; (ii) the type of audit opinion that might be rendered on the Company’s financial statements and neither a written report nor oral advice was provided to the Company that EY concluded was an important factor considered by the Company in reaching a decision as to any accounting, auditing or financial reporting issue; or (iii) any matter that was either the subject of a disagreement or reportable event.
| |
| Annual Report 2023 |
The Company’s corporate governance practices are governed by Luxembourg Law (including, among others, the Luxembourg Company Law, the Luxembourg Law of January 11, 2008 on transparency requirements for issuers, as amended (which transposes EU Directive 2004/109 of the European Parliament and of the Council of December 15, 2004), the Shareholders’ Rights Law and the Luxembourg law of July 23, 2016, concerning the audit profession (the “Audit Reform Law”) and by the Company’s articles of association. The following is a summary of certain rights of holders of the Company’s shares and includes the information required under the Luxembourg Law on takeovers of May 19, 2006. Shareholders’ rights are set out in the Company’s articles of association and are provided by applicable Luxembourg law and may differ from those typically provided to shareholders of U.S. companies under the corporation laws of some states of the United States. This summary is not exhaustive and does not contain all the information that may be important to investors. For more complete information, you should read the Company’s articles of association, which are attached as an exhibit to this annual report.
Corporate Governance
Memorandum and Articles of Association
The Company is a public limited liability company (société anonyme) organized under the laws of Luxembourg, registered under the number B85 203 in the Luxembourg Registre de Commerce et des Sociétés. Its object and purpose, as set forth in Article 2 of its articles of association, is the taking of interests, in any form, in corporations or other business entities, and the administration, management, control and development thereof.
The Company’s authorized share capital is fixed by the Company’s articles of association as amended from time to time with the approval of shareholders at an extraordinary general shareholders’ meeting. The Company has an authorized share capital of a single class of 2,500,000,000 shares having a nominal value of USD1.00 per share. There were 1,180,536,830 shares issued as of the date of this annual report, including treasury shares. All issued shares are fully paid. As at the end of the first tranche of its share buyback program, the Company had repurchased 17,779,302 shares which are expected to be cancelled in the upcoming extraordinary shareholders meeting scheduled to be held on April 30, 2024.
The Company’s articles of association authorize the board of directors, or any delegate(s) duly appointed by the board of directors, to issue shares within the limits of the authorized share capital against contributions in cash, contributions in kind or by way of available reserves, at such time and on such terms and conditions, including the issue price, as the board of directors, or its delegate(s), may in its or their discretion resolve.
The Company’s extraordinary shareholders’ meeting held on June 2, 2020 approved the renewal for an additional five-year period of the authorization granted to the board of directors to waive, suppress or limit any preemptive subscription rights of shareholders provided for by law to the extent it deems such waiver, suppression or limitation advisable for any issue or issues of shares within the authorized share capital; and have waived any preemptive subscription rights provided for by law and related procedures. The validity period of such authorization will expire on June 12, 2025. However, under the Company’s articles of association, the Company’s existing shareholders shall have a preferential right to subscribe for any new shares issued pursuant to the authorization granted to its board of directors, except in the following cases (in which cases no preemptive subscription rights shall apply):
| |
| Annual Report 2023 |
- any issuance of shares (including, without limitation, the direct issuance of shares or upon the exercise of options, rights convertible into shares, or similar instruments convertible or exchangeable into shares) against a contribution other than in cash; and
- any issuance of shares (including by way of free shares or at discount), up to an amount equal to 1.5% of the issued share capital of the Company, to directors, officers, agents or employees of the Company, its direct or indirect subsidiaries, or its affiliates, including, without limitation, the direct issuance of shares or upon the exercise of options, rights convertible into shares, or similar instruments convertible or exchangeable into shares, issued for the purpose of compensation or incentive for any such persons or in relation thereto (which the board of directors shall be authorized to issue upon such terms and conditions as it deems fit).
Amendment of the Company’s articles of association requires the approval of shareholders at an extraordinary shareholders’ meeting with a two-thirds majority vote of the shares represented at the meeting.
The Company is controlled by San Faustin, which owns 60.45% of the Company’s issued share capital, through its wholly owned subsidiary Techint Holdings S.à r.l. The Dutch private foundation (Stichting) RP STAK holds voting rights in San Faustin sufficient to control San Faustin. No person or group of persons controls RP STAK.
As of December 31, 2023, (i) 38.41% of the Company’s issued share capital was publicly traded on the Italian Stock Exchange and the Mexican Stock Exchange; in addition, the Company’s ADSs trade on the NYSE; (ii) a 0,07% was held by the Company’s directors and senior management as a group; and (iii) the remaining 1.07% of the Company’s issued share capital was held in treasury. See “Major Shareholders and Related Party Transactions”.
Dividends
Subject to applicable law, all issued shares (including shares underlying ADSs) are entitled to participate equally in dividends when, as and if declared by the shareholders at the annual general shareholders’ meeting, out of funds legally available for such purposes. Treasury shares are not entitled to dividend distributions.
Dividends may be lawfully declared and paid if the Company’s net profits and distributable reserves are sufficient under Luxembourg law. The amount and payment of dividends must be approved by a majority vote at a general shareholders’ meeting, generally, but not necessarily, based on the recommendation of the Company’s board of directors. Under Article 21 of the Company’s articles of association, the board of directors has the power to distribute interim dividends out of profits, share premium or any other available reserves, in accordance with applicable law, in particular in accordance with the conditions set forth in Article 461-3 of the Luxembourg Company Law. Such dividend payments must be finally approved by the general shareholders’ meeting. On February 21, 2024 the board of directors announced the proposals to be submitted to the consideration of the annual general shareholders’ meeting, including its proposal on dividends.
| |
| Annual Report 2023 |
As provided by Article 21 of the Company’s articles of association, dividends or other distributions declared by the general meeting as well as interim dividends or other distributions declared by the board of directors will be distributed at the times and places determined by the board of directors. The Company will make any and all dividend payments and any other distributions in respect of shares registered in the name of any securities settlement system or operator of such a system or in the name of any financial institution or other professional depositary of securities or any other depositary, whether in cash, shares or other assets, only to such registered holder, or otherwise in accordance with such registered holder’s instructions, and, as provided by Article 21 of the Company’s articles of association, that payment shall release the Company from any and all obligations for such payment.
The Company conducts and will continue to conduct its operations through subsidiaries and, accordingly, its main source of cash to pay dividends, among other possible sources, will be the dividends received from its subsidiaries. For further information see “Key Information – Risk Factors – Risks Relating to the Structure of the Company – The Company’s dividend payments depend on the results of operations and financial condition of its subsidiaries and could be restricted by legal, contractual or other limitations or tax changes”.
Under Luxembourg law, claims for dividends will lapse in favor of the Company five years after the date such dividends are declared. However, the Company may elect to pay a declared dividend after such period. Declared and unpaid dividends held by the Company for the account of its shareholders do not bear interest.
Pursuant to Luxembourg law, at least 5% of our net profits per year must be allocated to the creation of a legal reserve until such reserve has reached an amount equal to 10% of the Company’s issued share capital. If the legal reserve later falls below the 10% threshold, at least 5% (or such lower amount required to reach the 10% threshold) of net profits again must be allocated toward the reserve. As of December 31, 2023, the Company’s legal reserve represented 10% of its share capital. The legal reserve is not available for distribution.
| |
| Annual Report 2023 |
Shareholders’ Meetings; Voting Rights; Election of Directors
Each share entitles the holder thereof to one vote at the Company’s general shareholders’ meetings, provided that, under Luxembourg law, voting rights with respect to treasury shares shall be suspended for so long as such shares are held. Shareholder action by written consent is not permitted, but proxy voting is permitted. Notices of general shareholders’ meetings are governed by the provisions of Luxembourg law and the Company’s articles of association. Pursuant to applicable Luxembourg law, the Company must give notice of the calling of any general shareholders’ meeting at least 30 days prior to the date for which the meeting is being called, by publishing the relevant convening notice in the Recueil Electronique des Sociétés et Associations (Luxembourg’s electronic official gazette) and in a leading newspaper having general circulation in Luxembourg and by issuing a press release informing of the calling of such meeting. In case the Company’s shares are listed on a foreign regulated market, notices of general shareholders’ meetings shall also comply with the requirements (including as to content and publicity) and follow the customary practices of such regulated market.
Pursuant to the Company’s articles of association, for as long as the shares or other securities of the Company are listed on a regulated market within the European Union (as they currently are), and unless otherwise provided by applicable law, only shareholders holding shares as of midnight, central European time, on the day that is fourteen days prior to the day of any given general shareholders’ meeting can attend and vote at such meeting. The board of directors may determine other conditions that must be satisfied by shareholders in order to participate in a general shareholders’ meeting in person or by proxy, including with respect to deadlines for submitting supporting documentation to or for the Company.
No attendance quorum is required at ordinary general shareholders’ meetings, and resolutions may be adopted by a simple majority of the votes validly cast, irrespective of the number of shares present or represented. Unless otherwise provided by applicable law, an extraordinary general shareholders’ meeting may not validly deliberate on proposed amendments to the Company’s articles of association unless a quorum of at least half of the share capital is represented at the meeting. If a quorum is not reached at the first extraordinary shareholders’ meeting, a second extraordinary shareholders’ meeting may be convened in accordance with the Company’s articles of association and applicable law, and such second extraordinary general shareholders’ meeting shall validly deliberate regardless of the number of shares represented. In both cases, the Luxembourg Company Law and the Company’s articles of association require that any resolution of an extraordinary general shareholders’ meeting as to amendments to the Company’s articles of association be adopted by a two-thirds majority of the votes validly cast at the meeting. If a proposed resolution consists of changing the Company’s nationality or of increasing the shareholders’ commitments, the unanimous consent of all shareholders is required.
Cumulative voting is not permitted. The Company’s articles of association do not provide for staggered terms and directors are elected for a maximum of one year but may be reappointed or removed at any time, with or without cause, by the general shareholders’ meeting, by resolution passed by a simple majority vote of the shares validly cast at the meeting. In the case of a vacancy occurring in the board of directors, the remaining directors shall have the right to temporarily fill such vacancy with a temporary director appointed by resolution adopted with the affirmative vote of a majority of the remaining directors; provided that the next general shareholder’s meeting shall be called upon to ratify such appointment. The term of any such temporary director elected to fill a vacancy shall expire at the end of the term of office of the replaced director.
| |
| Annual Report 2023 |
The next annual general meeting of shareholders that will consider, among other matters, our consolidated financial statements and annual accounts included in this annual report, is scheduled to be held on Tuesday, April 30, 2024, at 15:00 (Central European Time) at the Company’s registered office in Luxembourg. An extraordinary general meeting of shareholders is scheduled to be held on the same date, immediately after the adjournment of the annual general meeting of shareholders to decide on the cancellation of 17,779,302 shares repurchased as at the end of the first tranche of the Company’s share buyback program and currently held in treasury and, consequently, to approve a reduction of the Company’s issued share capital for $17,779,302 so as to bring the issued share capital from $1,180,536,830 to $1,162,757,528, represented by 1,162,757,528 shares with a nominal value of $1,00 each, and to approve a corresponding amendment of the first paragraph of article 5 “Share Capital” of the Company’s articles of association to reflect such resolutions.
The articles of association provide that annual general shareholders’ meetings shall meet in Luxembourg within six months from the end of the previous financial year at the date, place and hour indicated in the convening notice. The rights of the shareholders attending the meetings are governed by Shareholders’ Rights Law.
Holders of shares deposited in fungible securities accounts have the same rights and obligations as holders of shares recorded in the Company’s share register. However, in order to be able to participate in and vote at shareholders’ meetings of the Company, the former must submit, prior to the relevant meeting, reasonably satisfactory evidence to the Company as to the number of shares held on the applicable record date for such meeting. For as long as the shares or the other securities of the Company are listed on a regulated market within the European Union, participation in a shareholders’ general meeting shall inter alia be subject to the relevant shareholder holding shares of the Company on the fourteenth day midnight Central European Time prior to the meeting (unless otherwise provided for by applicable law).
Holders of ADSs only have those rights that are expressly granted to them in the deposit agreement. See “Key Information – Risk Factors – Risks Relating to shares and ADSs – Holders of ADSs may not be able to exercise, or may encounter difficulties in the exercise of, certain rights afforded to shareholders”. ADS holders may not attend or directly exercise voting rights in shareholder’ meetings, but holders of record of our ADSs as of the relevant ADS holders’ record date set for any given general shareholders’ meeting are entitled to instruct the Depositary as to the exercise of the voting rights in respect of the shares underlying such holder’s ADSs at such meeting. Holders of ADSs maintaining non-certificated positions must follow voting instructions given by their broker or custodian bank.
The notices convening the annual general meeting of shareholders and an extraordinary general meeting of shareholders scheduled to be held on April 30, 2024, the Shareholder Meeting Brochure and Proxy Statement for the meetings, describing the procedures for attending and voting at the meetings; as well as the material required to be submitted to shareholders in connection with the meetings are available on the Company’s website at https://ir.tenaris.com/investor-relations in accordance with applicable rules and regulations, and were timely filed by the Company with the SEC on a report on Form 6-K.
Management
Management of the Company is vested in a board of directors. For more information on the Company’s board of directors, audit committee, senior management, and auditors, see “Directors, Senior Management and Employees”.
Access to Corporate Records
Luxembourg law and the Company’s articles of association do not generally provide for shareholder access to corporate records. Shareholders may inspect the annual accounts and auditors’ reports at our registered office during the fifteen-day period prior to a general shareholders’ meeting.
| |
| Annual Report 2023 |
Appraisal Rights
In the event the Company’s shareholders approve:
- the delisting of the shares from all stock exchanges where the shares are listed at that time;
- a merger in which the Company is not the surviving entity (unless the shares or other equity securities of such entity are listed on the New York or London stock exchanges);
- a sale, lease, exchange or other disposition of all or substantially all of the Company’s assets;
- an amendment of our articles of association that has the effect of materially changing the Company’s corporate purpose;
- the relocation of the Company’s domicile outside of the Grand Duchy of Luxembourg; or
- amendments to the Company’s articles of association that restrict the rights of the Company’s shareholders.
Dissenting or absent shareholders have the right to have their shares repurchased by the Company at (i) the average market value of the shares over the 90 calendar days preceding the applicable shareholders’ meeting or (ii) in the event that the shares are not traded on a regulated market, the amount that results from applying the proportion of the Company’s equity that the shares being sold represent over the Company’s net worth as of the date of the applicable shareholders’ meeting.
Dissenting or absent shareholders must present their claim within one month following the date of the shareholders’ meeting and supply the Company with evidence of their shareholding at the time of such meeting. The Company must (to the extent permitted by applicable laws and regulations and in compliance therewith) repurchase its shares within six months following the date of the shareholders’ meeting.
If delisting from one or more, but not all, of the stock exchanges where the shares are listed is approved in the shareholders’ meeting, only dissenting or absent shareholders with shares held through participants in the local clearing system for that market or markets can exercise this appraisal right if:
- they held the shares as of the date of the announcement by the Company of its intention to delist or as of the date of publication of the first convening notice for the general shareholders’ meeting that approved the delisting; and
- they present their claim within one month following the date of the general shareholders’ meeting and supply evidence of their shareholding as of the date of the Company’s announcement or the publication of the first convening notice to the meeting.
In the event a shareholder exercises its appraisal rights, applicable Luxembourg law provisions shall apply.
Holders of ADSs may not be able to exercise, or may encounter difficulties in the exercise of, certain rights afforded to shareholders, including appraisal rights. See “Key Information – Risk Factors – Risks Relating to shares and ADSs – Holders of ADSs may not be able to exercise, or may encounter difficulties in the exercise of, certain rights afforded to shareholders”.
| |
| Annual Report 2023 |
Distribution of Assets on Winding-Up
In the event of the Company’s liquidation, dissolution or winding-up, the net assets remaining after allowing for the payment of all debts, charges and expenses will be paid out to the holders of the shares in proportion to their respective holdings.
Transferability and Form
The Company’s articles of association do not contain any redemption or sinking fund provisions, nor do they impose any restrictions on the transfer of shares. The shares are issuable in registered form only.
The ownership of registered shares is evidenced by the inscription of the name of the shareholder, the number of shares held by such shareholders and the amount paid on each share in the Company’s share register. In addition, the Company’s shares may be held through fungible securities accounts with financial institutions or other professional depositaries.
Shares held through fungible securities accounts may be transferred in accordance with customary procedures for the transfer of securities in book-entry form. Shares that are not held through fungible securities accounts may be transferred by a written statement of transfer signed by both the transferor and the transferee or their respective duly appointed attorney-in-fact and recorded in the Company’s share register. The transfer of shares may also be made in accordance with the provisions of Article 1690 of the Luxembourg Civil Code. As evidence of the transfer of registered shares, the Company may also accept any correspondence or other documents evidencing the agreement between transferor and transferee as to the transfer of registered shares.
Repurchase of Company shares
The Company may repurchase its own shares in the cases and subject to the conditions set by the Luxembourg Company Law and, in the case of acquisitions of shares or ADSs made through a stock exchange in which shares or ADSs are traded, with any applicable laws and regulations of such market. Please see “Purchase of Equity Securities by the Issuer and Affiliated Purchasers” for further information on the authorization granted on June 2, 2020, by the annual general meeting of shareholders to the Company or its subsidiaries to repurchase shares of the Company, including shares represented by ADSs, and repurchase of Company shares under the existing share buyback program.
Limitation on Securities Ownership
There are no limitations currently imposed by Luxembourg law or the articles of association on the rights of the Company’s non-resident or foreign shareholders to hold or vote the Company’s shares.
Change in Control
None of our outstanding securities has any special control rights. The Company’s articles of association do not contain any provision that would have the effect of delaying, deferring or preventing a change in control of the Company and that would operate only with respect to a merger, acquisition or corporate restructuring involving the Company or any of its subsidiaries. In addition, the Company does not know of any significant agreements or other arrangements to which the Company is a party and which take effect, alter or terminate in the event of a change of control of the Company. There are no agreements between the Company and members of its board of directors or employees providing for compensation if they resign or are made redundant without reason, or if their employment ceases following a change in control of the Company.
There are no rights associated with the Company’s shares other than those described above.
| |
| Annual Report 2023 |
Ownership Disclosure
The Company’s articles of association do not contain any provision requiring disclosure of share ownership. However, under the Luxembourg Transparency Law investors in the Company’s securities should notify the Company and the Luxembourg securities commission on an ongoing basis whenever the proportion of voting rights held or controlled by any such investor reaches, exceeds or falls below any of the following thresholds: 5%, 10%, 15%, 20%, 25%, 33.33%, 50% and 66.66%. Failure to notify the Company and the Luxembourg securities commission of the reaching or crossing of any such thresholds may result in the suspension of the voting rights attaching to the shares exceeding the threshold which would have had to be notified.
Diversity and Inclusion
The Company’s Code of Conduct prohibits unlawful discrimination in employment relationships, granting all people the right to apply for a position in Tenaris, or to be considered for a new position based on merit, without arbitrary discrimination. The Company’s Human Resources Policy champions equal opportunities by ensuring that hiring, promotion, transfer, notice periods, dialogue, rights and protection, as well as other employment decisions are taken without regard for race, color, religious belief, gender, age, disability, national origin or sexual orientation. Compensation and remuneration are based on each person’s duties, personal performance, competence and behavior. Tenaris pursues a policy of inclusive corporate culture and leadership, recognizing the range of benefits brought by embracing diversity in all its aspects. We are improving our workforce’s gender balance, in the knowledge that a diverse workforce will contribute positively to our culture and performance.
Summary of differences with NYSE standards
As a Luxembourg company listed on the NYSE, the Bolsa Mexicana de Valores, S.A.B. de C.V. (the Mexican Stock Exchange), and the Borsa Italiana S.p.A. (the Italian Stock Exchange), the Company is required to comply with some, but not all, of the corporate governance standards of these exchanges. The Company, however, believes that its corporate governance practices meet, in all material respects, the corporate governance standards that are generally required for controlled companies by all of the exchanges on which the Company’s securities trade.
The following is a summary of the significant ways that the Company’s corporate governance practices differ from the corporate governance standards required for foreign controlled companies by the NYSE. The Company’s corporate governance practices may differ in non-material ways from certain other standards required by the NYSE that are not detailed here.
Non-management directors’ meetings
Under NYSE standards, non-management directors must meet at regularly scheduled executive sessions without management present and, if such group includes directors who are not independent, a meeting should be scheduled once per year including only independent directors. Neither Luxembourg law nor the Company’s articles of association require the holding of such meetings and the Company does not have a set policy for these meetings. For additional information on board meetings, see “Directors, Senior Management and Employees – Directors and Senior Management – Board of Directors”.
In addition, NYSE-listed companies are required to provide a method for interested parties to communicate directly with non-management directors as a group. While the Company does not have such a method, it has set up a compliance line for investors and other interested parties to communicate their concerns directly to the members of our audit committee, all of whom are non-management, independent directors.
Audit committee composition
Under NYSE standards, listed U.S. companies are required to have an audit committee composed of independent directors that satisfy the requirements of Rule 10A-3 promulgated under the Exchange Act. Pursuant to the Company’s articles of association, as supplemented by the audit committee’s charter, for as long as the Company’s shares are listed on at least one regulated market, the Company must have an audit committee composed of at least three members, the majority of whom must qualify as independent directors (as defined in the Company’s articles of association), provided, however, that the composition and membership of the audit committee shall satisfy such requirements as are applicable to, and mandatory for, audit committees of issuers such as the Company under any law, rule or regulation applicable to the Company (including, without limitation, the applicable laws, rules and regulations of such regulated market or markets). The Company’s audit committee, which currently consists of three members, complies with such requirements. In accordance with NYSE standards, the Company has an audit committee entirely composed of independent directors for purposes of the Exchange Act Rule 10A-3(b)(1). For more information on the Company’s audit committee see “Directors, Senior Management and Employees– Board Practices – Audit Committee”.
| |
| Annual Report 2023 |
Under NYSE standards, all audit committee members of listed U.S. companies are required to be financially literate or must acquire such financial knowledge within a reasonable period and at least one of its members shall have experience in accounting or financial administration. In addition, if a member of the audit committee is simultaneously a member of the audit committee of more than three public companies, and the listed company does not limit the number of audit committees on which its members may serve, then in each case the board must determine whether the simultaneous service would prevent such member from effectively serving on the listed company’s audit committee and shall publicly disclose its decision. Luxembourg law provisions on audit committee membership require only that at least one member of the audit committee have competence in accounting or auditing matters. The board of directors of the Company has determined that Ms. Tiuba, the committee’s chairperson, qualifies as “audit committee financial expert” under applicable SEC rules and has competence in accounting or auditing matters, as required by applicable Luxembourg law. In addition, the membership of the audit committee as a whole has sufficient relevant knowledge of the business and financial experience to properly discharge its functions. The audit committee has the authority, from time to time and as it deems necessary, to engage persons that meet all of the attributes of a financial expert as consultants. See “Audit Committee Financial Expert”.
Standards for evaluating director independence
Under NYSE standards, the board is required, on a case-by-case basis, to express an opinion with regard to the independence or lack of independence of each individual director. Neither Luxembourg law nor the Company’s articles of association requires that the board of directors express such an opinion. In addition, the definition of “independent” under the NYSE rules differs in some non-material respects from the definition contained in the Company’s articles of association. For more information on the Company’s independent directors and the definition of “independent” under the Company’s articles of association see “Directors, Senior Management and Employees – Directors and Senior Management – Board of Directors” and “Directors, Senior Management and Employees – Board Practices – Audit Committee”.
Audit committee responsibilities
Pursuant to the Company’s articles of association, the audit committee shall assist the board of directors in fulfilling its oversight responsibilities relating to the integrity of its consolidated financial statements, the effectiveness of its systems of internal control, risk management and internal audit over financial reporting and the independence and performance of the external auditors. The audit committee is required to review and, where applicable, approve material transactions between the Company or its subsidiaries and related parties and also perform the other duties entrusted to it by the board. The NYSE requires certain matters to be set forth in the audit committee charter of U.S. listed companies.
The Company’s audit committee charter provides for many of the responsibilities that are expected from such bodies under the NYSE standard and in accordance with applicable Luxembourg law, including the Audit Reform Law; however, due to the Company’s equity structure and holding company nature, the charter does not contain all such responsibilities, including provisions related to procedures for the receipt and treatment of complaints (although the Company has established such procedures), funding for payment of administrative expenses and compensation to advisors (although the audit committee has the authority to engage outside advisors), setting hiring policies for employees or former employees of external auditors, and an annual performance evaluation of the audit committee. For more information on the Company’s audit committee see “Directors, Senior Management and Employees – Board Practices – Audit Committee”.
| |
| Annual Report 2023 |
Standards for approval of related-party transactions
The Company is subject to Luxembourg laws governing approval and disclosure of material related party transactions, including the Shareholders’ Rights Law; and the Company’s articles of association and the Audit Committee charter require the Audit Committee to review material transactions with related parties to determine whether their terms are consistent with the interests of the Company and its shareholders and with market conditions. In addition, recently amended NYSE standard on related-party transactions requires all NYSE-listed companies’ audit committees (or another independent body of the board of directors) to conduct a reasonable prior review and oversight of all related party transactions for potential conflicts of interest and to prohibit such a transaction if it determines it to be inconsistent with the interests of the company and its shareholders. The rule defines the term “related party transaction” by reference to the disclosure requirements for annual reports under the Exchange Act. The materiality threshold applicable to foreign private issuers differs to the one applicable to U.S companies. For further details on the approval process for related party transactions, see “Directors, Senior Management and Employees – Board Practices – Audit Committee”.
Shareholder voting on equity compensation plans
Under NYSE standards, shareholders must be given the opportunity to vote on equity-compensation plans and material revisions thereto, except for employment inducement awards, certain grants, plans and amendments in the context of mergers and acquisitions, and certain specific types of plans. The Company does not currently offer equity-based compensation to its directors, senior management or employees, and therefore does not have a policy on this matter. For more information on directors’ compensation see “Directors, Senior Management and Employees – Compensation”.
The Shareholders’ Rights Law requires the Company to adopt a Compensation Policy setting forth the principles and guidelines for purposes of determining the compensation payable to the members of the Company’s board of directors and the managing director or chief executive officer. Such Compensation Policy must be submitted to the non-binding vote of the shareholders. In addition, the Shareholders’ Rights Law provides that the Company must prepare an annual report describing the compensation paid to directors and the chief executive officer for the performance of their duties and submit such report to the shareholders for approval. The Compensation Policy and Compensation Report must be available on the Company’s website. For more information on the Compensation Policy and the 2023 Compensation Report see “Directors, Senior Management and Employees – Compensation”.
Disclosure of corporate governance guidelines
NYSE-listed companies must adopt and disclose corporate governance guidelines. Neither Luxembourg law nor the Company’s articles of association require the adoption or disclosure of corporate governance guidelines. The Company’s board of directors follows corporate governance guidelines consistent with its equity structure and holding company nature, but the Company has not codified them and therefore does not disclose them on its website.
Code of business conduct and ethics
Under NYSE standards, listed companies must adopt and disclose a code of business conduct and ethics for directors, officers and employees, and promptly disclose any waivers of the code for directors or executive officers. Neither Luxembourg law nor the Company’s articles of association require the adoption or disclosure of such a code of conduct. The Company, however, has adopted a code of conduct that applies to all directors, officers and employees that is posted on its website and which complies with the NYSE’s requirements, except that it does not require the disclosure of waivers of the code for directors and officers. In addition, it has adopted a supplementary code of ethics for senior financial officers, which is also posted on our website. See “Code of Ethics”.
| |
| Annual Report 2023 |
Chief Executive Officer certification
A chief executive officer of a U.S. company listed on the NYSE must annually certify that he or she is not aware of any violation by the company of NYSE corporate governance standards. In accordance with NYSE rules applicable to foreign private issuers, the Company’s chief executive officer is not required to provide the NYSE with this annual compliance certification. However, in accordance with NYSE rules applicable to all listed companies, the Company’s chief executive officer must promptly notify the NYSE in writing after any of our executive officers becomes aware of any noncompliance with any applicable provision of the NYSE’s corporate governance standards. In addition, the Company must submit an executed written affirmation annually and an interim written affirmation upon the occurrence of any of the events listed in the foreign private issuer interim written affirmation form by the NYSE.
Risk Management, Strategy and Governance
Under the Company’s articles of association, as supplemented by the audit committee’s charter, the audit committee assists the board of directors in fulfilling its oversight responsibilities relating to the effectiveness of the Company’s systems of internal control, risk management and internal audit over financial reporting. In addition, the Company has established a management-level Critical Risk Committee (“CRC”) that assists the Company’s board of directors, the audit committee and the chief executive officer in connection with the monitoring, assessment and review of risks to which Tenaris is exposed and in the oversight of the risk management framework and processes, with a focus on critical risks (including accidents, cybersecurity and obsolescence, commercial execution, environmental, health and safety and regulatory risks), the development of mitigating actions, and the monitoring of action plans. The CRC, which comprises several senior executives, risk assurance manager and general counsel, periodically reports to the Company’s board of directors, the audit committee and the chief executive officer on its activities. For more information on the audit committee and CRC, see “Key Information – Risk Factors – Risks Relating to Our Business and Industry – Cyberattacks could have a material adverse impact on our business and results of operations”.
In particular, with respect to cybersecurity risks, Tenaris has adopted a “Cybersecurity Risk Management Methodology”, which sets forth a procedure to monitor, identify, communicate, assess the impact and likelihood and report actual or potential risks affecting Tenaris’s information systems, including platform, networking and systems vulnerabilities, processes, sensitive information leak or loss. The objective of our Cybersecurity Risk Management Methodology is to reduce, accept, transfer, or avoid the effects of such risks thereby reducing accidents, harm, losses, disruption to services, or other negative impacts. Our risk assessment methodology considers the potential impact of cybersecurity risks with respect to continuity of operations, information security (including confidentiality, integrity and availability), financial performance, compliance or reputational effects, and health, safety and environment damages. In addition, the adopted methodology considers the probability of occurrence of each event based on factors that vary according to specific risks. A Cybersecurity Risk Catalog is used to register detected risks, document risk assessments, and adopt appropriate action plans and reporting measures. If deemed appropriate (for example, when specific knowledge is required) specialized consultants may be engaged in connection with cybersecurity risk processes.
| |
| Annual Report 2023 |
Tenaris has adopted certain other cybersecurity procedures that complement the above-mentioned Cybersecurity Risk Management Methodology and seek to effectively manage cybersecurity incidents by analyzing potential impacts, containing the attack, eradicating the threat, and recovering from the incident, instruct users of Tenaris’s information systems on how to respond to cybersecurity incidents involving or affecting Tenaris IT resources or devices through which users may access any Tenaris’s IT systems; and provide instructions and best practices to Tenaris’s personnel with system administrator’s roles in connection with cybersecurity incidents prevention, detection and response.
Tenaris has also adopted a “Ransomware Crisis Management Procedure” setting forth the procedure to timely and adequately respond to a ransomware incident. In addition, because a cybersecurity incident may escalate into a major company crisis, “Tenaris’s Crisis Management Procedure” is triggered and applied when certain events signal potential material impacts.
Tenaris’s policies, processes and procedures established to detect and manage cybersecurity risks are monitored and coordinated by a team of experienced and recognized professionals, including a chief information security officer, a cybersecurity risk management director and a cybersecurity and security architecture director, with an average of more than 25 years of experience in cybersecurity and information technology fields. The chief information security officer periodically reports on his activities to the CRC.
During 2023, no risks from cybersecurity threats, including as a result of any previous cybersecurity incidents, lead to known breaches of our business-critical IT systems and, as such, have not materially affected, or are reasonably likely to materially affect, Tenaris, including its business strategy, results of operations, or financial condition.
Tenaris has adopted cyber-resilience standards as part of its cybersecurity strategy and cyber capabilities. For example, a massive cyberattack tabletop simulation exercise was carried out in 2023 with Tenaris’s top management, showing the Company’s strong commitment to cybersecurity issues, particularly associated risks, potential impacts and action plans.
For more information on cybersecurity risks, see “Key Information – Risk Factors – Risks Relating to Our Business and Industry – Cyberattacks could have a material adverse impact on our business and results of operations”.
For the Report of Independent Registered Public Accounting Firm (PCAOB ID
For the Financial Statements see pages F-4 through F-86 of this annual report.
EXHIBITIS
* The Amended and Restated Deposit Agreement is incorporated by reference to the Registration Statement on Form F-6 filed by Tenaris S.A. on February 25, 2013 (File No. 333-186825).
SIGNATURES
The registrant hereby certifies that it meets all the requirements for filing on Form 20-F and that it has duly caused and authorized the undersigned to sign this annual report on its behalf.
|
|
|
|
|
|
March 27, 2024 |
|
TENARIS S.A. | |
|
|
|
|
|
|
|
|
By |
/s/ Alicia Móndolo
|
|
|
|
Name: |
Alicia Móndolo |
|
|
|
Title: |
Chief Financial Officer |

Report of Independent Registered Public Accounting Firm
To the Board of Directors and Shareholders of
Tenaris S.A.
Opinions on the Consolidated Financial Statements and Internal Control over Financial Reporting
We have audited the accompanying consolidated statements of financial position of Tenaris S.A. and its subsidiaries (the “Company”) as of 31 December 2023 and 2022, and the related consolidated income statements, consolidated statements of comprehensive income, consolidated statements of changes in equity and consolidated statements of cash flows for each of the three years in the period ended 31 December 2023, including the related notes (collectively referred to as the “consolidated financial statements”). We also have audited the Company’s internal control over financial reporting as of 31 December 2023, based on criteria established in Internal Control - Integrated Framework (2013) issued by the Committee of Sponsoring Organizations of the Treadway Commission (COSO).
In our opinion, the consolidated financial statements referred to above present fairly, in all material respects, the financial position of the Company as of 31 December 2023 and 2022, and the results of its operations and its cash flows for each of the three years in the period ended 31 December 2023 in conformity with IFRS Accounting Standards as issued by the International Accounting Standards Board and IFRS Accounting Standards as adopted by the European Union. Also in our opinion, the Company maintained, in all material respects, effective internal control over financial reporting as of 31 December 2023, based on criteria established in Internal Control - Integrated Framework (2013) issued by the COSO.
Basis for Opinions
The Company's management is responsible for these consolidated financial statements, for maintaining effective internal control over financial reporting, and for its assessment of the effectiveness of internal control over financial reporting, included in the accompanying Management's Report on Internal Control over Financial Reporting appearing under Item 15. Our responsibility is to express opinions on the Company’s consolidated financial statements and on the Company's internal control over financial reporting based on our audits. We are a public accounting firm registered with the Public Company Accounting Oversight Board (United States) (PCAOB) and are required to be independent with respect to the Company in accordance with the U.S. federal securities laws and the applicable rules and regulations of the Securities and Exchange Commission and the PCAOB.
We conducted our audits in accordance with the standards of the PCAOB. Those standards require that we plan and perform the audits to obtain reasonable assurance about whether the consolidated financial statements are free of material misstatement, whether due to error or fraud, and whether effective internal control over financial reporting was maintained in all material respects.
T : +352 494848 1, F : +352 494848 2900, www.pwc.lu
Cabinet de révision agréé. Expert-comptable (autorisation gouvernementale n°10028256)
R.C.S. Luxembourg B 65 477 - TVA LU25482518
Our audits of the consolidated financial statements included performing procedures to assess the risks of material misstatement of the consolidated financial statements, whether due to error or fraud, and performing procedures that respond to those risks. Such procedures included examining, on a test basis, evidence regarding the amounts and disclosures in the consolidated financial statements. Our audits also included evaluating the accounting principles used and significant estimates made by management, as well as evaluating the overall presentation of the consolidated financial statements. Our audit of internal control over financial reporting included obtaining an understanding of internal control over financial reporting, assessing the risk that a material weakness exists, and testing and evaluating the design and operating effectiveness of internal control based on the assessed risk. Our audits also included performing such other procedures as we considered necessary in the circumstances. We believe that our audits provide a reasonable basis for our opinions.
As described in Management’s Report on Internal Control over Financial Reporting, management has excluded Bredero Shaw International BV (“BSIBV”) and its subsidiaries from its assessment of internal control over financial reporting as of 31 December 2023, which were acquired on 30 November 2023. We have also excluded BSIBV and its subsidiaries from our audit of internal control over financial reporting. BSIBV and its subsidiaries total assets and total revenues excluded from management’s assessment and our audit of internal control over financial reporting represent approximately 2% and 1%, respectively, of the related consolidated financial statement amounts as of and for the year ended 31 December 2023.
Definition and Limitations of Internal Control over Financial Reporting
A company’s internal control over financial reporting is a process designed to provide reasonable assurance regarding the reliability of financial reporting and the preparation of financial statements for external purposes in accordance with generally accepted accounting principles. A company’s internal control over financial reporting includes those policies and procedures that (i) pertain to the maintenance of records that, in reasonable detail, accurately and fairly reflect the transactions and dispositions of the assets of the company; (ii) provide reasonable assurance that transactions are recorded as necessary to permit preparation of financial statements in accordance with generally accepted accounting principles, and that receipts and expenditures of the company are being made only in accordance with authorizations of management and directors of the company; and (iii) provide reasonable assurance regarding prevention or timely detection of unauthorized acquisition, use, or disposition of the company’s assets that could have a material effect on the financial statements.
Because of its inherent limitations, internal control over financial reporting may not prevent or detect misstatements. Also, projections of any evaluation of effectiveness to future periods are subject to the risk that controls may become inadequate because of changes in conditions, or that the degree of compliance with the policies or procedures may deteriorate.
Critical Audit Matters
The critical audit matter communicated below is a matter arising from the current period audit of the consolidated financial statements that was communicated or required to be communicated to the audit committee and that (i) relates to accounts or disclosures that are material to the consolidated financial statements and (ii) involved our especially challenging, subjective, or complex judgments. The communication of critical audit matters does not alter in any way our opinion on the consolidated financial statements, taken as a whole, and we are not, by communicating the critical audit matter below, providing a separate opinion on the critical audit matter or on the accounts or disclosures to which it relates.
Income taxes - Recognition and recoverability of deferred tax assets on tax losses related to the Company's subsidiary in Luxembourg
As described in Notes II. O and IV. 22 to the consolidated financial statements, at 31 December 2023, the Company’s deferred tax assets amounted to 1,051.4 million USD, of which 550.3 million USD corresponds to tax losses recognized during 2023 related to its Luxembourg subsidiary. Deferred income tax is recognized applying the liability method on temporary differences arising between the tax bases of assets and liabilities and their carrying amounts in the financial statements. Deferred tax assets related to tax losses are recognized to the extent it is probable that future taxable profits will be available, against which such losses can be utilized. Management applies significant judgment in assessing the likelihood that future taxable profits will be available. In determining the amount of deferred tax assets to be recognized, management considered existing evidence, both positive and negative, including the historical taxable profits and the projections of future taxable profits.
The principal considerations for our determination that performing procedures relating to the recognition and recoverability of deferred tax assets on tax losses related to its Luxembourg subsidiary is a critical audit matter are (i) the significant judgment by management when determining the recognition and recoverability of deferred tax assets; and (ii) a high degree of auditor judgment, subjectivity, and effort in performing procedures and evaluating management’s assessment related to future taxable profits.
Addressing the matter involved performing procedures and evaluating audit evidence in connection with forming our overall opinion on the consolidated financial statements. These procedures included testing the effectiveness of controls relating to the recognition and recoverability of deferred tax assets. These procedures also included, among others (i) testing management’s process for developing the future taxable profits, considering the applicable tax regulations; (ii) testing the completeness and accuracy of underlying data used in measuring and recognizing deferred tax assets; (iii) testing the mathematical accuracy of the models used in management’s assessment; (iv) evaluating the sufficiency of the disclosures in the consolidated financial statements; (v) evaluating the reasonability of management’s projections of future taxable profits. Evaluating the reasonability of management’s projections of future taxable profits involved evaluating whether the assumptions used by management were reasonable considering (i) the current and past taxable profits; and (ii) the consistency with external market and industry data.
| PricewaterhouseCoopers, Société coopérative | Luxembourg, 27 March 2024 |
| Represented by |
/s/ Gilles Vanderweyen
Gilles Vanderweyen
We have served as the Company’s auditor since 2011.
| Consolidated Financial Statements | |
| For the years ended 2023, 2022 and 2021 - all amounts in thousands of U.S. dollars, unless otherwise stated |
CONSOLIDATED INCOME STATEMENTS
|
|
|
Year ended December 31, |
|||||||
|
|
Notes |
2023 |
2022 |
2021 |
|||||
|
Net sales |
1 |
|
|
|
|||||
|
Cost of sales |
2 |
( |
) |
( |
) |
( |
) | ||
|
Gross profit |
|
|
|
|
|||||
|
Selling, general and administrative expenses |
3 |
( |
) |
( |
) |
( |
) | ||
|
Impairment charge |
5 |
|
( |
) |
( |
) | |||
|
Other operating income |
6 |
|
|
|
|||||
|
Other operating expenses |
6 |
( |
) |
( |
) |
( |
) | ||
|
Operating income |
|
|
|
|
|||||
|
Finance income |
7 |
|
|
|
|||||
|
Finance cost |
7 |
( |
) |
( |
) |
( |
) | ||
|
Other financial results |
7 |
|
( |
) |
|
||||
|
Income before equity in earnings of non-consolidated companies and income tax |
|
|
|
|
|||||
|
Equity in earnings of non-consolidated companies |
8 |
|
|
|
|||||
|
Income before income tax |
|
|
|
|
|||||
|
Income tax |
9 |
( |
) |
( |
) |
( |
) | ||
|
Income for the year |
|
|
|
|
|||||
|
|
|
|
|
|
|||||
|
Attributable to: |
|
|
|
|
|||||
|
Shareholders' equity |
|
|
|
|
|||||
|
Non-controlling interests |
|
|
( |
) |
( |
) | |||
|
|
|
|
|
|
|||||
|
Earnings per share attributable to shareholders' equity during the year: |
|
|
|
|
|||||
|
Weighted average number of ordinary outstanding shares (thousands) |
|
|
|
|
|||||
|
|
|
|
|
|
|||||
|
Basic and diluted earnings per share (U.S. dollars per share) |
|
|
|
|
|||||
|
Basic and diluted earnings per ADS (U.S. dollars per ADS) (*) |
|
|
|
|
|||||
| (*) |
The accompanying notes are an integral part of these Consolidated Financial Statements.
| Consolidated Financial Statements | |
| For the years ended 2023, 2022 and 2021 - all amounts in thousands of U.S. dollars, unless otherwise stated |
CONSOLIDATED STATEMENTS OF COMPREHENSIVE INCOME
|
|
Year ended December 31, |
||||||||||
|
|
2023 |
2022 |
2021 |
||||||||
|
Income for the year |
|
|
|
||||||||
|
Items that may be subsequently reclassified to profit or loss: |
|
|
|
||||||||
|
Currency translation adjustment |
|
( |
) |
( |
) | ||||||
|
Reclassification of currency translation adjustment reserve (*) |
( |
) |
( |
) |
|
||||||
|
Change in value of cash flow hedges and instruments at fair value (**) |
( |
) |
( |
) |
( |
) | |||||
|
Income tax relating to components of other comprehensive income |
( |
) |
|
( |
) | ||||||
|
From participation in non-consolidated companies: |
|
|
|
||||||||
|
- Currency translation adjustment |
|
|
( |
) | |||||||
|
- Changes in the value of cash flow hedges and instruments at fair value |
( |
) |
|
|
|||||||
|
|
( |
) |
( |
) |
( |
) | |||||
|
Items that will not be reclassified to profit or loss: |
|
|
|
||||||||
|
Remeasurements of post-employment benefit obligations |
( |
) |
|
|
|||||||
|
Income tax on items that will not be reclassified |
|
( |
) |
( |
) | ||||||
|
Remeasurements of post-employment benefit obligations of non-consolidated companies |
( |
) |
|
|
|||||||
|
|
( |
) |
|
|
|||||||
|
Other comprehensive (loss) for the year |
( |
) |
( |
) |
( |
) | |||||
|
Total comprehensive income for the year |
|
|
|
||||||||
|
|
|
|
|
||||||||
|
Attributable to: |
|
|
|
||||||||
|
Shareholders' equity |
|
|
|
||||||||
|
Non-controlling interests |
|
( |
) |
( |
) | ||||||
|
|
|
|
|
||||||||
| (*) | |
| (**) |
The accompanying notes are an integral part of these Consolidated Financial Statements.
| Consolidated Financial Statements | |
| For the years ended 2023, 2022 and 2021 - all amounts in thousands of U.S. dollars, unless otherwise stated |
Consolidated STATEMENTS OF FINANCIAL POSITION
|
|
|
At December 31, 2023 |
|
At December 31, 2022 |
||||||||
|
|
Notes |
|
|
|
||||||||
|
ASSETS |
|
|
|
|
|
|
||||||
|
Non-current assets |
|
|
|
|
|
|
||||||
|
Property, plant and equipment, net |
11 |
|
|
|
|
|
||||||
|
Intangible assets, net |
12 |
|
|
|
|
|
||||||
|
Right-of-use assets, net |
13 |
|
|
|
|
|
||||||
|
Investments in non-consolidated companies |
14 |
|
|
|
|
|
||||||
|
Other investments |
20 |
|
|
|
|
|
||||||
|
Deferred tax assets |
22 |
|
|
|
|
|
||||||
|
Receivables, net |
15 |
|
|
|
|
|
||||||
|
Current assets |
|
|
|
|
|
|
||||||
|
Inventories, net |
16 |
|
|
|
|
|
||||||
|
Receivables and prepayments, net |
17 |
|
|
|
|
|
||||||
|
Current tax assets |
18 |
|
|
|
|
|
||||||
|
Trade receivables, net |
19 |
|
|
|
|
|
||||||
|
Derivative financial instruments |
26 |
|
|
|
|
|
||||||
|
Other investments |
20 |
|
|
|
|
|
||||||
|
Cash and cash equivalents |
20 |
|
|
|
|
|
||||||
|
Total assets |
|
|
|
|
|
|
||||||
|
EQUITY |
|
|
|
|
|
|
||||||
|
Shareholders' equity |
|
|
|
|
|
|
||||||
|
Non-controlling interests |
|
|
|
|
|
|
||||||
|
Total equity |
|
|
|
|
|
|
||||||
|
LIABILITIES |
|
|
|
|
|
|
||||||
|
Non-current liabilities |
|
|
|
|
|
|
||||||
|
Borrowings |
21 |
|
|
|
|
|
||||||
|
Lease liabilities |
13 |
|
|
|
|
|
||||||
|
Derivative financial instruments |
26 |
|
|
|
|
|
||||||
|
Deferred tax liabilities |
22 |
|
|
|
|
|
||||||
|
Other liabilities |
23 (i) |
|
|
|
|
|
||||||
|
Provisions |
24 |
|
|
|
|
|
||||||
|
Current liabilities |
|
|
|
|
|
|
||||||
|
Borrowings |
21 |
|
|
|
|
|
||||||
|
Lease liabilities |
13 |
|
|
|
|
|
||||||
|
Derivative financial instruments |
26 |
|
|
|
|
|
||||||
|
Current tax liabilities |
18 |
|
|
|
|
|
||||||
|
Other liabilities |
23 (ii) |
|
|
|
|
|
||||||
|
Provisions |
25 (ii) |
|
|
|
|
|
||||||
|
Customer advances |
|
|
|
|
|
|
||||||
|
Trade payables |
|
|
|
|
|
|
||||||
|
Total liabilities |
|
|
|
|
|
|
||||||
|
Total equity and liabilities |
|
|
|
|
|
|
||||||
Contingencies, commitments and restrictions on the distribution of profits are disclosed in note 27 to these Consolidated Financial Statements.
The accompanying notes are an integral part of these Consolidated Financial Statements.
| Consolidated Financial Statements | |
| For the years ended 2023, 2022 and 2021 - all amounts in thousands of U.S. dollars, unless otherwise stated |
Consolidated statementS of changes in equity
|
|
Shareholders' equity |
|
|
||||||||||||||||||||||||||
|
|
Share Capital (1) |
Treasury Shares (2) |
Legal Reserves |
Share Premium |
Currency Translation Adjustment |
Other Reserves (3) |
Retained Earnings (4) |
Total |
Non-controlling interests |
Total |
|||||||||||||||||||
|
Balance at December 31, 2022 |
|
- |
|
|
( |
) |
( |
) |
|
|
|
|
|||||||||||||||||
|
Income for the year |
- |
- |
- |
- |
- |
- |
|
|
|
|
|||||||||||||||||||
|
Currency translation adjustment |
- |
- |
- |
- |
|
- |
- |
|
|
|
|||||||||||||||||||
|
Reclassification of currency translation adjustment reserve |
- |
- |
- |
- |
( |
) |
- |
- |
( |
) |
- |
( |
) | ||||||||||||||||
|
Remeasurements of post-employment benefit obligations, net of taxes |
- |
- |
- |
- |
- |
( |
) |
( |
) |
( |
) |
( |
) |
( |
) | ||||||||||||||
|
Change in value of instruments at fair value through other comprehensive income and cash flow hedges, net of taxes (5) |
- |
- |
- |
- |
- |
( |
) |
- |
( |
) |
- |
( |
) | ||||||||||||||||
|
From other comprehensive income of non-consolidated companies |
- |
- |
- |
- |
|
( |
) |
- |
|
- |
|
||||||||||||||||||
|
Other comprehensive (loss) income for the year |
- |
- |
- |
- |
|
( |
) |
( |
) |
( |
) |
|
( |
) | |||||||||||||||
|
Total comprehensive income (loss) for the year |
- |
- |
- |
- |
|
( |
) |
|
|
|
|
||||||||||||||||||
|
Repurchase of own shares (2) |
- |
( |
) |
- |
- |
- |
- |
- |
( |
) |
- |
( |
) | ||||||||||||||||
|
Shares to be settled under buyback program (6) |
- |
- |
- |
- |
- |
( |
) |
- |
( |
) |
- |
( |
) | ||||||||||||||||
|
Acquisition and other changes in non-controlling interests (7) |
- |
- |
- |
- |
- |
- |
|
|
|
|
|||||||||||||||||||
|
Dividends paid in cash |
- |
- |
- |
- |
- |
- |
( |
) |
( |
) |
( |
) |
( |
) | |||||||||||||||
|
Balance at December 31, 2023 |
|
( |
) |
|
|
( |
) |
( |
) |
|
|
|
|
||||||||||||||||
| (1) | |
| (2) | |
| (3) | |
| (4) | |
| (5) | |
| (6) | |
| (7) |
The accompanying notes are an integral part of these Consolidated Financial Statements.
| Consolidated Financial Statements | |
| For the years ended 2023, 2022 and 2021 - all amounts in thousands of U.S. dollars, unless otherwise stated |
|
|
Shareholders' equity |
|
|
|||||||||||||||||||||||
|
|
Share Capital (1) |
Legal Reserves |
Share Premium |
Currency Translation Adjustment |
Other Reserve (2) |
Retained Earnings |
Total |
Non-controlling interests |
Total |
|||||||||||||||||
|
Balance at December 31, 2021 |
|
|
|
( |
) |
( |
) |
|
|
|
|
|||||||||||||||
|
Income (loss) for the year |
- |
- |
- |
- |
- |
|
|
( |
) |
|
||||||||||||||||
|
Currency translation adjustment |
- |
- |
- |
( |
) |
- |
- |
( |
) |
( |
) |
( |
) | |||||||||||||
|
Reclassification of currency translation adjustment reserve (3) |
- |
- |
- |
( |
) |
- |
- |
( |
) |
- |
( |
) | ||||||||||||||
|
Remeasurements of post-employment benefit obligations, net of taxes |
- |
- |
- |
- |
|
|
|
|
|
|||||||||||||||||
|
Change in value of instruments at fair value through other comprehensive income and cash flow hedges, net of taxes |
- |
- |
- |
- |
( |
) |
- |
( |
) |
( |
) |
( |
) | |||||||||||||
|
From other comprehensive income of non-consolidated companies |
- |
- |
- |
|
|
- |
|
- |
|
|||||||||||||||||
|
Other comprehensive (loss) income for the year |
- |
- |
- |
( |
) |
|
|
( |
) |
|
( |
) | ||||||||||||||
|
Total comprehensive income (loss) for the year |
- |
- |
- |
( |
) |
|
|
|
( |
) |
|
|||||||||||||||
|
Acquisition and other changes in non-controlling interests |
- |
- |
- |
- |
- |
- |
- |
( |
) |
( |
) | |||||||||||||||
|
Dividends paid in cash |
- |
- |
- |
- |
- |
( |
) |
( |
) |
( |
) |
( |
) | |||||||||||||
|
Balance at December 31, 2022 |
|
|
|
( |
) |
( |
) |
|
|
|
|
|||||||||||||||
| (1) | |
| (2) | |
| (3) |
The accompanying notes are an integral part of these Consolidated Financial Statements.
| Consolidated Financial Statements | |
| For the years ended 2023, 2022 and 2021 - all amounts in thousands of U.S. dollars, unless otherwise stated |
|
|
Shareholders' equity |
|
|
|||||||||||||||||||||||
|
|
Share Capital (1) |
Legal Reserves |
Share Premium |
Currency Translation Adjustment |
Other Reserves (2) |
Retained Earnings |
Total |
Non-controlling interests |
Total |
|||||||||||||||||
|
Balance at December 31, 2020 |
|
|
|
( |
) |
( |
) |
|
|
|
|
|||||||||||||||
|
Income (loss) for the year |
- |
- |
- |
- |
- |
|
|
( |
) |
|
||||||||||||||||
|
Currency translation adjustment |
- |
- |
- |
( |
) |
- |
- |
( |
) |
( |
) |
( |
) | |||||||||||||
|
Remeasurements of post-employment benefit obligations, net of taxes |
- |
- |
- |
- |
|
( |
) |
|
( |
) |
|
|||||||||||||||
|
Change in value of instruments at fair value through other comprehensive income and cash flow hedges, net of taxes |
- |
- |
- |
- |
( |
) |
- |
( |
) |
|
( |
) | ||||||||||||||
|
From other comprehensive income of non-consolidated companies |
- |
- |
- |
( |
) |
|
- |
( |
) |
- |
( |
) | ||||||||||||||
|
Other comprehensive (loss) income for the year |
- |
- |
- |
( |
) |
|
( |
) |
( |
) |
|
( |
) | |||||||||||||
|
Total comprehensive income (loss) for the year |
- |
- |
- |
( |
) |
|
|
|
( |
) |
|
|||||||||||||||
|
Acquisition and other changes in non-controlling interests (3) |
- |
- |
- |
- |
- |
- |
- |
|
|
|||||||||||||||||
|
Dividends paid in cash |
- |
- |
- |
- |
- |
( |
) |
( |
) |
( |
) |
( |
) | |||||||||||||
|
Balance at December 31, 2021 |
|
|
|
( |
) |
( |
) |
|
|
|
|
|||||||||||||||
| (1) | |
| (2) | |
| (3) |
| Consolidated Financial Statements | |
| For the years ended 2023, 2022 and 2021 - all amounts in thousands of U.S. dollars, unless otherwise stated |
CONSOLIDATED STATEMENTS OF CASH FLOWS
|
|
|
Year ended December 31, |
|||||||
|
|
Notes |
2023 |
2022 |
2021 |
|||||
|
Cash flows from operating activities |
|
|
|
|
|||||
|
Income for the year |
|
|
|
|
|||||
|
Adjustments for: |
|
|
|
|
|||||
|
Depreciation and amortization |
11, 12 & 13 |
|
|
|
|||||
|
Impairment charge |
5 |
|
|
|
|||||
|
Income tax accruals less payments |
30(ii) |
( |
) |
|
|
||||
|
Equity in earnings of non-consolidated companies |
8 |
( |
) |
( |
) |
( |
) | ||
|
Interest accruals less payments, net |
30(iii) |
( |
) |
|
( |
) | |||
|
Changes in provisions |
24 & 25(ii) |
|
|
|
|||||
|
Reclassification of currency translation adjustment reserve (*) |
6 & 36 |
( |
) |
( |
) |
|
|||
|
Result of sale of subsidiaries |
6 |
|
|
( |
) | ||||
|
Changes in working capital (**) |
30(i) |
|
( |
) |
( |
) | |||
|
Others, including net exchange differences |
|
( |
) |
|
( |
) | |||
|
Net cash provided by operating activities |
|
|
|
|
|||||
|
|
|
|
|
|
|||||
|
Cash flows from investing activities |
|
|
|
|
|||||
|
Capital expenditures |
11 & 12 |
( |
) |
( |
) |
( |
) | ||
|
Changes in advance to suppliers of property, plant and equipment |
|
|
( |
) |
( |
) | |||
|
Proceeds from sale of subsidiaries, net of cash |
6 |
|
|
|
|||||
|
Acquisition of subsidiaries, net of cash acquired (***) |
34 |
( |
) |
( |
) |
|
|||
|
Investment in companies under cost method |
|
( |
) |
|
( |
) | |||
|
Additions to associated companies |
14 (b) |
( |
) |
|
|
||||
|
Loan to joint-ventures |
14 (c) |
( |
) |
- |
- |
||||
|
Proceeds from disposal of property, plant and equipment and intangible assets |
|
|
|
|
|||||
|
Dividends received from non-consolidated companies |
8 |
|
|
|
|||||
|
Changes in investments in securities |
|
( |
) |
|
|
||||
|
Net cash (used in) provided by investing activities |
|
( |
) |
( |
) |
|
|||
|
|
|
|
|
|
|||||
|
Cash flows from financing activities |
|
|
|
|
|||||
|
Dividends paid |
10 |
( |
) |
( |
) |
( |
) | ||
|
Dividends paid to non-controlling interest in subsidiaries |
|
( |
) |
( |
) |
( |
) | ||
|
Changes in non-controlling interests |
|
|
( |
) |
|
||||
|
Acquisition of treasury shares |
37 |
( |
) |
|
|
||||
|
Payments of lease liabilities |
13 |
( |
) |
( |
) |
( |
) | ||
|
Proceeds from borrowings |
|
|
|
|
|||||
|
Repayments of borrowings |
|
( |
) |
( |
) |
( |
) | ||
|
Net cash used in financing activities |
|
( |
) |
( |
) |
( |
) | ||
|
|
|
|
|
|
|||||
|
Increase (decrease) in cash and cash equivalents |
|
|
|
( |
) | ||||
|
|
|
|
|
|
|||||
|
Movement in cash and cash equivalents |
|
|
|
|
|||||
|
At the beginning of the year |
|
|
|
|
|||||
|
Effect of exchange rate changes |
|
( |
) |
( |
) |
( |
) | ||
|
Increase (decrease) in cash and cash equivalents |
|
|
|
( |
) | ||||
|
At December 31, |
|
|
|
|
|||||
|
|
|
|
|
|
|||||
|
|
|
|
|||||||
|
|
|
At December 31, |
|||||||
|
Cash and cash equivalents |
|
2023 |
2022 |
2021 |
|||||
|
Cash and bank deposits |
20 |
|
|
|
|||||
|
Bank overdrafts |
21 |
( |
) |
( |
) |
( |
) | ||
|
|
|
|
|
|
|||||
| (*) | |
| (**) | |
| (***) | |
|
For 2022, related to Parques Eólicos de la Buena Ventura S.A. acquisition. |
The accompanying notes are an integral part of these Consolidated Financial Statements.
| Consolidated Financial Statements | |
| For the years ended 2023, 2022 and 2021 - all amounts in thousands of U.S. dollars, unless otherwise stated |
Index TO the notes to the consolidated financial statements
|
I |
GENERAL INFORMATION |
IV |
OTHER NOTES TO THE CONSOLIDATED FINANCIAL STATEMENTS |
|
|
|
1 |
Segment information |
|
II |
ACCOUNTING POLICIES |
2 |
Cost of sales |
|
A |
Basis of presentation |
3 |
Selling, general and administrative expenses |
|
B |
Group accounting |
4 |
Labor costs (included in Cost of sales and in Selling, general and administrative expenses) |
|
C |
Segment information |
5 |
Impairment charge |
|
D |
Foreign currency translation |
6 |
Other operating income and expenses |
|
E |
Property, plant and equipment |
7 |
Financial results |
|
F |
Intangible assets |
8 |
Equity in earnings of non-consolidated companies |
|
G |
Right-of-use assets and lease liabilities |
9 |
Income tax |
|
H |
Impairment of non-financial assets |
10 |
Dividends distribution |
|
I |
Other investments |
11 |
Property, plant and equipment, net |
|
J |
Inventories |
12 |
Intangible assets, net |
|
K |
Trade and other receivables |
13 |
Right-of-use assets, net and lease liabilities |
|
L |
Cash and cash equivalents |
14 |
Investments in non-consolidated companies |
|
M |
Equity |
15 |
Receivables non-current |
|
N |
Borrowings |
16 |
Inventories, net |
|
O |
Current and deferred income tax |
17 |
Receivables and prepayments, net |
|
P |
Employee benefits |
18 |
Current tax assets and liabilities |
|
Q |
Provisions |
19 |
Trade receivables, net |
|
R |
Trade and other payables |
20 |
Cash and cash equivalents and other investments |
|
S |
Revenue recognition |
21 |
Borrowings |
|
T |
Cost of sales and other selling expenses |
22 |
Deferred tax assets and liabilities |
|
U |
Earnings per share |
23 |
Other liabilities |
|
V |
Financial instruments |
24 |
Non-current allowances and provisions |
|
|
|
25 |
Current allowances and provisions |
|
III |
FINANCIAL RISK MANAGEMENT |
26 |
Derivative financial instruments |
|
|
|
27 |
Contingencies, commitments and restrictions on the distribution of profits |
|
A |
Financial risk factors |
28 |
Cancellation of title deed in Saudi Steel Pipe Company |
|
B |
Category of financial instruments and classification within the fair value hierarchy |
29 |
Foreign exchange control measures in Argentina |
|
C |
Fair value estimation |
30 |
Cash flow disclosures |
|
D |
Accounting for derivative financial instruments and hedging activities |
31 |
Related party transactions |
|
|
|
32 |
Principal accountant fees |
|
|
|
33 |
Principal subsidiaries |
|
|
|
34 |
Business combinations |
|
|
|
35 |
Nationalization of Venezuelan subsidiaries |
|
|
|
36 |
Termination of NKKTubes joint venture |
|
|
|
37 |
Share buyback program |
|
|
|
38 |
Climate change |
|
|
|
39 |
Events after the reporting period |
| Consolidated Financial Statements | |
| For the years ended 2023, 2022 and 2021 - all amounts in thousands of U.S. dollars, unless otherwise stated |
I. GENERAL INFORMATION
Tenaris S.A. (the “Company”) was established as a public limited liability company (société anonyme) under the laws of the Grand-Duchy of Luxembourg on December 17, 2001. The Company holds, either directly or indirectly, controlling interests in various subsidiaries in the steel pipe manufacturing and distribution businesses. References in these Consolidated Financial Statements to “Tenaris” refer to the Company and its consolidated subsidiaries. A list of the principal Company’s subsidiaries is included in note 33 to these Consolidated Financial Statements.
The Company’s shares trade on the Italian Stock Exchange and the Mexican Stock Exchange; and the Company’s American Depositary Securities (“ADS”) trade on the New York Stock Exchange.
These Consolidated Financial Statements were approved for issuance by the Company’s Board of Directors on February 21, 2024.
II. ACCOUNTING POLICIES
The accounting policies applied in the preparation of these Consolidated Financial Statements are set out below. These policies have been consistently applied to all the years presented, unless otherwise stated.
A Basis of presentation
The Consolidated Financial Statements of Tenaris have been prepared in accordance with International Financial Reporting Standards (“IFRS" or "IFRS Accounting Standards”), as issued by the International Accounting Standards Board (“IASB”) and in accordance with IFRS as adopted by the European Union, under the historical cost convention, as modified by the revaluation of certain financial assets and liabilities (including derivative instruments) and plan assets at fair value. The Consolidated Financial Statements are, unless otherwise noted, presented in thousands of U.S. dollars (“$”).
Whenever necessary, certain comparative amounts have been reclassified to conform to changes in presentation in the current year.
The preparation of Consolidated Financial Statements in conformity with IFRS requires management to make certain accounting estimates and assumptions that might affect among others, the reported amounts of assets, liabilities, contingent liabilities, revenues and expenses. Actual results may differ from these estimates. The main areas involving material estimates or judgements are: impairment of goodwill and long-lived assets (notes II.H), impairment in investments in associates (note II.B); income taxes including recoverability of deferred tax assets (note II.O); obsolescence of inventory (note II.J); contingencies (note II.Q); allowance for trade receivables (note II.K); post-employment and other long-term benefits (note II.P); business combinations (notes II.B); useful lives of property, plant and equipment and other long-lived assets (notes II.E, II.F, II.H) and property title ownership restriction (note IV.28). During the year there were no significant changes in the material accounting estimates and judgements.
(1) Accounting pronouncements applicable as from January 1, 2023
Amendments to IAS 12 - International Tax Reform - Pillar Two Model Rules
In December 2021, the Organization for Economic Co-operation and Development (“OECD”) released the Pillar Two model rules (the Global Anti-Base Erosion rules, or “GloBE”) to reform international corporate taxation. Following Pillar Two OECD’s initiative, the European Union adopted in December 2022 a directive to impose a global minimum taxation for multinational companies in the Union, to be effective as from 2024.
In May 2023, the IASB made narrow-scope amendments to IAS 12 setting an exception that provides relief from the requirement to recognize and disclose deferred taxes arising from enacted or substantively enacted tax laws that implement the Pillar Two model rules, including tax laws that implement qualified domestic minimum top-up taxes as per described in those rules.
On December 20, 2023, the Luxembourg Parliament approved the Pillar Two law transposing the EU Pillar Two Directive into domestic legislation. The law enters into force as from fiscal years starting on or after 31 December 2023.
The Company is within the scope of the rules, and therefore will be required to calculate its GloBE effective tax rate for each jurisdiction where it operates and will be liable to pay a top-up tax for the difference between its GloBE effective tax rate per jurisdiction and the
Other accounting pronouncements that became effective during 2023 have no material effect on the Company’s financial condition or results of operations.
(2) New accounting pronouncements not applicable as of December 31, 2023
Certain newly published accounting standards, amendments to accounting standards and interpretations are not mandatory for December 31, 2023 reporting periods and have not been early adopted by the Company. These standards, amendments or interpretations are not expected to have a material impact in the current or future reporting periods and on foreseeable future transactions.
B Group accounting
(1) Subsidiaries and transactions with non-controlling interests
Subsidiaries are all entities over which Tenaris has control. Tenaris controls an entity when it is exposed to, or has rights to, variable returns from its involvement with the entity and has the ability to affect those returns through its power over the entity. In some cases, the Company considers that it has the ability to affect returns through its power over an entity even if it holds less than
The acquisition method is used to account for the acquisition of subsidiaries by Tenaris. The cost of an acquisition is measured as the fair value of the assets transferred, equity instruments issued and liabilities incurred or assumed at the date of exchange. Acquisition-related costs are expensed as incurred. Identifiable assets acquired, liabilities and contingent liabilities assumed in a business combination are generally measured initially at their fair values at the acquisition date. Any non-controlling interest in the acquiree is measured either at fair value or at the non-controlling interest’s proportionate share of the acquiree’s net identifiable assets. The excess of the aggregate of the consideration transferred and the amount of any non-controlling interest in the acquiree over the fair value of the identifiable net assets acquired is recorded as goodwill. If this is less than the fair value of the net assets of the subsidiary acquired, the difference is recognized directly in the Consolidated Income Statement.
Contingent consideration is classified either as equity or as a financial liability. Amounts classified as a financial liability are subsequently remeasured to fair value with changes in fair value recognized in profit or loss.
If the business combination is achieved in stages, the acquisition date carrying value of the acquirer’s previously held equity interest in the acquiree is remeasured to fair value at the acquisition date. Any gains or losses arising from such remeasurement are recognized in profit or loss.
Transactions with non-controlling interests that do not result in a loss of control are accounted as transactions with equity owners of the Company. For purchases from non-controlling interests, the difference between any consideration paid and the relevant share acquired of the carrying value of net assets of the subsidiary is recorded in equity. Gains or losses on disposals to non-controlling interests are also recorded in equity.
When the Company ceases to have control or significant influence, any retained interest in the entity is remeasured to its fair value, with the change in carrying amount recognized in profit or loss. The fair value is the initial carrying amount for the purposes of subsequently accounting for the retained interest as an associate, joint venture or financial asset. In addition, any amounts previously recognized in other comprehensive income in respect of that entity are accounted for as if the group had directly disposed of the related assets or liabilities. This may mean that amounts previously recognized in other comprehensive income are reclassified to profit or loss.
Material intercompany transactions, balances and unrealized gains (losses) on transactions between Tenaris subsidiaries have been eliminated in consolidation. However, since the functional currency of some subsidiaries is its respective local currency, some financial gains (losses) arising from intercompany transactions are generated. These are included in the Consolidated Income Statement under Other financial results.
(2) Non-consolidated companies
Non-consolidated companies are all entities in which Tenaris has significant influence but not control, generally accompanying a shareholding of between
Under the equity method, the investments are initially recognized at cost and adjusted thereafter to recognize Tenaris’s share of the post-acquisition profits or losses of the investee in profit or loss, and Tenaris’s share of movements in other comprehensive income of the investee in other comprehensive income. Dividends received or receivable from associates and joint ventures are recognized as a reduction in the carrying amount of the investment.
If material, unrealized results on transactions between Tenaris and its non-consolidated companies are eliminated to the extent of Tenaris’s interest in the non-consolidated companies. Unrealized losses are also eliminated unless the transaction provides evidence of an impairment indicator of the asset transferred. Financial statements of non-consolidated companies are adjusted where necessary to ensure consistency with IFRS.
The Company’s pro-rata share of earnings in non-consolidated companies is recorded in the Consolidated Income Statement under Equity in earnings of non-consolidated companies. The Company’s pro-rata share of changes in other comprehensive income is recognized in the Consolidated Statement of Comprehensive Income.
a) Ternium
At December 31, 2023, Tenaris held
- both the Company and Ternium are under the indirect common control of San Faustin S.A. (“San Faustin”);
- four out of eight members of Ternium’s board of directors (including Ternium’s chairman) are also members of the Company’s board of directors;
- under the shareholders’ agreement by and between the Company and Techint Holdings S.àr.l ("Techint"), a wholly owned subsidiary of San Faustin and Ternium’s main shareholder, dated January 9, 2006 Techint, is required to take actions within its power to cause (a) one of the members of Ternium’s board of directors to be nominated by the Company and (b) any director nominated by the Company to be removed from Ternium’s board of directors only pursuant to previous written instructions of the Company.
b) Usiminas
At December 31, 2023, Tenaris held, through its Brazilian subsidiary Confab Industrial S.A. (“Confab”),
Confab’s participation in Usiminas share capital is the result of a series of acquisitions, the first of which was performed on January 16, 2012, pursuant to which Ternium (through certain of its subsidiaries) and Confab acquired a large block of Usiminas ordinary shares and joined Usiminas’ existing control group. Subsequently, in 2016, Ternium and Confab subscribed to additional ordinary shares and to preferred shares.
More recently, on March 30, 2023, Confab, together with Ternium (through its subsidiaries Ternium Investments and Ternium Argentina), agreed to acquire an additional
The Usiminas control group comprises the T/T Group, formed by Ternium Investments, Ternium Argentina and Confab; the NSC Group, comprising Nippon Steel Corporation, Mitsubishi and MetalOne; and Usiminas’ employee pension fund, Previdência Usiminas. At December 31, 2023, the Usiminas control group held, in the aggregate,
Upon closing of the July 3, 2023 acquisition, the then existing Usiminas shareholders agreement governing the relationship between the T/T Group, the NSC Group and Previdência Usiminas was replaced by a new shareholders agreement setting forth a new governance structure for Usiminas. The T/T Group is now entitled to nominate a majority of the Usiminas board of directors, the chief executive officer and
At any time after the second anniversary of the closing of the transaction, the T/T Group will have the right to buy the NSC Group’s remaining interest in the Usiminas control group (
Confab and the Ternium entities party to the Usiminas shareholders agreement have a separate shareholders agreement governing their respective rights and obligations as members of the T/T Group. Under such separate agreement, Confab enjoys certain rights with respect to the governance of Usiminas, including, among others, the ability to nominate certain Usiminas’ officers and directors. Those circumstances evidence that Tenaris continues having significant influence over Usiminas and, as a result, continues accounting for its investment under the equity method.
c) Techgen
Techgen S.A. de C.V. (“Techgen”), which operates an electric power plant in Mexico, is a joint venture company owned
d) Global Pipe Company
Global Pipe Company (“GPC”) is a joint venture, established in 2010 and located in Jubail, Saudi Arabia, which manufactures LSAW pipes. Until May 16, 2023, Tenaris, through its subsidiary Saudi Steel Pipe Company ("SSPC") owned
On May 17, 2023, SSPC acquired an additional
For more information on GPC's acquisition and its accounting treatment see note 34 “Business Combinations - Global Pipe Company acquisition”.
Tenaris carries its investments in non-consolidated companies under the equity method, with
C Segment information
The Company is organized in
The Tubes segment includes the production and sale of both seamless and welded steel tubular products and related services mainly for the oil and gas industry, particularly oil country tubular goods (“OCTG”) used in drilling operations, and for other industrial applications with production processes that consist in the transformation of steel into tubular products. Business activities included in this segment are mainly dependent on the worldwide oil and gas industry, as this industry is a major consumer of steel pipe products, particularly OCTG used in drilling activities. Demand for steel pipe products from the oil and gas industry has historically been volatile and depends primarily upon the number of oil and natural gas wells being drilled, completed and reworked, and the depth and drilling conditions of these wells. Sales are generally made to end users, with exports being done through a centrally managed global distribution network and domestic sales are made through local subsidiaries.
The Other segment includes all business activities related to the production and selling of sucker rods, coiled tubing, tubes used for plumbing and construction applications, oilfield / hydraulic fracturing services, the recently acquired coating business and others as energy and raw materials that exceed internal requirements.
Tenaris’s Chief Operating Decision Maker (“CODM”) reviews operating and financial performance information with senior management on a monthly basis. This information differs from IFRS principally as follows:
- the use of direct cost methodology to calculate the inventories, while under IFRS it is at full cost, including absorption of production overheads and depreciation;
- the use of costs based on previously internally defined cost estimates, while, under IFRS, costs are calculated at historical cost, mainly on a FIFO basis;
- any currency translation adjustment reclassification, when applicable, for companies that under IFRS had a different functional currency than the U.S. dollar; and
- other timing differences, if any.
Tenaris presents its geographical information in four areas: North America, South America, Europe and Asia Pacific, Middle East and Africa. For purposes of reporting geographical information, net sales are allocated to geographical areas based on the customer’s location; allocation of assets, capital expenditures and associated depreciations and amortizations are based on the geographical location of the assets.
D Foreign currency translation
(1) Functional and presentation currency
IAS 21 (revised), “The effects of changes in foreign exchange rates” defines the functional currency as the currency of the primary economic environment in which an entity operates.
The functional and presentation currency of the Company is the U.S. dollar. The U.S. dollar is the currency that best reflects the economic substance of the underlying events and circumstances relevant to Tenaris’s global operations.
Starting January 1, 2023, the Company changed the functional currency of its Brazilian subsidiaries, from the Brazilian Real to the U.S. dollar.
This decision was a result of a significant increase of its Brazilian Subsidiaries’ participation in the OCTG and line pipe international markets, a trend which started in recent years and has been strengthened in 2022, an increased level of integration of the local operations within Tenaris’s international commercial and supply chain system, as well as the fact that the main purchase agreement contracts and the long term sales agreement contracts with major international and local oil companies are either entered or indexed to the U.S. dollar. Local steel prices are also being affected by the U.S. dollar / Brazilian Real fluctuations.
Except for the Italian subsidiaries whose functional currency is the Euro and
- sales are mainly negotiated, denominated and / or settled in U.S. dollars. If priced in a currency other than the U.S. dollar, the sales price may consider exposure to fluctuation in the exchange rate against the U.S. dollar;
- prices of their critical raw materials and inputs are priced and / or settled in U.S. dollars;
- transaction and operational environment and the cash flow of these operations have the U.S. dollar as reference currency;
- there is a significant level of integration of the local operations within Tenaris's international global distribution network;
- net financial assets and liabilities are mainly received and maintained in U.S. dollars; and
- the exchange rate of certain legal currencies has long-been affected by recurring and severe economic crises.
(2) Transactions in currencies other than the functional currency
Transactions in currencies other than the functional currency are translated into the functional currency using the exchange rates prevailing at the date of the transactions or valuation where items are re-measured.
At the end of each reporting period: (i) monetary items denominated in currencies other than the functional currency are translated using the closing rates; (ii) non-monetary items that are measured in terms of historical cost in a currency other than the functional currency are translated using the exchange rates prevailing at the date of the transactions; and (iii) non-monetary items that are measured at fair value in a currency other than the functional currency are translated using the exchange rates prevailing at the date when the fair value was determined.
Foreign exchange gains and losses resulting from the settlement of such transactions and from the translation at year-end exchange rates of monetary assets and liabilities denominated in currencies other than the functional currency are recorded as gains and losses from foreign exchange and included in Other financial results in the Consolidated Income Statement, except when deferred in equity as qualifying cash flow hedges and qualifying net investment hedges.
(3) Translation of financial information in currencies other than the functional currency
Results of operations for subsidiaries whose functional currencies are not the U.S. dollar are translated into U.S. dollars at the average exchange rates for each quarter of the year. Financial statement positions are translated at the period-end exchange rates. Translation differences are recognized in a separate component of equity as currency translation adjustments. In the case of a sale or other disposal of any of such subsidiaries, any accumulated translation difference would be recognized in the Consolidated Income Statement as a gain or loss from the sale or disposal following IAS 21.
Goodwill and fair value adjustments arising from the acquisition of a foreign operation are treated as assets and liabilities of the foreign operation and translated at the closing exchange rate.
E Property, plant and equipment
Property, plant and equipment are recognized at historical acquisition or construction cost less accumulated depreciation and impairment losses. Historical cost includes expenditure that is directly attributable to the acquisition of the items. Property, plant and equipment acquired through acquisitions accounted for as business combinations have been valued initially at the fair market value of the assets acquired.
Major overhaul and rebuilding expenditures are capitalized as property, plant and equipment only when it is probable that future economic benefits associated with the item will flow to the Company and the investment enhances the condition of assets beyond its original condition. The carrying amount of the replaced part is derecognized. Maintenance expenses on manufacturing properties are recorded as cost of products sold in the year in which they are incurred.
Cost may also include transfers from equity of any gains or losses on qualifying cash flow hedges of foreign currency purchases of property, plant and equipment.
Borrowing costs that are attributable to the acquisition or construction of certain capital assets are capitalized as part of the cost of the asset, in accordance with IAS 23 (revised), “Borrowing Costs”. Assets for which borrowing costs are capitalized are those that require a substantial period of time to prepare for their intended use.
The depreciation method is reviewed at each year end. Depreciation is calculated using the straight-line method to depreciate the cost of each asset to its residual value over its estimated useful life, as follows:
|
|
Land |
No Depreciation |
|
|
Buildings and improvements |
|
|
|
Plant and production equipment |
|
|
|
Vehicles, furniture and fixtures, and other equipment |
|
The assets’ residual values and useful lives of significant plant and production equipment are reviewed and adjusted, if appropriate, at each year-end date. An asset’s carrying amount is written down immediately to its recoverable amount if the asset’s carrying amount is greater than its estimated recoverable amount.
Management’s re-estimation of assets useful lives, performed in accordance with IAS 16, “Property, Plant and Equipment”, resulted in additional depreciation expenses of approximately $
Tenaris depreciates each significant part of an item of property, plant and equipment for its different production facilities that (i) can be properly identified as an independent component with a cost that is significant in relation to the total cost of the item, and (ii) has a useful operating life that is different from another significant part of that same item of property, plant and equipment.
Gains and losses on disposals are determined by comparing the proceeds with the carrying amount of assets and are recognized under Other operating income or Other operating expenses in the Consolidated Income Statement.
F Intangible assets
(1) Goodwill
Goodwill represents the excess of the acquisition cost over the fair value of Tenaris’s share of net identifiable assets acquired as part of business combinations determined mainly by independent valuations. Goodwill is tested at least annually for impairment and carried at cost less accumulated impairment losses. Impairment losses on goodwill are not reversed. Goodwill is included in the Consolidated Statement of Financial Position under Intangible assets, net.
For the purpose of impairment testing, goodwill is allocated to a cash generating unit (“CGU”) or group of CGUs that are expected to benefit from the business combination which generated the goodwill being tested.
(2) Information systems projects
Costs associated with maintaining computer software programs are generally recognized as an expense as incurred. However, costs directly related to the development, acquisition and implementation of information systems are recognized as intangible assets if it is probable that they have economic benefits exceeding one year and comply with the recognition criteria of IAS 38, “Intangible Assets”.
Information systems projects recognized as assets are amortized using the straight-line method over their useful lives, generally not exceeding a period of
Management’s re-estimation of assets useful lives, performed in accordance with IAS 38, did not materially affect amortization expenses for 2023, 2022 and 2021.
(3) Licenses, patents, trademarks and proprietary technology
Licenses, patents, trademarks, and proprietary technology are initially recognized at fair value at the acquisition date. Licenses, patents, proprietary technology and those trademarks that have a finite useful life are carried at cost less accumulated amortization. Amortization is calculated using the straight-line method to allocate the cost over their estimated useful lives, which are in the range between
The balance of acquired trademarks that have indefinite useful lives according to external appraisal amounts to $
Management’s re-estimation of assets useful lives, performed in accordance with IAS 38, did not materially affect amortization expenses for 2023, 2022 and 2021.
(4) Research and development
Research expenditures as well as development costs that do not fulfill the criteria for capitalization are recorded as Cost of sales in the Consolidated Income Statement as incurred. Research and development expenditures included in Cost of sales for the years 2023, 2022 and 2021 totaled $
Capitalized costs were not material for the years 2023, 2022 and 2021.
(5) Customer relationships
In accordance with IFRS 3, "Business Combinations" and IAS 38, Tenaris has recognized the value of customer relationships separately from goodwill attributable to the acquisition of Maverick Tube Corporation (“Maverick”) and Hydril Company (“Hydril”) groups, SSPC, Ipsco Tubulars Inc. (“IPSCO”) and the more recent acquisition of Mattr’s pipe coating business unit.
Customer relationships acquired in a business combination are recognized at fair value at the acquisition date, have a finite useful life and are carried at cost less accumulated amortization. Amortization is calculated using the straight line method over the initial expected useful lives which were approximately
In 2022, the Company reviewed the useful life of SSPC’s customer relationships and decided to reduce it from
Management’s re-estimation of assets useful lives, performed in accordance with IAS 38, did not affect amortization expenses for 2023 and 2021.
As of December 31, 2023 the net book value of SSPC’s customer relationship amounted to $
G Right-of-use assets and lease liabilities
Leases are recognized as a right-of-use asset and a corresponding liability at the date at which the leased asset is available for use by the group. Each lease payment is allocated between the liability and finance cost. The finance cost is charged to profit or loss over the lease period so as to produce a constant periodic rate of interest on the remaining balance of the liability for each period. The right-of-use asset is depreciated over the lease term on a straight-line basis.
Lease liabilities include the net present value of i) fixed payments, less any lease incentives receivable, ii) variable lease payments that are based on an index or a rate, iii) amounts expected to be payable by the lessee under residual value guarantees, iv) the exercise price of a purchase option if the lessee is reasonably certain to exercise that option, and v) payments of penalties for terminating the lease, if the lease term reflects the lessee exercising that option.
The lease payments are discounted using the interest rate implicit in the lease. If that rate cannot be determined, the lessee’s incremental borrowing rate is used, being the rate that the lessee would have to pay to borrow the funds necessary to obtain an asset of similar value in a similar economic environment with similar terms and conditions.
Right-of-use assets are measured at cost comprising the amount of the initial measurement of the lease liability, any lease payments made at or before the commencement date less any lease incentives received and any initial direct costs incurred by the lessee.
In determining the lease term, management considers all facts and circumstances that create an economic incentive to exercise an extension option or early termination, or not to exercise a termination option. Extension options (or periods after termination options) are only included in the lease term if the lease is reasonably certain to be extended (or not terminated).
Payments associated with short-term leases, variable leases and leases of low value assets are recognized on a straight-line basis as expenses in profit or loss. Short-term leases are leases with a lease term of
H Impairment of non-financial assets
Long-lived assets including identifiable intangible assets are reviewed for impairment at the lowest level for which there are separately identifiable cash flows (“CGU”). Most of the Company’s principal subsidiaries that constitute a CGU have a single main production facility and, accordingly, each of such subsidiaries represents the lowest level of asset aggregation that generates largely independent cash inflows.
Assets that are subject to amortization or depreciation are reviewed for impairment whenever events or changes in circumstances indicate that the carrying amount may not be recoverable. Intangible assets with indefinite useful lives, including goodwill, are subject to at least an annual impairment test, or are tested more frequently if events or circumstances indicate that the carrying amount value may be impaired. In some situations where there have not been significant changes to CGU assets and liabilities as well as external and internal events and circumstances which could materially alter the recoverable amount of the CGU, the most recent detailed calculation of recoverable amount made in a preceding period may be used in the impairment test for that CGU in the current period.
In assessing whether there is any indication that a CGU may be impaired, external and internal sources of information are analyzed. Material facts and circumstances specifically considered in the analysis usually include the discount rate used in Tenaris’s cash flow projections and the business condition in terms of competitive, economic and regulatory factors, such as the cost of raw materials, oil and gas prices, and the evolution of the rig count.
An impairment loss is recognized for the amount by which the asset’s carrying amount exceeds its recoverable amount. The recoverable amount is the higher between the asset’s value in use and fair value less costs of disposal. Any impairment loss is allocated to reduce the carrying amount of the assets of the CGU in the following order:
(a) first, to reduce the carrying amount of any goodwill allocated to the CGU; and
(b) then, to the other assets of the unit (group of units) pro-rata on the basis of the carrying amount of each asset in the unit (group of units), considering not to reduce the carrying amount of the asset below the highest of its fair value less cost of disposal, its value in use or zero.
Value in use is calculated by discounting the estimated cash flows over a period (or higher if the period can be justified) based on forecasts approved by management. For the subsequent years beyond the five-year period, a terminal value is calculated based on perpetuity considering a nominal growth rate of
For purposes of calculating the fair value less costs of disposal, Tenaris uses the estimated value of future cash flows that a market participant could generate from the corresponding CGU.
Management judgment is required to estimate discounted future cash flows. Actual cash flows and values could vary significantly from the forecasted future cash flows and related values derived using discounting techniques.
Non-financial assets other than goodwill that suffered an impairment are reviewed for possible reversal at each reporting date. For more information on impairment charges see note 5 to these Consolidated Financial Statements.
I Other investments
Other investments consist primarily of investments in financial instruments and time deposits with a maturity of more than three months at the date of purchase.
Certain non-derivative financial assets that the Company held not for trading have been categorized as financial assets at fair value through other comprehensive income (“FVOCI”), as the business model objective is achieved by both holding financial assets in order to collect contractual cash flows and selling financial assets. They are carried at fair value and interest income from these financial assets is included in finance income using the effective interest rate method. Unrealized gains or losses are recorded as a fair value adjustment in the Consolidated Statement of Comprehensive Income and transferred to the Consolidated Income Statement when the financial asset is disposed. Exchange gains and losses and impairments related to the financial assets are immediately recognized in the Consolidated Income Statement. FVOCI instruments with maturities greater than
Other investments in financial instruments and time deposits are categorized as financial assets at fair value through profit or loss (“FVPL”) because such investments are held for trading and their performance is evaluated on a fair value basis. The results of these investments are recognized in Financial Results in the Consolidated Income Statement.
Purchases and sales of financial investments are recognized as of their settlement date.
The fair values of quoted investments are generally based on current bid prices. If the market for a financial investment is not active or the securities are not listed, Tenaris estimates the fair value by using standard valuation techniques. See section III Financial Risk Management.
J Inventories
Inventories are stated at the lower between cost and net realizable value. The cost of finished goods and goods in process is comprised of raw materials, direct labor, utilities, freights and other direct costs and related production overhead costs, and it excludes borrowing costs. The allocation of fixed production costs, including depreciation and amortization charges, is based on the normal level of production capacity. Inventories cost is mainly based on the FIFO method. Tenaris estimates the net realizable value of inventories by grouping, where applicable, similar or related items. Net realizable value is the estimated selling price in the ordinary course of business, less any estimated costs of completion and selling expenses. Goods in transit as of year-end are valued based on the supplier’s invoice cost.
Tenaris establishes an allowance for obsolete or slow-moving inventories related to finished goods, goods in process, supplies and spare parts. For slow moving or obsolete finished products, an allowance is established based on management’s analysis of product aging. An allowance for obsolete and slow-moving inventory of supplies and spare parts is established based on management's analysis of such items to be used as intended and the consideration of potential obsolescence due to technological changes, aging and consumption patterns.
K Trade and other receivables
Trade and other receivables are recognized initially at fair value that corresponds to the amount of consideration that is unconditional unless they contain significant financing components. The Company holds trade receivables with the objective to collect the contractual cash flows and therefore measures them subsequently at amortized cost using the effective interest method. Due to their short-term nature, their carrying amount is considered to be the same as their fair value.
Tenaris applies the IFRS 9 “Financial Instruments” simplified approach to measure expected credit losses, which uses a lifetime expected loss allowance for all trade receivables. To measure the expected credit losses, trade receivables have been grouped based on shared credit risk characteristics and the days past due. The expected loss rates are based on the payment profiles of sales over a period of
L Cash and cash equivalents
Cash and cash equivalents are comprised of cash at banks, liquidity funds and short-term investments with a maturity of less than three months at the date of purchase which are readily convertible to known amounts of cash. Assets recorded in cash and cash equivalents are carried at fair market value or at historical cost which approximates fair market value.
In the Consolidated Statement of Financial Position, bank overdrafts are included in Borrowings in current liabilities.
For the purposes of the Consolidated Statement of Cash Flows, Cash and cash equivalents includes overdrafts.
M Equity
(1) Equity components
The Consolidated Statement of Changes in Equity includes:
- the value of share capital, legal reserve,share premium and other distributable reserves calculated in accordance with Luxembourg law;
- the currency translation adjustment,treasury shares, other reserves, retained earnings and non-controlling interest calculated in accordance with IFRS.
(2) Share capital
The Company has an authorized share capital of a single class of
(3) Treasury Shares
Acquisitions of treasury shares are recorded at acquisition cost, deducted from equity until disposal or cancellation. Any potential gains or losses on disposal of treasury shares are recognized under Other reserves in the Consolidated Statement of Changes in Equity. Treasury shares outstanding as of December 31, 2023, were
(4) Dividends distribution by the Company to shareholders
Dividends distributions are recorded in the Company’s financial statements when Company’s shareholders have the right to receive the payment, or when interim dividends are approved by the Board of Directors in accordance with the by-laws of the Company.
Dividends may be paid by the Company to the extent that it has distributable retained earnings, calculated in accordance with Luxembourg law. See note 27 (iii) to these Consolidated Financial Statements.
N Borrowings
Borrowings are recognized initially at fair value net of transaction costs incurred and subsequently measured at amortized cost. Any difference between the proceeds (net of transaction costs) and the redemption amount is recognized in profit or loss over the period of the borrowings using the effective interest method.
O Current and deferred income tax
The income tax expense or credit for the period is the tax payable or recoverable on the current period’s taxable income based on the applicable income tax rate for each jurisdiction adjusted by changes in deferred tax assets and liabilities attributable to temporary differences and to unused tax losses. Current and deferred tax is recognized in the Consolidated Income Statement, except to the extent that it relates to items recognized in other comprehensive income or directly in equity. In these cases, the tax is also recognized in other comprehensive income or directly in equity, respectively.
The current income tax charge is calculated on the basis of the tax laws enacted or substantively enacted at the reporting date in the countries where the Company’s subsidiaries operate and generate taxable income.
Deferred income tax is recognized applying the liability method on temporary differences arising between the tax bases of assets and liabilities and their carrying amounts in the financial statements. The temporary differences arise mainly from net operating loss carry-forwards, the effect of currency translation on depreciable fixed assets and inventories, depreciation on property, plant and equipment, valuation of inventories, provisions for post-employment benefits and other long-term employee benefits and fair value adjustments of assets acquired in business combinations. However, deferred tax liabilities are not recognized if they arise from the initial recognition of goodwill. Deferred tax assets and liabilities are measured at the tax rates that are expected to apply in the time period when the asset is realized or the liability is settled, based on tax laws that have been enacted or substantively enacted at the reporting date.
Management periodically evaluates positions taken in tax returns with respect to situations in which applicable tax regulation is subject to interpretation and considers whether it is probable that a taxation authority will accept an uncertain tax treatment. The Company measures its tax balances either based on the most likely amount or the expected value, depending on which method provides a better prediction of the resolution of the uncertainty.
Deferred tax assets are recognized to the extent that it is probable that future taxable profits will be available against which the temporary differences and losses can be utilized. At the end of each reporting period, Tenaris reassesses unrecognized deferred tax assets. Tenaris recognizes a previously unrecognized deferred tax asset to the extent that it has become probable that future taxable income will allow the deferred tax asset to be recovered.
Deferred tax liabilities and assets are not recognized for temporary differences between the carrying amount and tax basis of investments in foreign operations where the company is able to control the timing of the reversal of the temporary differences and it is probable that the differences will not reverse in the foreseeable future.
Deferred tax assets and liabilities are offset when there is a legally enforceable right to offset current tax assets and liabilities and when the deferred tax balances relate to the same taxation authority. Current tax assets and tax liabilities are offset where the entity has a legally enforceable right to offset and intends either to settle on a net basis, or to realize the asset and settle the liability simultaneously.
Deferred tax assets and liabilities are re-measured if tax rates change. These amounts are charged or credited to the Consolidated Income Statement or to the item Other comprehensive income in the Consolidated Statement of Comprehensive Income, depending on the account to which the original amount was charged or credited.
P Employee benefits
(1) Short-term obligations
Liabilities for wages and salaries are recognized in respect of employees’ services up to the end of the reporting period and are measured at the amounts expected to be paid when the liabilities are settled. The liabilities are presented as current employee benefit obligations in the balance sheet.
(2) Post-employment benefits
The Company has defined benefit and defined contribution plans. A defined benefit plan is a pension plan that defines an amount of pension benefit that an employee will receive on retirement, usually dependent on one or more factors such as age, years of service and compensation.
The liability recognized in the statement of financial position in respect of defined benefit pension plans is the present value of the defined benefit obligation at the end of the reporting period less the fair value of plan assets, if any. The defined benefit obligation is calculated annually (at year end) by independent actuaries using the projected unit credit method. The present value of the defined benefit obligation is determined by discounting the estimated future cash flows using interest rates of high-quality corporate bonds that are denominated in the currency in which the benefits will be paid, and that have terms to maturity approximating to the terms of the related pension obligation.
Remeasurement gains and losses arising from experience adjustments and changes in actuarial assumptions are charged or credited to equity in Other comprehensive income in the period in which they arise. Past-service costs are recognized immediately in the Income Statement.
For defined benefit funded plans, net interest income / expense is calculated based on the surplus or deficit derived by the difference between the defined benefit obligations less fair value of plan assets.
For defined contribution plans, the Company pays contributions to publicly or privately administered pension insurance plans on a mandatory, contractual or voluntary basis. The Company has no further payment obligations once the contributions have been paid. The contributions are recognized as employee benefit expenses when they are due. Prepaid contributions are recognized as an asset to the extent that a cash refund or a reduction in the future payments is available.
Tenaris sponsors funded and unfunded defined benefit pension plans in certain subsidiaries. The most significant are:
|
• |
An unfunded defined benefit employee retirement plan for certain senior officers. The plan is designed to provide certain benefits to those officers (additional to those contemplated under applicable labor laws) in case of termination of the employment relationship due to certain specified events, including retirement. This unfunded plan provides defined benefits based on years of service and final average salary. As of December 31, 2023 the outstanding liability for this plan amounts to $ |
| • |
Employees’ service rescission indemnity. The cost of this obligation is charged to the Consolidated Income Statement over the expected service lives of employees. This provision is primarily related to the liability accrued for employees at Tenaris’s Italian subsidiary. As from January 1, 2007 as a consequence of a change in an Italian law, employees were entitled to make contributions to external funds, thus, Tenaris’s Italian subsidiary pays every year the required contribution to the funds with no further obligation. As a result, the plan changed from a defined benefit plan to a defined contribution plan effective from that date, but only limited to the contributions of 2007 onwards. As of December 31, 2023 the outstanding liability for this plan amounts to $ |
| • |
Funded retirement benefit plan held in the U.S. for the benefit of some employees hired prior a certain date, frozen for the purposes of credited service as well as determination of final average pay for the retirement benefit calculation. Plan assets consist primarily of investments in equities and money market funds. Additionally, an unfunded post-retirement health and life plan is in place that offers limited medical and life insurance benefits to the retirees, frozen to new participants. As of December 31, 2023 the outstanding liability for these plans amounts to $ |
| • | Funded retirement benefit plans held in Canada for salary and hourly employees hired prior to a certain date based on years of service and, in the case of salaried employees, final average salary. Plan assets consist primarily of annuities purchased from an insurance company for the benefit of current and future retirees, investments in debt and equity instruments. Both plans were replaced for defined contribution plans. Effective June 2016 the salary plan was frozen for the purposes of credited service as well as determination of final average pay. As of December 31, 2023 the plan was overfunded and the net assets related to this plan amounted to $ |
(3) Other long-term benefits
During 2007, Tenaris launched an employee retention and long-term incentive program (“the Program”) applicable to certain senior officers and employees of the Company, who will be granted a number of units throughout the duration of the Program. The value of each of these units is based on Tenaris’s shareholders’ equity (excluding non-controlling interest). Until the end of 2017, the units were vested ratably over a period of
The beneficiaries of the Program are entitled to receive cash amounts based on: (i) the amount of dividend payments made by Tenaris to its shareholders and (ii) the number of units held by each beneficiary to the Program. The payment of the benefit is tied to the book value of the shares, and not to their market value. Tenaris valued this long-term incentive program as a long-term benefit plan as classified in IAS 19, “Employee Benefits”.
As of December 31, 2023 and 2022, the outstanding liability corresponding to the Program amounts to $
(4) Termination benefits
Termination benefits are payable when employment is terminated by Tenaris before the normal retirement date, or when an employee accepts voluntary redundancy in exchange for these benefits. Tenaris recognizes termination benefits at the earlier of the following dates: (a) when it can no longer withdraw the offer of those benefits; and (b) when the costs for a restructuring that is within the scope of IAS 37 involves the payment of terminations benefits. In the case of an offer made to encourage voluntary redundancy, the termination benefits are measured based on the number of employees expected to accept the offer.
(5) Other compensation obligations
Employee entitlements to annual leave, long-service leave, sick leave and other bonuses and compensations obligations are accrued as earned.
Compensation to employees in the event of dismissal is charged to income in the year in which it becomes payable.
Q Provisions
Tenaris is subject to various claims, lawsuits and other legal proceedings, including customer claims, in which a third party is seeking payment for alleged damages, reimbursement for losses or indemnity. Tenaris’s potential liability with respect to such claims, lawsuits and other legal proceedings cannot be estimated with certainty. Management periodically reviews the status of each significant matter and assesses potential financial exposure. If, as a result of past events, a potential loss from a claim or proceeding is considered probable and the amount can be reliably estimated, a provision is recorded. Accruals for loss contingencies reflect a reasonable estimate of the losses to be incurred based on information available to management as of the date of preparation of the financial statements, and take into consideration Tenaris’s litigation and settlement strategies. These estimates are primarily constructed with the assistance of legal counsel. As the scope of liabilities become better defined, there may be changes in the estimates of future costs which could have a material adverse effect on its results of operations, financial condition and cash flows.
If Tenaris expects to be reimbursed for an accrued expense, as would be the case for an expense or loss covered under an insurance contract, and reimbursement is considered virtually certain, the expected reimbursement is recognized as a receivable.
This note should be read in conjunction with note 27 to these Consolidated Financial Statements.
R Trade and other payables
Trade and other payables are recognized initially at fair value, generally the nominal invoice amount and subsequently measured at amortized cost. They are presented as current liabilities unless payment is not due within twelve months after the reporting period. Due to their short-term nature their carrying amounts are considered to be the same as their fair value.
S Revenue recognition
Revenue comprises the fair value of the consideration received or receivable for the sale of goods and rendering of services in the ordinary course of Tenaris’s activities. The revenue recognized by the Company is measured at the transaction price of the consideration received or receivable to which the Company is entitled to, reduced by estimated returns and other customer credits, such as discounts and volume rebates, based on the expected value to be realized and after eliminating sales within the group.
Revenue is recognized at a point in time or over time from sales when control has been transferred and there is no unfulfilled performance obligation that could affect the acceptance of the product by the customer. The control is transferred upon delivery. Delivery occurs when the products have been shipped to the specific location, the risks of obsolescence and loss have been transferred and either the customer has accepted the product in accordance with the sales contract, the acceptance provisions have lapsed or the Company has objective evidence that all criteria for acceptance have been satisfied, including all performance obligations. These conditions are determined and analyzed on a contract by contract basis to ensure that all performance obligations are fulfilled. In particular, Tenaris verifies customer acceptance of the goods, the satisfaction of delivery terms and any other applicable condition.
For bill and hold transactions revenue is recognized only to the extent that (a) the reason for the bill and hold arrangement must be substantive (for example, the customer has requested the arrangement); (b) the products have been specifically identified and are ready for delivery; (c) the Company does not have the ability to use the product or to direct it to another customer; (d) the usual payment terms apply.
The Company’s contracts with customers do not provide any material variable consideration, other than discounts, rebates and right of return. Discounts and rebates are recognized based on the most likely value and rights of return are based on expected value considering past experience and contract conditions.
Where the contracts include multiple performance obligations, the transaction price is allocated to each performance obligation based on the stand-alone selling prices. Where these are not directly observable, they are estimated based on the expected cost plus margin.
There are no judgements applied by management that significantly affect the determination of timing of satisfaction of performance obligations, nor the transaction price and amounts allocated to different performance obligations.
Tenaris provides services primarily related to goods sold, which represent a non-material portion of sales revenue and mainly include:
Pipe Management Services: This comprises mainly preparation of the pipes ready to be run, delivery to the customer, storage services and rig return.
Field Services: Comprises field technical support and running assistance.
These services are rendered in connection to the sales of goods and are attached to contracts with customers for the sale of goods. A significant portion of service revenue is recognized in the same period as the goods sold. There are no distinct uncertainties in the revenues and cash flows of the goods sold and services rendered as they are included in the same contract, have the same counterparty and are subject to the same conditions.
The Company also provides hydraulic fracturing, coiled tubing and coating services. The revenue related to these services is included in the Other segment.
Revenue from providing services is recognized over time in the accounting period in which the services are rendered.
The following inputs and outputs methods are applied to recognize revenue considering the nature of service:
Storage services: the Company provides storage services in owned or third-party warehouses, subject to a variable fee to be invoiced. This fee is determined based on the time that the customer maintains the material in the warehouse and the amount of the material stored. In the majority of cases, to quantify the amount to be invoiced in any given month, the monthly average fee of storage per ton is multiplied by the monthly average stock stored (in tons).
Freights: the revenue is recognized on a pro rata basis considering the units delivered and time elapsed.
Field services: the revenue is recognized considering output methods, in particular surveys of service completion provided by the customer.
The Company does not expect to have any contracts where the period between the transfer of the promised goods or services to the customer and payment by the customer exceeds one year. As a consequence, considering that the contracts do not include any significant financing component, the Company does not adjust any of the transaction prices for the time value of money. For this reason, the Company is also applying the practical expedient not to disclose details on transaction prices allocated to the remaining performance obligations as of the end of the reporting period.
Tenaris only provides standard quality warranties assuring that the goods sold will function as expected or are fit for their intended purpose, with no incremental service to the customer. Accordingly, warranties do not constitute a separate performance obligation.
Other revenues earned by Tenaris are recognized on the following basis:
- Interest income: on the effective yield basis.
- Dividend income from investments in other companies: when Tenaris’s right to receive payment is established.
- Net income from other sales: when control is transferred to the customer.
- Construction / coating contracts revenues: in accordance with the stage of the project completion.
T Cost of sales and other selling expenses
Cost of sales and other selling expenses are recognized in the Consolidated Income Statement on the accrual basis of accounting.
Commissions, freights and other selling expenses, including shipping and handling costs, are recorded in Selling, general and administrative expenses in the Consolidated Income Statement.
U Earnings per share
Earnings per share are calculated by dividing the income attributable to the shareholders’ equity by the monthly weighted average number of common shares outstanding during the period.
There are
V Financial instruments
Non-derivative financial instruments comprise investments in financial debt instruments and equity, time deposits, trade and other receivables, cash and cash equivalents, borrowings and trade and other payables.
The Company classifies its financial instruments according to the following measurement categories:
- those to be measured subsequently at fair value (either through OCI or through profit or loss), and
- those to be measured at amortised cost.
The classification depends on the Company’s business model for managing the financial assets and contractual terms of the cash flows.
Financial assets are recognized on their settlement date. Financial assets are derecognized when the rights to receive cash flows from the financial assets have expired or have been transferred and the Company has transferred substantially all the risks and rewards of ownership.
At initial recognition, the Company measures a financial asset at its fair value plus, in the case of a financial asset not at fair value through profit or loss, transaction costs that are directly attributable to the acquisition of the financial asset. Transaction costs of financial assets carried at fair value through profit or loss are expenses in profit or loss.
Subsequent measurement of debt instruments depends on the Company’s business model for managing the asset and the cash flow characteristics of the asset. There are three measurement categories into which the Company classifies its debt instruments:
Amortized Cost: Assets that are held for collection of contractual cash flows where those cash flows represent solely payments of principal and interest. Interest income from these financial assets is included in finance income using the effective interest rate method.
Exchange gains and losses and impairments related to the financial assets are immediately recognized in the Consolidated Income Statement.
Fair value through other comprehensive income: Assets that are held for collection of contractual cash flows and for selling the financial assets, where the assets’ cash flows represent solely payments of principal and interest. Interest income from these financial assets is included in finance income using the effective interest rate method. Unrealized gains or losses are recorded as a fair value adjustment in the Consolidated Statement of Comprehensive Income and transferred to the Consolidated Income Statement when the financial asset is sold.
Fair value through profit and loss: Assets that do not meet the criteria for amortized cost or FVOCI. Changes in fair value of financial instruments at FVPL are immediately recognized in the Consolidated Income Statement.
Equity instruments are subsequently measured at fair value.
Accounting for derivative financial instruments and hedging activities is included within the section III, Financial Risk Management.
| Consolidated Financial Statements | |
| For the years ended 2023, 2022 and 2021 - all amounts in thousands of U.S. dollars, unless otherwise stated |
iii. Financial risk management
The multinational nature of Tenaris’s operations and customer base exposes the Company to a variety of risks, mainly related to market risks (including the effects of changes in foreign currency exchange rates and interest rates), credit risk and capital market risk. In order to manage the volatility related to these exposures, management evaluates exposures on a consolidated basis, taking advantage of exposure netting. The Company or its subsidiaries may then enter into various derivative transactions in order to prevent potential adverse impacts on Tenaris’s financial performance. Such derivative transactions are executed in accordance with internal policies and hedging practices.
A. Financial risk factors
(i) Capital risk management
Tenaris seeks to maintain a low debt to total equity ratio considering the industry and the markets where it operates. The year-end ratio of debt to total equity (where “debt” comprises financial borrowings and “total equity” is the sum of financial borrowings and equity) is
(ii) Foreign exchange risk
Tenaris manufactures and sells its products in a number of countries throughout the world and consequently is exposed to foreign exchange rate risk. Since the Company’s functional currency is the U.S. dollar the purpose of Tenaris’s foreign currency hedging program is mainly to reduce the risk caused by changes in the exchange rates of other currencies against the U.S. dollar.
Tenaris’s exposure to currency fluctuations is reviewed on a periodic and consolidated basis. A number of derivative transactions are performed in order to achieve an efficient coverage in the absence of operative or natural hedges. Almost all of these transactions are forward exchange rates contracts. See note 26 to these Consolidated Financial Statements.
Tenaris does not enter into derivative financial instruments for trading or other speculative purposes, other than non-material investments in structured products.
In the case of subsidiaries with functional currencies other than the U.S. dollar, the results of hedging activities, reported in accordance with IFRS, may not reflect entirely the management’s assessment of its foreign exchange risk hedging program. Intercompany balances between Tenaris’s subsidiaries may generate financial gains (losses) to the extent that functional currencies differ.
The value of Tenaris’s financial assets and liabilities is subject to changes arising from the variation of foreign currency exchange rates. The following table provides a breakdown of Tenaris’s main financial assets and liabilities (including foreign exchange derivative contracts) which impact the Company’s profit and loss as of December 31, 2023 and 2022.
|
All amounts Long / (Short) in thousands of U.S. dollars |
As of December 31, |
||||
|
Currency Exposure / Functional currency |
2023 |
2022 |
|||
|
Argentine Peso / U.S. dollar |
( |
) |
( |
) | |
|
Euro / U.S. dollar |
( |
) |
( |
) | |
|
Saudi Arabian Riyal / U.S. dollar |
( |
) |
( |
) | |
| Consolidated Financial Statements | |
| For the years ended 2023, 2022 and 2021 - all amounts in thousands of U.S. dollars, unless otherwise stated |
The main relevant exposures correspond to:
- Argentine Peso / U.S. dollar
As of December 31, 2023 and 2022 consisting primarily of Argentine Peso-denominated financial, trade, social and fiscal payables at certain Argentine subsidiaries whose functional currency is the U.S. dollar. A change of 1% in the ARS/USD exchange rate would have generated a pre-tax gain / loss of $
- Euro / U.S. dollar
As of December 31, 2023 and 2022 consisting primarily of Euro-denominated intercompany liabilities at certain subsidiaries whose functional currency is the U.S. dollar. A change of 1% in the EUR/USD exchange rate would have generated a pre-tax gain / loss of $
- Saudi Arabian Riyal / U.S. dollar
As of December 31, 2023 and 2022 consisting primarily of Saudi Arabian Riyal-denominated financial and trade payables. The Saudi Arabian Riyal is tied to the U.S. dollar.
Considering the balances held as of December 31, 2023 on financial assets and liabilities exposed to foreign exchange rate fluctuations, Tenaris estimates that the impact of a simultaneous 1% favorable / unfavorable movement in the levels of foreign currencies exchange rates relative to the U.S. dollar, would be a pre-tax gain / loss of $
Tenaris based its foreign exchange sensitivity analysis on a
(iii) Interest rate risk
Tenaris is subject to interest rate risk on its investment portfolio and its debt. The Company uses a mix of variable and fixed rate debt in combination with its investment portfolio strategy. The Company may choose to enter into foreign exchange derivative contracts and / or interest rate swaps to mitigate the exposure to changes in the interest rates.
The following table summarizes the proportions of variable-rate and fixed-rate debt as of each year end.
|
|
As of December 31, |
||||||||||
|
|
2023 |
2022 |
|||||||||
|
|
In thousands of U.S. dollars |
% |
In thousands of U.S. dollars |
% |
|||||||
|
Fixed rate (*) |
|
|
|
|
|||||||
|
Variable rate |
|
|
|
|
|||||||
|
Total |
|
|
|
|
|||||||
(*)
| Consolidated Financial Statements | |
| For the years ended 2023, 2022 and 2021 - all amounts in thousands of U.S. dollars, unless otherwise stated |
The Company estimates that, if market interest rates applicable to Tenaris’s borrowings had been 100 basis points higher, then the additional pre-tax loss would have been $
Tenaris based its interest rate sensitivity analysis on a 100 basis points variance for information purposes only, enabling the analysis to any particular variance.
(iv) Credit risk
Credit risk arises from cash and cash equivalents, deposits with banks and financial institutions, as well as credit exposures to customers, including outstanding receivables and committed transactions. The Company also actively monitors the creditworthiness of its treasury, derivative and insurance counterparties in order to minimize its credit risk.
Tenaris maintains a strong, longstanding relationship with Petróleos Mexicanos (“Pemex”), one of the world’s largest crude oil and condensates producers and one of its largest customers. Over the past several months, Pemex has delayed payments beyond the agreed-upon due dates, resulting in Tenaris having a significant credit exposure to Pemex, which represented approximately
Tenaris’s credit policies related to sales of products and services are designed to identify customers with acceptable credit history and to allow Tenaris to require the use of credit insurance, letters of credit and other instruments designed to minimize credit risks whenever deemed necessary. Tenaris maintains allowances for impairment for potential credit losses. See section II.K.
As of December 31, 2023, trade receivables amounted to $
As of December 31, 2022, trade receivables amounted to $
Management believes that both the allowance for doubtful accounts and the existing guarantees are sufficient to cover doubtful trade receivables.
(v) Counterparty risk
Tenaris has investment guidelines with specific parameters to limit issuer risk on marketable securities. Counterparties for derivatives and cash transactions are limited to high credit quality financial institutions, normally investment grade.
Approximately
| Consolidated Financial Statements | |
| For the years ended 2023, 2022 and 2021 - all amounts in thousands of U.S. dollars, unless otherwise stated |
(vi) Liquidity risk
Tenaris’s financing strategy aims to maintain adequate financial resources and access to additional liquidity. During 2023, Tenaris has counted on cash flows from operations as well as additional bank financing to fund its transactions.
Management maintains sufficient cash and marketable securities to finance normal operations and believes that Tenaris also has appropriate access to market for short-term working capital needs.
Liquid financial assets as a whole (comprising cash and cash equivalents and other investments) were
Tenaris has a conservative approach to the management of its liquidity, which consists of i) cash and cash equivalents (cash in banks, liquidity funds and investments with a maturity of less than
Tenaris holds primarily investments in money market funds and variable or fixed-rate securities from investment grade issuers.
Tenaris holds its investments primarily in U.S. dollars. As of December 31, 2023 and 2022, U.S. dollar denominated liquid assets plus investments denominated in other currencies hedged to the U.S. dollar represented approximately
(vii) Commodity price risk
In the ordinary course of its operations, Tenaris purchases commodities and raw materials that are subject to price volatility caused by supply conditions, political and economic variables and other factors. As a consequence, Tenaris is exposed to risk resulting from fluctuations in the prices of these commodities and raw materials. Tenaris fixes the prices of such raw materials and commodities for short-term periods, typically not in excess of
B. Category of financial instruments and classification within the fair value hierarchy
As mentioned in note II.V, the Company classifies its financial instruments in the following measurement categories: amortized cost, fair value through other comprehensive income and fair value through profit and loss. For financial instruments that are measured in the statement of financial position at fair value, IFRS 13, “Fair value measurement” requires a disclosure of fair value measurements by level according to the following fair value measurement hierarchy:
Level 1: Quoted prices (unadjusted) in active markets for identical assets or liabilities.
Level 2: Inputs other than quoted prices included within Level 1 that are observable for the asset or liability, either directly (that is, as prices) or indirectly (that is, derived from prices).
Level 3: Inputs for the asset or liability that are not based on observable market data (that is, unobservable inputs).
| Consolidated Financial Statements | |
| For the years ended 2023, 2022 and 2021 - all amounts in thousands of U.S. dollars, unless otherwise stated |
The following tables present the financial instruments by category and levels as of December 31, 2023 and 2022.
|
|
Carrying amount |
Measurement Categories |
At Fair Value |
|||||||||||||||||
|
December 31, 2023 |
Amortized Cost |
FVOCI |
FVPL |
Level 1 |
Level 2 |
Level 3 |
||||||||||||||
|
Assets |
|
|
|
|
|
|
|
|||||||||||||
|
Cash and cash equivalents |
|
|
|
|
|
|
|
|||||||||||||
|
Other investments |
|
|
|
|
|
|
|
|||||||||||||
|
Fixed income (time-deposit, zero coupon bonds, commercial papers) |
|
|
|
|
|
|
|
|||||||||||||
|
U.S. Sovereign Bills |
|
|
|
|
|
|
|
|||||||||||||
|
Certificates of deposits |
|
|
|
|
|
|
|
|||||||||||||
|
Commercial papers |
|
|
|
|
|
|
|
|||||||||||||
|
Other notes |
|
|
|
|
|
|
|
|||||||||||||
|
Bonds and other fixed income |
|
|
|
|
|
|
|
|||||||||||||
|
U.S. government securities |
|
|
|
|
|
|
|
|||||||||||||
|
Non-U.S. government securities |
|
|
|
|
|
|
|
|||||||||||||
|
Corporates securities |
|
|
|
|
|
|
|
|||||||||||||
|
Mutual Fund |
|
|
|
|
|
|
|
|||||||||||||
|
Derivative financial instruments |
|
|
|
|
|
|
|
|||||||||||||
|
Other Investments Non-current |
|
|
|
|
|
|
|
|||||||||||||
|
Bonds and other fixed income |
|
|
|
|
|
|
|
|||||||||||||
|
Other investments |
|
|
|
|
|
|
|
|||||||||||||
|
Trade receivables |
|
|
|
|
|
|
|
|||||||||||||
|
Receivables C and NC |
|
|
|
|
|
|
|
|||||||||||||
|
Other receivables |
|
|
|
|
|
|
|
|||||||||||||
|
Other receivables (non-financial) |
|
|
|
|
|
|
|
|||||||||||||
|
Total |
|
|
|
|
|
|
|
|||||||||||||
|
Liabilities |
|
|
|
|
|
|
|
|||||||||||||
|
Borrowings C and NC |
|
|
|
|
|
|
|
|||||||||||||
|
Other liabilities C and NC (*) |
||||||||||||||||||||
|
Other liabilities |
||||||||||||||||||||
|
Other liabilities (non-financial) |
||||||||||||||||||||
|
Trade payables |
|
|
|
|
|
|
|
|||||||||||||
|
Lease Liabilities C and NC |
|
|
|
|
|
|
|
|||||||||||||
|
Derivative financial instruments |
|
|
|
|
|
|
|
|||||||||||||
|
Total |
|
|
|
|
|
|
|
|||||||||||||
(*)
| Consolidated Financial Statements | |
| For the years ended 2023, 2022 and 2021 - all amounts in thousands of U.S. dollars, unless otherwise stated |
|
|
Carrying amount |
Measurement Categories |
At Fair Value |
|||||||||||||||||
|
December 31, 2022 |
Amortized Cost |
FVOCI |
FVPL |
Level 1 |
Level 2 |
Level 3 |
||||||||||||||
|
Assets |
|
|
|
|
|
|
|
|||||||||||||
|
Cash and cash equivalents |
|
|
|
|
|
|
|
|||||||||||||
|
Other investments |
|
|
|
|
|
|
|
|||||||||||||
|
Fixed income (time-deposit, zero coupon bonds, commercial papers) |
|
|
|
|
|
|
|
|||||||||||||
|
Certificates of deposits |
|
|
|
|
|
|
|
|||||||||||||
|
Commercial papers |
|
|
|
|
|
|
|
|||||||||||||
|
Other notes |
|
|
|
|
|
|
|
|||||||||||||
|
Bonds and other fixed income |
|
|
|
|
|
|
|
|||||||||||||
|
Non-U.S. government securities |
|
|
|
|
|
|
|
|||||||||||||
|
Corporates securities |
|
|
|
|
|
|
|
|||||||||||||
|
Mutual Fund |
|
|
|
|
|
|
|
|||||||||||||
|
Derivative financial instruments |
|
|
|
|
|
|
|
|||||||||||||
|
Other Investments Non-current |
|
|
|
|
|
|
|
|||||||||||||
|
Bonds and other fixed income |
|
|
|
|
|
|
|
|||||||||||||
|
Other investments |
|
|
|
|
|
|
|
|||||||||||||
|
Trade receivables |
|
|
|
|
|
|
|
|||||||||||||
|
Receivables C and NC (*) |
|
|
|
|
|
|
|
|||||||||||||
|
Other receivables |
|
|
|
|
|
|
|
|||||||||||||
|
Other receivables (non-financial) |
|
|
|
|
|
|
|
|||||||||||||
|
Total |
|
|
|
|
|
|
|
|||||||||||||
|
Liabilities |
|
|
|
|
|
|
|
|||||||||||||
|
Borrowings C and NC |
|
|
|
|
|
|
|
|||||||||||||
|
Trade payables |
|
|
|
|
|
|
|
|||||||||||||
|
Lease Liabilities C and NC |
|
|
|
|
|
|
|
|||||||||||||
|
Derivative financial instruments |
|
|
|
|
|
|
|
|||||||||||||
|
Total |
|
|
|
|
|
|
|
|||||||||||||
(*)
| Consolidated Financial Statements | |
| For the years ended 2023, 2022 and 2021 - all amounts in thousands of U.S. dollars, unless otherwise stated |
There were no transfers between levels during the year.
The fair value of financial instruments traded in active markets is based on quoted market prices at the reporting date. A market is regarded as active if quoted prices are readily and regularly available from an exchange, dealer, broker, industry group, pricing service, or regulatory agency, and those prices represent actual and regularly occurring market transactions on an arm’s length basis. The quoted market price used for financial assets held by Tenaris is the current bid price. These instruments are included in Level 1 and comprise primarily corporate and sovereign debt securities.
The fair value of financial instruments that are not traded in an active market (such as certain debt securities, certificates of deposits with original maturity of more than
If one or more of the significant inputs are not based on observable market data, the instruments are included in Level 3. Tenaris values its assets and liabilities in this level using observable market inputs and management assumptions which reflect the Company’s best estimate on how market participants would price the asset or liability at measurement date. Main balances in this level include a liability related to the shares to be settled under the share buyback program recognized during the period. For more information see note 37.
The following table presents the changes in Level 3 assets:
|
|
Year ended December 31, |
||||
|
|
2023 |
2022 |
|||
|
At the beginning of the year |
|
|
|||
|
Decrease (*) |
( |
) |
( |
) | |
|
Currency translation adjustment and others |
( |
) |
( |
) | |
|
At the end of the year |
|
|
|||
(*)
| Consolidated Financial Statements | |
| For the years ended 2023, 2022 and 2021 - all amounts in thousands of U.S. dollars, unless otherwise stated |
C. Fair value estimation
Financial assets or liabilities classified at fair value through profit or loss are measured under the framework established by the IASB accounting guidance for fair value measurements and disclosures.
The fair values of quoted investments are generally based on current bid prices. If the market for a financial asset is not active or no market is available, fair values are established using standard valuation techniques.
The fair value of all outstanding derivatives is determined using specific pricing models that include inputs that are observable in the market or can be derived from or corroborated by observable data. The fair value of forward foreign exchange contracts is calculated as the net present value of the estimated future cash flows in each currency, based on observable yield curves, converted into U.S. dollars at the spot rate of the valuation date.
Borrowings are classified under other financial liabilities and measured at their amortized cost. Tenaris estimates that the fair value of its main financial liabilities is approximately
The carrying amount of investments valuated at amortized cost approximates its fair value.
D. Accounting for derivative financial instruments and hedging activities
Derivative financial instruments are initially recognized in the statement of financial position at fair value through profit and loss on each date a derivative contract is entered into and are subsequently remeasured at fair value. Specific tools are used for calculation of each instrument’s fair value and these tools are tested for consistency on a monthly basis. Market rates are used for all pricing operations. These include exchange rates, deposit rates and other discount rates matching the nature of each underlying risk.
As a general rule, Tenaris recognizes the full amount related to the change in fair value of derivative financial instruments in Financial Results in the Consolidated Income Statement.
Tenaris designates certain derivatives as hedges of particular risks associated with recognized assets or liabilities or highly probable forecast transactions. These transactions are classified as cash flow hedges. The effective portion of the fair value of derivatives that are designated and qualify as cash flow hedges is recognized in equity. Amounts accumulated in equity are then recognized in the income statement in the same period as the offsetting losses and gains on the hedged item. The gain or loss relating to the ineffective portion is recognized immediately in the income statement. The fair value of Tenaris’s derivative financial instruments (assets or liabilities) continues to be reflected in the statement of financial position.
For transactions designated and qualifying for hedge accounting, Tenaris documents at the inception of the transaction the relationship between hedging instruments and hedged items, as well as its risk management objectives and strategy for undertaking various hedge transactions. Tenaris also documents its assessment on an ongoing basis, of whether the hedging instruments are highly effective in offsetting changes in the fair value or cash flow of hedged items. At December 31, 2023 and 2022, the effective portion of designated cash flow hedges which is included in Other Reserves in equity amounted to $
The fair values of various derivative instruments used for hedging purposes and the movements of the hedging reserve included within Other Reserves in equity are disclosed in note 26 to these Consolidated Financial Statements.
| Consolidated Financial Statements | |
| For the years ended 2023, 2022 and 2021 - all amounts in thousands of U.S. dollars, unless otherwise stated |
IV. OTHER NOTES TO THE CONSOLIDATED FINANCIAL STATEMENTS
1 Segment information
As mentioned in section II.C, the Segment Information is disclosed as follows:
Reportable operating segments
(All amounts in millions of U.S. dollars)
|
Year ended December 31, 2023 |
Tubes |
Other |
Total |
|||||
|
Management view - operating income |
|
|
|
|||||
|
Difference in cost of sales |
|
|
( |
) | ||||
|
Differences in selling, general and administrative expenses |
|
|
( |
) | ||||
|
Differences in other operating income (expenses), net |
|
|
( |
) | ||||
|
IFRS - operating income |
|
|
|
|||||
|
Financial income (expense), net |
|
|
|
|||||
|
Income before equity in earnings of non-consolidated companies and income tax |
|
|
|
|||||
|
Equity in earnings of non-consolidated companies |
|
|
|
|||||
|
Income before income tax |
|
|
|
|||||
|
Net Sales |
|
|
|
|||||
|
Depreciation and amortization |
|
|
|
|
Year ended December 31, 2022 |
Tubes |
Other |
Total |
|||||
|
Management view - operating income |
|
|
|
|||||
|
Difference in cost of sales |
|
|
|
|||||
|
Differences in depreciation and amortization |
|
|
|
|||||
|
Differences in selling, general and administrative expenses |
|
|
( |
) | ||||
|
Differences in other operating income (expenses), net |
|
|
|
|||||
|
IFRS - operating income |
|
|
|
|||||
|
Financial income (expense), net |
|
|
( |
) | ||||
|
Income before equity in earnings of non-consolidated companies and income tax |
|
|
|
|||||
|
Equity in earnings of non-consolidated companies |
|
|
|
|||||
|
Income before income tax |
|
|
|
|||||
|
|
|
|
|
|||||
|
Net Sales |
|
|
|
|||||
|
Depreciation and amortization |
|
|
|
| F-37 |
| Consolidated Financial Statements | |
| For the years ended 2023, 2022 and 2021 - all amounts in thousands of U.S. dollars, unless otherwise stated |
|
Year ended December 31, 2021 |
Tubes |
Other |
Total |
|||||
|
Management view - operating income |
|
|
|
|||||
|
Difference in cost of sales |
|
|
|
|||||
|
Differences in depreciation and amortization |
|
|
( |
) | ||||
|
Differences in other operating income (expenses), net |
|
|
( |
) | ||||
|
IFRS - operating income |
|
|
|
|||||
|
Financial income (expense), net |
|
|
|
|||||
|
Income before equity in earnings of non-consolidated companies and income tax |
|
|
|
|||||
|
Equity in earnings of non-consolidated companies |
|
|
|
|||||
|
Income before income tax |
|
|
|
|||||
|
|
|
|
|
|||||
|
Net Sales |
|
|
|
|||||
|
Depreciation and amortization |
|
|
|
Transactions between segments, which were eliminated in consolidation, are mainly related to sales of scrap, energy, surplus raw materials and others from the Other segment to the Tubes segment for $
There are no material differences between IFRS and management view in total revenues and by reportable segments.
The differences between operating income under IFRS view and the management view are mainly related to the cost of goods sold, reflecting the effect of raw materials prices increases on the valuation of the replacement cost considered for management view compared to IFRS cost calculated at historical cost on a FIFO basis, and other minor timing differences.
The main difference in Other operating income (expenses), net, for the year ended December 31, 2022, is attributable to the effect of the reclassification of the currency translation adjustment reserve related to NKK Tubes’ definitive cease of operations, not impacting the management view.
In addition to the amounts reconciled above, the main differences in net income arise from the impact of functional currencies on financial result, deferred income taxes as well as the result of investment in non-consolidated companies.
| F-38 |
| Consolidated Financial Statements | |
| For the years ended 2023, 2022 and 2021 - all amounts in thousands of U.S. dollars, unless otherwise stated |
Geographical information
|
|
North America |
South America |
Europe |
Asia Pacific, Middle East and Africa (*) |
Unallocated (**) |
Total |
|||||||||||
|
Year ended December 31, 2023 |
|
|
|
|
|
|
|||||||||||
|
Net sales |
|
|
|
|
|
|
|||||||||||
|
Total assets |
|
|
|
|
|
|
|||||||||||
|
Trade receivables, net |
|
|
|
|
|
|
|||||||||||
|
Property, plant and equipment, net |
|
|
|
|
|
|
|||||||||||
|
Capital expenditures |
|
|
|
|
|
|
|||||||||||
|
Depreciation and amortization |
|
|
|
|
|
|
|||||||||||
|
|
|
|
|
|
|
|
|||||||||||
|
Year ended December 31, 2022 |
|
|
|
|
|
|
|||||||||||
|
Net sales |
|
|
|
|
|
|
|||||||||||
|
Total assets |
|
|
|
|
|
|
|||||||||||
|
Trade receivables, net |
|
|
|
|
|
|
|||||||||||
|
Property, plant and equipment, net |
|
|
|
|
|
|
|||||||||||
|
Capital expenditures |
|
|
|
|
|
|
|||||||||||
|
Depreciation and amortization |
|
|
|
|
|
|
|||||||||||
|
|
|
|
|
|
|
|
|||||||||||
|
Year ended December 31, 2021 |
|
|
|
|
|
|
|||||||||||
|
Net sales |
|
|
|
|
|
|
|||||||||||
|
Total assets |
|
|
|
|
|
|
|||||||||||
|
Trade receivables, net |
|
|
|
|
|
|
|||||||||||
|
Property, plant and equipment, net |
|
|
|
|
|
|
|||||||||||
|
Capital expenditures |
|
|
|
|
|
|
|||||||||||
|
Depreciation and amortization |
|
|
|
|
|
|
(*)
(**)
There are no revenues from external customers attributable to the Company’s country of incorporation (Luxembourg).
The principal countries from which the Company derives its revenues are USA (
Revenue is mainly recognized at a point in time to direct customers, when control has been transferred and there is no unfulfilled performance obligation that could affect the acceptance of the product by the customer. Revenues related to governmental institutions represent approximately
| Consolidated Financial Statements | |
| For the years ended 2023, 2022 and 2021 - all amounts in thousands of U.S. dollars, unless otherwise stated |
Tubes segment revenues by market:
(All amounts in millions of U.S. dollars)
|
Revenues Tubes |
2023 |
2022 |
2021 |
|||||
|
Oil & gas |
|
|
|
|||||
|
Oil & gas processing plants |
|
|
|
|||||
|
Industrial, power and others |
|
|
|
|||||
|
Total |
|
|
|
At December 31, 2023, 2022 and 2021, the Company recognized contract liabilities related to customer advances in the amount of $
2 Cost of sales
|
|
Year ended December 31, |
|||||||
|
|
2023 |
2022 |
2021 |
|||||
|
Inventories at the beginning of the year |
|
|
|
|||||
|
Increase in inventory due to business combinations (*) |
|
|
|
|||||
|
Decrease in inventory due to sale of subsidiaries |
|
|
( |
) | ||||
|
Plus: Charges of the year |
|
|
|
|||||
|
Raw materials, energy, consumables and other |
|
|
|
|||||
|
Services and fees |
|
|
|
|||||
|
Labor cost |
|
|
|
|||||
|
Depreciation of property, plant and equipment |
|
|
|
|||||
|
Amortization of intangible assets |
|
|
|
|||||
|
Depreciation of right-of-use assets |
|
|
|
|||||
|
Maintenance expenses |
|
|
|
|||||
|
Allowance for obsolescence |
|
|
|
|||||
|
Taxes |
|
|
|
|||||
|
Other |
|
|
|
|||||
|
|
|
|
|
|||||
|
Less: Inventories at the end of the year |
( |
) |
( |
) |
( |
) | ||
|
|
|
|
|
|||||
(*)
| Consolidated Financial Statements | |
| For the years ended 2023, 2022 and 2021 - all amounts in thousands of U.S. dollars, unless otherwise stated |
3 Selling, general and administrative expenses
|
|
Year ended December 31, |
|||||||
|
|
2023 |
2022 |
2021 |
|||||
|
Services and fees |
|
|
|
|||||
|
Labor cost |
|
|
|
|||||
|
Depreciation of property, plant and equipment |
|
|
|
|||||
|
Amortization of intangible assets |
|
|
|
|||||
|
Depreciation of right-of-use assets |
|
|
|
|||||
|
Freights and other selling expenses |
|
|
|
|||||
|
Provisions for contingencies |
|
|
|
|||||
|
Allowances for doubtful accounts |
|
( |
) |
( |
) | |||
|
Taxes |
|
|
|
|||||
|
Other |
|
|
|
|||||
|
|
|
|
|
|||||
4 Labor costs (included in Cost of sales and in Selling, general and administrative expenses)
|
|
Year ended December 31, |
|||||||
|
|
2023 |
2022 |
2021 |
|||||
|
Wages, salaries and social security costs |
|
|
|
|||||
|
Severance indemnities |
|
|
|
|||||
|
Post-employment benefits - defined contribution plans |
|
|
|
|||||
|
Post-employment benefits - defined benefit plans |
|
|
|
|||||
|
Employee retention and long-term incentive program |
|
|
|
|||||
|
|
|
|
|
|||||
The following table shows the geographical distribution of the employees:
|
|
2023 |
2022 |
2021 |
|||||
|
Mexico |
|
|
|
|||||
|
Argentina |
|
|
|
|||||
|
USA |
|
|
|
|||||
|
Italy |
|
|
|
|||||
|
Romania |
|
|
|
|||||
|
Indonesia |
|
|
|
|||||
|
Brazil |
|
|
|
|||||
|
Canada |
|
|
|
|||||
|
Colombia |
|
|
|
|||||
|
Saudi Arabia |
|
|
|
|||||
|
Other |
|
|
|
|||||
|
|
|
|
|
5 Impairment charge
Tenaris’s main source of revenue is the sale of products and services to the oil and gas industry, and the level of such sales is sensitive to international oil and gas prices and their impact on drilling activities.
The Company conducts regular assessments of the carrying values of its assets. The recoverable value is based on the value in use. The main key assumptions used in estimating the value in use are discount rate, growth rate and competitive, economic and regulatory factors applied to determine cash flow projections, such as oil and gas prices, average number of active oil and gas drilling rigs (rig count) and raw material costs.
For purposes of assessing key assumptions, to estimate discounted future cash flows, the Company uses external sources of information and management judgment based on past experience and expectations. Management has determined the value of each of the key assumptions as follows:
- Discount rate: based on the applicable weighted average cost of capital (“WACC”), which is considered to be a good indicator of capital cost, taking into account the industry, country and size of the business. For each CGU where assets are allocated, a specific WACC was determined.
- Growth rate: considers mainly the inflation impact on prices and costs, the long-term evolution of the oil and gas industry, the higher demand to offset depletion of existing fields and the Company’s expected market penetration. In 2023, a nominal growth rate of
- Oil and gas prices: based on industry analysts’ reports and management’s expectations of market development.
- Rig count: based on information published by Baker Hughes and management’s expectations.
- Raw material costs: based on industry analysts’ reports and management’s expectations.
Considering that the recoverable amount of the cash-generating units obtained in prior years' tests and that the assets and liabilities making up those units have not changed significantly, nor the key assumptions mentioned above, the Company concluded that impairment tests for previous years are still valid as of the end of the reporting period. In addition, the Company has considered the impact of updating the main discount rates, applying rates in a range between
In December 2022, in the presence of impairment indicators, the Company conducted impairment tests and reviewed the values of certain idle assets in its subsidiaries. The aforementioned analysis resulted in impairment charges of $
| Consolidated Financial Statements | |
| For the years ended 2023, 2022 and 2021 - all amounts in thousands of U.S. dollars, unless otherwise stated |
In December 2021, as a result of the expected termination of the NKKTubes joint venture, which at the time represented an impairment indicator for its assets, an impairment test was conducted, resulting in a charge of $
6 Other operating income and expenses
|
|
Year ended December 31, |
|||||||
|
|
2023 |
2022 |
2021 |
|||||
|
Other operating income |
|
|
|
|||||
|
Net income from other sales |
|
|
|
|||||
|
Net rents |
|
|
|
|||||
|
Reclassification of currency translation adjustment reserve |
|
|
|
|||||
|
Tax recovery in Brazilian subsidiaries |
|
|
|
|||||
|
Bargain purchase gain |
|
|
|
|||||
|
Result on sale of Venezuela awards |
|
|
|
|||||
|
Recovery on allowance for doubtful receivables |
|
|
|
|||||
|
Other income |
|
|
|
|||||
|
|
|
|
|
|||||
|
Other operating expenses |
|
|
|
|||||
|
Contributions to welfare projects and non-profit organizations |
|
|
|
|||||
|
Allowance for doubtful receivables |
|
|
|
|||||
|
Securities Exchange Commission investigation settlement |
|
|
|
|||||
|
Other expense |
|
|
|
|||||
|
|
|
|
|
|||||
|
|
|
|
|
|||||
|
Other income, net |
|
( |
) |
|
||||
Reclassification of currency translation adjustment reserve: During 2022, as result of NKKTubes’ definitive cease of operations, the currency translation adjustment reserve belonging to the shareholders was reclassified to the income statement. For more information see note 36.
Tax recovery in Brazilian subsidiaries: On May 13, 2021, the Brazilian Supreme Court issued a final judgment confirming that in calculating PIS and COFINS (Federal Social Contributions on Gross Revenues), tax payers should exclude from its base the total output of ICMS, calculated on a gross basis. This decision led to a recognition of approximately $
Bargain purchase gain: This gain relates to the Isoplus anticorrosion coating division acquisition. For more information see note 34 “Business Combinations - Acquisition of Anticorrosion Coating Assets in Italy”.
Result on sale of Venezuela awards: For more information see note 35.
Other income: On November 1, 2021, Tenaris sold
Securities Exchange Commission investigation settlement: For more information see note 27 “Contingencies, commitments and restrictions to the distribution of profits - Contingencies - Petrobras-related proceedings and claims”.
| Consolidated Financial Statements | |
| For the years ended 2023, 2022 and 2021 - all amounts in thousands of U.S. dollars, unless otherwise stated |
7 Financial results
|
|
Year ended December 31, |
|||||||
|
|
2023 |
2022 |
2021 |
|||||
|
Interest income |
|
|
|
|||||
|
Net result on changes in FV of financial assets at FVPL |
|
( |
) |
|
||||
|
Finance income |
|
|
|
|||||
|
Finance cost |
( |
) |
( |
) |
( |
) | ||
|
Net foreign exchange transactions results |
|
|
|
|||||
|
Net foreign exchange derivatives contracts results |
( |
) |
( |
) |
( |
) | ||
|
Other |
( |
) |
( |
) |
( |
) | ||
|
Other financial results, net |
|
( |
) |
|
||||
|
Net financial results |
|
( |
) |
|
||||
Finance Income:
In 2023, 2022 and 2021 includes $
In 2022 also includes a realized loss of $
In 2021 also includes $
Net foreign exchange transactions results:
In 2023 mainly includes result from the Argentine peso depreciation against the U.S. dollar on Argentine peso denominated net financial position at subsidiaries with functional currency U.S. dollar, the Brazilian real appreciation against the U.S. dollar on Brazilian denominated net financial position at subsidiaries with functional currency U.S. dollar, together with the result from Euro appreciation against the U.S. dollar on Euro denominated intercompany liabilities in subsidiaries with functional currency U.S. dollar, offset by an increase in currency translation adjustment reserve from an Italian subsidiary.
In 2022 mainly includes result from the Argentine peso and Japanese yen depreciation against the U.S. dollar on Argentine peso and Japanese yen denominated net financial position at subsidiaries with functional currency U.S. dollar, together with the result from Euro depreciation against the U.S. dollar on Euro denominated intercompany liabilities in subsidiaries with functional currency U.S. dollar, largely offset by an increase in currency translation adjustment reserve from an Italian subsidiary.
In 2021 mainly includes the result from Euro depreciation against the U.S. dollar on Euro denominated intercompany liabilities in subsidiaries with functional currency U.S. dollar, largely offset by an increase in currency translation adjustment reserve from an Italian subsidiary, together with the result from the Argentine peso and Japanese yen depreciation against the U.S. dollar on Argentine peso and Japanese yen denominated net financial position at subsidiaries with functional currency U.S. dollar.
Net foreign exchange derivatives contracts results:
In 2023 includes mainly losses on derivatives covering net receivables in Brazilian real.
In 2022 includes mainly losses on derivatives covering net receivables in Brazilian real and net liabilities in Euro and Japanese yen.
In 2021 includes mainly losses on derivatives covering net liabilities in Euro and Japanese yen, partially offset by gains on derivatives covering net receivables in Brazilian real.
Other:
In 2023 includes a net loss of $
In 2022 includes a loss of $
| Consolidated Financial Statements | |
| For the years ended 2023, 2022 and 2021 - all amounts in thousands of U.S. dollars, unless otherwise stated |
8 Equity in earnings of non-consolidated companies
|
|
Year ended December 31, |
|||||||
|
|
2023 |
2022 |
2021 |
|||||
|
From non-consolidated companies |
|
|
|
|||||
|
Remeasurement of previously held interest |
|
|
|
|||||
|
Bargain purchase gain |
|
|
|
|||||
|
Impairment loss on non-consolidated companies |
|
( |
) |
|
||||
|
Net loss related to participation increase in Usiminas |
( |
) |
|
|
||||
|
|
|
|
|
|||||
Remeasurement of previously held interest and Bargain purchase gain: For year ended December 31, 2023, include $
Impairment loss on non-consolidated companies: For year ended December 31, 2022, $
Net loss related to participation increase in Usiminas: For more information see note 14 “Investments in non-consolidated companies - Usiminas”.
9 Income tax
|
|
Year ended December 31, |
|||||||
|
|
2023 |
2022 |
2021 |
|||||
|
Current tax |
( |
) |
( |
) |
( |
) | ||
|
Deferred tax |
|
( |
) |
|
||||
|
Tax charge |
( |
) |
( |
) |
( |
) | ||
In addition, the Company has applied the exception prescribed by the amendments to IAS 12, and therefore it has not recognized any deferred tax impact from the Pillar Two application.
The Company is in the process of assessing its exposure to the Pillar Two legislation and testing its situation under the OECD transitional safe harbour rules and expects no major impacts in relation to top-up tax due to the application of one or more of the transitional safe harbour rules.
Due to the complexities in applying the legislation and calculating GloBE income, the quantitative impact of the enacted legislation is not yet reasonably estimable.
| Consolidated Financial Statements | |
| For the years ended 2023, 2022 and 2021 - all amounts in thousands of U.S. dollars, unless otherwise stated |
The tax on Tenaris’s income before tax differs from the theoretical amount that would arise using the tax rate in each country as follows:
|
|
Year ended December 31, |
|||||||
|
|
2023 |
2022 |
2021 |
|||||
|
Income before income tax |
|
|
|
|||||
|
Less impairment charges (non-deductible) |
|
|
|
|||||
|
Income before income tax without impairment charges |
|
|
|
|||||
|
|
|
|
|
|||||
|
Tax calculated at the tax rate in each country |
( |
) |
( |
) |
( |
) | ||
|
Effect of currency translation on tax base |
( |
) |
( |
) |
( |
) | ||
|
Changes in the tax rates |
|
( |
) |
( |
) | |||
|
Utilization of previously unrecognized tax losses |
|
|
|
|||||
|
Tax revaluation, withholding tax and others |
|
|
|
|||||
|
Tax charges |
( |
) |
( |
) |
( |
) | ||
Effect of currency translation on tax base: Tenaris applies the liability method to recognize deferred income tax on temporary differences between the tax bases of assets / liabilities and their carrying amounts in the financial statements. By application of this method, Tenaris recognizes gains and losses on deferred income tax due to the effect of the change in the value on the tax bases in subsidiaries (mainly Argentina and Mexico), which have a functional currency different than their local currency. These gains and losses are required by IFRS even though the revalued / devalued tax bases of the relevant assets will not result in any deduction / obligation for tax purposes in future periods.
Changes in the tax rates: For the year 2021, includes mainly the effect of the increase in the corporate income tax rate in Argentina from
Tax revaluation, withholding tax and others: Includes a net tax income of $
10 Dividends distribution
On November 1, 2023, the Company’s Board of Directors approved an interim dividend of $
On May 3, 2023, the Company’s shareholders approved an annual dividend in the amount of $
On May 3, 2022, the Company’s shareholders approved an annual dividend in the amount of $
11 Property, plant and equipment, net
|
Year ended December 31, 2023 |
Land and civil buildings |
Industrial buildings, plant and production equipment |
Vehicles, furniture and fixtures |
Work in progress |
Spare parts and equipment |
Total |
|||||||||||
|
Cost |
|
|
|
|
|
|
|||||||||||
|
Values at the beginning of the year |
|
|
|
|
|
|
|||||||||||
|
Currency translation adjustment |
|
|
|
|
|
|
|||||||||||
|
Increase due to business combinations (*) |
|
|
|
|
- |
|
|||||||||||
|
Additions |
|
|
|
|
|
|
|||||||||||
|
Transfers / Reclassifications |
|
|
|
( |
) |
- |
( |
) | |||||||||
|
Disposals / Consumptions |
( |
) |
( |
) |
( |
) |
( |
) |
( |
) |
( |
) | |||||
|
Values at the end of the year |
|
|
|
|
|
|
|||||||||||
|
|
|
|
|
|
|
|
|||||||||||
|
Depreciation and impairment |
|
|
|
|
|
|
|||||||||||
|
Accumulated at the beginning of the year |
|
|
|
- |
|
|
|||||||||||
|
Currency translation adjustment |
|
|
|
- |
|
|
|||||||||||
|
Depreciation charge |
|
|
|
- |
|
|
|||||||||||
|
Transfers / Reclassifications |
( |
) |
( |
) |
|
- |
- |
( |
) | ||||||||
|
Disposals / Consumptions |
( |
) |
( |
) |
( |
) |
- |
- |
( |
) | |||||||
|
Accumulated at the end of the year |
|
|
|
- |
|
|
|||||||||||
|
At December 31, 2023 |
|
|
|
|
|
|
(*)
| Consolidated Financial Statements | |
| For the years ended 2023, 2022 and 2021 - all amounts in thousands of U.S. dollars, unless otherwise stated |
|
Year ended December 31, 2022 |
Land and civil buildings |
Industrial buildings, plant and production equipment |
Vehicles, furniture and fixtures |
Work in progress |
Spare parts and equipment |
Total |
|||||||||||
|
Cost |
|
|
|
|
|
|
|||||||||||
|
Values at the beginning of the year |
|
|
|
|
|
|
|||||||||||
|
Currency translation adjustment |
( |
) |
( |
) |
( |
) |
|
( |
) |
( |
) | ||||||
|
Increase due to business combinations (*) |
- |
- |
- |
|
- |
|
|||||||||||
|
Additions |
- |
|
|
|
|
|
|||||||||||
|
Transfers / Reclassifications |
|
|
|
( |
) |
- |
( |
) | |||||||||
|
Disposals / Consumptions |
( |
) |
( |
) |
( |
) |
( |
) |
( |
) |
( |
) | |||||
|
Values at the end of the year |
|
|
|
|
|
|
|||||||||||
|
|
|
|
|
|
|
|
|||||||||||
|
Depreciation and impairment |
|
|
|
|
|
|
|||||||||||
|
Accumulated at the beginning of the year |
|
|
|
- |
|
|
|||||||||||
|
Currency translation adjustment |
( |
) |
( |
) |
( |
) |
- |
|
( |
) | |||||||
|
Depreciation charge |
|
|
|
- |
|
|
|||||||||||
|
Transfers / Reclassifications |
( |
) |
( |
) |
( |
) |
- |
- |
( |
) | |||||||
|
Impairment charge (See note 5) |
- |
|
|
- |
- |
|
|||||||||||
|
Disposals / Consumptions |
( |
) |
( |
) |
( |
) |
- |
( |
) |
( |
) | ||||||
|
Accumulated at the end of the year |
|
|
|
- |
|
|
|||||||||||
|
At December 31, 2022 |
|
|
|
|
|
|
(*)
| Consolidated Financial Statements | |
| For the years ended 2023, 2022 and 2021 - all amounts in thousands of U.S. dollars, unless otherwise stated |
See note 28 for a description of certain restricted assets with a carrying value of $
Property, plant and equipment include capitalized interests for net amounts at December 31, 2023 and 2022 of $
Government grants recognized as a reduction of property, plant and equipment were not material for the years 2023 and 2022.
For the year 2023, the carrying amount of assets pledged as security for current and non-current borrowings amounted to $
For the year 2022, the carrying amount of assets pledged as security for current and non-current borrowings were not material.
12 Intangible assets, net
|
Year ended December 31, 2023 |
Information system projects |
Licenses, patents and trademarks (*) |
Goodwill |
Customer relationships |
Total |
|||||||||
|
Cost |
|
|
|
|
|
|||||||||
|
Values at the beginning of the year |
|
|
|
|
|
|||||||||
|
Currency translation adjustment |
|
|
|
|
|
|||||||||
|
Increase due to business combinations (**) |
|
|
|
|
|
|||||||||
|
Additions |
|
|
|
|
|
|||||||||
|
Transfers / Reclassifications |
|
|
|
|
|
|||||||||
|
Disposals |
( |
) |
|
|
|
( |
) | |||||||
|
Values at the end of the year |
|
|
|
|
|
|||||||||
|
|
|
|
|
|
|
|||||||||
|
Amortization and impairment |
|
|
|
|
|
|||||||||
|
Accumulated at the beginning of the year |
|
|
|
|
|
|||||||||
|
Currency translation adjustment |
|
|
|
|
|
|||||||||
|
Amortization charge |
|
|
|
|
|
|||||||||
|
Transfers / Reclassifications |
( |
) |
|
|
|
( |
) | |||||||
|
Disposals |
( |
) |
|
|
|
( |
) | |||||||
|
Accumulated at the end of the year |
|
|
|
|
|
|||||||||
|
At December 31, 2023 |
|
|
|
|
|
(*)
(**)
| Consolidated Financial Statements | |
| For the years ended 2023, 2022 and 2021 - all amounts in thousands of U.S. dollars, unless otherwise stated |
|
Year ended December 31, 2022 |
Information system projects |
Licenses, patents and trademarks (*) |
Goodwill |
Customer relationships |
Total |
|||||||||
|
Cost |
|
|
|
|
|
|||||||||
|
Values at the beginning of the year |
|
|
|
|
|
|||||||||
|
Currency translation adjustment |
( |
) |
|
|
|
( |
) | |||||||
|
Increase due to business combinations (**) |
|
|
|
|
|
|||||||||
|
Additions |
|
|
|
|
|
|||||||||
|
Transfers / Reclassifications |
( |
) |
|
|
|
( |
) | |||||||
|
Disposals (***) |
( |
) |
( |
) |
|
( |
) |
( |
) | |||||
|
Values at the end of the year |
|
|
|
|
|
|||||||||
|
|
|
|
|
|
|
|||||||||
|
Amortization and impairment |
|
|
|
|
|
|||||||||
|
Accumulated at the beginning of the year |
|
|
|
|
|
|||||||||
|
Currency translation adjustment |
( |
) |
|
|
|
( |
) | |||||||
|
Amortization charge |
|
|
|
|
|
|||||||||
|
Impairment charge (See note 5) |
|
|
|
|
|
|||||||||
|
Disposals (***) |
( |
) |
( |
) |
|
( |
) |
( |
) | |||||
|
Accumulated at the end of the year |
|
|
|
|
|
|||||||||
|
At December 31, 2022 |
|
|
|
|
|
(*)Includes Proprietary Technology.
(**)
(***)
The geographical allocation of goodwill for the year ended December 31, 2023 was $
The carrying amount of goodwill allocated by CGU, as of December 31, 2023, was as follows:
|
(all amounts in millions of U.S. dollars) |
|
|
|
|
|||||||
|
|
Tubes Segment |
Other Segment |
|
||||||||
|
CGU |
Hydril Acquisition |
Other |
Other |
Total |
|||||||
|
Tamsa |
|
|
|
|
|||||||
|
Siderca |
|
|
|
|
|||||||
|
Hydril |
|
|
|
|
|||||||
|
Other |
|
|
|
|
|||||||
|
Total |
|
|
|
|
|||||||
| Consolidated Financial Statements | |
| For the years ended 2023, 2022 and 2021 - all amounts in thousands of U.S. dollars, unless otherwise stated |
13 Right-of-use assets, net and lease liabilities
Right of use assets evolution
|
Year ended December 31, 2023 |
Land and Civil Buildings |
Industrial Buildings, Plant and Production Equipment |
Vehicles, furniture and fixtures |
Others |
Total |
|||||||||
|
Cost |
|
|
|
|
|
|||||||||
|
Opening net book amount |
|
|
|
|
|
|||||||||
|
Currency translation adjustment |
|
|
|
|
|
|||||||||
|
Increase due to business combinations (*) |
|
|
|
|
|
|||||||||
|
Additions |
|
|
|
|
|
|||||||||
|
Transfers / Reclassifications |
|
|
( |
) |
|
|
||||||||
|
Disposals |
( |
) |
( |
) |
( |
) |
|
( |
) | |||||
|
At December 31, 2023 |
|
|
|
|
|
|||||||||
|
|
|
|
|
|
|
|||||||||
|
Depreciation |
|
|
|
|
|
|||||||||
|
Accumulated at the beginning of the year |
|
|
|
|
|
|||||||||
|
Currency translation adjustment |
|
|
|
|
|
|||||||||
|
Depreciation charge |
|
|
|
|
|
|||||||||
|
Transfers / Reclassifications |
|
|
( |
) |
|
|
||||||||
|
Disposals |
( |
) |
( |
) |
( |
) |
|
( |
) | |||||
|
Accumulated at the end of the year |
|
|
|
|
|
|||||||||
|
At December 31, 2023 |
|
|
|
|
|
(*)
|
Year ended December 31, 2022 |
Land and Civil Buildings |
Industrial Buildings, Plant and Production Equipment |
Vehicles, furniture and fixtures |
Others |
Total |
|||||||||
|
Cost |
|
|
|
|
|
|||||||||
|
Opening net book amount |
|
|
|
|
|
|||||||||
|
Currency translation adjustment |
|
( |
) |
( |
) |
|
( |
) | ||||||
|
Additions |
|
|
|
|
|
|||||||||
|
Transfers / Reclassifications |
( |
) |
( |
) |
|
|
|
|||||||
|
Disposals |
( |
) |
( |
) |
( |
) |
|
( |
) | |||||
|
At December 31, 2022 |
|
|
|
|
|
|||||||||
|
|
|
|
|
|
|
|||||||||
|
Depreciation |
|
|
|
|
|
|||||||||
|
Accumulated at the beginning of the year |
|
|
|
|
|
|||||||||
|
Currency translation adjustment |
( |
) |
( |
) |
( |
) |
|
( |
) | |||||
|
Depreciation charge |
|
|
|
|
|
|||||||||
|
Transfers / Reclassifications |
( |
) |
|
|
|
|
||||||||
|
Disposals |
( |
) |
( |
) |
( |
) |
|
( |
) | |||||
|
Accumulated at the end of the year |
|
|
|
|
|
|||||||||
|
At December 31, 2022 |
|
|
|
|
|
Depreciation of right-of-use assets is mainly included in Tubes segment.
| Consolidated Financial Statements | |
| For the years ended 2023, 2022 and 2021 - all amounts in thousands of U.S. dollars, unless otherwise stated |
Lease liability evolution
|
|
Year ended December 31, |
||||
|
|
2023 |
2022 |
|||
|
Opening net book amount |
|
|
|||
|
Increase due to business combinations (*) |
|
|
|||
|
Translation differences |
|
( |
) | ||
|
Additions |
|
|
|||
|
Cancellations |
( |
) |
( |
) | |
|
Repayments (**) |
( |
) |
( |
) | |
|
Interest accrued |
|
|
|||
|
At December 31, |
|
|
|||
(*)
(**)
As of December 31, 2023, the amount of remaining payments with maturities of less than 1 year, between 2 and 5 years and more than 5 years was approximately
As of December 31, 2022, the amount of remaining payments with maturities of less than 1 year, between 2 and 5 years and more than 5 years was approximately
Expenses related to short-term leases, leases of low value assets and variable leases (included in Cost of sales and Selling, general and administrative expenses) were not material for the years 2023 and 2022.
14 Investments in non-consolidated companies
|
|
Year ended December 31, |
||||
|
|
2023 |
2022 |
|||
|
At the beginning of the year |
|
|
|||
|
Translation differences |
|
|
|||
|
Equity in earnings of non-consolidated companies |
|
|
|||
|
Impairment loss in non-consolidated companies |
|
( |
) | ||
|
Dividends and distributions declared |
( |
) |
( |
) | |
|
Acquisition of non-consolidated companies |
|
|
|||
|
Decrease due to step-acquisition |
( |
) |
|
||
|
(Decrease) / increase in equity reserves and others |
( |
) |
|
||
|
At the end of the year |
|
|
|||
Equity in earnings of non-consolidated companies: Includes a loss of $
Impairment loss in non-consolidated companies: Includes an impairment of $
Dividends and distributions declared: Related to Ternium and Usiminas. During 2023 and 2022 $
Acquisition of non-consolidated companies: Related to the investment in Usiminas.
| Consolidated Financial Statements | |
| For the years ended 2023, 2022 and 2021 - all amounts in thousands of U.S. dollars, unless otherwise stated |
Decrease due to step-acquisition: Related to GPC acquisition. For more information see note 34.
The principal non-consolidated companies are:
|
|
|
% ownership at December 31, |
Book value at December 31, |
|||||||||
|
Company |
Country of incorporation |
2023 |
2022 |
2023 |
2022 |
|||||||
|
a) Ternium (*) |
Luxembourg |
|
|
|
|
|||||||
|
b) Usiminas (**) |
Brazil |
|
|
|
|
|||||||
|
c) Techgen |
Mexico |
|
|
|
|
|||||||
|
d) Global Pipe Company (***) |
Saudi Arabia |
|
|
|
|
|||||||
|
Others |
|
|
|
|
|
|||||||
|
|
|
|
|
|
|
|||||||
(*)
(**)
(***)
a) Ternium
Ternium is a steel producer with production facilities in Mexico, Brazil, Argentina, Colombia, the Southern United States and Central America and is one of Tenaris’s main suppliers of round steel bars and flat steel products for its pipes business.
At December 31, 2023, the closing price of Ternium’s ADSs as quoted on the New York Stock Exchange was $
Summarized selected financial information of Ternium, including the aggregated amounts of assets, liabilities, revenues and profit or loss is as follows:
|
|
Ternium |
||||
|
|
2023 |
2022 |
|||
|
Non-current assets |
|
|
|||
|
Current assets |
|
|
|||
|
Total assets |
|
|
|||
|
Non-current liabilities |
|
|
|||
|
Current liabilities |
|
|
|||
|
Total liabilities |
|
|
|||
|
Total equity |
|
|
|||
|
Non-controlling interests |
|
|
|||
|
|
|
|
|||
|
Revenues |
|
|
|||
|
Gross profit |
|
|
|||
|
Net income for the year attributable to shareholders' equity |
|
|
|||
| Consolidated Financial Statements | |
| For the years ended 2023, 2022 and 2021 - all amounts in thousands of U.S. dollars, unless otherwise stated |
b) Usiminas
Usiminas is a Brazilian producer of high quality flat steel products used in the energy, automotive and other industries.
At December 31, 2023, the closing price of the Usiminas’ ordinary and preferred shares, as quoted on the B3 - Brasil Bolsa Balcão S.A, was BRL
Following the acquisition of shares referred to in note II.B.2).b) and considering the carrying value of the previously held interest, the price paid for the acquisition of the additional Usiminas shares and the fair value measurement of the Usiminas shares (conducted at the T/T Group level) the Company recorded a net loss of $
The Company reviews its participation in Usiminas whenever events or circumstances indicate that the asset’s carrying amount may not be recoverable. As of December 31, 2023, the Company concluded that the carrying amount did not exceed the recoverable value of the investment.
Summarized selected financial information of Usiminas, including the aggregated amounts of assets, liabilities, revenues and profit or loss is as follows:
|
|
Usiminas |
||||
|
|
2023 |
2022 |
|||
|
Non-current assets |
|
|
|||
|
Current assets |
|
|
|||
|
Total assets |
|
|
|||
|
Non-current liabilities |
|
|
|||
|
Current liabilities |
|
|
|||
|
Total liabilities |
|
|
|||
|
Total equity |
|
|
|||
|
Non-controlling interests |
|
|
|||
|
|
|
|
|||
|
Revenues |
|
|
|||
|
Gross profit |
|
|
|||
|
Net income for the year attributable to shareholders' equity |
|
|
|||
| Consolidated Financial Statements | |
| For the years ended 2023, 2022 and 2021 - all amounts in thousands of U.S. dollars, unless otherwise stated |
c) Techgen
Techgen is a Mexican company that operates a natural gas-fired combined cycle electric power plant in the Pesquería area of the State of Nuevo León, Mexico, with a power capacity of 900 megawatts. As of December 31, 2023, Tenaris held
Techgen entered into certain transportation capacity agreements and an agreement for the purchase of clean energy certificates. As of December 31, 2023, Tenaris’s exposure under these agreements amounted to $
Techgen’s sponsors granted certain subordinated loans to Techgen. As of December 31, 2023, the aggregate outstanding principal amount under these subordinated loans was $
On February 13, 2019, Techgen entered into a $
The existing syndicated loan agreement is “non-recourse” on the sponsors. Techgen’s obligations thereunder are guaranteed by a Mexican security trust (covering shares, assets, accounts and contract rights), account pledges and certain direct agreements –customary for these type of transactions–. The commercial terms and conditions governing the purchase by the Company’s Mexican subsidiary, Tamsa, of
Under the loan agreement, Techgen is committed to maintain a debt service reserve account covering debt service becoming due during two consecutive quarters; such account is funded by stand-by letters of credit issued for the account of Techgen’s sponsors in proportion to their respective participations in Techgen. Accordingly, the Company applied for stand-by letters of credit covering
d) GPC
GPC is a joint venture established in 2010 and located in Jubail, Saudi Arabia, which manufactures LSAW pipes. Until May 16, 2023, Tenaris, through its subsidiary SSPC, owned
| F-55 |
| Consolidated Financial Statements | |
| For the years ended 2023, 2022 and 2021 - all amounts in thousands of U.S. dollars, unless otherwise stated |
15 Receivables non-current
|
|
Year ended December 31, |
||||
|
|
2023 |
2022 |
|||
|
Employee advances and loans |
|
|
|||
|
Tax credits (*) |
|
|
|||
|
Receivables from related parties |
|
|
|||
|
Legal deposits |
|
|
|||
|
Advances to suppliers and other advances |
|
|
|||
|
Receivable Venezuelan subsidiaries |
|
|
|||
|
Others |
|
|
|||
|
|
|
|
|||
(*) As of December 31, 2023, included approximately $
As of December 31, 2022, included approximately $
16 Inventories, net
|
|
Year ended December 31, |
||||
|
|
2023 |
2022 |
|||
|
Finished goods |
|
|
|||
|
Goods in process |
|
|
|||
|
Raw materials |
|
|
|||
|
Supplies |
|
|
|||
|
Goods in transit |
|
|
|||
|
|
|
|
|||
|
Allowance for obsolescence, see note 25 (i) |
( |
) |
( |
) | |
|
|
|
|
|||
17 Receivables and prepayments, net
|
|
Year ended December 31, |
||||
|
|
2023 |
2022 |
|||
|
Prepaid expenses and other receivables |
|
|
|||
|
Government entities |
|
|
|||
|
Employee advances and loans |
|
|
|||
|
Advances to suppliers and other advances |
|
|
|||
|
Government tax refunds on exports |
|
|
|||
|
Receivables from related parties |
|
|
|||
|
Others |
|
|
|||
|
|
|
|
|||
|
Allowance for other doubtful accounts, see note 25 (i) |
( |
) |
( |
) | |
|
|
|
|
|||
| Consolidated Financial Statements | |
| For the years ended 2023, 2022 and 2021 - all amounts in thousands of U.S. dollars, unless otherwise stated |
18 Current tax assets and liabilities
|
|
Year ended December 31, |
||||
|
Current tax assets |
2023 |
2022 |
|||
|
Income tax assets |
|
|
|||
|
V.A.T. credits |
|
|
|||
|
Other prepaid taxes |
|
|
|||
|
|
|
|
|||
|
|
Year ended December 31, |
||||
|
Current tax liabilities |
2023 |
2022 |
|||
|
Income tax liabilities |
|
|
|||
|
V.A.T. liabilities |
|
|
|||
|
Other taxes |
|
|
|||
|
|
|
|
|||
19 Trade receivables, net
|
|
Year ended December 31, |
||||
|
|
2023 |
2022 |
|||
|
Current accounts |
|
|
|||
|
Receivables from related parties |
|
|
|||
|
|
|
|
|||
|
Allowance for doubtful accounts, see note 25 (i) |
( |
) |
( |
) | |
|
|
|
|
|||
The following table sets forth details of the aging of trade receivables:
|
At December 31, 2023 |
Trade Receivables |
Not Due |
Past due |
||||||||
|
|
1 - 180 days |
> 180 days |
|||||||||
|
Guaranteed |
|
|
|
|
|||||||
|
Not guaranteed |
|
|
|
|
|||||||
|
Guaranteed and not guaranteed |
|
|
|
|
|||||||
|
Expected loss rate |
|
% |
|
% |
|
% |
|
% | |||
|
Allowance for doubtful accounts |
( |
) |
( |
) |
( |
) |
( |
) | |||
|
Nominative allowance for doubtful accounts |
( |
) |
|
( |
) |
( |
) | ||||
|
Net Value |
|
|
|
|
|||||||
| Consolidated Financial Statements | |
| For the years ended 2023, 2022 and 2021 - all amounts in thousands of U.S. dollars, unless otherwise stated |
|
At December 31, 2022 |
Trade Receivables |
Not Due |
Past due |
||||||||
|
|
1 - 180 days |
> 180 days |
|||||||||
|
Guaranteed |
|
|
|
|
|||||||
|
Not guaranteed |
|
|
|
|
|||||||
|
Guaranteed and not guaranteed |
|
|
|
|
|||||||
|
Expected loss rate |
|
% |
|
% |
|
% |
|
% | |||
|
Allowance for doubtful accounts |
( |
) |
( |
) |
( |
) |
( |
) | |||
|
Nominative allowance for doubtful accounts |
( |
) |
|
( |
) |
( |
) | ||||
|
Net Value |
|
|
|
|
|||||||
Trade receivables are mainly denominated in U.S. dollars.
20 Cash and cash equivalents and other investments
|
|
Year ended December 31, |
||||
|
|
2023 |
2022 |
|||
|
Cash and cash equivalents |
|||||
|
Cash at banks |
|
|
|||
|
Liquidity funds |
|
|
|||
|
Short-term investments |
|
|
|||
|
|
|
|
|||
|
Other investments - current |
|
|
|||
|
Fixed income (time-deposit, zero coupon bonds, commercial papers) |
|
|
|||
|
Bonds and other fixed income |
|
|
|||
|
Fund investments |
|
|
|||
|
|
|
|
|||
|
Other investments - non-current |
|
|
|||
|
Bonds and other fixed income |
|
|
|||
|
Others |
|
|
|||
|
|
|
|
|||
21 Borrowings
|
|
Year ended December 31, |
||||
|
|
2023 |
2022 |
|||
|
Non-current |
|
|
|||
|
Bank borrowings |
|
|
|||
|
|
|
|
|||
|
Current |
|
|
|||
|
Bank borrowings |
|
|
|||
|
Bank overdrafts |
|
|
|||
|
Costs of issue of debt |
|
( |
) | ||
|
|
|
|
|||
|
Total Borrowings |
|
|
|||
| Consolidated Financial Statements | |
| For the years ended 2023, 2022 and 2021 - all amounts in thousands of U.S. dollars, unless otherwise stated |
The maturity of borrowings is as follows:
|
At December 31, 2023 |
1 year or less |
1 - 2 years |
2 – 3 years |
Over 3 years |
Total |
|||||||||
|
Borrowings |
|
|
|
|
|
|||||||||
|
Total borrowings |
|
|
|
|
|
|||||||||
|
|
|
|
|
|
|
|||||||||
|
Interest to be accrued |
|
|
|
|
|
|||||||||
|
Total |
|
|
|
|
|
|
At December 31, 2022 |
1 year or less |
1 - 2 years |
2 – 3 years |
Over 3 years |
Total |
|||||||||
|
Borrowings |
|
|
|
|
|
|||||||||
|
Total borrowings |
|
|
|
|
|
|||||||||
|
|
|
|
|
|
|
|||||||||
|
Interest to be accrued (*) |
|
|
|
|
|
|||||||||
|
Total |
|
|
|
|
|
(*)
Significant borrowings include:
|
In millions of U.S. dollars |
|
|
|
|
|
Disbursement date |
Borrower |
Type |
Final maturity |
Outstanding |
|
2023 |
Tubos de Acero de Mexico S.A. |
Bilateral |
2024 |
|
|
2023 |
Tenaris Tubocaribe Ltda. |
Bilateral |
2024 |
|
|
2023 |
Confab Industrial S.A. |
Bilateral |
2024 |
|
|
2017 |
Global Pipe Company |
Bilateral |
2024 / 2025 |
|
As of December 31, 2023, Tenaris was in compliance with all of its covenants, or obtained the necessary waivers from the applicable financial institution if the covenants were not met.
The weighted average interest rates before tax shown below were calculated using the rates set for each instrument in its corresponding currency as of December 31, 2023 and 2022, considering hedge accounting where applicable.
|
|
2023 |
2022 |
|||
|
Total borrowings |
|
|
| Consolidated Financial Statements | |
| For the years ended 2023, 2022 and 2021 - all amounts in thousands of U.S. dollars, unless otherwise stated |
Breakdown of long-term borrowings by currency and rate is as follows:
Non-current borrowings
|
|
|
Year ended December 31, |
||||
|
Currency |
Interest rates |
2023 |
2022 |
|||
|
USD |
Variable |
|
|
|||
|
SAR |
Fixed |
|
|
|||
|
SAR |
Variable |
|
|
|||
|
Total non-current borrowings |
|
|
|
|||
Current borrowings
|
|
|
Year ended December 31, |
||||
|
Currency |
Interest rates |
2023 |
2022 |
|||
|
USD |
Variable |
|
|
|||
|
USD |
Fixed |
|
|
|||
|
BRL |
Variable |
|
|
|||
|
EUR |
Fixed |
|
|
|||
|
MXN |
Fixed |
|
|
|||
|
ARS |
Fixed |
|
|
|||
|
SAR |
Variable |
|
|
|||
|
SAR |
Fixed |
|
|
|||
|
Total current borrowings |
|
|
|
|||
Borrowings evolution
|
|
Year ended December 31, 2023 |
||||
|
|
Non-current |
Current |
|||
|
At the beginning of the year |
|
|
|||
|
Translation differences |
|
( |
) | ||
|
Proceeds and repayments, net |
|
( |
) | ||
|
Interests accrued less payments |
|
( |
) | ||
|
Reclassifications |
( |
) |
|
||
|
Increase due to business combinations (*) |
|
|
|||
|
Overdrafts variation |
|
|
|||
|
At the end of the year |
|
|
|||
(*)
| Consolidated Financial Statements | |
| For the years ended 2023, 2022 and 2021 - all amounts in thousands of U.S. dollars, unless otherwise stated |
22 Deferred tax assets and liabilities
Deferred income taxes are calculated in full on temporary differences under the liability method using the tax rate of each country.
The evolution of deferred tax assets and liabilities during the year is as follows:
Deferred tax liabilities
|
|
Fixed assets |
Inventories |
Intangible assets and other |
Total |
|||||||
|
At the beginning of the year |
|
|
|
|
|||||||
|
Translation differences |
|
|
|
|
|||||||
|
Increase due to business combinations (*) |
|
|
|
|
|||||||
|
Charged to other comprehensive income |
|
|
|
|
|||||||
|
Income statement charge |
|
|
|
|
|||||||
|
At December 31, 2023 |
|
|
|
|
|
|
Fixed assets |
Inventories |
Intangible assets and other |
Total |
|||||||
|
At the beginning of the year |
|
|
|
|
|||||||
|
Translation differences |
( |
) |
|
|
|
||||||
|
Charged to other comprehensive income |
|
|
|
|
|||||||
|
Income statement (credit) / charge |
( |
) |
|
|
( |
) | |||||
|
At December 31, 2022 |
|
|
|
|
Deferred tax assets
|
|
Provisions and allowances |
Inventories |
Tax losses |
Other |
Total |
|||||||||
|
At the beginning of the year |
( |
) |
( |
) |
( |
) |
( |
) |
( |
) | ||||
|
Translation differences |
( |
) |
( |
) |
|
( |
) |
( |
) | |||||
|
Increase due to business combinations (*) |
( |
) |
( |
) |
( |
) |
( |
) |
( |
) | ||||
|
Charged to other comprehensive income |
|
|
|
( |
) |
( |
) | |||||||
|
Income statement (credit) / charge |
( |
) |
( |
) |
( |
) |
|
( |
) | |||||
|
At December 31, 2023 |
( |
) |
( |
) |
( |
) |
( |
) |
( |
) |
|
|
Provisions and allowances |
Inventories |
Tax losses |
Other |
Total |
|||||||||
|
At the beginning of the year |
( |
) |
( |
) |
( |
) |
( |
) |
( |
) | ||||
|
Translation differences |
( |
) |
|
|
( |
) |
|
|||||||
|
Charged to other comprehensive income |
|
|
|
|
|
|||||||||
|
Income statement charge / (credit) |
( |
) |
( |
) |
|
|
|
|||||||
|
At December 31, 2022 |
( |
) |
( |
) |
( |
) |
( |
) |
( |
) |
(*)
| Consolidated Financial Statements | |
| For the years ended 2023, 2022 and 2021 - all amounts in thousands of U.S. dollars, unless otherwise stated |
Deferred tax assets related to tax losses of Tenaris subsidiaries are recognized to the extent it is probable that future taxable profits will be available, against which such losses can be utilized. The utilization of such tax losses may also be restricted by the nature of the profit, expiration dates and / or potential limitations on their yearly consumption. In determining the amount of deferred taxes to be recognized. Tenaris considered existing evidence, both positive and negative, including the historical taxable profits and the projections of future taxable profits prepared by management to assess the probability that the deferred tax assets will be realized. Management applies significant judgment in assessing the likelihood that future taxable profits will be available.
Deferred tax assets related to tax losses as of the end of 2023 include $
Tenaris has concluded as of end 2023 that it is probable that sufficient future taxable profits will be generated by business activities to be carried out by its Luxembourg subsidiary, against which the above-mentioned tax losses could be utilized prior to their expiration.
Deferred tax assets related to tax losses also include $
Approximately 99% of the recognized tax losses have an expiration date in more than 5 years or do not expire.
As of December 31, 2023, the net unrecognized deferred tax assets amounted to $
The estimated recovery analysis of deferred tax assets and settlement of deferred tax liabilities, which takes into consideration management assumptions and estimates, is as follows:
|
|
Year ended December 31, |
||||
|
|
2023 |
2022 |
|||
|
Deferred tax assets to be recovered after 12 months |
( |
) |
( |
) | |
|
Deferred tax liabilities to be settled after 12 months |
|
|
|||
Deferred income tax assets and liabilities are offset when (1) there is a legally enforceable right to set-off current tax assets against current tax liabilities and (2) when the deferred income taxes relate to the same fiscal authority on either the same taxable entity or different taxable entities where there is an intention to settle the balances on a net basis. The following amounts, determined after appropriate set-off, are shown in the Consolidated Statement of Financial Position:
|
|
Year ended December 31, |
||||
|
|
2023 |
2022 |
|||
|
Deferred tax assets |
( |
) |
( |
) | |
|
Deferred tax liabilities |
|
|
|||
|
|
( |
) |
|
||
The movement in the net deferred income tax (asset) / liability account is as follows:
|
|
Year ended December 31, |
||||
|
|
2023 |
2022 |
|||
|
At the beginning of the year |
|
|
|||
|
Translation differences |
( |
) |
|
||
|
Increase due to business combinations (*) |
( |
) |
|
||
|
Charged to other comprehensive income |
( |
) |
|
||
|
Income statement (credit) / charge |
( |
) |
|
||
|
At the end of the year |
( |
) |
|
||
(*)
| Consolidated Financial Statements | |
| For the years ended 2023, 2022 and 2021 - all amounts in thousands of U.S. dollars, unless otherwise stated |
23 Other liabilities
(i) Other liabilities – Non-current
|
|
Year ended December 31, |
||||
|
|
2023 |
2022 |
|||
|
Post-employment benefits |
|
|
|||
|
Other long-term benefits |
|
|
|||
|
Miscellaneous |
|
|
|||
|
|
|
|
|||
At December 31, 2023 the weighted average duration of liabilities related to post-employment benefits was
Post-employment benefits
|
|
Year ended December 31, |
||||
|
|
2023 |
2022 |
|||
|
Unfunded |
|
|
|||
|
Funded |
|
|
|||
|
|
|
|
|||
- Unfunded
|
|
Year ended December 31, |
||||
|
|
2023 |
2022 |
|||
|
Values at the beginning of the year |
|
|
|||
|
Current service cost |
|
|
|||
|
Interest cost |
|
|
|||
|
Curtailments and settlements |
( |
) |
( |
) | |
|
Remeasurements (*) |
|
( |
) | ||
|
Translation differences |
( |
) |
( |
) | |
|
Increase due to business combinations (**) |
|
|
|||
|
Benefits paid from the plan |
( |
) |
( |
) | |
|
Reclassified to current liabilities |
|
( |
) | ||
|
Other |
( |
) |
|
||
|
At the end of the year |
|
|
|||
(*)
(**)
| Consolidated Financial Statements | |
| For the years ended 2023, 2022 and 2021 - all amounts in thousands of U.S. dollars, unless otherwise stated |
The actuarial assumptions for the most relevant plans were as follows:
|
|
Year ended December 31, |
||||
|
|
2023 |
2022 |
|||
|
Discount rate |
|
|
|||
|
Rate of compensation increase |
|
|
|||
As of December 31, 2023, an increase / (decrease) of
- Funded
The amounts recognized in the statement of financial position for the current annual period and the previous annual period are as follows:
|
|
Year ended December 31, |
||||
|
|
2023 |
2022 |
|||
|
Present value of funded obligations |
|
|
|||
|
Fair value of plan assets |
( |
) |
( |
) | |
|
Asset (*) |
( |
) |
( |
) | |
(*)
The movement in the present value of funded obligations is as follows:
|
|
Year ended December 31, |
||||
|
|
2023 |
2022 |
|||
|
At the beginning of the year |
|
|
|||
|
Translation differences |
|
( |
) | ||
|
Current service cost |
|
|
|||
|
Interest cost |
|
|
|||
|
Remeasurements (*) |
|
( |
) | ||
|
Increase due to business combinations (**) |
|
|
|||
|
Benefits paid |
( |
) |
( |
) | |
|
Other |
|
|
|||
|
At the end of the year |
|
|
|||
(*)
(**)
| Consolidated Financial Statements | |
| For the years ended 2023, 2022 and 2021 - all amounts in thousands of U.S. dollars, unless otherwise stated |
The movement in the fair value of plan assets is as follows:
|
|
Year ended December 31, |
||||
|
|
2023 |
2022 |
|||
|
At the beginning of the year |
( |
) |
( |
) | |
|
Translation differences |
( |
) |
|
||
|
Return on plan assets |
( |
) |
( |
) | |
|
Remeasurements |
( |
) |
|
||
|
Increase due to business combinations (*) |
( |
) |
|
||
|
Contributions paid to the plan |
|
( |
) | ||
|
Benefits paid from the plan |
|
|
|||
|
Other |
|
|
|||
|
At the end of the year |
( |
) |
( |
) | |
(*)
The major categories of plan assets as a percentage of total plan assets are as follows:
|
|
Year ended December 31, |
||||
|
|
2023 |
2022 |
|||
|
Equity instruments |
|
|
|||
|
Debt instruments |
|
|
|||
|
Others |
|
|
|||
The actuarial assumptions for the most relevant plans were as follows:
|
|
Year ended December 31, |
||||
|
|
2023 |
2022 |
|||
|
Discount rate |
|
|
|||
|
Rate of compensation increase |
|
|
|||
The expected return on plan assets is determined by considering the expected returns available on the assets underlying the current investment policy. Expected return on plan assets is determined based on long-term, prospective rates of return as of the end of the reporting period.
As of December 31, 2023, an increase / (decrease) of
The expected employer contributions for the year 2024 are not material.
The methods and types of assumptions used in preparing the sensitivity analyses did not change compared to the previous period.
| Consolidated Financial Statements | |
| For the years ended 2023, 2022 and 2021 - all amounts in thousands of U.S. dollars, unless otherwise stated |
(ii) Other liabilities – Current
|
|
Year ended December 31, |
||||
|
|
2023 |
2022 |
|||
|
Payroll and social security payable |
|
|
|||
|
Shares to be settled under buyback program |
|
|
|||
|
Miscellaneous |
|
|
|||
|
|
|
|
|||
24 Non-current allowances and provisions
Liabilities
|
|
Year ended December 31, |
||||
|
|
2023 |
2022 |
|||
|
Values at the beginning of the year |
|
|
|||
|
Translation differences |
|
|
|||
|
Increase due to business combinations (*) |
|
|
|||
|
Additional allowance |
|
|
|||
|
Reclassifications |
( |
) |
|
||
|
Used and other movements |
( |
) |
|
||
|
Values at the end of the year |
|
|
|||
(*)
25 Current allowances and provisions
(i) Deducted from assets
|
Year ended December 31, 2023 |
Allowance for doubtful accounts - Trade receivables |
Allowance for other doubtful accounts - Other receivables |
Allowance for inventory obsolescence |
|||||
|
Values at the beginning of the year |
( |
) |
( |
) |
( |
) | ||
|
Translation differences |
( |
) |
( |
) |
( |
) | ||
|
Increase due to business combinations (*) |
( |
) |
|
( |
) | |||
|
(Additional) allowances |
( |
) |
( |
) |
( |
) | ||
|
Used |
|
|
|
|||||
|
At December 31, 2023 |
( |
) |
( |
) |
( |
) |
(*)
| Consolidated Financial Statements | |
| For the years ended 2023, 2022 and 2021 - all amounts in thousands of U.S. dollars, unless otherwise stated |
|
Year ended December 31, 2022 |
Allowance for doubtful accounts - Trade receivables |
Allowance for other doubtful accounts - Other receivables |
Allowance for inventory obsolescence |
|||||
|
Values at the beginning of the year |
( |
) |
( |
) |
( |
) | ||
|
Translation differences |
( |
) |
|
( |
) | |||
|
(Additional) / reversal allowances |
|
( |
) |
( |
) | |||
|
Used |
|
|
|
|||||
|
At December 31, 2022 |
( |
) |
( |
) |
( |
) |
(ii) Liabilities
|
Year ended December 31, 2023 |
Sales risks |
Other claims and contingencies (*) |
Total |
|||||
|
Values at the beginning of the year |
|
|
|
|||||
|
Translation differences |
|
( |
) |
|
||||
|
Increase due to business combinations (**) |
|
|
|
|||||
|
Additional provisions |
|
|
|
|||||
|
Reclassifications |
|
|
|
|||||
|
Used |
( |
) |
( |
) |
( |
) | ||
|
At December 31, 2023 |
|
|
|
|
Year ended December 31, 2022 |
Sales risks |
Other claims and contingencies (*) |
Total |
|||||
|
Values at the beginning of the year |
|
|
|
|||||
|
Translation differences |
( |
) |
( |
) |
( |
) | ||
|
Additional provisions |
|
|
|
|||||
|
Reclassifications |
|
( |
) |
( |
) | |||
|
Used |
( |
) |
( |
) |
( |
) | ||
|
At December 31, 2022 |
|
|
|
(*)
(**)
| Consolidated Financial Statements | |
| For the years ended 2023, 2022 and 2021 - all amounts in thousands of U.S. dollars, unless otherwise stated |
26 Derivative financial instruments
Net fair values of derivative financial instruments
The net fair values of derivative financial instruments, in accordance with IFRS 13, are:
|
|
Year ended December 31, |
||||
|
|
2023 |
2022 |
|||
|
Derivatives hedging borrowings and investments |
|
|
|||
|
Other derivatives |
|
|
|||
|
Contracts with positive fair values |
|
|
|||
|
|
|
|
|||
|
Other derivatives |
( |
) |
( |
) | |
|
Contracts with negative fair values |
( |
) |
( |
) | |
|
Total |
( |
) |
|
||
Foreign exchange and commodities derivative contracts and hedge accounting
Tenaris applies hedge accounting to certain cash flow hedges of highly probable forecast transactions. The net fair values of exchange rate derivatives and those derivatives that were designated for hedge accounting as of December 31, 2023 and 2022 were as follows:
|
Purchase currency |
Sell currency |
Term |
Fair Value |
Hedge Accounting Reserve |
|||||||||
|
2023 |
2022 |
2023 |
2022 |
||||||||||
|
MXN |
USD |
2024 |
|
|
|
( |
) | ||||||
|
USD |
MXN |
2024 |
( |
) |
|
|
|
||||||
|
EUR |
USD |
2024 |
|
|
|
( |
) | ||||||
|
USD |
EUR |
2024 / 2025 |
( |
) |
|
|
|
||||||
|
USD |
BRL |
2024 |
( |
) |
( |
) |
|
|
|||||
|
USD |
KWD |
2024 |
( |
) |
( |
) |
( |
) |
|
||||
|
USD |
CAD |
2024 |
( |
) |
|
|
|
||||||
|
USD |
GBP |
2024 |
( |
) |
( |
) |
|
|
|||||
|
USD |
CNY |
2024 |
( |
) |
( |
) |
|
|
|||||
|
RON |
USD |
2024 |
|
|
|
|
|||||||
|
BRL |
USD |
2024 |
|
|
|
|
|||||||
|
Others |
|
2024 |
( |
) |
|
|
|
||||||
|
Total |
|
|
( |
) |
|
|
|
||||||
| Consolidated Financial Statements | |
| For the years ended 2023, 2022 and 2021 - all amounts in thousands of U.S. dollars, unless otherwise stated |
|
Commodity Derivatives |
Term |
Fair Value |
Hedge Accounting Reserve |
|||||||||
|
2023 |
2022 |
2023 |
2022 |
|||||||||
|
Houston Ship Channel Gas |
2024 |
( |
) |
( |
) |
( |
) |
( |
) | |||
|
LME Scrap |
2024 |
|
|
|
( |
) | ||||||
|
Iron Ore |
2024 |
|
|
|
( |
) | ||||||
|
Electric Energy |
2024 |
( |
) |
( |
) |
( |
) |
( |
) | |||
|
TTF Gas |
2024 |
|
( |
) |
|
( |
) | |||||
|
PSV Gas |
2024 |
( |
) |
|
( |
) |
|
|||||
|
Nickel |
2024 |
|
|
|
|
|||||||
|
Total |
|
|
( |
) |
|
( |
) | |||||
Following is a summary of the hedge reserve evolution:
|
|
Equity Reserve |
Movements 2022 |
Equity Reserve |
Movements 2023 |
Equity Reserve |
|||||||||
|
Foreign Exchange & Commodities |
|
|
|
( |
) |
|
||||||||
|
Total Cash flow Hedge |
|
|
|
( |
) |
|
Tenaris estimates that the majority of the cash flow hedge reserve corresponding to derivatives instruments at December 31, 2023 will be recycled to the Consolidated Income Statement during 2024. For information on hedge accounting reserve, see section III.D to these Consolidated Financial Statements.
27 Contingencies, commitments and restrictions on the distribution of profits
(i) Contingencies
Tenaris is from time to time subject to various claims, lawsuits and other legal proceedings, including customer, employee, tax and environmental-related claims, in which third parties are seeking payment for alleged damages, reimbursement for losses, or indemnity. Management with the assistance of legal counsel, periodically reviews the status of each significant matter and assesses potential financial exposure.
Some of these claims, lawsuits and other legal proceedings involve highly complex issues, and often these issues are subject to substantial uncertainties and, therefore, the probability of loss and an estimation of damages are difficult to ascertain. Accordingly, with respect to a large portion of such claims, lawsuits and other legal proceedings, the Company is unable to make a reliable estimate of the expected financial effect that will result from ultimate resolution of the proceeding. In those cases, the Company has not accrued a provision for the potential outcome of these cases.
If a potential loss from a claim, lawsuit or other proceeding is considered probable and the amount can be reasonably estimated, a provision is recorded. Accruals for loss contingencies reflect a reasonable estimate of the losses to be incurred based on information available to management as of the date of preparation of the financial statements and take into consideration litigation and settlement strategies. In a limited number of ongoing cases, the Company was able to make a reliable estimate of the expected loss or range of probable loss and, depending on the likelihood of occurrence, in some of such cases has accrued a provision for such loss but believes that publication of this information on a case-by-case basis would seriously prejudice the Tenaris’s position in the ongoing legal proceedings or in any related settlement discussions. Accordingly, in these cases, the Company has disclosed information with respect to the nature of the contingency but has not disclosed its estimate of the range of potential loss.
| Consolidated Financial Statements | |
| For the years ended 2023, 2022 and 2021 - all amounts in thousands of U.S. dollars, unless otherwise stated |
Below is a summary description of Tenaris’s material legal proceedings which are outstanding as of the date of these Consolidated Financial Statements. In addition, the Company is subject to other legal proceedings, none of which is believed to be material.
- CSN claims relating to the January 2012 acquisition of Usiminas
In 2013, the Company was notified of a lawsuit filed in Brazil by Companhia Siderúrgica Nacional (“CSN”), and various entities affiliated with CSN against the Company’s Brazilian subsidiary Confab and
On September 23, 2013, the first instance court dismissed the CSN lawsuit, and on February 8, 2017, the court of appeals maintained the understanding of the first instance court. On August 18, 2017, CSN filed an appeal to the Superior Court of Justice (“SCJ”) seeking the review and reversal of the decision issued by the Court of Appeals. On September 10, 2019, the SCJ declared CSN’s appeal admissible. On March 7, 2023, the SCJ, by majority vote, rejected CSN’s appeal. CSN made several submissions in connection with the SCJ decision, including a motion for clarification that challenged the merits of the SCJ decision. Decisions at the SCJ are adopted by majority vote and, at the date of these financial statements, voting at the SCJ with respect to the motion for clarification is ongoing. At an October 17, 2023 session, two justices voted in favor of remanding the case to the first instance for it to be retried following production and assessment of the new evidence, and two justices voted, without requiring any further evidence, in favor of granting CSN’s motion for clarification and reversing the March 7, 2023 decision that rejected CSN’s appeal; because the fifth member of SCJ excused himself from voting, a justice from another panel at the SCJ will be summoned to produce the tie-breaking vote. There are no specified deadlines for voting to be resumed or the SCJ decision to be issued. In any event, either party may appeal against a SCJ decision.
According to the views of the two justices that voted in favor of CSN’s motion, Confab and the other members of the T/T Group should be ordered to pay to CSN an indemnification amount equal to the difference between the price paid by the T/T Group in its acquisition and the market value of the Usiminas shares at signing, plus monetary adjustment and interest (at a rate of
The Company continues to believe that all of CSN’s claims and allegations are groundless and without merit, as confirmed by several opinions of Brazilian legal counsel, two decisions issued by the Brazilian securities regulator in February 2012 and December 2016, the first and second instance court decisions and the March 7, 2023 SCJ decision referred to above. Notwithstanding the foregoing, in light of the votes already issued by two members of the SCJ on CSN’s motion for clarification, the Company cannot predict the ultimate resolution on the matter.
- Veracel celulose accident litigation
| Consolidated Financial Statements | |
| For the years ended 2023, 2022 and 2021 - all amounts in thousands of U.S. dollars, unless otherwise stated |
On September 21, 2007, an accident occurred in the premises of Veracel Celulose S.A. (“Veracel”) in connection with a rupture in one of the tanks used in an evaporation system manufactured by Confab. The Veracel accident allegedly resulted in material damages to Veracel. Itaú Seguros S.A. (“Itaú”), Veracel’s insurer at the time of the Veracel accident and then replaced by Chubb Seguros Brasil S/A (“Chubb”), initiated a lawsuit against Confab seeking reimbursement of damages paid to Veracel in connection with the Veracel accident. Veracel initiated a second lawsuit against Confab seeking reimbursement of the amount paid as insurance deductible with respect to the Veracel accident and other amounts not covered by insurance. Itaú and Veracel claimed that the Veracel accident was caused by failures and defects attributable to the evaporation system manufactured by Confab. Confab believes that the Veracel accident was caused by the improper handling by Veracel’s personnel of the equipment supplied by Confab in violation of Confab’s instructions. The two lawsuits were consolidated and are considered by the 6th Civil Court of São Caetano do Sul. However, each lawsuit will be adjudicated separately.
On September 28, 2018, Confab and Chubb entered into a settlement agreement pursuant to which on October 9, 2018, Confab paid an amount of approximately $
On October 10, 2018, Confab was notified that the court had issued rulings for both lawsuits. Both decisions were unfavorable to Confab:
| • |
With respect to Chubb’s claim, the court subsequently homologated the above-mentioned settlement and, accordingly, the claim was finalized. |
| • |
With respect to Veracel’s claim, Confab was ordered to pay the insurance deductible and other concepts not covered by insurance, currently estimated to amount to BRL |
- Petrobras-related proceedings and claims 1
Upon learning that Brazilian, Italian and Swiss authorities were investigating whether certain payments were made prior to 2014 from accounts of entities presumably associated with affiliates of the Company to accounts allegedly linked to individuals related to Petróleo Brasileiro S.A. (“Petrobras”) and whether any such payments were intended to benefit the Company’s Brazilian subsidiary Confab, the Audit Committee of the Company's Board of Directors engaged external counsel in connection with the Company’s review of these matters. In addition, the Company voluntarily notified the U.S. Securities and Exchange Commission (“SEC”) and the U.S. Department of Justice (“DOJ”) in October 2016. The Company conducted, with the assistance of external counsel, an internal investigation and found no evidence corroborating any involvement by the Company or its directors, officers or employees in respect of improper payments. An internal investigation commissioned by Petrobras also found no evidence that Confab obtained any unfair commercial benefit or advantage from Petrobras in return for payments, including improperly obtained contracts. On June 2, 2022, the Company resolved the investigation by the SEC, and the DOJ informed that it had closed its parallel inquiry without taking action. Under the settlement with the SEC, the Company neither admits nor denies the SEC’s findings and on June 24, 2022, paid $
In July 2019, the Company learned that the public prosecutors’ office of Milan, Italy, had completed a preliminary investigation into the same alleged payments and had included in the investigation, among other persons, the Company’s Chairman and Chief Executive Officer, two other board members, Gianfelice Rocca and Roberto Bonatti, and the Company’s controlling shareholder, San Faustin. The Company is not a party to the proceedings. On March 22, 2022, upon completion of the evidentiary phase of the trial, the acting prosecutor requested the first-instance court in Milan in charge of the case to impose sanctions on our Chairman and Chief Executive Officer, on the other two board members, and on San Faustin. The Company’s outside counsel in Italy advised the Company that neither the case file nor the prosecutor’s request contain or identify any evidence of involvement in, or knowledge of, the alleged wrongdoing by any of the three directors. On May 26, 2022, the first-instance court dismissed the case brought by the public prosecutor against the defendants for lack of jurisdiction and stated that the criminal proceeding should not have been initiated. On October 7, 2022, the public prosecutor filed an appeal against the first-instance court’s decision. On February 22, 2024, the court of appeals referred the case to the court of cassation, which will be in charge of determining whether or not the Italian courts have jurisdiction over the matter.
| 1 This note was updated subsequently to the approval of these Consolidated Financial Statements by the Company’s Board of Directors on February 21, 2024. | |
| Consolidated Financial Statements | |
| For the years ended 2023, 2022 and 2021 - all amounts in thousands of U.S. dollars, unless otherwise stated |
In June 2020, the Brazilian public prosecutors’ office requested the indictment of several individuals, including three executives or former executives of Confab and a former agent of Confab, charging them with the alleged crimes of corruption in relation to contracts executed between 2007 and 2010, and money laundering in relation to payments between 2009 and 2013. These criminal proceedings are underway. Neither the Company nor Confab is a party to these criminal proceedings.
In addition, Petrobras and the Brazilian public prosecutors filed civil claims for damages against, among others, Confab and the Confab executives named in the criminal proceedings referred to above. Confab became aware of these civil claims in September 2022. As of December 31, 2023, the aggregate amount of these claims was estimated at BRL
- Putative class actions
Following the Company’s November 27, 2018, announcement that its Chairman and CEO Paolo Rocca had been included in an Argentine court investigation known as the Notebooks Case (a decision subsequently reversed by a higher court), two putative class action complaints were filed in the U.S. District Court for the Eastern District of New York. On April 29, 2019, the court consolidated the complaints into a single case, captioned “In re Tenaris S.A. Securities Litigation”, and appointed lead plaintiffs and lead counsel.
On July 19, 2019, the lead plaintiffs filed an amended complaint purportedly on behalf of purchasers of Tenaris securities during the putative class period of May 1, 2014, through December 5, 2018. The individual defendants named in the complaint are Tenaris’s Chairman and CEO and Tenaris’s former CFO. The complaint alleges that during the class period, the Company and the individual defendants inflated the Tenaris share price by failing to disclose that the nationalization proceeds received by Ternium (in which the Company held an
On October 9, 2020, the court granted in part and denied in part the defendants’ motions to dismiss. The court partially granted and partially denied the motion to dismiss the claims against the Company and its Chairman and CEO. In addition, the court granted the motions to dismiss as to all claims against San Faustin, Techint, and Tenaris’s former CFO.
On November 11, 2022, the parties filed a joint notice of settlement announcing a settlement in principle of all claims in the action, subject to finalizing the settlement agreements and court approval. The parties’ agreement in principle provides that, in exchange for dismissal of the action and customary releases from class members and with no admission of liability by Tenaris or Mr. Rocca, Tenaris will pay to the class $
On April 10, 2023, the court granted preliminary approval to the class settlement. The final settlement approval hearing was set for October 19, 2023, and on that date the court ordered that, prior to granting final settlement approval, the lead plaintiffs submit on or before March 29, 2024, an update letter advising the court of the status of the claims processing.
- Administrative proceeding concerning Brazilian tax credits
Confab is a party to an administrative proceeding concerning the recognition and transfer of tax credits for an amount allegedly exceeding the amount that Confab would have been entitled to recognize and / or transfer. The proceeding resulted in the imposition of a fine against Confab representing approximately
- U.S. patent infringement litigation
| Consolidated Financial Statements | |
| For the years ended 2023, 2022 and 2021 - all amounts in thousands of U.S. dollars, unless otherwise stated |
Tenaris Coiled Tubes, LLC (“TCT”), a U.S. subsidiary of the Company, was sued in 2017 by its competitor Global Tubing, alleging defamatory conduct by TCT and seeking a declaration that certain Global Tubing products do not infringe patents held by TCT. TCT counterclaimed that certain Global Tubing products did infringe patents held by TCT, and Global Tubing has since sought to invalidate such patents. On December 13, 2019, Global Tubing filed an amended complaint (including the Company as defendant), alleging, among other things, that TCT and the Company had misled the patent office. On March 20, 2023, the judge granted summary judgment in favor of Global Tubing, concluding that the patents at issue are unenforceable due to inequitable conduct during the patent prosecution process. TCT appealed this judgment, and Global Tubing appealed a previous ruling of the judge. Global Tubing also filed a brief seeking to recover attorneys’ fees, without specifying the amount of those fees. Although it is not possible to predict the final outcome of this matter, the Company believes that any potential losses arising from this case will not be material.
- U.S. Antidumping Duty Investigations
On October 27, 2021, the U.S. Department of Commerce (“DOC”) initiated antidumping duty investigations of oil country tubular goods (“OCTG”) from Argentina, Mexico, and Russia. After the DOC issued affirmative preliminary and final antidumping determinations with respect to imports from Argentina, Mexico and Russia on October 27, 2022, the International Trade Commission (“ITC”) determined that the imports under investigation caused injury to the U.S. OCTG industry. Tenaris and other parties have appealed the agency determinations from the investigation to the Court of International Trade. In addition, in response to a request from the Government of Argentina, the World Trade Organization (“WTO”) established a panel of experts to consider whether the DOC’s antidumping order applicable to Argentina is consistent with the international obligations of the United States. As a result of the investigation, and unless overturned on appeal, Tenaris is required to pay antidumping duty deposits (at a rate of
- Potential dispute with agent in the Middle East 2
Consistent with local practice in certain Middle East countries, Tenaris Global Services S.A. (“TGSU”), a Uruguayan subsidiary of the Company, sells materials to a local agent, and the agent then resells the materials to customers in the region. Tenaris is not a party to the contracts between the agent and each customer. In one such contract entered into in mid-2021, with pending obligations of approximately $
| 2 This note was updated subsequently to the approval of these Consolidated Financial Statements by the Company’s Board of Directors on February 21, 2024. | |
| Consolidated Financial Statements | |
| For the years ended 2023, 2022 and 2021 - all amounts in thousands of U.S. dollars, unless otherwise stated |
(ii) Commitments and guarantees
Set forth is a description of the Tenaris’s main outstanding commitments:
| • |
Certain subsidiaries of the Company entered into a contract with Praxair S.A. for the service of oxygen and nitrogen supply. As of December 31, 2023, the aggregate amount to take or pay the committed volumes for an original |
| • |
A subsidiary of the Company entered into a |
| • |
A U.S. subsidiary of the Company is a party to a contract with Nucor Steel Memphis Inc. under which it is committed to purchase on a monthly basis a specified minimum volume of steel bars, at prices subject to quarterly adjustments. The contract became effective upon delivery of the first purchase order, which occurred in April 2021, with an original duration of |
| • |
In connection with the closing of the acquisition of IPSCO, a U.S. subsidiary of the Company entered into a |
| • |
A Brazilian subsidiary of the Company entered into a contract with Usiminas and Gerdau from which it committed to purchase steel coils for a remaining amount of approximately $ |
| • |
A subsidiary of the Company entered into a contract with the supplier JFE Steel Corporation for the purchase of tubular material, including 13 Chrome alloy products following the closure of NKKTubes. Such contract foresees a penalty for a maximum amount of $ |
In addition, Tenaris (i) applied for stand-by letters of credit as well as corporate guarantees covering certain obligations of Techgen as described in note 14 (c) and (ii) issued performance guarantees mainly related to long-term commercial contracts with several customers and parent companies for approximately $
| Consolidated Financial Statements | |
| For the years ended 2023, 2022 and 2021 - all amounts in thousands of U.S. dollars, unless otherwise stated |
(iii) Restrictions on the distribution of profits and payment of dividends
In accordance with Luxembourg Law, the Company is required to transfer a minimum of
As of December 31, 2023, this reserve is fully allocated and additional allocations to the reserve are not required under Luxembourg law. Dividends may not be paid out of the legal reserve.
The Company may pay dividends to the extent, among other conditions, that it has distributable retained earnings calculated in accordance with Luxembourg law and regulations.
28 Cancellation of title deed in Saudi Steel Pipe Company
In early 2021, the Company learned through the Saudi Ministry of Justice’s online portal that the electronic title deeds to certain land plots of its Saudi Arabian subsidiary SSPC had become inactive due to cancellation by court order.
The affected land plots, with a total surface of
As of the date hereof, neither the cancellation nor the court order have been notified to SSPC or otherwise been made public by the authorities, and the legal basis for the court order is unknown. On May 4, 2021, SSPC filed a petition with an ad-hoc created special committee at the Saudi Ministry of Justice, seeking to have its title deeds reinstated. At this time, it is not possible to predict the outcome of this matter.
29 Foreign exchange control measures in Argentina
Between September 2019 and December 13, 2023, the Argentine government imposed significant restrictions on foreign exchange transactions. Although after a new administration took office in Argentina in December 2023 certain restrictions were eased and other changes to such regulations are expected, at the date of these Consolidated Financial Statements the application of existing foreign exchange regulations remains uncertain and the scope and timing of upcoming changes remain unknown. The main currently applicable measures are described below:
| Consolidated Financial Statements | |
| For the years ended 2023, 2022 and 2021 - all amounts in thousands of U.S. dollars, unless otherwise stated |
| • |
Foreign currency proceeds derived from exports of goods must be sold into the Argentine foreign exchange market (“MULC”) and converted into Argentine pesos within 60 days (if made to related parties) or 180 days (if made to unrelated parties) from shipment date, or, if collected earlier, within five days of collection. Foreign currency proceeds from exports of services must be sold into the MULC and converted into Argentine pesos within five business days of collection. As from December 13, 2023, up to | ||
| • | Access to the MULC to pay for imports of services rendered by related and non-related parties (including royalties) on or before December 12, 2023, is subject to Argentine Central Bank approval. Currently, these approvals are rarely, if ever, granted. Access to the MULC to pay for imports of services that were rendered or accrued as from December 13, 2023, does not require government approval, but payment is deferred 30 calendar days as from the date of supply or accrual of the service (if the service was rendered by a non-related party) or 180 calendar days (if rendered by a related party). | ||
| • |
Access to the MULC to pay for imports of goods is subject to several restrictions. For example, advance payments or at sight cannot be made. In addition: | ||
| - | Access to the MULC to pay for imports of goods that obtained customs clearance on or before December 12, 2023 requires the prior Argentine Central Bank approval. The Argentine Central Bank is currently issuing newly created Bonds (“BOPREALs”) with a maturity of | ||
| - | Access to the MULC to pay for imports that have obtained customs clearance as from December 13, 2023, does not require government approval but, it requires that the price is paid in four equal instalments payable on the 30th, 60th, 90th and 120th day counted from the customs clearance of the good imported. | ||
| • |
Access to the MULC to make dividend payments requires prior Argentine Central Bank approval. When required, Argentine Central Bank approvals are rarely, if ever, granted. |
||
The above-described measures substantially limit the ability of Argentine companies to obtain foreign currency and make certain payments and distributions out of Argentina through the MULC at the official exchange rate.
Access to foreign currency and transfers out of Argentina can be achieved, however, through securities transactions involving bonds or shares with multiple listings, resulting in a different implicit exchange rate, generally higher than the official exchange rate. Such transactions are subject to certain restrictions and limits, which change from time to time, and often result in a financial loss being generated at the time of making any such transaction. For example, in the past, the Argentine Securities Commission imposed several additional restrictions on such securities transactions, including a requirement to give prior notice to the Argentine government of any proposed transfer of securities outside of Argentina and a limitation on the amount of any such transfers. The new Argentine Securities Commission’s authorities has loosened certain of such limitations, although it is not clear if it will further eliminate or loosen remaining restrictions.
| Consolidated Financial Statements | |
| For the years ended 2023, 2022 and 2021 - all amounts in thousands of U.S. dollars, unless otherwise stated |
During May 2023, two Argentine subsidiaries of the Company, approved the distribution of dividends in kind to their foreign shareholders, which were paid with U.S. dollar-denominated Argentine bonds that, in the Argentine market had a valuation of approximately $
The exchange rate of the Argentine peso against the U.S. dollar devaluated by more than 100% upon the change of government. Tenaris’s financial position in Argentine pesos as of December 31, 2023, amounted to a net short exposure of approximately $
As of December 31, 2023, the total equity of Argentine subsidiaries represented approximately
This context of volatility and uncertainty remains in place as of the issue date of these Consolidated Financial Statements. Management continues to monitor closely the evolution of the main variables affecting its business, identifying the potential impact thereof on its financial and economic situation and determining the appropriate course of action in each case. These Consolidated Financial Statements should be read taking into account these circumstances.
30 Cash flow disclosures
|
|
|
Year ended December 31, |
|||||||
|
|
|
2023 |
2022 |
2021 |
|||||
|
(i) |
Changes in working capital (*) |
|
|
|
|||||
|
|
Inventories |
|
( |
) |
( |
) | |||
|
|
Receivables and prepayments and current tax assets |
|
( |
) |
( |
) | |||
|
|
Trade receivables |
|
( |
) |
( |
) | |||
|
|
Other liabilities |
|
|
|
|||||
|
|
Customer advances |
( |
) |
|
|
||||
|
|
Trade payables |
( |
) |
|
|
||||
|
|
|
|
( |
) |
( |
) | |||
|
(ii) |
Income tax accruals less payments |
|
|
|
|||||
|
|
Tax accrued |
|
|
|
|||||
|
|
Taxes paid |
( |
) |
( |
) |
( |
) | ||
|
|
|
( |
) |
|
|
||||
|
(iii) |
Interest accruals less payments, net |
|
|
|
|||||
|
|
Interest accrued, net |
( |
) |
( |
) |
( |
) | ||
|
|
Interest received |
|
|
|
|||||
|
|
Interest paid |
( |
) |
( |
) |
( |
) | ||
|
|
|
( |
) |
|
( |
) | |||
(*)
| Consolidated Financial Statements | |
| For the years ended 2023, 2022 and 2021 - all amounts in thousands of U.S. dollars, unless otherwise stated |
31 Related party transactions
As of December 31, 2023:
| • |
San Faustin owned |
| • |
San Faustin owned all of its shares in the Company through its wholly-owned subsidiary Techint, a Luxembourg société à responsabilité limitée, who is the holder of record of the above-mentioned Tenaris shares. |
| • |
Rocca & Partners Stichting Administratiekantoor Aandelen San Faustin, a private foundation located in the Netherlands (Stichting) (“RP STAK”) held voting shares in San Faustin sufficient in number to control San Faustin. |
| • | No person or group of persons controls RP STAK. |
Based on the information most recently available to the Company, Tenaris’s directors and senior management as a group owned
Transactions and balances disclosed as with “non-consolidated parties” are those with companies over which Tenaris exerts significant influence in accordance with IFRS, but does not have control. Transactions and balances disclosed as with “joint ventures” are those with companies over which Tenaris exerts joint control in accordance with IFRS, but does not have control. All other transactions and balances with related parties which are not non-consolidated parties and which are not consolidated are disclosed as “Other”. The following transactions were carried out with related parties:
|
|
|
Year ended December 31, |
|||||||
|
(i) |
Transactions |
2023 |
2022 |
2021 |
|||||
|
|
(a) Sales of goods and services |
|
|
|
|||||
|
|
Sales of goods to associated companies |
|
|
|
|||||
|
|
Sales of goods to other related parties |
|
|
|
|||||
|
|
Sales of services to associated companies |
|
|
|
|||||
|
|
Sales of services to joint ventures |
|
|
|
|||||
|
|
Sales of services to other related parties |
|
|
|
|||||
|
|
|
|
|
|
|||||
|
|
(b) Purchases of goods and services |
|
|
|
|||||
|
|
Purchases of goods to associated companies |
|
|
|
|||||
|
|
Purchases of goods to joint ventures |
|
|
|
|||||
|
|
Purchases of goods to other related parties |
|
|
|
|||||
|
|
Purchases of services to associated companies |
|
|
|
|||||
|
|
Purchases of services to other related parties |
|
|
|
|||||
|
|
|
|
|
|
|||||
|
|
(c) Financial Results |
|
|
|
|||||
|
|
Income from joint ventures |
|
|
|
|||||
|
|
|
|
|
|
|||||
|
|
|
|
|
|
|||||
|
|
(d) Dividends |
|
|
|
|||||
|
|
Dividends received from associated companies |
|
|
|
|||||
|
|
Dividends distributed to Techint Holdings S.àr.l. |
|
|
|
|||||
| Consolidated Financial Statements | |
| For the years ended 2023, 2022 and 2021 - all amounts in thousands of U.S. dollars, unless otherwise stated |
|
|
|
At December 31, |
||||
|
(ii) |
Period-end balances |
2023 |
2022 |
|||
|
|
(a) Arising from sales / purchases of goods / services |
|
|
|||
|
|
Receivables from associated companies |
|
|
|||
|
|
Receivables from joint ventures |
|
|
|||
|
|
Receivables from other related parties |
|
|
|||
|
|
Payables to associated companies |
( |
) |
( |
) | |
|
|
Payables to joint ventures |
( |
) |
( |
) | |
|
|
Payables to other related parties |
( |
) |
( |
) | |
|
|
|
|
( |
) | ||
|
|
(b) Financial debt |
|
|
|||
|
|
Finance lease liabilities from associated companies |
( |
) |
( |
) | |
|
|
Finance lease liabilities from other related parties |
( |
) |
( |
) | |
|
|
|
( |
) |
( |
) | |
In addition to the tables above, the Company issued various guarantees in favor of Techgen; for further details, please see note 14 (c and d) and note 27 (ii) to these Consolidated Financial Statements. No other material guarantees were issued in favor of other related parties.
Directors and senior management compensation
During the years ended December 31, 2023, 2022 and 2021, the cash compensation of Directors and Senior managers amounted to $
32 Principal accountant fees
Total fees accrued for professional services rendered by PwC Network firms to Tenaris S.A. and its subsidiaries are detailed as follows:
|
|
Year ended December 31, |
|||||||
|
|
2023 |
2022 |
2021 |
|||||
|
Audit fees |
|
|
|
|||||
|
Audit-related fees |
|
|
|
|||||
|
Tax fees |
|
|
|
|||||
|
All other fees |
|
|
|
|||||
|
Total |
|
|
|
|||||
In addition, PwC Network firms rendered $
33 Principal subsidiaries
The following is a list of Tenaris’s principal subsidiaries and its direct and indirect percentage of ownership of each controlled company at December 31, 2023.
|
Company |
Country of Incorporation |
Main activity |
Percentage of ownership at December 31, (*) | ||
|
2023 |
2022 |
2021 | |||
|
ALGOMA TUBES INC. |
Canada |
Manufacturing of welded and seamless steel pipes |
|
|
|
|
BREDERO SHAW INTERNATIONAL B.V. and subsidiaries |
Netherlands |
Holding company and supplier of pipe coating services |
|
NA |
NA |
|
CONFAB INDUSTRIAL S.A. and subsidiaries |
Brazil |
Manufacturing of welded steel pipes |
|
|
|
|
DALMINE S.p.A. and subsidiaries |
Italy |
Manufacturing of seamless steel pipes |
|
|
|
|
EXIROS B.V. and subsidiaries (a) |
Netherlands |
Procurement and trading services |
|
|
|
|
HYDRIL COMPANY and subsidiaries |
USA |
Manufacture and marketing of premium connections |
|
|
|
|
MAVERICK TUBE CORPORATION and subsidiaries |
USA |
Manufacturing of welded and seamless steel pipes |
|
|
|
|
P.T. SEAMLESS PIPE INDONESIA JAYA |
Indonesia |
Manufacturing of seamless steel products |
|
|
|
|
S.C. SILCOTUB S.A. |
Romania |
Manufacturing of seamless steel pipes |
|
|
|
|
SAUDI STEEL PIPE CO. and subsidiaries (b) |
Saudi Arabia |
Manufacturing of welded steel pipes |
|
|
|
|
SIAT SOCIEDAD ANONIMA |
Argentina |
Manufacturing of welded steel pipes |
|
|
|
|
SIDERCA SOCIEDAD ANONIMA INDUSTRIAL Y COMERCIAL and subsidiaries (c) |
Argentina |
Manufacturing of seamless steel pipes |
|
|
|
|
TALTA - TRADING AND MARKETING SOCIEDADE UNIPESSOAL LDA. |
Portugal |
Holding company |
|
|
|
|
TENARIS BAY CITY, INC. |
USA |
Manufacturing of welded and seamless steel pipes |
|
|
|
|
TENARIS CONNECTIONS BV |
Netherlands |
Development, management and licensing of intellectual property |
|
|
|
|
TENARIS FINANCIAL SERVICES S.A. |
Uruguay |
Financial company |
|
|
|
|
TENARIS GLOBAL SERVICES (CANADA) INC. |
Canada |
Marketing of steel products |
|
|
|
|
TENARIS GLOBAL SERVICES (U.S.A.) CORPORATION |
USA |
Marketing of steel products |
|
|
|
|
TENARIS GLOBAL SERVICES (UK) LTD |
United Kingdom |
Holding company and marketing of steel products |
|
|
|
|
TENARIS GLOBAL SERVICES S.A. and subsidiaries |
Uruguay |
Holding company, marketing and distribution of steel products |
|
|
|
|
TENARIS INVESTMENTS (NL) B.V. and subsidiaries |
Netherlands |
Holding company |
|
|
|
|
TENARIS GLOBAL SERVICES and INVESTMENTS S.àr.l. and subsidiaries |
Luxembourg |
Holding company |
|
|
|
|
TENARIS QINGDAO STEEL PIPES LTD. |
China |
Processing of premium joints, couplings and automotive components |
|
|
|
|
TENARIS TUBOCARIBE LTDA. |
Colombia |
Manufacturing of welded and seamless steel pipes |
|
|
|
|
TUBOS DE ACERO DE MEXICO, SA and subsidiaries |
Mexico |
Manufacturing of seamless steel pipes |
|
|
|
(*)
Tenaris holds
(a)
(b)
(c)
| F-80 |
| Consolidated Financial Statements | |
| For the years ended 2023, 2022 and 2021 - all amounts in thousands of U.S. dollars, unless otherwise stated |
34 Business combinations
The application of the purchase method requires certain estimates and assumptions, mainly concerning the determination of the fair values of the acquired intangible assets, property, plant and equipment as well as the liabilities assumed at the date of the acquisition, including the timing and amounts of cash flow projections, the revenue growth rates, the customer attrition rates and the discount rate. The fair values determined at the acquisition date are based on discounted cash flows and other valuation techniques.
The preliminary purchase price allocations were carried out with the assistance of third-party experts. Following IFRS 3, the Company will continue reviewing the allocations and make any necessary adjustments during the twelve months following each of the acquisition dates.
Whenever applicable, Tenaris recognizes the non-controlling interest at the proportionate share of the acquiree’s net identifiable assets.
Global Pipe Company acquisition
- Acquisition and price determination
On May 17, 2023, SSPC acquired
The Company consolidates GPC’s balances and results of operations as from May 17, 2023. The acquired business, which, contributed revenues of $
- Fair value of net assets acquired
The allocation of the fair values determined for the assets and liabilities arising from the acquisition is as follows:
|
Fair value of acquired assets and liabilities as of acquisition date (May, 17, 2023): |
$ million |
|
|
Property, Plant and Equipment |
|
|
|
Working capital |
|
|
|
Cash and Cash Equivalents |
|
|
|
Borrowings |
( |
) |
|
Other assets and liabilities, net |
( |
) |
|
Net assets acquired |
|
Tenaris accounted for this transaction as a step-acquisition whereby Tenaris’s ownership interest in GPC held before the acquisition, which amounted to $
The fair value of the net assets and liabilities acquired shown above amounted to approximately $
| Consolidated Financial Statements | |
| For the years ended 2023, 2022 and 2021 - all amounts in thousands of U.S. dollars, unless otherwise stated |
Acquisition-related costs for the year ended 2022 were not material and for the year ended December 31, 2023, amounted to $
SSPC and the other owners of GPC have issued corporate guarantees to secure the repayment of loan agreements entered into by GPC with the Saudi Investment Development Fund, the Saudi British Bank, the National Commercial Bank and Banque Saudi Fransi to finance GPC’s capital expenditures and working capital.
As a result of this acquisition, SSPC assumed a portion of EEW’s corporate guarantees. As of December 31, 2023, SSPC’s aggregate exposure to GPC’s financial debt amounted to $
Acquisition of Anticorrosion Coating Assets in Italy
- Acquisition and price determination
On July 1, 2023, an Italian subsidiary of the Company completed its previously announced acquisition of all of the assets and related rights, duties, liabilities and contracts of Isoplus Mediterranean S.r.l.’s (“Isoplus”) anticorrosion coating division for EUR
Isoplus was established in 2009 in Villamarzana in Italy. It operates in an area of about
The Company consolidated Isoplus anticorrosion coating division balances and results of operations as from July 1, 2023. The acquired business revenues, assigned to Tubes segment, were not material, with a minor contribution to the Company’s results for the period starting July 1, 2023 and ending December 31, 2023. Had the transaction been consummated on January 1, 2023, then Tenaris’s unaudited pro forma net sales and net income would not have changed materially.
- Fair value of net assets acquired
The allocation of the fair values determined for the assets and liabilities arising from the acquisition is as follows:
|
Fair value of acquired assets and liabilities as of acquisition date (July, 1, 2023): |
$ million |
|
|
Property, Plant and Equipment |
|
|
|
Working capital |
|
|
|
Net assets acquired |
|
The fair value of the net assets and liabilities acquired shown above amounted to approximately $
Acquisition-related costs for year ended December 31, 2023, were not material and were included in general and administrative expenses.
Acquisition of Republic Tube pipe processing facility
- Acquisition and price determination
On September 6, 2023, a U.S. subsidiary of the Company acquired all of the assets and related rights, duties, liabilities and contracts of Republic Tube LLC’s OCTG pipe processing facility in Houston, Texas. The final acquisition price amounted to $
| Consolidated Financial Statements | |
| For the years ended 2023, 2022 and 2021 - all amounts in thousands of U.S. dollars, unless otherwise stated |
The plant, located on the northeast side of Houston, adds heat treatment and finishing lines, further complementing Tenaris’s existing operations, and increasing its capacity to serve the domestic market.
The Company consolidated the balances and results of operations of the acquired business as from September 6, 2023. The acquired business revenues, assigned to Tubes segment, were not material, with a minor contribution to the Company’s results for the period starting September 6, 2023, and ending December 31, 2023. Had the transaction been consummated on January 1, 2023, then Tenaris’s unaudited pro forma net sales and net income would not have changed materially.
- Fair value of net assets acquired
The allocation of the fair values determined for the assets and liabilities arising from the acquisition is as follows:
|
Fair value of acquired assets and liabilities as of acquisition date (September, 6, 2023): |
$ million |
|
|
Property, Plant and Equipment |
|
|
|
Working capital |
( |
) |
|
Other assets and liabilities, net |
|
|
|
Net assets acquired |
|
The fair value of the net assets and liabilities acquired shown above amounted to approximately $
The goodwill generated by the acquisition is mainly attributable to the synergy created following the integration between the businesses, which is expected to enhance Tenaris’s position as well as its local manufacturing presence in the U.S. market, and also expand its services capabilities.
Acquisition-related costs for the year ended December 31, 2023, amounted to $
Acquisition of the Pipe Coating Business Unit of Mattr
- Acquisition and price determination
On November 30, 2023, Tenaris completed the acquisition of Mattr’s pipe coating business unit for $
The business acquired includes
The Company consolidated the balances and results of operations of the acquired business as from November 30, 2023. The acquired business contributed revenues of $
| Consolidated Financial Statements | |
| For the years ended 2023, 2022 and 2021 - all amounts in thousands of U.S. dollars, unless otherwise stated |
- Fair value of net assets acquired
The allocation of the fair values determined for the assets and liabilities arising from the acquisition is as follows:
|
Fair value of acquired assets and liabilities as of acquisition date (November 30, 2023): |
$ million |
|
|
Property, Plant and Equipment |
|
|
|
Intangible assets |
|
|
|
Working capital |
( |
) |
|
Cash and Cash Equivalents |
|
|
|
Provisions |
( |
) |
|
Other assets and liabilities, net |
|
|
|
Net assets acquired |
|
The fair value of the net assets and liabilities acquired shown above amounted to approximately $
Acquisition-related costs for the year ended December 31, 2023, amounted to $
35 Nationalization of Venezuelan subsidiaries
Following the nationalization by the Venezuelan government of the Company’s interests in its majority-owned subsidiaries TAVSA - Tubos de Acero de Venezuela S.A. (“Tavsa”) and Matesi Materiales Siderúrgicos S.A (“Matesi”) and in Complejo Siderúrgico de Guayana, C.A (“Comsigua”), the Company and its wholly-owned subsidiary Talta - Trading e Marketing Sociedad Unipessoal Lda (“Talta”) initiated arbitration proceedings against Venezuela before the ICSID in Washington D.C. in connection with these nationalizations and obtained favorable awards, which are final and not subject to further appeals.
Matesi
On January 29, 2016, the tribunal released its award on the arbitration proceeding concerning the nationalization of Matesi. The award upheld Tenaris’s and Talta’s claim and granted compensation in the amount of $
On June 8, 2018, Tenaris and Talta filed an action in federal court in the District of Columbia to recognize and enforce the award in the United States. On July 17, 2020, the court entered judgment recognizing the Matesi award. The judgment orders Venezuela to pay to Tenaris and Talta an amount of $
| Consolidated Financial Statements | |
| For the years ended 2023, 2022 and 2021 - all amounts in thousands of U.S. dollars, unless otherwise stated |
On December 12, 2016, the tribunal issued its award upholding Tenaris’s and Talta’s claim and granted compensation in the amount of $
On June 8, 2018, Tenaris and Talta filed an action in federal court in the District of Columbia to recognize and enforce the award in the United States. On March 29, 2021, the court granted Tenaris’s and Talta’s request to recognize the Tavsa award and on August 24, 2021, the court entered judgment in favor of Tenaris and Talta and against Venezuela in the amount of $
Transfer of the Awards and Judgements
On January 25, 2023, Tenaris and Talta entered into an awards purchase agreement with an unaffiliated purchaser pursuant to which Tenaris and Talta agreed to sell all of their rights, title and interests in the above-referenced claims, awards and judgements, including all post-award or post-judgement interest accruing on the awards and judgements, for a purchase price of $
After the U.S. Office of Foreign Assets Control approved the transfer of the awards and judgements to the purchaser, the transfer was consummated on September 7, 2023. As a result, the Company collected $
36 Termination of NKKTubes joint venture
NKKTubes, a company owned
37 Share Buyback Program
On November 1, 2023, the Company’s board of directors approved a share buyback program of up to $
The buyback program is being carried out under the authority granted by the annual general meeting of shareholders held on June 2, 2020, which may be renewed or extended, up to a maximum of
The program is divided into tranches. For purposes of carrying out the first tranche of the buyback program, Tenaris entered into a non-discretionary buyback agreement with a primary financial institution that makes trading decisions concerning the timing of the purchases of Tenaris’s ordinary shares independently of and uninfluenced by Tenaris and must act in compliance with applicable rules and regulations, including the Market Abuse Regulation 596/2014 and the Commission Delegated Regulation (EU) 2016/1052. Under the buyback agreement, purchases of shares may continue during any blackout periods.
During 2023, the Company purchased
Further information on the buyback transactions is available on Tenaris’s corporate website under the Share Buyback Program Section.
| Consolidated Financial Statements | |
| For the years ended 2023, 2022 and 2021 - all amounts in thousands of U.S. dollars, unless otherwise stated |
38 Climate change
Tenaris carefully assesses the potential impact of climate change and energy transition on its business and on the risks to its markets and its tangible and intangible assets, and adapts its business strategy accordingly.
In February 2021 Tenaris set a medium-term target to reduce its carbon emissions intensity rate by
In its assessment, Tenaris also considers that the countries in which it operates and its customers are also establishing their own decarbonization strategies and objectives, and that some customers are requesting specific information from their suppliers, including Tenaris, concerning the carbon emissions and Environmental, Social and Governance (“ESG”) practices in their supply chain, and that they may adjust their supply practices in light of that information.
The recoverable value assessments performed by the Company for purposes of the preparation of these financial statements reflects management’s views on energy transition and climate change and their potential medium- and long-term impact on Tenaris’s operations and its sales. In addition, the Company carefully monitors the medium- and long-term outlook scenarios published by leading industry experts on how the energy transition could affect global demand for energy and oil and gas and how this could affect the global demand for tubular products and its sales. Furthermore, estimates and assumptions used in the Company’s impairment tests over long-lived assets and goodwill, useful lives of assets, capital and research and development expenditures, inventory valuation, recovery of deferred tax assets and provisions, and contingent liabilities are based on available information and current government regulations on energy transition and climate-related matters, as well as on Tenaris’s current short-term investment plans. As of the date of these financial statements, the Company does not believe that climate-related matters should trigger any material adjustments to the conclusions of its impairment tests or the valuation of the above mentioned areas.
39 Events after the reporting period
Annual Dividend Proposal and Second Tranche of Share Buyback Program 3
Upon approval of the Company´s annual accounts in March 2024, the Board of Directors intends to propose, for the approval of the Annual General Shareholders' meeting to be held on April 30, 2024, the payment of an annual dividend of $
The second $
/s/ Alicia Móndolo
Alicia Móndolo
Chief Financial Officer
| 3 This note was updated subsequently to the approval of these Consolidated Financial Statements by the Company’s Board of Directors on February 21, 2024. | |
| F-86 |