|
|
UNITED STATES
SECURITIES AND EXCHANGE COMMISSION
Washington, D.C. 20549
FORM
For the fiscal year ended
or
For the transition period from to
Commission File Number:
(Exact name of registrant as specified in its charter)
|
|
|
|
(State or other jurisdiction of incorporation or organization) | (I.R.S. Employer Identification No.) |
(Address of principal executive offices, including zip code)
(
(Registrant’s telephone number, including area code)
Securities registered pursuant to Section 12(b) of the Act:
|
|
|
Title of each class | Trading symbol(s) | Name of each exchange on which registered |
The |
Securities registered pursuant to Section 12(g) of the Act:
None
Indicate by check mark if the registrant is a well-known seasoned issuer, as defined in Rule 405 of the Securities Act. Yes ☐ No
Indicate by check mark if the registrant is not required to file reports pursuant to Section 13 or Section 15(d) of the Act. Yes ☐ No
Indicate by check mark whether the registrant (1) has filed all reports required to be filed by Section 13 or 15(d) of the Securities Exchange Act of 1934 during the preceding 12 months (or for such shorter period that the registrant was required to file such reports), and (2) has been subject to such filing requirements for the past 90 days. Yes No ☐
Indicate by check mark whether the registrant has submitted electronically every Interactive Data File required to be submitted pursuant to Rule 405 of Regulation S-T (§ 232.405 of this chapter) during the preceding 12 months (or for such shorter period that the registrant was required to submit such files). Yes No ☐
Indicate by check mark whether the registrant is a large accelerated filer, an accelerated filer, a non-accelerated filer, a smaller reporting company, or an emerging growth company. See the definitions of “large accelerated filer,” “accelerated filer,” “smaller reporting company,” and “emerging growth company” in Rule 12b-2 of the Exchange Act.
|
|
|
Large accelerated filer ☐ |
| |
Non-accelerated filer ☐ | Smaller reporting company |
|
| Emerging growth company |
|
If an emerging growth company, indicate by check mark if the registrant has elected not to use the extended transition period for complying with any new or revised financial accounting standards provided pursuant to Section 13(a) of the Exchange Act. ☐
Indicate by check mark whether the registrant has filed a report on and attestation to its management’s assessment of the effectiveness of its internal control over financial reporting under Section 404(b) of the Sarbanes-Oxley Act (15 U.S.C. 7262(b)) by the registered public accounting firm that prepared or issued its audit report.
If securities are registered pursuant to Section 12(b) of the Act, indicate by check mark whether the financial statements of the registrant included in the filing reflect the correction of an error to previously issued financial statements.
Indicate by check mark whether any of those error corrections are restatements that required a recovery analysis of incentive-based compensation received by any of the registrant’s executive officers during the relevant recovery period pursuant to § 240.10D-1(b). ☐
Indicate by check mark whether the registrant is a shell company (as defined in Rule 12b-2 of the Act). Yes ☐ No
The aggregate market value of the voting and non-voting common equity held by non-affiliates computed by reference to the price at which the common equity was last sold as of the last business day of the registrant’s most recently completed second fiscal quarter was approximately: $
As of February 26, 2024, the registrant had
Certain information required by Part III is incorporated by reference from the Company’s definitive Proxy Statement for the Annual Meeting of Stockholders, or an amendment to this Form 10-K, which the Company intends to file with the SEC within 120 days after the fiscal year end covered by this report.
|
|
TILE SHOP HOLDINGS, INC. FORM 10-K
|
|
|
|
TABLE OF CONTENTS | |||
|
|
|
|
PART I |
|
| |
| 1 | ||
| 5 | ||
| 16 | ||
| 16 | ||
| 18 | ||
| 18 | ||
| 19 | ||
|
|
|
|
PART II |
|
| |
| 20 | ||
| 22 | ||
| MANAGEMENT’S DISCUSSION AND ANALYSIS OF FINANCIAL CONDITION AND RESULTS OF OPERATIONS | 22 | |
| 30 | ||
| 31 | ||
| CHANGES IN AND DISAGREEMENTS WITH ACCOUNTANTS ON ACCOUNTING AND FINANCIAL DISCLOSURE | 31 | |
| 32 | ||
| 34 | ||
| DISCLOSURE REGARDING FOREIGN JURISDICTIONS THAT PREVENT INSPECTIONS | 34 | |
|
|
|
|
PART III |
|
| |
| 35 | ||
| 35 | ||
| SECURITY OWNERSHIP OF CERTAIN BENEFICIAL OWNERS AND MANAGEMENT AND RELATED STOCKHOLDER MATTERS | 35 | |
| CERTAIN RELATIONSHIPS AND RELATED TRANSACTIONS, AND DIRECTOR INDEPENDENCE | 36 | |
| 36 | ||
|
|
|
|
PART IV |
|
| |
| 37 | ||
| 37 | ||
|
|
|
|
65 | |||
|
| ||
|
|
|
|
66 | |||
PART I
ITEM 1. BUSINESS
Overview
The Tile Shop, LLC (“The Tile Shop”) was founded in 1985 and Tile Shop Holdings, Inc. (“Holdings,” and together with its wholly owned subsidiaries, including The Tile Shop, the “Company” or “we”) was incorporated in Delaware in June 2012. We are a specialty retailer of natural stone, man-made and luxury vinyl tiles, setting and maintenance materials, and related accessories in the United States. Our assortment includes over 6,000 products from around the world. Natural stone products include marble, travertine, granite, quartz, sandstone, slate, and onyx tiles. Man-made products include ceramic, porcelain, glass, cement, wood look, metal and luxury vinyl tile. The majority of our tile products are sold under our proprietary Rush River and Fired Earth brand names. We purchase our tile products, accessories and tools directly from our global network of suppliers. We manufacture our own setting and maintenance materials, such as thinset, grout and sealer, under our Superior brand name, as well as work with other suppliers to manufacture private label products. As of December 31, 2023, we operated 142 stores in 31 states and the District of Columbia, with an average size of approximately 20,000 square feet.
We believe that our long-term vendor relationships, together with our design, manufacturing and distribution capabilities, enable us to offer a broad assortment of high-quality products to our customers, who are primarily homeowners and professionals, at competitive prices. We have invested significant resources to develop our proprietary brands and product sources and believe that we are a leading retailer of natural stone, man-made and luxury vinyl tiles, setting and maintenance materials, and related accessories in the United States.
In 2023, we reported net sales and income from operations of $377.1 million and $16.2 million, respectively. Our 2022 and 2021 net sales were $394.7 million and $370.7 million, respectively, and our 2022 and 2021 income from operations was $22.6 million and $20.6 million, respectively. As of December 31, 2023 and 2022, we had total assets of $316.7 million and $345.8 million, respectively.
Competitive Strengths
We believe that the following factors differentiate us from our competitors and position us to continue to grow our specialty retailer business.
Broad Product Assortment at Attractive Prices – We offer over 6,000 natural stone, man-made and luxury vinyl tile products, setting and maintenance materials, accessories, and tools. We are able to maintain competitive prices by purchasing tile and accessories directly from producers and manufacturing our own setting and maintenance materials.
Customer Service and Satisfaction – Our sales personnel are highly-trained and knowledgeable about the technical and design aspects of our products. In addition, we provide one-on-one installation training as required to meet customer needs. We accept returns up to two months following the date of the sale, with no restocking fees.
Inspiring Customer Experience – In each store, our products are brought to life by showcasing a broad array of the items we offer in up to 50 different vignettes of bathrooms, kitchens, fireplaces, foyers, and other distinct spaces. Our stores are spacious, well-lit, and organized by product type to simplify our customers’ shopping experience.
Global Sourcing Capabilities – We have long-standing relationships with our tile suppliers throughout the world and work with them to design products exclusively for us. We believe that these direct relationships differentiate us from our competitors.
Proprietary Branding – We sell the majority of our products under our proprietary brand names, which helps us to differentiate our products from those of our competitors. We offer products across a range of price points and quality levels, which allows us to target discrete market segments and to appeal to diverse groups of customers.
Centralized Distribution System – We service our store locations from five distribution centers. Our distribution centers, located in Michigan, Oklahoma, New Jersey, Virginia, and Wisconsin, are located to cost effectively service our existing stores.
Strategic Plan
We are committed to carrying an outstanding assortment, offering unsurpassed customer service, and showcasing excellence within our industry. These principles have always been core to our strategy and will continue to be as we move into 2024.
Key elements of our 2024 strategy include:
People First – We pride ourselves on offering the best service in our industry, and our employees are the key to our success. We are committed to investing in training and development programs to further enhance the skill sets of all employees. We are also continuing to take steps to improve engagement, communication and collaboration across our teams.
Focused Retail Execution – We believe profitable growth is tied to our ability to leverage best practices and technology to improve productivity in each of our store locations. We have defined critical success measures, tactics to drive improvement in each area of focus, and reporting processes to monitor progress.
Supply Chain – We strive to increase efficiencies within our distribution channels and transparency of product availability throughout our distribution center and store locations. This enhances our ability to provide the best service in our industry and deliver products our customers desire wherever they may need them.
Assortment Management –We curate an industry leading assortment, which is a foundational aspect of our strategy. Our assortment includes good, better, and best options for our customers within each of the product categories we carry in our stores and online. We continue to focus on maintaining an assortment that differentiates our brand.
Sales Model
We principally sell our products directly to homeowners and professionals. With regard to individual customers, we believe that, due to the average cost and relative infrequency of a tile purchase, many of our individual customers conduct extensive research using multiple channels before making a purchase decision. Our sales strategy emphasizes customer service by providing comprehensive and convenient educational tools on our website and in our stores for our customers to learn about our products and the tile installation process. Our website contains a broad range of information regarding our tile products, setting and maintenance materials, and accessories. Customers can order samples, view catalogs, or purchase products from our stores or online. Customers can choose to have their purchases delivered or picked up at one of our stores. We believe this strategy also positions us well with professional customers who are influenced by the preferences of individual homeowners.
Our stores are designed to emphasize our products in a visually appealing showroom format. Our average store is approximately 20,000 square feet, with a majority of the square footage devoted to the showroom. Several thousand square feet is used for warehouse space, which is used primarily to hold customer orders waiting to be picked up or delivered. Our stores are typically accessible from major roadways and have significant visibility to passing traffic. We can adapt to a range of existing buildings, whether free-standing or in shopping centers. All of our stores are leased.
Unlike many of our competitors, we devote a substantial portion of our store space to showrooms, including samples of our products and up to 50 different vignettes of bathrooms, kitchens, fireplaces, foyers, and other distinct spaces that showcase our products. Our showrooms are designed to provide our customers with a better understanding of how to integrate various types of tile in order to create an attractive presentation in their homes.
A staffing model for a typical store consists of a manager, an assistant manager, sales associates, and a warehouse leader. Our store managers are responsible for store operations and for overseeing our customers’ shopping experience. We offer financing to customers through a line of credit provided by a third-party consumer finance company.
Marketing
We utilize a variety of marketing strategies and programs to acquire and retain customers, including both consumers and trade professionals. Our advertising primarily consists of digital media, direct marketing, including email and postal mail, in store events, and mobile advertisements. We continually test and learn from new media and adjust our programs based on performance.
Our website, TileShop.com, supports desktop, tablet, and mobile devices and is designed for consumers, trade professionals and industry stakeholders to learn about our brand, our value propositions, and our product assortment and installation techniques, and to look up our store locations and account information. On social media, #TheTileShop provides current and prospective customers a high level of brand engagement and enables customers to share their finished projects in our inspiration gallery.
Products
We offer an extensive and complete assortment of natural stone, man-made and luxury vinyl tile products, sourced directly from our suppliers. Natural stone products include marble, travertine, granite, quartz, sandstone, slate, and onyx tiles. Man-made products include ceramic, porcelain, glass, cement, wood look, metal and luxury vinyl tile. Our wide assortment of accessories, including trim pieces, mosaics, pencils, listellos, and other unique products, encourages our customers to make a fashion statement with their tile
project and helps us to deliver a high level of customer satisfaction and drive repeat business. We also offer a broad range of setting and maintenance materials, such as thinset, grout, sealers, and accessories, including installation tools, shower and bath shelves, drains, and similar products. We also offer customers delivery service through third-party freight providers. We sell most of our products under our proprietary brand names, including Superior Adhesives & Chemicals, Superior Tools & Supplies, Rush River, and Fired Earth. In total, we offer over 6,000 different tile products, setting and maintenance materials, and accessory products. The percentage of our net sales represented by each product category was as follows for the years ended December 31, 2023 and 2022:
|
|
|
|
|
|
|
|
|
|
|
|
|
|
|
| Years Ended December 31, | ||||
|
| 2023 |
|
| 2022 |
|
Man-made tiles |
| 54 | % |
| 51 | % |
Natural stone tiles |
| 21 |
|
| 25 |
|
Setting and maintenance materials |
| 15 |
|
| 15 |
|
Accessories |
| 8 |
|
| 7 |
|
Delivery service |
| 2 |
|
| 2 |
|
|
| 100 | % |
| 100 | % |
Suppliers
We have long-standing relationships with our suppliers throughout the world and work with them to design and manufacture products exclusively for us. We believe that these direct relationships differentiate us from our competitors.
We currently purchase tile products from approximately 190 different suppliers. Our top ten tile suppliers accounted for 51% of our purchases in 2023. Our largest supplier accounted for 14% of our total purchases in 2023. We believe that alternative and competitive suppliers are available for many of our products. The percentage of our total purchases from the following continents was as follows for the years ended December 31, 2023 and 2022:
|
|
|
|
|
|
|
|
|
|
|
|
|
|
|
| Years Ended December 31, | ||||
|
| 2023 |
|
| 2022 |
|
North America |
| 46 | % |
| 34 | % |
Europe |
| 29 |
|
| 37 |
|
Asia |
| 17 |
|
| 24 |
|
South America |
| 7 |
|
| 4 |
|
Africa |
| 1 |
|
| 1 |
|
|
| 100 | % |
| 100 | % |
|
|
|
|
|
|
|
Our inventory balance decreased by $27.3 million from $121.0 million to $93.7 million as of December 31, 2022 and December 31, 2023, respectively. The decrease in inventory is due to steps taken to reduce inventory quantities as well as a decrease in inventory costs stemming from a reduction in ocean freight rates and steps taken to shift sourcing of certain products in our assortment to lower cost suppliers. The decrease in the percentage of purchases from European and Asian suppliers is primarily due to the decrease in inventory quantities purchased as well as the decrease in cost. The volume of inventory purchased from North American suppliers remained relatively consistent year-over-year; however, the percentage of overall purchases from North American suppliers increased given the decrease in overall purchases from 2022 to 2023.
Distribution and Order Fulfillment
We take possession of our products in the country of origin and arrange for transportation to our five distribution centers located in Michigan, Oklahoma, New Jersey, Virginia and Wisconsin. We also manufacture many of our setting and maintenance materials in Michigan, Oklahoma, Virginia, and Wisconsin. We maintain a large inventory of products in order to quickly fulfill customer orders.
We fulfill customer orders primarily by shipping our products to our stores where customers can either pick them up or arrange for home delivery. We continue to evaluate logistics alternatives to best serve our store base and our customers.
Competition
The retail tile market is highly-fragmented. We compete directly with regional and local specialty retailers of tile, factory-direct stores, a large number of privately-owned, single-site stores, and online-only competitors. In addition, we compete with large national home improvement centers that offer a wide range of home improvement products, including flooring. We also compete indirectly with companies that sell other types of floor coverings, including wood floors, carpet, and vinyl. The barriers of entry into the retail tile industry are relatively low and new or existing tile retailers could enter our markets and increase the competition that we face. Many
of our competitors enjoy competitive advantages over us, such as greater name recognition, longer operating histories, more varied product offerings, and greater financial, technical, and other resources.
We believe that the key competitive factors in the retail tile industry include:
product assortment;
product presentation;
customer service;
store location;
availability of inventory; and
price.
We believe that we compete favorably with respect to each of these factors by providing a highly diverse selection of products to our customers, at an attractive value, in appealing and convenient store locations, with exceptional customer service and on-site instructional opportunities. Further, while some larger factory-direct competitors manufacture their own products, many of our competitors do not maintain their own inventory and instead purchase their tile from domestic manufacturers or distributors when they receive an order from a customer. We also believe that we offer a broader range of products and stronger in-store customer support than these competitors.
Human Capital
We believe that our employees are our strongest competitive advantage and the high-quality service that they provide sets us apart from others in our industry. As of December 31, 2023, we had 1,308 employees, 1,136 of whom were full-time and none who were represented by a union. This includes 964 employees who work in our stores, 125 who work in corporate, store support, infrastructure or similar functions, and 219 who work in our distribution and manufacturing facilities.
The Company’s Board of Directors (the “Board” or “Board of Directors”), through its Compensation Committee, provides oversight of human capital matters, including the Company’s diversity and inclusion initiatives, which promote equity across the organization. The Compensation Committee and Board periodically review the composition of our workforce and promote practices to hire from a diverse pool of candidates. The Compensation Committee and Board also review the Company’s compensation and benefits programs, as well as management development and succession planning practices and strategies.
Our principal human capital objectives are to attract, develop and retain people who are committed to our goal of providing the best service in our industry. To support these objectives, our human resources programs seek to:
Reward our employees through highly competitive total compensation and benefit programs designed to reward exceptional performance, promote teamwork and support our employees’ total wellbeing.
Provide development opportunities to enhance sales skills, product knowledge, exposure to the latest design trends, safety, teamwork and leadership.
Enhance our culture through efforts aimed at making our workplace more diverse, engaging, equitable and inclusive.
We believe that building a strong and diverse workforce is a significant contributor to our success. Creating a culture that embraces diversity and inclusion is the key to a collaborative and winning team culture. To achieve this goal, we seek diverse talent internally and externally in an effort to achieve broader diverse representation throughout our organization. We also promote inclusion through our training and development programs.
Intellectual Property and Trademarks
We have registered and unregistered trademarks for all of our brands, including 25 registered trademarks. We regard our intellectual property as having significant value, and our brands are an important factor in the marketing of our products. Accordingly, we have taken, and continue to take, appropriate steps to protect our intellectual property.
Government Regulation
We are subject to extensive and varied federal, state and local government regulation in the jurisdictions in which we operate, including laws and regulations relating to our relationships with our employees, public health and safety, zoning, and fire codes. We operate each of our stores, offices, and distribution and manufacturing facilities in accordance with standards and procedures designed to comply with applicable laws, codes, and regulations.
Our operations and properties are also subject to federal, state and local laws and regulations relating to the use, storage, handling, generation, transportation, treatment, emission, release, discharge and disposal of hazardous materials, substances, and wastes and relating to the investigation and cleanup of contaminated properties, including off-site disposal locations. We do not incur significant costs complying with environmental laws and regulations. However, we could be subject to material costs, liabilities, or claims relating to environmental compliance in the future, especially in the event of changes in existing laws and regulations or in their interpretation.
Products that we import into the United States are subject to laws and regulations imposed in conjunction with such importation, including those issued and enforced by U.S. Customs and Border Protection. We work closely with our suppliers to ensure compliance with the applicable laws and regulations in these areas.
Financial Information about Geographic Areas
A majority of our revenues and profits are generated within the United States and nearly all of our long-lived assets are located within the United States as well. We have also established a sourcing office based in China.
Available Information
We are subject to the reporting requirements of the Securities Exchange Act of 1934, as amended (the “Exchange Act”). The Exchange Act requires us to file periodic reports, proxy statements and other information with the Securities and Exchange Commission (“SEC”). The SEC maintains a website that contains reports, proxy and information statements, and other information regarding issuers that file electronically with the SEC. These materials may be obtained electronically by accessing the SEC’s website at http://www.sec.gov.
We maintain a website at www.tileshop.com. Information contained on or accessible through our website is not a part of, and is not incorporated by reference into, this Form 10-K or any other report or document we file with the SEC. Any reference to our website is intended to be an inactive textual reference only. We make our annual reports on Form 10-K, quarterly reports on Form 10-Q, current reports on Form 8-K and amendments to those reports available on our website, free of charge, as soon as reasonably practicable after such reports have been filed with or furnished to the SEC. Our Code of Business Conduct and Ethics, as well as any waivers from and amendments to the Code of Business Conduct and Ethics, is also posted on our website.
We intend to use the investor relations section of our website, investors.tileshop.com, as a means of disclosing material non-public information and for complying with our disclosure obligations under SEC Regulation FD. Such disclosures will be included on our website under the heading News and Events. Accordingly, investors should monitor such portions of our website, in addition to following our press releases, SEC filings and public conference calls and webcasts.
ITEM 1A. RISK FACTORS
The following are material factors known to us that could adversely affect our business, financial condition, or operating results, as well as adversely affect the value of an investment in our common stock. These risks could cause our actual results to differ materially from our historical experience and from results predicted by forward-looking statements. All forward-looking statements made by us are qualified by the risks described below. Disclosures of risks should not be interpreted to imply that the risks have not already materialized, and there may be additional risks that are not presently material or known. You should carefully consider each of the following risks and all other information set forth in this report.
Risks Related to Our Growth Strategy
Our ability to grow and remain profitable may be limited by direct or indirect competition in the highly-competitive retail tile industry.
The retail tile industry in the United States is highly competitive. Participants in the tile industry compete primarily based on product variety, customer service, store location, and price. There can be no assurance that we will be able to continue to compete favorably with our competitors in these areas. Our store competitors include large national home centers, regional and local specialty retailers of tile, factory-direct stores, privately-owned, single-site stores and online-only competitors. We also compete indirectly with companies that sell other types of floor coverings, including wood floors, carpet, and vinyl sheet. In the past, we have faced periods of heightened competition that materially affected our results of operations. Certain of our competitors have greater name recognition, longer operating histories, more varied product offerings, and substantially greater financial and other resources than us. Accordingly, we may face periods of intense competition in the future that could have a material adverse effect on our planned growth and future results of operations. Moreover, the barriers to entry into the retail tile industry are relatively low. New or existing retailers could enter our markets and increase the competition that we face. In addition, manufacturers and suppliers of tile and related products, including those whose products we currently sell, could enter the United States retail tile market and start directly competing with us. Further,
the retail industry in general is subject to rapid technological change, which may increase the amount of capital we spend in the future as we work to sustain and grow our technological infrastructure and digital commerce capabilities in order to remain competitive. Competition in existing and new markets may also prevent or delay our ability to gain relative market share. Any of the developments described above could have a material adverse effect on our planned growth and future results of operations.
Any failure by us to successfully anticipate consumer trends may lead to loss of consumer acceptance of our products, resulting in reduced revenues.
Our success depends on our ability to anticipate and respond to changing trends in the tile industry and consumer demands in a timely manner. If we fail to identify and respond to emerging trends, consumer acceptance of our merchandise and our image with current or potential customers may be harmed, which could reduce our revenue potential. Additionally, if we misjudge market trends, we may significantly overstock unpopular products and be forced to reduce the sales price of such products, which would have a negative impact on our gross profit and cash flow. Conversely, shortages of products that prove popular, or increases in our pricing as a result of general product shortages, supply chain disruptions and inflationary cost pressure, could cause customers to seek alternative sources of such products, as well as other products they may have purchased from us, which could also reduce our revenues.
If we are unable to effectively manage our online sales, our reputation and operating results may be harmed.
Consumers are increasingly embracing shopping online and through mobile commerce applications. Any failure on our part to provide an attractive, reliable and user-friendly digital platform that offers a wide assortment of merchandise and meets the changing expectations of online shoppers could place us at a competitive disadvantage, result in the loss of e-commerce and other sales, harm our reputation with consumers, and have a material adverse impact on the growth of our e-commerce business and on our business and results of operations. We are vulnerable to certain risks and uncertainties associated with our e-commerce operations, including changes in required technology interfaces, website downtime and other technical failures, costs and technical issues for upgrades of our website software, computer viruses, changes in applicable federal and state regulations, security breaches and consumer privacy concerns. If not managed, these risks could adversely impact our operating results.
If we fail to successfully manage the challenges that our planned growth poses or encounter unexpected difficulties during our expansion, our revenues and profitability could be materially adversely affected.
One of our long-term objectives is to increase revenue and profitability through market share gains. Our ability to achieve market share growth, however, is contingent upon our ability to open new stores and achieve operating results in new stores at the same level as our similarly situated current stores. There can be no assurance that we will be able to open stores in new markets at the rate required to achieve market leadership in such markets, identify and obtain favorable store sites, arrange favorable leases for stores, obtain governmental and other third-party consents, permits, and licenses needed to open or operate stores in a timely manner, train and hire a sufficient number of qualified managers for new stores, attract a strong customer base and brand familiarity in new markets, or successfully compete with established retail tile stores in the new markets that we enter. Failure to open new stores in an effective and cost-efficient manner could place us at a competitive disadvantage as compared to retailers who are more adept than us at managing these challenges, which, in turn, could negatively affect our overall operating results.
We intend to open additional stores in both our existing markets and new markets, which poses both the possibility of diminishing sales by existing stores in our existing markets and the risk of a slow ramp-up period for stores in new markets.
In future periods, we intend to open additional stores in new and existing markets. Because our stores typically draw customers from their local areas, additional stores may draw customers away from nearby existing stores and may cause comparable store sales performance at those existing stores to decline, which may adversely affect our overall operating results. Additionally, stores in new markets typically have a ramp-up period before sales become steady enough for such stores to be profitable. Our ability to open additional stores will be dependent on our ability to promote and/or recruit enough qualified store managers, assistant store managers, and sales associates. The time and effort required to train and supervise a large number of new managers and associates and integrate them into our culture may divert resources from our existing stores. If we are unable to profitably open additional stores in both new and existing markets and limit the adverse impact of those new stores on existing stores, our comparable store sales and overall operating results may be reduced during the implementation of our expansion strategy.
Any future expansion will be dependent upon, and limited by, the availability of adequate capital.
Our expansion strategy will require adequate capital for, among other purposes, opening new stores, distribution centers, and manufacturing facilities, as well as entering new markets. Such expenditures will include researching real estate and consumer markets, leases, inventory, property and equipment costs, integration of new stores and markets into company-wide systems and programs, and other costs associated with new stores and market entry expenses and growth. If cash generated internally is insufficient to fund capital requirements, we will require additional debt or equity financing. Adequate financing may not be available or, if available, may not be available on terms satisfactory to us. In addition, our credit facility may limit the amount of capital expenditures
that we may make annually, depending on our ability to satisfy applicable financial and other covenants. If we fail to obtain sufficient additional capital in the future or we are unable to make capital expenditures under our credit facility, we could be forced to curtail our expansion strategies by reducing or delaying capital expenditures relating to new stores and new market entry. As a result, there can be no assurance that we will be able to fund our current plans for the opening of new stores or entry into new markets.
Our success depends on the effectiveness of our marketing strategy.
We believe that our growth was achieved in part through the effectiveness of our marketing strategy, which uses a variety of marketing channels, tactics and methods to reach a qualified audience. Our diversified strategy includes traditional media advertising in print and direct mail, digital media through online advertising, social media marketing, search engine optimization, email marketing, influencer marketing and content marketing, which involves creating and distributing brand content such as blogs and videos. In addition, our limited use of discount and promotional offers could fail to attract customers, resulting in a decrease in store traffic. If our marketing strategies fail to draw customers in the future, or if the cost of advertising or other marketing materials increases significantly, we could experience declines in our net sales and operating results.
In addition, there has been a substantial increase in the use of social media platforms by consumers. Negative commentary regarding us or the products we sell may be posted on social media platforms or other electronic means at any time and may be adverse to our reputation or business. Customers value readily available information and often act on such information without further investigation and without regard to its accuracy. Any harm to us or the products we sell may be immediate without allowing us an opportunity for redress or correction.
Risks Related to our Business, Operations and Financial Condition
Numerous economic factors, including inflation, our exposure to the U.S. housing industry, and an economic recession or downturn, or a downturn in the U.S. housing industry, could adversely affect us.
The U.S. and global economy, as well as our business and results of operations, may be negatively impacted by a variety of factors, including inflation, interest rate increases, supply chain and labor disruptions, unemployment rates, banking instability, geopolitical events and uncertainty, such as the Ukraine-Russia conflict and Israel-Hamas war, any U.S. government shutdown, any downgrades in the U.S. government’s sovereign credit rating, public health crises and an economic downturn or recession. In particular, our results of operations are sensitive to changes in macroeconomic conditions that affect consumer spending, including discretionary spending, especially as a substantial portion of the products we offer are products that consumers may view as discretionary items rather than necessities. Difficult macroeconomic conditions also affect our customers’ ability to obtain consumer credit. In recent years, high inflation has negatively impacted consumer confidence and discretionary spending; in addition, the U.S. Federal Reserve raised interest rates several times in response to concerns about such inflation. The impact of inflation and increased interest rates on various areas of our business, including labor and product costs and interest expenses, has negatively impacted our business, financial condition and results of operations, and while we have worked to mitigate such impacts, including increasing our prices, we may not be able to mitigate any future impacts of inflation or high interest rates. In addition, while inflation has recently slowed and further interest rate increases are currently not anticipated, economic uncertainty and the potential for an economic recession remains. We are unable to predict any future trends in the rate of inflation and interest rates, and if (and to the extent that) we are unable to recover higher costs in the event of future increases in inflation or interest rates, such increases could adversely affect our business, financial condition or results of operations. As global economic conditions continue to be volatile and economic uncertainty remains, trends in consumer discretionary spending also remain unpredictable and such spending may decrease due to credit constraints and uncertainties about the future. Other factors, including consumer confidence, employment levels, interest rates, tax rates, consumer debt levels, and fuel and energy costs, could reduce consumer spending or change consumer purchasing habits. Accordingly, slowdowns in the U.S. or global economy, including the possibility of recession, or an uncertain economic outlook, could materially adversely affect consumer spending habits and could have a material adverse effect on our financial results, business, and prospects.
Furthermore, we believe that our tile sales are affected by the strength of the U.S. housing industry, and downturns in the U.S. housing industry could have a material adverse effect on our financial results, business, and prospects. The housing industry depends on a number of factors that are beyond our control, including interest rates, inflation, tax policy, trade policy, employment levels, consumer confidence, credit availability, real estate prices, home-price appreciation, existing home sales, demographic trends, weather conditions, natural disasters and general economic conditions. Any one or a combination of these factors could result in decreased demand for our products, reduce spending on homebuilding or remodeling of existing homes or cause purchases of new and existing homes to decline, which could adversely affect our business, financial condition, and operating results.
Our comparable store sales fluctuate due to a variety of economic, operating, industry and environmental factors and may not be a fair indicator of our overall performance.
Our comparable store sales have experienced fluctuations, which can be expected to continue. Numerous factors affect our comparable store sales results, including, among others, the timing of new and relocated store openings, the relative proportion of new
and relocated stores to mature stores, cannibalization resulting from the opening of new stores in existing markets, changes in advertising and other operating costs, the timing and level of markdowns, changes in our product mix, weather conditions, which may be exacerbated by the effects of climate change, retail trends, the retail sales environment, economic and geopolitical conditions, inflation, the impact of competition, and our ability to execute our business strategy. As a result, comparable store sales or operating results may fluctuate and may cause the price of our securities to fluctuate significantly. Therefore, we believe that period-to-period comparisons of our comparable store sales may not be a reliable indicator of our future overall operating performance.
If customers are unable to obtain third-party financing at satisfactory rates, sales of our products could be materially adversely affected.
Our business, financial condition, and results of operations have been, and may continue to be, affected by various economic factors. Reduced access to credit may adversely affect the ability of consumers to purchase our products. This potential reduction in access to credit may adversely impact our ability to offer customers credit card financing through third-party credit providers on terms similar to those offered currently, or at all. In addition, economic conditions, including decreases in access to credit, may result in financial difficulties, leading to restructuring, bankruptcies, liquidations and other unfavorable events for our customers, which may adversely impact our industry, business, and results of operations.
The burden of incurring debt under our existing credit facility could adversely affect us and make us more vulnerable to adverse economic or industry conditions.
We entered into a revolving credit facility with JPMorgan Chase Bank, N.A. on September 30, 2022. As of December 31, 2023, we had fully repaid the balance that was previously outstanding on our revolving line of credit and had $73.6 million available for future borrowings. The terms of our credit facility could have serious consequences for us, including limiting our ability to obtain additional financing to fund our working capital, capital expenditures, debt service requirements, expansion strategy, or other needs and increasing our vulnerability to, and reducing our flexibility in planning for, adverse changes in economic, industry, and competitive conditions. Our credit facility also contains negative covenants that limit our ability to engage in specified types of transactions, including, among other things, our ability to dispose of assets, engage in acquisitions or mergers, make distributions on or repurchases of capital stock, incur additional debt, incur liens or make investments. A breach of any of these covenants could result in an event of default under our credit facility, which would allow the lender to declare all amounts outstanding to be immediately due and payable and terminate all commitments to extend further credit or seek amendments to our debt agreements that would provide for terms more favorable to our lenders, which we may have to accept under the circumstances. If we are unable to repay any amounts due, our lenders under our credit facility could proceed against the collateral granted to it to secure that indebtedness. In addition, any future increase in the level of our indebtedness will likely increase our interest expense, which could negatively impact our profitability, and we are vulnerable to changes in variable interest rates. For instance, our interest expense increased during 2023 compared to 2022 due to an increase in both average borrowings outstanding and interest rates.
If we are unable to renew or replace current store leases, if we are unable to enter into leases for additional stores on favorable terms, or if one or more of our current leases is terminated prior to expiration of its stated term and we cannot find suitable alternate store locations, our growth and profitability could be negatively impacted.
We currently lease all of our store locations and certain distribution center locations. Many of our current leases provide us with the unilateral option to renew for several additional rental periods at specific rental rates. Our ability to renegotiate favorable terms on an expiring lease or to negotiate favorable terms for a suitable alternate location, and our ability to negotiate favorable lease terms for additional store locations, could depend on conditions in the real estate market, competition for desirable properties, our relationships with current and prospective landlords, or other factors that are not within our control. Any or all of these factors and conditions could negatively impact our growth and profitability.
Our results may be adversely affected by fluctuations in material and energy costs.
Our results have been, and may continue to be, affected by the prices of the materials used in the manufacture of tile, setting and maintenance materials, and related accessories that we sell; for instance, during 2022, cost increases relating to sourcing our products were greater than the price increases we implemented, resulting in a decrease in gross margin from 2021. In 2023, inflationary cost pressures that resulted in gross margin contraction started to taper due in part to a decrease in international freight rates and steps taken to identify alternative sources of supply. Costs associated with sourcing the products we sell may fluctuate based on a number of factors beyond our control, including: oil prices, changes in supply and demand, general economic conditions, supply chain disruptions, labor costs, including those resulting from labor shortages, competition, import duties, tariffs, currency exchange rates, inflation, geopolitical conditions such as the Russia-Ukraine and Israel-Hamas conflicts and any related sanctions imposed by the U.S. and other countries, and government regulation. For instance, many of our vendors have implemented price increases in response to inflationary cost pressures, which, combined with escalated international shipping rates, have resulted in an increase in the cost of our inventory and corresponding pressure on our gross margin rates. While we seek to manage price and availability risks related to supplies through procurement strategies, these efforts may not be successful, and we may continue to experience adverse impacts due
to rising prices of such products. In addition, energy costs have fluctuated dramatically in the past and may continue to do so in the future. These fluctuations may result in an increase in our transportation costs for distribution from the manufacturer to our distribution centers and from our regional distribution centers to our stores, utility costs for our distribution and manufacturing centers and stores, and overall costs to purchase products from our suppliers.
While we have adjusted, and plan to continue to adjust, our pricing as a result of the cost pressures described above, we may not be able to adjust the prices of our products, especially in the short-term, to recover any cost increases in materials and energy. A continual rise in material and energy costs could also adversely affect consumer spending and demand for our products and increase our operating costs, both of which could have a material adverse effect on our financial condition and results of operations.
Natural disasters, changes in climate, geopolitical and other catastrophic events could adversely affect our operating results.
The threat or occurrence of one or more natural disasters or other extreme weather events, the nature, frequency and severity of which may be negatively impacted by climate change, and the threat or outbreak of terrorism such as attacks on cargo ships in the Suez Canal, civil unrest, banking instability, political instability, such as rising tensions between China and Taiwan, the Russia-Ukraine conflict, the Israel-Hamas war, a public health crisis, or other hostilities, conflicts or similar adverse events could materially adversely affect our financial performance. Such events have in the past, and may in the future, disrupt supply chains, resulting in increased costs and shipping delays, increase costs of energy and raw materials, and result in damage to, or destruction or closure of, our stores, distribution centers and other properties or those of our suppliers, customers and other business partners, as well as injuries or loss of life. For example, drought conditions have lowered the water levels of the Panama Canal, negatively impacting traffic and leading to shipping delays and additional costs. Such events can also adversely affect our work force and prevent employees and customers from reaching our stores and other properties, can modify consumer purchasing patterns and decrease disposable income, and can disrupt or disable portions of our supply chain and distribution network. Although preventative measures may help to mitigate damage, we cannot provide any assurance that any measures we may take will be successful, and delays in recovery may be significant. In addition, the insurance we maintain may not be adequate to cover our losses resulting from any business interruption, including those resulting from a natural disaster or other severe weather event, and recurring extreme weather events or other adverse events could reduce the availability or increase the cost of insurance.
We are a holding company with no business operations of our own and depend on cash flow from The Tile Shop to meet our obligations.
We are a holding company with no business operations of our own or material assets other than the equity of our subsidiaries. All of our operations are conducted by our subsidiaries, including The Tile Shop. As a holding company, we will require dividends and other payments from our subsidiaries to meet cash requirements. The terms of any future credit facility may restrict our subsidiaries from paying dividends and otherwise transferring cash or other assets to us, although our current facility does not restrict this action. If there is an insolvency, liquidation, or other reorganization of any of our subsidiaries, our stockholders likely will have no right to proceed against their assets. Creditors of those subsidiaries will be entitled to payment in full from the sale or other disposal of the assets of those subsidiaries before we, as an equity holder, would be entitled to receive any distribution from that sale or disposal. If The Tile Shop is unable to pay dividends or make other payments to us when needed, we will be unable to satisfy our obligations.
Our failure or inability to protect our intellectual property rights could diminish the value of our brand and weaken our competitive position.
We attempt to protect our intellectual property rights through a combination of copyright, patent, trademark, trade secret, trade dress and unfair competition laws, as well as confidentiality procedures, and assignment and licensing arrangements. Our failure to obtain or maintain adequate protection of our intellectual property rights for any reason could have a material adverse effect on our business, results of operations and financial condition, and might prevent our brands from achieving or maintaining market acceptance. Further, we cannot assure you that competitors or other third parties will not infringe upon our intellectual property rights, or that we will have adequate resources to enforce our intellectual property rights.
The effects of climate change may adversely impact our business.
Rising global average temperatures due to increased concentrations of carbon dioxide and other greenhouse gases in the atmosphere are causing significant changes in weather patterns around the globe and an increase in the frequency and severity of natural disasters. Changes in weather patterns and the increased frequency, intensity and duration of extreme weather events (such as floods, droughts, wildfires and severe storms) could, among other things, adversely impact the ability to extract natural stones from quarries, which is a key resource for a number of our products, disrupt the operation of our supply chain and the productivity of manufacturers on which we rely, disrupt retail operations and foot traffic in consumer markets, damage or destroy our stores, and increase our product costs. In addition, the impacts of climate change on global water resources may result in water scarcity, which could in the future impact our ability, and the ability of our suppliers, particularly those involved in quarrying activities, to access sufficient quantities of water in
certain locations and result in increased costs, as well as potentially causing supply chain delays, such as the drought causing low water levels in the Panama Canal.
Further, the long-term impacts of climate change, including transition risks such as regulatory and technology changes, are expected to be widespread and unpredictable. For example, while a number of governmental bodies have introduced or are contemplating legislative or regulatory changes in response to climate change, including regulating greenhouse gas emissions, there continues to be a lack of consistent climate legislation, which creates economic and regulatory uncertainty. There is also an increasing number of state-level anti-ESG (as defined below) initiatives in the United States that may conflict with other regulatory requirements. Any changes could, among other things, affect the availability and cost of our products. We also use fuel and electricity in our operations, which could face increased regulation and cost increases as a result of climate change and other environmental concerns. These changes and their impacts could disrupt and adversely affect our operations and could have an adverse effect on our financial performance.
The increasing focus by stakeholders on environmental, social and governance (“ESG”) policies and practices could result in additional costs, and could adversely impact our reputation, consumer perception, employee retention, and willingness of third parties to do business with us.
There has been increased focus from our stakeholders, including investors, consumers and employees, on our ESG policies and practices, including corporate citizenship and sustainability. Additionally, public interest and legislative pressure related to public companies’ ESG practices continues to grow. If our ESG policies and practices fail to meet regulatory requirements or stakeholders’ evolving expectations and standards for responsible corporate citizenship in areas including environmental stewardship, support for local communities, Board and employee diversity, human capital management, employee health and safety practices, corporate governance and transparency and employing ESG strategies in our operations, our brand, reputation and employee retention may be negatively impacted, and customers and suppliers may be unwilling to do business with us.
We could also incur additional costs and require additional resources to monitor, report and comply with various ESG practices, as well as any initiatives or goals we may establish or announce, including those related to climate change. If we do establish such initiatives or goals, there can be no assurance that our stakeholders will agree with our strategy or that we will be successful in achieving such initiatives or goals, and we will remain subject to climate change risks regardless. Moreover, we may determine that it is in the best interest of our Company and our stockholders to prioritize other business, social, governance or sustainability investments over the achievement of any such initiatives or goals based on economic, regulatory and social factors, business strategy or pressure from investors, activist groups or other stakeholders. As a result, the effects of climate change and increased focus by stakeholders on ESG matters could have short- and long-term impacts on our business and operations. Inconsistency of legislation and regulations among jurisdictions, including anti-ESG policies or legislation, and expected additional regulations may also affect the costs of compliance with such laws and regulations. Any assessment of the potential impact of future climate change legislation, regulations or industry standards, as well as any international treaties and accords, is uncertain given the wide scope of potential regulatory change where we operate.
If we fail to adopt ESG standards or practices as quickly as stakeholders desire, fail, or are perceived to fail, in our achievement of any initiatives or goals, or fail in fully and accurately reporting our progress on any such initiatives and goals, our reputation, business, financial performance and growth may be adversely impacted. Any such matters, or related corporate citizenship and sustainability matters, could have a material adverse effect on our business.
Risks Related to Our Labor and Supply Chain
If we fail to identify and maintain relationships with a sufficient number of suppliers, our ability to obtain products that meet our high quality standards at attractive prices could be adversely affected.
We purchase flooring and other products directly from suppliers located around the world. However, we do not have long-term contractual supply agreements with our suppliers that obligate them to supply us with products exclusively or at specified quantities or prices. As a result, our current suppliers may decide to sell products to our competitors and may not continue selling products to us. In order to retain the competitive advantage that we believe results from these relationships, we need to continue to identify, develop and maintain relationships with qualified suppliers that can satisfy our high standards for quality and our requirements for flooring and other products in a timely and efficient manner at attractive prices. The need to develop new relationships will be particularly important as we seek to expand our operations and enhance our product offerings in the future. The loss of one or more of our existing suppliers or our inability to develop relationships with new suppliers could reduce our competitiveness, slow our plans for further expansion, and cause our net sales and operating results to be adversely affected. In addition, any failure to manage our inventory effectively could have a material and adverse effect on our business, financial condition and results of operations. Our sales could be adversely affected when we experience shortages of key items; further, any inability to meet our customers’ product needs could also adversely affect sales of other related products.
We source the products that we stock and sell from approximately 190 domestic and international suppliers. We source a large number of those products from foreign manufacturers, including 51% of our products from a group of ten suppliers located in Asia, Europe and the United States. Our largest supplier accounted for approximately 14% of our total purchases in 2023. We generally take title to these products sourced from foreign suppliers overseas and are responsible for arranging shipment to our distribution centers.
During 2023, many of our vendors increased their prices in response to inflationary cost pressures, which, combined with escalated international shipping rates, resulted in an increase in the cost of our inventory and corresponding pressure on our gross margin rates. Geopolitical conditions, such as the current Russia-Ukraine and Israel-Hamas conflicts, may lead to additional price increases, shipping delays and affect our ability to maintain adequate inventory levels to satisfy customer demand. For instance, following the war between Israel and Hamas, the Houthi movement launched a number of attacks on marine vessels traversing the Red Sea, which is an important maritime route for international trade. Major shipping companies have announced suspensions of operations following these attacks, which could result in disruptions in our supply chain. In addition, drought conditions have lowered the water levels of the Panama Canal, which could also result in shipping delays and additional costs. In response to this cost pressure, we have adjusted and may continue to adjust our pricing; however, we cannot provide any assurance that our attempts to mitigate the impact of price increases imposed by our vendors will be successful or that customers will continue to purchase our products at adjusted prices.
Other factors that may impact our suppliers, including financial instability among key suppliers, political instability, the impact of public health crises or other catastrophic events, trade restrictions, tariffs, currency exchange rates, inflation and transport capacity and costs, are beyond our control and could negatively impact our business if they seriously disrupt the movement of products through our supply chain or increase the costs of our products.
Our reliance on foreign suppliers increases our risk of not obtaining adequate, timely and cost-effective products and other risks involved in foreign operations, including foreign currency translation.
The risks associated with direct sourcing from overseas manufacturers may be higher than the risks associated with our traditional domestic suppliers. Foreign sourcing subjects us to a number of risks, including long lead times; work stoppages; shipping delays and interruptions; product quality issues; employee rights issues; other social concerns; public health crises; political instability; acts of terrorism or war, including the Russia-Ukraine and Israel-Hamas conflicts; economic disruptions; the imposition of tariffs, including those imposed by the United States on goods imported from China and Russia, duties, quotas, import and export controls and other trade restrictions, as well as the possibility of a global trade war; changes in governmental policies, including potential adverse changes in tax laws and regulations; uncertainty surrounding the enforcement of laws (if any) relating to the protection of intellectual property or data security; and other events. Additionally, reductions in the value of the U.S. dollar or revaluation of foreign currencies used, as well as volatile market conditions arising from economic conditions, including the impact of the Russia-Ukraine and Israel-Hamas conflicts, could ultimately increase the prices that we pay for our products. Any of these events could have a material adverse effect on us.
In addition, all of our products manufactured overseas and imported into the U.S. are subject to duties collected by the U.S. Customs and Border Protection. We may be subjected to additional duties, significant monetary penalties, the seizure and forfeiture of the products we are attempting to import or the loss of import privileges if we or our suppliers are found to be in violation of U.S. laws and regulations applicable to the importation of our products. If duties were to be significantly increased, it could have a material adverse impact on us.
Our ability to offer compelling products, particularly products made of unique stone, depends on the continued availability of sufficient suitable natural products.
Our business strategy depends on offering a wide assortment of compelling products to our customers. We sell, among other things, products made from various natural stones from quarries throughout the world. Our ability to obtain an adequate volume and quality of hard-to-find products depends on our suppliers’ ability to furnish those products, which, in turn, could be affected by many things, including the exhaustion of stone quarries or the impact of water scarcity, natural disasters or other extreme weather events, which may be exacerbated by climate change, on the ability to access or efficiently extract resources from such quarries. If our suppliers cannot deliver sufficient products, and we cannot find replacement suppliers, our net sales and operating results may be adversely affected.
Our success is highly dependent on our ability to provide timely delivery to our customers, and any disruption in our delivery capabilities or our related planning and control processes may adversely affect our operating results.
Our success is due in part to our ability to deliver products quickly to our customers, which requires successful planning and distribution infrastructure, including ordering, transportation and receipt processing, and the ability of suppliers to meet distribution requirements. Our ability to maintain this success depends on the continued identification and implementation of improvements to our planning processes, distribution infrastructure, and supply chain. We also need to ensure that our distribution infrastructure and supply chain keep pace with our anticipated growth and increased number of stores. The cost of these enhanced processes could be
significant, and any failure to maintain, grow, or improve them could adversely affect our operating results. Our business has been, and could continue to be, adversely affected as a result of delays in product shipments due to freight difficulties, strikes, or other difficulties at our suppliers’ principal transport providers, or otherwise, including as a result of ongoing supply chain disruptions and labor shortages.
We depend on a few key employees, and if we lose the services of these employees, we may not be able to run our business effectively.
Our future success depends in part on our ability to attract and retain key executive, merchandising, marketing, and sales personnel who share our values and are able to operate effectively and consistent with our culture. We have had changes in our senior management team over the past few years and have promoted or hired new employees to fill certain roles. Our inability to effectively integrate the newly-hired senior managers into our business processes, controls, systems and culture could have a material adverse effect on us. If any of our key employees cease to be employed by us, we would need to hire additional qualified personnel and could experience difficulties and delays in filling those roles. Our ability to successfully hire other experienced and qualified key employees cannot be assured and may be difficult because we face competition for these professionals from our competitors, our suppliers and other companies operating in our industry. As a result, the loss or unavailability of any of our key employees could have a material adverse effect on us. In addition, ineffective succession planning could result in unexpected costs, reduced productivity and/or difficulties with respect to internal processes and controls.
If we fail to hire, train, and retain qualified store managers, sales associates, and other employees, our enhanced customer service could be compromised and we could lose sales to our competitors.
A key element of our competitive strategy is to provide product expertise to our customers through our extensively trained, commissioned sales associates. We may be constrained in hiring and retaining sufficient qualified employees to support our strategy due to general labor shortages in our industry. In addition, a lack of qualified personnel or increased turnover rates within our employee base could lead to increased costs, such as increased overtime to meet demand and increased wage rates to attract and retain qualified employees. If we are unable to attract and retain qualified personnel and managers as needed in the future, including qualified sales personnel, our level of customer service may decline, which may decrease our revenues and profitability.
Our ability to control labor costs is limited, which may negatively affect our business.
Our ability to control labor costs is subject to numerous external factors, including prevailing wage rates, inflationary pressures, the impact of legislation or regulations governing healthcare benefits or labor relations, and health and other insurance costs. If our labor and/or benefit costs increase, we may not be able to hire or maintain qualified personnel to the extent necessary to execute our competitive strategy, which could adversely affect our results of operations.
Our insurance coverage and self-insurance reserves may not cover future claims.
We maintain various insurance policies for employee health and workers’ compensation. We are self-insured on certain health insurance plans and are responsible for losses up to a certain limit for these respective plans. We are also self-insured with regard to workers’ compensation coverage, in which case we are responsible for losses up to certain retention limits on both a per-claim and aggregate basis.
For policies under which we are responsible for losses, we record a liability that represents our estimated cost of claims incurred and unpaid as of the balance sheet date. Our estimated liability is not discounted and is based on a number of assumptions and factors, including historical trends and economic conditions, and is closely monitored and adjusted when warranted by changing circumstances. Fluctuating healthcare costs, our significant growth rate and changes from our past experience with workers’ compensation claims could affect the accuracy of estimates based on historical experience. Should a greater amount of claims occur compared to what was estimated or employee health insurance costs increase beyond what was expected, our accrued liabilities might not be sufficient, and we may be required to record additional expense. Unanticipated changes may produce materially different amounts of expense than that reported under these programs, which could adversely impact our operating results.
We also maintain third-party insurance coverage against various other liability risks and risks of property loss, including directors’ and officers’ liability insurance coverage. Potential liabilities associated with those risks or other events could exceed the coverage provided by such arrangements, resulting in significant uninsured liabilities, which could have a material and adverse effect on our business, financial condition and results of operations. In addition, claims brought against us have resulted in, and additional claims could further result in, increased directors’ and officers’ insurance premiums and a reduction in coverage, which could negatively affect us, including by increasing our insurance costs and impacting our ability to attract and retain qualified officers and directors.
Legal and Regulatory Risks
Compliance with laws or changes in existing or new laws and regulations or regulatory enforcement priorities could adversely affect our business.
We must comply with various laws and regulations at the local, regional, state, federal, and international levels. These laws and regulations change frequently, and such changes can impose significant costs and other burdens of compliance on our business and suppliers. Any changes in regulations, the imposition of additional regulations, or the enactment of any new legislation that affects employment/labor, trade, product safety, transportation/logistics, energy costs, health care, tax, environmental issues, including the impact of climate change, or compliance with the Foreign Corrupt Practices Act could have an adverse impact on our financial condition and results of operations. In addition, changes in enforcement priorities by governmental agencies charged with enforcing existing laws and regulations could increase our cost of doing business. The evolving and at times overlapping regulatory regimes to which the Company is subject may change at any time, including as a result of changes in the U.S. political environment. In addition, a number of legal and regulatory measures and social initiatives have been introduced in an effort to reduce greenhouse gas and other carbon emissions. Any such initiatives, restrictions and requirements could restrict, or require us to make changes to, our operating activities, which could increase our operating costs, require us to make capital improvements to our properties, increase our energy, supply and transportation costs or limit their availability, or otherwise adversely affect our results of operations, liquidity or capital resources, and these effects could be material to us.
We may also be subject to audits by various taxing authorities. Changes in tax laws in any of the multiple jurisdictions in which we operate, or adverse outcomes from tax audits that we may be subject to in any of the jurisdictions in which we operate, could result in an unfavorable change in our effective tax rate, which could have an adverse effect on our business and results of operations.
Any failure to maintain effective internal control over financial reporting and disclosure controls and procedures could have a material adverse effect on our business.
We are required to maintain internal control over financial reporting and disclosure controls and procedures in order to provide reasonable assurance regarding the reliability of financial reporting and the preparation of our consolidated financial statements for external purposes in accordance with GAAP (as defined below). We, along with our independent registered public accounting firm, have identified material weaknesses in our internal control over financial reporting that pertain to our information technology general controls and our accounting for leases. A material weakness is a deficiency, or combination of deficiencies, in internal control over financial reporting such that there is a reasonable possibility that a material misstatement of our annual or interim financial statements will not be prevented or detected on a timely basis. The material weaknesses could adversely impact our ability to record, process and report financial information accurately, and to prepare financial statements within the time periods specified by the rules and forms of the SEC. While we continue to take meaningful steps to enhance our disclosure controls and procedures and our internal control over financial reporting by strengthening our financial reporting and accounting functions, we cannot provide any assurance that we will be able to maintain adequate controls over our financial processes and reporting in the future or that we will not identify additional significant deficiencies and material weaknesses in our internal control over financial reporting in the future. Any failure of our internal controls could result in material misstatements in our consolidated financial statements, significant deficiencies, material weaknesses, costs, failure to timely meet our periodic reporting obligations and erosion of investor confidence. Such failure could also negatively affect the market price and trading liquidity of our common stock, subject us to civil and criminal investigations and penalties and could have a material adverse effect on our business, financial condition, results of operations or cash flow.
If our suppliers do not use ethical business practices or comply with applicable laws and regulations, our reputation could be harmed due to negative publicity and we could be subject to legal risk.
We do not control the operations of our suppliers. Accordingly, we cannot guarantee that our suppliers will comply with applicable environmental, labor, anti-corruption and other laws and regulations or operate in a legal, ethical, and responsible manner. Violation of environmental, labor, anti-corruption or other laws by our suppliers or their failure to operate in a legal, ethical, or responsible manner could reduce demand for our products if, as a result of such violation or failure, we attract negative publicity. Further, such conduct could expose us to legal risks as a result of the purchase of products from non-compliant suppliers.
Taxing authorities may successfully assert that we should have collected or in the future should collect sales and use, value added or similar transactional taxes, and we could be subject to liability with respect to past or future sales, which could adversely affect our results of operations.
The application of sales tax and other indirect taxes on cross border sales by remote sellers is continuing to change and evolve. In June 2018, the U.S. Supreme Court decided, in South Dakota v. Wayfair, Inc., that state and local jurisdictions may, at least in certain circumstances, enforce a sales and use tax collection obligation on remote vendors that have no physical presence in such jurisdiction. All states have now enacted legislation to require sales and use tax collection by remote vendors and by online marketplaces. The details and effective dates of these collection requirements vary from state to state. While we now collect, remit, and report sales tax in
all states that impose a sales tax, it is possible that one or more jurisdictions may assert that we have liability for previous periods for which certain of our businesses did not collect sales, use or other similar taxes, and if such an assertion or assertions were successful, it could result in tax liabilities, including for past sales taxes and penalties and interest, which could materially adversely affect our business, financial condition and operating results.
We may become involved in legal proceedings and, while we cannot predict the outcomes of such proceedings and other contingencies with certainty, some of these outcomes could adversely affect our business, financial condition and results of operations.
We have in the past, and may in the future, become involved in stockholder, consumer, employment, tort or other litigation. We cannot predict with certainty the outcomes of these legal proceedings. The outcome of some of these legal proceedings could require us to take, or refrain from taking, actions which could negatively affect our operations or could require us to pay substantial amounts of money, adversely affecting our financial condition and results of operations. Additionally, defending against lawsuits and proceedings may involve significant expense and diversion of management’s attention and resources.
Technology-Related Risks
Our business operations could be disrupted if we are unable to protect the integrity and security of our customer and other personal and/or confidential information.
Like all businesses, we face cybersecurity threats, as we are reliant upon information systems and the Internet to conduct our business activities. For example, in connection with payment card sales and other transactions, including bank cards, debit cards, credit cards and other merchant cards, we process and transmit confidential banking and payment card information. Additionally, as part of our normal business activities, we collect and store sensitive personal information related to our employees, customers, suppliers and other parties. Despite our security measures, our information technology and infrastructure, and that of third parties upon which we rely, may be vulnerable to criminal cyber-attacks or security incidents due to employee or service provider error, third-party action, including actions of foreign actors, which risk may be exacerbated by the current Russia-Ukraine and Israel-Hamas conflicts and U.S. and international response, insider attacks, phishing or denial-of-service attacks, ransomware or other malware, social engineering, malfeasance, other unauthorized physical or electronic access, or other vulnerabilities. Any such incidents could compromise our networks, or those of our vendors, or disrupt our or our vendors’ critical systems, and the information stored there, such as personally identifiable information or funds, could be accessed, publicly disclosed, lost, corrupted or stolen. Third parties may have the technology and know-how to breach the security of this information, and our security measures and those of our banks, merchant card processing and other technology suppliers may not effectively prohibit others from obtaining improper access to this information. The techniques used by criminals to obtain unauthorized access to sensitive data continue to evolve and become more sophisticated and often are not recognized until launched against a target; accordingly, we may be unable to anticipate these techniques or implement adequate preventative measures, and future cyber-attacks could go undetected and persist for an extended period of time. Furthermore, to the extent artificial intelligence capabilities improve and are increasingly adopted, they may be used to identify vulnerabilities and craft increasingly sophisticated cybersecurity attacks, and vulnerabilities may be introduced from the use of artificial intelligence by us, our financial services providers and other vendors and third-party providers.
Our vendors and others to whom we entrust confidential data, and on whom we rely to provide products and services, face similar threats and growing requirements. We depend on such parties to implement adequate controls and safeguards to protect against and report cyber incidents. If such parties fail to deter, detect or report cyber incidents in a timely manner, we may suffer from financial and other harm, including to our information, operations, performance, employees and reputation.
We also incur costs in order to comply with cybersecurity or data privacy regulations or with requirements imposed by business partners. Data privacy and cybersecurity laws in the United States and internationally are constantly changing, and the implementation of these laws has become more complex. In order to comply with current or newly enacted laws, we may be subject to increased costs as a result of continually evaluating our policies and processes and adapting to new requirements that are or become applicable to us. For instance, many states have enacted laws requiring companies to notify individuals of data security breaches involving their personal data. These mandatory disclosures regarding a security breach often lead to widespread negative publicity, which may cause our customers to lose confidence in the effectiveness of our data security measures. Any security breach, whether successful or not, would harm our reputation and could damage our competitive position and cause the loss of customers. In addition, any such breach, or any material failure on our part to comply with applicable laws, could subject us to litigation, government investigation or enforcement actions or other regulatory sanctions, regulatory penalties or fines, or costly response measures. Any such occurrence could have a material adverse effect on us. While we carry cyber insurance, we cannot be certain that our coverage will be adequate for liabilities actually incurred, that insurance will continue to be available to us on economically reasonable terms, or at all, or that any insurer will not deny coverage as to any future claim.
If our management information systems experience disruptions, it could disrupt our business and reduce our net sales.
We depend on our management information systems to integrate the activities of our stores, to process orders, to manage inventory, to purchase merchandise and to sell and ship goods on a timely basis. We may experience operational problems with our information systems, as well as loss of funds, intellectual property or other proprietary information, as a result of system failures, viruses, computer “hackers” or other causes. We may incur significant expenses in order to repair any such operational problems and could suffer reputational damage. Any significant disruption or slowdown of our systems could cause information, including data related to customer orders, to be lost or delayed, which could result in delays in the delivery of products to our stores and customers or lost sales. Accordingly, if our network is disrupted, we may experience delayed communications within our operations and between our customers and ourselves. Any such occurrence could have a material adverse effect on us.
The selection and implementation of information technology initiatives may impact our operational efficiency and productivity.
In order to better manage our business, we have invested in, and expect to continue to invest in, our information systems. In doing so, we must select the correct investments and implement them in an efficient manner. The costs, potential problems and interruptions associated with implementing technology initiatives could disrupt or reduce the efficiency of our operations. For instance, we may experience occasional system interruptions and delays, as a result of routine maintenance, periodic updates, implementation of new technology or other factors, that make our information systems unavailable or slow to respond, including the interaction of our information systems with those of third parties. Furthermore, these initiatives might not provide the anticipated benefits or provide them in a delayed or unexpectedly costly manner. Accordingly, issues relating to our selection and implementation of information technology initiatives may negatively impact our business and operating results.
Risks Related to Ownership of Our Common Stock
We may be unable to maintain our listing on The Nasdaq Stock Market LLC (“Nasdaq”) and may incur additional costs as a result of our Nasdaq listing.
Our common stock currently trades on Nasdaq. We cannot provide any assurance that we will be able to continue to satisfy Nasdaq’s continued listing requirements and standards to which we are subject. A delisting of our common stock could negatively affect the price and liquidity of our common stock and could impair our ability to raise capital in the future. In addition, we incur costs as a result of compliance with Nasdaq’s rules and requirements, which could adversely affect our results of operations.
The market price of our securities may decline and/or be volatile.
The market price of our common stock has fluctuated significantly in the past and may continue to fluctuate in the future. Future fluctuations could be based on various factors in addition to those otherwise described in this report, including:
our operating performance and the performance of our competitors;
the public’s reaction to our filings with the SEC, our press releases and other public announcements;
the degree of trading liquidity in our common stock, including our ability to remain listed on Nasdaq;
changes in recommendations or earnings estimates by research analysts who follow us or other companies in our industry;
variations in general economic conditions, including the impact of inflation, geopolitical conditions and the possibility of an economic recession;
actions of our current stockholders, including purchases or sales of common stock by our directors and executive officers;
the arrival or departure of key personnel; and
other developments affecting us, our industry or our competitors.
In addition, the stock market may experience significant price and volume fluctuations. These fluctuations may be unrelated to the operating performance of particular companies but may cause declines in the market price of our common stock. The price of our common stock could fluctuate based upon factors that have little or nothing to do with our Company or its performance.
We currently do not pay quarterly dividends or have a stock repurchase program; as such, appreciation in the price of our common stock may be the only method to realize a return on your investment.
We have, from time to time, paid special dividends and engaged in stock repurchases. Any future determination with respect to the payment of dividends or stock repurchases is at the discretion of our Board and is dependent upon our financial condition, results of operations, capital requirements, general business conditions, tax treatment of dividends and issuer stock repurchases in the United States, potential future contractual restrictions contained in credit agreements and other agreements and other factors deemed relevant by our Board of Directors. We can provide no assurance that we will pay any dividends to our stockholders in the future, or as to the
amount of any such dividends, or that we will engage in additional stock repurchases. Our election not to pay a quarterly dividend or repurchase stock may negatively impact our reputation, our stock price, and investor confidence in us.
Concentration of ownership may have the effect of delaying or preventing a change in control.
Our directors and executive officers, together with their affiliates, beneficially hold approximately 36% of our outstanding shares of common stock. As a result, these stockholders, if acting together, have the ability to influence the outcome of corporate actions requiring stockholder approval. This concentration of ownership may have the effect of delaying or preventing a change in control and might adversely affect the market price of our securities.
Anti-takeover provisions contained in our certificate of incorporation and bylaws and provisions of Delaware law could impair a takeover attempt.
Our certificate of incorporation and bylaws contain provisions that, alone or together, could have the effect of delaying or preventing hostile takeovers or changes in control or changes in our management without the consent of our Board of Directors. These provisions include, among other things, a classified Board of Directors; no cumulative voting in the election of directors; the exclusive right of our Board of Directors to fill a vacancy created by the expansion of the Board of Directors or the resignation, death, or removal of a director; the ability of our Board of Directors to issue shares of preferred stock, including determining the price, voting rights and other terms of such shares, without stockholder approval; requiring approval of certain transactions by the Independent Transaction Committee of the Board; a prohibition on stockholder action by written consent and providing that a special meeting of stockholders may be called only by the chairman of the Board of Directors, the Chief Executive Officer, or the Board of Directors; limiting the liability of, and providing indemnification to, our directors and officers; controlling the procedures for the conduct and scheduling of stockholder meetings; allowing the Board of Directors to postpone or reschedule special meetings of stockholders; providing that directors may be removed prior to the expiration of their terms by stockholders only for cause; and advance notice procedures for nominating director candidates or proposing matters to be acted upon at a stockholders’ meeting. In addition, we are subject to provisions of Delaware law that may impair takeover attempts, including Section 203 of the Delaware General Corporation Law, which generally provides that a corporation may not engage in any business combination with any interested stockholder during the three-year period following the time that such stockholder becomes an interested stockholder, unless certain approval requirements are met. Any provision of our certificate of incorporation or bylaws or Delaware law that has the effect of delaying or deterring a change in control could limit the opportunity for our stockholders to receive a premium for their shares of our common stock, and could also affect the price that some investors are willing to pay for our common stock.
Our certificate of incorporation provides that the Court of Chancery of the State of Delaware will be the exclusive forum for certain types of lawsuits, which could increase costs to bring a claim, discourage claims or limit the ability of our stockholders to bring a claim in a judicial forum viewed by the stockholders as more favorable for disputes with us or our directors, officers or other employees.
Our certificate of incorporation provides that the Court of Chancery of the State of Delaware will be the sole and exclusive forum for (i) any derivative action or proceeding brought on our behalf, (ii) any action asserting a claim of breach of a fiduciary duty owed by any of our directors, officers, or other employees to us or our stockholders, (iii) any action asserting a claim against us arising pursuant to any provision of the Delaware General Corporation Law, our certificate of incorporation or our bylaws, or (iv) any action asserting a claim governed by the internal affairs doctrine. The choice of forum provision may increase costs to bring a claim, discourage claims or limit a stockholder’s ability to bring a claim in a judicial forum that it finds favorable for disputes with us or our directors, officers or other employees, which may discourage such lawsuits against us or our directors, officers and other employees. Alternatively, if a court were to find this choice of forum provision to be inapplicable or unenforceable in an action, we may incur additional costs associated with resolving such action in other jurisdictions. The exclusive forum provision in our certificate of incorporation will not preclude or contract the scope of exclusive federal or concurrent jurisdiction for actions brought under the federal securities laws including the Exchange Act or the Securities Act of 1933, as amended, or the respective rules and regulations promulgated thereunder.
ITEM 1B. UNRESOLVED STAFF COMMENTS
None.
ITEM 1C. CYBERSECURITY
Like all businesses, the Company faces cybersecurity threats, as the Company is reliant upon information systems and the Internet to conduct its business activities. For example, in connection with payment card sales and other transactions, including bank cards, debit cards, credit cards and other merchant cards, the Company processes and transmits confidential banking and payment card information. Additionally, as part of its normal business activities, the Company collects and stores sensitive personal information related to the Company’s employees, customers, suppliers and other parties. Businesses, including those in our industry, and third parties on which we rely are frequently confronted with a broad range of cybersecurity threats, from uncoordinated, individual
attempts to gain unauthorized access to an organization’s information technology (“IT”) environment to sophisticated and targeted cyberattacks sponsored by foreign governments and criminal enterprises.
Although the Company employs measures to prevent, detect, address, and mitigate these threats, a cybersecurity incident could potentially result in the misappropriation, destruction, corruption, or unavailability of critical data, personally identifiable information, and other confidential or proprietary data (our own or that of third parties) and the disruption of business operations. Any such incidents could compromise the Company’s networks, or those of our vendors, or disrupt the Company’s or our vendors’ critical systems, and the information stored there, such as personally identifiable information or funds, could be accessed, publicly disclosed, lost, corrupted or stolen. Third parties may have the technology and know-how to breach the security of this information, and the Company’s security measures and those of the Company’s banks, merchant card processing and other technology suppliers may not effectively prohibit others from obtaining improper access to this information. The techniques used by criminals to obtain unauthorized access to sensitive data change frequently and often are not recognized until launched against a target; accordingly, the Company may be unable to anticipate these techniques or implement adequate preventative measures.
The potential consequences of a material cybersecurity incident include remediation and restoration costs, reputational damage, and litigation with third parties, which in turn could adversely affect our competitiveness and results of operations. Accordingly, cybersecurity is an important part of the Company’s enterprise risk management program, and the Company seeks to address cybersecurity risks through a comprehensive, cross-functional approach.
The Company’s cybersecurity policies, standards, processes, and practices for assessing, identifying, and managing material risks from cybersecurity threats and responding to cybersecurity incidents are integrated into the Company’s risk management program and are based on recognized frameworks established by the National Institute of Standards and Technology and other applicable industry standards. The Company has established controls and procedures, including an Incident Response Plan, that provide for the identification, analysis, notification, escalation, communication, and remediation of data security incidents at appropriate levels so that decisions regarding the public disclosure and reporting of such incidents can be made by management in a timely manner. The Company has also established a process to validate the aforementioned controls are in place and the results are being reviewed as a part of the overall company risk assessment. The Company’s Incident Response Plan (i) is designed to identify and detect information security threats through various mechanisms, such as through security controls and third-party disclosures, and (ii) sets forth a process to (a) analyze any such threats detected within the Company’s IT environment or within a third-party’s IT environment, (b) contain cybersecurity threats under various circumstances, and (c) better ensure the Company can recover from cybersecurity incidents to a normal state of business operations. The Company has established and maintains other incident response and recovery plans that address the Company’s response to a cybersecurity incident.
The Company has cybersecurity insurance (subject to specified retentions or deductibles) related to a cybersecurity incident that addresses costs, losses, and expenses related to cybersecurity investigations, crisis management, notification processes and credit monitoring services, public relations, and legal advice. However, damages, fines and claims arising from such incidents may not be covered or may exceed the amount of any insurance available or may not be insurable.
As part of its cybersecurity program, the Company deploys measures to deter, prevent, detect, respond to and mitigate cybersecurity threats, including firewalls, anti-malware, extended detection and response systems, identity and access controls, strong password controls, multi-factor authentication, software patching protocols, and physical security measures. The Company periodically assesses and tests the Company’s policies, standards, processes, and practices that are designed to address cybersecurity threats and incidents, including by assessing current threat intelligence, conducting tabletop exercises, vulnerability scanning, and performing external penetration testing. The Company has a process to report material results of such testing and assessments to the Board, and periodically adjusts the Company’s cybersecurity program based on these exercises. The Company engages third parties to oversee and conduct part of such testing, as well as perform external audits of security protocols and capabilities. The Company seeks to identify and oversee cybersecurity risks presented by third parties and their systems from a risk-based perspective by identifying critical vendors (defined based on capabilities provided and investments required) and reviewing software patching, upgrades and associated changes required to reduce risk. The Company also conducts cybersecurity training for employees, including mandatory training programs for system users. The Company’s training programs require employees to complete a knowledge check prior to completion of the program. Completion of the Company’s training programs is monitored by management.
Many of the Company’s IT systems operate with a hosted architecture or by third-party service providers, and if these third-party IT environments fail to operate properly, our systems could stop functioning for a period of time, which could put our users at risk. Accordingly, we are dependent on the operations of IT service providers. Our vendor management process, which includes due diligence steps prior to selecting third party service providers, is an important part of our risk mitigation strategy. In particular, we require ISO and other security compliance for all critical vendors by contract. Additionally, the Company monitors risks from cybersecurity threats associated with the user of third-party service providers and will audit critical vendors for compliance, as appropriate. Notwithstanding, if there is a catastrophic event, such as a natural disaster or other adverse weather condition, terrorist attack, security breach, or other extraordinary event, the Company, and our service providers, may be unable to operate business as usual, or at all, for the duration of the event and/or a time thereafter.
Considering the pervasive and increasing threat from cyberattacks, the Board and the Audit Committee, with input from management, assess the Company’s cybersecurity threats and the measures implemented by the Company in an effort to mitigate and prevent cyberattacks. The Audit Committee consults with management regarding ongoing cybersecurity initiatives and requests management report to the Audit Committee or the full Board regularly on their assessment of the Company’s cybersecurity program and risks. Both the Audit Committee and the full Board receive quarterly reports from the Chief Information Officer on cybersecurity risks and timely reports regarding any cybersecurity incident that meets established reporting thresholds, as well as ongoing updates regarding any such incident until it has been addressed. Our Board has risk management experience, including members with experience in overseeing teams responsible for data security and cybersecurity and assessing technology-related risks and development of risk mitigation strategies.
In addition, the Company’s information security/cybersecurity program is managed by the Director of Infrastructure and Security, who is responsible for leading enterprise-wide cybersecurity strategy, policy, standards, architecture, and processes. The Director of Infrastructure and Security and Chief Information Officer provide periodic reports to our Board and Audit Committee as well as our Chief Executive Officer and other members of our senior management as appropriate. We have also established cross-functional teams to collaborate and communicate on cybersecurity-related issues. The reports to management include updates on the Company’s cyber risks and threats, the status of projects to strengthen our information security systems, assessments of the information security program, and the emerging threat landscape. The Incident Response Team, which includes the Chief Information Officer, Director of Infrastructure and Security, Chief Finance Officer and key operational leaders, is regularly engaged to discuss cybersecurity risks and to review the Company’s preparations for any security events. The Incident Response Team will notify the Board of Directors of any critical events as defined in the Incident Response Plan. Additionally, the Chief Information Officer regularly engages the Board representative with cybersecurity experience to identify Board-level needs for education and communication.
The Chief Information Officer holds an undergraduate degree in computer science and has served in various roles in information technology for over 30 years, including serving as a senior technology leader or Chief Information Officer of two public companies and two private equity-owned firms. The Chief Information Officer and Chief Financial Officer have prior experience supporting organizations that have experienced cybersecurity events and continue to learn more about the current trends and risks by partnering with third parties.
While the Company faces a number of cybersecurity risks in connection with its business, as of the date of this report, the Company is not aware of any risks from cybersecurity threats that have materially affected or are reasonably likely to materially affect the Company, including its business strategy, results of operations, or financial condition.
ITEM 2. PROPERTIES
As of December 31, 2023, we operated 142 stores located in 31 states and the District of Columbia with an average square footage of approximately 20,000 square feet. The table below sets forth the store locations (alphabetically by state) of our 142 stores in operation as of December 31, 2023.
|
|
|
|
|
|
|
|
|
|
|
|
|
|
|
|
|
|
|
|
|
|
State | Stores |
| State | Stores |
| State | Stores |
| State | Stores |
Arizona | 4 |
| Illinois | 12 |
| Minnesota | 7 |
| Oklahoma | 2 |
Arkansas | 1 |
| Indiana | 4 |
| Missouri | 4 |
| Pennsylvania | 5 |
Colorado | 5 |
| Iowa | 1 |
| Nebraska | 1 |
| Rhode Island | 1 |
Connecticut | 3 |
| Kansas | 1 |
| New Jersey | 7 |
| South Carolina | 2 |
Delaware | 1 |
| Kentucky | 3 |
| New Mexico | 1 |
| Tennessee | 4 |
District of Columbia | 1 |
| Maryland | 5 |
| New York | 7 |
| Texas | 17 |
Florida | 5 |
| Massachusetts | 4 |
| North Carolina | 5 |
| Virginia | 7 |
Georgia | 4 |
| Michigan | 7 |
| Ohio | 8 |
| Wisconsin | 3 |
|
|
|
|
|
|
|
|
| Total | 142 |
We lease all of our stores. Our approximately 15,000 square foot headquarters in Plymouth, Minnesota is attached to our store. We own four regional facilities used for distribution of purchased product and manufacturing of setting and maintenance materials, located in Spring Valley, Wisconsin; Ottawa Lake, Michigan; Ridgeway, Virginia; and Durant, Oklahoma, which consist of 69,000, 271,000, 134,000, and 260,000 square feet, respectively. We also lease a distribution facility in Dayton, New Jersey that is 163,000 square feet.
We believe that our material property holdings are suitable for our current operations and purposes.
ITEM 3. LEGAL PROCEEDINGS
We are, from time to time, party to lawsuits, threatened lawsuits, disputes and other claims arising in the normal course of business. We assess our liabilities and contingencies in connection with outstanding legal proceedings utilizing the latest information available. Where it is probable that we will incur a loss and the amount of the loss can be reasonably estimated, we record a liability in our
consolidated financial statements. These legal accruals may be increased or decreased to reflect any relevant developments on a quarterly basis. Where a loss is not probable or the amount of the loss is not estimable, we do not record an accrual, consistent with applicable accounting guidance. In the opinion of management, while the outcome of such claims and disputes cannot be predicted with certainty, our ultimate liability in connection with these matters is not expected to have a material adverse effect on our results of operations, financial position or cash flows, and the amounts accrued for any individual matter are not material. However, legal proceedings are inherently uncertain. As a result, the outcome of a particular matter or a combination of matters may be material to our results of operations for a particular period, depending upon the size of the loss or our income for that particular period.
ITEM 4. MINE SAFETY DISCLOSURES
None.
PART II
ITEM 5. MARKET FOR THE REGISTRANT'S COMMON EQUITY, RELATED STOCKHOLDER MATTERS AND ISSUER PURCHASES OF EQUITY SECURITIES
Our common stock is traded on Nasdaq under the symbol “TTSH.”
As of February 26, 2024, we had approximately 246 holders of record of our common stock. This figure does not include the number of persons whose securities are held in nominee or “street” name accounts through brokers.
As of February 26, 2024, we had 44,510,779 shares of common stock outstanding. The last reported sales price for our common stock on February 26, 2024 was $6.80.
Dividends
Any future determination with respect to the payment of dividends is at the discretion of our Board of Directors and is dependent upon our financial condition, results of operations, capital requirements, general business conditions, tax treatment of dividends in the United States, contractual restrictions contained in our credit agreement and other factors deemed relevant by our Board of Directors. We can provide no assurance that we will pay any dividends to our stockholders in the future, or as to the amount of any such dividends.
Recent Sales of Unregistered Securities
None.
Securities Authorized for Issuance Under Equity Compensation Plans
For information on our equity compensation plans, refer to Part III, Item 12. “Security Ownership of Certain Beneficial Owners and Management and Related Stockholder Matters.”
Issuer Purchases of Equity Securities
|
|
|
|
|
|
|
|
|
|
|
|
|
|
|
|
|
|
|
|
|
| Total Number of Shares Purchased |
| Average Price Paid per Share |
| Total Number of Shares Purchased as Part of Publicly Announced Plans or Programs |
| Maximum Number of Shares that May Yet be Purchased Under the Plans or Programs | |
October 1, 2023 - October 31, 2023 |
| 48,263 | (1) | $ | 0.74 | (1) | - |
| - |
November 1, 2023 - November 30, 2023 |
| - |
|
| - |
| - |
| - |
December 1, 2023 - December 31, 2023 |
| 712 | (2) |
| 6.83 | (2) | - |
| - |
|
| 48,975 |
| $ | 0.83 |
| - |
| - |
(1)We withheld a total of 6,954 shares to satisfy tax withholding obligations due upon the vesting of restricted stock grants, as allowed by the 2012 Omnibus Award Plan (the “2012 Plan”). We did not pay cash to repurchase these shares, nor were these repurchases part of a publicly announced plan or program. We repurchased an additional 41,309 shares pursuant to the terms of the underlying restricted stock agreements, as allowed by the 2012 Plan and the 2021 Omnibus Equity Compensation Plan (the “2021 Plan”). We paid $0.0001 per share, the par value, to repurchase these shares. These repurchases were not part of a publicly announced plan or program.
(2)We withheld 712 shares to satisfy tax withholding obligations due upon the vesting of restricted stock grants, as allowed by the 2021 Plan. We did not pay cash to repurchase these shares, nor were these repurchases part of a publicly announced plan or program.
Stock Performance Graph
The graph and table below present our cumulative total stockholder returns relative to the performance of the S&P SmallCap 600 and the Dow Jones U.S. Furnishings Index for the period commencing December 31, 2018 and ending December 31, 2023, the last trading day of fiscal year 2023. The comparison assumes $100 invested at the close of trading on December 31, 2018 in (i) our common stock, (ii) the stocks comprising the S&P SmallCap 600, and (iii) the stocks comprising the Dow Jones U.S. Furnishings Index. All values assume that all dividends were reinvested on the date paid. The points on the graph represent fiscal year-end amounts based on the last trading day in each fiscal year. The stock price performance included in the line graph below is not necessarily indicative of future stock price performance.
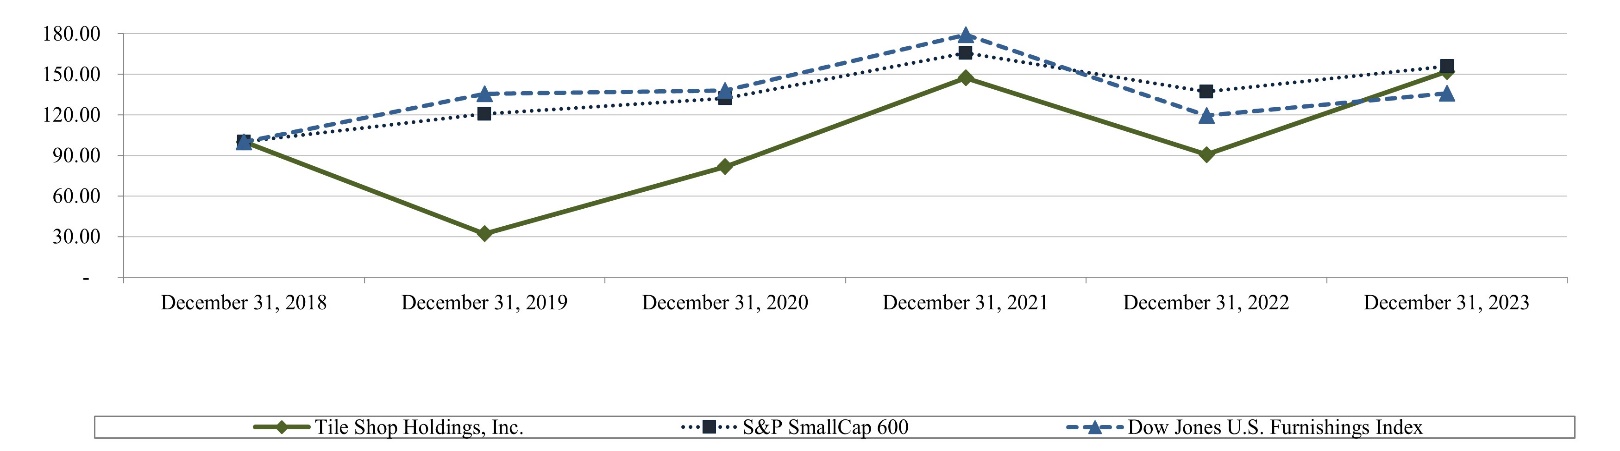
|
|
|
|
|
|
|
|
|
|
|
|
|
|
|
|
|
|
|
|
|
| Tile Shop Holdings, Inc. |
| S&P SmallCap 600 |
| Dow Jones | |||
December 31, 2018 |
| $ | 100.00 |
| $ | 100.00 |
| $ | 100.00 |
December 31, 2019 |
| $ | 32.09 |
| $ | 120.86 |
| $ | 135.50 |
December 31, 2020 |
| $ | 81.64 |
| $ | 132.43 |
| $ | 137.90 |
December 31, 2021 |
| $ | 147.42 |
| $ | 165.89 |
| $ | 179.09 |
December 31, 2022 |
| $ | 90.56 |
| $ | 137.00 |
| $ | 119.63 |
December 31, 2023 |
| $ | 152.18 |
| $ | 156.02 |
| $ | 135.91 |
ITEM 6. [RESERVED]
ITEM 7. MANAGEMENT’S DISCUSSION AND ANALYSIS OF FINANCIAL CONDITION AND RESULTS OF OPERATIONS
You should read the following discussion and analysis together with our consolidated financial statements and related notes included elsewhere in this report. Among other things, those historical consolidated financial statements include more detailed information regarding the basis of presentation for the financial data than is included in the following discussion. This report contains “forward-looking statements” within the meaning of the “safe harbor” provisions of the Private Securities Litigation Reform Act of 1995. In some cases, you can identify these statements by words such as, but not limited to, “anticipate,” “believe,” “can,” “continue,” “could,” “depend,” “estimate,” “expect,” “intend,” “may,” “might,” “plan,” “predict,” “project,” “seek,” “should,” “target,” “will,” “will likely result,” “would,” and similar expressions or variations, although some forward-looking statements are expressed differently. All statements other than statements of historical fact are statements that could be deemed forward-looking statements. The forward-looking statements in this report relate to, among other things, our anticipated new store openings, remodeling plans, and growth opportunities; our business strengths, marketing strategies, competitive advantages and role in our industry and markets; an overall decline in the health of the economy, the tile industry, consumer confidence and spending, and the housing market, including as a result of rising inflation or interest rates, instability in the global banking system, geopolitical instability, or the possibility of an economic recession or other macroeconomic factors; the impact of ongoing supply chain disruptions and inflationary cost pressures, including increased materials, labor, energy, and transportation costs and decreased discretionary consumer spending; our ability to successfully implement and realize the anticipated benefits of our strategic plan; our ability to successfully anticipate consumer trends; any statements with respect to dividends or stock repurchases and timing, methods, and payment of same; the effectiveness of our marketing strategy; potential fluctuations in our comparable store sales; our expectations regarding our and our customers’ financing arrangements and our ability to obtain additional capital, including potential difficulties of obtaining financing due to market conditions resulting from geopolitical conditions and other economic factors; supply costs and expectations, including the continued availability of sufficient products from our suppliers, risks related to relying on foreign suppliers, and the potential impact of the Russia-Ukraine, Israel-Hamas, and other geopolitical conflicts on, among other things, product availability and pricing and timing and cost of deliveries; our expectations with respect to ongoing compliance with the terms of the credit facility, including increasing interest rates; our ability to provide timely delivery to our customers; the effect of regulations on us and our industry, and our suppliers’ compliance with such regulations, including any environmental or climate change-related requirements; the impact of corporate citizenship and ESG matters; labor shortages and our expectations regarding the effects of employee recruiting, training, mentoring, and retention on our ability to recruit and retain employees; tax-related risks; the potential impact of cybersecurity breaches or disruptions to our management information systems; our ability to successfully implement our information technology and other digital initiatives; our ability to effectively manage our online sales; costs and adequacy of insurance; the potential impact of natural disasters, which may worsen or increase due to the effects of climate change, and other catastrophic events; risks inherent in operating as a holding company; fluctuations in material and energy costs, including ongoing volatility of oil and gas prices; our ability to remediate the material weaknesses in our internal control over financial reporting; the potential outcome of any legal proceedings; and risks related to ownership of our common stock.
These forward-looking statements are based on current expectations and assumptions that are subject to risks and uncertainties, many of which are difficult to predict and are outside of our control, that may cause our actual results, performance, or achievements to differ materially from any expected future results, performance, or achievements expressed or implied by such forward-looking statements. These risks and uncertainties include, but are not limited to:
the level of demand for our products;
our ability to grow and remain profitable in the highly competitive retail tile industry;
our ability to access additional capital when and as needed;
our ability to attract and retain qualified personnel;
changes in general economic, business and industry conditions, including any economic downturn or recession;
our ability to introduce new products that satisfy market demand; and
legal, regulatory, and tax developments, including additional requirements imposed by changes in domestic and foreign laws and regulations.
There is no assurance that our expectations will be realized. If one or more of these risks or uncertainties materialize, or if our underlying assumptions prove incorrect, actual results may vary materially from those expected, estimated, or projected. Such risks and uncertainties also include those set forth in Part I, Item 1A. “Risk Factors,” of this report. These statements are based on the beliefs and assumptions of our management based on information currently available to management. Our forward-looking statements speak only as of the time that they are made and do not necessarily reflect our outlook at any other point in time. Except as required by law, we undertake no obligation to update publicly any forward-looking statements, whether as a result of new information, future events, or for any other reason.
Overview and Recent Trends
We are a specialty retailer of natural stone, man-made and luxury vinyl tiles, setting and maintenance materials, and related accessories in the United States. We offer a wide selection of products, attractive prices, and exceptional customer service in an extensive showroom setting. As of December 31, 2023, we operated 142 stores in 31 states and the District of Columbia, with an average size of approximately 20,000 square feet.
We purchase our tile products and accessories directly from suppliers and manufacture our own setting and maintenance materials, such as thinset, grout, and sealers. We believe that our long-term supplier relationships, together with our design and manufacturing and distribution capabilities, enable us to offer a broad assortment of high-quality products to our customers, who are primarily homeowners and professionals, at competitive prices. We have invested significant resources to develop our proprietary brands and product sources, and we believe that we are a leading retailer of natural stone, man-made and luxury vinyl tiles, setting and maintenance materials, and related accessories in the United States.
The table below sets forth information about our net sales, operating income and stores opened from 2021 to 2023.
|
|
|
|
|
|
|
|
|
|
|
|
|
|
|
|
|
|
|
|
|
| For the year ended December 31, | |||||||
|
| 2023 |
| 2022 |
| 2021 | |||
|
| (in thousands, except store data) | |||||||
Net sales |
| $ | 377,146 |
| $ | 394,702 |
| $ | 370,700 |
Income from operations |
| $ | 16,158 |
| $ | 22,609 |
| $ | 20,610 |
Net cash provided by operating activities |
| $ | 62,060 |
| $ | 2,715 |
| $ | 39,691 |
New stores opened during period |
|
| 1 |
|
| - |
|
| 1 |
We serve customers who seek to undertake a wide range of projects; however, many end customers choose to work with us when they choose to remodel their home. Historically, we have monitored existing home sales trends reported by the National Association of REALTORS as a leading indicator of demand in our industry. In 2023, existing home sales decreased compared to 2022, following actions taken by the Federal Reserve to increase interest rates. We believe the decrease in existing home sales has resulted in softening demand for remodel projects and has had an adverse impact on our business. For the year ended December 31, 2023, our comparable store sales decreased by 4.1% due to lower levels of traffic, partially offset by an increase in average ticket value.
Our operating results are heavily dependent upon the prices paid to acquire man-made and natural store products from our suppliers around the world. In 2023, inflationary cost pressures that resulted in gross margin contraction in recent years started to taper due in part to a decrease in international freight rates and steps taken to identify alternative sources of supply. We have generally maintained our pricing, which helped contribute to an improvement in gross margin rates when comparing the first half of 2023 to the second half of the year.
Selling, general and administrative expenses decreased by $9.4 million or 4.0% to $226.9 million for the year ended December 31, 2023 as compared to the year ended December 31, 2022. The decrease was largely driven by a $6.6 million decrease in variable compensation expenses, a $3.3 million decrease in shipping and transportation expenses and a $2.6 million decrease in occupancy costs, which were partially offset by a $1.6 million increase in IT-related expenses and a $0.9 million increase in marketing expenses. Additionally, asset impairment charges increased by $0.6 million, from $0.4 million in 2022 to $1.0 million in 2023.
During 2023, operating cash flow increased by $59.3 million to $62.1 million for the year ended December 31, 2023 as compared to $2.7 million for the year ended December 31, 2022. Cash generated by operations was used to purchase $15.3 million of property, plant, and equipment and repay $45.4 million of debt. As of December 31, 2023, we had no borrowings outstanding on our revolving line of credit.
Selected Financial Data
The following table sets forth selected historical financial information derived from (i) our audited financial statements included elsewhere in this report as of December 31, 2023 and 2022 and for the years ended December 31, 2023, 2022, and 2021 and (ii) our audited financial statements not included elsewhere in this report as of December 31, 2021, 2020, and 2019 and for the years ended December 31, 2020 and 2019. The following selected financial data should be read in conjunction with the section entitled “Management’s Discussion and Analysis of Financial Condition and Results of Operations” and the financial statements and the related notes appearing elsewhere in this report.
|
|
|
|
|
|
|
|
|
|
|
|
|
|
|
|
|
|
|
|
|
|
|
|
|
|
|
|
|
|
|
|
|
|
|
|
|
|
|
|
|
|
|
| As of December 31, or for the year ended December 31, |
| |||||||||||||||||
|
| 2023 |
|
| 2022 |
|
| 2021 |
|
| 2020 |
|
| 2019 |
| |||||
|
| (in thousands, except per share and store data) |
| |||||||||||||||||
Statement of Income Data |
|
|
|
|
|
|
|
|
|
|
|
|
|
|
|
|
|
|
|
|
Net sales |
| $ | 377,146 |
|
| $ | 394,702 |
|
| $ | 370,700 |
|
| $ | 325,057 |
|
| $ | 340,351 |
|
Cost of sales |
|
| 134,085 |
|
|
| 135,765 |
|
|
| 117,570 |
|
|
| 103,532 |
|
|
| 104,232 |
|
Gross profit |
|
| 243,061 |
|
|
| 258,937 |
|
|
| 253,130 |
|
|
| 221,525 |
|
|
| 236,119 |
|
Selling, general and administrative |
|
| 226,903 |
|
|
| 236,328 |
|
|
| 232,520 |
|
|
| 215,149 |
|
|
| 237,476 |
|
Income (loss) from operations |
|
| 16,158 |
|
|
| 22,609 |
|
|
| 20,610 |
|
|
| 6,376 |
|
|
| (1,357) |
|
Interest expense |
|
| (2,164) |
|
|
| (1,579) |
|
|
| (656) |
|
|
| (1,874) |
|
|
| (3,792) |
|
Other income |
|
| - |
|
|
| - |
|
|
| - |
|
|
| - |
|
|
| 12 |
|
Income (loss) before income taxes |
|
| 13,994 |
|
|
| 21,030 |
|
|
| 19,954 |
|
|
| 4,502 |
|
|
| (5,137) |
|
(Provision) benefit for income taxes |
|
| (3,923) |
|
|
| (5,327) |
|
|
| (5,180) |
|
|
| 1,529 |
|
|
| 674 |
|
Net income (loss) |
| $ | 10,071 |
|
| $ | 15,703 |
|
| $ | 14,774 |
|
| $ | 6,031 |
|
| $ | (4,463) |
|
Earnings (loss) per share |
| $ | 0.23 |
|
| $ | 0.32 |
|
| $ | 0.29 |
|
| $ | 0.12 |
|
| $ | (0.09) |
|
Weighted average shares |
|
| 43,621 |
|
|
| 49,247 |
|
|
| 51,085 |
|
|
| 50,584 |
|
|
| 50,624 |
|
Balance Sheet Data |
|
|
|
|
|
|
|
|
|
|
|
|
|
|
|
|
|
|
|
|
Cash and cash equivalents |
| $ | 8,620 |
|
| $ | 5,948 |
|
| $ | 9,358 |
|
| $ | 9,617 |
|
| $ | 9,104 |
|
Inventories |
|
| 93,679 |
|
|
| 120,952 |
|
|
| 97,175 |
|
|
| 74,296 |
|
|
| 97,620 |
|
Total assets |
|
| 316,672 |
|
|
| 345,822 |
|
|
| 340,758 |
|
|
| 342,690 |
|
|
| 399,814 |
|
Lease obligations |
|
| 139,962 |
|
|
| 131,219 |
|
|
| 138,451 |
|
|
| 149,901 |
|
|
| 158,718 |
|
Total debt(1) |
|
| - |
|
|
| 45,400 |
|
|
| 5,000 |
|
|
| - |
|
|
| 63,000 |
|
Total stockholders' equity |
|
| 119,687 |
|
|
| 108,769 |
|
|
| 122,224 |
|
|
| 139,062 |
|
|
| 130,899 |
|
Working capital |
|
| 35,813 |
|
|
| 63,112 |
|
|
| 29,369 |
|
|
| 27,850 |
|
|
| 52,329 |
|
Cash Flow Data |
|
|
|
|
|
|
|
|
|
|
|
|
|
|
|
|
|
|
|
|
Net cash provided by operating |
| $ | 62,060 |
|
| $ | 2,715 |
|
| $ | 39,691 |
|
| $ | 65,596 |
|
| $ | 38,563 |
|
Net cash used in investing activities |
|
| (15,255) |
|
|
| (14,027) |
|
|
| (11,070) |
|
|
| (1,968) |
|
|
| (26,390) |
|
Net cash (used in) provided by financing activities |
|
| (45,928) |
|
|
| 9,114 |
|
|
| (28,902) |
|
|
| (63,329) |
|
|
| (8,622) |
|
Other Selected Financial Data |
|
|
|
|
|
|
|
|
|
|
|
|
|
|
|
|
|
|
|
|
Dividends paid per share |
| $ | - |
|
| $ | - |
|
| $ | 0.65 |
|
| $ | - |
|
| $ | 0.15 |
|
Adjusted EBITDA(2) |
|
| 38,779 |
|
|
| 49,583 |
|
|
| 50,255 |
|
|
| 39,953 |
|
|
| 34,846 |
|
Adjusted EBITDA margin(2) |
|
| 10.3 | % |
|
| 12.6 | % |
|
| 13.6 | % |
|
| 12.3 | % |
|
| 10.2 | % |
Gross margin rate(3) |
|
| 64.4 | % |
|
| 65.6 | % |
|
| 68.3 | % |
|
| 68.1 | % |
|
| 69.4 | % |
Operating income (loss) margin(4) |
|
| 4.3 | % |
|
| 5.7 | % |
|
| 5.6 | % |
|
| 2.0 | % |
|
| (0.4) | % |
Comparable store sales (decline) growth(5) |
|
| (4.1) | % |
|
| 6.5 | % |
|
| 13.8 | % |
|
| (5.6) | % |
|
| (4.6) | % |
Stores open at end of period |
|
| 142 |
|
|
| 142 |
|
|
| 143 |
|
|
| 142 |
|
|
| 142 |
|
(1)Total debt includes current maturities of long-term debt and long-term debt balances.
(2)We calculate Adjusted EBITDA by taking net income calculated in accordance with accounting principles generally accepted in the United States (“GAAP”) and adjusting for interest expense, income taxes, depreciation and amortization, and stock based compensation expense. Adjusted EBITDA margin is equal to Adjusted EBITDA divided by net sales. For more information about Adjusted EBITDA and Adjusted EBITDA margin, see “Non-GAAP Measures” below.
(3)Gross margin rate is equal to gross profit divided by net sales.
(4)Operating income (loss) margin is equal to income (loss) from operations divided by net sales.
(5)Comparable store sales growth (decline) is the percentage change in sales of comparable stores period-over-period. A store is considered comparable on the first day of the 13th full month of operation. When a store is relocated, it is excluded from the comparable store sales growth calculation. Comparable store sales growth (decline) amounts include total charges to customers less any actual returns. We include the change in the allowance for anticipated sales returns applicable to comparable stores in the comparable store sales calculation. Comparable store sales data reported by other companies may be prepared on a different basis and therefore may not be useful for purposes of comparing our results to those of other businesses. Company management believes the comparable store sales growth (decline) metric provides useful information to both management and investors to evaluate the Company’s performance, the effectiveness of its strategy and its competitive position.
Key Components of our Consolidated Statements of Income
Net Sales – Net sales represents total charges to customers, net of returns, and includes freight charged to customers. We recognize sales at the time that the customer takes control of the merchandise or final delivery of the product has occurred. We are required to charge and collect sales and other taxes on sales to our customers and remit these taxes back to government authorities. Total revenues do not include sales tax because we are a pass-through conduit for collecting and remitting sales tax. Sales are reduced by a reserve for anticipated sales returns that we estimate based on historical returns.
Comparable store sales growth is the percentage change in sales of comparable stores period-over-period. A store is considered comparable on the first day of the 13th full month of operation. When a store is relocated, it is excluded from the comparable store sales growth calculation. Comparable store sales growth amounts include total charges to customers less any actual returns. We include the change in allowance for anticipated sales returns applicable to comparable stores in the comparable store sales calculation. Comparable store sales data reported by other companies may be prepared on a different basis and therefore may not be useful for purposes of comparing our results to those of other businesses. Company management believes the comparable store sales growth (decline) metric provides useful information to both management and investors to evaluate the Company’s performance, the effectiveness of its strategy and its competitive position.
Cost of Sales – Cost of sales consists primarily of material costs, freight, customs and duty fees, and storage and delivery of product to the customers, as well as physical inventory losses and costs associated with manufacturing of setting and maintenance materials.
Gross Profit – Gross profit is net sales less cost of sales. Gross margin rate is the percentage determined by dividing gross profit by net sales.
Selling, General and Administrative Expenses – Selling, general and administrative expenses consist primarily of compensation costs, occupancy, utilities, and maintenance costs, advertising costs, shipping and transportation expenses to move inventory from our distribution centers to our stores, and depreciation and amortization.
Pre-opening Costs – Our pre-opening costs are those typically associated with the opening of a new store and generally include rent expense, compensation costs and promotional costs. We expense pre-opening costs as incurred and include these costs in selling, general and administrative expenses.
Income Taxes – We are subject to income tax in the United States as well as other tax jurisdictions in which we conduct business.
Comparison of the Year Ended December 31, 2023 to the Year Ended December 31, 2022
|
|
|
|
|
|
|
|
|
|
|
|
|
|
|
|
|
|
|
|
|
|
|
|
|
|
|
| 2023 |
| % of sales(1) |
| 2022 |
| % of sales | ||||
|
| ($ in thousands) | ||||||||||
Net sales |
| $ | 377,146 |
| 100.0 | % |
| $ | 394,702 |
| 100.0 | % |
Cost of sales |
|
| 134,085 |
| 35.6 | % |
|
| 135,765 |
| 34.4 | % |
Gross profit |
|
| 243,061 |
| 64.4 | % |
|
| 258,937 |
| 65.6 | % |
Selling, general and administrative expenses |
|
| 226,903 |
| 60.2 | % |
|
| 236,328 |
| 59.9 | % |
Income from operations |
|
| 16,158 |
| 4.3 | % |
|
| 22,609 |
| 5.7 | % |
Interest expense |
|
| (2,164) |
| (0.6) | % |
|
| (1,579) |
| (0.4) | % |
Income before income taxes |
|
| 13,994 |
| 3.7 | % |
|
| 21,030 |
| 5.3 | % |
Provision for income taxes |
|
| (3,923) |
| (1.0) | % |
|
| (5,327) |
| (1.3) | % |
Net income |
| $ | 10,071 |
| 2.7 | % |
| $ | 15,703 |
| 4.0 | % |
(1)Amounts do not foot due to rounding.
Net Sales – Net sales decreased $17.6 million, or 4.4%, in 2023 compared to 2022. Sales at comparable stores decreased by 4.1% during 2023. The decrease in annual sales was primarily due to a decrease in store traffic that was partially offset by an increase in average ticket value.
Gross Profit – Gross profit decreased $15.9 million, or 6.1%, in 2023 compared to 2022. The gross margin rate was 64.4% and 65.6% for 2023 and 2022, respectively. The decrease in gross margin rate was primarily due to increases in supplier costs and higher international freight rates that drove inventory costs higher throughout 2022 and the first half of 2023 before beginning to moderate during the second half of 2023.
Selling, General and Administrative Expenses – Selling, general and administrative expenses decreased $9.4 million, or 4.0%, in 2023 compared to 2022. The decrease was largely driven by a $6.6 million decrease in variable compensation expenses, a $3.3 million decrease in shipping and transportation expenses and a $2.6 million decrease in occupancy costs, which were partially offset by a $1.6 million increase in IT-related expenses and a $0.9 million increase in marketing expenses. Additionally, asset impairment charges increased by $0.6 million, from $0.4 million in 2022 to $1.0 million in 2023.
Interest Expense – Interest expense increased $0.6 million in 2023 compared to 2022. The increase in interest expense was primarily due to a higher level of average debt in 2023 and an increase in interest rates.
Provision for Income Taxes – The provision for income taxes decreased $1.4 million for 2023 compared to 2022 due to a decrease in pretax income. Our effective tax rate was 28.0% in 2023 and 25.3% in 2022. The increase in the effective tax rate was largely due to an increase in tax expense associated with stock based compensation.
Comparison of the Year Ended December 31, 2022 to the Year Ended December 31, 2021
A detailed discussion of the fiscal year 2022 performance compared to fiscal year 2021 is set forth in Part II, Item 7. “Management’s Discussion and Analysis of Financial Condition and Results of Operations – Comparison of the Year Ended December 31, 2022 to the Year Ended December 31, 2021,” in our Annual Report on Form 10-K for the year ended December 31, 2022, as filed with the SEC on March 2, 2023, which discussion is incorporated herein by reference.
Non-GAAP Measures
We calculate Adjusted EBITDA by taking net income calculated in accordance with GAAP and adjusting for interest expense, income taxes, depreciation and amortization, and stock-based compensation expense. Adjusted EBITDA margin is equal to Adjusted EBITDA divided by net sales. We calculate pretax return on capital employed by taking income (loss) from operations divided by capital employed. Capital employed equals total assets less accounts payable, income taxes payable, other accrued liabilities, lease liability and other long-term liabilities. Other companies may calculate both Adjusted EBITDA and pretax return on capital employed differently, limiting the usefulness of these measures for comparative purposes.
We believe that these non-GAAP measures of financial results provide useful information to management and investors regarding certain financial and business trends relating to our financial condition and results of operations. Our management uses these non-GAAP measures to compare our performance to that of prior periods for trend analyses, for purposes of determining management incentive compensation, for budgeting and planning purposes, and for assessing the effectiveness of capital allocation over time. These measures are used in monthly financial reports prepared for management and our Board of Directors. We believe that the use of these non-GAAP financial measures provides an additional tool for investors to use in evaluating ongoing operating results and trends and in comparing our financial measures with other specialty retailers, many of which present similar non-GAAP financial measures to investors.
Our management does not consider these non-GAAP measures in isolation or as an alternative to financial measures determined in accordance with GAAP. The principal limitations of these non-GAAP financial measures are that they exclude significant expenses and income that are required by GAAP to be recognized in our consolidated financial statements. In addition, they are subject to inherent limitations as they reflect the exercise of judgments by management about which expenses and income are excluded or included in determining these non-GAAP financial measures. In order to compensate for these limitations, management presents non-GAAP financial measures in connection with GAAP results. We urge investors to review the reconciliation of our non-GAAP financial measures to the comparable GAAP financial measures and not to rely on any single financial measure to evaluate our business.
The reconciliation of Adjusted EBITDA to net income (loss) for the years ended December 31, 2019 through December 31, 2023 is as follows:
|
|
|
|
|
|
|
|
|
|
|
|
|
|
|
|
|
| Years Ended December 31, | |||||||||||||
|
| 2023 |
| 2022 |
| 2021 |
| 2020 |
| 2019 | |||||
|
| (in thousands) | |||||||||||||
Net income (loss) |
| $ | 10,071 |
| $ | 15,703 |
| $ | 14,774 |
| $ | 6,031 |
| $ | (4,463) |
Interest expense |
|
| 2,164 |
|
| 1,579 |
|
| 656 |
|
| 1,874 |
|
| 3,792 |
Provision (benefit) for income taxes |
|
| 3,923 |
|
| 5,327 |
|
| 5,180 |
|
| (1,529) |
|
| (674) |
Depreciation & amortization |
|
| 21,229 |
|
| 25,142 |
|
| 27,379 |
|
| 31,336 |
|
| 33,546 |
Stock based compensation |
|
| 1,392 |
|
| 1,832 |
|
| 2,266 |
|
| 2,241 |
|
| 2,645 |
Adjusted EBITDA |
| $ | 38,779 |
| $ | 49,583 |
| $ | 50,255 |
| $ | 39,953 |
| $ | 34,846 |
|
|
|
|
|
|
|
|
|
|
|
|
|
|
|
|
Adjusted EBITDA as a percentage of net sales for the years ended December 31, 2019 through December 31, 2023 is as follows:
|
|
|
|
|
|
|
|
|
|
|
|
|
|
|
|
|
| Years Ended December 31, | |||||||||||||
|
| 2023 |
| 2022 |
| 2021 |
| 2020 |
| 2019(1) | |||||
|
| % of net sales | |||||||||||||
Net income (loss) |
| 2.7 | % |
| 4.0 | % |
| 4.0 | % |
| 1.9 | % |
| (1.3) | % |
Interest expense |
| 0.6 |
|
| 0.4 |
|
| 0.2 |
|
| 0.6 |
|
| 1.1 |
|
Provision (benefit) for income taxes |
| 1.0 |
|
| 1.3 |
|
| 1.4 |
|
| (0.5) |
|
| (0.2) |
|
Depreciation & amortization |
| 5.6 |
|
| 6.4 |
|
| 7.4 |
|
| 9.6 |
|
| 9.9 |
|
Stock based compensation |
| 0.4 |
|
| 0.5 |
|
| 0.6 |
|
| 0.7 |
|
| 0.8 |
|
Adjusted EBITDA |
| 10.3 | % |
| 12.6 | % |
| 13.6 | % |
| 12.3 | % |
| 10.2 | % |
(1)Amounts do not foot due to rounding.
The calculation of pretax return on capital employed is as follows:
|
|
|
|
|
|
|
|
|
|
|
|
|
|
($ in thousands) |
| December 31, | ||||
|
| 2023(1) |
| 2022(1) | ||
Income from operations |
| $ | 16,158 |
| $ | 22,609 |
|
|
|
|
|
|
|
Total Assets |
|
| 324,880 |
|
| 348,720 |
Less: Accounts payable |
|
| (24,885) |
|
| (28,752) |
Less: Income tax payable |
|
| (519) |
|
| (818) |
Less: Other accrued liabilities |
|
| (32,728) |
|
| (39,951) |
Less: Lease liability |
|
| (131,840) |
|
| (130,852) |
Less: Other long-term liabilities |
|
| (4,585) |
|
| (4,618) |
Capital Employed |
| $ | 130,323 |
| $ | 143,729 |
|
|
|
|
|
|
|
Pretax Return on Capital Employed |
|
| 12.4% |
|
| 15.7% |
(1)Income statement accounts represent the activity for the trailing twelve months ended as of each of the balance sheet dates. Balance sheet accounts represent the average account balance for the four quarters ended as of each of the balance sheet dates.
Liquidity and Capital Resources
Our principal sources of liquidity include $8.6 million of cash and cash equivalents at December 31, 2023, cash provided by operating activities and borrowings available under our credit facility. We expect to use this liquidity for maintaining our existing stores, purchasing additional merchandise inventory, and general corporate purposes.
On September 30, 2022, Holdings and its operating subsidiary, The Tile Shop, and certain subsidiaries of each entered into a Credit Agreement with JPMorgan Chase Bank, N.A. and the lenders party thereto, including Fifth Third Bank (the “Credit Agreement”). The Credit Agreement provides us with a senior credit facility consisting of a $75.0 million revolving line of credit through September 30, 2027. Borrowings pursuant to the Credit Agreement initially bear interest at a rate per annum equal to: (i) Adjusted Term SOFR Rate (as defined in the Credit Agreement), plus a margin ranging from 1.25% to 1.75%; (ii) Adjusted Daily Simple SOFR (as defined in the Credit Agreement), plus a margin ranging from 1.25% to 1.75%; or (iii) the Alternate Base Rate (as defined in the Credit Agreement), plus a margin ranging from 0.25% to 0.75%. The margin is determined based on the Rent Adjusted Leverage Ratio (as defined in the Credit Agreement).
The Credit Agreement is secured by virtually all of our assets, including but not limited to, inventory, accounts receivable, equipment and general intangibles. The Credit Agreement contains customary events of default, conditions to borrowing and restrictive covenants, including restrictions on our ability to dispose of assets, engage in acquisitions or mergers, make distributions on or repurchases of capital stock, incur additional debt, incur liens or make investments. The Credit Agreement also includes financial and other covenants, including covenants to maintain a Fixed Charge Coverage Ratio (as defined in the Credit Agreement) of no less than 1.20 to 1.00 and a Rent Adjusted Leverage Ratio (as defined in the Credit Agreement) of no greater than 3.50 to 1.00. We were in compliance with the covenants as of December 31, 2023.
We had no borrowings outstanding on our line of credit as of December 31, 2023. We have standby letters of credit outstanding related to our workers’ compensation and medical insurance policies. As of December 31, 2023, standby letters of credit totaled $1.4 million. As of December 31, 2023, there was $73.6 million available for borrowing on the revolving line of credit, which may be used for maintaining our existing stores, purchasing additional merchandise inventory, and general corporate purposes.
During 2024, we expect to use cash for maintaining our existing stores, purchasing additional merchandise inventory, and general corporate purposes. Additionally, as described further in Note 6 of the Notes to the Consolidated Financial Statements, as of December 31, 2023, our lease liability under operating leases totaled $140.0 million. Contractual lease payments range from $17.0 million to $38.7 million on an annual basis over the next five years. We are also obligated to fund certain self-insured employee benefits, including our medical and workers’ compensation plans. As of December 31, 2023, accrual balances related to our estimated workers’ compensation claims and medical claims totaled $1.5 million and $1.1 million, respectively. Additionally, we have contractual obligations related to software service arrangements with suppliers for fixed or minimum amounts. Future minimum payments at December 31, 2023 for purchase obligations were $4.7 million. Amounts due under these arrangements in 2024, 2025, 2026, 2027 and 2028 total $2.0 million, $1.2 million, $0.7 million, $0.4 million, and $0.4 million, respectively.
We currently believe that our cash and cash equivalents, cash flows from operations and access to cash under our credit facility will be adequate to meet our ongoing operating requirements over the next twelve months and our long-term liquidity requirements.
Capital Expenditures
The following table summarizes our capital expenditures during the years ended December 31, 2023, 2022 and 2021.
|
|
|
|
|
|
|
|
|
|
|
|
|
|
|
|
|
|
|
|
|
|
|
|
|
|
|
|
|
|
|
| Years Ended December 31, | |||||||
|
| 2023 |
| 2022 |
| 2021 | |||
|
| (in millions) | |||||||
New store building, existing store remodels and store merchandising investments |
| $ | 11.9 |
| $ | 7.6 |
| $ | 7.1 |
Information technology infrastructure |
|
| 1.7 |
|
| 2.8 |
|
| 2.4 |
Distribution and manufacturing facilities |
|
| 1.7 |
|
| 3.6 |
|
| 1.6 |
|
| $ | 15.3 |
| $ | 14.0 |
| $ | 11.1 |
Our future capital requirements will vary based on the number of additional stores, distribution centers, and manufacturing facilities that we open and the number of stores that we choose to renovate. Our decisions regarding opening, relocating, or renovating stores, and whether to engage in strategic acquisitions, will be based in part on macroeconomic factors and the general state of the U.S. economy, as well as the local economies in the markets in which our stores are located.
Cash Flows
The following table summarizes our cash flow for the years ended December 31, 2023, 2022 and 2021.
|
|
|
|
|
|
|
|
|
|
|
|
|
|
|
|
|
|
|
|
|
| For the year ended December 31, | |||||||
|
| 2023 |
| 2022 |
| 2021 | |||
|
| (in thousands) | |||||||
Net cash provided by operating activities |
| $ | 62,060 |
| $ | 2,715 |
| $ | 39,691 |
Net cash used in investing activities |
|
| (15,255) |
|
| (14,027) |
|
| (11,070) |
Net cash (used in) provided by financing activities |
|
| (45,928) |
|
| 9,114 |
|
| (28,902) |
Operating Activities
Cash flows from operating activities provide us with a significant source of liquidity. Net cash provided by operating activities was $62.1 million, $2.7 million, and $39.7 million in 2023, 2022 and 2021, respectively. The increase in operating cash flows in 2023 compared to 2022 was primarily due to a decrease in inventory in 2023 when compared to an increase in inventory in 2022.
Investing Activities
Net cash used in investing activities was $15.3 million, $14.0 million and $11.1 million in 2023, 2022 and 2021, respectively. The increase in investing activities in 2023 was due to an increase in capital expenditures during 2023 to invest in new stores, store remodels, store merchandising, distribution, internal fleet and information technology assets. During 2023, the Company relocated one store, opened one store, and closed one store.
Financing Activities
Net cash (used in) provided by financing activities was ($45.9) million, $9.1 million and ($28.9) million in 2023, 2022 and 2021, respectively. Cash used in financing activities during 2023 included $65.4 million of payments against the line of credit net of $20.0 million of borrowings against the line of credit.
Critical Accounting Policies and Estimates
Our financial statements are prepared in accordance with GAAP. The preparation of our financial statements and related disclosures requires us to make estimates, assumptions, and judgments that affect the reported amount of assets, liabilities, revenues, costs and expenses, and related disclosures. We base our estimates and assumptions on historical experience and other factors that we believe to be reasonable under the circumstances, but all such estimates and assumptions are inherently uncertain and unpredictable. We evaluate our estimates and assumptions on an ongoing basis. Actual results may differ from those estimates and assumptions, and it is possible that other professionals, applying their own judgment to the same facts and circumstances, could develop and support alternative estimates and assumptions that would result in material changes to our operating results and financial condition. Our most critical accounting policies are summarized below. For further information on our critical and other significant accounting policies, see the notes to the consolidated financial statements included in this report.
Recognition of Revenue
Description: Revenues are recognized when control of promised goods or services is transferred to our customers, in an amount that reflects the consideration received in exchange for those goods or services. We recognize service revenue, which consists primarily of freight charges for home delivery, when the service has been rendered. We are required to charge and collect sales and other taxes on sales to our customers and remit these taxes back to government authorities. Total revenues do not include sales tax because we are a pass-through conduit for collecting and remitting sales tax.
Judgement and uncertainties involved in the estimate: Net sales are reduced by an allowance for anticipated sales returns that we estimate based on historical returns. Our process to establish a sales return reserve contains uncertainties because it requires management to make assumptions and to apply judgment to estimate future sales returns and exchanges. Merchandise exchanges are not considered merchandise returns and, therefore, are excluded when calculating the sales returns reserve.
Effect if actual results differ from the assumptions: Actual return trends have not varied significantly from estimated amounts in prior periods. However, if the nature of sales returns changes significantly, our sales could be adversely impacted. A 10% change in our sales returns reserves and related return assets at December 31, 2023 would have had a $0.2 million net impact on operating income during fiscal 2023.
Inventory Valuation and Shrinkage
Description: Our inventory consists of manufactured items and purchased merchandise held for resale. Inventories are stated at the lower of cost (determined using the moving average cost method) or net realizable value. We capitalize the cost of inbound freight, duties, and receiving and handling costs to bring purchased materials into our distribution network. The labor and overhead costs incurred in connection with the production process are included in the value of manufactured finished goods.
Judgement and uncertainties involved in the estimate: We provide provisions for losses related to shrinkage and other amounts that are otherwise not expected to be fully recoverable. These provisions are calculated based on historical shrinkage, selling price, margin and current business trends. These estimates have calculations that require management to make assumptions based on the current rate of sales, age, salability and profitability of inventory, historical percentages that can be affected by changes in our merchandising mix, customer preferences, rates of sell through and changes in actual shrinkage trends.
Effect if actual results differ from the assumptions: We do not believe there is a reasonable likelihood that there will be a material change in the assumptions we use to calculate our inventory provisions. However, if actual results are not consistent with our estimates and assumptions, we may be exposed to losses that could be material. A 10% change in our inventory valuation and shrinkage reserves at December 31, 2023 would have had a $0.1 million net impact on operating income during fiscal 2023.
Property, Plant and Equipment
Description: Property, plant and equipment are carried at cost less accumulated depreciation, which is amortized over the useful life of the assets. Leasehold improvements are amortized over the shorter of their estimated useful lives or lease period (including expected renewal periods). Property, plant, equipment, and right of use assets are evaluated for impairment whenever events or changes in circumstances indicate that the carrying value may not be recoverable. The evaluation is performed at the lowest level of identifiable cash flows independent of other assets, which typically occurs at an individual store level. An impairment loss is recognized when estimated undiscounted future cash flows from the operations and/or disposition of the assets are less than the carrying amount.
Judgement and uncertainties involved in the estimate: Significant assumptions used in developing undiscounted cash flow analyses include estimates of future sales, gross margin and operating expenses. Measurement of an impairment loss is based on the excess of the carrying amount of the asset group over its fair value. Fair value is measured using discounted cash flows or independent opinions of value, as appropriate. Significant assumptions used in the fair value analyses include estimates of future sales, gross margin, operating expenses, comparable market rents and discount rates.
Effect if actual results differ from the assumptions: If actual results are not consistent with our estimates and assumptions used in determining future cash flows and asset fair values, we may be exposed to losses that could be material. During the fiscal years ended December 31, 2023, 2022 and 2021, the Company recorded asset impairment charges of $1.0 million, $0.4 million and $0.7 million, respectively, which were classified in selling, general and administrative expenses.
Income Taxes
Description: Deferred tax liabilities and assets are determined based on the difference between the financial statement basis and tax basis of assets and liabilities using enacted tax rates in effect for the year in which the differences are expected to reverse.
Judgement and uncertainties involved in the estimate: We estimate the degree to which tax assets and loss carryforwards will result in a benefit based on expected profitability by tax jurisdiction. A valuation allowance for such tax assets and loss carryforwards is provided when it is determined to be more likely than not that the benefit of such deferred tax asset will not be realized in future periods. If it becomes more likely than not that a tax asset will be used, the related valuation allowance on such assets would be reduced.
Effect if actual results differ from the assumptions: If future taxable income is insufficient to realize the benefit of tax assets and loss carryforwards, we may be exposed to losses that could be material.
ITEM 7A. QUANTITATIVE AND QUALITATIVE DISCLOSURES ABOUT MARKET RISK
We are exposed to market risks in the ordinary course of our business. These risks primarily include inflation, interest rate risk, credit concentration risk and foreign currency exchange risk.
Inflation
Inflationary factors such as increases in the cost of our products and overhead costs may adversely affect our operating results. Our operating results are heavily dependent upon the prices paid to acquire man-made and natural stone products from our vendors around the world. Our cost of sales is subject to inflationary pressures and price fluctuations of the raw materials we use and other costs, including freight and labor costs. The cost to source our products has increased over the last couple of years due to an increase in international freight rates and vendor price increases, due in part to higher labor costs, energy prices and other inflationary pressures. Higher rates of inflation may have an adverse effect on our ability to maintain historical levels of gross profit and selling, general and administrative expenses as a percentage of revenues if the selling prices of our products do not increase with these increased costs. Historically, we have generally been able over time to offset, in whole or in part, the effects of inflation and price fluctuations through sales price increases and production efficiencies associated with technological enhancements and volume growth; however, we cannot reasonably estimate our ability to offset any increases in raw material prices or freight or labor costs or other inflationary pressures in the future. Such sustained inflationary pressures may have an adverse effect on our business, financial condition and results of operations if the selling prices of our products do not increase with these increased costs, or we cannot identify cost efficiencies.
Interest Rate Risk
We are exposed to interest rate risk through the investment of our cash and cash equivalents. Changes in interest rates affect the interest income that we earn in connection with these investments, and therefore impact our cash flows and results of operation. We are also exposed to interest rate risk in connection with borrowings under our credit facility. Borrowings pursuant to our Credit Agreement initially bear interest at a rate per annum equal to: (i) Adjusted Term SOFR Rate (as defined in the Credit Agreement), plus a margin ranging from 1.25% to 1.75%; (ii) Adjusted Daily Simple SOFR (as defined in the Credit Agreement), plus a margin ranging from 1.25% to 1.75%; or (iii) the Alternate Base Rate (as defined in the Credit Agreement), plus a margin ranging from 0.25% to 0.75%. The margin is determined based on the Rent Adjusted Leverage Ratio (as defined in the Credit Agreement). Based upon balances and interest rates as of December 31, 2023, holding other variables constant, a one percentage point increase in interest rates for the next 12-month period would not affect pre-tax earnings or cash flow as we had paid off our debt balance as of the end of the year.
We currently do not engage in any interest rate hedging activity. We do not, and do not intend to, engage in the practice of trading derivative securities for profit.
Credit Concentration Risk
Financial instruments, which may subject us to concentration of credit risk, consist principally of cash deposits. We maintain cash balances at financial institutions with strong credit ratings. However, the amounts invested with financial institutions are generally in excess of FDIC insurance limits.
Foreign Currency Exchange Rate Risk
We are exposed to risks from foreign currency exchange rate fluctuations on the translation of our subsidiary based in China and on the purchase of goods in Chinese yuan. Purchases made in Chinese yuan were less than 15% of our total inventory purchases in both 2023 and 2022. Our exposure to foreign currency rate fluctuations is not significant to our financial condition or results of operations.
We currently do not engage in any exchange rate hedging activity and currently have no intention to do so in the foreseeable future. However, in the future, in an effort to mitigate losses associated with these risks, we may at times engage in these transactions.
ITEM 8. FINANCIAL STATEMENTS AND SUPPLEMENTARY DATA
Our consolidated financial statements and the reports of our independent registered public accounting firm, as listed under Part IV, Item 15. “Exhibits and Financial Statement Schedules,” are included as a separate section of this report beginning on page 37 and are incorporated herein by reference.
ITEM 9. CHANGES IN AND DISAGREEMENTS WITH ACCOUNTANTS ON ACCOUNTING AND FINANCIAL DISCLOSURE
None.
ITEM 9A. CONTROLS AND PROCEDURES
Disclosure Controls and Procedures.
We have established disclosure controls and procedures that are designed to ensure that information required to be disclosed in our reports filed or submitted under the Exchange Act is recorded, processed, summarized and reported within the time periods specified in the rules and forms of the SEC, and that information relating to the Company is accumulated and communicated to management, including our principal officers, as appropriate to allow timely decisions regarding required disclosure. Our Chief Executive Officer and Chief Financial Officer have evaluated the effectiveness of our disclosure controls and procedures as of December 31, 2023 and have concluded that our disclosure controls and procedures were not effective as of December 31, 2023 due to the material weaknesses in our internal control over financial reporting as described below.
Management’s Annual Report on Internal Control over Financial Reporting
Our management is responsible for establishing and maintaining adequate internal control over financial reporting, as defined in Rule 13a-15(f) promulgated under the Exchange Act. Internal control over financial reporting is a process designed by, or under the supervision of, our Chief Executive Officer and Chief Financial Officer and effected by our Board of Directors, management and other personnel, to provide reasonable assurance regarding the reliability of financial reporting and the preparation of our financial statements for external purposes in accordance with GAAP. Internal control over financial reporting includes policies and procedures that: (i) pertain to the maintenance of records that, in reasonable detail, accurately and fairly reflect the transactions and dispositions of an issuer’s assets; (ii) provide reasonable assurance that transactions are recorded as necessary to permit preparation of financial statements in accordance with GAAP, and that an issuer’s receipts and expenditures are being made only in accordance with authorizations of its management and directors; and (iii) provide reasonable assurance regarding prevention or timely detection of unauthorized acquisition, use or disposition of an issuer’s assets that could have a material effect on the consolidated financial statements. A material weakness is a significant deficiency, or combination of significant deficiencies, in internal control over financial reporting, such that there is a reasonable possibility that a material misstatement of the annual or interim financial statements will not be prevented or detected on a timely basis. Because of its inherent limitations, internal control over financial reporting may not prevent or detect misstatements. Also, the application of any evaluation of effectiveness to future periods is subject to the risk that controls may become inadequate because of changes in conditions, or that compliance with the policies or procedures may deteriorate.
As required by Rule 13a-15(c) promulgated under the Exchange Act, our management, with the participation of our Chief Executive Officer and Chief Financial Officer, evaluated the effectiveness of our internal control over financial reporting as of December 31, 2023. Management’s assessment was based on criteria set forth by the Committee of Sponsoring Organizations of the Treadway Commission in Internal Control - Integrated Framework (2013 Framework) (“COSO”). Based on management’s assessment, management has concluded that our internal control over financial reporting was not effective as of December 31, 2023 due to material weaknesses in the design effectiveness of the Company’s information technology general controls (“ITGCs”) and the operating effectiveness of the Company’s controls surrounding leases.
The material weakness related to the Company’s ITGCs stems from deficiencies in user access controls, which did not adequately restrict access to the Company’s financial reporting system, did not ensure appropriate segregation of duties, and did not prevent unauthorized individuals from having the ability to create, post and modify journal entries. This material weakness also resulted in the ineffectiveness of automated and manual business process controls throughout our financial reporting and business transaction cycles that are dependent upon the affected ITGCs.
In addition, we previously identified a material weakness in internal control over financial reporting attributable to the breakdown in the operating effectiveness of our controls designed to identify and ensure timely recognition of new and modified leases, as disclosed in “Part I, Item 4 – Controls and Procedures” in our Form 10-Q prepared for the period ending September 30, 2023. Since originally identifying this material weakness, we have identified additional deficiencies in the design and operating effectiveness of our controls to review key inputs underlying certain lease accounting calculations.
These deficiencies resulted in an elevated risk that a material misstatement of our annual or interim financial statements would not be prevented or detected by other compensating controls. Notwithstanding the identified material weaknesses, we believe the consolidated financial statements included in this Form 10-K fairly present, in all material respects, our financial condition, results of operations, and cash flows for the periods presented in conformity with GAAP.
RSM US LLP, our independent registered public accounting firm, has issued a report on our internal control over financial reporting as of December 31, 2023. See “Report of Independent Registered Public Accounting Firm – Opinion on Internal Control over Financial Reporting” of this report.
Planned Remediation of Material Weaknesses
Management has actively engaged in implementing remediation plans to address the material weaknesses outlined above.
With respect to the material weakness identified related to the Company’s ITGCs, the remediation efforts include the following actions, among others:
Restricting access in our enterprise resource planning (“ERP”) system to process transactions that could trigger a manual journal entry initiated outside of the park and post process for users who are responsible for reviewing account reconciliations.
Adjusting access profiles in our ERP system to eliminate the ability for a user to modify and subsequently approve a manual journal entry.
Designing and implementing a new monitoring control to identify and assess the appropriateness of any change made to a manual journal entry by the same user who approved the manual journal entry.
Developing a new control to identify and assess the appropriateness of transactions processed in our ERP system that generate accounting entries initiated individuals who are responsible for reviewing account reconciliations.
Refining the control to identify access profiles in our ERP system that result in segregation of duties risks.
With respect to the material weakness surrounding the Company’s lease accounting, management has taken the following steps to remediate the deficiencies identified:
Reviewed all new leases and lease amendments entered into during 2023 and confirmed that our accounting records have been updated to reflect the terms of the new leases and lease amendments.
Transitioned responsibility to certify the completeness of the population of new and amended leases each quarter to a new control operator who is responsible for oversight of lease negotiations. We have provided training to our new control operator and set clear expectations with respect to our controls involving the accounting for leases.
In future periods, management will take additional measures to enhance its controls to review key inputs used in its lease accounting calculations.
We have started implementing, for the material weakness related to the ITCGs, and continue to implement, for the material weakness relating to the Company’s lease accounting, the remediation steps outlined above. Each identified material weakness in internal control over financial reporting will not be considered remediated until the applicable controls have been in operation for a sufficient period of time for our management to conclude that such material weakness has been remediated. We will continue to assess the effectiveness of our remediation efforts in connection with our evaluations of internal control over financial reporting. No assurance can be made that our remediation efforts will be completed in a timely manner or that the updated controls and procedures associated with such efforts will be deemed adequate after being subjected to testing.
Changes in Internal Control over Financial Reporting
Other than the changes discussed above, there were no changes in internal control over financial reporting (as defined by Rule 13a-15(f) under the Exchange Act) during the quarter ended December 31, 2023 that have materially affected, or are reasonably likely to materially affect, our internal control over financial reporting.
Inherent Limitations on Effectiveness of Controls
Our management, including our Chief Executive Officer and Chief Financial Officer, intends that our disclosure controls and procedures and internal control over financial reporting are designed to provide reasonable assurance of achieving their objectives. However, our management does not expect that our disclosure controls and procedures or our internal control over financial reporting will prevent all errors and all fraud. A control system, no matter how well conceived and operated, can provide only reasonable, not absolute, assurance that the objectives of the control system are met. Further, the design of a control system must reflect the fact that there are resource constraints, and the benefits of controls must be considered relative to their costs. Because of the inherent limitations in all control systems, no evaluation of controls can provide absolute assurance that all control issues and instances of fraud, if any, have been detected. These inherent limitations include the realities that judgments in decision-making can be faulty, and that breakdowns can occur because of a simple error or mistake. Additionally, controls can be circumvented by the individual acts of some persons, by collusion of two or more people or by management override of the controls. The design of any system of controls also is based in part upon certain assumptions about the likelihood of future events, and there can be no assurance that any design will succeed in achieving its stated goals under all potential future conditions; over time, controls may become inadequate because of
changes in conditions, or the degree of compliance with policies or procedures may deteriorate. Because of the inherent limitations in a cost effective control system, misstatements due to error or fraud may occur and not be detected.
ITEM 9B. OTHER INFORMATION
Rule 10b5-1 Trading Plans
During the quarter ended December 31, 2023, none of the Company’s directors or executive officers
ITEM 9C. DISCLOSURE REGARDING FOREIGN JURISDICTIONS THAT PREVENT INSPECTIONS
Not applicable.
PART III
Certain information required by Part III is incorporated by reference from our definitive Proxy Statement for the Annual Meeting of Stockholders, which is currently scheduled to be held on June 18, 2024 (the “Proxy Statement”), or an amendment to this Form 10-K, which we intend to file with the SEC within 120 days after the fiscal year end covered by this report. Except for those portions specifically incorporated in this Form 10-K by reference to the Proxy Statement, no other portions of the Proxy Statement are deemed to be filed as part of this Form 10-K.
ITEM 10. DIRECTORS, EXECUTIVE OFFICERS AND CORPORATE GOVERNANCE
The following sections of the Proxy Statement are incorporated herein by reference:
Proposal 1 – Election of Directors
Information about our Executive Officers
Certain Relationships and Related Transactions
Delinquent Section 16(a) Reports
We have adopted a Code of Business Conduct and Ethics that applies to all of our officers, directors and employees. The Code of Business Conduct and Ethics is available on the “Investor Relations” section of our website, at http://investors.tileshop.com, under the “Corporate Governance—Governance Documents” heading. We intend to satisfy the disclosure requirement under Item 5.05 of Form 8-K regarding an amendment to, or waiver from, a provision of our Code of Ethics and Business Conduct by posting such information on our website at the web address and location specified above within four business days following the date of the amendment or waiver.
ITEM 11. EXECUTIVE COMPENSATION
The following sections of the Proxy Statement are incorporated herein by reference:
Executive Compensation
Director Compensation
Pay Ratio
Pay Versus Performance
Proposal 1 – Election of Directors – Committees of the Board of Directors – Compensation Committee Interlocks and Insider Participation
Proposal 1 – Election of Directors – Information Regarding the Board of Directors and Corporate Governance – Oversight of Risk Management
ITEM 12. SECURITY OWNERSHIP OF CERTAIN BENEFICIAL OWNERS AND MANAGEMENT AND RELATED STOCKHOLDER MATTERS
The following section of the Proxy Statement is incorporated herein by reference:
Security Ownership of Certain Beneficial Owners and Management
EQUITY COMPENSATION PLAN INFORMATION
The following table presents our equity compensation plan information as of December 31, 2023:
|
|
|
|
|
|
|
|
|
|
|
|
|
|
|
|
|
| (a) |
| (b) |
| (c) |
|
Plan Category |
| Number of securities to be issued upon exercise of outstanding options, warrants and rights |
| Weighted average |
| Number of securities |
|
Equity compensation plans approved by stockholders |
| 310,717 | (1) | 7.51 |
| 3,253,747 | (2) |
Equity compensation plans not approved by stockholders |
| - |
| - |
| - |
|
Total |
| 310,717 |
| 7.51 |
| 3,253,747 |
|
(1)Represents shares of common stock to be issued upon exercise of outstanding options to purchase common stock granted pursuant to the 2012 Plan and 2021 Plan as of December 31, 2023.
(2)All shares available for future issuance are under the 2021 Plan.
ITEM 13. CERTAIN RELATIONSHIPS AND RELATED TRANSACTIONS, AND DIRECTOR INDEPENDENCE
The following sections of the Proxy Statement are incorporated herein by reference:
Proposal 1 – Election of Directors – Information Regarding the Board of Directors and Corporate Governance – Independence of the Board of Directors
Certain Relationships and Related Transactions
ITEM 14. PRINCIPAL ACCOUNTANT FEES AND SERVICES
The following section of the Proxy Statement is incorporated herein by reference:
Proposal 3 – Ratification of Appointment of Independent Registered Public Accounting Firm
PART IV
ITEM 15. EXHIBITS AND FINANCIAL STATEMENT SCHEDULES
(a) Documents filed as part of report
1. Financial Statements
The following consolidated financial statements of the Company and its subsidiaries are filed as part of this Form 10-K:
2. Financial Statement Schedules
The information required to be disclosed within Schedule II – Valuation and Qualifying Accounts is provided within the Consolidated Financial Statements of the Company filed as part of this Form 10-K.
3. Exhibits
See “Exhibit Index” immediately preceding the signature page of this Form 10-K, which is incorporated herein by reference.
ITEM 16. FORM 10-K SUMMARY
Not applicable.
Report of Independent Registered Public Accounting Firm
To the Shareholders and the Board of Directors of Tile Shop Holdings, Inc. and Subsidiaries
Opinion on the Financial Statements
We have audited the accompanying consolidated balance sheet of Tile Shop Holdings, Inc. and Subsidiaries (the Company) as of December 31, 2023, related consolidated statements of operations, comprehensive income, stockholders’ equity and cash flows, for the year then ended, and the related notes (collectively, the financial statements). In our opinion, the financial statements present fairly, in all material respects, the financial position of the Company as of December 31, 2023, and the results of its operations and its cash flows for the year then ended in conformity with accounting principles generally accepted in the United States of America.
We have also audited, in accordance with the standards of the Public Company Accounting Oversight Board (United States) (PCAOB), the Company's internal control over financial reporting as of December 31, 2023, based on criteria established in Internal Control — Integrated Framework issued by the Committee of Sponsoring Organizations of the Treadway Commission in 2013, and our report dated February 29, 2024 expressed an opinion that the Company had not maintained effective internal control over financial reporting as of December 31, 2023, based on criteria established in Internal Control — Integrated Framework issued by the Committee of Sponsoring Organizations of the Treadway Commission in 2013.
Basis for Opinion
These financial statements are the responsibility of the Company's management. Our responsibility is to express an opinion on the Company's financial statements based on our audit. We are a public accounting firm registered with the PCAOB and are required to be independent with respect to the Company in accordance with U.S. federal securities laws and the applicable rules and regulations of the Securities and Exchange Commission and the PCAOB.
We conducted our audit in accordance with the standards of the PCAOB. Those standards require that we plan and perform the audit to obtain reasonable assurance about whether the financial statements are free of material misstatement, whether due to error or fraud. Our audit included performing procedures to assess the risks of material misstatement of the financial statements, whether due to error or fraud, and performing procedures that respond to those risks. Such procedures included examining, on a test basis, evidence regarding the amounts and disclosures in the financial statements. Our audit also included evaluating the accounting principles used and significant estimates made by management, as well as evaluating the overall presentation of the financial statements. We believe that our audit provides a reasonable basis for our opinion.
Critical Audit Matter
The critical audit matter communicated below is a matter arising from the current period audit of the financial statements that was communicated or required to be communicated to the audit committee and that: (1) relates to accounts or disclosures that are material to the financial statements and (2) involved our especially challenging, subjective or complex judgments. The communication of critical audit matters does not alter in any way our opinion on the financial statements, taken as a whole, and we are not, by communicating the critical audit matter below, providing separate opinions on the critical audit matter or on the accounts or disclosures to which it relates.
Retail Store Asset Impairment Assessment
As discussed in Notes 1, 3 and 6 to the consolidated financial statements, the Company reviews long-lived assets for impairment whenever events or changes in circumstances indicate that the carrying amount of these asset groups may exceed their fair values. The Company evaluates potential impairment losses at the individual retail store level, which is the lowest level at which cash flows can be identified. When events and circumstances indicate that the store assets may be impaired, the Company compares the undiscounted future cash flows estimated to be generated by the retail store to the store’s asset group carrying amount. If the estimated undiscounted future cash flows related to the asset group are less than the carrying value, the Company performs an analysis to estimate the fair value of the asset group. An impairment may be recorded when the fair value of the asset group is less than its carrying value. The Company’s long-lived assets consisted of consolidated property, plant and equipment, net of $64.3 million and consolidated operating lease right of use assets balance of $129.1 million as of December 31, 2023. For the year ended December 31, 2023, the Company recorded an impairment charge of $1.0 million.
Management’s retail store asset impairment analyses involved a high degree of subjectivity due to the significant assumptions utilized in management’s store undiscounted cash flow analysis, including estimates of future revenue growth rates, gross margin, and operating expenses. In addition, significant assumptions are utilized in the store asset fair value analysis, including comparable market rents and discount rates. Given the high estimation uncertainty of management's assumptions, which can be affected by expectations about future market and economic conditions, performing audit procedures to evaluate management’s store undiscounted cash flow analysis and store asset fair value analysis required a high degree of auditor judgment and an increase in the nature and extent an audit effort, including the use of valuation specialists.
Our audit procedures related to management’s retail store asset impairment assessment analyses included the following, among others:
We tested the Company’s estimates of future undiscounted cash flows by store that included, among others, comparing the significant assumptions used by management, such as future revenue growth rates, gross margins, and operating expenses, to historical trends and further evaluated the projections of future cash flows for consistency with current industry and economic trends.
We tested the mathematical accuracy of the Company’s impairment models and tested the underlying data used by management for completeness and accuracy by agreeing it to source data.
We utilized internal valuation specialists to assist with testing management’s estimates of fair value through evaluating both the reasonableness of management’s methodology to determine fair value and the reasonableness of certain significant assumptions used by management, including market rents and discount rates, by comparing them to publicly available market data.
/s/ RSM US LLP
We have served as the Company's auditor since 2023.
Minneapolis, Minnesota
February 29, 2024
Report of Independent Registered Public Accounting Firm
To the Shareholders and the Board of Directors of Tile Shop Holdings, Inc. and Subsidiaries
Opinion on the Internal Control Over Financial Reporting
We have audited Tile Shop Holdings, Inc. and Subsidiaries’ internal control over financial reporting as of December 31, 2023, based on criteria established in Internal Control — Integrated Framework issued by the Committee of Sponsoring Organizations of the Treadway Commission in 2013. In our opinion, because of the effect of the material weaknesses described below on the achievement of the objectives of the control criteria, the Company has not maintained effective internal control over financial reporting as of December 31, 2023, based on criteria established in Internal Control — Integrated Framework issued by the Committee of Sponsoring Organizations of the Treadway Commission in 2013.
We have also audited, in accordance with the standards of the Public Company Accounting Oversight Board (United States) (PCAOB), the consolidated financial statements as of and for the year ended December 31, 2023 of the Company and our report dated February 29, 2024 expressed an unqualified opinion.
A material weakness is a deficiency, or a combination of deficiencies, in internal control over financial reporting, such that there is a reasonable possibility that a material misstatement of the Company's annual or interim financial statements will not be prevented or detected on a timely basis. The following material weaknesses have been identified and included in management's assessment.
There were deficiencies in the design and operation of the Company’s information technology general controls (ITGCs) around user access management, which did not adequately restrict access to the Company’s financial reporting systems, did not ensure appropriate segregation of duties, and did not prevent unauthorized users within the organization from having the ability to create, record, and modify journal entries. These deficiencies in ITGCs also results in the ineffectiveness of manual and automated business process controls that are dependent upon the affected ITGCs.
There were deficiencies in the design and operation of the Company’s controls related to accounting for leases which did not ensure timely recognition of new and modified leases and did not ensure the appropriate review of key inputs underlying certain lease accounting calculations.
These material weaknesses were considered in determining the nature, timing and extent of audit tests applied in our audit of the 2023 financial statements, and this report does not affect our report dated February 29, 2024 on those financial statements.
Basis for Opinion
The Company’s management is responsible for maintaining effective internal control over financial reporting and for its assessment of the effectiveness of internal control over financial reporting in the accompanying Management’s Annual Report on Internal Control over Financial Reporting. Our responsibility is to express an opinion on the Company’s internal control over financial reporting based on our audit. We are a public accounting firm registered with the PCAOB and are required to be independent with respect to the Company in accordance with U.S. federal securities laws and the applicable rules and regulations of the Securities and Exchange Commission and the PCAOB.
We conducted our audit in accordance with the standards of the PCAOB. Those standards require that we plan and perform the audit to obtain reasonable assurance about whether effective internal control over financial reporting was maintained in all material respects. Our audit included obtaining an understanding of internal control over financial reporting, assessing the risk that a material weakness exists, and testing and evaluating the design and operating effectiveness of internal control based on the assessed risk. Our audit also included performing such other procedures as we considered necessary in the circumstances. We believe that our audit provides a reasonable basis for our opinion.
Definition and Limitations of Internal Control Over Financial Reporting
A company's internal control over financial reporting is a process designed to provide reasonable assurance regarding the reliability of financial reporting and the preparation of financial statements for external purposes in accordance with generally accepted accounting principles. A company's internal control over financial reporting includes those policies and procedures that (1) pertain to the maintenance of records that, in reasonable detail, accurately and fairly reflect the transactions and dispositions of the assets of the company; (2) provide reasonable assurance that transactions are recorded as necessary to permit preparation of financial statements in accordance with generally accepted accounting principles, and that receipts and expenditures of the company are being made only in accordance with authorizations of management and directors of the company; and (3) provide reasonable assurance regarding prevention or timely detection of unauthorized acquisition, use or disposition of the company's assets that could have a material effect on the financial statements.
Because of its inherent limitations, internal control over financial reporting may not prevent or detect misstatements. Also, projections of any evaluation of effectiveness to future periods are subject to the risk that controls may become inadequate because of changes in conditions, or that the degree of compliance with the policies or procedures may deteriorate.
/s/
February 29, 2024
Report of Independent Registered Public Accounting Firm
The Board of Directors and Shareholders of
Tile Shop Holdings, Inc. and Subsidiaries
Opinion on the Financial Statements
We have audited the accompanying consolidated balance sheet of Tile Shop Holdings, Inc. and Subsidiaries (the Company) as of December 31, 2022, the related consolidated statements of income, comprehensive income, stockholders’ equity and cash flows for each of the two years in the period ended December 31, 2022, and the related notes (collectively referred to as the “consolidated financial statements”). In our opinion, the consolidated financial statements present fairly, in all material respects, the financial position of the Company at December 31, 2022, and the results of its operations and its cash flows for each of the two years in the period ended December 31, 2022, in conformity with U.S. generally accepted accounting principles.
Basis for Opinion
These financial statements are the responsibility of the Company's management. Our responsibility is to express an opinion on the Company’s financial statements based on our audits. We are a public accounting firm registered with the PCAOB and are required to be independent with respect to the Company in accordance with the U.S. federal securities laws and the applicable rules and regulations of the Securities and Exchange Commission and the PCAOB.
We conducted our audits in accordance with the standards of the PCAOB. Those standards require that we plan and perform the audit to obtain reasonable assurance about whether the financial statements are free of material misstatement, whether due to error or fraud. Our audits included performing procedures to assess the risks of material misstatement of the financial statements, whether due to error or fraud, and performing procedures that respond to those risks. Such procedures included examining, on a test basis, evidence regarding the amounts and disclosures in the financial statements. Our audits also included evaluating the accounting principles used and significant estimates made by management, as well as evaluating the overall presentation of the financial statements. We believe that our audits provide a reasonable basis for our opinion.
We served as the Company’s auditor from 2013 to 2023.
/s/
March 2, 2023
Tile Shop Holdings, Inc. and Subsidiaries
Consolidated Balance Sheets
As of December 31, 2023 and 2022
(dollars in thousands, except per share data)
|
|
|
|
|
|
|
|
|
|
|
|
|
|
|
| December 31, |
| December 31, | ||
|
| 2023 |
| 2022 | ||
Assets |
|
|
|
|
|
|
Current assets: |
|
|
|
|
|
|
Cash and cash equivalents |
| $ | |
| $ | |
Restricted cash |
|
| - |
|
| |
Receivables, net |
|
| |
|
| |
Inventories |
|
| |
|
| |
Income tax receivable |
|
| |
|
| |
Other current assets, net |
|
| |
|
| |
Total Current Assets |
|
| |
|
| |
Property, plant and equipment, net |
|
| |
|
| |
Right of use asset |
|
| |
|
| |
Deferred tax assets |
|
| |
|
| |
Other assets |
|
| |
|
| |
Total Assets |
| $ | |
| $ | |
|
|
|
|
|
|
|
Liabilities and Stockholders' Equity |
|
|
|
|
|
|
Current liabilities: |
|
|
|
|
|
|
Accounts payable |
| $ | |
| $ | |
Income tax payable |
|
| |
|
| |
Current portion of lease liability |
|
| |
|
| |
Other accrued liabilities |
|
| |
|
| |
Total Current Liabilities |
|
| |
|
| |
Long-term debt, net |
|
| - |
|
| |
Long-term lease liability, net |
|
| |
|
| |
Other long-term liabilities |
|
| |
|
| |
Total Liabilities |
|
| |
|
| |
|
|
|
|
|
|
|
Stockholders’ Equity: |
|
|
|
|
|
|
Common stock, par value: $ |
|
| |
|
| |
Preferred stock, par value: $ |
|
|
|
|
|
|
Additional paid-in capital |
|
| |
|
| |
Accumulated deficit |
|
| ( |
|
| ( |
Accumulated other comprehensive loss |
|
| ( |
|
| ( |
Total Stockholders' Equity |
|
| |
|
| |
Total Liabilities and Stockholders' Equity |
| $ | |
| $ | |
|
|
|
|
|
|
|
See accompanying Notes to Consolidated Financial Statements.
Tile Shop Holdings, Inc. and Subsidiaries
Consolidated Statements of Income
For the years ended December 31, 2023, 2022 and 2021
(dollars in thousands, except per share data)
|
|
|
|
|
|
|
|
|
|
|
|
|
|
|
|
|
|
|
|
|
| 2023 |
| 2022 |
| 2021 | |||
Net sales |
| $ | |
| $ | |
| $ | |
Cost of sales |
|
| |
|
| |
|
| |
Gross profit |
|
| |
|
| |
|
| |
Selling, general and administrative expenses |
|
| |
|
| |
|
| |
Income from operations |
|
| |
|
| |
|
| |
Interest expense |
|
| ( |
|
| ( |
|
| ( |
Income before income taxes |
|
| |
|
| |
|
| |
Provision for income taxes |
|
| ( |
|
| ( |
|
| ( |
Net income |
| $ | |
| $ | |
| $ | |
|
|
|
|
|
|
|
|
|
|
Income per common share: |
|
|
|
|
|
|
|
|
|
Basic |
| $ | |
| $ | |
| $ | |
Diluted |
| $ | |
| $ | |
| $ | |
|
|
|
|
|
|
|
|
|
|
Weighted average shares outstanding: |
|
|
|
|
|
|
|
|
|
Basic |
|
| |
|
| |
|
| |
Diluted |
|
| |
|
| |
|
| |
See accompanying Notes to Consolidated Financial Statements.
Tile Shop Holdings, Inc. and Subsidiaries
Consolidated Statements of Comprehensive Income
For the years ended December 31, 2023, 2022 and 2021
(dollars in thousands)
|
|
|
|
|
|
|
|
|
|
|
|
|
|
|
|
|
|
|
|
|
| 2023 |
| 2022 |
| 2021 | |||
Net income |
| $ | |
| $ | |
| $ | |
Currency translation adjustment |
|
| ( |
|
| ( |
|
| |
Other comprehensive (loss) income |
|
| ( |
|
| ( |
|
| |
Comprehensive income |
| $ | |
| $ | |
| $ | |
See accompanying Notes to Consolidated Financial Statements.
Tile Shop Holdings, Inc. and Subsidiaries
Consolidated Statements of Stockholders’ Equity
(dollars in thousands, except per share data)
|
|
|
|
|
|
|
|
|
|
|
|
|
|
|
|
|
|
|
|
|
|
|
|
|
|
|
|
|
|
|
|
|
|
|
|
| Common stock |
|
|
|
|
|
|
|
|
|
|
|
| ||||
|
| Shares |
| Amount |
| Additional |
| Accumulated deficit |
| Accumulated other |
| Total | |||||
Balance at January 1, 2021 |
| |
| $ | |
| $ |
| $ | ( |
| $ | ( |
| $ | | |
Issuance of restricted shares |
| |
|
| - |
|
| - |
|
| - |
|
| - |
|
| - |
Cancellation of restricted shares |
| ( |
|
| - |
|
| - |
|
| - |
|
| - |
|
| - |
Stock based compensation |
| - |
|
| - |
|
| |
|
| - |
|
| - |
|
| |
Tax withholdings related to net share settlements of stock based compensation awards |
| ( |
|
| - |
|
| ( |
|
| - |
|
| - |
|
| ( |
Dividends paid ($ |
| - |
|
| - |
|
| ( |
|
| - |
|
| - |
|
| ( |
Foreign currency translation adjustments |
| - |
|
| - |
|
| - |
|
| - |
|
| |
|
| |
Net income |
| - |
|
| - |
|
| - |
|
| |
|
| - |
|
| |
Balance at December 31, 2021 |
| |
| $ | |
| $ |
| $ | ( |
| $ | |
| $ | | |
Issuance of restricted shares |
| |
|
| - |
|
| - |
|
| - |
|
| - |
|
| - |
Cancellation of restricted shares |
| ( |
|
| - |
|
| - |
|
| - |
|
| - |
|
| - |
Stock based compensation |
| - |
|
| - |
|
| |
|
| - |
|
| - |
|
| |
Tax withholdings related to net share settlements of stock based compensation awards |
| ( |
|
| - |
|
| ( |
|
| - |
|
| - |
|
| ( |
Repurchases of common stock |
| ( |
|
| ( |
|
| - |
|
| ( |
|
| - |
|
| ( |
Foreign currency translation adjustments |
| - |
|
| - |
|
| - |
|
| - |
|
| ( |
|
| ( |
Net income |
| - |
|
| - |
|
| - |
|
| |
|
| - |
|
| |
Balance at December 31, 2022 |
| |
| $ | |
| $ |
| $ | ( |
| $ | ( |
| $ | | |
Issuance of restricted shares |
| |
|
| - |
|
| - |
|
| - |
|
| - |
|
| - |
Issuance of common stock upon exercise of options |
| |
|
| - |
|
| |
|
| - |
|
| - |
|
| |
Cancellation of restricted shares |
| ( |
|
| - |
|
| - |
|
| - |
|
| - |
|
| - |
Stock based compensation |
| - |
|
| - |
|
| |
|
| - |
|
| - |
|
| |
Tax withholdings related to net share settlements of stock based compensation awards |
| ( |
|
| - |
|
| ( |
|
| - |
|
| - |
|
| ( |
Foreign currency translation adjustments |
| - |
|
| - |
|
| - |
|
| - |
|
| ( |
|
| ( |
Net income |
| - |
|
| - |
|
| - |
|
| |
|
| - |
|
| |
Balance at December 31, 2023 |
| |
| $ | |
| $ |
| $ | ( |
| $ | ( |
| $ | | |
|
|
|
|
|
|
|
|
|
|
|
|
|
|
|
|
|
|
See accompanying Notes to Consolidated Financial Statements.
Tile Shop Holdings, Inc. and Subsidiaries
Consolidated Statements of Cash Flows
For the years ended December 31, 2023, 2022 and 2021
(dollars in thousands)
|
|
|
|
|
|
|
|
|
|
|
|
|
|
|
|
|
|
|
|
|
| For the years ended, | |||||||
|
| 2023 |
| 2022 |
| 2021 | |||
Cash Flows From Operating Activities |
|
|
|
|
|
|
|
|
|
Net income |
| $ | |
| $ | |
| $ | |
Adjustments to reconcile net income to net cash provided by operating activities: |
|
|
|
|
|
|
|
|
|
Depreciation and amortization |
|
| |
|
| |
|
| |
Amortization of debt issuance costs |
|
| |
|
| |
|
| |
(Gain) loss on disposals of property, plant and equipment |
|
| ( |
|
| - |
|
| |
Impairment charges |
|
| |
|
| |
|
| |
Non-cash lease expense |
|
| |
|
| |
|
| |
Stock based compensation |
|
| |
|
| |
|
| |
Deferred income taxes |
|
| |
|
| |
|
| ( |
Changes in operating assets and liabilities: |
|
|
|
|
|
|
|
|
|
Receivables |
|
| |
|
| ( |
|
| ( |
Inventories |
|
| |
|
| ( |
|
| ( |
Other current assets, net |
|
| |
|
| ( |
|
| ( |
Accounts payable |
|
| |
|
| ( |
|
| |
Income tax receivable / payable |
|
| |
|
| |
|
| |
Accrued expenses and other liabilities |
|
| ( |
|
| ( |
|
| ( |
Net cash provided by operating activities |
|
| |
|
| |
|
| |
Cash Flows From Investing Activities |
|
|
|
|
|
|
|
|
|
Purchases of property, plant and equipment |
|
| ( |
|
| ( |
|
| ( |
Proceeds from the sale of property, plant and equipment |
|
| |
|
| - |
|
| - |
Net cash used in investing activities |
|
| ( |
|
| ( |
|
| ( |
Cash Flows From Financing Activities |
|
|
|
|
|
|
|
|
|
Payments of long-term debt and financing lease obligations |
|
| ( |
|
| ( |
|
| ( |
Advances on line of credit |
|
| |
|
| |
|
| |
Dividends paid |
|
| - |
|
| - |
|
| ( |
Proceeds from exercise of stock options |
|
| |
|
| - |
|
| - |
Repurchases of common stock |
|
| - |
|
| ( |
|
| - |
Employee taxes paid for shares withheld |
|
| ( |
|
| ( |
|
| ( |
Debt issuance costs |
|
| - |
|
| ( |
|
| - |
Net cash (used in) provided by financing activities |
|
| ( |
|
| |
|
| ( |
Effect of exchange rate changes on cash |
|
| ( |
|
| ( |
|
| |
Net change in cash, cash equivalents and restricted cash |
|
| |
|
| ( |
|
| ( |
Cash, cash equivalents and restricted cash beginning of period |
|
| |
|
| |
|
| |
Cash, cash equivalents and restricted cash end of period |
| $ | |
| $ | |
| $ | |
|
|
|
|
|
|
|
|
|
|
Cash and cash equivalents |
| $ | |
| $ | |
| $ | |
Restricted cash |
|
| - |
|
| |
|
| |
Cash, cash equivalents and restricted cash end of period |
| $ | |
| $ | |
| $ | |
|
|
|
|
|
|
|
|
|
|
Supplemental disclosure of cash flow information |
|
|
|
|
|
|
|
|
|
Purchases of property, plant and equipment included in accounts payable and accrued expenses |
| $ | |
| $ | |
| $ | |
Cash paid for interest |
|
| |
|
| |
|
| |
Cash (received) paid for income taxes, net of refunds |
|
| ( |
|
| |
|
| |
See accompanying Notes to Consolidated Financial Statements.
Tile Shop Holdings, Inc. and Subsidiaries
Notes to Consolidated Financial Statements
The Tile Shop, LLC (“The Tile Shop”) was founded in 1985 and Tile Shop Holdings, Inc. (“Holdings,” and together with its wholly owned subsidiaries, including The Tile Shop, the “Company”) was incorporated in Delaware in June 2012. The Company is a specialty retailer of natural stone, man-made and luxury vinyl tiles, setting and maintenance materials, and related accessories in the United States. The Company’s assortment includes over
The consolidated financial statements of Holdings include the accounts of its wholly owned subsidiaries and variable interest entities for which the Company is the primary beneficiary. All significant intercompany transactions have been eliminated in consolidation.
The preparation of financial statements in conformity with generally accepted accounting principles in the United States (“GAAP”) requires management to make estimates and assumptions that affect the amounts reported in the consolidated financial statements. The Company’s estimates and judgments are based on historical experience and various other assumptions that it believes are reasonable under the circumstances. The amount of assets and liabilities reported on the Company's balance sheets and the amounts of income and expenses reported for each of the periods presented are affected by estimates and assumptions, which are used for, but not limited to, the accounting for revenue recognition and related reserves for sales returns, useful lives of property, plant and equipment, determining impairment of property, plant and equipment and right of use assets, accounting for leases, valuation of inventory, and income taxes. Actual results may differ from these estimates.
The Company had cash and cash equivalents of $
Cash and cash equivalents that are restricted as to withdrawal or are under the terms of use for current operations are included in the restricted balance on the balance sheet.
Trade receivables are carried at original invoice amount less an estimate made for doubtful accounts. Management determines the allowance for doubtful accounts on a specific identification basis and by leveraging information on historical losses, current conditions, and reasonable and supportable forecasts of future conditions. Trade receivables are written off when deemed uncollectible. Recoveries of trade receivables previously written off are recorded when received. The allowance for doubtful accounts was $
The Company’s inventory consists of manufactured items and purchased merchandise held for resale. Inventories are stated at the lower of cost (determined using the moving average cost method) or net realizable value. The Company capitalizes the cost of
Tile Shop Holdings, Inc. and Subsidiaries
Notes to Consolidated Financial Statements
inbound freight, duties, and receiving and handling costs to bring purchased materials into its distribution network. The labor and overhead costs incurred in connection with the production process are included in the value of manufactured finished goods.
Inventories were comprised of the following as of December 31:
|
|
|
|
|
|
|
|
|
|
|
|
|
|
|
| 2023 |
| 2022 | ||
|
| (in thousands) | ||||
Finished goods |
| $ |
| $ | ||
Raw materials |
|
|
|
| ||
Total |
| $ |
| $ | ||
The Company provides provisions for losses related to shrinkage and other amounts that are otherwise not expected to be fully recoverable. These provisions are calculated based on historical shrinkage, selling price, margin and current business trends. These estimates have calculations that require management to make assumptions based on the current rate of sales, age, salability and profitability of inventory, historical percentages that can be affected by changes in our merchandising mix, customer preferences, rates of sell through and changes in actual shrinkage trends. The provision for losses related to shrinkage and other amounts was $
The Company recognizes deferred tax liabilities and assets for the expected future tax consequences of events that have been included in the financial statements or tax returns. Deferred tax liabilities and assets are determined based on the difference between the financial statement basis and tax basis of assets and liabilities using enacted tax rates in effect for the year in which the differences are expected to reverse. The Company estimates the degree to which tax assets and credit carryforwards will result in a benefit based on expected profitability by tax jurisdiction. A valuation allowance for such tax assets and loss carryforwards is provided when it is determined to be more likely than not that the benefit of such deferred tax asset will not be realized in future periods. If it becomes more likely than not that a tax asset will be used, the related valuation allowance on such assets would be reduced.
The Company records interest and penalties relating to uncertain tax positions in income tax expense. As of December 31, 2023 and 2022, the Company has
Revenues are recognized when control of the promised goods or services is transferred to the Company’s customers, in an amount that reflects the consideration received in exchange for those goods or services. The Company recognizes service revenue, which consists primarily of freight charges for home delivery, when the service has been rendered. The Company is required to charge and collect sales and other taxes on sales to the Company's customers and remit these taxes back to government authorities. Total revenues do not include sales tax because the Company is a pass-through conduit for collecting and remitting sales tax. Sales are reduced by an allowance for anticipated sales returns that the Company estimates based on historical returns.
The Company generally requires customers to pay a deposit when purchasing inventory that is not regularly carried at the store location, or not currently in stock. These deposits are included in other current accrued liabilities until the customer takes possession of the merchandise.
Customers may return purchased items for an exchange or refund. The process to establish a sales return reserve contains uncertainties because it requires management to make assumptions and to apply judgment to estimate future returns and exchanges. The customer may receive a refund or exchange the original product for a replacement of equal or similar quality for a period of
Tile Shop Holdings, Inc. and Subsidiaries
Notes to Consolidated Financial Statements
The primary costs classified in each major expense category are:
Cost of Sales
Materials cost;
Shipping and transportation expenses to bring products into the Company's distribution centers;
Customs and duty expenses;
Customer shipping and handling expenses;
Physical inventory losses;
Costs incurred at distribution centers in connection with the receiving process; and
Labor and overhead costs incurred to manufacture inventory
Selling, General & Administrative (sometimes referred to as “SG&A”) Expenses
All compensation costs for store, corporate and distribution employees;
Occupancy, utilities and maintenance costs of store and corporate facilities;
Shipping and transportation expenses to move inventory from the Company's distribution centers to the Company's stores;
Depreciation and amortization; and
Advertising costs
The Company recognizes expense for its stock based compensation based on the fair value of the awards on the grant date. The Company may issue incentive awards in the form of stock options, restricted stock awards and other equity awards to employees and non-employee directors. Compensation expense is recognized on a straight-line basis over the requisite service period, net of actual forfeitures. Certain awards are also subject to forfeiture if the Company fails to attain its Adjusted EBITDA or Pretax Return on Capital Employed targets. The Company adjusts the cumulative expense recognized on awards with performance conditions based on a probability of achieving the performance condition.
Financial instruments that potentially subject the Company to concentrations of credit risk consist principally of cash and cash equivalents and bank deposits. By their nature, all such instruments involve risks, including credit risks of non-performance by counterparties. A substantial portion of the Company's cash and cash equivalents and bank deposits are invested with banks with high investment grade credit ratings.
Supplier Concentration
The Company purchases merchandise inventories from approximately
The Company’s operations consist primarily of retail sales of natural stone, man-made and luxury vinyl tiles, setting and maintenance materials, and related accessories in stores located in the United States. The Company’s chief operating decision maker only reviews the consolidated results of the Company and accordingly, the Company has concluded it has
Advertising costs were $
Tile Shop Holdings, Inc. and Subsidiaries
Notes to Consolidated Financial Statements
Company’s advertising consists primarily of digital media, direct marketing, events, traditional print media and mobile advertisements and is expensed at the time the media is distributed.
The Company’s pre-opening costs are those typically associated with the opening of a new store and generally include rent expense, compensation costs and promotional costs. The Company expenses pre-opening costs as incurred which are recorded in selling, general and administrative expenses. During both the years ended December 31, 2023 and 2021, the Company recorded pre-opening costs of $
Property, plant and equipment and leasehold improvements are recorded at cost. Improvements are capitalized while repairs and maintenance costs are charged to selling, general and administrative expenses when incurred. Property, plant and equipment are depreciated or amortized using the straight-line method over each asset’s estimated useful life. Leasehold improvements and fixtures at leased locations are amortized using the straight-line method over the shorter of the lease term or the estimated useful life of the asset. The cost and accumulated depreciation of assets sold or otherwise disposed of are removed from the accounts and any gain or loss thereon is included in other income and expense.
|
|
|
|
|
|
|
|
|
|
|
| Asset life (in years) | ||
Buildings and building improvements |
|
|
| |
Leasehold improvements |
| – | ||
Furniture and fixtures |
| – | ||
Machinery and equipment |
| – | ||
Computer equipment and software |
| – | ||
Vehicles |
|
|
| |
The Company evaluates potential impairment losses on long-lived assets used in operations at the individual retail store level, which is the lowest level at which cash flows can be identified, when events and circumstances indicate that the assets may be impaired, and the undiscounted cash flows estimated to be generated by those assets are less than the carrying amounts of those assets. If impairment exists and the undiscounted cash flows estimated to be generated by those assets are less than the carrying amount of those assets, an impairment loss is recorded based on the excess of the carrying value of the asset group over its fair value. Fair value is measured using discounted cash flows or independent opinions of value, as appropriate. During the fiscal years ended December 31, 2023, 2022 and 2021, the Company recorded asset impairment charges of $
The Company capitalizes software development costs incurred during the application development stage related to new software or major enhancements to the functionality of existing software that is developed solely to meet the Company’s internal operational needs and when there are no plans to market the software externally. Costs capitalized include external direct costs of materials and services and internal compensation costs. Any costs during the preliminary project stage or related to training or maintenance are expensed as incurred. Capitalization ceases when the software project is substantially complete and ready for its intended use. The capitalization and ongoing assessment of recoverability of development costs requires judgment by management with respect to certain external factors, including, but not limited to, technological and economic feasibility, and estimated economic life. As of December 31, 2023 and 2022, $
The Company licenses software for internal use from third parties. The Company accounts for costs associated with software contracts considered cloud computing arrangements as operating expenses. If a software contract gives the Company the right and it is feasible to take possession of the software, the Company recognizes an asset for the entire contractual cost and recognizes a liability for future payments under the license agreement.
The Company has contractual obligations related to software service arrangements with suppliers for fixed or minimum amounts. Future minimum payments at December 31, 2023 for purchase obligations were $
Tile Shop Holdings, Inc. and Subsidiaries
Notes to Consolidated Financial Statements
arrangements in 2024, 2025, 2026, 2027 and 2028 total $
The Company determines if an arrangement is a lease at inception. Operating leases are included in right of use assets and lease liabilities on the consolidated balance sheets. The right of use assets and lease liabilities are recognized as the present value of the future minimum lease payments over the lease term at commencement date. As most of the leases do not provide an implicit rate, the Company uses its incremental borrowing rate based on the information available at commencement date in determining the present value of future payments. The right of use asset is also adjusted for any lease incentives received pursuant to the lease agreement. The Company’s lease terms may include options to extend or terminate the lease typically at its own discretion. The Company regularly evaluates the renewal options and when such options are reasonably certain of exercise, the Company includes the renewal period in its lease term. The Company does not apply the recognition requirements to short term leases.
Certain lease arrangements contain provisions requiring the Company to restore the leased property to its original condition at the end of the lease. The fair values of these obligations are recorded as liabilities on a discounted basis, which occurs at the time the Company enters into the lease arrangement. In the estimation of fair value, the Company uses assumptions and judgements regarding such factors as the existence of a legal obligation for an asset retirement obligation, estimated amounts and timing of settlements, discount rates and inflation rates. The costs associated with these liabilities are capitalized and depreciated over the lease term and the liabilities are accreted over the same period. Asset retirement obligations attributable to leases with a remaining lease term of 12 months or less are presented as other accrued liabilities. As of December 31, 2023 and 2022, asset retirement obligations classified as other accrued liabilities were $
The Company is self-insured for certain employee health and workers’ compensation claims. The Company estimates a liability for aggregate losses below stop-loss coverage limits based on estimates of the ultimate costs to be incurred to settle known claims and claims not reported as of the balance sheet date. The estimated liability is not discounted and is based on a number of assumptions and factors including historical trends, and economic conditions. As of both December 31, 2023 and 2022, an accrual of $
The Company has standby letters of credit outstanding related to the Company's workers’ compensation and employee health insurance policies. As of December 31, 2023 and 2022, the standby letters of credit totaled $
Revenues are recognized when control of the promised goods or services is transferred to the Company’s customers, in an amount that reflects the consideration received in exchange for those goods or services. Sales taxes are excluded from revenue.
The following table presents revenues disaggregated by product category:
|
|
|
|
|
|
|
|
|
|
|
|
|
|
|
| Years Ended December 31, | ||||
|
| 2023 |
|
| 2022 |
|
Man-made tiles |
| % |
| % | ||
Natural stone tiles |
|
|
|
| ||
Setting and maintenance materials |
|
|
|
| ||
Accessories |
|
|
|
| ||
Delivery service |
|
|
|
| ||
|
| % |
| % | ||
Tile Shop Holdings, Inc. and Subsidiaries
Notes to Consolidated Financial Statements
The Company generates revenues by selling tile products, setting and maintenance materials, accessories, and delivery services to its customers through its store locations. The timing of revenue recognition coincides with the transfer of control of goods and services ordered by the customer, which falls into one of three categories described below:
Revenue recognized when an order is placed – If a customer places an order in a store and the contents of their order are available, the Company recognizes revenue concurrent with the exchange of goods for consideration from the customer.
Revenue recognized when an order is picked up – If a customer places an order for items held in a centralized distribution center, the Company requests a deposit from the customer at the time they place the order. Subsequently when the contents of the customer’s order are delivered to the store, the customer returns to the store and picks up the items that were ordered. The Company recognizes revenue on this transaction when the customer picks up their order.
Revenue recognized when an order is delivered – If a customer places an order in a store and requests delivery of their order, the Company prepares the contents of their order, initiates the delivery service, and recognizes revenue once the contents of the customer’s order are delivered.
The Company determines the transaction price of its contracts based on the pricing established at the time a customer places an order. The transaction price does not include sales tax as the Company is a pass-through conduit for collecting and remitting sales tax. Any discounts applied to an order are allocated proportionately to the base price of the goods and services ordered. Deposits made by customers are recorded in other accrued liabilities. Deferred revenues associated with customer deposits are recognized at the time the Company transfers control of the items ordered or renders the delivery service. In the event an order is partially fulfilled as of the end of a reporting period, revenue will be recognized based on the transaction price allocated to the goods delivered and services rendered. The customer deposit balance was $
The Company extends financing to qualified professional customers who apply for credit. The accounts receivable balance was $
Customers may return purchased items for an exchange or refund. The Company records a reserve for estimated product returns based on the historical returns trends and the current product sales performance. The Company presents the sales returns reserve as an other current accrued liability and the estimated value of the inventory that will be returned as an other current asset in the Consolidated Balance Sheet. The components of the sales returns reserve reflected in the Consolidated Balance Sheet as of December 31, 2023 and 2022 are as follows:
|
|
|
|
|
|
|
|
|
|
|
|
|
|
|
| December 31, |
| December 31, | ||
|
| 2023 |
| 2022 | ||
|
| (in thousands) | ||||
Other current accrued liabilities |
| $ | |
| $ | |
Other current assets |
|
| |
|
| |
Sales returns reserve, net |
| $ | |
| $ | |
Tile Shop Holdings, Inc. and Subsidiaries
Notes to Consolidated Financial Statements
Note 3: Property, Plant and Equipment
Property, plant and equipment consisted of the following at December 31:
|
|
|
|
|
|
|
|
|
|
|
|
|
|
|
| 2023 |
| 2022 | ||
|
| (in thousands) | ||||
Land |
| $ | |
| $ | |
Building and building improvements |
|
| |
|
| |
Leasehold improvements |
|
| |
|
| |
Furniture and fixtures |
|
| |
|
| |
Machinery and equipment |
|
| |
|
| |
Computer equipment and software |
|
| |
|
| |
Vehicles |
|
| |
|
| |
Construction in progress |
|
| |
|
| |
Total property, plant and equipment |
|
| |
|
| |
Less accumulated depreciation |
|
| ( |
|
| ( |
Total property, plant and equipment, net |
| $ | |
| $ | |
Depreciation expense on property and equipment, including financing leases, was $
Other accrued liabilities consisted of the following at December 31:
|
|
|
|
|
|
|
|
|
|
|
|
|
|
|
| 2023 |
| 2022 | ||
|
| (in thousands) | ||||
Customer deposits |
| $ |
| $ | ||
Sales returns reserve |
|
|
|
| ||
Accrued wages and salaries |
|
|
|
| ||
Payroll and sales taxes |
|
|
|
| ||
Other current liabilities |
|
|
|
| ||
Total other accrued liabilities |
| $ |
| $ | ||
Long-term debt, net of debt issuance costs, consisted of the following at December 31:
|
|
|
|
|
|
|
|
|
|
|
|
|
|
|
| 2023 |
| 2022 | ||
|
| (in thousands) | ||||
Total debt obligations |
| $ | - |
| $ | |
Less: current portion |
|
| - |
|
| - |
Debt obligations, net of current portion |
| $ | - |
| $ | |
On
The Credit Agreement is secured by virtually all of the assets of the Company, including, but not limited to, inventory, accounts receivable, equipment and general intangibles. The Credit Agreement contains customary events of default, conditions to borrowing and restrictive covenants, including restrictions on the Company’s ability to dispose of assets, engage in acquisitions or mergers, make
Tile Shop Holdings, Inc. and Subsidiaries
Notes to Consolidated Financial Statements
distributions on or repurchases of capital stock, incur additional debt, incur liens or make investments. The Credit Agreement also includes financial and other covenants, including covenants to maintain a Fixed Charge Coverage Ratio (as defined in the Credit Agreement) of no less than
The Company leases its retail stores, certain distribution space, and office space. Leases generally have a term of to
|
|
|
|
|
|
|
|
Leases (in thousands) | Classification |
|
| December 31, 2023 |
|
| December 31, 2022 |
Assets |
|
|
|
|
|
|
|
Operating lease assets | Right of use asset |
| $ | |
| $ | |
Total leased assets |
|
| $ | |
| $ | |
|
|
|
|
|
|
|
|
Liabilities |
|
|
|
|
|
|
|
Current |
|
|
|
|
|
|
|
Operating | Current portion of lease liability |
| $ | |
| $ | |
Noncurrent |
|
|
|
|
|
|
|
Operating | Long-term lease liability, net |
|
| |
|
| |
Total lease liabilities |
|
| $ | |
| $ | |
|
|
|
|
|
|
|
|
|
|
|
| Year Ended December 31, | |||
Lease cost (in thousands) | Classification |
|
| 2023 |
|
| 2022 |
Operating lease cost | SG&A expenses |
| $ | |
| $ | |
Variable lease cost(1) | SG&A expenses |
|
| |
|
| |
Short term lease cost | SG&A expenses |
|
| |
|
| |
Net lease cost |
|
| $ | |
| $ | |
(1) Variable lease costs consist primarily of taxes, insurance, and common area or other maintenance costs for the Company’s leased facilities.
|
|
|
|
Maturity of Lease Liabilities (in thousands) |
| Operating Leases | |
2024 |
| $ | |
2025 |
|
| |
2026 |
|
| |
2027 |
|
| |
2028 |
|
| |
Thereafter |
|
| |
Total lease payments |
|
| |
Less: interest |
|
| ( |
Present value of lease liabilities |
| $ | |
|
|
|
|
|
|
|
|
|
| Year Ended December 31, | |||
Other Information (in thousands) |
|
| 2023 |
|
| 2022 |
Cash paid for amounts included in the measurement of lease liabilities |
|
|
|
|
|
|
Operating cash flows from operating leases |
| $ | ( |
| $ | ( |
Lease right-of-use assets obtained or modified in exchange for lease obligations |
| $ | |
| $ | |
Tile Shop Holdings, Inc. and Subsidiaries
Notes to Consolidated Financial Statements
|
|
|
|
|
|
|
|
Lease Term and Discount Rate |
|
| December 31, 2023 |
|
| December 31, 2022 |
|
Weighted average remaining term (years) |
|
|
|
|
|
|
|
Operating leases |
|
| |
|
| |
|
Weighted average discount rate |
|
|
|
|
|
|
|
Operating leases |
|
| | % |
| | % |
Fair value is the price that would be received to sell an asset or paid to transfer a liability (an exit price) in the principal or most advantageous market for the asset or liability in an orderly transaction between market participants on the measurement date. To measure fair value, the Company uses a three-tier valuation hierarchy based upon observable and non-observable inputs:
Level 1 – Unadjusted quoted prices that are available in active markets for the identical assets or liabilities at the measurement date.
Level 2 – Significant other observable inputs available at the measurement date, other than quoted prices included in Level 1, either directly or indirectly, including:
Quoted prices for similar assets or liabilities in active markets;
Quoted prices for identical or similar assets or liabilities in non-active markets;
Inputs other than quoted prices that are observable for the asset or liability; and
Inputs that are derived principally from or corroborated by other observable market data.
Level 3 – Significant unobservable inputs that cannot be corroborated by observable market data and reflect the use of significant management judgment.
The following table sets forth by level within the fair value hierarchy the Company’s financial assets that were accounted for at fair value on a recurring basis at December 31, 2023 and 2022 according to the valuation techniques the Company uses to determine their fair values. There have been no transfers of assets among the fair value hierarchies presented.
|
|
|
|
|
|
|
|
|
|
|
|
|
|
|
|
|
|
|
| Pricing |
| Fair Value at | ||||
|
| Category |
| December 31, 2023 |
| December 31, 2022 | ||
Assets |
|
|
| (in thousands) | ||||
Cash and cash equivalents |
| Level 1 |
| $ | |
| $ | |
Restricted cash |
| Level 1 |
|
| - |
|
| |
The following methods and assumptions were used to estimate the fair value of each class of financial instrument. There have been no changes in the valuation techniques used by the Company to value the Company’s financial instruments.
Cash and cash equivalents: Consists of cash on hand and bank deposits. The value was measured using quoted market prices in active markets. The carrying amount approximates fair value.
Restricted cash: Consists of cash and cash equivalents held in bank deposit accounts restricted as to withdrawal or that are under the terms of use for current operations. The value was measured using quoted market prices in active markets. The carrying amount approximates fair value.
The carrying value of accounts receivable and accounts payable approximates their estimated fair values due to the short maturities of these instruments.
Tile Shop Holdings, Inc. and Subsidiaries
Notes to Consolidated Financial Statements
Fair value measurements also apply to certain non-financial assets and liabilities measured at fair value on a nonrecurring basis. Property, plant and equipment and right of use assets are measured at fair value when an impairment is recognized and the related assets are written down to fair value. During the years ended December 31, 2023, 2022 and 2021, the Company recognized charges in selling, general, and administrative expenses to write-down property, plant, and equipment and right of use assets to their estimated fair values of $
|
|
|
|
|
|
|
|
|
|
|
|
|
|
| Fair Value |
| Valuation Technique |
| Category |
| Input |
| Range |
Right of use assets (1) |
| $ | |
| Discounted cash flow |
| Level 2 |
| Market rental rates |
| $ |
|
|
|
|
|
|
| Level 2 |
| Discount rate |
| |
Property, plant and equipment (1) |
| $ | - |
| Discounted cash flow |
| Level 3 |
| Revenue growth rate |
| |
|
|
|
|
|
|
| Level 3 |
| Discount rate |
|
(1)The fair value specifically relates to only those locations which had impairment charges during the twelve months ended December 31, 2023.
During the twelve months ended December 31, 2023, the Company recorded a $
Basic earnings per share is calculated by dividing net income by the weighted average number of shares outstanding during the period. Diluted earnings per share is calculated by dividing net income by the weighted average number of common shares outstanding, after taking into consideration all dilutive potential common shares outstanding during the period.
Basic and diluted net income per share was calculated as follows:
|
|
|
|
|
|
|
|
|
|
|
|
|
|
|
|
|
|
|
|
|
| 2023 |
| 2022 |
| 2021 | |||
|
| (in thousands, except share and per share data) | |||||||
Net income |
| $ | |
| $ | |
| $ | |
Weighted average shares outstanding - basic |
|
| |
|
| |
|
| |
Effect of dilutive securities attributable to stock based awards |
|
| |
|
| |
|
| |
Weighted average shares outstanding - diluted |
|
| |
|
| |
|
| |
Basic net income per share |
| $ | |
| $ | |
| $ | |
Diluted net income per share |
| $ | |
| $ | |
| $ | |
Anti-dilutive securities excluded from earnings per share calculation |
|
| |
|
| |
|
| |
Equity Plans:
On July 20, 2021, the stockholders of the Company approved the Tile Shop Holdings, Inc. 2021 Omnibus Equity Compensation Plan (the “2021 Plan”). The 2021 Plan replaced the 2012 Omnibus Award Plan (the “Prior Plan”). Awards granted under the Prior Plan that were outstanding on the date of stockholder approval remained outstanding in accordance with their terms. The maximum number of shares that may be delivered with respect to awards under the 2021 Plan is
Tile Shop Holdings, Inc. and Subsidiaries
Notes to Consolidated Financial Statements
without the issuance of shares or an award is settled only in cash, the shares subject to such awards granted but not delivered will be added to the number of shares available for awards under the 2021 Plan.
Stock Options:
During the years ended December 31, 2023, 2022 and 2021, the Company did
Stock based compensation related to options for the years ended December 31, 2023, 2022 and 2021 was less than $
The following table summarizes stock option activity during the years ended December 31, 2023, 2022 and 2021:
|
|
|
|
|
|
|
|
|
|
|
|
|
|
|
|
|
|
|
|
|
|
|
|
|
|
|
|
|
| Shares |
| Weighted |
| Weighted Avg. Grant Date Fair Value |
| Weighted Avg. |
| Aggregate | |||
Balance, January 1, 2021 |
| |
| $ | |
| $ | |
| |
| $ | - |
Granted |
| - |
| $ | - |
| $ | - |
|
|
|
|
|
Exercised |
| - |
| $ | - |
| $ | - |
|
|
|
|
|
Cancelled/Forfeited |
| ( |
| $ | |
| $ | |
|
|
|
|
|
Balance, December 31, 2021 |
| |
| $ | |
| $ | |
| |
| $ | |
Granted |
| - |
| $ | - |
| $ | - |
|
|
|
|
|
Exercised |
| - |
| $ | - |
| $ | - |
|
|
|
|
|
Cancelled/Forfeited |
| ( |
| $ | |
| $ | |
|
|
|
|
|
Balance, December 31, 2022 |
| |
| $ | |
| $ | |
| |
| $ | - |
Granted |
| - |
| $ | - |
| $ | - |
|
|
|
|
|
Exercised |
| ( |
| $ | |
| $ | |
|
|
|
|
|
Cancelled/Forfeited |
| ( |
| $ | |
| $ | |
|
|
|
|
|
Balance, December 31, 2023 |
| |
| $ | |
| $ | |
| |
| $ | |
Exercisable at December 31, 2023 |
| |
| $ | |
| $ | |
|
|
| $ | - |
Vested and expected to vest, December 31, 2023 |
| |
| $ | |
| $ | |
|
|
| $ | |
The aggregate intrinsic value is the difference between the exercise price and the closing price of the Company’s stock on December 31.
Tile Shop Holdings, Inc. and Subsidiaries
Notes to Consolidated Financial Statements
Restricted Stock:
The Company awards restricted common shares to selected employees and non-employee directors. Recipients are not required to provide any consideration upon vesting of the award. Restricted stock awards are subject to certain restrictions on transfer, and all or part of the shares awarded may be subject to forfeiture upon the occurrence of certain events, including employment termination. Certain awards are also subject to forfeiture if the Company fails to attain its Adjusted EBITDA or Pretax Return on Capital Employed performance targets. The restricted common stock is valued at its grant date fair value and expensed over the requisite service period or the vesting term of the awards. The Company adjusts the cumulative expense recognized on awards with performance conditions based on the probability of achieving the performance condition.
The following table summarizes restricted stock activity during the years ended December 31, 2023, 2022 and 2021:
|
|
|
|
|
|
|
|
|
|
|
|
|
| Shares |
| Weighted Avg. | |
Nonvested, January 1, 2021 |
| |
| $ | |
Granted |
| |
| $ | |
Vested |
| ( |
| $ | |
Forfeited |
| ( |
| $ | |
Nonvested, December 31, 2021 |
| |
| $ | |
Granted |
| |
| $ | |
Vested |
| ( |
| $ | |
Forfeited |
| ( |
| $ | |
Nonvested, December 31, 2022 |
| |
| $ | |
Granted |
| |
| $ | |
Vested |
| ( |
| $ | |
Forfeited |
| ( |
| $ | |
Nonvested, December 31, 2023 |
| |
| $ | |
The total expense associated with restricted stock for the years ended December 31, 2023, 2022, and 2021 was $
During 2021, the Company granted restricted share awards subject to forfeiture on the date the Company files its annual report on Form 10-K for each of the 2021, 2022 and 2023 fiscal years if the Company fails to attain certain Adjusted EBITDA margin performance targets in 2021, 2022 and 2023. In 2022, the Company granted restricted share awards subject to forfeiture on the date the Company files its annual report on Form 10-K for each of the 2022, 2023 and 2024 fiscal years if the Company fails to attain certain Pretax Return on Capital Employed performance targets in 2022, 2023 and 2024. In 2023, the Company granted restricted share awards subject to forfeiture on the date the Company files its annual report on Form 10-K for each of the 2023, 2024 and 2025 fiscal years if the Company fails to attain certain Pretax Return on Capital Employed performance targets in 2023, 2024 and 2025. The Company did not attain any of the Adjusted EBITDA or Pretax Return on Capital Employed performance measures in 2023, and accordingly, did not record any expense in connection with the performance share awards in 2023. The Company anticipates cancelling
As of December 31, 2023, there was $
Tile Shop Holdings, Inc. and Subsidiaries
Notes to Consolidated Financial Statements
The components of the provision for income taxes consisted of the following:
|
|
|
|
|
|
|
|
|
|
|
|
|
|
|
|
|
|
|
|
|
| Years Ended December 31, | |||||||
|
| 2023 |
| 2022 |
| 2021 | |||
|
| (in thousands) | |||||||
Current |
|
|
|
|
|
|
|
|
|
Federal |
| $ | ( |
| $ | ( |
| $ | ( |
State |
|
| ( |
|
| ( |
|
| ( |
International |
|
| - |
|
| - |
|
| ( |
Total Current |
|
| ( |
|
| ( |
|
| ( |
Deferred |
|
|
|
|
|
|
|
|
|
Federal |
|
| ( |
|
| ( |
|
| |
State |
|
| ( |
|
| ( |
|
| ( |
International |
|
| - |
|
| ( |
|
| |
Total Deferred |
|
| ( |
|
| ( |
|
| |
Total (Provision) Benefit for Income Taxes |
| $ | ( |
| $ | ( |
| $ | ( |
A majority of the Company's pretax income is from domestic operations.
The following table reflects the effective income tax rate reconciliation for the years ended December 31, 2023, 2022 and 2021:
|
|
|
|
|
|
|
|
|
|
|
|
|
|
|
|
|
|
|
|
|
| 2023 |
| 2022 |
| 2021 | |||
Federal statutory rate |
| | % |
| | % |
| | % |
State income taxes, net of the federal tax benefit |
| |
|
| |
|
| |
|
Stock based compensation |
| |
|
| ( |
|
| ( |
|
Tax credits |
| ( |
|
| ( |
|
| ( |
|
Other |
| |
|
| ( |
|
| |
|
Effective tax rate |
| | % |
| | % |
| | % |
The Company’s effective tax rate was
Tile Shop Holdings, Inc. and Subsidiaries
Notes to Consolidated Financial Statements
Components of net deferred income taxes were as follows at December 31:
|
|
|
|
|
|
|
|
|
|
|
|
|
|
|
| 2023 |
| 2022 | ||
|
| (in thousands) | ||||
Deferred income tax assets: |
|
|
|
|
|
|
Section 743 carryforward |
| $ | |
| $ | |
Inventory |
|
| |
|
| |
Operating lease liabilities |
|
| |
|
| |
Other |
|
| |
|
| |
Total deferred income tax assets |
| $ | |
| $ | |
|
|
|
|
|
|
|
Deferred income tax liabilities |
|
|
|
|
|
|
Depreciation |
|
| |
|
| |
Operating lease right-of-use assets |
|
| |
|
| |
Other |
|
| |
|
| |
Total deferred income tax liabilities |
|
| |
|
| |
Net deferred income tax assets |
| $ | |
| $ | |
The Company has recognized the tax consequences of all foreign unremitted earnings and management has no specific plans to indefinitely reinvest the unremitted earnings of its foreign subsidiary as of December 31, 2023. As of December 31, 2023, the total undistributed earnings of the Company's non-U.S. subsidiary was approximately $
The Company records interest and penalties through income tax expense relating to uncertain tax positions. As of December 31, 2023, 2022 and 2021, the Company has
The Company's federal, state, and foreign income tax returns are subject to audit. The Company is not currently under audit by federal, state, or foreign taxing authorities. The years open to examination include years ending 2020 to 2022 for federal income tax purposes, years ending 2019 to 2022 for state income tax purposes, and years ending 2020 to 2022 for foreign income tax purposes.
2016 New Markets Tax Credit
In December 2016, the Company entered into a financing transaction with U.S. Bank Community, LLC (“U.S. Bank”) related to a $
In December 2023, U.S. Bank exercised the put option to sell its interest in the Investment Fund at the end of the tax credit recapture period. Upon closing, the balance in the Investment Fund that was previously classified as restricted cash in the Consolidated Balance Sheet was used to fund $
Tile Shop Holdings, Inc. and Subsidiaries
Notes to Consolidated Financial Statements
Quarterly results of operations for the years ended December 31, 2023 and 2022 are summarized below (in thousands, except per share amounts):
|
|
|
|
|
|
|
|
|
|
|
|
|
|
|
|
|
|
|
|
|
|
|
|
|
|
|
| First Quarter |
| Second Quarter |
| Third Quarter |
| Fourth Quarter | ||||
|
|
| ||||||||||
2023 |
|
|
|
|
|
|
|
|
|
|
|
|
Net sales |
| $ | |
|
| |
|
| |
|
| |
Gross profit |
|
| |
|
| |
|
| |
|
| |
Income from operations |
|
| |
|
| |
|
| |
|
| |
Net income |
|
| |
|
| |
|
| |
|
| |
Basic earnings per share |
|
| |
|
| |
|
| |
|
| |
Diluted earnings per share |
|
| |
|
| |
|
| |
|
| |
|
|
|
|
|
|
|
|
|
|
|
|
|
2022 |
|
|
|
|
|
|
|
|
|
|
|
|
Net sales |
| $ | |
|
| |
|
| |
|
| |
Gross profit |
|
| |
|
| |
|
| |
|
| |
Income from operations |
|
| |
|
| |
|
| |
|
| |
Net income |
|
| |
|
| |
|
| |
|
| |
Basic earnings per share |
|
| |
|
| |
|
| |
|
| |
Diluted earnings per share |
|
| |
|
| |
|
| |
|
| |
|
|
|
|
|
|
|
|
|
|
|
|
|
TILE SHOP HOLDINGS, INC.
EXHIBIT INDEX
|
|
Exhibit No. | Description |
Tile Shop Holdings, Inc. Insider Trading Policy (last amended February 28, 2023) – filed herewith. | |
Consent of RSM US LLP, independent registered public accounting firm – filed herewith. | |
Consent of Ernst & Young LLP, independent registered public accounting firm – filed herewith. | |
101 | The following financial statements from the Annual Report on Form 10-K for the year ended December 31, 2023 are formatted in iXBRL (Inline eXtensible Business Reporting Language): (i) Consolidated Balance Sheets, (ii) Consolidated Statements of Income, (iii) Consolidated Statements of Comprehensive Income, (iv) Consolidated Statements of Stockholders’ Equity, (v) Consolidated Statements of Cash Flows, and (vi) the Notes to Consolidated Financial Statements – filed herewith. |
104 | Cover Page Interactive Data File (formatted as Inline XBRL and contained in Exhibit 101) – filed herewith. |
___________________________
* Management compensatory plan or arrangement.
** These certifications are not deemed filed with the Securities and Exchange Commission and are not to be incorporated by reference in any filing we make under the Securities Act of 1933, as amended, or the Exchange Act.
*** Schedules and exhibits have been omitted pursuant to Regulation S-K, Item 601(a)(5). The Company will provide a copy of any omitted schedule or exhibit to the Securities and Exchange Commission or its staff upon request.
SIGNATURES
Pursuant to the requirements of Section 13 or 15(d) of the Securities Exchange Act of 1934, the Registrant has duly caused this report to be signed on its behalf by the undersigned, thereunto duly authorized.
88 |
|
|
|
| TILE SHOP HOLDINGS, INC. |
|
|
Date: February 29, 2024 | /s/ CABELL H. LOLMAUGH |
| Cabell H. Lolmaugh |
| Chief Executive Officer |
POWER OF ATTORNEY
Each person whose signature appears below constitutes CABELL H. LOLMAUGH, KARLA LUNAN and MARK B. DAVIS, or any of them, as his or her true and lawful attorney-in-fact and agent, with full power of substitution and resubstitution, for him or her and in his or her name, place and stead, in any and all capacities, to sign any or all amendments to this Annual Report on Form 10-K and to file the same, with all exhibits thereto, and other documents in connection therewith, with the Securities and Exchange Commission, granting unto said attorney-in-fact and agent, full power and authority to do and perform each and every act and thing requisite and necessary to be done in and about the premises, as fully to all intents and purposes as he or she might or could do in person, hereby ratifying and confirming all said attorney-in-fact and agent, or his or her substitute or substitutes, may lawfully do or cause to be done by virtue thereof.
Pursuant to the requirements of the Securities Exchange Act of 1934, this report has been signed below by the following persons on behalf of the Registrant and in the capacities and on the dates indicated.
|
|
|
|
|
Signature |
| Title |
| Date |
|
|
|
|
|
/s/ CABELL H. LOLMAUGH |
| Chief Executive Officer, Director |
| February 29, 2024 |
Cabell H. Lolmaugh |
| (Principal Executive Officer) |
|
|
|
|
|
|
|
/s/ KARLA LUNAN |
| Senior Vice President and Chief Financial Officer |
| February 29, 2024 |
Karla Lunan |
| (Principal Financial Officer) |
|
|
|
|
|
|
|
/s/ MARK B. DAVIS |
| Vice President, Investor Relations, and Chief |
| February 29, 2024 |
Mark B. Davis |
| Accounting Officer (Principal Accounting Officer) |
|
|
|
|
|
|
|
/s/ PETER H. KAMIN |
| Director and Chairman of the Board of Directors |
| February 29, 2024 |
Peter H. Kamin |
|
|
|
|
|
|
|
|
|
/s/ MARK J. BONNEY |
| Director |
| February 29, 2024 |
Mark J. Bonney |
|
|
|
|
|
|
|
|
|
/s/ DEBORAH K. GLASSER |
| Director |
| February 29, 2024 |
Deborah K. Glasser |
|
|
|
|
|
|
|
|
|
/s/ PETER J. JACULLO, III |
| Director |
| February 29, 2024 |
Peter J. Jacullo, III |
|
|
|
|
|
|
|
|
|
/s/ LINDA SOLHEID |
| Director |
| February 29, 2024 |
Linda Solheid |
|
|
|
|