UNITED STATES
SECURITIES AND EXCHANGE COMMISSION
Washington, D.C. 20549
________________________________________
________________________________________
FORM 10-K
| ANNUAL REPORT PURSUANT TO SECTION 13 OR 15(d) OF THE SECURITIES EXCHANGE ACT OF 1934 | |||||
For the fiscal year ended December 31 , 2023
or
| TRANSITION REPORT PURSUANT TO SECTION 13 OR 15(d) OF THE SECURITIES EXCHANGE ACT OF 1934 | |||||
Commission File Number: 001-38860
TRADEWEB MARKETS INC.
(Exact name of registrant as specified in its charter)
___________________________________________
| (State of other jurisdiction of incorporation or organization) | (I.R.S. Employer Identification No.) | |||||||
| (Address of principal executive offices) | (Zip Code) | |||||||
(646 ) 430-6000
(Registrant’s telephone number, including area code)
Securities registered pursuant to Section 12(b) of the Act:
Title of each class | Trading Symbol(s) | Name of each exchange on which registered | ||||||||||||
Securities registered pursuant to Section 12(g) of the Act: None
Indicate by check mark if the registrant is a well-known seasoned issuer, as defined in Rule 405 of the Securities Act. ☒ Yes ☐ No
Indicate by check mark if the registrant is not required to file reports pursuant to Section 13 or Section 15(d) of the Act. ☐ Yes ☒ No
Indicate by check mark whether the registrant (1) has filed all reports required to be filed by Section 13 or 15(d) of the Securities Exchange Act of 1934 during the preceding 12 months (or for such shorter period that the registrant was required to file such reports), and (2) has been subject to such filing requirements for the past 90 days. ☒Yes ☐ No
Indicate by check mark whether the registrant has submitted electronically every Interactive Data File required to be submitted pursuant to Rule 405 of Regulation S-T (§232.405 of this chapter) during the preceding 12 months (or for such shorter period that the registrant was required to submit such files). ☒ Yes ☐ No
Indicate by check mark whether the registrant is a large accelerated filer, an accelerated filer, a non-accelerated filer, a smaller reporting company, or an emerging growth company. See the definitions of “large accelerated filer”, “accelerated filer”, “smaller reporting company” and “emerging growth company” in Rule 12b-2 of the Exchange Act.
| ☒ | Accelerated filer | ☐ | Non-accelerated filer | ☐ | |||||||||||||||||||
| Smaller reporting company | Emerging growth company | ||||||||||||||||||||||
If an emerging growth company, indicate by check mark if the registrant has elected not to use the extended transition period for complying with any new or revised financial accounting standards provided pursuant to Section 13(a) of the Exchange Act.☐
Indicate by check mark whether the registrant has filed a report on and attestation of the effectiveness of its internal control over financial reporting under Section 404(b) of Sarbanes-Oxley Act (15 U.S.C. 7262(b)) by registered public accounting firm that prepared or issued its audit report ☒
If securities are registered pursuant to Section 12(b) of the Act, indicate by check mark whether the financial statements of the registrant included in the filing reflect the correction of an error to previously issued financial statements.☐
Indicate by check mark whether any of those error corrections are restatements that required a recovery analysis of incentive-based compensation received by any of the registrant’s executive officers during the relevant recovery period pursuant to §240.10D-1(b).☐
Indicate by check mark whether the registrant is a shell company (as defined in Rule 12b-2 of the Exchange Act). ☐ Yes ☒ No
The aggregate market value of the voting and non-voting common equity held by non-affiliates of the registrant, based on the closing price of the Class A common stock on the NASDAQ Global Select Market on June 30, 2023, was approximately $16.1 billion.
| Class of Stock | Shares Outstanding as of February 2, 2024 | |||||||
| Class A Common Stock, par value $0.00001 per share | ||||||||
| Class B Common Stock, par value $0.00001 per share | ||||||||
| Class C Common Stock, par value $0.00001 per share | ||||||||
| Class D Common Stock, par value $0.00001 per share | ||||||||
| Documents Incorporated by Reference | ||||||||
Part III of this Annual Report on Form 10-K incorporates by reference portions of the Registrant’s Proxy Statement for its 2024 Annual Meeting of Stockholders.
TRADEWEB MARKETS INC.
FORM 10-K ANNUAL REPORT
TABLE OF CONTENTS
| Page | ||||||||
2
INTRODUCTORY NOTE
Basis of Presentation
The financial statements and other disclosures contained in this Annual Report on Form 10-K include those of Tradeweb Markets Inc., which is the registrant, and those of its consolidating subsidiaries, including Tradeweb Markets LLC, which became the principal operating subsidiary of Tradeweb Markets Inc. on April 4, 2019 in a series of reorganization transactions (the “Reorganization Transactions”) that were completed in connection with Tradeweb Markets Inc.’s initial public offering (the “IPO”), which closed on April 8, 2019.
As a result of the Reorganization Transactions completed in connection with the IPO, Tradeweb Markets Inc. became a holding company whose only material assets consist of its equity interest in Tradeweb Markets LLC and related deferred tax assets. As the sole manager of Tradeweb Markets LLC, Tradeweb Markets Inc. operates and controls all of the business and affairs of Tradeweb Markets LLC and, through Tradeweb Markets LLC and its subsidiaries, conducts its business. As a result of this control, and because Tradeweb Markets Inc. has a substantial financial interest in Tradeweb Markets LLC, Tradeweb Markets Inc. consolidates the financial results of Tradeweb Markets LLC and its subsidiaries.
As used in this Annual Report on Form 10-K, unless the context otherwise requires, references to:
•“We,” “us,” “our,” the “Company,” “Tradeweb” and similar references refer: (i) on or prior to the completion of the Reorganization Transactions to Tradeweb Markets LLC, which we refer to as “TWM LLC,” and, unless otherwise stated or the context otherwise requires, all of its subsidiaries and any predecessor entities, and (ii) following the completion of the Reorganization Transactions to Tradeweb Markets Inc., and, unless otherwise stated or the context otherwise requires, TWM LLC and all of its subsidiaries and any predecessor entities.
•“Bank Stockholders” refer collectively to entities affiliated with the following clients: Barclays Capital Inc., BofA Securities, Inc. (a subsidiary of Bank of America Corporation), Citigroup Global Markets Inc., Credit Suisse Securities (USA) LLC, Deutsche Bank Securities Inc., Goldman Sachs & Co. LLC, J.P. Morgan Securities LLC, Morgan Stanley & Co. LLC, RBS Securities Inc., UBS Securities LLC and Wells Fargo Securities, LLC, which, prior to the completion of the IPO, collectively held a 46% ownership interest in Tradeweb. Subsequent to August 2022, there were no LLC Interests (as defined below) held by Bank Stockholders.
•“Continuing LLC Owners” refer collectively to (i) those Original LLC Owners (as defined below), including Refinitiv (as defined below), certain of the Bank Stockholders and members of management, that continued to own LLC Interests after the completion of the IPO and Reorganization Transactions and that received shares of our Class C common stock, shares of our Class D common stock or a combination of both, as the case may be, in connection with the completion of the Reorganization Transactions, (ii) any subsequent transferee of any Original LLC Owner that has executed a joinder agreement to TWM LLC’s limited liability company agreement (the “TWM LLC Agreement”) and (iii) solely with respect to the Tax Receivable Agreement (as defined below), (x) those Original LLC Owners, including certain of the Bank Stockholders, that disposed of all of their LLC Interests for cash in connection with the IPO and (y) any party that has executed a joinder agreement to the Tax Receivable Agreement in accordance with the Tax Receivable Agreement.
•“Investor Group” refer to certain investment funds affiliated with The Blackstone Group Inc. (f/k/a The Blackstone Group L.P.), an affiliate of Canada Pension Plan Investment Board, an affiliate of GIC Special Investments Pte. Ltd. and certain co-investors, which prior to the LSEG Transaction (as defined below) collectively held indirectly a 55% ownership interest in Refinitiv.
•“LLC Interests” refer to the single class of common membership interests of TWM LLC. LLC Interests, other than those held by Tradeweb Markets Inc., are redeemable or exchangeable in accordance with the TWM LLC Agreement for shares of Class A common stock or Class B common stock, as the case may be, on a one-for-one basis.
•“LSEG Transaction” refer to the acquisition of the Refinitiv business by London Stock Exchange Group plc, in an all share transaction, which closed on January 29, 2021. The Refinitiv business was rebranded by the London Stock Exchange Group plc as LSEG Data & Analytics during the fourth quarter of 2023.
•“LSEG” refer to London Stock Exchange Group plc, and unless otherwise stated or the context otherwise requires, all of its direct and indirect subsidiaries.
•“Original LLC Owners” refer to the owners of TWM LLC prior to the Reorganization Transactions.
3
•“Refinitiv,” prior to the LSEG Transaction, refer to Refinitiv Holdings Limited, and unless otherwise stated or the context otherwise requires, all of its direct and indirect subsidiaries, and subsequent to the LSEG Transaction, refer to Refinitiv Parent Limited, and unless otherwise stated or the context otherwise requires, all of its subsidiaries. Refinitiv owns substantially all of the former financial and risk business of Thomson Reuters (as defined below), including, prior to and following the completion of the Reorganization Transactions, an indirect majority ownership interest in Tradeweb, and was controlled by the Investor Group prior to the LSEG Transaction.
•“Refinitiv Transaction” refer to the transaction pursuant to which Refinitiv indirectly acquired on October 1, 2018 substantially all of the financial and risk business of Thomson Reuters and Thomson Reuters indirectly acquired a 45% ownership interest in Refinitiv.
•“Thomson Reuters” or “TR” refer to Thomson Reuters Corporation, which prior to the LSEG Transaction indirectly held a 45% ownership interest in Refinitiv.
Numerical figures included in this Annual Report on Form 10-K have been subject to rounding adjustments. Accordingly, numerical figures shown as totals in various tables may not be arithmetic aggregations of the figures that precede them. In addition, we round certain percentages presented in this Annual Report on Form 10-K to the nearest whole number. As a result, figures expressed as percentages in the text may not total 100% or, when aggregated, may not be the arithmetic aggregation of the percentages that precede them.
Market and Industry Data
This Annual Report on Form 10-K includes estimates regarding market and industry data. Unless otherwise indicated, information concerning our industry and the markets in which we operate, including our general expectations, market position, market opportunity and market size, are based on our management’s knowledge and experience in the markets in which we operate, together with currently available information obtained from various sources, including publicly available information, industry reports and publications, surveys, our clients, trade and business organizations and other contacts in the markets in which we operate. Certain information is based on management estimates, which have been derived from third-party sources, as well as data from our internal research, and are based on certain assumptions that we believe to be reasonable. In particular, to calculate our market position, market opportunity and market size we derived the size of the applicable market from a combination of management estimates, public filings and statements of competitors and public industry sources, including FINRA’s Trade Reporting and Compliance Engine (“TRACE”), the Securities Industry and Financial Markets Association (“SIFMA”), the International Swaps and Derivatives Association (“ISDA”), Clarus Financial Technology, TRAX, the Federal Reserve Bank of New York, Flow Traders, Coalition Greenwich, the Association for Financial Markets in Europe (“AFME”), the Japan Securities Deal Association, the China Foreign Exchange Trade System (“CFETS”) and the Emerging Markets Trade Association (“EMTA”). In calculating the size of certain markets, we omitted products for which there is no publicly available data, and, as a result, the actual markets for certain of our asset classes may be larger than those presented herein.
In presenting this information, we have made certain assumptions that we believe to be reasonable based on such data and other similar sources and on our knowledge of, and our experience to date in, the markets in which we operate. While we believe the estimated market and industry data included in this Annual Report on Form 10-K are generally reliable, such information, which is derived in part from management’s estimates and beliefs, is inherently uncertain and imprecise. Market and industry data are subject to change and may be limited by the availability of raw data, the voluntary nature of the data gathering process and other limitations inherent in any statistical survey of such data. In addition, projections, assumptions and estimates of the future performance of the markets in which we operate and our future performance are necessarily subject to uncertainty and risk due to a variety of factors, including those described in “Cautionary Note Regarding Forward-Looking Statements” and Part I, Item 1A. – “Risk Factors.” These and other factors could cause results to differ materially from those expressed in the estimates made by third parties and by us. Accordingly, you are cautioned not to place undue reliance on such market and industry data or any other such estimates. We cannot guarantee the accuracy or completeness of this information, and we have not independently verified any third-party information and data from our internal research has not been verified by any independent source.
Certain Trademarks, Trade Names and Service Marks
This Annual Report on Form 10-K includes trademarks and service marks owned by us. This Annual Report on Form 10-K also contains trademarks, trade names and service marks of other companies, which are the property of their respective owners. Solely for convenience, trademarks, trade names and service marks referred to in this Annual Report on Form 10-K may appear without the ®, ™ or SM symbols, but such references are not intended to indicate, in any way, that we will not assert, to the fullest extent under applicable law, our rights to these trademarks, trade names and service marks. We do not intend our use or display of other parties’ trademarks, trade names or service marks to imply, and such use or display should not be construed to imply, a relationship with, or endorsement or sponsorship of us by, these other parties.
4
USE OF NON-GAAP FINANCIAL MEASURES
This Annual Report on Form 10-K contains “non-GAAP financial measures,” which are financial measures that are not calculated and presented in accordance with accounting principles generally accepted in the United States of America (“GAAP”).
The Securities and Exchange Commission (“SEC”) has adopted rules to regulate the use of non-GAAP financial measures in filings with the SEC and in other public disclosures. These rules govern the manner in which non-GAAP financial measures are publicly presented and require, among other things:
•a presentation with equal or greater prominence of the most comparable financial measure or measures calculated and presented in accordance with GAAP; and
•a statement disclosing the purposes for which the registrant’s management uses the non-GAAP financial measure.
Specifically, we make use of the non-GAAP financial measures “Free Cash Flow,” “Adjusted EBITDA,” “Adjusted EBITDA margin,” “Adjusted EBIT,” “Adjusted EBIT margin,” “Adjusted Net Income” and “Adjusted Diluted EPS,” as well as the change in revenue, Adjusted EBITDA margin and Adjusted EBIT margin on a constant currency basis, in evaluating our historical results and future prospects. For the definition of Free Cash Flow and a reconciliation to cash flow from operating activities, its most directly comparable financial measure presented in accordance with GAAP, see Part II, Item 7. – “Management’s Discussion and Analysis of Financial Condition and Results of Operations – Non-GAAP Financial Measures.” For the definitions of Adjusted EBITDA, Adjusted EBIT and Adjusted Net Income and reconciliations to net income, and net income attributable to Tradeweb Markets Inc., as applicable, their most directly comparable financial measures presented in accordance with GAAP, see Part II, Item 7. – “Management’s Discussion and Analysis of Financial Condition and Results of Operations – Non-GAAP Financial Measures.” For the definition of constant currency revenue change, see Part II, Item 7. – “Management’s Discussion and Analysis of Financial Condition and Results of Operations – Results of Operations.” Adjusted EBITDA margin and Adjusted EBIT margin are defined as Adjusted EBITDA and Adjusted EBIT, respectively, divided by revenue for the applicable period. For the definition of constant currency change in Adjusted EBITDA margin and Adjusted EBIT margin, see Part II, Item 7. – “Management’s Discussion and Analysis of Financial Condition and Results of Operations – Non-GAAP Financial Measures.” Adjusted Diluted EPS is defined as Adjusted Net Income divided by the diluted weighted average number of shares of Class A common stock and Class B common stock outstanding for the applicable period (including the effect of potentially dilutive securities determined using the treasury stock method), plus the weighted average number of other participating securities reflected in earnings per share using the two-class method, plus the assumed full exchange of all outstanding LLC Interests held by non-controlling interests for shares of Class A common stock or Class B common stock.
We present Free Cash Flow because we believe it is a useful indicator of liquidity that provides information to management and investors about the amount of cash generated from our core operations after expenditures for capitalized software development costs and furniture, equipment and leasehold improvements.
We present Adjusted EBITDA, Adjusted EBITDA margin, Adjusted EBIT and Adjusted EBIT margin because we believe they assist investors and analysts in comparing our operating performance across reporting periods on a consistent basis by excluding items that we do not believe are indicative of our core operating performance. Management and our board of directors use Adjusted EBITDA, Adjusted EBITDA margin, Adjusted EBIT and Adjusted EBIT margin to assess our financial performance and believe they are helpful in highlighting trends in our core operating performance, while other measures can differ significantly depending on long-term strategic decisions regarding capital structure, the tax jurisdictions in which we operate and capital investments. Further, our executive incentive compensation program is based in part on components of Adjusted EBITDA and Adjusted EBITDA margin.
We use constant currency measures as supplemental metrics to evaluate our underlying performance between periods by removing the impact of foreign currency fluctuations. We believe that providing certain percentage changes on a constant currency basis provide useful comparisons of our performance and trends between periods.
We use Adjusted Net Income and Adjusted Diluted EPS as supplemental metrics to evaluate our business performance in a way that also considers our ability to generate profit without the impact of certain items. Each of the normal recurring adjustments and other adjustments described in the definition of Adjusted Net Income helps to provide management with a measure of our operating performance over time by removing items that are not related to day-to-day operations or are non-cash expenses.
5
Free Cash Flow, Adjusted EBITDA, Adjusted EBITDA margin, Adjusted EBIT, Adjusted EBIT margin, Adjusted Net Income, Adjusted Diluted EPS and constant currency measures have limitations as analytical tools, and you should not consider such measures either in isolation or as substitutes for analyzing our results as reported under GAAP. Some of these limitations include the following:
•Free Cash Flow, Adjusted EBITDA, Adjusted EBIT, Adjusted Net Income and Adjusted Diluted EPS do not reflect every expenditure, future requirements for capital expenditures or contractual commitments;
•Adjusted EBITDA, Adjusted EBIT, Adjusted Net Income and Adjusted Diluted EPS do not reflect changes in our working capital needs;
•Adjusted EBITDA and Adjusted EBIT do not reflect any interest expense, or the amounts necessary to service interest or principal payments on any debt obligations;
•Adjusted EBITDA and Adjusted EBIT do not reflect income tax expense, which is a necessary element of our costs and ability to operate;
•although depreciation and amortization are eliminated in the calculation of Adjusted EBITDA, and the depreciation and amortization related to acquisitions and the Refinitiv Transaction are eliminated in the calculation of Adjusted EBIT, the assets being depreciated and amortized will often have to be replaced in the future, and Adjusted EBITDA and Adjusted EBIT do not reflect any costs of such replacements;
•Adjusted EBITDA, Adjusted EBIT, Adjusted Net Income and Adjusted Diluted EPS do not reflect the noncash component of certain employee compensation expense or payroll taxes associated with certain option exercises;
•Adjusted EBITDA, Adjusted EBIT, Adjusted Net Income and Adjusted Diluted EPS do not reflect the impact of earnings or charges resulting from matters we consider not to be indicative, on a recurring basis, of our ongoing operations;
•Constant currency measures do not reflect the impact of foreign currency fluctuations; and
•other companies in our industry may calculate Free Cash Flow, Adjusted EBITDA, Adjusted EBIT, Adjusted Net Income, Adjusted Diluted EPS, constant currency measures or similarly titled measures differently than we do, limiting their usefulness as comparative measures.
We compensate for these limitations by relying primarily on our GAAP results and using Free Cash Flow, Adjusted EBITDA, Adjusted EBIT, Adjusted Net Income, Adjusted Diluted EPS and constant currency measures only as supplemental information.
6
CAUTIONARY NOTE REGARDING FORWARD-LOOKING STATEMENTS
This Annual Report on Form 10-K contains forward-looking statements within the meaning of Section 27A of the Securities Act of 1933, as amended (the “Securities Act”), and Section 21E of the Securities Exchange Act of 1934, as amended (the “Exchange Act”). You can generally identify forward-looking statements by our use of forward-looking terminology such as “anticipate,” “believe,” “continue,” “could,” “estimate,” “expect,” “intend,” “may,” “might,” “plan,” “potential,” “predict,” “projection,” “seek,” “should,” “will” or “would,” or the negative thereof or other variations thereon or comparable terminology. In particular, statements about the markets in which we operate, including our expectations about market trends, our market opportunity and the growth of our various markets, our expansion into new markets, any pending acquisitions or other strategic transactions, any potential tax savings we may realize as a result of our organizational structure, our dividend policy, our share repurchase program and our expectations, beliefs, plans, strategies, objectives, prospects or assumptions regarding future events, our performance or otherwise, contained in this Annual Report on Form 10-K under Part I, Item 1. – “Business,” Part I, Item 1A. – “Risk Factors” and Part II, Item 7. – “Management’s Discussion and Analysis of Financial Condition and Results of Operations” are forward-looking statements.
We have based these forward-looking statements on our current expectations, assumptions, estimates and projections. While we believe these expectations, assumptions, estimates and projections are reasonable, such forward-looking statements are only predictions and involve known and unknown risks and uncertainties, many of which are beyond our control. These and other important factors, including those discussed in this Annual Report on Form 10-K under Part I, Item 1. – “Business,” Part I, Item 1A. – “Risk Factors” and Part II, Item 7. – “Management’s Discussion and Analysis of Financial Condition and Results of Operations,” may cause our actual results, performance or achievements to differ materially from those expressed or implied by these forward-looking statements, or could affect our stock price.
Some of the factors that could cause actual results to differ materially from those expressed or implied by the forward-looking statements include:
•changes in economic, political, social and market conditions and the impact of these changes on trading volumes;
•our failure to compete successfully;
•our failure to adapt our business effectively to keep pace with industry changes;
•consolidation and concentration in the financial services industry;
•our dependence on dealer clients;
•design defects, errors, failures or delays with our platforms or solutions;
•our dependence on third parties for certain market data and certain key functions;
•our inability to achieve our environmental, social and governance goals;
•our ability to implement our business strategies profitably;
•our ability to successfully integrate any acquisition or to realize benefits from any strategic alliances, partnerships or joint ventures;
•our inability to maintain and grow the capacity of our trading platforms, systems and infrastructure;
•systems failures, interruptions, delays in services, cybersecurity incidents, catastrophic events and any resulting interruptions;
•inadequate protection of our intellectual property;
•extensive regulation of our industry;
•our ability to retain the services of our senior management team;
•limitations on operating our business and incurring additional indebtedness as a result of covenant restrictions under our $500.0 million senior unsecured revolving credit facility (the “2023 Revolving Credit Facility”) with Citibank, N.A., as administrative agent, and the other lenders party thereto;
7
•our dependence on distributions from TWM LLC to fund our expected dividend payments and to pay our taxes and expenses, including payments under the tax receivable agreement (the “Tax Receivable Agreement”) entered into in connection with the IPO;
•our ability to realize any benefit from our organizational structure;
•Refinitiv’s, and indirectly LSEG’s, control of us and our status as a controlled company; and
•other risks and uncertainties, including those listed under Part I, Item 1A. – “Risk Factors.”
Given these risks and uncertainties, you are cautioned not to place undue reliance on such forward-looking statements. The forward-looking statements contained in this Annual Report on Form 10-K are not guarantees of future events or performance and future events, our actual results of operations, financial condition or liquidity, and the development of the industry and markets in which we operate, may differ materially from the forward-looking statements contained in this Annual Report on Form 10-K. In addition, even if future events, our results of operations, financial condition or liquidity, and events in the industry and markets in which we operate, are consistent with the forward-looking statements contained in this Annual Report on Form 10-K, they may not be predictive of events, results or developments in future periods.
Any forward-looking statement that we make in this Annual Report on Form 10-K speaks only as of the date of such statement. Except as required by law, we do not undertake any obligation to update or revise, or to publicly announce any update or revision to, any of the forward-looking statements, whether as a result of new information, future events or otherwise, after the date of this Annual Report on Form 10-K.
8
PART I
ITEM 1. BUSINESS.
Overview
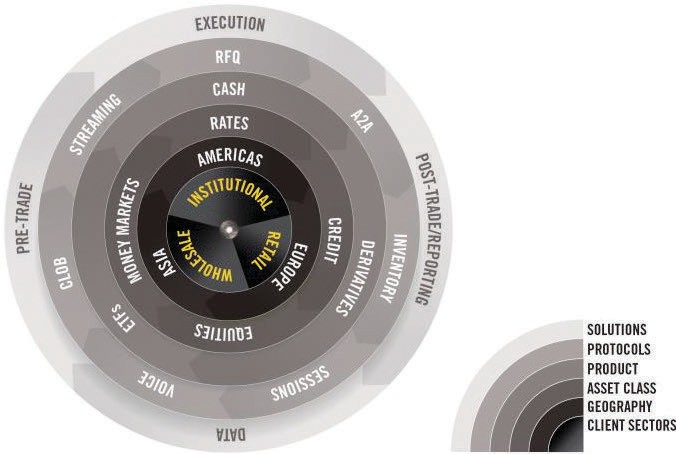
We are a leader in building and operating electronic marketplaces for our global network of clients across the financial ecosystem. Our network is comprised of clients across the institutional, wholesale and retail client sectors, including many of the largest global asset managers, hedge funds, insurance companies, central banks, banks and dealers, proprietary trading firms and retail brokerage and financial advisory firms, as well as regional dealers. Our marketplaces facilitate trading across a range of asset classes, including rates, credit, equities and money markets. We are a global company serving clients in over 70 countries with offices in North America, Europe, Asia, Australia and the Middle East. We believe our proprietary technology and culture of collaborative innovation allow us to adapt our offerings to enter new markets, create new platforms and solutions and adjust to regulations quickly and efficiently. We support our clients by providing solutions across the trade lifecycle, including pre-trade, execution, post-trade and data.
There are multiple key dimensions to the electronic marketplaces that we build and operate to provide deep pools of liquidity. Foundationally, these begin with our clients and then expand through and across multiple client sectors, geographic regions, asset classes, product groups, trading protocols and trade lifecycle solutions.
Our markets are large and growing. Electronic trading continues to increase in the markets in which we operate as a result of market demand for greater transparency, higher execution quality, operational efficiency and lower costs, as well as regulatory changes. We believe our deep client relationships, asset class breadth, geographic reach, regulatory knowledge and scalable technology position us to continue to be at the forefront of the evolution of electronic trading. Our platforms provide transparent, efficient, cost-effective and compliant trading solutions across multiple products, regions and regulatory regimes. As market participants seek to trade across multiple asset classes, reduce their costs of trading and increase the effectiveness of their trading, including through the use of data and analytics, we believe the demand for our platforms and electronic trading solutions will continue to grow.
We have a powerful network of more than 2,500 clients across the institutional, wholesale and retail client sectors. Our clients include leading global asset managers, hedge funds, insurance companies, central banks, banks and dealers, proprietary trading firms and retail brokerage and financial advisory firms, as well as regional dealers. As our network continues to grow across client sectors, we will generate additional transactions and data on our platforms, driving a virtuous cycle of greater liquidity and value for our clients.
Our technology supports multiple asset classes, trading protocols and geographies, and as a result, we are able to provide a broad spectrum of solutions and cost savings to our clients. We have built, and continue to invest in, a scalable, flexible and resilient proprietary technology architecture that enables us to remain agile and evolve with market structure. This allows us to partner closely with our clients to develop customized solutions for their trading and workflow needs. Our technology is deeply integrated with our clients’ risk and order management systems, clearinghouses, trade repositories, middleware providers and other important links in the trading value chain. These qualities allow us to be quick to market with new offerings, to constantly enhance our existing platforms and solutions and to collect a robust set of data and analytics to support our marketplaces.
9
We are focused on balancing revenue growth and margin expansion to create long-term value and we have a track record of growth and financial performance. By expanding the scope of our platforms and solutions, building scale and integration across marketplaces and benefiting from broader network effects, we have been able to grow both our transaction volume and subscription-based revenues.
Our Evolution
We were founded in 1996 and set out to solve for inefficiencies in the institutional U.S. Treasury trading workflows, including limited price transparency, weak connectivity among market participants and error-prone manual processes. Our first electronic marketplace went live in 1998, and for more than 25 years we have leveraged our technology and expertise to expand into additional rates products and other asset classes, including credit, equities and money markets. Market demand for better trading workflows globally also was increasing and we initiated a strategy of rolling out our existing products to new geographies and adding local products. We expanded to Europe in 2000, initially offering U.S. fixed income products and soon thereafter added a marketplace for European government bonds. We expanded to Asia in 2004, where our first local product was Japanese government bonds. We have since continued to expand our product and client base in Europe, Asia and most recently in Australia, Africa, South America and the Middle East.
We identified an opportunity to complement our offerings to the wholesale and retail client sectors based on our existing relationships with dealers and our strong market position. We developed our wholesale platform through the acquisitions of Hilliard Farber & Co. in 2008 and Rafferty Capital Markets in 2011, and developed technology to facilitate the migration of inefficient wholesale voice markets to more efficient and transparent electronic markets. We entered the retail market through our acquisition of LeverTrade in 2006, scaled our market position through our acquisition of BondDesk in 2013, and have continued to leverage our market and technology expertise to enhance our platform serving that client sector. In June 2021, we acquired Nasdaq’s U.S. fixed income electronic trading platform. The addition of this fully-electronic CLOB (central limit order book) offers a flexible, efficient approach to trading in the wholesale U.S. Treasury market. In August 2023, we acquired Tradeweb Australia Pty Ltd (formerly Yieldbroker Pty Limited) (“Yieldbroker”), a leading Australian trading platform for Australian and New Zealand government bonds and interest rate derivatives covering the institutional and wholesale client sectors. This acquisition combines Australia and New Zealand’s highly attractive, fast-growing markets with Tradeweb’s international reach and scale. In January 2024, we acquired R8FIN Holdings LP (together with its subsidiaries, “r8fin”), a technology provider that specializes in algorithmic-based execution for U.S. Treasuries and interest rate futures that complement our other offerings, creating a valuable and broad-based approach to trading.
Throughout our evolution we have developed many new innovations that have provided greater pre-trade price transparency, better execution quality and seamless post-trade solutions. Such innovations include the introduction of pre-trade composite pricing for multi-dealer-to-customer (“D2C”) trading, the Request-for-Quote (“RFQ”) trading protocol across all of our asset classes, the blast all-to-all (“A2A”) trading protocol across our global credit marketplaces and portfolio trading. We have also integrated our trading platforms with our proprietary post-trade systems as well as many of our clients’ order management and risk systems for efficient post-trade processing. In addition, because large components of the market remain relationship-driven, we continue to focus on introducing technology solutions to solve inefficiencies in voice markets, such as electronic voice processing, which allows our clients to use Tradeweb technology to process voice trades. We expect to continue to leverage our success to expand into new products, asset classes and geographies, while growing our powerful network of clients.
While our cornerstone products continue to be some of the first products we launched, including U.S. Treasuries, European government bonds and To-Be-Announced mortgage-backed securities (“TBA MBS”), we have continued to solve trading inefficiencies by adding new products across our rates, credit, equities and money markets asset classes. As a result of expanding our offerings, we have increased our opportunities in related addressable markets, where estimated average daily trading volumes have grown from approximately $0.6 trillion in 1998 to $8.8 trillion through December 31, 2023, according to industry sources and management estimates.
10
Our Competitive Strengths
Our Network of Clients, Products, Geographies and Protocols
Our clients continue to use our trading venues because of our large network and deep pools of liquidity, which result in better and more efficient trade execution. We expand our relationships through our integrated technology and new offerings made available to our growing network of clients. As an electronic trading marketplace for key asset classes and products, we benefit from a virtuous cycle of liquidity — trading volumes growing together and re-enforcing each other. We expect our existing clients to trade more volume on our trading venues and to attract new users to our already powerful network, as liquidity on our marketplaces continues to grow and we offer more products and value-added solutions. The breadth of our network, products, global presence and embedded scalable technology offers us unique insights and an established platform to swiftly enter additional markets and offer new value-added solutions. This is supported by more than 25 years of successful innovation and long trusted relationships with our clients.
We are a leader in making trading and the associated workflow more efficient for market participants. Based on industry sources and management estimates, we believe that we are a market leader in electronic trading for the following products: U.S. Treasuries, U.S. High-Grade credit, TBA MBS, European government bonds, global interest rate swaps, ETP-traded Yen-denominated interest rate swaps and European exchange traded funds (“ETFs”). We cover all major client sectors participating in electronic trading, including the institutional, wholesale and retail client sectors. In addition, we provide a full spectrum of trading protocols including voice, sweeps (session-based trading), RFQ, CLOB, A2A and portfolio trading, among others.
We believe the breadth of our offerings, experience and client relationships provides us unique market feedback and enables us to enter new markets with higher probabilities of success and greater speed. Many of our markets are interwoven and we provide participants trading capabilities across multiple products through a single relationship. We cover our global clients through offices in North America, Europe, Asia, Australia and the Middle East and a global trading network that is distributed throughout the world.
Culture of Collaborative Innovation
We have developed trusted client relationships through a culture of collaborative innovation where we work alongside our clients to solve their evolving workflow needs. We have a long track record of working with clients to solve both industry-level challenges and client-specific issues. We have had a philosophy of collaboration since our founding, when we worked with certain clients to improve U.S. Treasury trading for the institutional client sector.
More recently, we introduced Tradeweb’s Rematch, an industry-exclusive solution, offering institutional investors trading within AllTrade previously unavailable access to hundreds of millions of dollars in unmatched risk from dealers’ sessions, opening the door to a significantly larger pool of liquidity. We were also the first trading platform to offer portfolio trading for corporate bonds, creating a new and efficient way for participants to move risk. We helped make trading in credit markets more efficient by partnering with major dealers to improve liquidity and reduce the cost of net spotting the U.S. Treasury in connection with a corporate bond trade. This net spotting functionality allows our credit clients to spot multiple bonds at the same time using our multi-dealer net spotting tool to net their interest rate risk simultaneously using one spot price. We have also worked side-by-side with clients and federal agencies to customize solutions for their particular needs in the TBA MBS market. For example, in direct collaboration with our leading TBA MBS clients we developed our Round Robin functionality to help resolve the issue of systemic fails on TBA MBS trades and reduce the operational risk and costs associated with delivery failures that often plague the TBA MBS market. In conjunction with Freddie Mac, we developed a direct-to-Freddie Mac exchange path for institutional clients related to the single security initiative, paving the way for a combined Freddie Mac and Fannie Mae TBA market of Uniform Mortgage-Backed Securities. Through collaborative endeavors like these, we have become deeply integrated into our clients’ workflow and become a partner of choice for new innovations.
11
Scalable and Flexible Technology
We consistently use our proprietary technology to find new ways for our clients to trade more effectively and efficiently. Our core software solutions span multiple components of the trading lifecycle and include pre-trade data and analytics, trade execution and post-trade data, analytics and reporting, integration, connectivity and straight-through processing. Our systems are built to be scalable, flexible and resilient. Our internet-based, thin client technology is readily accessible and enables us to quickly access the market with easily distributed new solutions. For example, we were the first to offer web-based electronic multi-dealer trading to the institutional U.S. Treasury market and have subsequently automated the market structure of additional markets globally. We have also created new trading protocols and developed additional solutions for our clients that are translated and built by our highly experienced technology and business personnel working together to solve a client workflow problem. Our 2024 acquisition of the r8fin technology will help us reach a new and differentiated level of intelligent execution through a powerful combination of algorithmic technology and cross-market connectivity. We believe pairing r8fin’s sophisticated technology with our global network will open up a range of new possibilities for clients engaged in relative value or macro trades spanning multiple asset classes. Going forward, we expect our technology platform, and ongoing investments in technology and new product offerings, to help us stay at the forefront of the evolution of electronic trading.
Our Global Regulatory Footprint and Domain Expertise
We are regulated (as necessitated by jurisdiction and applicable law) or have necessary legal clearance to offer our platforms and solutions in major markets globally, and our experience provides us credibility when we enter new markets and facilitates our ability to comply with additional regulatory regimes. With extensive experience in addressing existing and pending regulatory changes in our industry, we offer clients a central source of expertise and thought leadership in our markets and assist them through the myriad of regulatory requirements. We then provide our clients with trading platforms that meet regulatory requirements and enable connectivity to pre- and post-trade systems necessary to comply with their regulatory obligations.
Platforms and Solutions Empowered by Data and Analytics
Our data and analytics enhance the value proposition of our trading venues and improve the trading experience of our clients. We support our clients’ core trading functions by offering trusted pre- and post-trade services, value-added analytics and predictive insights informed by our deep understanding of how market participants interact. Our data and analytics help clients make better trading decisions, benefitting our current clients and attracting new market participants to our network. For example, data powers our Automated Intelligent Execution (“AiEX”) functionality which allows traders to automatically execute trades according to pre-programmed rules and automatically sends completed or rejected order details to internal order management systems. By allowing traders to automate and execute their smaller, low touch trades more efficiently, AiEX helps traders focus their attention on larger, more nuanced trades. During the year ended December 31, 2023, the percentage of trades executed by our institutional clients using our AiEX functionality was over 35% of total institutional trades, up from 6% in 2015, and we are seeing demand for AiEX continue to grow across some of our key products, including U.S. Treasuries, European government bonds, global swaps, U.S. corporate bonds and global ETFs.
Our over 25 year operating history has allowed us to build comprehensive and unique datasets across our markets and, as we add new products to our platforms, we will continue to create new datasets that may be monetized in the future. Our marketplaces generate valuable data, processing on average over 130,000 trades and significantly more pre-trade price updates daily, that we collect centrally and use as inputs to our pre-trade indicative pricing and analytics. We maintain a full history of inquiries and transactions, which means, for example, we have over 25 years of U.S. Treasury data. With markets becoming more electronic, clients increasingly turn to our composite data for its transparency and to help improve execution, further increasing the value proposition of our data. For example, in October 2023, we signed an amended and restated two-year market data license agreement with an affiliate of LSEG (formerly referred to as Refinitiv), pursuant to which LSEG will continue to distribute certain of our data directly to LSEG customers through its flagship financial platforms, LSEG Workspace, Datascope, LSEG Pricing Service and Tick History. The 2023 agreement, which was effective on November 1, 2023, replaced an existing agreement that was initiated in 2010 and most recently renewed in 2018, and provides us with increased revenue and flexibility in growing our market data offering. We will seek to further monetize our data over time both through potential expansion of our existing market data license agreement with LSEG and through distributing additional datasets, derived data and analytics offerings through our own network or through other third-party networks. For example, in October 2023, we also announced a strategic partnership with FTSE Russell which will seek to develop the next generation of fixed income pricing and index trading products. Fixed income closing prices will be administered as benchmarks by FTSE Russell and be derived from trading activity on our platform. The partnership aims to extend pricing coverage to most constituents featured in the FTSE Fixed Income Index universes and explore incorporating new Tradeweb pricing sets into FTSE Fixed Income Indices.
12
We are also continuously developing new offerings and solutions to meet the changing needs of our clients. For example, in 2023, we launched a new market data service to calculate real-time indicative net asset values (“iNAVs”) for ETFs. Our breadth of product coverage, depth of price contributions and timeliness of quotes help position Tradeweb iNAVs to become the market’s preferred solution for intraday ETF evaluation, which could ultimately boost trading confidence in the ETF market. Our offerings also include Automated Intelligent Pricing (“Ai-Price”), an innovative bond pricing engine that applies data science to help make markets more efficient and delivers reliable reference pricing for U.S. corporate and municipal bonds, regardless of how frequently a bond trades. Clients leverage the service to power their AiEX auto-trading, portfolio trading, and Transaction Cost Analysis (“TCA”).
Experienced Management Team
Our focus and decades of experience have enabled us to accumulate the knowledge and capabilities needed to serve complex, dynamic and highly regulated markets, and oversee our expansion into new markets and geographies while managing ongoing strategic initiatives including our significant technology investments. Our management team is composed of executives with an average of over 25 years of relevant industry experience including an average of over 10 years working together at Tradeweb under different ownership structures and through multiple market cycles, with a combination of veteran Tradeweb employees such as Mr. Billy Hult, who has been at the Company for over 20 years and took over as our Chief Executive Officer effective January 1, 2023 and new executives, including Mr. Thomas Pluta, who became our President effective as of January 1, 2023. Management has fostered a culture of collaborative innovation with our clients, which combined with management’s focus and experience, has been an important contributor to our success. We have been thought leaders and contributors to the public dialogue on key issues and regulations affecting our markets and industry, including congressional testimony, public roundtables, regulatory committees and industry panels.
Our Growth Strategies
Throughout our history, we have operated with agility to address the evolving needs of our clients. We have been guided by our core principles, which are to build better marketplaces, to forge new relationships and to create trading solutions that position us as a strategic partner to the clients that we serve. We seek to advance our leadership position by focusing our efforts on the following growth strategies:
Continue to Grow Our Existing Markets
We believe there are significant opportunities to generate additional revenue from secular and cyclical tailwinds in our existing markets:
Growth in Our Underlying Asset Classes
The underlying volumes in our asset classes continue to increase due to increased government and corporate issuance. In addition, the government bond market is foundational to and correlative to virtually every asset class in the cash and derivatives fixed income markets. Select products that we believe have a high growth potential due to current market trends include global government bonds, global interest rate swaps, ETFs and credit cash products.
Growth in Our Market Share
Our clients represent most of the largest institutional, wholesale and retail market participants. The global rates, credit, equities and money markets asset classes continue to evolve electronically, and we seek to increase our market share by continuing to innovate to electronify workflows. We intend to continue to increase our market share by growing our client base and increasing the percentage of our clients’ overall trading volume transacted in those asset classes on our platforms, including by leveraging our voice solutions to win more electronic trading business from electronic voice processing clients in our rates and credit asset classes. In particular, across many of our products, we are implementing an integrated approach to grow our market share — serving all three of our client sectors across all trade sizes, from odd-lot to block trades, through a variety of protocols. Many of our asset manager, hedge fund, insurance, central bank/sovereign entity and regional dealer clients actively trade multiple products on our platforms. In addition, our global dealer clients trade in most asset classes across all three client sectors. We also see a growing appetite for multi-asset trading to reduce cost and duration risk.
13
Electronification of Our Markets
Market demands and regulation are changing the paradigm of trading and driving the migration to electronic markets. Our clients desire transparency, best execution and choice of trading protocols amidst dynamic and evolving markets. Furthermore, innovations in capital markets have enabled increased automation and process efficiency across our markets. The electronification of our marketplaces varies by product. We typically see meaningful electronification of new products within three to five years of their launch, with certain products experiencing significant revenue growth following that period of time, including as a result of market and regulatory developments. For example, our U.S.- and euro-denominated derivative products experienced increased rates of electronification and related revenue growth following the implementation of mandates under the Dodd-Frank Act in 2013 and MiFID II in 2018 and we saw strong electronification increases in U.S. corporate bonds, repurchase agreements and swaps during the COVID-19 pandemic. We are well positioned to continue to innovate and provide better electronic markets and solutions that satisfy the needs of our clients and that meet changing market demands and evolving regulatory standards.
We believe that global government bonds, global interest rate swaps, global ETFs, in particular, institutional block ETFs, cash credit products, including corporate high grade and high yield bonds and emerging markets are key drivers of our potential growth. Our penetration of these markets, and their level of electronification, are at various stages. We are focused on growing our market share for these products by continuing to invest in new technology solutions that will attract new market participants to our platforms and increase the use of our platforms by existing clients.
Expand Our Product Set and Reach
We have grown our business by prudently expanding our offerings to add new products and asset classes, and we expect to continue to invest to add new products and expand into new complementary markets as client demand and market trends evolve. In 2017, we expanded into China to offer our global clients access to the Chinese bond market through our initiative with BondConnect, where Northbound trading began in 2017, and in 2020 we launched CIBM Direct. During 2021, we completed our first Southbound BondConnect transactions for various bonds tradable in the Hong Kong bond market, offering onshore investors enhanced access to oversees liquidity, pre-trade transparency and innovative trading protocols. During 2023, we announced that institutional clients executing Japanese Yen swaps on our multilateral trading facilities and swap execution facilities would now be able to clear their transactions via the Japan Securities Clearing Corporation (“JSCC”), providing more connectivity, flexibility and choice in Yen swap trading. Also in 2023, we participated in the development of and added the ability for our clients to have direct trading access on our platform to Swap Connect, the world’s first derivatives market access scheme, where offshore investors can trade and central counterparty clear onshore Chinese Yuan Renminbi interest rate swaps without changing their existing trading and settlement practices. The interest rate swap trades are cleared through Hong Kong Exchange OTC Clear under Hong Kong’s internationally-familiar legal framework. We continue to focus on these initiatives and on expanding opportunities with clients in the Asia region more broadly.
We have also expanded our product set to include wholesale electronic repurchase agreements, as well as U.S. and European bilateral repurchase agreements, European cash equities and U.S. options for our institutional client sector. We also intend to leverage innovation and technology capabilities to develop new solutions that help our clients trade more effectively and efficiently. For example, in 2023, we launched a new and innovative solution to help institutional investors trade EM bonds more efficiently, developed in collaboration with FXall, LSEG’s leading electronic platform for global currency products. This new FX swap workflow solution allows mutual clients of Tradeweb and FXall to buy or sell an EM bond via the request-for-quote or request-for-market protocols on Tradeweb and then seamlessly hedge the local currency risk by executing an FX swap trade via direct connection to FXall. In addition, our swap compression functionality allows clients to reduce their swap positions at the clearinghouse, resulting in significant cost savings. On our institutional U.S. credit platform, our portfolio trading solution allows clients to obtain competitive prices on a full basket of securities and trade on net present value from dealers. Our multi-asset package (MAP) trading allows clients to simultaneously execute interest rate swaps, inflations swaps and government bonds in a single electronic package enabling clients to achieve more competitive pricing, reduce manual booking errors and increase execution speed. Net spotting, which links our institutional U.S. credit and U.S. Treasury markets allows clients to reduce the operational stress and financial cost of executing offsetting Treasury hedges for corporate bonds that trade at a spread to the U.S. Treasury. Given the breadth of expertise of our sales people and management, we have the ability to focus on new client opportunities and on selling additional solutions to existing clients.
14
In addition, we believe our business model is well suited to serve market participants in other asset classes and geographies where our guiding principles can continue to transform markets and broaden our reach and we expect to grow our emerging markets footprint moving forward. Our international strategy involves offering our existing products in new geographies and then adding local products. In addition, we believe our trading models in one product or asset class are transferable to other products or asset classes, irrespective of geography. For example, we have leveraged our session-based trading technology in European corporate bonds for session-based trading in U.S. corporate bonds and Off-the-Run U.S. Treasuries and with our 2023 acquisition of Yieldbroker, we are well-positioned to seamlessly connect markets in Australia and New Zealand with our global network of clients and dealers. We have significant scale and breadth across our platforms, which position us well to take advantage of favorable market dynamics when introducing new products or solutions or entering into new markets.
Enhance Underlying Data and Analytics Capabilities to Develop Innovative Solutions
As the demand for data and analytics solutions grows across markets and geographies, we plan to continue to expand the scope of our underlying data, improve our tools and technology and enhance our analytics and trade decision support capabilities to provide innovative solutions that address this demand. As the needs of market participants evolve, we expect to continue to help them meet their challenges, which our continuous investments in data, technology and analytics enable us to do more quickly and efficiently. For example, we enhance our solutions by linking indicative pre-trade data to our clients’ specific trades to create predictive insights from client trading behavior. Our technology architecture reduces the time to market for new data solutions, which allows us to react quickly to client needs.
Effective in November 2023, we entered an amended and restated, two-year agreement with an affiliate of LSEG (formerly referred to as Refinitiv), extending our long-term relationship where LSEG licenses certain data from us, which provides us with a predictable and growing revenue stream.
We also have a roster of closing prices partnering with the FTSE Russell for UK Gilts and European government bonds and Intercontinental Exchange (“ICE”) for U.S. Treasuries in response to the growing demand for trusted reference price data that enables firms to manage investment portfolios, evaluate the fair value of securities, perform compliance monitoring and satisfy general accounting standards. In October 2023, we also announced a strategic partnership with FTSE Russell to develop the next generation of fixed income pricing and index trading products. The collaboration is focused on expanding benchmark pricing, broadening index inclusion and enhancing trading functionality across fixed income products.
We will continue to selectively pursue new strategic partnerships to expand our data and analytics offering over time.
Pursue Strategic Acquisitions and Alliances
As part of our culture of collaborative innovation, throughout our history we have completed various acquisitions and initiated several formal strategic alliances. These alliances have taken several forms, including distribution partnerships, technological alliances and other financial arrangements. We intend to continue to selectively consider opportunities to grow through strategic alliances and acquisitions. For example, in June 2021, we acquired Nasdaq’s U.S. fixed income electronic trading platform and in November 2022, we entered into a multi-year partnership with BlackRock with the goal to integrate our credit trading solutions and data into BlackRock’s Aladdin order execution management system. In August 2023, we acquired Yieldbroker, a leading Australian trading platform for Australian and New Zealand government bonds and interest rate derivatives and in January 2024, we acquired r8fin, a technology provider that specializes in algorithmic-based execution for U.S. Treasuries and interest rate futures. These and other opportunities should enhance our existing capabilities, allow us to leverage the scale of other parties and accelerate our ability to enter new markets or provide new solutions. Our focus continues to be on opportunities that we believe can enhance or benefit from our technology platform and client network, provide significant market share and profitability and are consistent with our corporate culture.
Our Client Sectors
We have a powerful network of more than 2,500 clients across the institutional, wholesale and retail client sectors. Our clients include leading global asset managers, hedge funds, insurance companies, central banks, banks and dealers, proprietary trading firms and retail brokerage and financial advisory firms, as well as regional dealers. Since the founding of Tradeweb more than 25 years ago, we have developed trusted relationships with many of our clients and have invested to integrate with their capital markets technology infrastructures. This has facilitated the collaborative approach we employ to solve our clients’ evolving workflow needs.
15
We provide deep liquidity pools to the institutional, wholesale and retail client sectors through our Tradeweb Institutional, Dealerweb and Tradeweb Direct platforms. We are dependent on our dealer clients to support our marketplaces by providing liquidity on our trading platforms, and certain of our dealer clients may account for a significant portion of our trading volume. Market knowledge and feedback from these dealer clients have also been important factors in the development of many of our offerings and solutions.
Our client sectors are continuing to become more interwoven and we believe we are well positioned to deliver the benefits of cross-marketplace network effects. Many of our asset manager, hedge fund, insurance, central bank/sovereign entity and regional dealer clients actively trade multiple products on our platforms. In addition, many of the commercial banks and dealers providing liquidity on Tradeweb Institutional are also active traders on Dealerweb, our wholesale platform, and provide odd-lot inventory for our retail client sector. We believe that this overlapping of client sectors and asset classes will continue and, in the long-term, will eliminate the distinctions across institutional, retail and wholesale channels. Given our technological capabilities, the diversity of our client sectors and the breadth of our products and trading protocols, we believe we are well positioned to capitalize on this emerging trend.
Institutional
Tradeweb Institutional offers dealer-to-client and all-to-all trading and related solutions to more than 1,950 liquidity-taking clients. Our clients include leading asset managers, hedge funds, insurance companies, regional dealers and central banks/sovereign entities. The Tradeweb Institutional platform serves 90% of the world’s largest 100 asset managers, over 80% of the top 25 insurance companies and over 60 central banks/sovereign entities with more than 200 dealers providing liquidity.
Tradeweb Institutional offers trading in a wide variety of products, including U.S. Treasuries, European government bonds, TBA MBS, global interest rate swaps, global corporate bonds and ETFs, among others. Our trading protocols include RFQ, Request-for-Market, Request-for-Stream, list trading, compression, blast all-to-all, Click-to-Trade, portfolio trading and inventory-based.
Wholesale
We provide fully electronic, hybrid and voice trading for the wholesale community on our Dealerweb platform. Our clients include more than 300 dealers and financial institutions with more than 190 actively trading on our electronic and hybrid markets. Nearly all of our electronic and hybrid dealer clients also trade on the Tradeweb Institutional and Tradeweb Direct platforms. Wholesale’s leading markets include TBA MBS, specified pools, other securitized products, global credit products, U.S. Treasuries, repurchase agreements, U.S. dollar-denominated swaps, U.S. ETFs and U.S. equity derivative products. Our electronic trading protocols include directed streams, central limit orderbook and session-based trading. We are well positioned to facilitate and capitalize on the continued transition of wholesale client trading from voice or hybrid trading to fully electronic trading. To that end, we have had over 90% growth in the number of e-participants on our wholesale client sector markets since 2016.
Retail
Tradeweb Direct, our regulated Alternative Trading System (“ATS”), offers financial advisors and their retail clients access to micro-lot liquidity provided by our network of broker-dealers. Tradeweb Direct serves over 50,000 financial advisors at approximately 250 retail brokerage and advisory firms. In addition, certain Tradeweb Direct clients provide access to over 170,000 retail clients through white-labeled, web-based front ends. Tradeweb Direct also provides access to its ATS to large and middle-market asset managers. Tradeweb Direct offers trading in a range of products, including U.S. corporate bonds, Treasuries, municipal bonds, structured products and certificates of deposit (CDs), using our Click-to-Trade, inventory-based and RFQ trading protocols. Participants on Tradeweb Direct have the ability to connect to our marketplaces via workstations or APIs or through access to websites that are white-labeled for our clients.
Our Asset Classes and Products
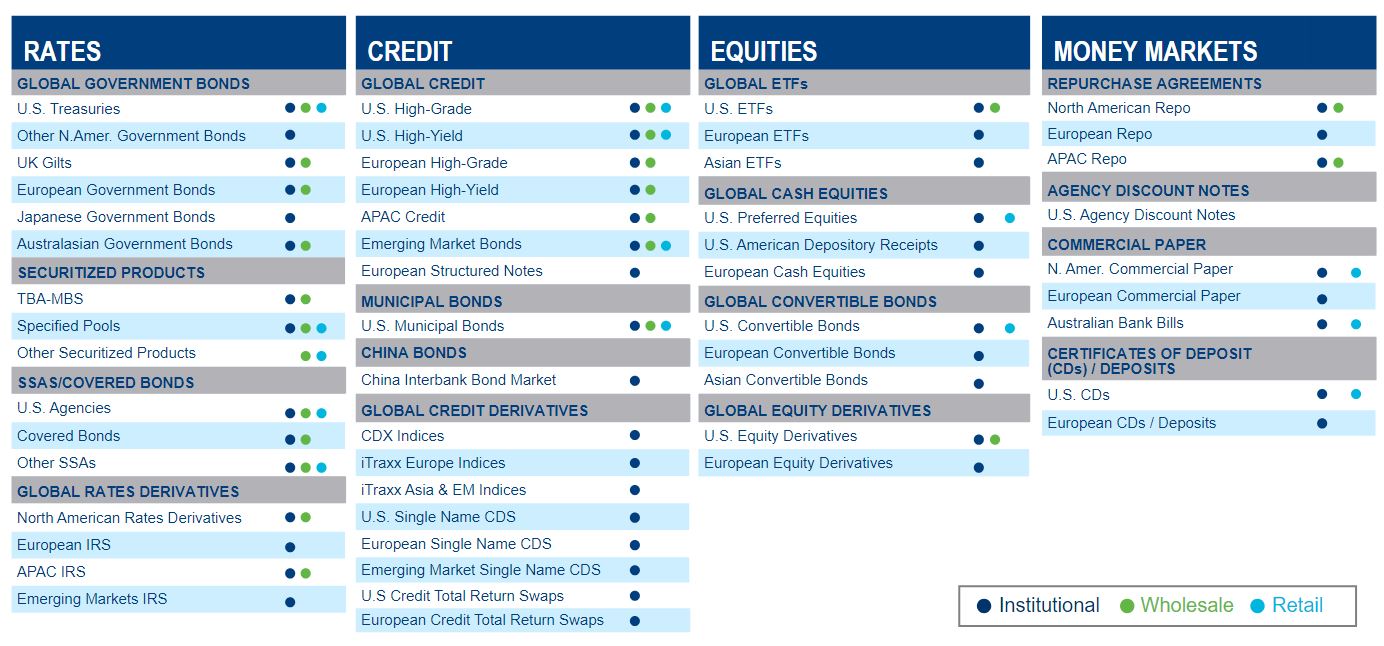
We offer efficient and transparent trading across a diverse range of asset classes:
•Rates: We facilitate trading in a broad range of cash and derivatives rates products, including major government securities, such as U.S. Treasury securities and European government bonds, mortgage-backed securities, interest rate swaps and agency/supranational securities and other rates products.
•Credit: We offer deep pools of liquidity for our clients in cash and derivatives credit products, including U.S. and European high grade and high yield bonds, China bonds, municipal bonds, index, single name and sovereign credit default swaps and other credit products.
16
•Equities: We offer trading in a range of cash and derivatives equities products, including global ETFs, equity derivatives and other equities products.
•Money Markets: We offer trading in a broad range of cash money market products, including commercial paper, agency discount notes, repurchase agreements, certificates of deposit and Treasury bills and other money markets products.
Our Geographies
We have a global footprint serving more than 2,500 clients in over 70 countries across the Americas, EMEA (Europe, Middle East and Africa) and APAC (Asia Pacific) regions and with offices in North America, Europe, Asia, Australia and the Middle East. By region:
•We serve more than 1,500 clients in the Americas across North, Central and South America.
•We serve more than 700 clients in EMEA across Europe, the Middle East and North Africa.
•We serve more than 300 clients in APAC across Asia, the Pacific, Oceania and the Indian sub-continent.
In addition, we currently support trading across over 25 currencies globally.
We believe our platforms, technology and solutions have made trading in markets globally more efficient and transparent. Furthermore, our expertise in multiple jurisdictions positions us as a partner of choice as our clients expand their trading operations to new geographies. As the global markets move to electronic trading, we expect to be at the forefront of this change.
Our Solutions
We provide clients with solutions across the trade lifecycle including pre-trade data and analytics, intelligent trade execution, straight-through processing and post-trade data, analytics and reporting.
•Pre-Trade Data and Analytics: We provide clients with accurate, real-time market data and streaming price updates across more than 50 products. Major financial publications across the globe reference our market data. Our real-time market data services include major government bonds, corporate bonds, mortgage-backed securities, fixed income derivatives and money markets. For example, data and analytics power our Automated Intelligent Price, or Ai-Price, functionality, which delivers benchmark pricing and insights for over 26,000 U.S. corporate bonds. We integrate directly with order management systems allowing for order entry and pre-trade compliance and risk analysis. Clients are also able to perform credit checks for cleared derivatives trading — either with limits on our system or through connectivity to the futures commission merchants.
17
In addition, we provide LSEG with certain real-time market data feeds for multiple fixed income and derivatives products under a license pursuant to which LSEG distributes such market data to its customers on its platforms and through direct feeds.
•Trade Execution: Trade execution is at the core of our business. We provide marketplaces and tools that facilitate trading by our clients and streamline their related workflows. Our market specialists and technology team work closely with our clients to continuously innovate and improve their trading practices. The trading protocols we currently offer on our platforms include:
•Request-for-quote. Our multi-dealer request-for-quote, or RFQ, protocol provides institutional clients with the ability to hold a real-time auction with multiple dealers and select the best price. RFQ was pioneered by Tradeweb in 1998 and has been deployed across all of our rate markets, including government bonds, mortgage-backed securities and U.S. agencies, and our other asset classes. The RFQ is a fully-disclosed trading protocol — both buy-side and sell-side names are known prior to execution. Multi-dealer RFQ assists clients with achieving best execution.
•Request-for-market. Our request-for-market, or RFM, protocol provides institutional clients with the ability to request a two-sided market from a particular dealer. This mirrors the approach of a client calling a specific trader for market prices and rates before showing the direction they want to trade. The RFM protocol has been effective in some of our newer markets, including credit default swap indices, where it is integrated with the RFQ and click-to-trade protocols on a single trading screen.
•Request-for-stream. Our request-for-stream, or RFS, protocol allows multiple dealers to show clients continuously updating rates, in line with market movements, during a client’s request window.
•List trading. Used by clients with multiple transactions to complete, our list trading protocol is a highly efficient workflow tool. By executing many trades at once, clients can request prices from multiple dealers to extract the best price and complete the hedging of the trades at one time, saving significant manual effort compared to executing on the telephone.
•Compression. Clients utilize our interest rate swap compression tool as an efficient means to reduce the number of line items they have outstanding at a clearinghouse by netting offsetting positions in a single transaction. This functionality allows clients to submit up to 250 line items to liquidity providers for simultaneous list pricing, which they can execute, clear and report in one transaction, reducing both their risk and clearing costs. The Tradeweb compression tool is flexible and versatile in design allowing clients to adapt the tool to their workflow and customize for non-standard/bespoke swaps.
•Blast all-to-all. Our Blast all-to-all, or A2A, protocol allows clients to send RFQ trade inquiries to all market participants in a given market and receive responses for executions. Trades are exposed to all liquidity providers simultaneously to broaden their liquidity sources. Blast A2A is currently used by our institutional clients in our global credit marketplaces, including U.S. high grade, U.S. high yield, European credit products and other corporate bonds. The Blast A2A functionality provides alert and inquiry monitors so participants are notified of trading opportunities. Clients can send single or list trade inquiries and can receive responses for full or partial fills. Clients can also leverage our AiEX tool in conjunction with this trading protocol.
•Click-to-trade. Our click-to-trade, or CTT, protocol enables a liquidity-taking client to view a set of prices in real-time and click on the price and the dealer with whom they wish to execute. This trading protocol is especially popular with clients that are looking to view a range of executable, real-time prices across dealers.
•Portfolio Trading. To support rebalancing of passive portfolios and ETFs, our portfolio trading solution allows clients to obtain competitive prices and trade on net present value on a full basket of securities.
•Session-based. Sweep, our session-based trading protocol, allows clients to manage inventory and balance sheets by entering orders to be matched against opposite orders at a specified time and price, concentrating market liquidity to a particular point in time. This protocol leverages our broker relationships, technology, and pricing from the overall Tradeweb network to fill the gap between voice brokering and fully electronic order book trading.
18
•Central Limit Order Book. Our central limit order book, or CLOB, is a continuous electronic protocol that allows clients to trade on firm bids and offers from other market participants, as well as enter their own resting bids and offers for display to the market participants, typically anonymously.
•Directed streams. Our directed streams protocol, which is currently used by our wholesale clients in the On-The-Run U.S. Treasury marketplace, gives clients an efficient alternative to traditional voice and order book trading. Liquidity-taking and liquidity-providing clients can establish data-driven, customized bilateral trading relationships that deliver real-time price discovery and high quality execution. In this matched principal model, clients can connect to a single platform to transact with multiple pools of directed liquidity.
◦Inventory-based. Our inventory-based protocol allows liquidity-providing clients to submit a range of bids and offers for particular securities that a counterparty can then look to execute on. These prices are not necessarily updated in real-time but provide a good indication of where the counterparty is likely to complete the trade. This protocol is most commonly deployed in less liquid, security-specific marketplaces, such as certain credit and money markets marketplaces.
◦Rematch. Our Rematch protocol allows dealers to send accepted, but unmatched orders from a Sweep session to the all-to-all network as an anonymous RFQ. For a pre-set period of time, sell-side participants create a second opportunity to trade a given security with a larger and more diverse set of counterparties. Rematch connects our wholesale liquidity to our institutional and retail liquidity pools.
◦Voice. Voice-brokered products in our wholesale client sector include, among other products, U.S. Treasuries, MBS, municipal bonds and repurchase agreements. Our voice brokers provide anonymity and insight for sell side traders and give us valuable high-touch relationships and market understanding and access.
Tradeweb Automated Intelligent Execution, or AiEX, is an innovative automated trading technology that allows clients to execute large volumes of trade tickets at a high speed using pre-programmed execution rules that are tailored to the client’s trading strategy. Clients use AiEX to efficiently automate high volumes of small, basic trades to free up time and create capacity. In addition, clients apply AiEX to more complex execution strategies to open up new trading opportunities. The trading benefits of AiEX include efficient accelerated execution, better optimization to fine-tune dealer selection and enhanced automated compliance.
•Trade Processing: Our trade processing technology allows our clients to increase productivity, reduce risk and improve overall performance. Our post-trade solutions allow clients to allocate their electronic or phone-executed trades electronically, including storing and communicating organizational and sub-account settlement, identity and confirmation preference information for processing trades. Our post-trade solutions also make it easier for clients to communicate trade settlement information to dealers, prime brokers, fund administrators and confirmation vendors. Additionally, clients can send trades to clearinghouses and reporting in real-time through third-party middleware or Tradeweb developed direct links. We work side by side with numerous industry partners to provide direct server-to-server connections. By eliminating manual re-entry of trade and allocation information, our solutions assist clients in reducing failed trades and saving time, effort and money.
•Post-Trade Data, Analytics and Reporting: Our comprehensive post-trade services include transaction cost analysis, or TCA, best execution reporting and client performance reports. These powerful tools provide our clients with ways to measure and optimize their trade performance. Our TCA tools monitor the cost effectiveness and quality of execution of trading activities for trades executed on or off Tradeweb. Our post-trade performance reports provide a summary of trading activity including detailed exception reports, price benchmarking and peer group comparisons. In partnership with FTSE Russell, we also provide U.S. Treasury, UK Gilt and European government bond closing prices in a manner consistent with the International Organization of Securities Commissions (“IOSCO”) principles and United Kingdom (“UK”) and European Union (“EU”) Benchmark Regulation (“BMR”). These reference prices can be used for asset valuation, trade at close and as reference rates in derivatives contracts. To support MiFID II regulatory obligations, we operate an APA reporting service in the UK and EU to allow clients to meet post-trade transparency requirements for off-venue or OTC trading activity. Our APA service provides regulatory pre-trade and post-trade reporting across multiple asset classes, including for products not offered by Tradeweb. The APA service also provides venue reporting for clients for LSEG’s FX trading venues.
19
Sales and Marketing
We sell and promote our offerings and solutions using a variety of sales and marketing strategies. Our sales organization, which is generally not commission based, follows a team-based approach to covering clients, deploying our product and regional expertise as best dictated by evolving market conditions. The team has historically been organized by client sector and then by region, but as markets have converged, we have increasingly leveraged our global and cross-product expertise to drive growth. Our sales team, which works closely with our technology team, is responsible for new client acquisition and the management of ongoing client relationships to increase clients’ awareness, knowledge and usage of our trading platforms, new product launches, information and data services and post-trade services. Our sales team is also responsible for training and supporting new and existing clients on their use of our platforms and solutions and for educating clients more broadly on the benefits of electronic trading, including how to optimize their trading performance and efficiency through our various trading protocols.
Given the breadth of our global client network, trading volume activity and engagement with regulatory bodies, we regularly work to help educate market participants on market trends, the impact of regulatory changes and technology advancements. Our senior executives often provide insight and thought leadership to the industry through conversations with the media, appearances at important industry events, roundtables and forums, submitting authored opinion pieces to media outlets and conducting topical webinars for our clients. We believe this provides a valued service for our constituents and enhances our brand awareness and stature within the financial community.
Additionally, we employ various marketing strategies to strengthen our brand position and explain our offerings, including through our public website, advertising, digital and social media, earned media, direct marketing, promotional mailings, industry conferences and hosted events.
Competition
The markets for our solutions continue to evolve and are competitive in the asset classes, products and geographies in which we operate. We compete with a broad range of market participants globally. Some of these market participants compete in a particular market, while select others compete against the entire spectrum of our offerings and solutions. In addition, there are other companies that have the platform breadth and global reach that we provide. We believe that our comprehensive offerings, global reach, culture of collaboration and broad network increasingly differentiate us from other market participants.
We primarily compete on the basis of client network, domain expertise, breadth of offerings and solutions and ease of integration of our platforms with our client’s technology, as well as the quality, reliability, security and ease of our platforms and solutions. We face six main areas of competition:
•Other electronic trading platforms: We compete with a number of other electronic trading venues. These include MarketAxess, Bloomberg, ICE (Bondpoint, TMC Bonds, Creditex), Trumid, TP ICAP (Liquidnet) and others in the credit and municipal markets; Bloomberg, Euronext (MTS), CME Group (NEX Group), BGC Partners (Fenics), MarketAxess (LiquidityEdge), GLMX and others in the rates and derivatives markets; and Virtu (RFQ-hub) and Bloomberg in the equities and ETF markets.
•Exchanges: In recent years, exchanges have pursued acquisitions that have put them in competition with us. For example, ICE acquired BondPoint and TMC Bonds, retail-focused platforms, and Interactive Data Corporation (“IDC”), a provider of fixed income data, in an effort to expand its portfolio of fixed income products and services. CME Group and CBOE also operate exchanges that compete with us. Exchanges also have data and analytics relationships with several market participants, which increasingly put their offerings in direct competition with Tradeweb.
•Inter-dealer brokers: We compete with inter-dealer brokers, particularly in our wholesale markets in products such as MBS, U.S. Treasuries, U.S. repo and products traded on Swap Execution Facilities (“SEFs”). Major competitors include TP ICAP, BGC Partners and Tradition. Many of these firms also offer voice, electronic and hybrid trading protocols. As larger, full service inter-dealer brokers have consolidated, numerous boutique firms and alternative electronic start-ups are attempting to capture select markets.
•EMS and OMS providers: There are various providers of execution management services (“EMS”) and order management services (“OMS”) that have announced plans to offer aggregation of trading venue liquidity, as well as direct-to-dealer fully electronic trading solutions.
•Single-bank systems: Major global and regional investment and commercial banks offer institutional clients electronic trade execution through proprietary trading systems. Many of these banks expend considerable resources on product development, sales and support to promote their single-bank systems.
20
•Dealers: Many of our markets are still traded through traditional voice-based protocols. Institutional investors have historically purchased fixed-income securities, large blocks of equity securities, or ETFs, or entered into OTC derivative transactions, by telephoning sales professionals at dealers. We face competition from trading conducted over the telephone between dealers and their institutional clients.
•Market data and information vendors: Market data and information providers, such as Bloomberg, IDC (now part of ICE) and IHS Markit, have a pervasive presence across the financial trading community. Their data and pre- and post-trade analytics compete with offerings we provide to support trading on our marketplaces.
We face intense competition, and we expect competition with a broad range of competitors to continue to intensify in the future. See Part I, Item 1A. – “Risk Factors — Risks Relating to Market and Industry Dynamics and Competition — Failure to compete successfully could materially adversely affect our business, financial condition and results of operations.”
Proprietary Technology
For more than 25 years, we have collaborated with our clients to continually innovate and evolve with the structure of our markets. This collaboration enables us to remain agile across client sectors, geographies, asset classes and products providing speed to market and a distinct cost and innovation advantage to our clients. Critical to our ability to collaborate with clients and remain at the forefront of evolving market trends is our team of over 350 technologists, which works closely with our client, product and sales teams and has deep market knowledge and domain expertise. This knowledge and expertise not only allows us to address client demand but also to focus on those solutions that can be scaled across client sectors, asset classes and trading protocols.
Our systems are built to be scalable, flexible and resilient. Our core software solutions span the trading lifecycle and include pre-trade analytics, trade execution and post-trade data, analytics and reporting, connectivity and straight-through processing.
A significant portion of our operating budget is dedicated to system design, development and operations in order to achieve high levels of overall system performance. We continually monitor our performance metrics and upgrade our capacity configurations and requirements to handle anticipated peak trading activity in our highest volume products.
The key aspects of our proprietary technology infrastructure include facilitating client-driven innovation, launching new solutions quickly and investing in talent, machine learning and AI capabilities. These aspects of our technology lead to the following:
•Nimble product development in collaboration with clients: Our approach to product development facilitates continuous releases of important product features. This allows us to be opportunistic in what we decide to release at any point in time and inject newly discovered opportunities into the trade lifecycle. We have designed our platforms to be component-based and modular. New components can be built quickly and have detailed monitoring and command capabilities embedded.
•Scalable architecture: Our scalable architecture was designed to address increased trading activities and evolving market structures in a cost efficient manner. Furthermore, the diversity and breadth of our platforms allow us to expand our capabilities across new markets. We use third-party data centers to more flexibly manage our capacity needs and costs, as well as to leverage security, network and service capabilities.
•Strong business continuity and disaster recovery planning: We continue to regularly evaluate and enhance our business continuity plans in place in the event of a significant business disruption or disaster recovery situation to ensure the resilience of critical systems required for normal operations and the safety of all employees. The plans cover a range of scenarios and adhere to industry standards and regulatory mandates as outlined by the Interagency Paper on Sound Practices to Strengthen the Resilience of the U.S. Financial System, the SEC’s Regulation Systems Compliance and Integrity, Commodity Futures Trading Commission (“CFTC”) rules concerning system safeguards and other agencies and entities. Activities covered by the plans include the primary responsible parties at Tradeweb, actions to restore essential systems and applications with target recovery times to accomplish all stated objectives and communications to staff, partners, clients and regulators. The plans are periodically updated based on the most relevant threats to operations and tested to ensure effectiveness during emergency conditions.
We also maintain redundant networks, hardware, data centers and alternate operational facilities to address interruptions. We have ten datacenters across the United States, the UK , Japan and Austrialia. Our data center infrastructure is designed to be resilient and responsive with built-in redundancies.
21
•Ongoing security, system monitoring and alerting: We prioritize security throughout our platforms, operations and software development. We make architectural, design and implementation choices to structurally address security risks, such as logical and physical access controls, perimeter firewall protection and embedded security processes in our systems development lifecycle. Our cyber security program is based on a combination of ISO/ICE 27001 principles, the National Institute of Standards and Technology Cybersecurity Framework and industry best practices. Our Chief Information Security Officer leads a qualified cybersecurity team in assessing, managing and reducing material risks from cybersecurity threats to protect critical operations and delivery of service. We continuously monitor connectivity, and our global operations team is alerted if there are any suspect events. See Part I, Item 1C. – “Cybersecurity – Governance” for further detail regarding our cybersecurity risk management, strategy and governance structure.
Intellectual Property
Like most companies that develop technology in-house, we rely upon a combination of copyright, patent, trade secret and trademark laws, written agreements and common law to protect our proprietary technology, processes and other intellectual property.
To that end, we have patents or patents pending in the United States and other jurisdictions covering significant trading protocols and other aspects of our trading system technology.
In addition, we own, or have filed applications for, the rights to trade names, trademarks, copyrights, domain names and service marks that we use in the marketing of our platforms and solutions to clients. We have registered for trademarks in many of our markets, including our major markets, with registrations pending in others. Trademarks registered include, but are not limited to, “Tradeweb,” “Dealerweb,” and “Tradeweb Direct.”
We also enter into written agreements with third parties, employees, clients, contractors and strategic partners to protect our proprietary technology, processes and other intellectual property, including agreements designed to protect our trade secrets. Examples of these written agreements include third-party non-disclosure agreements, employee non-disclosure and inventions assignment agreements, licensing agreements and restricted use agreements.
Regulation
Many aspects of our business are subject to regulation in a number of jurisdictions, including the United States, the UK, the Netherlands, France, Germany, Japan, Hong Kong, Singapore, Australia and the Dubai International Financial Centre (“DIFC”). In these jurisdictions, government regulators and self-regulatory organizations oversee the conduct of our business, and have broad powers to promulgate and interpret laws, rules and regulations that may serve to restrict or limit our business. As a matter of public policy, these regulators are tasked with ensuring the integrity of the financial and securities markets and protecting the interests of investors in those markets generally. Rulemaking by regulators, including resulting market structure changes, has had an impact on our business by directly affecting our method of operation and, at times, our profitability, as well as indirectly by imposing costs in the form of increased compliance, personnel, and technology needs in order to comply with relevant laws and regulations.
As registered trading platforms, broker-dealers, introducing brokers and other types of regulated entities as described below, certain of our subsidiaries are subject to laws, rules and regulations (including the rules of self-regulatory organizations) that cover all aspects of their business, including manner of operation, system integrity, anti-money laundering and financial crimes, handling of material non-public information, safeguarding data, capital requirements, reporting, record retention, market access, licensing of employees and the conduct of officers, employees and other associated persons.
Regulation can impose, and has imposed, obligations on our regulated subsidiaries, including our broker-dealer subsidiaries. These increased obligations require the implementation and maintenance of internal practices, procedures and controls, which have increased our costs. Many of our regulators, as well as other governmental authorities, are empowered to bring enforcement actions and to conduct administrative proceedings, examinations, inspections and investigations, which may result in increased compliance costs, penalties, fines, enhanced oversight, increased financial and capital requirements, additional restrictions or limitations, censure, suspension or disqualification of the entity and/or its officers, employees or other associated persons, or other sanctions, such as disgorgement, restitution or the revocation or limitation of regulatory approvals. Whether or not resulting in adverse findings, regulatory proceedings, examinations, inspections and investigations can require substantial expenditures of time and money and can have an adverse impact on a firm’s reputation, client relationships and profitability. From time to time, we and our associated persons have been and are subject to routine reviews, none of which to date have had a material adverse effect on our businesses, financial condition, results of operations or prospects. As a result of such reviews, we may be required to amend certain internal structures and frameworks, such as our operating procedures, systems and controls.
22
The regulatory environment in which we operate is subject to constant change. We are unable to predict how certain new laws and proposed rules and regulations will be implemented or in what form, or whether any changes to existing laws, rules and regulations, including the interpretation, implementation or enforcement thereof or a relaxation or amendment thereof, will occur in the future. We believe that uncertainty and potential delays around the final form of certain new rules and regulations may negatively impact our clients and trading volumes in certain markets in which we transact, although a relaxation of or the amendment of existing rules and requirements could potentially have a positive impact on certain markets. While we generally believe the net impact of the laws, rules and regulations may be positive for our business, it is possible that unintended consequences may materially adversely affect us in ways yet to be determined. See Part I, Item 1A. – “Risk Factors — Risks Relating to Legal, Regulatory and Tax Considerations — Our business, and the businesses of many of our clients, could be materially adversely affected by new laws, rules or regulations or changes in existing laws, rules or regulations, including the interpretation and enforcement thereof.”
U.S. Regulation
In the United States, the SEC is the federal agency primarily responsible for the administration of the federal securities laws, including adopting and enforcing rules and regulations applicable to broker-dealers. Two of our broker-dealers operate alternative trading systems subject to the SEC’s Regulation ATS, which includes certain specific requirements and compliance responsibilities in addition to those faced by broker-dealers generally. Broker-dealers are also subject to regulation by state securities administrators in those states in which they conduct business or have registered to do business. We are also subject to the various anti-fraud provisions of the Securities Act, the Exchange Act, the Commodity Exchange Act, certain state securities laws and the rules and regulations promulgated thereunder. We also may be subject to vicarious and controlling person liability for the activities of our subsidiaries and our officers, employees and affiliated persons.
The CFTC is the federal agency primarily responsible for the administration of federal laws governing activities relating to futures, swaps and other derivatives (but excluding security-based swaps) including the adoption of rules applicable to SEFs. Our SEFs are subject to regulations that relate to trading and product requirements, governance and disciplinary requirements, operational capabilities, surveillance obligations and financial information and resource requirements, including the requirement that they maintain sufficient financial resources to cover operating costs for at least one year.
Much of the regulation of broker-dealers’ operations in the United States has been delegated to self-regulatory organizations. These self-regulatory organizations adopt rules (which are generally subject to approval by the SEC) that govern the operations of broker-dealers and conduct periodic inspections and examinations of their operations. In the case of our U.S. broker-dealer subsidiaries, the principal self-regulatory organization is the Financial Industry Regulatory Authority, Inc. (“FINRA”). Accordingly, our U.S. broker-dealer subsidiaries are subject to both scheduled and unscheduled examinations by the SEC and FINRA. In addition, our broker-dealers’ municipal securities-related activities are subject to the rules of the Municipal Securities Rulemaking Board (“MSRB”). In connection with our introducing broker-related activities, we are also subject to the oversight of the National Futures Association (“NFA”), a self-regulatory organization that regulates certain CFTC registrants.
Following the 2008 financial crisis, legislators and regulators in the United States adopted new laws and regulations, including the Dodd-Frank Act. Various rules and regulations were promulgated following the financial crisis, such as the Volcker Rule and additional bank capital and liquidity requirements.
In addition, Title VII of the Dodd-Frank Act (“Title VII”) amended the Commodity Exchange Act and the Exchange Act to establish a regulatory framework for swaps, subject to regulation by the CFTC, and security-based swaps, subject to regulation by the SEC. The CFTC has completed the majority of its regulations in this area, most of which are in effect. The SEC has also finalized many of its security-based swap regulations. Among other things, Title VII rules require certain standardized swaps to be cleared through a central clearinghouse and/or traded on a designated contract market or SEF, subject to various exceptions. Title VII also requires the registration and regulation of certain market participants, including SEFs, and requires SEFs to maintain robust front-end and back-office information technology capabilities. The SEC is charged with regulations for “security-based swaps” (i.e., swaps based on certain types of securities or loans). In late 2023, the SEC adopted registration requirements for entities that act as security-based swap execution facilities (“SBSEFs”). We expect that one or more of our subsidiaries will register in this capacity with the SEC and, as such, will become subject to further new extensive regulation at an entity level as well as new requirements specifically applicable to the business as it relates to security-based swaps. We anticipate that implementation of these requirements will be substantially similar to requirements implemented as a result of operating as a CFTC-registered SEF, but the implementation will likely result in new challenges and oversight risk.
23
The regulatory environment in the U.S. continues to evolve and while legislation to roll-back key pieces of the Dodd-Frank Act in an effort to loosen certain regulatory restrictions on financial institutions has been issued, the industry continues to be more heavily regulated than it was prior to the 2008 financial crisis. While it is still largely unknown at this time to what extent new legislation will be passed into law or whether pending or new regulatory proposals will be adopted or modified, or what effect such passage, adoption or modification will have, whether positive or negative, on our industry, our clients or us, both the SEC and the CFTC have issued a number of regulatory proposals and we may continue to see the same level of activity by these two regulators in the future. For example, in August 2022, the CFTC issued a final rule modifying the swap clearing requirement in support of the transition from LIBOR and other Interbank Offered Rates to Alternative Reference Rates and Tradeweb SEF LLC filed and received approval on July 7, 2023 to include certain swaps referencing risk-free rates as designated made available to trade products. Additionally, the SEC has recently conducted a review of the regulatory framework for fixed-income electronic trading platforms for the purpose of evaluating the potential regulatory gaps that may exist among such platforms, including ours, with respect to access to markets, system integrity, surveillance, and transparency, among other things. In recent years, the SEC proposed rules that would expand Regulation ATS and Regulation SCI to capture alternative trading systems (“ATS”) that trade government securities and amend the SEC rule regarding the definition of an “exchange” to include Communication Protocol Systems, such as our RFQ protocols. In April 2023, the SEC proposed separate, specific rules that would update the requirements of Regulation SCI and expand the number and types of entities that must comply with Regulation SCI. In connection with these proposed rules, we expect that we will have to operate additional trading protocols in compliance with Regulation ATS and Regulation SCI. It is unknown at this time to what extent new legislation will be passed into law or whether pending or new regulatory proposals will be adopted or modified, or what effect such passage, adoption or modification will have, whether positive or negative, on our industry, our clients or us.
The SEC also adopted final rules on December 13, 2023 regarding central clearing of certain secondary market repurchase and reverse repurchase transactions and secondary market purchase and sale transactions involving U.S. Treasury securities. Although the final rule was more limited in scope than the initial rule proposal, this central clearing mandate will impact certain market participants who do not clear today, and some have expressed concerns about the potential impact of additional clearing costs that may impact liquidity. While we expect this change will increase our own platform efficiency and potentially create greater electronification of trading, it is still unknown at this time the full impact of this change, and what effect it will have, whether positive or negative, on our industry, our clients or us.
Non-U.S. Regulation
Outside of the United States, we are currently regulated by: the Financial Conduct Authority (“FCA”) in the UK, the De Nederlandsche Bank (“DNB”) and the Netherlands Authority for the Financial Markets (“AFM”), Autorité Des Marchés Financiers (“AMF”) and Autorité de contrôle prudentiel et de resolution (“ACPR”) in France, Bundesanstalt für Finanzdienstleistungsaufsicht (“BaFin”) in Germany, the Japan Financial Services Agency (the “JFSA”), the Japan Securities Dealers Association (the “JSDA”), the Securities & Futures Commission (the “SFC”) of Hong Kong, the Monetary Authority of Singapore (the “MAS”), the Australian Securities and Investment Commission (the “ASIC”), the Comisión Nacional Bancaria y de Valores (the “CBNV”) in Mexico, the Swiss Financial Market Supervisory Authority (“FINMA”), the Investment Industry Regulatory Organization of Canada and provincial regulators in Canada and the Dubai Financial Services Authority (the “DFSA”) in the DIFC.
The FCA’s strategic objective is to ensure that the UK’s markets function well and its operational objectives are to protect consumers, to protect and enhance the integrity of the UK financial system and to promote effective competition in the interests of consumers. It has investigative and enforcement powers derived from the Financial Services and Markets Act 2000 (“FSMA”) and subsequent legislation and regulations. The FCA is responsible for supervision of our conduct and prudential compliance. Subject to section 178 of FSMA, individuals or companies that seek to acquire or increase their control in a firm that the FCA regulates is required to obtain prior approval from the FCA.
The legal framework in the Netherlands for financial undertakings is predominantly included in the Dutch Financial Supervision Act (Wet op het financieel toezicht or “FSA”). The AFM, like the DNB, is an autonomous administrative authority with independent responsibility for fulfilling its supervisory function. Pursuant to section 2:96 of the FSA, the AFM authorizes investment firms. The AFM is legally responsible for business supervision. The DNB is responsible for prudential supervision. The purpose of prudential supervision is to ensure the solidity of financial undertakings and to contribute to the stability of the financial sector. Holders of a qualifying holding (in short, shareholdings or voting rights of 10% or more) must apply to the DNB for a declaration of no objection and satisfy the applicable requirements pursuant to section 3:95 of the FSA. The DNB and the AFM co-operate under the provisions of the FSA and have concluded a covenant on the co-operation and co-ordination of supervision and other related tasks.
24
Much of our derivatives volume continues to be executed by non-U.S. based clients outside the United States and is subject to local regulations. In particular, the EU has enhanced the existing laws and developed new rules and regulations targeted at the financial services industry, including MiFID II and Markets in Financial Instruments Regulation (“MiFIR”), which were implemented in January 2018 and which introduced significant changes to the EU financial markets, including the fixed income and derivative markets, designed to facilitate more efficient markets and greater transparency for participants.
During 2023, the European Securities and Markets Authority (“ESMA”), the EU’s financial markets regulator and supervisor, announced a shift in its Union Strategic Supervisory Priorities (“USSPs”), introducing cyber risk and digital resilience as key areas of focus alongside environmental, social and governance disclosures. The strategy takes into account the key priorities of the EU in the area of financial services and aims to address the most significant risks linked to EU financial markets. It is structured around the following key areas: effective financial markets and financial stability, supervision and supervisory convergence, retail investor protection, sustainable finance and technological innovation and increased use of data. With this new priority, EU supervisors will put greater emphasis on reinforcing firms’ information and communication technology (“ICT”) risk management surrounding the use of financial technology systems (including but not limited to trading venue technologies) through close monitoring and supervisory actions, building new supervisory capacity and expertise. The new USSP will come into force in 2025, at the same time as the Digital Operational Resilience Act. This timeline is intended to provide supervisors and firms in member states with sufficient time to prepare for compliance with the new regulatory requirements. Meanwhile, ESMA and national competent authorities (“NCAs”) will carry out preparatory work planning and shaping the supervisory activities to undertake this priority. The USSPs are an important tool through which ESMA coordinates and focuses supervisory action with NCAs across the EU on specific topics.
The Digital Operational Resilience Act (“DORA”) is a new EU framework which aims to enhance and harmonize the digital operational resilience and cyber security of entities across the EU financial sector. Under DORA firms that are in scope will need to adopt a broader business view of resilience, with accountability clearly established at the senior management level. DORA consists of the following key pillars: ICT risk management requirements, reporting of ICT incidents, testing programs covering ICT tools, systems and processes, ICT third party risk management and an oversight framework for critical ICT third-party service providers.
Capital Requirements
Certain of our subsidiaries are subject to jurisdiction specific regulatory capital requirements, designed to maintain the general financial integrity and liquidity of a regulated entity. In general, they require that at least a minimum amount of a regulated entity’s assets be kept in relatively liquid form. Failure to maintain required minimum capital may subject a regulated subsidiary to a fine, requirement to cease conducting business, suspension, revocation of registration or expulsion by the applicable regulatory authorities, and ultimately could require the relevant entity’s liquidation. As of December 31, 2023, each of our regulated subsidiaries had maintained sufficient net capital or financial resources to at least satisfy their minimum requirements. See Note 19 – Regulatory Capital Requirements to our audited consolidated financial statements included elsewhere in this Annual Report on Form 10-K.
Regulatory Status of Tradeweb Entities
Our operations span jurisdictions across North America, South America, Europe, Asia, Australia and the Middle East, and we operate through various regulated entities. The current regulatory status of our regulated entities is described below.
Tradeweb LLC is a SEC-registered broker-dealer and a member of FINRA and MSRB. Tradeweb LLC is also a CFTC-registered introducing broker and a member of NFA. Tradeweb LLC relies on the international dealer exemption in the Canadian provinces of Ontario, Alberta, British Columbia, New Brunswick, Nova Scotia, Quebec, Saskatchewan and Manitoba and is recognized as a foreign trading venue in Switzerland.
Dealerweb Inc. is a SEC-registered broker-dealer, operates an ATS and is a member of FINRA and MSRB. Dealerweb Inc. is also a CFTC-registered introducing broker and a member of NFA. Dealerweb Inc. is recognized as a foreign trading venue in Switzerland. Dealerweb relies on the international dealer exemption in the Canadian provinces of Ontario, Quebec and Nova Scotia and the ATS Order Exemption for Ontario, Quebec and Nova Scotia.
Execution Access, LLC, acquired in June 2021, was a SEC-registered broker-dealer that operated an ATS and was a member of FINRA. In November 2022, Execution Access, LLC merged with and into Dealerweb Inc. with Dealerweb Inc. being the surviving entity.
25
Tradeweb Direct LLC is a SEC registered broker-dealer, operates an ATS and is a member of FINRA and MSRB. Tradeweb Direct LLC also relies on the Ontario Securities Commission International Dealer Exemption in the Canadian provinces of Ontario and Quebec, is registered as an exempt firm with the AFM and is a Recognized Body of the DFSA.
Tradeweb Europe Limited is authorized and regulated in the UK by the FCA as a MiFID Investment Firm. It has permissions to operate an Multilateral Trading Facility (“MTF”), an Organized Trading Facility (“OTF”) and an APA. Tradeweb Europe Limited is also regulated by ASIC and holds an Overseas Australian Market Operator License and is a recognized foreign trading venue by FINMA in Switzerland. In January 2022, Tradeweb Europe obtained a license to provide direct market access to trading participants (Handelsteilnehmer) domiciled in Germany via an electronic trading system pursuant to section 102(1) of the German Securities Trading Act (Wertpapierhandelsgesetz – WpHG).
The Singapore branch of Tradeweb Europe Limited is regulated by the MAS as a Recognised Market Operator (“RMO”).
The Hong Kong branch of Tradeweb Europe Limited is regulated by the SFC as an Automated Trading Service.
Tradeweb Information Technology Services (Shanghai) Co., Ltd. is a wholly-owned foreign enterprise (WOFE) in China. Its business scope includes information, data and technology related services including development, sales, import and export and consulting. The Tradeweb offshore electronic trading platform is recognized by the People’s Bank of China (“PBOC”) for the provision of Bond Connect, CIBM Direct RFQ and Swap Connect.
TW SEF LLC is a CFTC-registered SEF. TW SEF LLC is formally exempt from registration as an exchange in the Canadian provinces of Alberta, Ontario, Nova Scotia and Quebec and is recognized as a foreign trading venue in Switzerland. TW SEF LLC is approved and regulated by ASIC as an Overseas Australian Market Operator Licensee, recognized as Foreign Trading Venue in Mexico and is a Recognized Body of the DFSA.
DW SEF LLC is a CFTC-registered SEF. DW SEF LLC is formally exempt from registration in the Canadian provinces of Ontario and Nova Scotia is recognized as a foreign trading venue in Switzerland.
Tradeweb Japan KK is regulated by the JFSA and is registered as a Type 1 Financial Instruments Exchange Business Operator (reg. Kanto Local Finance Bureau (Kinsho) No.2997) pursuant to which it has been granted a Proprietary Trading System (PTS) Operator License. It is also a notified Electronic Trading Platform (ETP) operator for IRS intermediary business. Tradeweb Japan KK is a member of the JSDA, which is an authorized self-regulatory body under the Financial Instruments and Exchange Law of Japan, the governing law of the financial services industry in Japan.
Tradeweb EU B.V. is authorized and regulated by the DNB and AFM as a MiFID Investment Firm with permissions to operate an MTF and an OTF. Tradeweb EU B.V. passports its permissions under MiFID and accordingly provides services throughout the EU and the European Economic Area (“EEA”). Tradeweb EU B.V. is also regulated by ASIC and holds an Overseas Australian Market Operator License and is a recognized foreign trading venue by FINMA in Switzerland.
The Paris branch of Tradeweb EU B.V. is supervised by the ACPR.
Tradeweb Execution Services Limited is authorized and regulated in the UK by the FCA as an Investment Firm (“BIPRU Firm”).
Tradeweb Execution Services B.V. is authorized and regulated by the AFM as a MiFID investment firm with permission to trade on a matched principal basis.
Tradeweb Australia Pty Ltd (formerly Yieldbroker Pty Limited), acquired in August 2023, is a Tier 1 Australian Markets Licensee in Australia, regulated by the ASIC, that maintains a branch in Singapore that is regulated by the MAS as a Regulated Market Operator. Tradeweb Australia Pty Ltd changed its name from Yieldbroker Pty Limited in January 2024.
Tradeweb (DIFC) Limited is an Authorized Firm regulated by the DFSA with a license for “arranging deals in investments” for users to access our various trading venues that are also separately recognized by the DFSA.
Human Capital
In order to maintain our role as a leader in building and operating electronic marketplaces for our global network of clients, it is crucial that we continue to attract and retain top talent. To facilitate talent attraction and employee retention, we strive to make Tradeweb a diverse, inclusive and safe workplace. We firmly believe that a cared-for, proud, and diverse workforce will power our innovation into the future. We strive to provide opportunities for our employees to grow and develop in their careers, supported by strong compensation, benefits and health and wellness programs, and by initiatives that build connections between our employees and the communities in which we operate.
26
As of December 31, 2023, we had 1,179 employees, 815 of whom were based in the United States and 364 of whom were based outside of the United States. None of our employees are represented by a labor union. We consider our relationships with our employees to be good and have not experienced any interruptions of operations due to labor disagreements.
Diversity, Equity and Inclusion
We believe that diverse teams make better decisions and create greater long-term value, and we are committed to maintaining a safe and inclusive environment for everyone and attracting and retaining diverse talent at all levels. Our goal is to continue to strive for greater gender and ethnic diversity across the company, in accordance with applicable equal opportunity laws, to maintain and grow our culture of inclusiveness, education, acceptance and learning, and to ensure employees feel encouraged and equipped to be their genuine selves at work. Through our Diversity, Equity and Inclusion (“DE&I”) Committee, on which members of our executive team serve, including our Global Head of Human Resources and Head of Investor Relations, FP&A and Treasury, we raise awareness, provide a forum to discuss diversity and inclusion and promote a diverse and inclusive culture. We seek to involve employees at all levels in DE&I, including through recruitment, philanthropy and training. We also sponsor the Global Women’s Network, which provides skills-building, educational, and career-relevant programming for employees and brings topics affecting women in the workplace front and center. Our commitment to DE&I has been demonstrated through partnerships with approximately 18 organizations globally, including StreetWise Partners, Women’s Bond Club, TEAK, Hiring our Heroes, Emily K Center and Adaptive Growth Leadership in the U.S., and SEO, Big City Bright Future and Cowrie Scholarship Foundation in the UK. By focusing on employee volunteerism in these areas, our employees have the opportunity to take action and make a difference.
We also seek to advance the interests of our stakeholders through DE&I initiatives. For example, in June 2022, we launched the Spotlight Dealer Diversity Program, designed to promote diverse dealers participating on our platforms, including woman-, veteran-, disabled- and minority-owned firms. The Spotlight Program was developed collaboratively with feedback from members of the buy-side and dealer communities to support our diverse dealer community through a combination of individual dealer profiles, direct consultation and other promotional programs designed to bring more visibility to diverse dealers operating in electronic markets. In addition, we enhanced our RFQ trading workflow for U.S. Institutional Credit to more prominently expose diverse dealer liquidity to our participating buy-side clients, further strengthening engagement between diverse dealers and buy-side users on the platform. We continue to work with our Spotlight participants to expand opportunities for doing business together. Since launch we have grown from 12 participating Spotlight Dealers to 21.
In addition, we seek to cement our commitment to diversity at the intern, college graduate and experienced hire levels by leveraging relationships with a number of external organizations.
These efforts all support our multi-layered strategy for recruiting and retaining diverse talent.
Health and Well-Being
The success of our business is fundamentally connected to the health, safety and wellness of our employees. We provide an evolving package of benefits and perks to employees (which varies by country and region), aiming to ensure our employees have access to comprehensive care relating to their physical and mental health and their family planning needs, as well as adequate time out of office for personal, vacation, sick and bereavement leave needs. Some examples of the initiatives we provide in certain countries include post-birth parental and adoptive parent leave, financial assistance in connection with eligible fertility treatment, adoption and surrogacy expenses, health and wellness speaker series, health club discounts and subsidized memberships through Healthkick and virtual health visits.
Compensation and Benefits
We provide robust compensation and benefits programs to help attract and retain talent and to meet the needs of our employees. In addition to salaries, these programs (which vary by country or region) include annual bonuses, stock awards, retirement savings plans, healthcare and insurance benefits, health savings and flexible spending accounts, paid time off, family leave, family care resources, flexible work schedules, employee assistance programs, including confidential counseling services for employees and their family members and tuition assistance, among many others. In addition to our broad-based equity award programs, we have used targeted equity-based grants with vesting conditions to facilitate retention of key personnel, particularly those with strong product and functional knowledge, critical technology and engineering skills and experience.
27
Talent Development
We invest significant resources to develop and retain the talent needed to continue to build our position as a global leader in electronic marketplaces. We are focused on providing continuous opportunities for our employees to garner new knowledge and skills. Events and resources such as product and business updates, as well as other programs such as Lunch & Learns and Tradeweb U(niversity), which provides education courses on financial topics, are aimed at sharing information and improving our collective understanding of our industry and our clients’ needs. We sponsor a competitive summer internship program, from which we often make full-time hires, and provide assistance with numerous professional courses and qualifications through our tuition reimbursement program. Through our mentoring efforts and Tradeweb Achievers Program, we aim to strengthen our global culture of mentoring and developing our homegrown talent by equipping our senior leadership team with the tools and framework to share their professional experiences, motivate up-and-coming talent and build our future leadership pipeline.
Our employee engagement programs provide employees with the resources they need to help develop themselves and our shared culture—celebrating our differences and common purpose as our people grow both as unique individuals and as a collective, positive force in the world. Tradeweb has established and supports a number of committees and affinity groups dedicated to improving our people’s lives at work and advancing their personal and professional development. These include the Tradeweb Global Women’s Network, Diversity Equity & Inclusion Network, Tradeweb Cares philanthropy group, Sustainability Action Network and the Working Parents Network.
Community Involvement and Philanthropy
We believe it is our responsibility to do our part to help the communities around the world where our employees live and work. We bring these opportunities to our employees through our philanthropy group, Tradeweb Cares, which focuses on corporate partnerships, encouraging employee volunteerism and matching of qualifying charitable contributions by our employees up to $1,000 per year per employee. We partner with many organizations around the world that are focused on the four pillars of our philanthropy strategy: ensuring equitable access to quality education and economic opportunity for all, supporting environmental conservation efforts to restore our planet, enriching and empowering social mobility in the communities where we live and work, and providing access to healthcare and disease prevention for our society’s most vulnerable.
Corporate Sustainability – Environmental, Social and Governance Matters
We are committed to doing our part to help financial markets move toward a more sustainable global financial system. In August 2023 we published our third annual Corporate Sustainability Report, which reports on our environmental, social and governance (“ESG”) goals and priorities as well as our progress towards those goals during calendar year 2022. While the reporting structure is relatively new, our strong foundation in ESG principles is not. We have long been committed to creating and fostering an inclusive workplace, celebrating our diverse employee base, providing transparency and innovation for our markets and ensuring transparency and validity for the data that propels them. Our long-term view encompasses ever more sustainable ways of working and investing as we forge the links between better serving markets and better serving the world.
The Environment
We are committed to understanding the full extent of our environmental impact and to working toward minimizing our global emissions footprint. We seek to better understand the environmental impact of our operations through measurable means, and to set attainable targets and timelines for environmental impact reporting, including the eventual setting of science-based targets for greenhouse gas emissions. While our business involves limited direct environmental risks, we will endeavor to make our operations and impact more sustainable over time. Our primary environmental goals have been to reduce our overall energy consumption and emissions where possible, and to move toward renewable energy coverage, or direct sourcing of renewable energy for our Scope 2 energy usage. To that end, we purchased Green-e U.S. Renewable Energy Certificates for our forecasted 2023 U.S energy usage and retired them in September of 2023. We also purchased Japan Non-Fossil Certificates for our forecasted energy usage from operations in Asia, which were retired at the end of 2023. This marks a step forward in our climate action plan, and an action toward our stated goal of covering our global usage with renewable energy. Tradeweb also responded to CDP for the first time, and published our inaugural Taskforce on Climate-Related Financial Disclosure (“TCFD”) report, each in 2023. We endeavor to continue to be transparent and robust in our environmental disclosure, marking important steps toward that goal with these two reporting items.
28
In April 2021, we joined the Climate Bonds Initiative’s (“CBI”) Partnership Programme. CBI is an international, investor-focused not-for-profit organization promoting investment in projects and assets necessary for a rapid transition to a low-carbon and climate-resilient economy. The Climate Bonds Standard and Certification Scheme (the “Scheme”) is a labeling scheme for bonds, loans and other debt instruments. The Scheme’s rigorous scientific criteria are intended to ensure consistency with the Paris Agreement’s goal of limiting global warming to 1.5 degrees Celsius above pre-industrial levels. The Scheme is used globally by bond issuers, governments, investors and the financial markets seeking to prioritize investments that genuinely contribute to addressing climate change. By partnering with CBI, we aim to promote the visibility and accessibility of Green Bond trading activity across a wide range of asset classes, and leverage CBI data to provide transparency and clarity around the Green Bond trading volumes and trends on our platforms. In 2023, CBI-screened Green Bond trading accounted for $292.0 billion of the total $303.6 billion in global Green Bond trading volume executed on Tradeweb (excluding ETF). This represents a trading volume increase of 46% from 2022, calculated using CBI-screened Green Bond alignment based on the CBI definition of ‘Green’ as of December 31, 2023 for both the 2023 and 2022 comparative period. We provide Green Bond highlights across our institutional platform, including Global Credit, European Government Bonds, Supranationals, Repurchase Agreements, China Bonds, and Convertibles, and have Green Bond search tools across asset classes on our Retail platform. We plan to continually increase the data available to our clients around Green Bonds, and intend to expand this data set to include other ESG-related securities including Social Bonds, Sustainability Bonds, and Sustainability-Linked Bonds.
Our People and Communities
We value and encourage diverse perspectives, and strive to cultivate a team with varied and robust ideas. We aim to give everyone the access and ability to grow as an individual and, eventually, a leader. For more information on how we support our people and help foster a diverse workforce, please see “– Human Capital” above.
Our Governance
We have invested in strong and well-established governance structures across our global enterprise, led by a diverse Board of Directors that is deeply experienced in our business and highly focused on advancing our ESG strategies across the company. As part of that commitment, during 2020, we established an ESG Steering Committee comprised of senior level executives covering major business directives across the company. The ESG Steering Committee is an advisory board assembled to guide our focus, and ensure delivery on our thoughtful approach to integrating our ESG strategy into our business and operations. To support the implementation of our ESG strategy, a dedicated team was formed and has expanded to meet the needs of our growing strategy. The team head reports directly into our senior executive leadership team, which provides critical support for the integration of these initiatives across our business. At the Board level, the Nominating and Corporate Governance Committee is responsible for ESG oversight and guidance. The Compensation Committee has responsibility for oversight of human capital-related topics, including diversity, equity, and inclusion, and the Audit Committee has responsibility for oversight of external reporting of climate-related disclosures.
Our Organizational Structure
Tradeweb Markets Inc. was incorporated in Delaware in November 2018. As a result of the Reorganization Transactions completed in connection with the IPO, Tradeweb Markets Inc. became a holding company whose only material assets consist of its equity interest in Tradeweb Markets LLC and related deferred tax assets. As the sole manager of Tradeweb Markets LLC, Tradeweb Markets Inc. operates and controls all of the business and affairs of Tradeweb Markets LLC and, through Tradeweb Markets LLC and its subsidiaries, conducts its business. As a result of this control, and because Tradeweb Markets Inc. has a substantial financial interest in Tradeweb Markets LLC, Tradeweb Markets Inc. consolidates the financial results of Tradeweb Markets LLC and its subsidiaries. For more information regarding our organizational structure, see Note 1 – Organization and Note 11 – Stockholders’ Equity to our audited consolidated financial statements included elsewhere in this Annual Report on Form 10-K.
LSEG Transaction
On January 29, 2021, LSEG completed its acquisition of the Refinitiv business (currently referred to by LSEG as LSEG Data & Analytics) from a consortium, including certain investment funds affiliated with Blackstone as well as Thomson Reuters, in an all share transaction.
29
Following the consummation of the LSEG Transaction, LSEG became the controlling shareholder of Refinitiv and Refinitiv continued to be the controlling shareholder of Tradeweb, holding approximately 89.9% of our combined voting power as of December 31, 2023. Tradeweb remained a standalone, publicly-traded company, and the LSEG Transaction did not result in any changes to our stockholder voting rights, and we have not experienced and do not foresee any material impact on our strategy, day-to-day operations or Tradeweb management as a result of the LSEG Transaction. We maintain a market data license agreement with LSEG, which was amended and restated effective as of November 1, 2023. The non-compete period applicable to Refinitiv in their restrictive covenant agreement with us was terminated as of January 29, 2021.
Available Information
Our internet website address is www.tradeweb.com. Through our internet website, we will make available, free of charge, the following reports as soon as reasonably practicable after electronically filing them with, or furnishing them to, the SEC: our Annual Report on Form 10-K; our Quarterly Reports on Form 10-Q; our Current Reports on Form 8-K; and amendments to those reports filed or furnished pursuant to Section 13(a) of the Exchange Act. Our Proxy Statements for our Annual Meetings are also available through our internet website. In addition, the SEC maintains a website, www.sec.gov, that includes filings of and information about issuers, including the Company, that file electronically with the SEC. Our internet website and the information contained therein or connected thereto are not intended to be incorporated into this Annual Report on Form 10-K.
Investors and others should note that we announce material financial and operational information using our investor relations website, press releases, SEC filings and public conference calls and webcasts. Information about Tradeweb, our business and our results of operations may also be announced by posts on Tradeweb’s accounts on the following social media channels: Instagram, LinkedIn and X (formerly Twitter). The information that we post through these social media channels may be deemed material. As a result, we encourage investors, the media and others interested in Tradeweb to monitor these social media channels in addition to following our investor relations website, press releases, SEC filings and public conference calls and webcasts. These social media channels may be updated from time to time on our investor relations website.
30
ITEM 1A. RISK FACTORS.
Investing in our Class A common stock involves a high degree of risk. You should carefully consider the following risks, together with all of the other information contained in this Annual Report on Form 10-K, before deciding to invest in our Class A common stock. Our business, financial condition and results of operations could be materially adversely affected by any of these risks or uncertainties. In that case, the trading price of our Class A common stock could decline, and you may lose all or part of your investment.
Risk Factors Summary
The following is a summary of the principal factors that make an investment in our Class A common stock speculative or risky.
Risks Relating to Market and Industry Dynamics and Competition
•Economic, political and market conditions may reduce trading volumes.
•We may fail to compete successfully.
•If we are unable to adapt our business effectively to keep pace with industry changes, we may not be able to compete effectively.
•We may face consolidation and concentration in the financial services industry.
Risks Relating to the Operation and Performance of our Business
•We are dependent on our dealer clients to support our marketplaces by transacting with our other institutional, wholesale and retail clients.
•We do not have long-term contractual arrangements with most of our liquidity taking clients.
•Our business could be harmed if we are unable to maintain and grow the capacity of our trading platforms, systems and infrastructure.
•We may experience design defects, errors, failures or delays with our platforms or solutions.
•We rely on third parties to perform certain key functions, are dependent on third parties for our pre- and post-trade data, analytics and reporting solutions and are dependent upon trading counterparties and clearinghouses to perform their obligations.
•Our ability to conduct our business may be impacted by unforeseen, catastrophic or uncontrollable events.
•Our quarterly results may fluctuate significantly.
•Failure to retain our senior management team or the inability to attract and retain qualified personnel could materially adversely impact our ability to operate or grow our business.
•We could face damage to our reputation or brand.
•We may incur impairment charges for our goodwill and other indefinite-lived intangible assets.
•We may be unable to achieve our environmental, social and governance goals.
Risks Relating to our Growth Strategies and other Strategic Opportunities
•We may fail to maintain our current level of business or execute our growth plan.
•It is possible that our entry into new markets will not be successful, and potential new markets may not develop quickly or at all.
•We may undertake acquisitions or divestitures, which may not be successful.
•If we enter into strategic alliances, partnerships or joint ventures, we may not realize the anticipated strategic goals for any such transactions.
Risks Relating to our International Operations
•Our business, financial condition and results of operations may be materially adversely affected by risks associated with our international operations.
•Fluctuations in foreign currency exchange rates may adversely affect our financial results.
Risks Relating to Cybersecurity and Intellectual Property
•We could face actual or perceived security vulnerabilities in the systems, networks and infrastructure that we own or use, breaches of security controls, unauthorized access to confidential or personal information or cyber-attacks.
•We could be subject to systems failures, interruptions, delays in service, catastrophic events and resulting interruptions in the availability of our platforms or solutions.
•We may not be able to adequately protect our intellectual property or rely on third-party intellectual property rights.
•Third parties may claim that we are infringing or misappropriating their intellectual property rights.
•Our use of open source software could result in litigation or impose unanticipated restrictions on our ability to commercialize our platforms and solutions.
31
Risks Relating to Legal, Regulatory and Tax Considerations
•Extensive regulation of our industry results in ongoing exposure to significant costs and penalties, enhanced oversight and restrictions and limitations on our business.
•Our business, and the businesses of many of our clients, could be materially adversely affected by new laws, rules or regulations or changes in existing laws, rules or regulations.
•Our actual or perceived failure to comply with privacy, data protection and information security laws, rules, regulations and obligations could harm our business.
•We may face new tax legislation and regulation as well as unanticipated changes in effective tax rates or adverse outcomes resulting from examination of our income or other tax returns.
•Our compliance and risk management programs might not be effective.
•We are exposed to litigation risk, including securities litigation risk.
Risks Relating to our Indebtedness
•The credit agreement that governs the 2023 Revolving Credit Facility imposes certain operating and financial restrictions on us and our restricted subsidiaries.
•Any borrowings under the 2023 Revolving Credit Facility will subject us to interest rate risk.
Risks Relating to our Organizational Structure and Governance
•Refinitiv controls us and its interests may conflict with ours or yours.
•We are a “controlled company” within the meaning of the corporate governance standards of Nasdaq.
•Anti-takeover provisions in our organizational documents and Delaware law might discourage or delay acquisition attempts for us that you might consider favorable.
•Our amended and restated certificate of incorporation designates the Court of Chancery of the State of Delaware as the sole and exclusive forum for certain types of actions and proceedings that may be initiated by our stockholders.
•Our principal asset is our equity interest in TWM LLC, and, accordingly, we depend on distributions from TWM LLC to pay our taxes and expenses, including payments under the Tax Receivable Agreement.
•The Tax Receivable Agreement with the Continuing LLC Owners requires us to make cash payments to them in respect of certain tax benefits to which we may become entitled.
•Our organizational structure, including the Tax Receivable Agreement, confers certain benefits upon the Continuing LLC Owners that will not benefit Class A common stockholders or Class B common stockholders to the same extent as it will benefit the Continuing LLC Owners.
•In certain cases, payments under the Tax Receivable Agreement to the Continuing LLC Owners may be accelerated or significantly exceed the actual benefits we realize.
•We will not be reimbursed for any payments made to the Continuing LLC Owners under the Tax Receivable Agreement in the event that any tax benefits are disallowed.
•If we are deemed to be an investment company under the Investment Company Act of 1940, applicable restrictions could make it impractical for us to continue our business as contemplated and could have a material adverse effect on our business.
Risks Relating to Ownership of our Class A Common Stock
•Refinitiv and Continuing LLC Owners may require us to issue additional shares of our Class A common stock.
•The market price of our Class A common stock may be highly volatile.
•Sales, or the potential for sales, of a substantial number of shares of our Class A common stock in the public market could cause our stock price to drop significantly.
•If securities or industry analysts cease publishing research or reports about us, adversely change their recommendations or publish negative reports regarding our business or our Class A common stock, our stock price and stock trading volume could materially decline.
•We intend to continue to pay regular dividends, but our ability to do so may be limited.
•The timing and amount of any share repurchases are subject to a number of uncertainties.
•The requirements of being a public company may strain our resources, increase our costs and divert management’s attention, and we may be unable to comply with these requirements in a timely or cost-effective manner.
32
Risks Relating to Market and Industry Dynamics and Competition
Economic, political and market conditions may reduce trading volumes, which could have a material adverse effect on our business, financial condition and results of operations.
The electronic financial services industry is, by its nature, risky and volatile. Our business performance is impacted by a number of global and regional factors that are generally beyond our control. The occurrence of, or uncertainty related to, any one of the following factors may cause a substantial decline in the U.S. and/or global financial markets, which could result in reduced trading volumes and profitability for our business:
•economic, political and social conditions in the United States, the UK, the EU and/or its member states, China or other major economies around the world, including, among other things, the strength and direction of the U.S. and global economy, the war in Ukraine and the Israel Hamas war;
•the impact of foreign exchange fluctuations (see “—Risks Relating to our International Operations — Fluctuations in foreign currency exchange rates may adversely affect our financial results” for further information);
•the effect of Federal Reserve Board and other central banks’ monetary policy, increased capital requirements for banks and other financial institutions and other regulatory requirements;
•adverse market conditions, including unforeseen market closures or other disruptions in trading;
•broad trends in business and finance, including the number of new issuances and changes in investment patterns and priorities;
•concerns over a potential recession (in the United States or globally), inflation, the banking industry, including as a result of any bank failures and weakening consumer and investor confidence levels;
•the level and volatility of interest rates, including actual and anticipated increases in the federal funds rate by the Federal Reserve;
•consolidation or contraction in the number, and changes in the financial strength, of market participants;
•the availability of capital for borrowings and investments by our clients;
•liquidity concerns, including concerns over credit default or bankruptcy of one or more sovereign nations or corporate entities;
•legislative, regulatory or government policy changes, including changes to financial industry regulations and tax laws, including the Inflation Reduction Act of 2022 (the “IRA”) and central clearing requirements for the U.S. Treasury market, that could limit the ability of market participants to engage in a wider array of trading activities or make certain corporate activities less desirable or more expensive;
•actual or threatened trade war, including between the United States and China, or other governmental action related to tariffs, international trade agreements or trade policies; and
•the current or anticipated impact of climate change, extreme weather events, natural disasters and other catastrophic events, actual or threatened acts of war, terrorism or other armed hostilities or outbreaks of pandemic or contagious diseases.
These factors also affect the degree of volatility (the magnitude and frequency of fluctuations) in the U.S. and global financial markets, including in the prices and trading volumes of the products traded on our platforms. Volatility increases the need to hedge price risk and creates opportunities for investment and speculative or arbitrage trading, and thus increases trading volumes. Although we generally experience increased trading volumes across our marketplaces during periods of volatility, use of our platforms and demand for our solutions may decline during periods of significant volatility as market participants in rapidly moving markets may seek to negotiate trades and access information directly over the telephone instead of electronically.
In the event of stagnant or deteriorating economic conditions or periods of instability or prolonged stability or decreased activity in the U.S. and/or global financial markets, we could experience lower trading volumes. A general decline in trading volumes across our marketplaces would lower revenues and could materially adversely affect our results of operations if we are unable to offset falling volumes through changes in our fee structure. If trading volumes decline substantially or for a sustained period, the critical mass of transaction volume necessary to support viable markets and generate valuable data could be jeopardized, which, in turn, could further discourage clients from using our platforms and solutions and further accelerate the decline in trading volumes. Additionally, if our total market share decreases relative to our competitors, our trading venues may be viewed as less attractive sources of liquidity. If our marketplaces are perceived to be less liquid, we could lose further trading volumes and our business, financial condition and results of operations could be materially adversely affected.
33
There have been significant declines in trading volumes in the financial markets generally in the past and there may be similar declines in trading volumes generally or across our marketplaces in particular in the future. During periods of lower trading volumes or during an economic downturn, our clients may become more price sensitive and exert pricing pressure on us, and we may be forced to reduce our fees or to maintain our fees during periods of increased costs. Because our cost structure is largely fixed, if use of our platforms and demand for our solutions decline for any reason or if we are forced to reduce fees, we may not be able to adjust our cost structure to counteract the associated decline in revenues, which would materially harm our profitability.
Failure to compete successfully could materially adversely affect our business, financial condition and results of operations.
We face intense competition in both the financial services industry generally and the markets that we serve in particular, and we expect competition with a broad range of competitors to continue to intensify in the future. Within the electronic financial services industry in which we operate, we compete based on our ability to provide a broad range of solutions, trading venues with a broad network of market participants and deep liquidity, a competitive fee structure and comprehensive pre-trade, trade and post-trade functionality, as well as the reliability, security and ease of use of our platforms and solutions.
We primarily compete with other electronic trading platforms and trading business conducted directly between dealers and their institutional, wholesale and retail client counterparties over telephone, email or instant messaging. We also compete with securities and futures exchanges, other inter-dealer brokers and single bank systems. For example, our trading platforms face existing and potential competition from large exchanges, which have in recent years developed electronic capabilities in-house or through acquisitions. We also face competition from individual banks that offer their own electronic platforms to their institutional clients and from providers of execution management services and order management services. In addition, we may face competition from companies with strong market share in specific markets or organizations and businesses that have not traditionally competed with us but that could adapt their products and services or utilize significant financial and information resources, recognized brands, or technological expertise to begin competing with us. We expect that we may compete in the future with a variety of companies with respect to our platforms and solutions. If we are not able to compete successfully in the future, our business, financial condition and results of operations could be materially adversely affected.
Certain of our current and prospective competitors are substantially larger than we are and have substantially greater market presence than we do, as well as greater financial, technological, marketing and other resources. These competitors may be better able to withstand reductions in fees or other adverse economic or market conditions than we can. Some competitors may be able to adopt new or emerging technologies, or incorporate customized features or functions into existing technologies, to address changing market conditions or client preferences at a relatively low cost and/or more quickly than we can. In addition, because we operate in a rapidly evolving industry, start-up companies can enter the market with new and emerging technologies more easily and quickly than they would in more traditional industries. If we are unable or unwilling to reduce our fees or make additional investments in the future, we may lose clients and our competitive position may be adversely affected. In addition, our competitive position may be adversely affected by changes in regulations that have a disproportionately negative affect on us or the products or trading protocols we offer our clients.
Competition in the markets in which we operate has intensified due to consolidation, which has resulted in increasingly large and sophisticated competitors. In recent years, our competitors have made acquisitions and/or entered into joint ventures and consortia to improve the competitiveness of their electronic trading offerings. For example, ICE acquired BondPoint, TMC Bonds and IDC, in an effort to expand its portfolio of fixed income products and services. In addition, in 2018, CME Group completed its acquisition of NEX Group, which expands CME Group’s offerings to include NEX Group’s OTC foreign exchange and rates products and market data. Further, in 2022, TP ICAP completed its acquisition of Liquidnet to further diversify its business. If, as a result of industry consolidation, our competitors are able to offer lower cost (including fixed cost fees compared to our variable fees for certain offerings) and/or a wider range of trading venues and solutions, obtain more favorable terms from third-party providers or otherwise take actions that could increase their market share, our competitive position and therefore our business, financial condition and results of operations may be materially adversely affected.
Our operations also include the sale of pre- and post-trade services, analytics and market data (including through a distribution agreement with LSEG). There is a high degree of competition among market data and information vendors in solutions for pre- and post-trade data, analytics and reporting, and such businesses may become more competitive in the future as new competitors emerge. Some of these companies are already in or may enter the electronic trading business. Accordingly, some of our competitors may be able to combine use of their electronic trading platforms with complementary access to market data and analytical tools and/or leverage relationships with existing clients to obtain additional business from such clients, which could preempt use of our platforms or solutions. For example, Bloomberg and ICE have trading platforms that compete with ours and also have data and analytics relationships with the vast majority of institutional, wholesale and retail market participants. If we are not able to compete successfully in this area in the future, our revenues could be adversely impacted and, as a result, our business, financial condition and results of operations would be materially adversely affected.
34
The industry in which we operate is rapidly evolving. If we are unable to adapt our business effectively to keep pace with industry changes, we may not be able to compete effectively, which could have a material adverse effect on our business, financial condition and results of operations.
The electronic financial services industry is characterized by rapidly changing and increasingly complex technologies and systems, changing and increasingly sophisticated client demands (including access to new technologies and markets), frequent technology and service introductions, evolving industry standards, changing regulatory requirements and new business models. If we are not able to keep pace with changing market conditions or client demands or if our competitors release new technology before we do, our existing platforms, solutions and technologies may become obsolete or our competitive position may be materially harmed, each of which could have a material adverse effect on our business, financial condition and results of operations.
Operating in a rapidly evolving industry involves a high degree of risk and our future success will depend in part on our ability to:
•enhance and improve the responsiveness, functionality, accessibility and reliability of our existing platforms and solutions;
•develop, license or acquire new platforms, solutions and technologies that address the increasingly sophisticated and varied needs of our existing and prospective clients, and that allow us to grow within our existing markets and to expand into new markets, asset classes and products;
•achieve and maintain market acceptance for our platforms and solutions;
•adapt our existing platforms and solutions for new markets, asset classes and products;
•respond to competitive pressures, technological advances, including new or disruptive technology such as artificial intelligence, emerging industry standards and practices and regulatory requirements and changes on a cost-effective and timely basis;
•attract highly-skilled technology, regulatory, sales and marketing personnel;
•operate, support, expand, adapt and develop our operations, systems, networks and infrastructure;
•manage cybersecurity threats;
•take advantage of acquisitions, strategic alliances and other opportunities; and
•obtain any applicable regulatory approval for our platforms and solutions.
Further, the development of new internet, networking, telecommunications or blockchain technologies may require us to devote substantial resources to modify and adapt our marketplaces. In particular, because our platforms and solutions are designed to operate on a variety of electronic systems, we will need to continuously modify and enhance our marketplaces to keep pace with changes in internet-related hardware and other software, communication and browser technologies. We cannot assure you that we will be able to successfully adapt our existing technologies and systems to incorporate new, or changes to existing, technologies.
The success of new platforms or solutions, or new features and versions of existing platforms and solutions, depends on several factors, including the timely and cost-effective completion, introduction and market acceptance of such new or enhanced platform or solution. Development efforts entail significant technical and business risks. We may use new technologies ineffectively, fail to adequately address regulatory requirements, experience design defects or errors or fail to accurately determine market demand for new platforms, solutions and enhancements. Furthermore, development efforts may require substantial expenditures and take considerable time, and we may experience cost overrun, delays in delivery or performance problems and not be successful in realizing a return on these development efforts in a timely manner or at all.
We cannot assure you that we will be able to anticipate or respond in a timely manner to changing market conditions, and new platforms, technologies or solutions, or enhancements to existing platforms, technologies or solutions, may not meet regulatory requirements, address client needs or achieve market acceptance. If we are not able to successfully develop and implement, or face material delays in introducing, new platforms, solutions and enhancements, our clients may forego the use of our platforms and solutions and instead use those of our competitors. Any failure to remain abreast of changing market conditions and to be responsive to market preferences could cause our market share to decline and materially adversely impact our revenues.
35
Consolidation and concentration in the financial services industry could materially adversely affect our business, financial condition and results of operations.
There has been significant consolidation in the financial services industry over the past several years and several of our large broker-dealer clients have reduced their sales and trading businesses in certain products. Further consolidation in the financial services industry could result in a smaller client base and heightened competition, which may lower our trading volumes. If our clients merge with or are acquired by other companies that are not our clients, or companies that utilize our offerings to a lesser degree, such clients may discontinue or reduce their use of our platforms and solutions. Any such developments could materially adversely affect our business, financial condition and results of operations.
The substantial consolidation of market share among companies in the financial services industry has resulted in concentration in markets by some of our largest dealer clients. Because our trading platforms depend on these clients, any event that impacts one or more of these clients or the financial services industry in general could negatively impact our trading volumes and revenues. In addition, some of our dealer clients have announced plans to reduce their sales and trading businesses in the markets in which we operate. This is in addition to the significant reductions in these businesses already completed by certain of our dealer clients.
The consolidation and concentration of market share and the reduction by large clients of certain businesses may lead to increased revenue concentration among our dealer clients, which may further increase our dependency on such clients and reduce our ability to negotiate pricing and other matters with such clients. Additionally, the sales and trading global market share has become increasingly concentrated over the past several years among the top investment banks, which will increase competition for client trades and place additional pricing pressure on us. If we are not able to compete successfully, our business, financial condition and results of operations could be materially adversely affected.
Risks Relating to the Operation and Performance of our Business
We are dependent on our dealer clients to support our marketplaces by transacting with our other institutional, wholesale and retail clients.
We rely on our dealer clients to provide liquidity on our trading platforms by posting prices on our platforms and responding to client inquiries, and certain of our dealer clients account for a significant portion of our total trading volume on our platforms. In addition, our dealer clients also provide us with data via feeds and through the transactions they execute on our trading platforms, which is an important input for our data and analytics offerings. Market knowledge and feedback from dealer clients have been important factors in the development of many of our offerings and solutions.
There are inherent risks whenever a significant percentage of our trading volume and revenues are concentrated with a limited number of clients, and these risks are especially heightened for us due to the potential effects of increased industry consolidation and financial regulation on our business. The contractual obligations of our clients to us are non-exclusive and subject to termination rights by such clients. Any failure by us to meet a key dealer client’s or other key client’s expectations could result in cancellation or non-renewal of the contract. In addition, our reliance on any individual dealer client for a significant portion of our trading volume may also give that client a degree of leverage against us when negotiating contracts and terms of services with us.
Our dealer clients also buy and sell through traditional methods, including by telephone, e-mail and instant messaging, and through other trading platforms. Some of our dealer clients have developed electronic trading networks that compete with us or have announced their intention to explore the development of such electronic trading networks, and many of our dealer clients are involved in other ventures, including other trading platforms or other distribution channels, as trading participants and/or as investors. In particular, certain of our dealer clients have their own competing trading platform and frequently invest in such businesses and may acquire ownership interests in similar businesses, and such businesses may also compete with us. These competing trading platforms may offer some features that we do not currently offer or that we are unable to offer, including customized features or functions. Accordingly, there can be no assurance that such dealer clients’ primary commitments will not be to one of our competitors or that they will not continue to rely on their own trading platforms or traditional methods instead of using our trading platforms.
Although we have established and maintain significant long-term relationships with our key dealer clients, we cannot assure you that all of these relationships will continue or will not diminish. Any reduction in the use of our trading platforms by our key dealer clients, for any reason, and any associated decrease in the pool of capital and liquidity accessible across our marketplaces, could reduce the volume of trading on our platforms, which could, in turn, reduce the use of our platforms by their counterparty clients. In addition, any decrease in the number of dealer clients competing for trades on our trading platforms, could cause our dealer clients to forego use of our platforms and instead use platforms that provide access to more competitive trading environments and prices. The occurrence of any of the foregoing may have a material adverse effect on our business, financial condition and results of operations.
36
We do not have long-term contractual arrangements with most of our liquidity taking clients, and our trading volumes and revenues could be reduced if these clients stop using our platforms and solutions.
Our business largely depends on certain of our liquidity taking clients to initiate inquiries on our trading platforms. A limited number of such clients can account for a significant portion of our trading volumes, which in turn, results in a significant portion of our transaction fees. Most of our liquidity taking clients do not have long-term contractual arrangements with us and utilize our platforms and solutions on a transaction-by-transaction basis and may choose not to use our platforms at any time. These clients buy and sell a variety of products within various asset classes using traditional methods, including by telephone, e-mail and instant messaging, and through other trading platforms. Any significant loss of these clients or a significant reduction in their use of our platforms and solutions could have a material negative impact on our trading volumes and revenues, and materially adversely affect our business, financial condition and results of operations.
Our business could be harmed if we are unable to maintain and grow the capacity of our trading platforms, systems and infrastructure.
We rely on our information technology environment and certain critical databases, systems and applications to support key product and service offerings. Our success depends on our clients’ confidence in our ability to provide reliable, secure, real-time access to our trading platforms. If our trading platforms cannot cope, or expand to cope, with demand, or otherwise fail to perform, we could experience disruptions in service, slow delivery times and insufficient capacity. Any material disruptions in our trading platforms could result in our clients deciding to stop using or to reduce their use of our trading platforms, either of which would have a material adverse effect on our business, financial condition and results of operations.
We will need to continually improve and upgrade our trading platforms, systems and infrastructure to accommodate increases in trading volumes, changes in trading practices of new and existing clients or irregular or heavy use of our trading platforms, especially during peak trading times or at times of increased market volatility. The maintenance and expansion of our trading platforms, systems and infrastructure has required, and will continue to require, substantial financial, operational and technical resources. As our operations grow in both size and scope, these resources will typically need to be committed well in advance of any potential increase in trading volumes. We cannot assure you that our estimates of future trading volumes will be accurate or that our systems will always be able to accommodate actual trading volumes without failure or degradation of performance, especially during periods of abnormally high volumes. If we do not successfully adapt our existing trading platforms, systems and infrastructure to the requirements of our clients or to emerging industry standards, or if our trading platforms otherwise fail to accommodate trading volumes, our business, financial condition and results of operations could be materially adversely affected.
If we experience design defects, errors, failures or delays with our platforms or solutions, our business could suffer serious harm.
Despite testing, our platforms and solutions may contain design defects and errors or fail when first introduced or when major new updates or enhancements are released. In our development of new platforms, platform features and solutions or updates and enhancements to our existing platforms and solutions, we may make a design error that causes the platform feature or solution to fail or operate incorrectly or less effectively than planned. Many of our solutions also rely on data and services provided by third-party providers over which we have no or limited control and may be provided to us with defects, errors or failures. Our clients may also use our platforms and solutions together with their own software, data or products from other companies. As a result, when problems occur, it might be difficult to identify the source of the problem and responsibility for any loss. In addition, we could experience delays while developing and introducing new or enhanced platforms, platform features and solutions, primarily due to difficulties in technology development, obtaining any applicable regulatory approval, licensing data inputs or adapting to new operating environments.
If design defects, errors or failures are discovered in our current or future platforms or solutions, we may not be able to correct or work around them in a cost-effective or timely manner, or at all. The existence of design defects, errors, failures or delays that are significant, or are perceived to be significant, could also result in rejection or delay in market acceptance of our platforms, features or solutions, damage to our reputation, loss of clients and related revenues, diversion of resources, product liability claims, regulatory actions or increases in costs, any of which could materially adversely affect our business, financial condition or results of operations.
37
We rely on third parties to perform certain key functions, and their failure to perform those functions could result in the interruption of our operations and systems and could result in significant costs and reputational damage to us.
We rely on a number of third parties to supply, support and maintain critical elements of our operations, including our trading platforms, information technology and other systems. In addition, we depend on third parties, such as telephone companies, online service providers, hosting services and software and hardware vendors, for various computer and communications systems, such as our data centers, telecommunications access lines and certain computer software and hardware. Our clients also depend on third-party middleware and clearinghouses for clearing and settlement of certain trades on our trading platforms, which could impact our trading platforms.
We cannot assure you that any of these third-party providers will be able or willing to continue to provide these products and services in an efficient, cost-effective or timely manner, or at all, or that they will be able to adequately expand their services to meet our needs. In particular, like us, third-party providers are vulnerable to operational and technological disruptions, and we may have limited remedies against these third parties in the event of product or service disruptions. In addition, we have little control over and limited recourse to third-party providers, which increases our vulnerability to errors, failures, interruptions or disruptions or problems with their products or services. Further, the priorities and objectives of third-party providers may differ from ours, which may make us vulnerable to terminations of, or adverse changes to, our arrangements with such providers, and there can be no assurance that we will be able to maintain good relationships or the same terms with such providers. If an existing third-party provider is unable or unwilling to provide a critical product or service, and we are unable to make alternative arrangements for the supply of such product or service on commercially reasonable terms or a timely basis, or at all, our business, financial condition and results of operations could be materially adversely affected.
Further, we also face risks that providers may perform work that deviates from our standards or contracts. Moreover, our existing third-party arrangements may bind us for a period of time to terms that become uncompetitive or technology and systems that become obsolete. If we do not obtain the expected benefits from our relationships with third-party providers, we may be less competitive, which could have a material adverse effect on our business, financial condition and results of operations. In the future, if we choose to transition a function previously managed by us to a third party, we may spend significant financial and operational resources and experience delays in completing such transition, and may never realize any of the anticipated benefits of such transition.
We are dependent on third-party providers and our clients for our pre- and post-trade data, analytics and reporting solutions.
The success of our trading platforms depends in part on our pre- and post-trade data, analytics and reporting solutions. We depend upon data and information services from external sources, including data received from certain competitors, clients, self-regulatory organizations and other third-party data providers for information used on our platforms and by our solutions, including our data, analytical tools and other pre- and post-trade services. In particular, we depend on LSEG to source certain reference data for products that trade on our platforms. Our data sources and information providers, some of which are our competitors, could increase the price for or withdraw their data or information services for a variety of reasons. For example, data sources or information providers may enter into exclusive contracts with other third parties, including our competitors, which could preclude us from receiving certain data or information services from these providers or restrict our use of such data or information services, which may give our competitors an advantage. In addition, our clients, the majority of which are not subject to long-term contractual arrangements, may stop using or reduce their use of our trading platforms at any time, which would decrease our volume of trade data and may diminish the competitiveness of our market data offerings.
If a substantial number of our key data sources and information providers withdraw or are unable to provide us with their data or information services, or if a substantial number of clients no longer trade on our platforms or use our solutions, and we are unable to suitably replace such data sources or information services, or if the collection of data or information becomes uneconomical, our ability to offer our pre- and post-trade data, analytics tools and reporting solutions could be adversely impacted. If any of these factors negatively impact our ability to provide these data-based solutions to our clients, our competitive position could be materially harmed, which could have a material adverse effect on our business, financial condition and results of operations.
In addition, pursuant to a market data license agreement, LSEG currently distributes a significant portion of our market data. The cancellation of, or any adverse change to, our arrangement with LSEG or the inability of LSEG to effectively distribute our data may materially harm our business and competitive position.
38
We are dependent upon trading counterparties and clearinghouses to perform their obligations.
Our business consists of providing consistent two-sided liquidity to market participants across numerous geographies, asset classes and products. In addition, in the normal course of our business we, as an agent, execute transactions with, and on behalf of, other brokers and dealers. See Part II, Item 7A. – “Quantitative and Qualitative Disclosures about Market Risk – Credit Risk.” In the event of a systemic market event resulting from large price movements or otherwise, certain market participants may not be able to meet their obligations to their trading counterparties, who, in turn, may not be able to meet their obligations to their other trading counterparties, which could lead to major defaults by one or more market participants. Many trades in the securities markets, and an increasing number of trades in the over-the-counter derivatives markets, are cleared through central counterparties. These central counterparties assume and specialize in managing counterparty performance risk relating to such trades. However, even when trades are cleared in this manner, there can be no assurance that a clearinghouse’s risk management methodology will be adequate to manage one or more defaults. Given the counterparty performance risk that is concentrated in central clearing parties, any failure by a clearinghouse to properly manage a default could lead to a systemic market failure. For example, historically we have used ICBC Financial Services (“ICBC”), a wholly-owned subsidiary of the Industrial and Commercial Bank of China Limited to clear U.S. Treasury trades executed by non-FICC members on our wholesale trading platform. Following the November 2023 ransomware attack on some ICBC operating systems, including those used to clear U.S. Treasury and repurchase agreement financings, we have and may continue to self-clear these U.S. Treasury trades. If trading counterparties do not meet their obligations, including to us, or if any central clearing parties fail to properly manage defaults by market participants, we could suffer a material adverse effect on our business, financial condition, results of operations and cash flows.
Our ability to conduct our business may be materially adversely impacted by unforeseen, catastrophic or uncontrollable events. In addition, our U.S. and European operations are heavily concentrated in particular areas and may be adversely affected by events in those areas.
We may incur losses as a result of unforeseen, catastrophic or uncontrollable events, including fire, natural disasters, extreme weather events, global health crises (including COVID-19 and its variants), power loss, telecommunications failure, software or hardware malfunctions, theft, cyber-attacks, acts of war, terrorist attacks or other armed hostilities (including the war in Ukraine and the Israel Hamas war). In addition, employee misconduct, fraud or error, such as improperly using confidential information or engaging in improper or unauthorized activities or transactions, could expose us to significant liability, losses, regulatory sanctions and reputational harm. These unforeseen, catastrophic or uncontrollable events could adversely affect our clients’ levels of business activity and precipitate sudden significant changes in regional and global economic conditions and cycles. Certain of these events also pose significant risks to our employees and our physical facilities and operations around the world, whether the facilities are ours or those of our third-party providers or clients. If our systems, networks or infrastructure were to fail or be negatively impacted as a result of an unforeseen, catastrophic or uncontrollable event, our business functions could be interrupted, our ability to make our platforms and solutions available to our clients could be impaired and, as a result, we could lose critical data and revenues. If we are unable to deploy or develop adequate plans to ensure that our business functions continue to operate during and after an unforeseen, catastrophic or uncontrollable event, and successfully execute on those plans should such an event occur, our business, financial condition, results of operations and reputation could be materially harmed.
In addition, our U.S. operations are heavily concentrated in the New York metro area and our European operations are heavily concentrated in London, United Kingdom. Any event that affects either of those geographic areas could affect our ability to operate our business.
Our quarterly results may fluctuate significantly and may not fully reflect the underlying performance of our business.
Our quarterly operating results may vary significantly in the future, and period-to-period comparisons of our operating results may not be meaningful. Accordingly, the results of any one quarter should not be relied upon as an indication of future performance. Our quarterly financial results may fluctuate as a result of a variety of factors and, as a result, may not fully reflect the underlying performance of our business. Fluctuations in quarterly results may negatively impact the price at which our Class A common stock trades. Factors that may cause fluctuations in our quarterly financial results include, but are not limited to:
•fluctuations in overall trading volumes or our market share for our key products;
•the addition or loss of clients;
•the unpredictability of the financial services industry;
•our ability to drive an increase in the use of our trading platforms by new and existing clients;
•the mix of products and volumes traded, changes in fee plans and average variable fees per million;
•the amount and timing of expenses, including those related to the maintenance and expansion of our business, operations and infrastructure;
39
•network or service outages, internet disruptions, the availability of our platforms, cyber-attacks, security breaches or perceived security breaches;
•general economic, political, social, industry and market conditions;
•changes in our business strategies and pricing policies (or those of our competitors);
•the timing and success of our entry into new markets or introductions of new or enhanced platforms or solutions by us or our competitors, including disruptive technology, or any other change in the competitive dynamics of our industry, including consolidation or new entrants among competitors, market participants or strategic alliances;
•the timing and success of any acquisitions, divestitures or strategic alliances;
•the timing of expenses related to the development or acquisition of platforms, solutions, technologies or businesses and potential future charges for impairment of goodwill from acquired companies;
•new, or changes to existing, regulations that limit or affect our platforms, solutions and technologies or which increase our regulatory compliance costs; and
•the timing and magnitude of any adjustments in our consolidated financial statements driven by changes in the liability under the Tax Receivable Agreement.
Failure to retain our senior management team or the inability to attract and retain qualified personnel could materially adversely impact our ability to operate or grow our business.
The success of our business depends upon the skills, experience and efforts of our executive officers and other key personnel. Although we have invested in succession planning, the loss of key members of our senior management team or other key personnel could nevertheless have a material adverse effect on our business, financial condition and results of operations. Should we lose the services of a member of our senior management team or other key personnel, we may have to conduct a search for a qualified replacement. This search may be prolonged, and we may not be able to locate and hire a qualified replacement.
Our business also depends on our ability to continue to attract, motivate and retain a large number of highly qualified personnel in order to support our clients and achieve business results. There is a limited pool of employees who have the requisite skills, training and education. Identifying, recruiting, training, integrating and retaining qualified personnel requires significant time, expense and attention, and the market for qualified personnel, particularly those with experience in technology, clearing and settlement, product management and regulatory compliance, has become increasingly competitive as an increasing number of companies seek to enhance their positions in the markets we serve. In particular, we compete for technology personnel with highly innovative technology companies and large companies focused on technology development both in and outside our traditional geographic markets. Many of these companies have significant financial resources and more recognizable brands than ours and may be able to offer more attractive employment opportunities and more lucrative compensation packages. Our inability to attract, retain and motivate personnel with the requisite skills could impair our ability to develop new platforms, platform features or solutions, enhance our existing platforms and solutions, grow our client base, enter into new markets, operate under various regulatory frameworks or manage our business effectively.
Damage to our reputation or brand could negatively impact our business, financial condition and results of operations.
Our reputation and the quality of our brand are critical to our business, and we must protect and grow the value of our brand in order for us to continue to be successful. Any incident that erodes client loyalty for our brand could significantly reduce its value and damage our business. We may be adversely affected by any negative publicity, regardless of its accuracy, including with respect to, among other things, the quality and reliability of our platforms and solutions, the accuracy of our market data, our ability to maintain the security of our data and systems, networks and infrastructure and any impropriety, misconduct or fraudulent activity by any person formerly or currently associated with us.
Also, there has been a marked increase in the use of blogs, social media platforms and other forms of Internet-based communications that provide individuals with access to a broad audience of interested persons. The opportunity for dissemination of information, including inaccurate information, is seemingly limitless and readily available. Information may be posted on such sites and platforms at any time. Information posted may be adverse to our interests or may be inaccurate, each of which may harm our business and reputation. The harm may be immediate without affording us an opportunity for redress or correction.
Ultimately, the risks associated with any negative publicity or actual, alleged or perceived issues regarding our business or any person formerly or currently associated with us cannot be completely eliminated or mitigated and may materially harm our reputation, business, financial condition and results of operations.
40
We may incur impairment charges for our goodwill and other indefinite-lived intangible assets which would negatively impact our operating results.
As of December 31, 2023, we had goodwill of $2.8 billion and indefinite-lived intangible assets of $0.3 billion. The carrying value of goodwill represents the fair value of an acquired business in excess of identifiable assets and liabilities as of the acquisition date. The carrying value of indefinite-lived intangible assets represents the fair value of licenses and trade names as of the acquisition date. Determining the fair value of certain assets acquired and liabilities assumed is judgmental in nature and requires management to use significant estimates and assumptions, including assumptions with respect to future cash flows, discount rates, growth rates and asset lives. We do not amortize goodwill and indefinite-lived intangible assets that we expect to contribute indefinitely to our cash flows, but instead we evaluate these assets for impairment at least annually, or more frequently if changes in circumstances indicate that a potential impairment could exist. Significant negative industry or economic trends, disruptions to our business, inability to effectively integrate acquired businesses, unexpected significant changes or planned changes in use of the acquired assets, divestitures and market capitalization declines may impair our goodwill and other indefinite-lived intangible assets. Any charges relating to such impairments could materially adversely affect our financial condition and results of operations.
We may be unable to achieve our environmental, social and governance (“ESG”) goals.
We have established ESG goals for our business. These goals reflect our current plans and aspirations and we may not be able to achieve them. Our failure to adequately update, accomplish or accurately track and report on these goals on a timely basis, or at all, could adversely affect our reputation, financial performance and growth, and expose us to increased scrutiny from the investment community, special interest groups and enforcement authorities.
Our ability to achieve any ESG objective is subject to numerous risks, many of which are outside of our control. Examples of such risks include our ability to accurately track Scope 1, 2 and 3 greenhouse gas emissions, the evolving regulatory requirements affecting ESG standards or disclosures and our ability to recruit, develop and retain diverse talent in our workforce.
Standards for tracking and reporting ESG matters continue to evolve. Our selection of voluntary disclosure frameworks and standards, and the interpretation or application of those frameworks and standards, may change from time to time or differ from those of others. Methodologies for reporting ESG data may be updated and previously reported ESG data may be adjusted to reflect improvement in availability and quality of third-party data, changing assumptions, changes in the nature and scope of our operations and other changes in circumstances. Our processes and controls for reporting ESG matters across our operations are evolving along with multiple disparate standards for identifying, measuring, and reporting ESG metrics, including ESG-related disclosures that may be required by the SEC and European and other regulators, and such standards may change over time, which could result in significant revisions to our current goals, reported progress in achieving such goals, or ability to achieve such goals in the future. If our ESG practices and goals do not meet evolving investor or other stakeholder expectations and standards, then our reputation or our attractiveness as an investment, business partner, acquirer, service provider or employer could be negatively impacted.
Risks Relating to our Growth Strategies and other Strategic Opportunities
If we fail to maintain our current level of business or execute our growth plan, our business, financial condition and results of operations may be materially harmed.
We have experienced significant growth in our operations over the years, including, in part, as a result of favorable industry and market trends, such as the increased electronification of markets, growing global markets and evolving regulatory requirements. However, we cannot assure you that our operations will continue to grow at a similar rate, if at all, or that we will continue to benefit from such favorable industry and market trends. In particular, we cannot assure you that the growth of electronic means of trading will continue at the levels expected or at all. Our future financial performance depends in large part on our ability to successfully execute our growth plan. To effectively manage the expected growth of our operations, we will need to continue to improve our operational, financial and management processes and systems.
41
The success of our growth plan depends, in part, on our ability to implement our business strategies. In particular, our growth depends on our ability to maintain and expand our network by attracting new clients, increasing the use of our platforms and solutions by existing clients and by integrating them across geographies and a wide range of asset classes, products, trade types and trade sizes within our marketplaces. Our growth also depends on, among other things, our ability to increase our market share, add new products, enhance our existing platforms and solutions, develop new offerings that address client demand and market trends and stay abreast of changing market conditions and regulatory requirements. Our growth may also be dependent on our ability to further diversify our revenue base. As of December 31, 2023, we derived approximately 52% of our revenue from our Rates asset class. Our long-term growth plan includes expanding the number of products we offer across asset classes, by investing in our development efforts and increasing our revenues by growing our market share in our existing markets and entering into new markets. We cannot assure you that we will be able to successfully execute our growth plan or implement our business strategies within our expected timing or at all or be able to maintain or improve our current level of business, and we may decide to alter or discontinue certain aspects of our growth plan at any time.
Execution of our growth plan entails significant risks and may be impacted by factors outside of our control, including competition, general economic, political and market conditions and industry, legal and regulatory changes. Failure to manage our growth effectively could result in our costs increasing at a faster rate than our revenues and distracting management from our core business and operations. For example, we may incur substantial development, sales and marketing expenses and expend significant management effort to create a new platform, platform feature or solution, and the period before such platform, platform feature or solution is successfully developed, introduced and/or adopted may extend over many months or years, if ever. Even after incurring these costs, such platform, platform feature or solution may not achieve market acceptance.
It is possible that our entry into new markets will not be successful, and potential new markets may not develop quickly or at all.
Our long-term growth plan includes expanding our operations by entering into new markets, including new asset classes, products and geographies, including markets where we have little or no operating experience. We may have difficulties identifying and entering into new markets due to established competitors, lack of recognition of our brand and lack of acceptance of our platforms and solutions, as has occurred with certain of our initiatives in the past.
Expansion, particularly in new geographic markets, may require substantial expenditures and take considerable time. In particular, we may need to make additional investments in management and new personnel, infrastructure and compliance systems. Furthermore, our expansion efforts may divert management’s attention or inefficiently utilize our resources. If we are not able to manage our expansion effectively, our expansion costs could increase at a faster rate than our revenues from these new markets. If we cannot successfully implement the necessary processes to support and manage our expansion, our business, financial condition and results of operations may suffer.
We cannot assure you that we will be able to successfully adapt our platforms, solutions and technologies for use in any new markets. Even if we do adapt our products, services and technologies, we cannot assure you that we will be able to attract clients to our platforms and solutions and compete successfully in any such new markets.
These and other factors have led us to scale back our expansion efforts into new markets in the past, and there can be no assurance that we will not experience similar difficulties in the future. There can be no assurance that we will be able to successfully maintain or grow our operations abroad.
It is possible that our entry into new markets will not be successful, and potential new markets may not develop quickly or at all. If these efforts are not successful, we may realize less than expected earnings, which in turn could result in a material decrease in the market value of our Class A common stock.
We may undertake acquisitions or divestitures, which may not be successful, and which could materially adversely affect our business, financial condition and results of operations.
From time to time, we consider acquisitions, which may not be completed or, if completed, may not be ultimately beneficial to us. We have made several acquisitions in the past, including the purchase of the Hilliard Farber & Co. business in 2008, the Rafferty Capital Markets business in 2011, BondDesk in 2013, CodeStreet in 2016, Nasdaq’s U.S. fixed income electronic trading platform in 2021, Yieldbroker in 2023 and r8fin in 2024. We also may consider potential divestitures of businesses from time to time. We routinely evaluate potential acquisition and divestiture candidates and engage in discussions and negotiations regarding potential acquisitions and divestitures on an ongoing basis; however, even if we execute a definitive agreement, there can be no assurance that we will consummate the transaction within the anticipated closing timeframe, or at all. Moreover, there is significant competition for acquisition and expansion opportunities in the electronic financial services industry.
42
Acquisitions involve numerous risks, including (i) failing to properly identify appropriate acquisition targets and to negotiate acceptable terms; (ii) incurring the time and expense associated with identifying and evaluating potential acquisition targets and negotiating potential transactions; (iii) diverting management’s attention from the operation of our existing business; (iv) using inaccurate estimates and judgments to evaluate credit, operations, funding, liquidity, business, management and market risks with respect to the acquisition target or assets; (v) litigation relating to an acquisition, particularly in the context of a publicly held acquisition target, that could require us to incur significant expenses, result in or delay or enjoin the transaction; (vi) failing to properly identify an acquisition target’s significant problems, liabilities or risks; (vii) not receiving required regulatory approvals on the terms expected or such approvals being delayed or restrictively conditional; and (viii) failing to obtain financing on favorable terms, or at all. In addition, in connection with any acquisitions, we must comply with various antitrust requirements, and it is possible that perceived or actual violations of these requirements could give rise to litigation or regulatory enforcement action or result in us not receiving the necessary approvals to complete a desired acquisition.
Furthermore, even if we complete an acquisition, the anticipated benefits from such acquisition may not be achieved unless the operations of the acquired business, platform or technology are integrated in an efficient, cost-effective and timely manner. The integration of any acquisition includes numerous risks, including an acquired business not performing to our expectations, our not integrating it appropriately and failing to realize anticipated synergies and cost savings as a result, and difficulties, inefficiencies or cost overruns in integrating and assimilating the organizational cultures, operations, technologies, data, products and services of the acquired business with ours. The integration of any acquisition will require substantial attention from management and operating personnel to ensure that the acquisition does not disrupt any existing operations, or affect our reputation or our clients’ opinions and perceptions of our platforms and solutions. We may spend time and resources on acquisitions that do not ultimately increase our profitability or that cause loss of, or harm to, relationships with key employees, clients, third-party providers or other business partners.
Divestitures also involve numerous risks, including: (i) failing to properly identify appropriate assets or businesses for divestiture and buyers; (ii) inability to negotiate favorable terms for the divestiture of such assets or businesses; (iii) incurring the time and expense associated with identifying and evaluating potential divestitures and negotiating potential transactions; (iv) management’s attention being diverted from the operation of our existing business, including to provide on-going services to the divested business; (v) encountering difficulties in the separation of operations, platforms, solutions or personnel; (vi) retaining future liabilities as a result of contractual indemnity obligations; and (vii) loss of, or damage to our relationships with, any of our key employees, clients, third-party providers or other business partners.
We cannot readily predict the timing or size of any future acquisition or divestiture, and there can be no assurance that we will realize any anticipated benefits from any recent or any potential future acquisition or divestiture. If we do not realize any such anticipated benefits, our business, financial condition and results of operations could be materially adversely affected.
If we enter into strategic alliances, partnerships or joint ventures, we may not realize the anticipated strategic goals for any such transactions.
From time to time, we may enter into strategic alliances, partnerships or joint ventures as a means to accelerate our entry into new markets, provide new solutions or enhance our existing capabilities. Entering into strategic alliances, partnerships and joint ventures entails risks, including: (i) difficulties in developing or expanding the business of newly formed alliances, partnerships and joint ventures; (ii) exercising influence over the activities of joint ventures in which we do not have a controlling interest; (iii) potential conflicts with or among our partners; (iv) the possibility that our partners could take action without our approval or prevent us from taking action; and (v) the possibility that our partners suffer reputational harm during the pendency of the partnership, become bankrupt or otherwise lack the financial resources to meet their obligations.
In addition, there may be a long negotiation period before we enter into a strategic alliance, partnership or joint venture or a long preparation period before we commence providing trading venues and solutions and/or begin earning revenues pursuant to such arrangement. We typically incur significant business development expenses, and management’s attention may be diverted from the operation of our existing business, during the discussion and negotiation period with no guarantee of consummation of the proposed transaction. Even if we succeed in developing a strategic alliance, partnership or joint venture with a new partner, we may not be successful in maintaining the relationship.
We cannot assure you that we will be able to enter into strategic alliances, partnerships or joint ventures on terms that are favorable to us, or at all, or that any strategic alliance, partnership or joint venture we have entered into or may enter into will be successful. In particular, these arrangements may not generate the expected number of new clients or increased trading volumes or revenues or other benefits we seek. Unsuccessful strategic alliances, partnerships or joint ventures could harm our reputation and have a material adverse effect on our business, financial condition and results of operations.
43
Risks Relating to our International Operations
Our business, financial condition and results of operations may be materially adversely affected by risks associated with our international operations.
We are a global company serving clients in over 70 countries with offices in North America, Europe, Asia, Australia and the Middle East. We may further expand our international operations in the future. We have invested significant resources in our international operations and expect to continue to do so in the future. However, there are certain risks inherent in doing business in international markets, particularly in the financial services industry, which is heavily regulated in many jurisdictions. These risks include:
•local economic, political and social conditions, including the possibility of economic slowdowns, hyperinflationary conditions, political instability, social unrest or outbreaks of pandemic or contagious diseases;
•differing legal and regulatory requirements, and the possibility that any required approvals may impose restrictions on the operation of our business;
•changes in laws, government policies and regulations, or in how provisions are interpreted or administered and how we are supervised;
•the inability to manage and coordinate the various legal and regulatory requirements of multiple jurisdictions that are constantly evolving and subject to change;
•varying tax regimes, including with respect to imposition or increase of taxes on financial transactions or withholding and other taxes on remittances and other payments by subsidiaries;
•actual or threatened trade war, including between the United States and China, or other governmental action related to tariffs, international trade agreements or trade policies;
•currency exchange rate fluctuations, changes in currency policies or practices and restrictions on currency conversion;
•limitations or restrictions on the repatriation or other transfer of funds;
•potential difficulties in protecting intellectual property;
•the inability to enforce agreements, collect payments or seek recourse under or comply with differing commercial laws;
•managing the potential conflicts between locally accepted business practices and our obligations to comply with laws and regulations, including anti-corruption and anti-money laundering laws and regulations;
•compliance with economic sanctions laws and regulations;
•difficulties in staffing and managing foreign operations;
•increased costs and difficulties in developing and managing our global operations and our technological infrastructure; and
•seasonal fluctuations in business activity.
Our overall success depends, in part, on our ability to anticipate and effectively manage these risks and there can be no assurance that we will be able to do so without incurring unexpected or increased costs. If we are not able to manage the risks related to our international operations, our business, financial condition and results of operations may be materially adversely affected. In certain regions, the degree of these risks may be higher due to more volatile economic, political or social conditions, less developed and predictable legal and regulatory regimes and increased potential for various types of adverse governmental action.
Fluctuations in foreign currency exchange rates may adversely affect our financial results.
For the year ended December 31, 2023, 36% of our revenues derived from our international operations. Since we operate in several different countries outside the United States, most notably the UK, the Netherlands, Japan, as well as Australia, China, Singapore, Hong Kong and Canada, among others, significant portions of our revenues, expenses, assets and liabilities are denominated in non-U.S. dollar currencies, most notably the British pound sterling and euros, as well as Japanese Yen, Australian dollars, Chinese Yuan Renminbi, Singapore dollars, Hong Kong dollars and Canadian dollars, among others. Because our consolidated financial statements are presented in U.S. dollars, we must translate non-U.S. dollar denominated revenues, income and expenses, as well as assets and liabilities, into U.S. dollars at exchange rates in effect during or at the end of each reporting period. Accordingly, increases or decreases in the value of the U.S. dollar against other currencies may affect our business, financial condition and results of operations. In recent years, external events have caused, and may continue to cause, significant volatility in currency exchange rates, especially among the U.S. dollar, the British pound sterling and the euro.
While we engage in hedging activity to attempt to mitigate currency exchange rate risk, these hedging activities may not fully mitigate the risk. Accordingly, if there are adverse movements in exchange rates, we may suffer significant losses, which would materially adversely affect our financial condition and results of operations.
44
Risks Relating to Cybersecurity and Intellectual Property
Actual or perceived security vulnerabilities in our systems, networks and infrastructure, breaches of security controls, unauthorized access to confidential or personal information or cyber-attacks could harm our business, reputation and results of operations.
The operation of our electronic trading platforms relies on the secure processing, storage and transmission of a large amount of transactional data and other confidential sensitive data. Because of our reliance on technology (including through our use of third-party service providers), we are susceptible to various cyber-threats to our systems, networks and infrastructure, in particular those that power our platforms and solutions. Similar to other financial services companies that provide services online, we have experienced, and likely will continue to experience, cyber-threats, cyber-attacks and attempted security breaches. Cyber-threats and cyber-attacks vary in technique and sources, are persistent, frequently change and have become more sophisticated, targeted and difficult to detect and prevent against. These threats and attacks may come from external sources such as governments, crime organizations, hackers and other third parties or may originate internally from an employee or a third-party service provider, and can include unauthorized attempts to access, disable, interrupt, improperly modify or degrade our information, systems, networks and infrastructure or the introduction of computer viruses, ransomware, malware, and other malicious codes and fraudulent “phishing” emails or other forms of social engineering that seek to misappropriate data and information. Due to political uncertainty in certain regions, we, like other financial services companies, may be subject to a heightened risk of such attacks from nation-state and affiliated actors, including attacks that could materially disrupt our systems, operations and platforms. While we maintain insurance coverage that is designed to address certain aspects of cyber risks, such insurance coverage may be insufficient to cover all losses or all types of claims that may arise in the event we experience a cybersecurity incident, data breach, disruption, unauthorized access, interruption, significant delay, failure or malfunction in our systems, networks, infrastructure and other operations, affecting, in particular, our platforms and solutions, which could result in reputational damage, financial losses, client dissatisfaction, regulatory enforcement actions, fines and penalties and/or private litigation.
While we have dedicated personnel who are responsible for maintaining our cybersecurity program and training our employees on cybersecurity, and while we utilize third-party technology products and services to help identify, protect and remediate our systems, networks and infrastructure, such measures and security controls may not be adequate or effective to prevent, detect or mitigate a cyber-attack, security breach, data breach, disruption, unauthorized access, interruption, significant delay, failure or malfunction. We are also dependent on security measures, if any, that our third-party service providers and clients take to protect their own systems, networks and infrastructures. Because techniques used to obtain unauthorized access to, or to sabotage, systems, networks and infrastructures change frequently and generally are not recognized until launched against a target, we, our third-party service providers or our clients may be unable to anticipate these techniques or to implement adequate defensive measures or security controls. Additionally, we may be required in the future to incur significant costs to continue to minimize, mitigate against or alleviate the effects of cyber-attacks, security and data breaches or other security vulnerabilities and to protect against damage caused by such events.
There have been an increasing number of cyber-attacks in recent years in various industries, including ours, and cybersecurity risk management has been the subject of increasing focus by U.S. and foreign regulators. See Part I, Item 1C. – “Cybersecurity – Governance” for further detail regarding our cybersecurity risk management, strategy and governance structure.
As regulatory focus increases, we may be required to devote significant additional financial, operational and technical resources to modify and enhance our defensive measures and security controls and to identify and remediate any security vulnerabilities. In addition, any adverse regulatory actions that may result from a cybersecurity incident or a finding that we have inadequate defensive measures and security controls, could result in regulatory enforcement actions, fines and penalties, private litigation and/or reputational harm.
Although we have not been a victim of a cyber-attack or other cybersecurity incident that has had a material impact on our operations or financial condition, we have from time to time experienced cybersecurity incidents, including attempted distributed denial of service attacks, malware infections, phishing and other information technology incidents that are typical for an electronic financial services company of our size. If an actual, threatened or perceived cyber-attack or breach of our security occurs, our clients could lose confidence in our security measures and the reliability of our platforms and solutions, which would materially harm our ability to retain existing clients and gain new clients. As a result of any such attack or breach, we may be required to expend significant resources to repair system, network or infrastructure damage and to protect against the threat of future cyber-attacks or security breaches. We could also face litigation or other claims from impacted individuals as well as substantial regulatory sanctions or fines.
45
Systems failures, interruptions, delays in service, catastrophic events and resulting interruptions in the availability of our platforms or solutions could materially harm our business and reputation.
Our business depends on the efficient and uninterrupted operation of our systems, networks and infrastructure, in particular those that power our platforms and solutions. From time to time, we have experienced, and we cannot assure you that we, or our third-party providers, will not experience, systems failures, delays in service or business interruptions. Our systems, networks, infrastructure and other operations, in particular our platforms and solutions, are vulnerable to impact or interruption from a wide variety of causes, including: irregular or heavy use of our trading platforms and related solutions during peak trading times or at times of increased market volatility; power, internet or telecommunications failures; hardware failures or software errors; human error, acts of vandalism or sabotage; catastrophic events, including those that are occurring with increasing frequency due to climate change such as natural disasters and extreme weather events; acts of war, terrorism or other armed hostilities; malicious cyberattacks, cyber-warfare or cyber incidents, such as unauthorized access, ransomware, loss or destruction of data, computer viruses or other malicious code; and the loss or failure of systems over which we have no control, such as loss of support services from critical third-party providers. In addition, we may also face significant increases in our use of power and data storage and may experience a shortage of capacity and/or increased costs associated with such usage.
Any failure of, or significant interruption, delay or disruption to, or security breaches affecting, our systems, networks or infrastructure could result in: disruption to our operations, including disruptions in service to our clients; slower response times; distribution of untimely or inaccurate market data to clients who rely on this data for their trades; delays in trade execution; incomplete or inaccurate accounting, recording or processing of trades; significant expense to repair, replace or remediate systems, networks or infrastructure; financial losses and liabilities to clients; loss of clients; or legal or regulatory claims, proceedings, penalties or fines. Any system failure or significant interruption, delay or disruption in our operations, or decreases in the responsiveness of our platforms and solutions, could materially harm our reputation and business and lead our clients to decrease or cease their use of our trading platforms and solutions.
We internally support and maintain many of our systems and networks, including those underlying our trading platforms; however, we may not have sufficient personnel to properly respond to all systems, networks or infrastructure problems. Our failure to monitor or maintain our systems, networks and infrastructure, including those maintained or supported by our third-party providers, or to find a replacement for defective or obsolete components within our systems, networks and infrastructure in a timely and cost-effective manner when necessary, would have a material adverse effect on our business, financial condition and results of operations. While we generally have disaster recovery and business continuity plans that utilize industry standards and best practices for much of our business, including redundant systems, networks, computer software and hardware and data centers to address interruption to our normal course of business, our systems, networks and infrastructure may not always be fully redundant and our disaster recovery and business continuity plans may not always be sufficient or effective. Similarly, although some contracts with our third-party providers, such as our hosting facility providers, require adequate disaster recovery or business continuity capabilities, we cannot be certain that these will be adequate or implemented properly. Our disaster recovery and business continuity plans are heavily reliant on the availability of the internet and mobile phone technology, so any disruption of those systems would likely affect our ability to recover promptly from a crisis situation. In addition, supply chain disruptions could affect our ability to procure hardware needed to recover from a crisis situation. If we are unable to execute our disaster recovery and business continuity plans, or if our plans prove insufficient for a particular situation or take longer than expected to implement in a crisis situation, it could have a material adverse effect on our business, financial condition and results of operations, and our business interruption insurance may not adequately compensate us for losses that may occur.
In addition, high-profile system failures in the electronic financial services industry, whether or not involving us directly, could negatively impact our business. In recent years, U.S. and foreign regulators have imposed new requirements on operations such as ours that have been costly for us to implement and that could result in a decrease in the use of our platforms and demand for some of our solutions or result in regulatory investigations, fines and penalties. For example, the SEC’s Regulation Systems Compliance and Integrity and the system safeguards regulations of the CFTC subject portions of our trading platforms and other technological systems related to our SEFs to more extensive regulation and oversight. The SEC has proposed amendments which, among other things, would extend Regulation Systems Compliance and Integrity to systems involving U.S. government securities trading and impose additional cybersecurity-related obligations on covered entities. Ensuring our compliance with these (and any future proposed) regulations requires significant ongoing costs and there can be no assurance that government regulators will not impose additional costly obligations on us in the future. If system failures in the industry continue to occur, it is possible that confidence in the electronic financial services industry could diminish, leading to materially decreased trading volumes and revenues.
46
We may not be able to adequately protect our intellectual property or rely on third-party intellectual property rights, which, in turn, could materially adversely affect our brand and our business.
Our success depends in part on our proprietary technology, processes, methodologies and information and on our ability to further build brand recognition using our tradenames and logos. We rely primarily on a combination of U.S. and foreign patent, copyright, trademark, service mark and trade secret laws and nondisclosure, license, assignment and confidentiality arrangements to establish, maintain and protect our proprietary rights as well as the intellectual property rights of third parties whose content, data, information and other materials we license (see also “—We rely on third parties to perform certain key functions, and their failure to perform those functions could result in the interruption of our operations and systems and could result in significant costs and reputational damage to us.”). We can give no assurances that any such patents, copyrights, trademarks, service marks and other intellectual property rights will protect our business from competition or that any intellectual property rights applied for in the future will be issued, or that the intellectual property rights licensed to us from third-parties will not be subject to challenge. In addition, the steps we take to protect our intellectual property may not adequately protect our rights or prevent third parties from infringing or misappropriating our rights, and third parties may successfully challenge the validity and/or enforceability of our intellectual property rights. Furthermore, we cannot assure you that these protections will be adequate to prevent our competitors from independently developing platforms, solutions technologies or logos that are substantially equivalent or superior to our own.
The protection of our intellectual property may require the expenditure of financial and managerial resources. Litigation brought to protect and enforce our intellectual property rights or bring a claim against a third-party licensor could be costly, time-consuming and distracting to management and may result in the impairment or loss of portions of our intellectual property. In addition, the laws of some countries in which we now or in the future provide our platforms and solutions may not protect intellectual property rights to the same extent as the laws of the United States. If our efforts to secure, protect and enforce our intellectual property rights are inadequate, or if any third party misappropriates, dilutes or infringes on our intellectual property, the value of our brand may be harmed, which could have a material adverse effect on our business.
Third parties may claim that we are infringing or misappropriating their intellectual property rights, which could cause us to suffer competitive injury, expend significant resources defending against such claims or be prevented from offering our platforms and solutions.
Our competitors, as well as other companies and individuals, may have obtained, and may be expected to obtain in the future, intellectual property rights related to the types of platforms and solutions we currently provide or plan to provide. In particular, as the number of trading platforms increases and the functionality of these platforms and related solutions further overlaps, the possibility of intellectual property rights claims against us grows. We cannot assure you that we are or will be aware of all third-party intellectual property rights that may pose a risk of infringement or misappropriation to our platforms, solutions, technologies or the manner in which we operate our business.
We have in the past been, are currently, and may from time to time in the future become subject to legal proceedings and claims relating to the intellectual property rights of others. The costs of supporting legal and dispute resolution proceedings are considerable, and there can be no assurance that a favorable outcome will be obtained. We may need to settle litigation and disputes on terms that are unfavorable to us, or we may be subject to an unfavorable judgment. The terms of any settlement or judgment may require us to cease some or all of our operations, pay substantial amounts to the other party and/or seek a license to continue practices found to be in violation of third-party intellectual property rights, which may not be available on reasonable terms and may significantly increase our operating expenses. A license may not be available to us at all, and we may be required to develop alternative non-infringing platforms, solutions, technologies or practices or discontinue use of such platforms, solutions, technologies or practices. Any development efforts could require significant effort and expense and, as result, our business, results of operations and financial condition could be materially adversely affected.
Our use of open source software could result in litigation or impose unanticipated restrictions on our ability to commercialize our platforms and solutions.
We use open source software in our technology, most often as small components within a larger solution. Open source code is also contained in some third-party software we rely on. The terms of many open source licenses are ambiguous and have not been interpreted by U.S. or other courts, and these licenses could be construed in a manner that imposes unanticipated conditions or restrictions on our ability to commercialize our platforms and solutions, license the software on unfavorable terms, require us to re-engineer our platforms and solutions or take other remedial actions, any of which could have a material adverse effect on our business.
47
Risks Relating to Legal, Regulatory and Tax Considerations
Extensive regulation of our industry results in ongoing exposure to significant costs and penalties, enhanced oversight and restrictions and limitations on our ability to conduct and grow our business.
The financial services industry, including our business, is subject to extensive regulation by governmental and self-regulatory organizations in the jurisdictions in which we operate. These regulators have broad powers to promulgate and interpret laws, rules and regulations that often serve to restrict or limit our business. The SEC, the CFTC, FINRA, the NFA and other authorities extensively regulate the U.S. financial services industry, including most of our operations in the United States. Much of our international operations are subject to similar regulations in their respective jurisdictions, including regulations overseen by the FCA, the DNB, the AFM, the AMF, the ACPR, the BaFin, the JFSA, the JSDA, the SFC, the MAS, the ASIC, the CBNV, the FINMA, the Investment Industry Regulatory Organization of Canada and provincial regulators in Canada and the DFS.
Most aspects of our business, and in particular our broker-dealer, SEF and introducing broker subsidiaries, are subject to laws, rules and regulations that cover all aspects of our business, including manner of operation, system integrity, anti-money laundering and financial crimes, handling of material non-public information, safeguarding data, capital requirements, reporting, record retention, market access, licensing of employees and the conduct of officers, employees and other associated persons. See Part I, Item 1. – “Business – Regulation,” for a further description of the laws, rules and regulations that materially impact our business. There can be no assurance that we or our directors, officers and employees will be able to fully comply with these laws, rules and regulations. Any failure to comply with such legal and regulatory requirements could subject us to increased costs, fines, penalties or other sanctions, including suspensions of, or prohibitions on, certain of our activities, revocations of certain of our licenses or registrations, such as our membership in FINRA or our registration as a broker-dealer, or suspension of personnel.
Certain of our subsidiaries are subject to net capital and similar financial resource requirements. For example, our SEF subsidiaries are required to maintain sufficient financial resources to cover operating costs for at least one year. These net capital and related requirements may restrict our ability to withdraw capital from our regulated subsidiaries in certain circumstances, including through the payment of dividends, stock repurchases or the making of unsecured advances or loans.
Some of our subsidiaries are subject to regulations, including under FINRA, the FCA and the DNB, regarding changes in control of their ownership or organizational structure as defined by the applicable regulatory body. These regulations generally provide that prior regulatory approval must be obtained in connection with any transaction resulting in a change in control or organizational structure of the subsidiary, such as changes in direct and indirect ownership or changes in the composition of the board of directors or similar body or the appointment of new officers, and may include similar changes that occur at the Company or any of its stockholders that may be deemed to hold a controlling interest as defined by the applicable regulatory body. As a result of these regulations, our future efforts to sell shares or raise additional capital, or to make changes to our organizational structure, may be delayed or prohibited in circumstances in which such a transaction would give rise to a change in control or organizational structure as defined by the applicable regulatory body.
Our ability to operate our trading platforms or offer our solutions in a particular jurisdiction is dependent on continued registration or authorization in that jurisdiction (or the maintenance of a valid exemption from such registration or authorization). In addition, regulatory approval may be required to expand certain of our operations and activities, and we may not be able to obtain the necessary regulatory approvals on a timely or cost-effective basis, or at all. Even if regulatory approvals are obtained, they may limit or impose restrictions on our operations and activities, and we may not be able to continue to comply with the terms of such approvals.
We incur significant costs, and will continue to devote significant financial and operational resources, to develop, implement and maintain policies, systems and processes to comply with our evolving legal and regulatory requirements. Future laws, rules and regulations, or adverse changes to, or more stringent enforcement of, existing laws, rules and regulations, could increase these costs and expose us to significant liabilities.
Our regulators generally require strict compliance with their laws, rules and regulations, and may investigate and enforce compliance and punish non-compliance. Many of our regulators, as well as other governmental authorities, are empowered to bring enforcement actions and to conduct administrative proceedings, examinations, inspections and investigations, which may result in increased compliance costs, penalties, fines, enhanced oversight, increased financial and capital requirements, additional restrictions or limitations, censure, suspension or other sanction, such as disgorgement, restitution or the revocation of regulatory approvals. The risks associated with such actions are difficult to assess or quantify.
48
In the normal course of our business, we have been, and continue to be from time to time, a party to various legal and regulatory proceedings related to compliance with applicable laws, rules and regulations, including audits, examinations and investigations of our operations and activities. Legal and regulatory actions, from subpoenas and other requests for information to potential criminal investigations, may divert management’s attention, cause us to incur significant expenses, including fees for legal representation and costs for remediation efforts, and result in fines, penalties or other sanctions. We may also be required to change or cease aspects of our operations or activities if a legal or regulatory authority determines that we have failed to comply with any laws, rules or regulations applicable to our business and/or otherwise determines to prohibit any of our operations or activities or revoke any of our approvals. In addition, regardless of the outcome, such actions may result in substantial costs and negative publicity, which may damage our reputation and impair our ability to attract and retain clients.
Firms in the financial services industry have experienced increased scrutiny in recent years, and penalties, fines and other sanctions sought by governmental and regulatory authorities, including the SEC, the CFTC, the Department of Justice, state securities administrators and state attorneys general in the United States, the FCA in the UK and other foreign regulators, have increased accordingly. This trend toward a heightened regulatory oversight and enforcement environment is expected to continue for the foreseeable future, and may create uncertainty and may increase our exposure to scrutiny of our operations and activities, significant penalties and liability and negative publicity.
Our business, and the businesses of many of our clients, could be materially adversely affected by new laws, rules or regulations or changes in existing laws, rules or regulations, including the interpretation and enforcement thereof.
Our business, and the business of many of our clients, is subject to extensive regulation.
Governmental and regulatory authorities periodically review legislative and regulatory policies and initiatives, and may promulgate new or revised, or adopt changes in the interpretation and enforcement of existing, laws, rules and regulations at any time. Any such changes in laws, rules or regulations or in governmental policies could create additional regulatory exposure for our business, cause us to incur significant additional costs, require us to change or cease aspects of our business or restrict or limit our ability to grow our business, any of which could have a material adverse effect on our business, financial condition or results of operations. There have been in the past, and could be in the future, significant technological, operational and compliance costs associated with the obligations that derive from compliance with evolving laws, rules and regulations.
Changes in legislation and in the rules and regulations promulgated by domestic and foreign regulators, and how they are applied, often directly affect the method of operation and profitability of dealers and other financial services intermediaries, including our dealer clients, and could result in restrictions in the way we and our clients conduct business. For example, current financial regulations impose certain capital requirements on, and restrict certain trading activities by, our dealer clients, which could adversely affect such clients’ ability to make markets across a variety of asset classes and products. If our existing dealer clients reduce their trading activity and that activity is not replaced by other market participants, the level of liquidity and pricing available on our trading platforms would be negatively impacted, which could materially adversely affect our business, financial condition and results of operations. Our business and that of our clients could also be affected by the monetary policies adopted by the Federal Reserve and foreign central banking authorities, which may affect the credit quality of our clients or increase the cost for our clients to trade certain instruments on our trading platforms. In addition, such changes in monetary policy, such as the Federal Reserve’s recent increases to the federal funds rate, may directly impact our cost of funds for financing and investment activities and may impact the value of any financial instruments we hold.
Furthermore, many of the underlying markets in which we facilitate trading, and in which our clients trade, are subject to regulation. For example, trading in interest rate swaps has been subject to extensive regulation in the past, and any future regulation could lead to a decline in trading in these markets, which could have a negative impact on our trading volumes and, as a result, our revenues.
In addition, regulatory bodies in Europe have developed and continue to develop rules and regulations targeted at the financial services industry. Additionally, most of the world’s major economies have introduced and continue to introduce regulations implementing Basel III, a global regulatory standard on bank capital adequacy, stress testing and market liquidity risk. The continued implementation of new rules and regulations concerning bank capital standards could restrict the ability of our large bank and dealer customers to raise additional capital or use existing capital for trading purposes, which might cause them to trade less on our trading platforms and diminish transaction velocity. In addition, as regulations are introduced which affect our prudential obligations, the regulatory capital requirements imposed on certain of our subsidiaries may change.
49
It is difficult to know conclusively how future regulatory developments may directly affect our business. We cannot predict whether additional changes to the laws, rules and regulations that govern our business and operations, including changes to their interpretation, implementation or enforcement, will occur in the future or the extent to which any such changes will impact our business and operations. In addition, we cannot predict how current proposals that have not yet been finalized or that remain subject to ongoing debate will be implemented or in what form. We believe that uncertainty and potential delays around the final form of such new laws, rules and regulations may negatively impact our clients and trading volumes in certain markets in which we transact. Additionally, unintended consequences of such new laws, rules and regulations may adversely affect our industry, our clients and us in ways yet to be determined. Any such legal and regulatory changes could affect us in substantial and unpredictable ways, and could have a material adverse effect on our business, financial condition and results of operations.
Our actual or perceived failure to comply with privacy, data protection and information security laws, rules, regulations and obligations could harm our business.
Certain types of information we collect, compile, store, use, transfer and/or publish are subject to numerous federal, state, local and foreign laws and regulations regarding privacy, data protection and information security. These laws, rules and regulations govern the storing, sharing, use, processing, transfer, disclosure and protection of personal information and other content. The scope of these laws, rules and regulations are changing, subject to differing interpretations, may be inconsistent among jurisdictions or conflict with other laws, rules or regulations. We are also subject to the terms of our privacy policies and obligations to third parties related to applicable privacy, data protection and information security.
The regulatory framework for privacy, data protection and information security worldwide is uncertain, and is likely to remain uncertain for the foreseeable future, and we expect that there will continue to be new laws, rules regulations and industry standards concerning privacy, data protection and information security proposed and enacted in the various jurisdictions in which we operate. For example, in the EEA, the General Data Protection Regulation (“GDPR”) imposes more stringent EU data protection requirements for entities using, processing, and transferring personal data and provides for significant penalties for noncompliance. The GDPR prohibits the transfer of personal data to countries outside of the European Union/EEA (including the U.S.) that are not considered by the European Commission to provide an adequate level of data protection, except if the data controller meets very specific requirements, including, for example, use of standard contractual clauses (“SCCs”), issued by the European Commission, or certification under the new EU-U.S. Data Privacy Framework administered by the U.S. Department of Commerce. . The SCCs impose obligations on companies relating to cross-border personal data transfers, including, for example, depending on a party’s role in the transfer, implementation of additional security measures and to update internal privacy practices. We rely on a mixture of mechanisms to transfer personal data from our EU business to the U.S. and we evaluate what additional mechanisms may be required to establish adequate safeguards for personal information. As supervisory authorities issue further guidance on personal information export mechanisms, including circumstances where the SCCs cannot be used and/or broaden their enforcement activities, we could incur substantial costs and/or regulatory investigations or fines. We are also subject to the GDPR as incorporated into United Kingdom law (“UK GDPR”). Following Brexit, the European Commission adopted a UK adequacy decision in June 2021 which organizations can rely on for EEA to UK personal data transfers. This decision will automatically expire four years after its entry into force, but it might be renewed provided the UK maintains an adequate level of data protection. The relationship between the UK and the EU in relation to certain aspects of data protection law remains unclear, however, and it is unclear how UK data protection laws and regulations will develop in the medium to longer term, and how data transfers to and from the UK will be regulated in the long term. Outside of Europe and the UK, several other countries in which we operate, including China, Japan, Singapore and Hong Kong have established specific legal requirements for privacy, data protection and information security, including data localization and/or cross-border transfer restrictions.
If we are otherwise unable to transfer personal information between and among countries and regions in which we operate, it could affect the manner in which we provide our services and could adversely affect our financial results. Moreover, any changes to these laws may require us to modify our data processing practices and policies and to incur substantial costs and expenses to comply.
We are also subject to evolving EU and UK privacy laws on cookies, tracking technologies and e-marketing. Recent European court and regulator decisions are driving increased attention to use of cookies and tracking technologies on websites and digital platforms. If the trend of increasing enforcement by regulators of the strict approach to opt-in consent for all but essential use cases, this could lead to substantial costs, require significant systems changes, limit the effectiveness of our marketing activities, divert the attention of our technology personnel, adversely affect our margins, and subject us to additional liabilities. In light of the complex and evolving nature of EU, EU Member State and UK privacy laws on cookies and tracking technologies, there can be no assurances that we will be successful in our efforts to comply with such laws.
50
There has also been increased regulation of data privacy and security in the U.S. at the state level. For example, the California Consumer Privacy Act (“CCPA”), which came into force in 2020, broadly defines personal information, gives California residents expanded data privacy rights and protections to access and delete their personal information, opt out of certain personal information sharing, and receive detailed information about how their personal data is used. The CCPA provides for civil penalties for violations and a private right of action for data breaches. The CCPA contained certain exemptions for personal information of employees and job applicants, and personal information collected in a “business-to-business” context, each of which expired as of January 1, 2023, expanding compliance obligations under the CCPA. In addition, the California Privacy Rights Act (“CPRA”), which took effect on January 1, 2023, significantly expanded the CCPA. Among other changes, the CPRA introduced additional obligations such as data minimization and storage limitations; established a dedicated privacy regulator in California, the California Privacy Protection Agency, to implement and enforce the law; and granted additional rights to consumers, such as correction of personal information and additional opt-out rights with respect to a new category of “sensitive information.” The CCPA marked the beginning of a trend toward more stringent state data privacy legislation in the U.S., which may result in significant costs to our business, damage our reputation, require us to amend our business practices, and could adversely affect our business, especially to the extent the specific requirements vary from those and other existing laws. For example, comprehensive privacy laws in multiple U.S. states have gone, or will go, into effect between 2023 and 2026, and a number of other states are considering similar laws related to the protection of consumer personal information.
In addition, many jurisdictions have also enacted or are considering laws requiring companies to notify individuals and/or regulators of data security breaches involving their personal data.These mandatory notifications are costly to implement and often lead to widespread negative publicity, which may cause our clients to lose confidence in the effectiveness of our cybersecurity measures. Any inability, or perceived inability, by us or third parties on which we rely to comply with applicable laws, regulations, policies, industry standards and guidance, contractual obligations, or other legal obligations requiring notification could result in litigation; regulatory investigations, fines and penalties; enforcement actions;increased costs to us and significant legal and financial exposure and/or reputational harm.
Our efforts to comply with privacy, data protection and information security laws, rules and regulations could entail substantial expenses, may divert resources from other initiatives and could impact our ability to provide certain solutions. Additionally, if our third-party providers violate any of these laws or regulations, such violations may also put our operations at risk. Any failure or perceived failure by us to comply with any of our obligations relating to privacy, data protection or information security may result in governmental investigations or enforcement actions, litigation, claims or negative publicity and could result in significant liability, increased costs or cause our clients to lose trust in us, which could have an adverse effect on our reputation and business.
New tax legislation and regulation may materially adversely affect our financial condition, results of operations and cash flows.
At any time, the U.S. federal income tax laws or the administrative interpretations of those laws may be amended. We cannot predict when or if any new U.S. federal income tax law, regulation or administrative interpretation, or any amendment to any existing U.S. federal income tax law, regulation, or administrative interpretation, will be adopted, promulgated or become effective. Any such law, regulation or interpretation could take effect retroactively, and could adversely affect our business and financial condition, and the impact of any such law, regulation or interpretation on holders of our Class A common stock could be adverse. For example, the IRA enacted, among other changes, a 15% corporate alternative minimum tax on certain United States corporations and a 1% excise tax on certain stock redemptions by United States corporations. On October 8, 2021, the Organization for Economic Cooperation and Development announced an accord endorsing and providing an implementation plan focused on global profit allocation, and implementing a global minimum tax rate of at least 15% for large multinational corporations on a jurisdiction-by-jurisdiction basis, known as the “Two Pillar Plan.” On December 15, 2022, the European Council formally adopted a European Union directive on the implementation of the plan by January 1, 2024. We may be subject to the provisions of the Two Pillar Plan, and related tax impacts per local country adoption, as we are a consolidating subsidiary of LSEG.
Unanticipated changes in effective tax rates or adverse outcomes resulting from examination of our income or other tax returns could materially adversely affect our results of operations and financial condition.
We are subject to taxation by U.S. federal, state, local and foreign tax authorities, and our tax liabilities will be affected by the allocation of expenses to differing jurisdictions. Our future effective tax rates could be subject to volatility or adversely affected by a number of factors, including:
•changes in the valuation of our deferred tax assets and liabilities;
•expected timing and amount of the release of any tax valuation allowances;
•tax effects of stock-based compensation;
•changes in tax laws, regulations or interpretations thereof; or
51
•future earnings being lower than anticipated in countries where we have lower statutory tax rates and higher than anticipated in countries where we have higher statutory tax rates.
In addition, we may be subject to audits of our income, sales and other transaction taxes by U.S. federal, state, local and foreign taxing authorities. Outcomes from these audits could have an adverse effect on our results of operations and financial condition.
In certain circumstances, liability for adjustments to a partnership’s tax return may be imputed to the partnership itself absent an election to the contrary. TWM LLC may be subject to material liabilities if, for example, its calculations of taxable income are incorrect.
Our compliance and risk management programs might not be effective and may result in outcomes that could adversely affect our reputation, business, financial condition and results of operations.
Our ability to comply with all applicable laws, rules and regulations is largely dependent on our establishment and maintenance of compliance and risk management programs, including audit and reporting systems, that can quickly adapt and respond to changes in the legal and regulatory landscape, as well as our ability to attract and retain qualified compliance, audit, legal, cybersecurity and other compliance and risk management personnel. While we have policies and procedures to identify, monitor and manage our risks and regulatory obligations, we cannot assure you that our policies and procedures will always be effective or that we will always be successful in monitoring or evaluating the risks to which we are or may be exposed. Our risk-management programs may prove to be ineffective because of their design, their implementation and maintenance or the lack of adequate, accurate or timely information. If our risk-management programs and efforts are ineffective, we could suffer losses that could have a material adverse effect on our financial condition and results of operations.
As part of our compliance and risk management programs, we must rely upon our analysis of laws, rules, regulations and information regarding our industry, markets, personnel, clients and other matters. That information may not in all cases be accurate, complete, up-to-date or properly analyzed. Furthermore, we rely on a combination of technical and human controls and supervision that are subject to error and potential failure.
In case of non-compliance or alleged non-compliance with applicable laws, rules or regulations by us or third parties on which we may rely, we could be subject to regulatory investigations and proceedings that may be very expensive to defend against and may result in substantial fines and penalties or civil lawsuits, including by clients, for damages which can be significant. Any of these outcomes would adversely affect our reputation, financial condition and results of operations. Further, the implementation of new legislation or regulations, or changes in or unfavorable interpretations of existing legislation or regulations by courts or regulators, could require us to incur significant compliance costs and impede our ability to operate, expand and enhance our platforms and solutions as necessary to remain competitive and grow our business, which could materially adversely affect our business, financial condition and results of operations.
We are exposed to litigation risk, including securities litigation risk.
We are from time to time involved in various litigation matters and claims, including lawsuits regarding employment matters, breach of contract matters and other business and commercial matters. See Part I, Item 3. – “Legal Proceedings.” Many aspects of our business, and the businesses of our clients, involve substantial risks of liability. These risks include, among others, disputes over the terms of a trade and claims that a system failure or delay caused monetary loss to a client or that an unauthorized trade occurred. Although we carry insurance that may limit our risk of damages in some matters, we may still sustain uncovered losses or losses in excess of available insurance, and we could incur significant legal expenses defending claims, even those without merit. Due to the uncertain nature of the litigation process, it is not possible to predict with certainty the outcome of any particular litigation matter or claim, and we could in the future incur judgments or enter into settlements that could have a material adverse effect on our business, financial condition and results of operations. The ultimate outcome of litigation matters and claims against us may require us to change or cease certain operations and may result in higher operating costs. An adverse resolution of any litigation matter or claim could cause damage to our reputation and could have a material adverse effect on our business, financial condition and results of operations.
Our stock price may be volatile and, in the past, companies that have experienced volatility in the market price of their stock have been subject to securities class action litigation. We may be the target of this type of litigation in the future. Litigation of this type could result in substantial costs and diversion of management’s attention and resources, which could have a material adverse effect on our business, financial condition and results of operations. Any adverse determination in litigation could also subject us to significant liabilities.
52
Risks Relating to our Indebtedness
The credit agreement that governs the 2023 Revolving Credit Facility imposes certain operating and financial restrictions on us and our restricted subsidiaries, which may prevent us from capitalizing on business opportunities, and we may incur debt in the future that may include similar or additional restrictions.
We are party to the 2023 Revolving Credit Facility, a $500.0 million senior unsecured revolving credit facility with a syndicate of banks. The credit agreement that governs the 2023 Revolving Credit Facility imposes certain operating and financial restrictions. These restrictions, which are subject to a number of qualifications and exceptions, could, among other things, limit the ability of (i) TWM LLC to merge or consolidate with other entities, (ii) the subsidiaries of TWM LLC to incur or guarantee indebtedness and (iii) TWM LLC and its subsidiaries to create or incur liens.
In addition, the credit agreement that governs our 2023 Revolving Credit Facility requires us to maintain a maximum total net leverage ratio and a minimum cash interest coverage ratio. See Part II, Item 7. – “Management’s Discussion and Analysis of Financial Condition and Results of Operations – Liquidity and Capital Resources.”
These covenants could affect our ability to finance our future operations or capital needs and otherwise conduct our business. Our ability to comply with these covenants may be affected by circumstances and events beyond our control, such as prevailing economic conditions and changes in regulations, and we cannot assure you that we will be able to comply with such covenants. In addition, complying with these covenants may also cause us to take actions that make it more difficult for us to successfully execute our business strategies and compete against companies that are not subject to such restrictions.
Our failure to comply with the covenants and other terms of the 2023 Revolving Credit Facility and/or the terms of any future indebtedness could result in an event of default. If any such event of default occurs and is not waived, the lenders under the 2023 Revolving Credit Facility could elect to declare all amounts outstanding and accrued and unpaid interest, if any, under the 2023 Revolving Credit Facility to be immediately due and payable. The lenders would also have the right in these circumstances to terminate any commitments they have to provide further credit extensions. If we are forced to refinance any borrowings under the 2023 Revolving Credit Facility on less favorable terms or if we cannot refinance these borrowings, our financial condition and results of operations could be materially adversely affected.
In addition, although the credit agreement that governs the 2023 Revolving Credit Facility contains restrictions on the incurrence of certain indebtedness, these restrictions are subject to a number of qualifications and exceptions, and we and our subsidiaries may be able to incur substantial indebtedness in the future. The terms of any future indebtedness we may incur could include more restrictive covenants.
Any borrowings under the 2023 Revolving Credit Facility will subject us to interest rate risk, which could cause our debt service obligations to increase significantly.
Any borrowings under the 2023 Revolving Credit Facility will be at variable rates of interest and expose us to interest rate risk. If interest rates rise, as they did throughout most of 2023, our debt service obligations on any borrowings under the 2023 Revolving Credit Facility will increase even though the amount borrowed may remain the same, and our net income and cash flows will correspondingly decrease. Assuming that the $500.0 million 2023 Revolving Credit Facility was fully drawn, each 0.125% change in interest rates would result in an approximate change of $0.6 million in annual interest expense on the borrowings under the 2023 Revolving Credit Facility.
Borrowings under the 2023 Revolving Credit Facility may bear interest at a rate per annum that, at our election, is based upon SOFR. Since the initial publication of SOFR, daily changes in the rate have, on occasion, been more volatile than daily changes in comparable benchmark or market rates, and SOFR over time may bear little or no relation to the historical actual or historical indicative data. The possible volatility of and uncertainty around SOFR as a LIBOR replacement rate could result in higher borrowing costs for us, which could adversely affect our liquidity, financial condition and results of operations.
53
Risks Relating to our Organizational Structure and Governance
Refinitiv controls us and its interests may conflict with ours or yours in the future.
Following the consummation of the LSEG Transaction, LSEG is the controlling shareholder of Refinitiv and Refinitiv continues to be the controlling shareholder of Tradeweb. As of December 31, 2023, Refinitiv controls approximately 89.9% of the combined voting power of our common stock as a result of its ownership of our Class B common stock and Class D common stock, each share of which is entitled to 10 votes on all matters submitted to a vote of our stockholders and its ownership of our Class C common stock, each share of which is entitled to 1 vote on all matters submitted to a vote of our stockholders. Moreover, under our amended and restated bylaws and the Stockholders Agreement, for so long as Refinitiv continues to beneficially own at least 10% of the combined voting power of our common stock, we will agree to nominate to our board of directors a certain number of individuals designated by Refinitiv. Even when Refinitiv ceases to own shares of our common stock representing a majority of the combined voting power, for so long as Refinitiv continues to own a significant percentage of our common stock, Refinitiv will still be able to significantly influence the composition of our board of directors and the approval of actions requiring stockholder approval through its combined voting power. Accordingly, for such period of time, Refinitiv will continue to have significant influence with respect to our management, business plans and policies. In particular, Refinitiv is able to cause or prevent a change of control of our company or a change in the composition of our board of directors and could preclude any unsolicited acquisition of our company. The concentration of voting power could deprive you of an opportunity to receive a premium for your shares of Class A common stock as part of a sale of our company and ultimately might affect the market price of our Class A common stock.
Refinitiv engages in a broad spectrum of activities. In the ordinary course of its business activities, Refinitiv may engage in activities where its interests conflict with our interests or those of our stockholders. Our amended and restated certificate of incorporation provides that none of Refinitiv, any of its affiliates (including LSEG) or any director who is not employed by us (including any non-employee director who serves as one of our officers in both his or her director and officer capacities) or his or her affiliates has any duty to refrain from engaging, directly or indirectly, in the same business activities or similar business activities or lines of business in which we operate. Refinitiv also may pursue acquisition opportunities that may be complementary to our business, and, as a result, those acquisition opportunities may not be available to us. In addition, Refinitiv may have an interest in our pursuing acquisitions, divestitures and other transactions that, in its judgment, could enhance its investment, even though such transactions might involve risks to you.
We are a “controlled company” within the meaning of the corporate governance standards of Nasdaq and, as a result, qualify for, and rely on, exemptions from certain corporate governance requirements.
Refinitiv owns a majority of the combined voting power in us. As a result, we are a “controlled company” within the meaning of the corporate governance standards of Nasdaq. A company of which more than 50% of the voting power is held by an individual, a group or another company is a “controlled company” within the meaning of the corporate governance standards of Nasdaq and may elect not to comply with certain corporate governance requirements of Nasdaq, including:
•the requirement that a majority of our board of directors consist of independent directors;
•the requirement that director nominations be made, or recommended to the full board of directors, by its independent directors or by a nominations committee that is composed entirely of independent directors; and
•the requirement that we have a compensation committee that is composed entirely of independent directors.
We may in the future rely on any or all of the exemptions listed above. If we utilize the exemptions, we will not have a majority of independent directors and our nominating and corporate governance and compensation committees will not consist entirely of independent directors. As a result, our board of directors and those committees may have more directors who do not meet Nasdaq independence standards than they would if those standards were to apply. The independence standards are intended to ensure that directors who meet those standards are free of any conflicting interest that could influence their actions as directors. Accordingly, if we utilize the exemptions, you would not have the same protections afforded to stockholders of companies that are subject to all of the corporate governance requirements of Nasdaq.
54
Anti-takeover provisions in our organizational documents and Delaware law might discourage or delay acquisition attempts for us that you might consider favorable.
Our amended and restated certificate of incorporation and amended and restated bylaws contain provisions that may make the merger or acquisition of our company more difficult without the approval of our board of directors. Among other things, these provisions:
•provide for a multi-class common stock structure with a 10 vote per share feature of our Class B common stock and Class D common stock;
•allow us to authorize the issuance of undesignated preferred stock in connection with a stockholder rights plan or otherwise, the terms of which may be established and the shares of which may be issued without stockholder approval, and which may include super voting, special approval, dividend, or other rights or preferences superior to the rights of the holders of our common stock;
•prohibit stockholder action by written consent from and after the date on which Refinitiv ceases to beneficially own at least 50% of the total voting power of all then outstanding shares of our capital stock unless such action is recommended by all directors then in office;
•provide that the board of directors is expressly authorized to make, alter or repeal our bylaws and that our stockholders may only amend our bylaws with the approval of 66 2∕3% or more in voting power of all outstanding shares of our capital stock, if Refinitiv beneficially owns less than 50% in voting power of our stock entitled to vote generally in the election of directors; and
•establish advance notice requirements for nominations for elections to our board or for proposing matters that can be acted upon by stockholders at stockholder meetings.
In addition, while we have opted out of Section 203 of the Delaware General Corporation Law (“DGCL”), our amended and restated certificate of incorporation contains similar provisions providing that we may not engage in certain “business combinations” with any “interested stockholder” for a three-year period following the time that the stockholder became an interested stockholder, unless:
•prior to such time, our board of directors approved either the business combination or the transaction which resulted in the stockholder becoming an interested stockholder;
•upon consummation of the transaction that resulted in the stockholder becoming an interested stockholder, the interested stockholder owned at least 85% of our voting stock outstanding at the time the transaction commenced, excluding certain shares; or
•at or subsequent to that time, the business combination is approved by our board of directors and by the affirmative vote of holders of at least 66 2∕3% of our outstanding voting stock that is not owned by the interested stockholder.
Our amended and restated certificate of incorporation provides that Refinitiv and its affiliates, and any of their respective direct or indirect transferees and any group as to which such persons are a party, do not constitute “interested stockholders” for purposes of this provision.
Further, as a Delaware corporation, we are also subject to provisions of Delaware law, which may impair a takeover attempt that our stockholders may find beneficial. These anti-takeover provisions and other provisions under Delaware law could discourage, delay or prevent a transaction involving a change in control of our company, including actions that our stockholders may deem advantageous, or negatively affect the market price of our Class A common stock. These provisions could also discourage proxy contests and make it more difficult for you and other stockholders to elect directors of your choosing and to cause us to take other corporate actions you desire. See Exhibit 4.2 to this Annual Report on Form 10-K for a description of our capital stock.
55
Our amended and restated certificate of incorporation designates the Court of Chancery of the State of Delaware as the sole and exclusive forum for certain types of actions and proceedings that may be initiated by our stockholders, which could limit our stockholders’ ability to obtain what such stockholders believe to be a favorable judicial forum for disputes with us or our directors, officers or other employees.
Our amended and restated certificate of incorporation provides that, unless we consent to the selection of an alternative forum, any (i) derivative action or proceeding brought on behalf of our company, (ii) action asserting a claim of breach of a fiduciary duty owed by any director, officer or other employee of our company to our company or our stockholders, (iii) action asserting a claim against us or any director or officer arising pursuant to any provision of the DGCL or our amended and restated certificate of incorporation or our amended and restated bylaws or (iv) action asserting a claim against us or any director or officer of our company governed by the internal affairs doctrine, shall, to the fullest extent permitted by law, be exclusively brought in the Court of Chancery of the State of Delaware or, if such court does not have subject matter jurisdiction thereof, the federal district court of the State of Delaware. Notwithstanding the foregoing, the exclusive forum provision does not apply to suits brought to enforce any liability or duty created by the Exchange Act, the Securities Act or any other claim for which the federal courts have exclusive jurisdiction. Any person or entity purchasing or otherwise acquiring an interest in any shares of our capital stock shall be deemed to have notice of and to have consented to the forum provisions in our amended and restated certificate of incorporation. These choice-of-forum provisions may limit a stockholder’s ability to bring a claim in a judicial forum that he, she or it believes to be favorable for disputes with us or our directors, officers or other employees, which may discourage such lawsuits. Alternatively, if a court were to find these provisions of our amended and restated certificate of incorporation inapplicable or unenforceable with respect to one or more of the specified types of actions or proceedings, we may incur additional costs associated with resolving such matters in other jurisdictions, which could materially adversely affect our business, financial condition and results of operations and result in a diversion of the time and resources of our management and board of directors.
Our principal asset is our equity interest in TWM LLC, and, accordingly, we depend on distributions from TWM LLC to pay our taxes and expenses, including payments under the Tax Receivable Agreement.
We are a holding company and our principal asset is our equity interest in TWM LLC. We have no independent means of generating revenue or cash flow, and our ability to pay our taxes and operating expenses or declare and pay dividends, if any, in accordance with our dividend policy will be dependent upon the financial results and cash flows of TWM LLC and its subsidiaries and distributions we receive from TWM LLC. There can be no assurance that TWM LLC and its subsidiaries will generate sufficient cash flow to distribute funds to us or that applicable state law and contractual restrictions will permit such distributions.
We also incur expenses related to our operations, including payments under the Tax Receivable Agreement, which we expect could be significant. See Note 10 – Tax Receivable Agreement to our audited consolidated financial statements included elsewhere in this Annual Report on Form 10-K. We intend, as its sole manager of TWM LLC, to cause TWM LLC to continue to make cash distributions to the owners of LLC Interests, including us, in an amount sufficient to (i) fund all or part of their tax obligations in respect of taxable income allocated to them and (ii) cover our operating expenses, including payments under the Tax Receivable Agreement. When TWM LLC makes distributions, Continuing LLC Owners will be entitled to receive proportionate distributions based on their economic interests in TWM LLC at the time of such distributions. TWM LLC’s ability to make such distributions may be subject to various limitations and restrictions, such as restrictions on distributions that would either violate any contract or agreement to which TWM LLC is then a party, or any applicable law, or that would have the effect of rendering TWM LLC insolvent. If we do not have sufficient funds to pay tax or other liabilities or to fund our operations, we may have to borrow funds, including under the 2023 Revolving Credit Facility, which could materially adversely affect our liquidity and financial condition and subject us to various restrictions imposed by any such indebtedness. To the extent that we are unable to make payments under the Tax Receivable Agreement for any reason, such payments generally will be deferred and will accrue interest until paid; provided, however, that nonpayment for a specified period may constitute a material breach of a material obligation under the Tax Receivable Agreement and therefore accelerate payments due under the Tax Receivable Agreement. See “— Risks Relating to Ownership of Our Class A Common Stock.”
56
In certain circumstances, TWM LLC will be required to make distributions to us and the other holders of LLC Interests, and the distributions that TWM LLC will be required to make may be substantial and in excess of our tax liabilities and obligations under the Tax Receivable Agreement. To the extent we do not distribute such excess cash, the Continuing LLC Owners would benefit from any value attributable to such cash balances as a result of their ownership of Class A common stock or Class B common stock following an exchange of their LLC Interests.
TWM LLC is treated as a partnership for U.S. federal income tax purposes and, as such, is not subject to any entity-level U.S. federal income tax. Instead, taxable income is allocated to holders of LLC Interests, including us. Accordingly, we incur income taxes on our allocable share of any net taxable income of TWM LLC. Under the TWM LLC Agreement, TWM LLC is generally required from time to time to make pro rata distributions in cash to us and the other holders of LLC Interests in amounts that are intended to be sufficient to cover the taxes on our and the other LLC Interests holders’ respective allocable shares of the taxable income of TWM LLC. As a result of (i) potential differences in the amount of net taxable income allocable to us and the other LLC Interest holders, (ii) the lower tax rate applicable to corporations as compared to individuals and (iii) the favorable tax benefits that we anticipate receiving from (a) acquisitions of LLC Interests in connection with future taxable redemptions or exchanges of LLC Interests for shares of our Class A common stock or Class B common stock, as applicable, and (b) payments under the Tax Receivable Agreement, we expect that these tax distributions will be in amounts that exceed our tax liabilities and obligations to make payments under the Tax Receivable Agreement. Our board of directors will determine the appropriate uses for any excess cash so accumulated, which may include, among other uses, any potential dividends, the payment of obligations under the Tax Receivable Agreement and the payment of other expenses. We have no obligation to distribute such cash (or other available cash other than any declared dividend) to our stockholders. No adjustments to the redemption or exchange ratio of LLC Interests for shares of Class A common stock or Class B common stock, as applicable, will be made as a result of either (i) any cash distribution by TWM LLC or (ii) any cash that we retain and do not distribute to our stockholders. To the extent that we do not distribute such excess cash as dividends on our Class A common stock and Class B common stock and instead, for example, hold such cash balances or lend them to TWM LLC, Continuing LLC Owners would benefit from any value attributable to such cash balances as a result of their ownership of Class A common stock or Class B common stock, as applicable, following a redemption or exchange of their LLC Interests.
The Tax Receivable Agreement with the Continuing LLC Owners requires us to make cash payments to them in respect of certain tax benefits to which we may become entitled, and we expect that the payments we will be required to make will be substantial.
We are a party to the Tax Receivable Agreement with TWM LLC and the Continuing LLC Owners. Under the Tax Receivable Agreement, we are required to make cash payments to a Continuing LLC Owner equal to 50% of the U.S. federal, state and local income or franchise tax savings, if any, that we actually realize, or in certain circumstances are deemed to realize, as a result of (i) increases in the tax basis of TWM LLC’s assets resulting from (a) the purchase of LLC Interests from a Continuing LLC Owner, including with the net proceeds from the IPO, the October 2019 and the April 2020 follow-on offerings and any future offerings or (b) redemptions or exchanges by a Continuing LLC Owner of LLC Interests for shares of our Class A common stock or Class B Common Stock or for cash, as applicable, and (ii) certain other tax benefits related to our making payments under the Tax Receivable Agreement. We expect that the amount of the cash payments that we will be required to make under the Tax Receivable Agreement will be substantial. Any payments made by us to the Continuing LLC Owners under the Tax Receivable Agreement will generally reduce the amount of overall cash flow that might have otherwise been available to us. Furthermore, our obligation to make payments under the Tax Receivable Agreement could make us a less attractive target for an acquisition, particularly in the case of an acquirer that cannot use some or all of the tax benefits that are the subject of the Tax Receivable Agreement.
57
The actual increase in tax basis, as well as the amount and timing of any payments under the Tax Receivable Agreement, will vary depending on a number of factors, including, but not limited to, the timing of any future redemptions, exchanges or purchases of the LLC Interests held by Continuing LLC Owners, the price of our Class A common stock at the time of the redemption, exchange or purchase, the extent to which redemptions or exchanges are taxable, the amount and timing of the taxable income that we generate in the future, the timing and amount of any earlier payments we make under the Tax Receivable Agreement itself, the tax rates then applicable and the portion of our payments under the Tax Receivable Agreement constituting imputed interest. We expect that, as a result of the increases in the tax basis of the tangible and intangible assets of TWM LLC attributable to the redeemed or exchanged LLC Interests, the payments that we may make to Continuing LLC Owners could be substantial. For example, as of December 31, 2023, we recorded a liability of $457.5 million related to our projected obligations under the Tax Receivable Agreement with respect to LLC Interests that were purchased by Tradeweb Markets Inc. using the net proceeds from the IPO and the October 2019 and the April 2020 follow-on offerings and LLC Interests that were subsequently exchanged by Continuing LLC Owners. Payments under the Tax Receivable Agreement are not conditioned on any Continuing LLC Owner’s continued ownership of LLC Interests or our Class A common stock or Class B common stock. There may be a material negative effect on our liquidity if, as described below, the payments under the Tax Receivable Agreement exceed the actual benefits we receive in respect of the tax attributes subject to the Tax Receivable Agreement and/or distributions to us by TWM LLC are not sufficient to permit us to make payments under the Tax Receivable Agreement.
Our organizational structure, including the Tax Receivable Agreement, confers certain benefits upon the Continuing LLC Owners that will not benefit Class A common stockholders or Class B common stockholders to the same extent as it will benefit the Continuing LLC Owners.
Our organizational structure, including the Tax Receivable Agreement, confers certain benefits upon the Continuing LLC Owners that will not benefit the holders of our Class A common stock or Class B common stock to the same extent as it will benefit the Continuing LLC Owners. The Tax Receivable Agreement with TWM LLC and the Continuing LLC Owners provides for the payment by us to a Continuing LLC Owner of 50% of the tax benefits, if any, that we actually realize, or in certain circumstances are deemed to realize, as a result of (i) increases in the tax basis of TWM LLC’s assets resulting from (a) the purchase of LLC Interests from a Continuing LLC Owner, including with the net proceeds from the IPO, the October 2019 and April 2020 follow-on offerings and any future offerings or (b) redemptions or exchanges by a Continuing LLC Owner of LLC Interests for shares of our Class A common stock or Class B Common Stock or for cash, as applicable, and (ii) certain other tax benefits related to our making payments under the Tax Receivable Agreement. Although we will retain 50% of the amount of such tax benefits, this and other aspects of our organizational structure may adversely impact the future trading market for the Class A common stock.
In certain cases, payments under the Tax Receivable Agreement to the Continuing LLC Owners may be accelerated or significantly exceed the actual benefits we realize in respect of the tax attributes subject to the Tax Receivable Agreement.
The Tax Receivable Agreement provides that upon certain changes of control or if, at any time, we elect an early termination of the Tax Receivable Agreement, then our obligations, or our successor’s obligations, to make payments under the Tax Receivable Agreement would be accelerated and calculated based on certain assumptions, including an assumption that we would have sufficient taxable income to fully utilize all potential future tax benefits that are subject to the Tax Receivable Agreement.
As a result of the foregoing, (i) we could be required to make payments under the Tax Receivable Agreement that are greater than the specified percentage of the actual benefits we ultimately realize in respect of the tax benefits that are subject to the Tax Receivable Agreement (for example, if we do not end up having any income in the relevant period) and (ii) we would be required to make an immediate cash payment equal to the present value of the anticipated future tax benefits that are the subject of the Tax Receivable Agreement, which payment may be made significantly in advance of the actual realization, if any, of such future tax benefits. In these situations, our obligations under the Tax Receivable Agreement could have a substantial negative impact on our liquidity and could have the effect of delaying, deferring or preventing certain change of control transactions. There can be no assurance that we will be able to fund or finance our obligations under the Tax Receivable Agreement.
58
We will not be reimbursed for any payments made to the Continuing LLC Owners under the Tax Receivable Agreement in the event that any tax benefits are disallowed.
Payments under the Tax Receivable Agreement are based on the tax reporting positions that we determine, and the Internal Revenue Service or another tax authority may challenge all or part of the tax basis increases, as well as other related tax positions we take, and a court could sustain such challenge. We will not be reimbursed for any cash payments previously made to the Continuing LLC Owners under the Tax Receivable Agreement in the event that any tax benefits initially claimed by us and for which payment has been made to a Continuing LLC Owner are subsequently challenged by a taxing authority and are ultimately disallowed. Instead, any excess cash payments made by us to a Continuing LLC Owner will be netted against any future cash payments that we might otherwise be required to make to such Continuing LLC Owner under the terms of the Tax Receivable Agreement. However, we might not determine that we have effectively made an excess cash payment to a Continuing LLC Owner for a number of years following the initial time of such payment and, if any of our tax reporting positions are challenged by a taxing authority, we will not be permitted to reduce any future cash payments under the Tax Receivable Agreement until any such challenge is finally settled or determined. As a result, payments could be made under the Tax Receivable Agreement in excess of the tax savings that we realize in respect of the tax attributes with respect to a Continuing LLC Owner that are the subject of the Tax Receivable Agreement.
If we are deemed to be an investment company under the Investment Company Act of 1940, as amended (the “1940 Act”), as a result of our ownership of TWM LLC, applicable restrictions could make it impractical for us to continue our business as contemplated and could have a material adverse effect on our business.
Under Sections 3(a)(1)(A) and (C) of the 1940 Act, a company generally will be deemed to be an “investment company” for purposes of the 1940 Act if (i) it is, or holds itself out as being, engaged primarily, or proposes to engage primarily, in the business of investing, reinvesting or trading in securities or (ii) it engages, or proposes to engage, in the business of investing, reinvesting, owning, holding or trading in securities and it owns or proposes to acquire investment securities having a value exceeding 40% of the value of its total assets (exclusive of U.S. government securities and cash items) on an unconsolidated basis. We do not believe that we are an “investment company,” as such term is defined in either of those sections of the 1940 Act.
As the sole manager of TWM LLC, we control and operate TWM LLC. On that basis, we believe that our interest in TWM LLC is not an “investment security” as that term is used in the 1940 Act. However, if we were to cease participation in the management of TWM LLC, our interest in TWM LLC could be deemed an “investment security” for purposes of the 1940 Act.
We and TWM LLC intend to continue to conduct our operations so that we will not be deemed an investment company. However, if we are deemed to be an investment company, restrictions imposed by the 1940 Act, including limitations on our capital structure and our ability to transact with affiliates, could make it impractical for us to continue our business as contemplated and could have a material adverse effect on our business.
Risks Relating to Ownership of our Class A Common Stock
Refinitiv and Continuing LLC Owners may require us to issue additional shares of our Class A common stock.
As of February 2, 2024, we have an aggregate of 884,261,056 shares of Class A common stock authorized but unissued, including approximately 120,011,165 shares of Class A common stock issuable upon the redemption or exchange of LLC Interests that are held by the Continuing LLC Owners or the exchange of shares of Class B common stock that are held by Refinitiv and any other future holders of Class B common stock. Subject to certain restrictions set forth in the TWM LLC Agreement, Continuing LLC Owners are entitled to have their LLC Interests redeemed for newly issued shares of our Class A common stock or Class B common stock, as applicable, in each case, on a one-for-one basis (in which case such holders’ shares of Class C common stock or Class D common stock, as the case may be, will be cancelled on a one-for-one basis upon any such issuance). Shares of our Class B common stock may also be exchanged at any time, at the option of the holder, for newly issued shares of Class A common stock (in which case such holders’ shares of Class B common stock will be cancelled on a one-for-one basis upon any such issuance).
We cannot predict the size of future issuances of our Class A common stock or the effect, if any, that future issuances and sales of shares of our Class A common stock may have on the market price of our Class A common stock. Sales or distributions of substantial amounts of our Class A common stock, including shares issued in connection with an acquisition, or the perception that such sales or distributions could occur, may cause the market price of our Class A common stock to decline.
59
The market price of our Class A common stock may be highly volatile.
The market price and trading volumes of our Class A common stock could be volatile, and you could lose all or part of your investment. Stock markets have experienced extreme price and volume fluctuations that have affected and continue to affect the market prices of equity securities of many companies in our industry. The following factors, in addition to other factors described in this “Risk Factors” section, may have a significant impact on the market price and trading volume of our Class A common stock:
•negative trends in global economic conditions or activity levels in our industry, including any potential recession in the U.S. or global economies;
•changes in our relationship with our clients or in client needs or expectations or trends in the markets in which we operate;
•announcements concerning or by our competitors or concerning our industry or the markets in which we operate in general;
•announcements of investigations or regulatory scrutiny of our operations or lawsuits filed against us;
•our ability to implement our business strategy;
•our ability to complete and integrate acquisitions;
•actual or anticipated fluctuations in our quarterly or annual operating results or failure to meet guidance given by us or any change in guidance given by us or in our guidance practices;
•trading volume of our Class A common stock;
•the failure of securities analysts to cover the Company or changes in financial estimates by the analysts who cover us, our competitors or our industry in general;
•economic, political, social, legal and regulatory factors unrelated to our performance;
•changes in accounting principles;
•the loss of any of our management or key personnel;
•sales of our Class A common stock by us, our executive officers, directors or our stockholders in the future;
•investor perception of us, our competitors and our industry;
•any adverse consequences related to our multi-class capital structure, such as stock index providers excluding companies with multi-class capital structures from certain indices; and
•overall fluctuations in the U.S. equity markets generally.
In addition, broad market and industry factors may negatively affect the market price of our Class A common stock, regardless of our actual operating performance, and factors beyond our control may cause our stock price to decline rapidly and unexpectedly.
Sales, or the potential for sales, of a substantial number of shares of our Class A common stock in the public market could cause our stock price to drop significantly.
Sales of a substantial number of shares of our Class A common stock in the public market or the perception that these sales might occur, could depress the market price of our Class A common stock, impair our ability to raise capital through the sale of additional equity securities or make it more difficult for you to sell your Class A common stock at a time and price that you deem appropriate. As of February 2, 2024 we have 115,738,944 outstanding shares of Class A common stock and 120,011,165 shares of Class A common stock that are authorized but unissued that would be issuable upon redemption or exchange of LLC Interests or exchange of shares of our Class B common stock.
In addition, shares of Class A common stock issued or issuable upon exercise of options that have currently vested and vesting of outstanding equity awards (as described more fully in Note 13 - Stock-Based Compensation Plains to our audited consolidated financial statements included elsewhere in this Annual Report on Form 10-K) are eligible for sale. We have filed registration statements on Form S-8 under the Securities Act covering approximately 32 million shares of Class A common stock issued or issuable under our equity incentive plans. Accordingly, shares registered under such registration statements are available for sale in the open market following the vesting of awards, as applicable, the expiration or waiver of any applicable lockup period and subject to Rule 144 limitations applicable to affiliates.
In addition, pursuant to the Registration Rights Agreement, Refinitiv, its affiliates and certain of its transferees have the right, under certain circumstances and subject to certain restrictions, to require us to register under the Securities Act shares of Class A common stock. Registration of these shares under the Securities Act, would result in the shares becoming freely tradable without restriction under the Securities Act, except for shares held by our affiliates as defined in Rule 144 under the Securities Act.
60
If securities or industry analysts cease publishing research or reports about us, our business, our industry or markets or our competitors, or if they adversely change their recommendations or publish negative reports regarding our business or our Class A common stock, our stock price and trading volume could materially decline.
The trading market for our Class A common stock will be influenced by the research and reports that industry or securities analysts may publish about us, our business, our industry or markets or our competitors. We do not have any control over these analysts and we cannot provide any assurance that analysts will continue to cover us or provide favorable coverage. If any of the analysts who cover us adversely change their recommendation regarding our Class A common stock, or provide more favorable relative recommendations about our competitors, our stock price could materially decline. If any analyst who covers us were to cease coverage of our company or fail to regularly publish reports on us, we could lose visibility in the financial markets, which in turn could cause our stock price or stock trading volumes to materially decline.
We intend to continue to pay regular dividends on our Class A common stock and Class B common stock, but our ability to do so may be limited.
We intend to continue to pay cash dividends on our Class A common stock and Class B common stock on a quarterly basis, subject to the discretion of our board of directors and our compliance with applicable law, and depending on our and our subsidiaries’ results of operations, capital requirements, financial condition, business prospects, contractual restrictions, restrictions imposed by applicable laws and other factors that our board of directors deems relevant.
Because we are a holding company and all of our business is conducted through our subsidiaries, we expect to pay dividends, if any, only from funds we receive from our subsidiaries. Accordingly, our ability to pay dividends to our stockholders is dependent on the earnings and distributions of funds from our subsidiaries. As the sole manager of TWM LLC, we intend to cause, and will rely on, TWM LLC to make distributions in respect of LLC Interests to fund our dividends. When TWM LLC makes such distributions, Continuing LLC Owners will be entitled to receive equivalent distributions pro rata based on their economic interests in TWM LLC at the time of such distributions. In order for TWM LLC to make distributions, it may need to receive distributions from its subsidiaries. Certain of these subsidiaries are or may in the future be subject to regulatory capital requirements that limit the size or frequency of distributions. If TWM LLC is unable to cause these subsidiaries to make distributions, it may have inadequate funds to distribute to us and we may be unable to fund our dividends. Our ability to pay dividends may also be restricted by the terms of any future credit agreement or any future debt or preferred equity securities of Tradeweb or its subsidiaries.
Our dividend policy entails certain risks and limitations, particularly with respect to our liquidity. By paying cash dividends rather than investing that cash in our business or repaying any outstanding debt, we risk, among other things, slowing the expansion of our business, having insufficient cash to fund our operations or make capital expenditures or limiting our ability to incur borrowings. Our board of directors will periodically review the cash generated from our business and the capital expenditures required to finance our growth plans and determine whether to modify the amount of regular dividends and/or declare any periodic special dividends. There can be no assurance that our board of directors will not reduce the amount of regular cash dividends or cause us to cease paying dividends altogether.
The timing and amount of any share repurchases are subject to a number of uncertainties.
On December 5, 2022, our board of directors approved a share repurchase program with an indefinite term under which the Company may purchase up to $300 million of its Class A common stock (the “Share Repurchase Program”). Pursuant to the Share Repurchase Program, the Company may repurchase its Class A common stock from time to time, in amounts, at prices and at such times as it deems appropriate, subject to market conditions and other considerations. The Company may make repurchases in the open market, through privately negotiated transactions, through accelerated repurchase programs, or pursuant to Rule 10b5-1 plans. The Share Repurchase Program will be conducted in compliance with applicable legal requirements and shall be subject to market conditions and other factors. The Share Repurchase Program has no termination date, may be suspended or discontinued at any time and does not obligate the company to acquire any amount of Class A common stock, and our board of directors may not authorize any increases to or extensions of the Share Repurchase Program or any new repurchase program in the future.
The manner, timing and amount of any purchase will be based on an evaluation of market conditions, stock price and other factors. For example, the IRA imposes a 1% excise tax on the repurchase of stock by publicly traded U.S. corporations. The imposition of the excise tax on repurchases of our shares will increase the cost to us of making repurchases and may cause management to reduce the number of shares repurchased pursuant to the program. Additional considerations that could cause management to limit, suspend or delay future stock repurchases include unfavorable market conditions, the trading price of our Class A common stock, the nature and magnitude of other investment opportunities available to us from time to time and the allocation of available cash.
61
In addition, repurchases of shares of our Class A common stock pursuant to the Share Repurchase Program could affect our stock price and increase its volatility. For example, the existence of the Share Repurchase Program could cause our stock price to be higher than it would be in the absence of such a program and could potentially reduce the market liquidity for our Class A common stock. Our repurchases may also not enhance stockholder value because the stock price of our Class A common stock may decline below the prices at which we repurchased shares and short-term stock price fluctuations could reduce the program’s effectiveness. Additionally, our share repurchase program could diminish our cash reserves, which may impact our ability to finance or pursue our business strategies.
The requirements of being a public company, including compliance with the reporting requirements of the Exchange Act and the requirements of the Sarbanes-Oxley Act and Nasdaq, may strain our resources, increase our costs and divert management’s attention, and we may be unable to comply with these requirements in a timely or cost-effective manner.
As a public company, we are subject to the reporting requirements of the Exchange Act, and the corporate governance standards of the Sarbanes-Oxley Act and Nasdaq. These requirements may place a strain on our management, systems and resources. In addition, we have incurred, and expect to continue to incur significant legal, accounting, insurance and other expenses in connection with being a public company. The Exchange Act requires us to file annual, quarterly and current reports with respect to our business and financial condition within specified time periods and to prepare a proxy statement with respect to our annual meeting of stockholders. The Sarbanes-Oxley Act requires that we maintain effective disclosure controls and procedures and internal control over financial reporting. Nasdaq requires that we comply with various corporate governance requirements. To maintain and improve the effectiveness of our disclosure controls and procedures and internal control over financial reporting and comply with the Exchange Act and Nasdaq requirements, significant resources and management oversight are required. This may divert management’s attention from other business concerns and lead to significant costs associated with compliance, which could have a material adverse effect on us and the market price of our Class A common stock.
The expenses incurred by public companies generally for reporting and corporate governance purposes have been increasing. We expect these rules and regulations to continue to increase our legal and financial compliance costs and to make some activities more time-consuming and costly. For example, we expect to incur additional costs in connection with compliance with any new climate-related disclosure rules. These laws and regulations could also make it more difficult or costly for us to obtain certain types of insurance, including director and officer liability insurance, and we may be forced to accept reduced policy limits and coverage or incur substantially higher costs to obtain the same or similar coverage. These laws and regulations could also make it more difficult for us to attract and retain qualified persons to serve on our board of directors or its committees or as our executive officers. Advocacy efforts by stockholders and third parties may also prompt even more changes in governance and reporting requirements. We cannot predict or estimate the amount of additional costs we may incur or the timing of these costs. Furthermore, if we are unable to satisfy our obligations as a public company, we could be subject to delisting of our Class A common stock, fines, sanctions and other regulatory action and potentially civil litigation.
ITEM 1B. UNRESOLVED STAFF COMMENTS.
None.
ITEM 1C. CYBERSECURITY.
As a leader in building and operating electronic marketplaces, we face a broad set of cybersecurity risks stemming from managing complex technology systems, handling sensitive data, and the digital nature of our business. Managing cybersecurity risk is critically important to our business. We have comprehensive cybersecurity risk management and governance systems in place across our global operations designed to support successful operation of our systems.
Risk Management and Strategy
We operate in an environment where cybersecurity risks is a dynamic and evolving factor. We are committed to appropriately managing and minimizing the impact of cybersecurity risk on the achievement of our business objectives. We view cybersecurity risk management as a fundamental business process essential to our overall success. As such, we have integrated our cybersecurity program into our comprehensive Risk Framework, which is in place to support the management and oversight of risk across our organization. The Risk Framework establishes a consistent approach for identifying, assessing, measuring, mitigating, and reporting on material risks, including cybersecurity risks. The Risk Framework is composed of process components such as risk governance, risk identification and assessment, risk measurement, risk response and remediation and risk analysis and reporting.
62
The general objectives for our cybersecurity program are to protect our information systems from cyber threats and to protect the confidentiality, integrity and availability of systems and information used, owned, or managed by Tradeweb and our customers. This involves a comprehensive and ongoing effort to protect against, detect, and respond to cybersecurity threats and vulnerabilities. Our cybersecurity program includes a number of components, such as:
•conducting regular risk assessments to identify potential vulnerabilities and threats;
•implementing strong cybersecurity frameworks by adopting policies, standards and guidelines derived from a combination of ISO/IEC 27001 principles, the National Institute of Standards and Technology Cybersecurity Framework and industry best practices;
•enforcing strict access control policies as appropriate;
•implementing strong encryption protocols;
•utilizing advanced threat detection systems;
•conducting regular security audits and penetration testing;
•conducting thorough security assessment of third-party vendors and service providers on an ongoing basis; and
•continuous monitoring of our and third-party systems.
As part of our cybersecurity program, we have robust incident response and business continuity plans designed to provide a framework for quick and effective remediation of cyber issues, which are tested periodically throughout the year. Additionally, we have worked to create a culture of security by providing regular cybersecurity training to employees to raise awareness about various cyber threats like phishing, social engineering, and insider threats. We provide additional targeted training to individuals responsible for managing our information systems. We also maintain cyber insurance coverage intended to mitigate certain costs associated with certain cybersecurity events.
In addition, each year, we undergo System and Organization Controls (“SOC”) 1 and SOC 2 audit reviews performed by an independent third-party firm to test our information technology systems internal controls. In 2023, we also engaged a third-party service provider to conduct a cybersecurity maturity assessment of our information security program. We also regularly engage additional assessors, auditors and service providers in connection with the implementation, assessment, enhancement and evaluation of our cybersecurity program, including our risk management processes.
We have not been a victim of a cyber-attack or other cybersecurity incident that has had a material impact on us, our business strategy, results of operations or financial condition; however, we have from time to time experienced non-significant cybersecurity events, including attempted denial of service attacks, malware infections, phishing and other information technology events that are typical for an electronic financial services company of our size. An actual, threatened or perceived cyber-attack or breach of our security could materially affect us, including our business strategy, results of operations and financial condition in many ways, including through the loss of clients or client confidence, expenditure of significant costs to repair system, network or infrastructure damages as well as to protect against future cyber-attacks, security breaches or harm and potential litigation or other claims or actions, including from regulatory agencies. For additional information regarding risks related to cybersecurity threats, see Part I, Item 1A. – “Risk Factors — Risks Relating to Cybersecurity and Intellectual Property — Actual or perceived security vulnerabilities in our systems, networks and infrastructure, breaches of security controls, unauthorized access to confidential or personal information or cyber-attacks could harm our business, reputation and results of operations” and “— Systems failures, interruptions, delays in service, catastrophic events and resulting interruptions in the availability of our platforms or solutions could materially harm our business and reputation.”
Governance
Role of our Board of Directors
The Board of Directors of Tradeweb Markets Inc. exercises direct oversight of the strategic risks to the Company. The Audit Committee of the Board reviews guidelines and policies governing the process by which senior management assesses and manages our exposure to risk, including our major financial and operational risk exposures including those derived from cybersecurity risk, and the steps management takes to monitor and control such exposures. Our Board and our Audit Committee each receive periodic reports from our Chief Information Security Officer and Chief Risk Officer to assess key cybersecurity risks for the Company and the measures implemented to mitigate them, as well as updates regarding changes to our cybersecurity risk profile or newly identified significant risks. In addition, the Audit Committee reports to the Board on these matters at each regularly scheduled Board meeting. The Board and Audit Committee provide feedback and recommendations accordingly.
63
Role of Management
We operate on a “three lines of defense” risk governance model, with partnership and communication across the three lines. The first line of defense is comprised of the business and technology managers, the second line of defense is comprised of the Compliance, Risk and Information Security teams and the third line of defense is comprised of the Internal Audit function. The second and third lines of defense focus on providing the first line of defense with advisory and assurance functions for informed and actionable risk-based decisions. The Enterprise Risk Committee (the “ERC”) is chaired by our Chief Risk Officer and includes our President, Chief Technology Officer, General Counsel, Global Head of Enterprise Risk, Chief Information Security Officer, Head of Global Compliance, Global Head of Human Resources, Head of Internal Audit and various global heads of business lines and corporate functions. The ERC is responsible for the governance and oversight of our Risk Framework, which includes cybersecurity risks. Its responsibilities include, supervising risk mitigation strategies and their implementation, overseeing compliance and regulatory aspects, managing crisis, approving risk tolerance, reviewing and approving material policy changes and evaluating the effectiveness of the organization’s risk management practices. The ERC regularly obtains reports from the Chief Information Security Officer who maintains the primary responsibility for assessing and managing the cybersecurity risks, to evaluate the principal cybersecurity risks for the Company and review strategies in place to mitigate them. The ERC meets quarterly and reports to senior management, including the Chief Executive Officer and Chief Financial Officer. Senior management provides oversight and support in aligning cyber risk management with the Company’s strategic decisions, fostering a culture of risk awareness across the organization and allocating adequate resources to support the initiatives.
Our Chief Information Security Officer leads a highly qualified cybersecurity team in assessing, managing and reducing material risks from cybersecurity threats to protect critical operations and delivery of service. Our Chief Information Security Officer has over 25 years of industry experience, with more than a decade of CISO experience at various financial institutions. Many members of the cybersecurity team hold Certified Information Systems Security Professional and Certified Information Systems Auditor certifications. In addition, our Global Head of Enterprise Risk has over a decade of experience managing enterprise risk programs and maintains multiple information security certifications. We also belong to several professional and recognized industry organizations related to cybersecurity, including FS-ISAC, FCA Cyber Coordination Group and SIFMA in order to stay up-to-date on industry-wide trends.
ITEM 2. PROPERTIES.
Our corporate headquarters is located in New York, New York. As of December 31, 2023, our principal offices consisted of the following properties:
| Location | Square Feet | Lease Expiration Date | Use | |||||||||||||||||
| New York, New York | 41,062 | 12/31/2024 | Office Space | |||||||||||||||||
| Jersey City, New Jersey | 65,242 | 12/31/2027 | Office Space | |||||||||||||||||
| London, United Kingdom | 16,259 | 3/1/2030 | Office Space | |||||||||||||||||
We also rent offices in Boston, Massachusetts, Garden City, New York, Shanghai, China, Paris, France, Hong Kong, China, Tokyo, Japan, Amsterdam, Netherlands, Dubai, United Arab Emirates, Singapore, Miami, Florida, Chicago, Illinois and Sydney, Australia.
Our infrastructure operates out of third-party data centers in Secaucus, New Jersey, Weehawken, New Jersey, Piscataway, New Jersey and Chicago, Illinois and, outside the United States, in Hounslow, United Kingdom, Slough, United Kingdom, Saitama, Japan, Tokyo, Japan and Sydney, Australia.
We believe that our facilities are in good operating condition and adequately meet our current needs, and that additional or alternative space to support future use and expansion will be available on reasonable commercial terms.
64
ITEM 3. LEGAL PROCEEDINGS.
From time to time, we are subject to various claims, lawsuits and other legal proceedings, including reviews, investigations and proceedings by governmental and self-regulatory agencies regarding our business. Set forth below is a summary of our currently pending material legal proceedings. While the ultimate resolution of these matters cannot presently be determined, we do not believe that, taking into account any applicable insurance coverage, any of our pending legal proceedings, including the matters set forth below, could reasonably be expected to have a material adverse effect on our business, financial condition or results of operations. However, legal matters are inherently unpredictable and subject to significant uncertainties, some of which are beyond our control. As such, there can be no assurance that the final outcome of any of our pending or future legal proceedings will not have a material adverse effect on our business, financial condition or results of operations, including for any particular reporting period. In addition, regardless of the outcome, legal proceedings may have an adverse impact on us because of defense and settlement costs, diversion of management resources, reputational loss and other factors.
We record our best estimate of a loss, including estimated defense costs, when the loss is considered probable and the amount of such loss can be reasonably estimated. Based on our experience, we believe that the amount of damages claimed in a legal proceeding is not a meaningful indicator of the potential liability. At this time, we cannot reasonably predict the timing or outcomes of, or estimate the amount of loss, or range of loss, if any, related to, our pending legal proceedings, including the matters described below, and therefore we do not have any contingency reserves established for any of these matters.
Treasuries Matter
In December 2015, more than 40 substantially similar putative class action complaints filed by individual investors, pension funds, retirement funds, insurance companies, municipalities, hedge funds and banks were consolidated in the United States District Court for the Southern District of New York under the caption In re Treasuries Securities Auction Antitrust Litigation, No. 1:15-md-2673 (S.D.N.Y.) (PGG). In November 2017, the plaintiffs in these consolidated actions filed a consolidated amended complaint in which they allege (a) an “Auction Conspiracy” among primary dealers of United States Treasury securities in auctions for Treasury securities and in the “when-issued” and secondary markets for such securities and other derivative financial products; and (b) a “Boycott Conspiracy” among certain primary dealers and Tradeweb Markets LLC, Tradeweb IDB Markets, Inc. and Dealerweb Inc. (collectively, the “Tradeweb Parties”). The plaintiffs purport to represent two putative classes: an “Auction Class” consisting of all persons who purchased Treasuries in an auction, transacted in Treasuries with a dealer defendant or through an exchange from January 1, 2007 through June 8, 2015, and a “Boycott Class” consisting of all persons who transacted in Treasury securities in the secondary market with a dealer defendant from November 15, 2013 to the present.
The consolidated amended complaint alleges that the Tradeweb Parties participated in the alleged “Boycott Conspiracy” through which certain primary dealers are alleged to have boycotted trading platforms permitting “all-to-all” trading of Treasury securities. The complaint asserts claims against the Tradeweb Parties under Section 1 of the Sherman Antitrust Act and for unjust enrichment under state law and seeks to permanently enjoin the Tradeweb Parties and the dealer defendants from maintaining the alleged “Boycott Conspiracy” and an award of treble damages, costs and expenses.
Defendants filed motions to dismiss in February 2018, including a separate motion to dismiss filed by the Tradeweb Parties. The cases were dismissed in March 2021, with the Court granting the Plaintiffs leave to further amend the complaint by no later than May 14, 2021. The Plaintiffs filed an amended complaint on or about May 14, 2021, and the Company served its motion to dismiss the amended compliant on June 14, 2021. By order dated March 31, 2022, the Court granted the Company’s motion and dismissed all of the claims against it in the amended complaint. The Court also denied the Plaintiffs’ request for leave to file a further amended complaint. On April 28, 2022, the Plaintiffs filed a Notice of Appeal of the decision and filed their opening brief on the appeal in the United States Court of Appeals for the Second Circuit on August 18, 2022. The Company filed its brief in response on November 17, 2022. Plaintiffs filed their brief in reply in further support of their appeal on December 14, 2022. Oral argument in the appeal was held on October 3, 2023, and by order and opinion issued on February 1, 2024, the Second Circuit affirmed the District Court’s order dismissing all claims against all defendants, including the claims against the Company.
65
Interest Rate Swaps Matter
In November 2015, Public School Teachers’ Pension and Retirement Fund of Chicago, on behalf of itself and a putative class of other similar purchasers of interest rate swaps (“IRS”), filed a lawsuit in the United States District Court for the Southern District of New York against Tradeweb Markets LLC, ICAP Capital Markets LLC and several investment banks and their affiliates (the “Dealer Defendants”), captioned Public School Teachers’ Pension and Retirement Fund of Chicago v. Bank of America Corporation, Case No. 15-cv-09219 (S.D.N.Y.). Additional plaintiffs, including Tera Group Inc. and Javelin Capital Markets LLC, filed lawsuits and, ultimately, the cases were consolidated under the caption In re Interest Rate Swaps Antitrust Litigation, No. 1:16-md-2704.
The plaintiffs allege that defendants conspired to forestall the emergence of exchange style trading for IRS and seek treble damages and declaratory and injunctive relief under federal antitrust laws with respect to Tradeweb Markets LLC. Plaintiffs allege that Tradeweb agreed with the Dealer Defendants to shutter its plans to launch an exchange-like trading platform for IRS in furtherance of the conspiracy and provided a forum where the Dealer Defendants carried out their alleged collusion.
Tradeweb Markets LLC and certain other entities were dismissed from the lawsuit in July 2017, following the court’s order and opinion on defendants’ motions to dismiss. In May 2018, the court denied plaintiffs’ request for leave to amend their complaint to reinstate Tradeweb Markets LLC as a defendant, but granted leave to amend to include additional allegations. In October 2018, plaintiffs filed a motion seeking leave to file a proposed fourth amended complaint. They did not seek to name Tradeweb Markets LLC as a defendant but instead purported to reserve all rights with respect to Tradeweb Markets LLC. While Tradeweb Markets LLC is not a party to the litigation, it was actively engaged in third-party discovery and responded to the parties’ data and document requests. Additionally, in June 2018, the plaintiffs notified the court that they are likely to move for entry of judgment of the dismissed claims. We believe that we have meritorious defenses to any allegations asserted against us in this litigation and, if necessary, intend to vigorously defend our position.
ITEM 4. MINE SAFETY DISCLOSURES.
Not applicable.
66
PART II
ITEM 5. MARKET FOR REGISTRANT’S COMMON EQUITY, RELATED STOCKHOLDER MATTERS AND ISSUER PURCHASES OF EQUITY SECURITIES.
Market Information
Our Class A common stock trades on the Nasdaq Global Select Market under the ticker symbol “TW.” There is no established public trading market for our Class B common stock, Class C common stock or Class D common stock.
Holders
As of December 31, 2023, there are two holders of record of our Class A common stock, one holder of record of our Class B common stock, one holder of record of our Class C common stock and 12 holders of record of our Class D common stock. A substantially greater number of holders of our Class A common stock are “street name” or beneficial owners, whose shares of Class A common stock are held of record by banks, brokerage firms and other financial institutions. Such shares of Class A common stock held by banks, brokerage firms and other financial institutions as nominees for beneficial owners are considered to be held of record by Cede & Co., a nominee for The Depository Trust Company, who is considered to be one of the two holders of record of our Class A common stock.
Dividend Policy
Subject to legally available funds, we intend to pay quarterly cash dividends on our Class A common stock and Class B common stock equal to $0.10 per share. The declaration, amount and payment of any dividends will be at the sole discretion of our board of directors and will depend on our and our subsidiaries’ results of operations, capital requirements, financial condition, business prospects, contractual restrictions, restrictions imposed by applicable laws and other factors that our board of directors may deem relevant. Because we are a holding company and all of our business is conducted through our subsidiaries, we expect to pay dividends, if any, from funds we receive from our subsidiaries. Accordingly, our ability to pay dividends to our stockholders is dependent on the earnings and distributions of funds from our subsidiaries. As the sole manager of TWM LLC, we intend to cause, and will rely on, TWM LLC to make distributions in respect of LLC Interests to fund our dividends. When TWM LLC makes such distributions, the Continuing LLC Owners will be entitled to receive equivalent distributions pro rata based on their economic interests in TWM LLC at the time of such distributions. Because Tradeweb must pay taxes and make payments under the Tax Receivable Agreement, amounts ultimately distributed as dividends to holders of our Class A common stock or Class B common stock are expected to be less than the amounts distributed by TWM LLC to its members on a per LLC Interest basis. In order for TWM LLC to make distributions, it may need to receive distributions from its subsidiaries. If TWM LLC is unable to cause these subsidiaries to make distributions, it may have inadequate funds to distribute to us and we may be unable to fund our dividends. Our ability to pay dividends may also be restricted by the terms of any future credit agreement or any future debt or preferred equity securities of Tradeweb or its subsidiaries.
Our board of directors will periodically review the cash generated from our business and the capital expenditures required to finance our growth plans and determine whether to modify the amount of regular dividends and/or declare any periodic special dividends. Any future determination to change the amount of dividends and/or declare special dividends will be at the discretion of our board of directors and will be dependent upon then-existing conditions and other factors that our board of directors considers relevant.
See Part I, Item 1A. – “Risk Factors — Risks Relating to our Organizational Structure and Governance — Our principal asset is our equity interest in TWM LLC, and, accordingly, we depend on distributions from TWM LLC to pay our taxes and expenses, including payments under the Tax Receivable Agreement” and Part I, Item 1A. – “Risk Factors — Risks Relating to Ownership of our Class A Common Stock — We intend to continue to pay regular dividends on our Class A common stock and Class B common stock, but our ability to do so may be limited.”
During 2023, Tradeweb Markets Inc. paid quarterly cash dividends of $0.09 per share, in an aggregate amount of $75.9 million, to the holders of Class A common stock and Class B common stock.
67
Recent Sales of Unregistered Securities
On November 16, 2023, we and TWM LLC entered into a definitive agreement for TWM LLC to acquire all the outstanding equity interests of r8fin, which closed on January 19, 2024. On the closing date, we issued a total of 374,601 shares of Class A common stock as partial consideration for the acquisition. The issuance of the Class A common stock was made in reliance on Section 4(a)(2) of the Securities Act. The Company relied on this exemption from registration based in part on the nature of the transaction and the representations made by the recipients of the Class A common stock, which were former equityholders of r8fin.
Securities Authorized for Issuance Under Equity Compensation Plans
See Item 12 of this Report for information about securities authorized for issuance under our equity compensation plans.
Issuer Purchases of Equity Securities
During the three months ended December 31, 2023, we did not repurchase any securities pursuant to share repurchase programs.
Stock Performance Graph
The following graph shows a comparison from April 4, 2019 (the date our Class A common stock commenced trading on Nasdaq) through December 31, 2023 of the cumulative total return for (i) our Class A common stock, (ii) the S&P 500 Index and (iii) the Dow Jones U.S. Financials Index. The graph assumes an initial investment of $100 in our Class A common stock and in each index on April 4, 2019, and that all dividends were reinvested. Historical stock price performance should not be relied upon as an indication of future stock price performance.
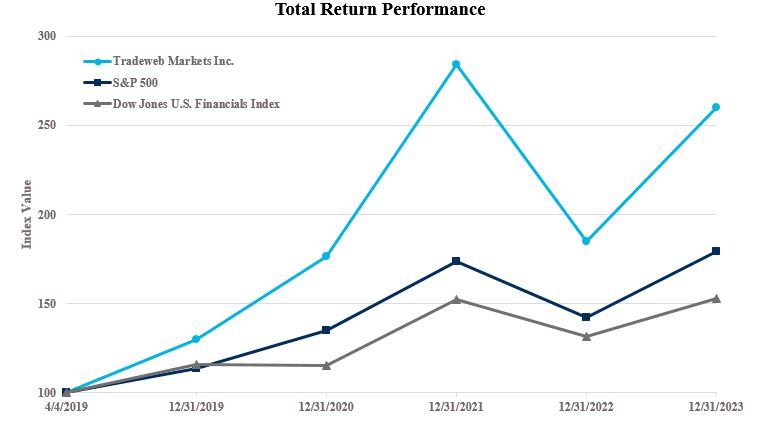
The stock performance graph and related information shall not be deemed “soliciting material” or to be “filed” for purposes of Section 18 of the Exchange Act or otherwise subject to the liabilities under that Section, and shall not be deemed to be incorporated by reference into any future filing under the Securities Act or Exchange Act, except to the extent that we specifically incorporate it by reference into such filing.
ITEM 6. RESERVED.
68
ITEM 7. MANAGEMENT’S DISCUSSION AND ANALYSIS OF FINANCIAL CONDITION AND RESULTS OF OPERATIONS.
The following discussion and analysis of our financial condition and results of operations should be read in conjunction with the sections titled “Introductory Note”, “Use of Non-GAAP Financial Measures” and our audited consolidated financial statements and related notes and other information included elsewhere in this Annual Report on Form 10-K. This discussion contains forward-looking statements that involve risks and uncertainties. Our actual results could differ materially from the results described in or implied by the forward-looking statements. Factors that could cause or contribute to those differences include, but are not limited to, those identified below and those discussed in the sections titled “Risk Factors” and “Cautionary Note Regarding Forward-Looking Statements” included elsewhere in this Annual Report on Form 10-K.
The following discussion includes a comparison of our results of operations, cash flows and liquidity and capital resources for the years ended December 31, 2023 and 2022, respectively. A comparison of our results of operations, cash flows and liquidity and capital resources from the years ended December 31, 2022 and December 31, 2021 may be found in Part II, Item 7. – “Management’s Discussion and Analysis of Financial Condition and Results of Operations,” of our Annual Report on Form 10-K for the year ended December 31, 2022.
Overview
We are a leader in building and operating electronic marketplaces for our global network of clients across the financial ecosystem. Our network is comprised of clients across the institutional, wholesale and retail client sectors, including many of the largest global asset managers, hedge funds, insurance companies, central banks, banks and dealers, proprietary trading firms and retail brokerage and financial advisory firms, as well as regional dealers. Our marketplaces facilitate trading across a range of asset classes, including rates, credit, equities and money markets. We are a global company serving clients in over 70 countries with offices in North America, Europe, Asia, Australia and the Middle East. We believe our proprietary technology and culture of collaborative innovation allow us to adapt our offerings to enter new markets, create new platforms and solutions and adjust to regulations quickly and efficiently. We support our clients by providing solutions across the trade lifecycle, including pre-trade, execution, post-trade and data.
Our institutional client sector serves institutional investors in over 70 countries around the globe and across over 25 currencies. We connect institutional investors with pools of liquidity using our flexible order and trading systems. Our clients trust the integrity of our markets and recognize the value they get by trading electronically: enhanced transparency, competitive pricing, efficient trade execution and regulatory compliance.
In our wholesale client sector, we provide a broad range of electronic, voice and hybrid platforms to more than 300 dealers and financial institutions with more than 190 actively trading on our electronic or hybrid markets with our Dealerweb platform. This platform was launched in 2008 following the acquisition of inter-dealer broker Hilliard Farber & Co., Inc. In 2011, we acquired the brokerage assets of Rafferty Capital Markets and in June 2021, we acquired Nasdaq’s U.S. fixed income electronic trading platform (formerly known as eSpeed) (the “NFI Acquisition”). Today, Dealerweb actively competes across a range of rates, credit, money markets, derivatives and equity markets.
In our retail client sector, we provide advanced trading solutions for financial advisory firms and traders with our Tradeweb Direct platform. We entered the retail sector in 2006 and launched our Tradeweb Direct platform following the 2013 acquisition of BondDesk Group LLC, which was built to bring innovation and efficiency to the wealth management community. Tradeweb Direct has provided financial advisory firms access to live offerings, accurate pricing in the marketplace and fast execution.
Our markets are large and growing. Electronic trading continues to increase across the markets in which we operate as a result of market demand for greater transparency, higher execution quality, operational efficiency and lower costs, as well as regulatory changes. We believe our deep client relationships, asset class breadth, geographic reach, regulatory knowledge and scalable technology position us to continue to be at the forefront of the evolution of electronic trading. Our platforms provide transparent, efficient, cost-effective and compliant trading solutions across multiple products, regions and regulatory regimes. As market participants seek to trade across multiple asset classes, reduce their costs of trading and increase the effectiveness of their trading, including through the use of data and analytics, we believe the demand for our platforms and electronic trading solutions will continue to grow.
69
Trends and Other Factors Impacting Our Performance
Acquisitions
Yieldbroker
On August 31, 2023, we completed the acquisition of all of the outstanding equity interests of Tradeweb Australia Pty Ltd (formerly Yieldbroker Pty Limited). The all-cash purchase price of A$123.6 million ($80.1 million U.S. dollars as translated as of August 31, 2023) was net of cash acquired and prior to working capital and other closing adjustments.
Yieldbroker is a Tier 1 Australian Markets Licensee in Australia, regulated by ASIC, that maintains a branch in Singapore that is regulated by the MAS as a Regulated Market Operator. Yieldbroker operates a leading Australian trading platform for Australian and New Zealand government bonds and interest rate derivatives covering the institutional and wholesale client sectors. This acquisition combines Australia and New Zealand’s highly attractive, fast-growing markets with Tradeweb’s international reach and scale. The Yieldbroker acquisition is not material to our consolidated financial statements and did not have a significant impact to our results of operations for the year ended December 31, 2023. See Note 4 – Acquisitions to the consolidated financial statements included elsewhere in this Annual Report on Form 10-K for additional details.
r8fin
On November 16, 2023, we entered into a definitive agreement to acquire r8fin in exchange for total consideration of $125 million, consisting of $90 million in cash and $35 million in shares of Class A common stock of the Corporation, subject to working capital and other adjustments. r8fin provides a suite of algorithmic-based tools as well as a thin-client execution management system (EMS) trading application to facilitate futures and cash trades. The solutions complement Tradeweb’s existing Dealerweb Active Streams, Dealerweb Central Limit Order Book (CLOB), Tradeweb Request-for-Quote (RFQ) and Tradeweb AiEX (Automated Intelligent Execution) offerings, creating a valuable and broad-based approach to trading U.S. Treasuries and related futures trading. The acquisition closed on January 19, 2024, following the satisfaction of closing conditions and regulatory reviews. The r8fin acquisition is not expected to be material to our 2024 consolidated financial statements.
2023 LSEG Market Data Agreement
In October 2023, we signed an amended and restated two-year market data license agreement with an affiliate of LSEG (formerly referred to as Refinitiv), pursuant to which LSEG will continue to distribute certain of our data directly to LSEG customers through its flagship financial platforms, LSEG Workspace, Datascope, LSEG Pricing Service and Tick History. The 2023 agreement, which was effective on November 1, 2023, replaced an existing agreement that was initiated in 2010 and most recently renewed in 2018, and provides us with increased revenue and flexibility in growing our market data offering. We will seek to further monetize our data over time both through potential expansion of our existing market data license agreement with LSEG and through distributing additional datasets, derived data and analytics offerings through our own network or through other third-party networks. Our current revenue guidance related to the 2023 LSEG market data agreement is forecasting approximately $80 million and $90 million for the years ended December 31, 2024 and 2025, respectively.
Economic Environment
Our business is impacted by the overall market activity and, in particular, trading volumes and market volatility. Lower volatility may result in lower trading volume for our clients and may negatively impact our operating performance and financial condition. Factors that may impact market activity in 2024 include, among other things, evolving monetary policies of central banks, economic, political and social conditions, legislative, regulatory or government policy changes, and concerns with respect to the banking industry, including as a result of any bank failures.
Because the majority of our financial assets are short-term in nature, they are not significantly affected by inflation. However, the rate of inflation may affect our expenses, such as employee compensation and benefits, technology and communication expenses and occupancy costs, which may not be readily recoverable in the prices of our services. We believe any effects of inflation on our results of operations and financial condition have not been significant during any of the periods presented in this Annual Report on Form 10-K. To the extent inflation, along with other factors, continue to result in rising interest rates and have other adverse effects on the securities markets and the overall economy, they may adversely affect our results of operations and financial condition.
While our business is impacted by the overall activity of the market and market volatility, our revenues consist of a mix of fixed and variable fees that partially mitigates this impact. More importantly, we are actively engaged in the further electronification of trading activities, which will help mitigate this impact as we believe secular growth trends can partially offset market volatility risk.
70
Regulatory Environment
Our business is subject to extensive regulations in the United States and internationally, which may expose us to significant regulatory risk and cause additional legal costs to ensure compliance. See Part I, Item 1. – “Business – Regulation.” The existing legal framework that governs the financial markets is periodically reviewed and amended, resulting in enforcement of new laws and regulations that apply to our business. The current regulatory environment in the United States and abroad may be subject to future legislative and regulatory changes driven by U.S. and global issues and priorities. The impact of any changes in the legal or regulatory landscape on us and our operations remains uncertain. Compliance with regulations may require us to dedicate additional financial and operational resources, which may adversely affect our profitability. In addition, compliance with regulations may require our clients to dedicate significant financial and operational resources, which may negatively affect their ability to pay our fees and use our platforms and, as a result, our profitability. However, under certain circumstances regulation may increase demand for our platforms and solutions, and we believe we are well positioned to benefit from any potential increased electronification due to regulatory changes as market participants seek platforms that meet regulatory requirements and solutions that help them comply with their regulatory obligations.
Competitive Environment
We and our competitors compete to introduce innovations in market structure and new electronic trading capabilities. While we endeavor to be a leader in innovation, new trading capabilities of our competitors are also adopted by market participants. On the one hand, this increases liquidity and electronification for all participants, but it also puts pressure on us to further invest in our technology and to innovate to ensure the continued growth of our network of clients and continued improvement of liquidity, electronic processing and pricing on our platforms. Our ability to compete is influenced by key factors such as (i) developments in trading platforms and solutions, (ii) the liquidity we provide on transactions, (iii) the transaction costs we incur in providing our solutions, (iv) the efficiency in execution of transactions on our platforms, (v) our ability to hire and retain talent and (vi) our ability to maintain the security of our platforms and solutions. Our competitive position is also influenced by the familiarity and integration of our clients with our electronic, voice and hybrid systems. When either a client wants to trade in a new product or we want to introduce a new product, trading protocol or other solution, we believe we benefit from our clients’ familiarity with our offerings as well as our integration into their order management systems and back offices. See Part I, Item 1. – “Business – Competition” for more detail on our competitors.
Technology and Cybersecurity Environment
Our business and its success are largely impacted by the introduction of increasingly complex and sophisticated technology systems and infrastructures and new business models. Offering specialized trading venues and solutions through the development of new and enhanced platforms is essential to maintaining our level of competitiveness in the market and attracting new clients seeking platforms that provide advanced automation and better liquidity. We believe we will continue to increase demand for our platforms and solutions and the volume of transactions on our platforms, and thereby enhance our client relationships, by responding to new trading and information requirements through utilizing technological advances and emerging industry standards and practices in an effective and efficient way. We plan to continue to focus on and invest in technology infrastructure initiatives and continually improve and expand our platforms and solutions to further enhance our market position. We experience cyber-threats and attempted security breaches. If these were successful, these cybersecurity incidents could impact revenue and operating income and increase costs. We therefore continue to make investments to strengthen our cybersecurity infrastructure, which may result in increased costs. See Part I, Item 1C. – “Cybersecurity – Governance” for further detail regarding our cybersecurity risk management, strategy and governance structure.
Foreign Currency Exchange Rate Environment
We earn revenues, pay expenses, hold assets and incur liabilities in currencies other than the U.S. dollar. Accordingly, fluctuations in foreign currency exchange rates can affect our results of operations from period to period. In particular, fluctuations in exchange rates for non-U.S. dollar currencies may reduce the U.S. dollar value of revenues, earnings and cash flows we receive from non-U.S. markets, increase our operating expenses (as measured in U.S. dollars) in those markets, negatively impact our competitiveness in those markets or otherwise adversely impact our results of operations or financial condition. Future fluctuations of foreign currency exchange rates and their impact on our results of operations and financial condition are inherently uncertain. As we continue to grow the size of our global operations, these fluctuations may be material. See Part II, Item 7A. – “Quantitative and Qualitative Disclosures about Market Risk – Foreign Currency and Derivative Risk” elsewhere in this Annual Report on Form 10-K, for the change in revenue and operating income caused by fluctuations in foreign currency rates and realized and unrealized gains/losses from foreign currency during the years ended December 31, 2023, 2022 and 2021.
71
Taxation
In connection with the Reorganization Transactions, we became the sole manager of TWM LLC. As a result, beginning with the second quarter of 2019, we became subject to U.S. federal, state and local income taxes with respect to our allocable share of any taxable income of TWM LLC and are taxed at prevailing corporate tax rates. Our actual effective tax rate is impacted by our ownership share of TWM LLC, which has increased over time primarily due to Continuing LLC Owners redeeming or exchanging their LLC Interests for shares of Class A common stock or Class B common stock, as applicable, and our purchase of LLC Interests from Continuing LLC Owners. Furthermore, in connection with the IPO, we entered into the Tax Receivable Agreement pursuant to which we began to make payments in January 2021, and we expect future payments to be significant. We intend to continue to cause TWM LLC to make distributions in an amount sufficient to allow us to pay our tax obligations, operating expenses, including payments under the Tax Receivable Agreement, and our quarterly cash dividends, as and when declared by our board of directors.
On August 16, 2022, President Biden signed the Inflation Reduction Act of 2022 (“IRA”) into law. The IRA establishes a 15% corporate alternative minimum tax (“CAMT”) effective for taxable years beginning after December 31, 2022, and imposes a 1% excise tax on the repurchase after December 31, 2022 of stock by publicly traded U.S. corporations. The 1% excise tax did not have an impact to our financial condition, results of operations and cash flows as of and for the year ended December 31, 2023. The Company will be subject to the 15% CAMT, which is expected to change the estimated period in which the tax receivable agreement liability payments will be made. However, it is not expected to have a material impact on the Company’s effective tax rate. The adoption of the IRA will also not have an impact to our non-GAAP adjusted effective tax rate used for purposes of calculating our non-GAAP measure of Adjusted Net Income.
On October 8, 2021, the Organization for Economic Cooperation and Development announced an accord endorsing and providing an implementation plan focused on global profit allocation, and implementing a global minimum tax rate of at least 15% for large multinational corporations on a jurisdiction-by-jurisdiction basis, known as the “Two Pillar Plan.” On December 15, 2022, the European Council formally adopted a European Union directive on the implementation of the plan by January 1, 2024. The Company may be subject to the provisions of the Two Pillar Plan, and related tax impacts per local country adoption, as it is a consolidating subsidiary of LSEG. The Company does not expect to have material impact of the Two Pillar Plan, but will continue to monitor legislative development.
Components of our Results of Operations
Revenues
Our revenue is derived primarily from transaction fees, commissions, subscription fees and market data fees.
Transaction Fees and Commissions
We earn transaction fees from transactions executed on our trading platforms through various fee plans. Transaction fees are generated on both a variable and fixed price basis and vary by geographic region, product type and trade size. For most of our products, clients pay both fixed minimum monthly transaction fees and variable transaction fees on a per transaction basis in excess of the monthly minimum. For certain of our products, clients also pay a subscription fee in addition to the minimum monthly transaction fee. For other products, instead of a minimum monthly transaction fee, clients pay a subscription fee and a fixed transaction fee or variable transaction fees on a per transaction basis. For variable transaction fees, we charge clients fees based on the mix of products traded and the volume of transactions executed.
Transaction volume is determined by using either a measure of the notional volume of the products traded or a count of the number of trades. We typically charge higher fees for products that are less actively traded. In addition, because transaction fees are sometimes subject to fee plans with tiered pricing based on product mix, volume, monthly minimums and monthly maximum fee caps, average transaction fees per million generated for a client may vary each month depending on the mix of products and volume traded. Furthermore, because transaction fees vary by geographic region, product type and trade size, our revenues may not correlate with volume growth.
We earn commission revenue from our electronic and voice brokerage services on a riskless principal basis. Riskless principal revenues are derived on matched principal transactions where revenues are earned on the spread between the buy and sell price of the transacted product. For TBA-MBS, U.S. Treasury and repurchase agreement transactions executed by our wholesale clients, we also generate revenue from fixed commissions that are generally invoiced monthly.
72
Subscription Fees
We earn subscription fees primarily for granting clients access to our markets for trading and market data. For a limited number of products, we only charge subscription fees and no transaction fees or commissions. Subscription fees are generally generated on a fixed price basis.
For purposes of our discussion of our results of operations, we include LSEG market data fees in subscription fees. We earn fixed license fees from our market data license agreement with LSEG. We also earn a revenue share for certain data services which are provided to LSEG and then sold by LSEG to its customers. Our revenue share revenues may fluctuate from period to period depending on the revenue achieved by LSEG during the applicable fee earning period.
Operating Expenses
Employee Compensation and Benefits
Employee compensation and benefits expense consists of wages, employee benefits, bonuses, commissions, stock-based compensation cost and related taxes. Factors that influence employee compensation and benefits expense include revenue and earnings growth, hiring new employees and trading activity which generates broker commissions. We expect employee compensation and benefits expense to increase as we hire additional employees to support revenue and earnings growth. As a result, employee compensation and benefits can vary from period to period.
Depreciation and Amortization
Depreciation and amortization expense consists of costs relating to the depreciation and amortization of acquired and internally developed software, other intangible assets, leasehold improvements, furniture and equipment.
General and Administrative
General and administrative expense consists of travel and entertainment, marketing, value-added taxes, state use taxes, foreign currency transaction gains and losses, gains and losses on foreign exchange derivative contracts entered into for foreign exchange risk management purposes relating to operating activities, charitable contributions, other administrative expenses and credit loss expense. We expect general and administrative expense to increase as we expand the number of our employees and product offerings and grow our operations.
Technology and Communications
Technology and communications expense consists of costs relating to software and hardware maintenance, our internal network connections, data center costs, clearance and other trading platform related transaction costs and data feeds provided by third-party service providers, including LSEG. Factors that influence technology and communications expense include trading volumes and our investments in innovation, data strategy and cybersecurity.
Professional Fees
Professional fees consist primarily of accounting, tax and legal fees and fees paid to technology and software consultants to maintain our trading platforms and infrastructure, as well as costs related to business acquisition transactions.
Occupancy
Occupancy expense consists of operating lease rent and related costs for office space and data centers leased in North America, Europe, Asia, Australia and the Middle East.
Tax Receivable Agreement Liability Adjustment
The tax receivable agreement liability adjustment reflects changes in the tax receivable agreement liability recorded in our consolidated statements of financial condition as a result of changes in the mix of earnings, tax legislation and tax rates in various jurisdictions which impacted our estimated future tax savings.
73
Net Interest Income (Expense)
Interest income consists of interest earned from our cash deposited with large commercial banks and money market funds. Interest expense consists of commitment fees payable on, and, if applicable, interest payable on any borrowings outstanding under our credit facility.
Other Income (Loss), Net
Other income (loss), net consists of any income or loss earned from investments, any mark-to-market adjustments or impairments recorded on investments, unrealized and realized gain/loss on foreign exchange derivative contracts entered into for foreign exchange risk management purposes relating to investing activities and any other non-operating items.
Income Taxes
We are subject to U.S. federal, state and local income taxes with respect to our taxable income, including our allocable share of any taxable income of TWM LLC, and are taxed at prevailing corporate tax rates. TWM LLC is a multiple member limited liability company taxed as a partnership and accordingly any taxable income generated by TWM LLC is passed through to and included in the taxable income of its members, including to us. Income taxes also include unincorporated business taxes on income earned or losses incurred for conducting business in certain state and local jurisdictions, income taxes on income earned or losses incurred in foreign jurisdictions on certain operations and federal and state income taxes on income earned or losses incurred, both current and deferred, on subsidiaries that are taxed as corporations for U.S. tax purposes.
Net Income Attributable to Non-Controlling Interests
We are the sole manager of TWM LLC. As a result of this control, and because we have a substantial financial interest in TWM LLC, we consolidate the financial results of TWM LLC and report a non-controlling interest in our consolidated financial statements, representing the economic interests of TWM LLC held by Continuing LLC Owners. Income or loss is attributed to the non-controlling interests based on the relative ownership percentages of LLC Interests held during the period by us and any Continuing LLC Owners.
In connection with the Reorganization Transactions, the TWM LLC Agreement was amended and restated to, among other things, (i) provide for LLC Interests and (ii) exchange all of the then existing membership interests in TWM LLC for LLC Interests. LLC Interests held by Continuing LLC Owners are redeemable in accordance with the TWM LLC Agreement, at the election of such holders, for newly issued shares of Class A common stock or Class B common stock, as the case may be, on a one-for-one basis. In the event of such election by a Continuing LLC Owner, we may, at our option, effect a direct exchange of Class A common stock or Class B common stock for such LLC Interests of such Continuing LLC Owner in lieu of such redemption. In connection with any redemption or exchange, we will receive a corresponding number of LLC Interests, increasing our total ownership interest in TWM LLC. Following the completion of the Reorganization Transactions and the IPO, we owned 64.3% of TWM LLC and Continuing LLC Owners owned the remaining 35.7% of TWM LLC. As of December 31, 2023, we owned 90.2% of TWM LLC and Continuing LLC Owners owned the remaining 9.8% of TWM LLC.
74
Results of Operations
For the Years Ended December 31, 2023 and December 31, 2022
The following table sets forth a summary of our statements of income for the years ended December 31, 2023 and 2022:
| Year Ended | ||||||||||||||||||||||||||
| December 31, | ||||||||||||||||||||||||||
| 2023 | 2022 | $ Change | % Change | |||||||||||||||||||||||
(dollars in thousands) | ||||||||||||||||||||||||||
| Total revenue | $ | 1,338,219 | $ | 1,188,781 | $ | 149,438 | 12.6 | % | ||||||||||||||||||
| Total expenses | 832,950 | 776,208 | 56,742 | 7.3 | % | |||||||||||||||||||||
| Operating income | 505,269 | 412,573 | 92,696 | 22.5 | % | |||||||||||||||||||||
Tax receivable agreement liability adjustment | (9,517) | 13,653 | (23,170) | (169.7) | % | |||||||||||||||||||||
| Net interest income (expense) | 65,350 | 11,907 | 53,443 | 448.8 | % | |||||||||||||||||||||
| Other income (loss), net | (13,122) | (1,000) | (12,122) | N/M | ||||||||||||||||||||||
| Income before taxes | 547,980 | 437,133 | 110,847 | 25.4 | % | |||||||||||||||||||||
| Provision for income taxes | (128,477) | (77,520) | (50,957) | 65.7 | % | |||||||||||||||||||||
| Net income | 419,503 | 359,613 | 59,890 | 16.7 | % | |||||||||||||||||||||
| Less: Net income attributable to non-controlling interests | 54,637 | 50,275 | 4,362 | 8.7 | % | |||||||||||||||||||||
| Net income attributable to Tradeweb Markets Inc. | $ | 364,866 | $ | 309,338 | $ | 55,528 | 18.0 | % | ||||||||||||||||||
N/M = not meaningful
Revenues
Our revenues for the years ended December 31, 2023 and 2022, and the resulting dollar and percentage changes, were as follows:
| Year Ended | ||||||||||||||||||||||||||||||||||||||
| December 31, | ||||||||||||||||||||||||||||||||||||||
| 2023 | 2022 | |||||||||||||||||||||||||||||||||||||
$ | % of Total Revenue | $ | % of Total Revenue | $ Change | % Change | |||||||||||||||||||||||||||||||||
(dollars in thousands) | ||||||||||||||||||||||||||||||||||||||
| Revenues | ||||||||||||||||||||||||||||||||||||||
| Transaction fees and commissions | $ | 1,078,344 | 80.6 | % | $ | 950,269 | 79.9 | % | $ | 128,075 | 13.5 | % | ||||||||||||||||||||||||||
Subscription fees (1) | 248,308 | 18.6 | 228,643 | 19.2 | 19,665 | 8.6 | % | |||||||||||||||||||||||||||||||
| Other | 11,567 | 0.9 | 9,869 | 0.8 | 1,698 | 17.2 | % | |||||||||||||||||||||||||||||||
| Total revenue | $ | 1,338,219 | 100.0 | % | $ | 1,188,781 | 100.0 | % | $ | 149,438 | 12.6 | % | ||||||||||||||||||||||||||
| Components of total revenue growth: | ||||||||||||||||||||||||||||||||||||||
Constant currency change (2) | 12.2 | % | ||||||||||||||||||||||||||||||||||||
| Foreign currency impact | 0.4 | % | ||||||||||||||||||||||||||||||||||||
| Total revenue growth | 12.6 | % | ||||||||||||||||||||||||||||||||||||
(1)Subscription fees for the years ended December 31, 2023 and 2022 include $64.3 million and $62.7 million, respectively, of LSEG market data fees (formerly referred to as Refinitiv market data fees).
(2)Constant currency revenue change, which is a non-GAAP financial measure, is defined as total revenue change excluding the effects of foreign currency fluctuations. Total revenue excluding the effects of foreign currency fluctuations is calculated by translating the current period and prior period’s total revenue using the annual average exchange rates for the prior period. We use constant currency change as a supplemental metric to evaluate our underlying total revenue performance between periods by removing the impact of foreign currency fluctuations. We believe that providing constant currency change provides a useful comparison of our total revenue performance and trends between periods.
75
Our diversified offering across products, client sectors and geographies supported sustained growth amidst a complex macroeconomic backdrop, including historic interest rate moves, geopolitical uncertainty and sustained broader market rate volatility. The primary driver of the $149.4 million increase in revenue was related to a $128.1 million increase in transaction fees and commissions to $1.1 billion for the year ended December 31, 2023 from $950.3 million for the year ended December 31, 2022, primarily due to higher revenues for rates derivatives products, U.S. and European corporate bonds, U.S. and European government bonds and certificates of deposit.
Our total revenue by asset class for the years ended December 31, 2023 and 2022, and the resulting dollar and percentage changes, were as follows:
| Year Ended | ||||||||||||||||||||||||||
| December 31, | ||||||||||||||||||||||||||
| 2023 | 2022 | $ Change | % Change | |||||||||||||||||||||||
(dollars in thousands) | ||||||||||||||||||||||||||
| Revenues | ||||||||||||||||||||||||||
| Rates | $ | 695,434 | $ | 605,406 | $ | 90,028 | 14.9 | % | ||||||||||||||||||
| Credit | 367,394 | 331,803 | 35,591 | 10.7 | % | |||||||||||||||||||||
| Equities | 95,295 | 93,474 | 1,821 | 1.9 | % | |||||||||||||||||||||
| Money Markets | 63,010 | 49,958 | 13,052 | 26.1 | % | |||||||||||||||||||||
| Market Data | 94,074 | 85,913 | 8,161 | 9.5 | % | |||||||||||||||||||||
| Other | 23,012 | 22,227 | 785 | 3.5 | % | |||||||||||||||||||||
| Total revenue | $ | 1,338,219 | $ | 1,188,781 | $ | 149,438 | 12.6 | % | ||||||||||||||||||
Our variable and fixed revenues by asset class for the years ended December 31, 2023 and 2022, and the resulting dollar and percentage changes, were as follows:
| Year Ended | ||||||||||||||||||||||||||||||||||||||||||||||||||
| December 31, | ||||||||||||||||||||||||||||||||||||||||||||||||||
| 2023 | 2022 | $ Change | % Change | |||||||||||||||||||||||||||||||||||||||||||||||
Variable | Fixed | Variable | Fixed | Variable | Fixed | Variable | Fixed | |||||||||||||||||||||||||||||||||||||||||||
(dollars in thousands) | ||||||||||||||||||||||||||||||||||||||||||||||||||
| Revenues | ||||||||||||||||||||||||||||||||||||||||||||||||||
| Rates | $ | 462,132 | $ | 233,302 | $ | 383,780 | $ | 221,626 | $ | 78,352 | $ | 11,676 | 20.4 | % | 5.3 | % | ||||||||||||||||||||||||||||||||||
| Credit | 338,981 | 28,413 | 305,760 | 26,043 | 33,221 | 2,370 | 10.9 | % | 9.1 | % | ||||||||||||||||||||||||||||||||||||||||
| Equities | 86,003 | 9,292 | 84,354 | 9,120 | 1,649 | 172 | 2.0 | % | 1.9 | % | ||||||||||||||||||||||||||||||||||||||||
| Money Markets | 45,830 | 17,180 | 32,306 | 17,652 | 13,524 | (472) | 41.9 | % | (2.7) | % | ||||||||||||||||||||||||||||||||||||||||
| Market Data | 268 | 93,806 | — | 85,913 | 268 | 7,893 | N/M | 9.2 | % | |||||||||||||||||||||||||||||||||||||||||
| Other | — | 23,012 | — | 22,227 | — | 785 | — | 3.5 | % | |||||||||||||||||||||||||||||||||||||||||
| Total revenue | $ | 933,214 | $ | 405,005 | $ | 806,200 | $ | 382,581 | $ | 127,014 | $ | 22,424 | 15.8 | % | 5.9 | % | ||||||||||||||||||||||||||||||||||
N/M = not meaningful
The key drivers of the change in total revenue by asset class are summarized as follows:
Rates. Revenues from our rates asset class increased by $90.0 million or 14.9% to $695.4 million for the year ended December 31, 2023 compared to $605.4 million for the year ended December 31, 2022 primarily due to higher variable transaction fees and commissions on higher trading volumes for rates derivatives products and U.S. and European government bonds and an increase in fixed subscription fees.
Credit. Revenues from our credit asset class increased by $35.6 million or 10.7% to $367.4 million for the year ended December 31, 2023 compared to $331.8 million for the year ended December 31, 2022 primarily due to higher variable transaction fees and commissions on higher trading volumes for U.S. and European corporate bonds, partially offset by lower variable transaction fees and commissions on lower trading volumes for credit derivatives products.
76
Equities. Revenues from our equities asset class increased by $1.8 million or 1.9% to $95.3 million for the year ended December 31, 2023 compared to $93.5 million for the year ended December 31, 2022 primarily due to higher variable transaction fees and commissions on higher trading volumes for equity derivative products, partially offset by lower variable transaction fees and commissions on lower trading volumes for European ETFs.
Money Markets. Revenues from our money markets asset class increased by $13.1 million or 26.1% to $63.0 million for the year ended December 31, 2023 compared to $50.0 million for the year ended December 31, 2022 primarily due to higher variable transaction fees and commissions on higher trading volumes for certificates of deposit and repurchase agreements.
Market Data. Revenues from our market data asset class increased by $8.2 million or 9.5% to $94.1 million for the year ended December 31, 2023 compared to $85.9 million for the year ended December 31, 2022. The increase was derived primarily from increased proprietary third party market data fees, increased trade reporting services (APA) revenue and increased LSEG market data fees driven primarily from the amended and restated market data license agreement effective as of November 1, 2023 discussed above in “—Trends and Other Factors Impacting Our Performance—2023 LSEG Market Data Agreement.”
Other. Revenues from our other asset class remained relatively flat at $23.0 million for the year ended December 31, 2023 compared to $22.2 million for the year ended December 31, 2022, with a modest increase of $0.8 million or 3.5%.
We generate revenue from a diverse portfolio of client sectors. Our total revenue by client sector for the years ended December 31, 2023 and 2022, and the resulting dollar and percentage changes, were as follows:
| Year Ended | ||||||||||||||||||||||||||
| December 31, | ||||||||||||||||||||||||||
| 2023 | 2022 | $ Change | % Change | |||||||||||||||||||||||
(dollars in thousands) | ||||||||||||||||||||||||||
| Revenues | ||||||||||||||||||||||||||
| Institutional | $ | 797,038 | $ | 719,211 | $ | 77,827 | 10.8 | % | ||||||||||||||||||
| Wholesale | 312,586 | 273,189 | 39,397 | 14.4 | % | |||||||||||||||||||||
| Retail | 134,521 | 110,468 | 24,053 | 21.8 | % | |||||||||||||||||||||
| Market Data | 94,074 | 85,913 | 8,161 | 9.5 | % | |||||||||||||||||||||
| Total revenue | $ | 1,338,219 | $ | 1,188,781 | $ | 149,438 | 12.6 | % | ||||||||||||||||||
Institutional. Revenues from our institutional client sector increased by $77.8 million or 10.8% to $797.0 million for the year ended December 31, 2023 from $719.2 million for the year ended December 31, 2022. The increase was derived primarily from higher revenues for rates derivatives products, U.S. corporate bonds and U.S. and European government bonds, partially offset by lower revenues for credit derivatives products.
Wholesale. Revenues from our wholesale client sector increased by $39.4 million or 14.4% to $312.6 million for the year ended December 31, 2023 from $273.2 million for the year ended December 31, 2022. The increase was derived primarily from higher revenues for U.S. and European corporate bonds and U.S. government bonds.
Retail. Revenues from our retail client sector increased by $24.1 million or 21.8% to $134.5 million for the year ended December 31, 2023 from $110.5 million for the year ended December 31, 2022. The increase was derived primarily from higher revenues for certificates of deposit, U.S. government bonds and U.S. corporate bonds.
Market Data. Revenues from our market data client sector increased by $8.2 million or 9.5% to $94.1 million for the year ended December 31, 2023 from $85.9 million for the year ended December 31, 2022. The increase was derived primarily from increased proprietary third party market data fees, increased trade reporting services (APA) revenue and increased LSEG market data fees driven primarily from the amended and restated market data license agreement effective as of November 1, 2023 discussed above in “—Trends and Other Factors Impacting Our Performance—2023 LSEG Market Data Agreement.”
77
Our revenues and client base are also diversified by geography. Our total revenue by geography (based on client location) for the years ended December 31, 2023 and 2022, and the resulting dollar and percentage changes, were as follows:
| Year Ended | ||||||||||||||||||||||||||
| December 31, | ||||||||||||||||||||||||||
| 2023 | 2022 | $ Change | % Change | |||||||||||||||||||||||
(dollars in thousands) | ||||||||||||||||||||||||||
| Revenues | ||||||||||||||||||||||||||
| U.S. | $ | 850,338 | $ | 760,642 | $ | 89,696 | 11.8 | % | ||||||||||||||||||
| International | 487,881 | 428,139 | 59,742 | 14.0 | % | |||||||||||||||||||||
| Total revenue | $ | 1,338,219 | $ | 1,188,781 | $ | 149,438 | 12.6 | % | ||||||||||||||||||
U.S. Revenues from U.S. clients increased by $89.7 million or 11.8% to $850.3 million for the year ended December 31, 2023 from $760.6 million for the year ended December 31, 2022 primarily due to higher revenues for U.S. corporate bonds, U.S. government bonds, rates derivatives products and certificates of deposit.
International. Revenues from International clients increased by $59.7 million or 14.0% to $487.9 million for the year ended December 31, 2023 from $428.1 million for the year ended December 31, 2022 primarily due to higher revenues for rates derivatives products, European corporate bonds, European government bonds and higher market data revenue, offset by lower revenues for credit derivatives products and European ETFs.
Operating Expenses
Our expenses for the years ended December 31, 2023 and 2022 were as follows:
| Year Ended | ||||||||||||||||||||||||||
| December 31, | ||||||||||||||||||||||||||
| 2023 | 2022 | $ Change | % Change | |||||||||||||||||||||||
| (dollars in thousands) | ||||||||||||||||||||||||||
| Employee compensation and benefits | $ | 460,305 | $ | 432,421 | $ | 27,884 | 6.4 | % | ||||||||||||||||||
| Depreciation and amortization | 185,350 | 178,879 | 6,471 | 3.6 | % | |||||||||||||||||||||
| Technology and communications | 77,506 | 65,857 | 11,649 | 17.7 | % | |||||||||||||||||||||
| General and administrative | 51,495 | 46,561 | 4,934 | 10.6 | % | |||||||||||||||||||||
| Professional fees | 42,364 | 37,764 | 4,600 | 12.2 | % | |||||||||||||||||||||
| Occupancy | 15,930 | 14,726 | 1,204 | 8.2 | % | |||||||||||||||||||||
| Total expenses | $ | 832,950 | $ | 776,208 | $ | 56,742 | 7.3 | % | ||||||||||||||||||
Employee Compensation and Benefits. Expenses related to employee compensation and benefits increased by $27.9 million or 6.4% to $460.3 million for the year ended December 31, 2023 from $432.4 million for the year ended December 31, 2022. The increase was primarily due to an increase in headcount and related salaries and benefits as well as increases in incentive compensation expense and commissions tied to our operating performance, partially offset by $15.0 million in non-cash accelerated stock-based compensation expense and related payroll taxes relating to the retirement of our former CEO incurred during the year ended December 31, 2022 that did not recur during 2023.
Depreciation and Amortization. Expenses related to depreciation and amortization increased by $6.5 million or 3.6% to $185.4 million for the year ended December 31, 2023 from $178.9 million for the year ended December 31, 2022. The increase was primarily due to increases in amortization of software development costs and hardware driven by increases in investment in our infrastructure and expense relating to the assets acquired in connection with the August 31, 2023 Yieldbroker acquisition.
Technology and Communications. Expenses related to technology and communications increased by $11.6 million or 17.7% to $77.5 million for the year ended December 31, 2023 from $65.9 million for the year ended December 31, 2022. The increase was primarily due to investment in our data strategy and infrastructure and increased data and clearance fees driven primarily by higher trading volumes period-over-period.
78
General and Administrative. Expenses related to general and administrative costs increased by $4.9 million or 10.6% to $51.5 million for the year ended December 31, 2023 from $46.6 million for the year ended December 31, 2022. The increase was primarily due to an increase in realized and unrealized foreign currency losses, which increased by $3.4 million to $0.8 million in losses for the year ended December 31, 2023 compared to $2.6 million in gains for the year ended December 31, 2022. The change was primarily driven by the change in fair value of our foreign currency forward contracts used in connection with our foreign currency risk management program, partially offset by a decrease in foreign currency re-measurement losses on transactions in nonfunctional currencies.
Professional Fees. Expenses related to professional fees increased by $4.6 million or 12.2% to $42.4 million for the year ended December 31, 2023 from $37.8 million for the year ended December 31, 2022. The increase was primarily due to increased legal and other costs related to acquisitions.
Occupancy. Expenses related to occupancy costs increased by $1.2 million or 8.2% to $15.9 million for the year ended December 31, 2023 as compared to $14.7 million for the year ended December 31, 2022. The increase was primarily due to higher data center rent expense primarily driven by the completion of the NFI Acquisition technology integration during the three months ended March 31, 2023 and the relocation of data centers to locations providing enhanced infrastructure and improved performance.
Tax Receivable Agreement Liability Adjustment
The tax receivable agreement liability adjustment decreased by $23.2 million or 169.7% to $9.5 million of expense for the year ended December 31, 2023 from $13.7 million of income for the year ended December 31, 2022, due to changes in the tax receivable agreement liability recorded in our consolidated statements of financial condition as a result of changes in the mix of earnings, tax legislation and tax rates in various jurisdictions, which impacted our estimated future tax savings.
Net Interest Income (Expense)
Net interest income increased by $53.4 million or 448.8% to $65.4 million of net interest income for the year ended December 31, 2023 from $11.9 million of net interest expense for the year ended December 31, 2022, primarily due to an increase in interest income earned relating to an increase in our average invested cash balance and an increase in interest rates period over period.
Other Income (Loss), Net
Other loss increased by $12.1 million to $13.1 million loss for the year ended December 31, 2023 from $1.0 million of loss for the year ended December 31, 2022. During the year ended December 31, 2023, we recognized a loss of $11.1 million due to the impairment of a minority equity investment and a $1.3 million loss in connection with unwinding the out-of-the-money foreign currency call option entered into in order to partially mitigate the foreign currency exposure on the payment of the purchase price for the Yieldbroker Acquisition. See Note 4 – Acquisitions to our audited consolidated financial statements included elsewhere in this Annual Report on Form 10-K for further details. During the year ended December 31, 2023, we also recognized a $0.7 million loss due to a net reduction in the tax indemnification receivables from Refinitiv relating to the settlement of the tax matter for less than the previously estimated amount. See Note 9 – Income Taxes to our audited consolidated financial statements included elsewhere in this Annual Report on Form 10-K for further details. During the year ended December 31, 2022, we recognized a $1.0 million loss due to the write-off of an investment that was determined to be uncollectible.
Income Taxes
Income tax expense increased by $51.0 million or 65.7% to $128.5 million for the year ended December 31, 2023 from $77.5 million for the year ended December 31, 2022. The provision for income taxes includes U.S. federal, state, local, and foreign taxes. The effective tax rate for the year ended December 31, 2023 was approximately 23.4%, compared with 17.7% for the year ended December 31, 2022. The effective tax rate for the year ended December 31, 2023 differed from the U.S. federal statutory rate of 21.0% primarily due to state and local taxes net of the benefit related to the effect of non-controlling interest. The effective tax rate for the year ended December 31, 2022 differed from the U.S. federal statutory rate of 21.0% primarily due to state and local taxes including the tax impact of state apportionment rates changes on total tax expense as a result of the remeasurement of the Company’s net tax deferred asset, the effect of non-controlling interests and the tax impact of the exercise of equity compensation.
79
Effects of Inflation
While inflation may impact our revenues and operating expenses, we believe the effects of inflation, if any, on our results of operations and financial condition have not been significant during the years ended December 31, 2023 and 2022. However, there can be no assurance that our results of operations and financial condition will not be materially impacted by inflation in the future. See “— Trends and Other Factors Impacting Our Performance — Economic Environment” above.
Liquidity and Capital Resources
Overview
Liquidity describes the ability of a company to generate sufficient cash flows to meet the cash requirements of its business operations, including working capital needs to meet operating expenses, debt service, acquisitions, other commitments and contractual obligations. We consider liquidity in terms of cash on hand, cash flows from operations and availability under the 2023 Revolving Credit Facility and their sufficiency to fund our operating and investing activities.
Historically, we have generated significant cash flows from operations and have funded our business operations through cash on hand and cash flows from operations.
Our primary cash needs are for day to day operations, working capital requirements, clearing margin requirements, capital expenditures primarily for software and equipment, our expected dividend payments and our share repurchase program. In addition, we are obligated to make payments under the Tax Receivable Agreement.
We expect to fund our short and long-term liquidity requirements through cash and cash equivalents and cash flows from operations. While historically we have generated significant and adequate cash flows from operations, in the case of an unexpected event in the future or otherwise, we may fund our liquidity requirements through borrowings under the 2023 Revolving Credit Facility.
We believe that our projected cash position, cash flows from operations and, if necessary, borrowings under the 2023 Revolving Credit Facility, will be sufficient to fund our liquidity requirements for at least the next 12 months. However, our future liquidity requirements could be higher than we currently expect as a result of various factors. For example, any future investments, acquisitions, joint ventures or other similar transactions, which we consider from time to time, may reduce our cash balance or require additional capital. In addition, our ability to continue to meet our future liquidity requirements will depend on, among other things, our ability to achieve anticipated levels of revenues and cash flows from operations and our ability to manage costs and working capital successfully, all of which are subject to general economic, financial, competitive and other factors beyond our control. In the event we require any additional capital, it will take the form of equity or debt financing, or both, and there can be no assurance that we will be able to raise any such financing on terms acceptable to us or at all.
As of December 31, 2023 and 2022, we had cash and cash equivalents of approximately $1.7 billion and $1.3 billion, respectively. All cash and cash equivalents were held in accounts with financial institutions or money market funds such that the funds are immediately available or in fixed term deposits or investments with a maximum maturity of three months. See Part II, Item 7A. – “Quantitative and Qualitative Disclosures about Market Risk – Credit Risk” elsewhere in this Annual Report on Form 10-K.
80
Factors Influencing Our Liquidity and Capital Resources
Dividend Policy
Subject to legally available funds, we intend to pay quarterly cash dividends on our Class A common stock and Class B common stock equal to $0.10 per share. As discussed below, our ability to pay these quarterly cash dividends on our Class A common stock and Class B common stock will depend on distributions to us from TWM LLC.
The declaration, amount and payment of any dividends will be at the sole discretion of our board of directors and will depend on our and our subsidiaries’ results of operations, capital requirements, financial condition, business prospects, contractual restrictions, restrictions imposed by applicable laws and other factors that our board of directors deem relevant. Because we are a holding company and all of our business is conducted through our subsidiaries, we expect to pay dividends, if any, only from funds we receive from our subsidiaries. Accordingly, our ability to pay dividends to our stockholders is dependent on the earnings and distributions of funds from our subsidiaries. As the sole manager of TWM LLC, we intend to cause, and will rely on, TWM LLC to make distributions in respect of LLC Interests to fund our dividends. If TWM LLC is unable to cause these subsidiaries to make distributions, it may have inadequate funds to distribute to us and we may be unable to fund our dividends. In addition, when TWM LLC makes distributions to us, the other holders of LLC Interests will be entitled to receive proportionate distributions based on their economic interests in TWM LLC at the time of such distributions.
Our board of directors will periodically review the cash generated from our business and the capital expenditures required to finance our growth plans and determine whether to modify the amount of regular dividends and/or declare any periodic special dividends. Any future determination to change the amount of dividends and/or declare special dividends will be at the discretion of our board of directors and will be dependent upon then-existing conditions and other factors that our board of directors considers relevant. See “Risk Factors — Risks Relating to our Organizational Structure and Governance — Our principal asset is our equity interest in TWM LLC, and, accordingly, we depend on distributions from TWM LLC to pay our taxes and expenses, including payments under the Tax Receivable Agreement” and “Risk Factors — Risks Relating to Ownership of our Class A Common Stock — We intend to continue to pay regular dividends on our Class A common stock and Class B common stock, but our ability to do so may be limited.”
Cash Dividends
On February 2, 2024, the board of directors of Tradeweb Markets Inc. declared a cash dividend of $0.10 per share of Class A common stock and Class B common stock for the first quarter of 2024. This dividend will be payable on March 15, 2024 to stockholders of record as of March 1, 2024. The February 2024 dividend declaration of $0.10 represents a 11.1% per share increase from our historical quarterly dividend of $0.09. During 2023, Tradeweb Markets Inc. paid quarterly cash dividends of $0.09 per share to holders of Class A common stock and Class B common stock in an aggregate amount totaling $75.9 million.
Cash Distributions
On February 2, 2024, Tradeweb Markets Inc., as the sole manager, approved a distribution by TWM LLC to its equityholders, including Tradeweb Markets Inc., in an aggregate amount of $62.1 million, as adjusted by required state and local tax withholdings that will be determined prior to the record date of March 1, 2024, payable on March 13, 2024.
During 2023, TWM LLC made quarterly cash distributions to its equityholders in an aggregate amount totaling $119.4 million, including distributions to Tradeweb Markets Inc. totaling $107.0 million and distributions to non-controlling interests totaling $12.4 million. The proceeds of the cash distributions were used by Tradeweb Markets Inc. to fund dividend payments, taxes and expenses.
81
Share Repurchase Program
In February 2021, the board of directors authorized $150.0 million of total repurchases of the Company’s Class A common stock (the “2021 Share Repurchase Program”), which was completed in October 2022. On December 5, 2022, the Company announced that the board of directors had authorized a new share repurchase program (the “2022 Share Repurchase Program”). The 2022 Share Repurchase Program was authorized to continue to offset annual dilution from stock-based compensation plans, as well as to opportunistically repurchase our Class A common stock. The 2022 Share Repurchase Program authorizes the purchase of up to $300.0 million of our Class A common stock at the Company’s discretion and has no termination date. The 2022 Share Repurchase Program can be effected through regular open-market purchases (which may include repurchase plans designed to comply with Rule 10b5-1), through privately negotiated transactions or through accelerated share repurchases, each in accordance with applicable securities laws and other restrictions. The amounts, timing and manner of the repurchases will be subject to general market conditions, the prevailing price and trading volumes of our Class A common stock and other factors. The 2022 Share Repurchase Program does not require the Company to acquire a specific number of shares and may be suspended, amended or discontinued at any time. During the year ended December 31, 2023, the Company acquired a total of 485,730 shares of Class A common stock, at an average price of $72.48, for purchases totaling $35.2 million, pursuant to the 2022 Share Repurchase Program. As of December 31, 2023, a total of $239.8 million remained available for repurchase pursuant to the 2022 Share Repurchase Program.
Other Share Repurchases
In addition to the share repurchase programs discussed above, we may also withhold shares to cover the payroll tax withholding obligations upon the exercise of stock options and vesting of PRSUs and RSUs.
During the year ended December 31, 2023, the Company withheld 715,101 shares of common stock from employee stock option, PRSU and RSU awards, at an average price per share of $72.02 and an aggregate value of $51.5 million based on the price of the Class A common stock on the date the relevant withholding occurred.
Tax Receivable Agreement
We are obligated to make payments under the Tax Receivable Agreement. See Note 10 – Tax Receivable Agreement to our audited consolidated financial statements included elsewhere in this Annual Report on Form 10-K for additional details regarding the requirements for these payments. Although the actual timing and amount of any payments that may be made under the Tax Receivable Agreement will vary, we expect the payments required will be significant. Any payments made by us under the Tax Receivable Agreement will generally reduce the amount of overall cash flows that might have otherwise been available to us or to TWM LLC. These payments will offset some of the tax benefits that we expect to realize as a result of the ownership structure of TWM LLC. To the extent that we are unable to make payments under the Tax Receivable Agreement for any reason, the unpaid amounts generally will be deferred and will accrue interest until paid by us. The first payment of the Tax Receivable Agreement was made in January 2021. As of December 31, 2023, total amounts due to the Continuing LLC Owners under the Tax Receivable Agreement were $457.5 million, substantially all due to be paid over 15 years following the purchase of LLC Interests from Continuing LLC Owners or redemption or exchanges by Continuing LLC Owners of LLC Interests.
Liabilities under the Tax Receivable Agreement include amounts to be paid to Continuing LLC Owners, assuming we will have sufficient taxable income over the term of the Tax Receivable Agreement to utilize the related tax benefits. In determining the estimated timing of payments, the current year’s taxable income is used to extrapolate an estimate of future taxable income. The Company is subject to CAMT, which is expected to change the estimated period in which the payments will be made, as reflected in the payment schedule below. As of December 31, 2023, we had the following obligations expected to be paid pursuant to the Tax Receivable Agreement:
| Payments due by period | ||||||||||||||||||||||||||||||||
| Total | Less than 1 year | 1 to 3 years | 3 to 5 years | More than 5 years | ||||||||||||||||||||||||||||
| (in thousands) | ||||||||||||||||||||||||||||||||
| Tax receivable agreement liability | $ | 457,523 | $ | 26,804 | $ | 101,421 | $ | 91,400 | $ | 237,898 | ||||||||||||||||||||||
In addition to the above, our tax receivable agreement liability and future payments thereunder are expected to increase as we realize (or are deemed to realize) an increase in tax basis of TWM LLC’s assets resulting from any future purchases, redemptions or exchanges of LLC Interests from Continuing LLC Owners. We currently expect to fund these future tax receivable agreement liability payments from some of the realized cash tax savings as a result of this increase in tax basis.
82
Indebtedness
As of December 31, 2023 and 2022, we had no outstanding indebtedness.
On November 21, 2023, TWM LLC terminated the revolving credit facility entered into in April 2019 and replaced it with a new 2023 Revolving Credit Facility entered into with a syndicate of banks. The 2023 Revolving Credit Facility provides borrowing capacity to be used to fund ongoing working capital needs, letters of credit and for general corporate purposes, including potential future acquisitions and expansions.
The 2023 Revolving Credit Facility permits borrowings of up to $500.0 million by TWM LLC. Subject to the satisfaction of certain conditions, we will be able to increase the 2023 Revolving Credit Facility by $250.0 million with the consent of the lenders participating in the increase. Borrowings under the 2023 Revolving Credit Facility may be, at the option of the Company, in US Dollars, Euros or Sterling. The 2023 Revolving Credit Facility also provides for the issuance of up to $5.0 million of letters of credit as well as borrowings on same-day notice, referred to as swingline loans, in an amount of up to $50.0 million. The 2023 Revolving Credit Facility will mature on November 21, 2028.
As of December 31, 2023, there were $0.5 million in letters of credit issued under the 2023 Revolving Credit Facility, respectively and no borrowings outstanding. As of December 31, 2023, we had availability of $499.5 million.
Borrowings under the 2023 Revolving Credit Facility bear interest at a rate equal to, at the Company’s option, either (a) a base rate equal to the greatest of (i) the administrative agent’s prime rate, (ii) the federal funds effective rate plus ½ of 1.00% and (iii) one month Term SOFR plus 1.00% plus a credit adjustment spread of 0.10%, in each case plus a margin based on the Company’s consolidated net leverage ratio ranging from 0.25% to 0.75%, or (b) a rate equal to (i) in the case of borrowings in US Dollars, Term SOFR plus a credit adjustment spread of 0.10%, subject to a 0.00% floor, (ii) in the case of borrowings in Sterling, SONIA subject to a 0.00% floor, and (iii) in the case of borrowings in Euros, EURIBOR, subject to a 0.00% floor, in each case plus a margin based on the Company’s consolidated net leverage ratio ranging from 1.25% to 1.75%. The agreement also includes a commitment fee of 0.25% for available but unborrowed amounts We are also required to pay customary letter of credit fees and agency fees.
We have the option to voluntarily repay outstanding loans at any time without premium or penalty other than customary “breakage” costs with respect to Term SOFR, SONIA and EURIBOR loans. There will be no scheduled amortization under the 2023 Revolving Credit Facility. The principal amount outstanding will be due and payable in full at maturity.
The 2023 Revolving Credit Facility is unsecured and as of December 31, 2023, obligations under the 2023 Revolving Credit Facility are not guaranteed by any of the Company’s subsidiaries.
The credit agreement that governs the 2023 Revolving Credit Facility contains a number of covenants that, among other things and subject to certain exceptions, restrict the ability of (i) TWM LLC to merge or consolidate with other entities, (ii) the subsidiaries of TWM LLC to incur or guarantee indebtedness and (iii) TWM LLC and its subsidiaries to create or incur liens.
The 2023 Revolving Credit Facility contains a financial covenant requiring compliance with a (i) maximum total net leverage ratio tested as of the last day of each fiscal quarter not to exceed 3.5 to 1.0 (increasing to 4.0 to 1.0 for the four-quarter period following a material acquisition and the fiscal quarter in which such material acquisition is consummated) and (ii) minimum cash interest coverage ratio tested as of the last day of each fiscal quarter not less than 3.0 to 1.0.
The credit agreement that governs the 2023 Revolving Credit Facility also contains certain affirmative covenants and events of default customary for facilities of this type, including relating to a change of control. If an event of default occurs, the lenders under the 2023 Revolving Credit Facility will be entitled to take various actions, including the acceleration of amounts due under the 2023 Revolving Credit Facility.
As of December 31, 2023, we were in compliance with all the covenants set forth in the 2023 Revolving Credit Facility.
83
Operating Lease Obligations
We have operating leases for corporate offices and data centers with initial lease terms ranging from one to 10 years. Our operating lease obligations are primarily related to rental payments under lease agreements for office space in the United States and the United Kingdom through December 2027. In December 2023, the lease for our New York headquarters was extended for an amended term through December 2024, as we continue to evaluate our office space needs for the future. As of December 31, 2023, our operating lease liabilities totaled $27.5 million, with payments pursuant to these obligations due within the next 12 months and thereafter totaling $12.3 million and $17.6 million, respectively.
Capital Expenditures
Our business also requires continued investment in our technology for product innovation, proprietary technology architecture, operational reliability and cybersecurity. We expect total cash paid for non-acquisition related capital expenditures and software development costs for fiscal 2024 to be between $75 million and $83 million, compared to expenditures of $61.8 million and $60.1 million in fiscal years 2023 and 2022, respectively, with the midpoint of our 2024 capital expenditure guidance up 28% versus fiscal year 2023 primarily due to anticipated capitalized integration spend associated with the acquisitions of Yieldbroker and r8fin. Excluding the 2024 integration and other one-time spend, the mid-point growth is projected to be approximately 15% higher year over year.
Other Cash and Liquidity Requirements
Certain of our U.S. subsidiaries are registered as broker-dealers, SEFs or introducing brokers and are subject to the applicable rules and regulations of the SEC and CFTC. These rules contain minimum net capital or other financial resource requirements, as defined in the applicable regulations. These rules may also require a significant part of the registrants’ assets be kept in relatively liquid form. Certain of our foreign subsidiaries are regulated by the FCA in the UK, the Nederlandsche Bank in the Netherlands, the Japanese Financial Services Agency, the Japanese Securities Dealers Association and other foreign regulators, and must maintain financial resources, as defined in the applicable regulations, in excess of the applicable financial resources requirement. As of December 31, 2023 and 2022, each of our regulated subsidiaries had maintained sufficient net capital or financial resources to at least satisfy their minimum requirements, which in aggregate were $76.7 million and $69.1 million, respectively. We maintain capital balances in these subsidiaries in excess of our minimum requirements in order to satisfy working capital needs and to ensure that we have enough cash on hand to satisfy margin requirements and credit risk, including the excess capital expectations of our clients. The Fixed Income Clearing Corporation (“FICC”) and some of our clearing brokers require us to post collateral on unsettled positions, included within deposits with clearing organizations in our consolidated statements of financial condition. Collateral amounts are marked to market on a daily basis, requiring us to pay or receive margin amounts as part of the daily funds settlement. Margin call requirements can vary significantly across periods based on daily market changes and may represent a significant and unpredictable use of our liquidity.
At times, transactions executed on our wholesale platform fail to settle due to the inability of a transaction party to deliver or receive the transacted security. Until the failed transaction settles, we will recognize a receivable from (and a matching payable to) brokers and dealers and clearing organizations for the proceeds from the unsettled transaction. The impact on our liquidity and capital resources is minimal as receivables and payables for failed transactions are usually recognized simultaneously and predominantly offset. However, from time to time, we enter into repurchase and/or reverse repurchase agreements to facilitate the clearance of securities relating to fails to deliver or receive. We seek to manage credit exposure related to these agreements to repurchase (or reverse repurchase), including the risk related to a decline in market value of collateral (pledged or received), by entering into agreements to repurchase with overnight or short-term maturity dates and only entering into repurchase transactions with netting members of the FICC. The FICC operates a continuous net settlement system, whereby as trades are submitted and compared, the FICC becomes the counterparty.
84
Historically we have used ICBC, a wholly-owned subsidiary of the Industrial and Commercial Bank of China Limited to clear U.S. Treasury trades executed by non-FICC members on our wholesale trading platform. Under that arrangement, ICBC submitted our trades from non-FICC members to the FICC under the ICBC netting account with the FICC. Following the November 2023 ransomware attack on some ICBC operating systems, including those used to clear U.S. Treasury and repurchase agreement financings, we have and may continue to self-clear these U.S. Treasury trades. As a result, this increased the number of trades that settle over the fed wire, instead of FICC clearing, and accordingly we have experienced and may continue to experience, an increase in the number of U.S. Treasury failed settlement transactions. As of December 31, 2023, we recorded a $381.2 million receivable and a $351.9 million payable from/to brokers and dealers and clearing organizations related to failed settlement transactions, entered into a repurchase transaction in the amount of $21.6 million and we self-funded the remaining $7.7 million difference between the fail to deliver and fail to receive. All of the above failed settlement transactions and the securities sold under agreements to repurchase outstanding as of December 31, 2023 were fully settled during January 2024. See below for further details regarding the changes to working capital as a result of these failed settlement transactions.
Working Capital
Working capital is defined as current assets minus current liabilities. Current assets consist of cash and cash equivalents, restricted cash, receivable from brokers and dealers and clearing organizations, deposits with clearing organizations, accounts receivable and receivable and due from affiliates. Current liabilities consist of securities sold under agreements to repurchase, payable to brokers and dealers and clearing organizations, accrued compensation, deferred revenue, payable and due to affiliates, accounts payable, accrued expenses and other liabilities, lease liabilities and tax receivable agreement liability. Changes in working capital, which impact our cash flows provided by operating activities, can vary depending on factors such as delays in the collection of receivables, changes in our operating performance, changes in trading patterns, changes in client billing terms and other changes in the demand for our platforms and solutions.
Our working capital as of December 31, 2023 and 2022 was as follows:
| December 31, | ||||||||||||||
| 2023 | 2022 | |||||||||||||
| (in thousands) | ||||||||||||||
| Cash and cash equivalents | $ | 1,706,468 | $ | 1,257,229 | ||||||||||
| Restricted cash | 1,000 | 1,000 | ||||||||||||
| Receivable from brokers and dealers and clearing organizations | 381,178 | 11,632 | ||||||||||||
| Deposits with clearing organizations | 36,806 | 23,906 | ||||||||||||
| Accounts receivable | 168,407 | 142,676 | ||||||||||||
| Receivable and due from affiliates | 192 | 2,728 | ||||||||||||
| Total current assets | 2,294,051 | 1,439,171 | ||||||||||||
| Securities sold under agreements to repurchase | 21,612 | — | ||||||||||||
| Payable to brokers and dealers and clearing organizations | 351,864 | 11,264 | ||||||||||||
| Accrued compensation | 164,329 | 150,884 | ||||||||||||
| Deferred revenue | 25,746 | 22,827 | ||||||||||||
| Payable and due to affiliates | 1,327 | 7,232 | ||||||||||||
| Current portion of: | ||||||||||||||
| Accounts payable, accrued expenses and other liabilities | 56,878 | 46,099 | ||||||||||||
| Lease liabilities | 11,347 | 11,265 | ||||||||||||
| Tax receivable agreement liability | 26,804 | 5,791 | ||||||||||||
| Total current liabilities | 659,907 | 255,362 | ||||||||||||
| Total working capital | $ | 1,634,144 | $ | 1,183,809 | ||||||||||
Current Assets
Current assets increased to $2.3 billion as of December 31, 2023 from $1.4 billion as of December 31, 2022 primarily due to an increase in cash and cash equivalents (see “—Cash Flows” below) and receivables from brokers and dealers and clearing organizations resulting from a higher value of fails to deliver as a result of increased unsettled wholesale platform transactions, all of which settled in January 2024.
85
Current Liabilities
Current liabilities increased to $659.9 million as of December 31, 2023 from $255.4 million as of December 31, 2022 primarily due to an increase in the payable to brokers and dealers and clearing organizations and securities sold under agreements to repurchase resulting from a higher value of fails to deliver as a result of increased unsettled wholesale platform transactions, all of which settled in January 2024 and an increase in the current portion of the tax receivable agreement liability as a result of an increase in our taxable income.
See “—Other Cash and Liquidity Requirements” above for a discussion on how capital requirements can impact our working capital.
Cash Flows
Our cash flows for the years ended December 31, 2023, 2022 and 2021 were as follows:
| Year Ended | ||||||||||||||||||||
| December 31, | ||||||||||||||||||||
| 2023 | 2022 | 2021 | ||||||||||||||||||
(in thousands) | ||||||||||||||||||||
| Net cash provided by operating activities | $ | 746,089 | $ | 632,822 | $ | 578,021 | ||||||||||||||
| Net cash used in investing activities | (132,765) | (60,096) | (259,110) | |||||||||||||||||
| Net cash used in financing activities | (168,174) | (276,703) | (136,100) | |||||||||||||||||
| Effect of exchange rate changes on cash, cash equivalents and restricted cash | 4,089 | (10,842) | (2,043) | |||||||||||||||||
| Net increase (decrease) in cash, cash equivalents and restricted cash | $ | 449,239 | $ | 285,181 | $ | 180,768 | ||||||||||||||
Operating Activities
Operating activities consist primarily of net income adjusted for noncash items that primarily include depreciation and amortization, stock-based compensation expense and deferred tax expense. Cash flows from operating activities can fluctuate significantly from period-to-period as working capital needs and the timing of payments for accrued compensation (primarily in the first quarter) and other items impact reported cash flows.
Net cash provided by operating activities for the year ended December 31, 2023 was $746.1 million, an increase of $113.3 million as compared to the year ended December 31, 2022, primarily driven by an increase in net income during 2023, including the adjustment to net income to add back non-cash related items such as deferred tax expense and the tax receivable liability adjustment and including an increase in net interest income, partially offset by changes in working capital.
Investing Activities
Investing activities consist primarily of software development costs, investments in technology hardware, purchases of equipment and other tangible assets, business acquisitions and investments.
Net cash used in investing activities was $132.8 million for the year ended December 31, 2023, which consisted of $69.7 million of total net cash paid for the Yieldbroker acquisition (net of cash acquired), $43.2 million of capitalized software development costs, $18.5 million of purchases of furniture, equipment, purchased software and leasehold improvements and $1.3 million of cash paid for a foreign currency call option, net of sales proceeds. Net cash used in investing activities was $60.1 million for the year ended December 31, 2022, which consisted of $36.9 million of capitalized software development costs and $23.2 million of purchases of furniture, equipment, purchased software and leasehold improvements.
Financing Activities
Net cash used in financing activities for the year ended December 31, 2023 was $168.2 million, and was primarily driven by $35.2 million in share repurchases pursuant to our share repurchase programs, $36.1 million in payroll tax payments for options, PRSUs and RSUs, net of proceeds from stock-based compensation option exercises and $75.9 million in cash dividends to our Class A and Class B common stockholders. Net cash used in financing activities for the year ended December 31, 2022 was $276.7 million, and was primarily driven by $99.3 million in share repurchases pursuant to our share repurchase programs, $91.5 million in payroll tax payments for options, PRSUs and RSUs, net of proceeds from stock-based compensation option exercises and $66.0 million in cash dividends to our Class A and Class B common stockholders.
86
Non-GAAP Financial Measures
Free Cash Flow
In addition to cash flow from operating activities presented in accordance with GAAP, we use Free Cash Flow, a non-GAAP measure, to measure liquidity. Free Cash Flow is defined as cash flow from operating activities less non-acquisition related expenditures for capitalized software development costs and furniture, equipment and leasehold improvements.
We present Free Cash Flow because we believe it is a useful indicator of liquidity that provides information to management and investors about the amount of cash generated from our core operations after non-acquisition related expenditures for capitalized software development costs and furniture, equipment and leasehold improvements.
Free Cash Flow has limitations as an analytical tool, and you should not consider Free Cash Flow in isolation or as an alternative to cash flow from operating activities or any other liquidity measure determined in accordance with GAAP. You are encouraged to evaluate each adjustment. In addition, in evaluating Free Cash Flow, you should be aware that in the future, we may incur expenditures similar to the adjustments in the presentation of Free Cash Flow. In addition, Free Cash Flow may not be comparable to similarly titled measures used by other companies in our industry or across different industries.
The table set forth below presents a reconciliation of our cash flow from operating activities to Free Cash Flow for the years ended December 31, 2023, 2022 and 2021:
| Year Ended | ||||||||||||||||||||
| December 31, | ||||||||||||||||||||
| 2023 | 2022 | 2021 | ||||||||||||||||||
(in thousands) | ||||||||||||||||||||
| Cash flow from operating activities | $ | 746,089 | $ | 632,822 | $ | 578,021 | ||||||||||||||
| Less: Capitalization of software development costs | (43,235) | (36,882) | (34,470) | |||||||||||||||||
| Less: Purchases of furniture, equipment and leasehold improvements | (18,529) | (23,214) | (16,878) | |||||||||||||||||
| Free Cash Flow | $ | 684,325 | $ | 572,726 | $ | 526,673 | ||||||||||||||
Adjusted EBITDA, Adjusted EBITDA margin, Adjusted EBIT, Adjusted EBIT margin, Adjusted Net Income and Adjusted Diluted EPS
In addition to net income, net income margin and net income attributable to Tradeweb Markets Inc., each presented in accordance with GAAP, we present Adjusted EBITDA, Adjusted EBITDA margin, Adjusted EBIT and Adjusted EBIT margin as non-GAAP measures of our operating performance and Adjusted Net Income and Adjusted Net Income per diluted share (“Adjusted Diluted EPS”) as non-GAAP measures of our profitability.
Adjusted EBITDA, Adjusted EBITDA margin, Adjusted EBIT and Adjusted EBIT margin
Adjusted EBITDA is defined as net income before net interest income/expense, provision for income taxes and depreciation and amortization, adjusted for the impact of certain other items, including merger and acquisition transaction and integration costs, certain stock-based compensation expense and related payroll taxes, tax receivable agreement liability adjustments, unrealized gains and losses from outstanding foreign currency forward contracts, gains and losses from the revaluation of foreign denominated cash and other income and loss.
Adjusted EBIT is defined as net income before net interest income/expense and provision for income taxes, adjusted for the impact of certain other items, including merger and acquisition transaction and integration costs, certain stock-based compensation expense and related payroll taxes, tax receivable agreement liability adjustments, depreciation and amortization related to acquisitions and the Refinitiv Transaction, unrealized gains and losses from outstanding foreign currency forward contracts, gains and losses from the revaluation of foreign denominated cash and other income and loss.
Net income margin is defined as net income, divided by revenue for the applicable period. Adjusted EBITDA margin and Adjusted EBIT margin are defined as Adjusted EBITDA and Adjusted EBIT, respectively, divided by revenue for the applicable period.
87
We present Adjusted EBITDA, Adjusted EBITDA margin, Adjusted EBIT and Adjusted EBIT margin because we believe they assist investors and analysts in comparing our operating performance across reporting periods on a consistent basis by excluding items that we do not believe are indicative of our core operating performance. For example, we exclude non-cash stock-based compensation expense associated with the Special Option Award as defined in Note 2 – Significant Accounting Policies to our audited consolidated financial statements included elsewhere in this Annual Report on Form 10-K and post-IPO options awarded in 2019 to management and other employees as well as payroll taxes associated with exercises of such options during the applicable period. We believe it is useful to exclude this stock-based compensation expense and associated payroll taxes because the amount of expense associated with the Special Option Award and the post-IPO option awards in 2019 may not directly correlate to the underlying performance of our business and will vary across periods. Beginning on August 30, 2021, we also exclude the non-cash accelerated stock-based compensation expense associated with our former CFO and beginning on February 11, 2022 the incremental non-cash accelerated stock-based compensation expense associated with our retired CEO and related payroll taxes are also excluded, as we do not consider these expenses indicative of our core ongoing operating performance. The accelerated stock-based compensation expense associated with our former CFO and retired CEO was fully amortized on January 4, 2022 and December 31, 2022, respectively. In addition, we exclude the tax receivable agreement liability adjustments discussed below under “— Critical Accounting Policies and Estimates — Tax Receivable Agreement.” We believe it is useful to exclude the tax receivable agreement liability adjustment because the recognition of income during a period due to changes in the tax receivable agreement liability recorded in our consolidated statements of financial condition as a result of changes in the mix of earnings, tax legislation and tax rates in various jurisdictions, or other factors that may impact our tax savings, may not directly correlate to the underlying performance of our business and will vary across periods. We also believe it is useful to exclude merger and acquisition transaction and integration costs as the incremental direct costs related to completed and potential acquisitions and related integrations are not indicative of our core ongoing operating performance. With respect to Adjusted EBIT and Adjusted EBIT margin, we believe it is useful to exclude the depreciation and amortization of tangible and intangible assets resulting from acquisitions and the application of pushdown accounting to the Refinitiv Transaction in order to facilitate a period-over-period comparison of our financial performance.
Management and our board of directors use Adjusted EBITDA, Adjusted EBITDA margin, Adjusted EBIT and Adjusted EBIT margin to assess our financial performance and believe they are helpful in highlighting trends in our core operating performance, while other measures can differ significantly depending on long-term strategic decisions regarding capital structure, the tax jurisdictions in which we operate and capital investments. Further, our executive incentive compensation is based in part on components of Adjusted EBITDA and Adjusted EBITDA margin.
Adjusted Net Income and Adjusted Diluted EPS
Adjusted Net Income is defined as net income attributable to Tradeweb Markets Inc. assuming the full exchange of all outstanding LLC Interests held by non-controlling interests for shares of Class A common stock or Class B common stock of Tradeweb Markets Inc., adjusted for certain stock-based compensation expense and related payroll taxes, tax receivable agreement liability adjustments, merger and acquisition transaction and integration costs, depreciation and amortization related to acquisitions and the Refinitiv Transaction, unrealized gains and losses from outstanding foreign currency forward contracts, gains and losses from the revaluation of foreign denominated cash and other income and loss. Adjusted Net Income also gives effect to certain tax related adjustments to reflect an assumed effective tax rate. Adjusted Diluted EPS is defined as Adjusted Net Income divided by the diluted weighted average number of shares of Class A common stock and Class B common stock outstanding for the applicable period (including the effect of potentially dilutive securities determined using the treasury stock method), plus the weighted average number of other participating securities reflected in earnings per share using the two-class method, plus the assumed full exchange of all outstanding LLC Interests held by non-controlling interests for shares of Class A common stock or Class B common stock.
88
We use Adjusted Net Income and Adjusted Diluted EPS as supplemental metrics to evaluate our business performance in a way that also considers our ability to generate profit without the impact of certain items. We exclude stock-based compensation expense associated with the Special Option Award and the post-IPO option awards in 2019 and payroll taxes associated with exercises of such options, non-cash accelerated stock-based compensation expense associated with our former CFO and retired CEO and related payroll taxes, tax receivable agreement liability adjustments, merger and acquisition transaction and integration costs and acquisition and Refinitiv Transaction-related depreciation and amortization for the reasons described above. Each of the normal recurring adjustments and other adjustments described in the definition of Adjusted Net Income helps to provide management with a measure of our operating performance over time by removing items that are not related to day-to-day operations or are non-cash expenses. In addition to excluding items that are non-recurring or may not be indicative of our ongoing operating performance, by assuming the full exchange of all outstanding LLC Interests held by non-controlling interests, we believe that Adjusted Net Income and Adjusted Diluted EPS for Tradeweb Markets Inc. facilitate comparisons with other companies that have different organizational and tax structures, as well as comparisons period over period, because it eliminates the effect of any changes in net income attributable to Tradeweb Markets Inc. driven by increases in our ownership of TWM LLC, which are unrelated to our operating performance.
Adjusted EBITDA, Adjusted EBITDA margin, Adjusted EBIT, Adjusted EBIT margin, Adjusted Net Income and Adjusted Diluted EPS have limitations as analytical tools, and you should not consider these non-GAAP financial measures in isolation or as alternatives to net income attributable to Tradeweb Markets Inc., net income, net income margin, operating income, gross margin, earnings per share or any other financial measure derived in accordance with GAAP. You are encouraged to evaluate each adjustment and, as applicable, the reasons we consider it appropriate for supplemental analysis. In addition, in evaluating Adjusted EBITDA, Adjusted EBITDA margin, Adjusted EBIT, Adjusted EBIT margin, Adjusted Net Income and Adjusted Diluted EPS you should be aware that in the future, we may incur expenses similar to the adjustments in the presentation of these non-GAAP financial measures. Our presentation of Adjusted EBITDA, Adjusted EBITDA margin, Adjusted EBIT, Adjusted EBIT margin, Adjusted Net Income and Adjusted Diluted EPS should not be construed as an inference that our future results will be unaffected by unusual or non-recurring items. In addition, Adjusted EBITDA, Adjusted EBITDA margin, Adjusted EBIT, Adjusted EBIT margin, Adjusted Net Income and Adjusted Diluted EPS may not be comparable to similarly titled measures used by other companies in our industry or across different industries.
89
The table set forth below presents a reconciliation of net income and net income margin to Adjusted EBITDA, Adjusted EBITDA margin, Adjusted EBIT and Adjusted EBIT margin for the years ended December 31, 2023, 2022 and 2021:
| Year Ended | ||||||||||||||||||||
| December 31, | ||||||||||||||||||||
| 2023 | 2022 | 2021 | ||||||||||||||||||
| (dollars in thousands) | ||||||||||||||||||||
Net income | $ | 419,503 | $ | 359,613 | $ | 273,108 | ||||||||||||||
Merger and acquisition transaction and integration costs (1) | 8,042 | 1,069 | 5,073 | |||||||||||||||||
Net interest (income) expense | (65,350) | (11,907) | 1,590 | |||||||||||||||||
Depreciation and amortization | 185,350 | 178,879 | 171,308 | |||||||||||||||||
Stock-based compensation expense (2) | 2,947 | 20,409 | 16,509 | |||||||||||||||||
Provision for income taxes | 128,477 | 77,520 | 96,875 | |||||||||||||||||
Foreign exchange (gains) / losses (3) | (47) | 4,409 | (4,702) | |||||||||||||||||
Tax receivable agreement liability adjustment (4) | 9,517 | (13,653) | (12,745) | |||||||||||||||||
| Other (income) loss, net | 13,122 | 1,000 | — | |||||||||||||||||
Adjusted EBITDA | $ | 701,561 | $ | 617,339 | $ | 547,016 | ||||||||||||||
Less: Depreciation and amortization | (185,350) | (178,879) | (171,308) | |||||||||||||||||
Add: D&A related to acquisitions and the Refinitiv Transaction (5) | 127,731 | 126,659 | 124,580 | |||||||||||||||||
Adjusted EBIT | $ | 643,942 | $ | 565,119 | $ | 500,288 | ||||||||||||||
Net income margin | 31.3 | % | 30.3 | % | 25.4 | % | ||||||||||||||
Adjusted EBITDA margin | 52.4 | % | 51.9 | % | 50.8 | % | ||||||||||||||
Adjusted EBIT margin | 48.1 | % | 47.5 | % | 46.5 | % | ||||||||||||||
(1)Represents incremental direct costs associated with the acquisition and integration of completed and potential mergers and acquisitions. These costs generally include legal, consulting, advisory, due diligence, severance and other third party costs incurred that directly relate to the acquisition transaction or its integration.
(2)Represents non-cash stock-based compensation expense associated with the Special Option Award and post-IPO options awarded in 2019 and payroll taxes associated with the exercise of such options. During the year ended December 31, 2022, this adjustment also includes $15.0 million of non-cash accelerated stock-based compensation expense and related payroll taxes associated with our retired CEO. During the year ended December 31, 2021, this adjustment also includes $1.7 million of non-cash accelerated stock-based compensation expense and related payroll taxes associated with our former CFO.
(3)Represents unrealized gain or loss recognized on foreign currency forward contracts and foreign exchange gain or loss from the revaluation of cash denominated in a different currency than the entity’s functional currency.
(4)Represents income recognized during the applicable period due to changes in the tax receivable agreement liability recorded in the consolidated statement of financial condition as a result of changes in the mix of earnings, tax legislation and tax rates in various jurisdictions which impacted our tax savings.
(5)Represents intangible asset and acquired software amortization resulting from acquisitions and intangible asset amortization and increased tangible asset and capitalized software depreciation and amortization resulting from the application of pushdown accounting to the Refinitiv Transaction (where all assets were marked to fair value as of the closing date of the Refinitiv Transaction).
| Year Ended | ||||||||||||||||||||||||||
| December 31, | ||||||||||||||||||||||||||
| 2023 | 2022 | Basis Point Change | Constant Currency Basis Point Change (1) | |||||||||||||||||||||||
| Adjusted EBITDA margin | 52.4 | % | 51.9 | % | +49 bps | +100 bps | ||||||||||||||||||||
| Adjusted EBIT margin | 48.1 | % | 47.5 | % | +58 bps | +107 bps | ||||||||||||||||||||
(1)The changes in Adjusted EBITDA margin and Adjusted EBIT margin, both on a constant currency basis, are non-GAAP financial measures, and are defined as the changes in Adjusted EBITDA margin and Adjusted EBIT margin excluding the effects of foreign currency fluctuations. Adjusted EBITDA margin and Adjusted EBIT margin excluding the effects of foreign currency fluctuations are calculated by translating the current period and prior period’s results using the annual average exchange rates for the prior period. We use the changes in Adjusted EBITDA margin and Adjusted EBIT margin on a constant currency basis as supplemental metrics to evaluate our underlying margin performance between periods by removing the impact of foreign currency fluctuations. We believe that providing changes in Adjusted EBITDA margin and Adjusted EBIT margin on a constant currency basis provide useful comparisons of our Adjusted EBITDA margin and Adjusted EBIT margin and trends between periods.
90
The table set forth below presents a reconciliation of net income attributable to Tradeweb Markets Inc. and net income, as applicable, to Adjusted Net Income and Adjusted Diluted EPS for the years ended December 31, 2023, 2022 and 2021:
| Year Ended | ||||||||||||||||||||
| December 31, | ||||||||||||||||||||
| 2023 | 2022 | 2021 | ||||||||||||||||||
| (in thousands except per share amounts) | ||||||||||||||||||||
Earnings per diluted share | $ | 1.71 | $ | 1.48 | $ | 1.09 | ||||||||||||||
Net income attributable to Tradeweb Markets Inc. | $ | 364,866 | $ | 309,338 | $ | 226,828 | ||||||||||||||
Net income attributable to non-controlling interests (1) | 54,637 | 50,275 | 46,280 | |||||||||||||||||
Net income | 419,503 | 359,613 | 273,108 | |||||||||||||||||
Provision for income taxes | 128,477 | 77,520 | 96,875 | |||||||||||||||||
Merger and acquisition transaction and integration costs (2) | 8,042 | 1,069 | 5,073 | |||||||||||||||||
D&A related to acquisitions and the Refinitiv Transaction (3) | 127,731 | 126,659 | 124,580 | |||||||||||||||||
Stock-based compensation expense (4) | 2,947 | 20,409 | 16,509 | |||||||||||||||||
Foreign exchange (gains) / losses (5) | (47) | 4,409 | (4,702) | |||||||||||||||||
Tax receivable agreement liability adjustment (6) | 9,517 | (13,653) | (12,745) | |||||||||||||||||
Other (income) loss, net | 13,122 | 1,000 | — | |||||||||||||||||
Adjusted Net Income before income taxes | 709,292 | 577,026 | 498,698 | |||||||||||||||||
Adjusted income taxes (7) | (173,777) | (126,946) | (109,713) | |||||||||||||||||
Adjusted Net Income | $ | 535,515 | $ | 450,080 | $ | 388,985 | ||||||||||||||
Adjusted Diluted EPS (8) | $ | 2.26 | $ | 1.90 | $ | 1.63 | ||||||||||||||
(1)Represents the reallocation of net income attributable to non-controlling interests from the assumed exchange of all outstanding LLC Interests held by non-controlling interests for shares of Class A or Class B common stock.
(2)Represents incremental direct costs associated with the acquisition and integration of completed and potential mergers and acquisitions. These costs generally include legal, consulting, advisory, due diligence, severance and other third party costs incurred that directly relate to the acquisition transaction or its integration.
(3)Represents intangible asset and acquired software amortization resulting from acquisitions and intangible asset amortization and increased tangible asset and capitalized software depreciation and amortization resulting from the application of pushdown accounting to the Refinitiv Transaction (where all assets were marked to fair value as of the closing date of the Refinitiv Transaction).
(4)Represents non-cash stock-based compensation expense associated with the Special Option Award and post-IPO options awarded in 2019 and payroll taxes associated with the exercise of such options. During the year ended December 31, 2022, this adjustment also includes $15.0 million of non-cash accelerated stock-based compensation expense and related payroll taxes associated with our retired CEO. During the year ended December 31, 2021, this adjustment also includes $1.7 million of non-cash accelerated stock-based compensation expense and related payroll taxes associated with our former CFO.
(5)Represents unrealized gain or loss recognized on foreign currency forward contracts and foreign exchange gain or loss from the revaluation of cash denominated in a different currency than the entity’s functional currency.
(6)Represents income recognized during the applicable period due to changes in the tax receivable agreement liability recorded in the consolidated statement of financial condition as a result of changes in the mix of earnings, tax legislation and tax rates in various jurisdictions which impacted our tax savings.
(7)Represents corporate income taxes at an assumed effective tax rate of 24.5% applied to Adjusted Net Income before income taxes for the year ended December 31, 2023 and 22% the years ended December 31, 2022 and 2021.
(8)For a summary of the calculation of Adjusted Diluted EPS, see “Reconciliation of Diluted Weighted Average Shares Outstanding to Adjusted Diluted Weighted Average Shares Outstanding and Adjusted Diluted EPS” below.
91
The following table summarizes the calculation of Adjusted Diluted EPS for the years ended December 31, 2023, 2022 and 2021:
| Reconciliation of Diluted Weighted Average Shares Outstanding to Adjusted Diluted Weighted Average Shares Outstanding and Adjusted Diluted EPS | Year Ended | |||||||||||||||||||
| December 31, | ||||||||||||||||||||
| 2023 | 2022 | 2021 | ||||||||||||||||||
Diluted weighted average shares of Class A and Class B common stock outstanding | 212,668,808 | 208,400,040 | 207,254,840 | |||||||||||||||||
Weighted average of other participating securities (1) | 270,249 | 193,441 | — | |||||||||||||||||
Assumed exchange of LLC Interests for shares of Class A or Class B common stock (2) | 23,902,379 | 28,830,686 | 30,699,577 | |||||||||||||||||
Adjusted diluted weighted average shares outstanding | 236,841,436 | 237,424,167 | 237,954,417 | |||||||||||||||||
Adjusted Net Income (in thousands) | $ | 535,515 | $ | 450,080 | $ | 388,985 | ||||||||||||||
Adjusted Diluted EPS | $ | 2.26 | $ | 1.90 | $ | 1.63 | ||||||||||||||
(1)Represents weighted average unvested restricted stock units and unsettled vested performance-based restricted stock units issued to certain retired or terminated employees that are entitled to non-forfeitable dividend equivalent rights and are considered participating securities prior to being issued and outstanding shares of common stock in accordance with the two-class method used for purposes of calculating earnings per share. See Note 2 – Significant Accounting Policies to our audited consolidated financial statements included elsewhere in this Annual Report on Form 10-K for a discussion of the two-class method.
(2)Assumes the full exchange of the weighted average of all outstanding LLC Interests held by non-controlling interests for shares of Class A or Class B common stock, resulting in the elimination of the non-controlling interests and recognition of the net income attributable to non-controlling interests.
Critical Accounting Policies and Estimates
Our consolidated financial statements are prepared in accordance with U.S. GAAP which requires us to make estimates and assumptions about future events that affect the reported amounts of assets, liabilities, revenues and expenses, and disclosure of contingent assets and liabilities. These estimates and assumptions are based on judgment and the best available information at the time. Management bases its estimates on historical experience, observance of trends in particular areas, information available from outside sources and various other assumptions that are believed to be reasonable under the circumstances. Information from these sources form the basis for making judgments about the carrying values of assets and liabilities that may not be readily apparent from other sources. Therefore, actual results could differ materially from those estimates. Management evaluates its accounting policies, estimates and judgments on an on-going basis.
Management evaluated the development and selection of its critical accounting policies and estimates and believes that the following policies are most critical to the portrayal of our financial condition and results of operations, and that require our most difficult, subjective or complex judgments in estimating the effect of inherent uncertainties. Our most critical policies and estimates include business combinations, revenue recognition, stock-based compensation, current and deferred income taxes and the tax receivable agreement liability. With respect to critical accounting policies and estimates, even a relatively minor variance between actual and expected experience can potentially have a materially favorable or unfavorable impact on subsequent results of operations. More information on all of our significant accounting policies can be found in Note 2 – Significant Accounting Policies to our audited consolidated financial statements included elsewhere in this Annual Report on Form 10-K.
Business Combinations
Business combinations are accounted for under the purchase method of accounting pursuant to Accounting Standards Codification (“ASC”) 805, Business Combinations (“ASC 805”). The total cost of an acquisition is allocated to the underlying net assets based on their respective estimated fair values. The excess of the purchase price over the estimated fair values of the net assets acquired is recorded as goodwill. The fair value of assets acquired and liabilities assumed is determined based on assumptions that reasonable market participants would use in the principal (or most advantageous) market for the asset or liability. Determining the fair value of certain assets acquired and liabilities assumed is judgmental in nature and often involves the use of significant estimates and assumptions, including assumptions with respect to future cash flows, discount rates, growth rates, customer attrition rates and asset lives.
The most significant accounting estimate associated with the Yieldbroker Acquisition that closed in August 2023 was the valuation of the acquired definite-lived intangible customer relationship asset (the “Customer Relationships”), which was valued at approximately $39.7 million as of the date of the closing of the acquisition. The majority of the residual total purchase price of $40.3 million, net of cash acquired and prior to working capital and other closing adjustments, was primarily allocated to goodwill, which was measured at approximately $35.3 million as of the date of the closing of the acquisition. We utilized the assistance of a third-party valuation specialist to determine the fair value of the assets acquired and liabilities assumed at the date of the closing of the acquisition. Management is responsible for these valuations and appraisals.
92
The valuation of the Customer Relationships primarily included significant unobservable inputs (Level 3), creating a significant level of estimation uncertainty. Customer Relationships were valued using the income approach, specifically a multi-period excess earnings method. The excess earnings method examines the economic returns contributed by the identified tangible and intangible assets of a company, and then examines the excess return that is attributable to the intangible asset being valued. The discount rate used reflects the amount of risk associated with the hypothetical cash flows for the Customer Relationships relative to the overall business. In developing a discount rate for the Customer Relationships, the Company estimated a weighted-average cost of capital for the overall business and employed an intangible asset risk premium to this rate when discounting the excess earnings related to Customer Relationships. The resulting discounted cash flows were then tax-affected at the applicable statutory rate. For GAAP purposes, the Customer Relationships will be amortized over a useful life of 13 years. Any changes in the discount rate used for valuing the Customer Relationships or the estimated useful life used for amortization purposes could have a material impact on our consolidated statements of financial condition and consolidated statement of income. Any increases or decreases in the allocation of purchase price to Customer Relationships, which is an amortizable asset, would be offset by a corresponding decrease or increase in goodwill, which is an indefinite-lived asset, not subject to amortization and as a result would impact the asset balances recorded on our consolidated statements of financial condition as well as the amortization expense recorded on our consolidated statement of income over the life of the asset. Any changes in the estimated useful life of the Customer Relationships would also impact timing of the reduction of the net balance of intangible assets, net of accumulated amortization on our consolidated statements of financial condition and the timing of the recognition of amortization expense on our consolidated statement of income.
Revenue Recognition
We enter into contracts with our clients to provide a stand-ready connection to our electronic marketplaces, which facilitates the execution of trades by our clients. The access to our electronic marketplaces, including market data and continuous pricing data refreshes and the processing of trades thereon are highly interrelated and are considered a single performance obligation satisfied over time as the client simultaneously receives and consumes the benefit from our performance. This performance obligation constitutes a series of services that are substantially the same in nature and are provided over time using the same measure of progress. For our services, we earn subscription fees for granting access to our electronic marketplaces.
We earn transaction fees and/or commissions from transactions executed on our trading platforms, including commission revenue from electronic and voice brokerage transacted on a riskless principal basis. Riskless principal revenues are derived on matched principal transactions where revenues are earned on the spread between the buy and sell price of the transacted product. Fixed monthly transaction fees or commissions or monthly transaction fee or commission minimums are generally earned on a monthly basis in the period the stand-ready trading services are provided. Variable transaction fee or commission revenue is recognized and recorded on a trade-date basis when the individual trade occurs. Variable discounts or rebates on transaction fees or commissions are generally earned and applied monthly or quarterly, are resolved within the same reporting period and are recorded as a reduction to revenue in the period the relevant trades occur.
We earn fees from LSEG relating to the sale of market data to LSEG, which distributes that data. Included in these fees are real-time market data fees which are recognized monthly on a straight-line basis as Refinitiv receives and consumes the benefit evenly, over the contact period, as the data is provided, and fees for historical data sets which are recognized when the historical data set is provided to Refinitiv.
We are required to make significant judgments for the LSEG market data fees. Significant judgments used in accounting for this contract include the following determinations:
•The provision of real-time market data feeds and historical data sets are distinct performance obligations.
•The performance obligations under this contract are recognized over time from the initial delivery of the data feeds until the end of the contract term or at a point in time upon delivery of each historical data set.
•The transaction prices for the performance obligations were determined by using an adjusted market assessment analysis. Inputs in this analysis included publicly available price lists for data sets provided by other companies, planned internal pricing strategies and other market data points and adjustments obtained through consultations with market data industry experts regarding estimating a standalone selling price for each performance obligation.
During the years ended December 31, 2023, 2022 and 2021, there were no material changes in the methodology or assumptions used to determine the Refinitiv market data fees.
93
Stock-Based Compensation
The stock-based payments received by the employees of the Company are accounted for as equity awards. The Company measures and recognizes the cost of employee services received in exchange for awards of equity instruments based on their estimated fair values measured as of the grant date. For performance-based restricted stock units that vest based on market conditions, the Company recognizes stock-based compensation based on the estimated grant date fair value of the awards computed with the assistance of a valuation specialist using a Monte Carlo simulation on a binomial model, which represents a significant accounting estimate given the significant level of estimation uncertainty relating to the selection of valuation assumptions required for the valuation. The significant assumptions used to estimate the fair value of the performance-based restricted stock units that vest based on market conditions are years of maturity, annualized volatility and the risk-free interest rate. The maturity period represents the period of time that the award granted was modeled into the future, the risk-free interest rate is based on the U.S. Treasury yield curve in effect at the time of measurement corresponding with the maturity period of the award and the expected volatility is based upon historical volatility of the Company’s Class A common stock. On March 15, 2023, we granted 251,113 performance-based restricted stock units that vest based on market conditions with a grant date fair value totaling $24.7 million, which will be amortized into expense on a straight-line basis through December 31, 2025. The significant assumptions used in determining the grant date fair value of the award were a maturity of 2.8 years, annualized volatility of 28.81% and a risk-free interest rate of 3.77%. A change in any of the assumptions used to value these awards could materially affect stock-based compensation expense recorded in the current and future periods.
Income Taxes
Tradeweb Markets Inc. is subject to U.S. federal, state and local income taxes with respect to its taxable income, including its allocable share of any taxable income of TWM LLC, and is taxed at prevailing corporate tax rates. TWM LLC is a multiple member limited liability company taxed as a partnership and accordingly any taxable income generated by TWM LLC is passed through to and included in the taxable income of its members, including to us. TWM LLC records taxes for conducting business in certain state, local and foreign jurisdictions and records U.S. federal taxes for subsidiaries that are taxed as corporations for U.S. tax purposes. We currently record deferred tax assets and liabilities for the expected future tax consequences of temporary differences between the financial reporting and tax bases of assets and liabilities and measure the deferred taxes using the enacted tax rates and laws that will be in effect when such temporary differences are expected to reverse. The measurement of deferred taxes often involves the exercise of significant judgment related to the realization of tax basis. Our deferred tax assets and liabilities reflect our assessment that tax positions taken in filed tax returns and the resulting tax basis are more likely than not to be sustained if they are audited by taxing authorities. Assessing tax rates that we expect to apply and determining the years when the temporary differences are expected to affect taxable income requires judgment about the future apportionment of our income among the jurisdictions in which we operate. Any changes in our practices or judgments involved in the measurement of deferred tax assets and liabilities could materially impact our financial condition or results of operations.
In connection with recording deferred tax assets and liabilities, we record valuation allowances when we believe that it is more likely than not that the Company will not be able to realize its deferred tax assets in the future. We evaluate our deferred tax assets quarterly to determine whether adjustments to our valuation allowance are appropriate in light of changes in facts or circumstances, such as changes in tax law, interactions with taxing authorities and developments in case law. In making this evaluation, we rely on our recent history of pre-tax earnings, our forecasts of future earnings and the nature and timing of future deductions and benefits represented by the deferred tax assets, all of which involve the exercise of significant judgment. As of December 31, 2023 and 2022, we have no valuation allowance established on gross deferred tax assets totaling $687.4 million and $698.1 million, respectively. If forecasts of future earnings and the nature and estimated timing of future deductions and benefits change in the future, we may determine that existing valuation allowances must be revised or new valuation allowances created, any of which could materially impact our financial condition or results of operations. See Note 9 – Income Taxes to our audited consolidated financial statements included elsewhere in this Annual Report on Form 10-K.
We recognize interest and penalties related to unrecognized tax benefits within the provision for income taxes in our consolidated statements of income. Accrued interest and penalties are included within accounts payable, accrued expenses and other liabilities in our consolidated statements of financial condition. A U.S. shareholder of a controlled foreign corporation (“CFC”) is required to include in income, as a deemed dividend, the global intangible low-taxed income (“GILTI”) of the CFC. We have elected to treat taxes due on future U.S. inclusions in taxable income of GILTI as a current period expense when incurred.
94
Tax Receivable Agreement
Tradeweb Markets Inc. entered into a Tax Receivable Agreement with TWM LLC and the Continuing LLC Owners which provides for the payment by Tradeweb Markets Inc. to a Continuing LLC Owner of 50% of the amount of U.S. federal, state and local income or franchise tax savings, if any, that Tradeweb Markets Inc. actually realizes (or in some circumstances is deemed to realize) as a result of (i) increases in the tax basis of TWM LLC’s assets resulting from (a) the purchase of LLC Interests from such Continuing LLC Owner, including with the net proceeds from the IPO, the October 2019 and April 2020 follow-on offerings and any future offering or (b) redemptions or exchanges by such Continuing LLC Owner of LLC Interests for shares of Class A common stock or Class B common stock or for cash, as applicable, and (ii) certain other tax benefits related to Tradeweb Markets Inc. making payments under the Tax Receivable Agreement. Substantially all payments due under the Tax Receivable Agreement are payable over the 15 years following the purchase of LLC Interests from Continuing LLC Owners or redemption or exchanges by Continuing LLC Owners of LLC Interests. The timing of the payments over the 15 year period is dependent upon our annual taxable income over the same period. In determining the estimated timing of payments, the current year’s taxable income is used to extrapolate an estimate of future taxable income. This requires significant judgment relating to projecting future earnings, the geographic mix of those earnings and the timing of deferred taxes becoming current.
The impact of any changes in the total projected obligations recorded under the Tax Receivable Agreement as a result of actual changes in the geographic mix of our earnings, changes in tax legislation and tax rates or other factors that may impact our actual tax savings realized will be reflected in income before taxes in the period in which the change occurs.
Recent Accounting Pronouncements
See Note 2 – Significant Accounting Policies to our audited consolidated financial statements included elsewhere in this Annual Report on Form 10-K for a discussion of recent accounting pronouncements.
ITEM 7A. QUANTITATIVE AND QUALITATIVE DISCLOSURES ABOUT MARKET RISK.
Foreign Currency and Derivative Risk
We have global operations and substantial portions of our revenues, expenses, assets and liabilities are generated and denominated in non-U.S. dollar currencies.
The following table shows the percentage breakdown of our revenue and operating expenses denominated in currencies other than the U.S. dollar for the years ended December 31, 2023, 2022 and 2021:
| Year Ended | ||||||||||||||||||||
| December 31, | ||||||||||||||||||||
| 2023 | 2022 | 2021 | ||||||||||||||||||
% of revenue denominated in foreign currencies (1) | 28% | 28% | 29% | |||||||||||||||||
% of operating expenses denominated in foreign currencies (2) | 16% | 15% | 15% | |||||||||||||||||
(1)Revenue in foreign currencies is primarily denominated in euros.
(2)Operating expenses in foreign currencies are primarily denominated in British pounds sterling.
Revenues, expenses, assets and liabilities denominated in non-functional currencies are recorded in the appropriate functional currency for the legal entity at the rate of exchange prevailing at the transaction date. Monetary assets and liabilities that are denominated in non-functional currencies are then remeasured at the end of each reporting period at the exchange rate prevailing at the end of the reporting period. Foreign currency remeasurement gains or losses on monetary assets and liabilities in nonfunctional currencies are recognized in the consolidated statements of income within general and administrative expenses. Realized and unrealized losses from foreign currency re-measurement of transactions in nonfunctional currencies recognized in the consolidated statements of income within general and administrative expense totaled a loss of $1.6 million, $2.3 million and $4.0 million for the years ended December 31, 2023, 2022 and 2021, respectively.
Since our consolidated financial statements are presented in U.S. dollars, we also translate all non-U.S. dollar functional currency revenues, expenses, assets and liabilities into U.S. dollars. All non-U.S. dollar functional currency revenue and expense amounts are translated into U.S. dollars monthly at the average exchange rate for the month. All non-U.S. dollar functional currency assets and liabilities are translated at the rate prevailing at the end of the reporting period. Gains or losses on translation in the financial statements, when the functional currency is other than the U.S. dollar, are included as a component of other comprehensive income. Accordingly, increases or decreases in the value of the U.S. dollar against the other currencies will affect our operating revenues, operating income and the value of balance sheet items.
95
Aside from U.S. dollars, a significant portion of our revenues are denominated in euros and a significant portion of our expenses are denominated in British pound sterling. The following table shows the average foreign currency exchange rates to the U.S. dollar for the years ended December 31, 2023, 2022 and 2021:
| Year Ended | ||||||||||||||||||||
| December 31, | ||||||||||||||||||||
| 2023 | 2022 | 2021 | ||||||||||||||||||
| Euros | $ | 1.08 | $ | 1.05 | $ | 1.18 | ||||||||||||||
| British pound sterling | $ | 1.24 | $ | 1.24 | $ | 1.38 | ||||||||||||||
The following table shows the change in revenue and operating income caused by fluctuations in foreign currency rates used in translation during the years ended December 31, 2023, 2022 and 2021:
| Year Ended | ||||||||||||||||||||
| Impact of Foreign Currency Rate Fluctuations (amounts in thousands) | December 31, | |||||||||||||||||||
| 2023 | 2022 | 2021 | ||||||||||||||||||
| Increase (decrease) in revenue | $ | 6,300 | $ | (38,300) | $ | 11,300 | ||||||||||||||
| Increase (decrease) in operating income | $ | 6,100 | $ | (26,200) | $ | 5,200 | ||||||||||||||
The following table shows the impact a hypothetical 10% increase or decrease in the U.S. dollar against all other currencies and a hypothetical 10% increase or decrease in only euro or only British pound sterling exchange rates would have on the translation of actual revenue and operating income for the years ended December 31, 2023, 2022 and 2021:
| Year Ended | |||||||||||||||||||||||||||||
| Hypothetical 10% Change in Value of U.S. Dollar (amounts in thousands) | December 31, | ||||||||||||||||||||||||||||
| 2023 | 2022 | 2021 | |||||||||||||||||||||||||||
| All currencies | |||||||||||||||||||||||||||||
| Effect of 10% change on revenue | +/- | $ | 41,800 | +/- | $ | 36,400 | +/- | $ | 34,900 | ||||||||||||||||||||
| Effect of 10% change on operating income | +/- | $ | 27,000 | +/- | $ | 23,800 | +/- | $ | 23,000 | ||||||||||||||||||||
| Euros | |||||||||||||||||||||||||||||
| Effect of 10% change on revenue | +/- | $ | 37,500 | +/- | $ | 33,300 | +/- | $ | 32,000 | ||||||||||||||||||||
| Effect of 10% change on operating income | +/- | $ | 35,600 | +/- | $ | 32,100 | +/- | $ | 31,000 | ||||||||||||||||||||
| British pound sterling | |||||||||||||||||||||||||||||
| Effect of 10% change on revenue | +/- | $ | 1,700 | +/- | $ | 1,400 | +/- | $ | 1,500 | ||||||||||||||||||||
| Effect of 10% change on operating income | +/- | $ | 8,700 | +/- | $ | 8,500 | +/- | $ | 7,700 | ||||||||||||||||||||
We have derivative risk relating to our foreign exchange derivative contracts. We enter into foreign currency forward contracts to mitigate our U.S. dollar and British pound sterling versus euro exposure, generally with a duration of not more than 12 months. In June 2023, we also entered into a foreign currency call option on Australian dollars, in order to partially mitigate the Company’s U.S. dollar versus Australian dollar foreign exchange exposure on the then-anticipated payment of the Australian dollar denominated purchase price for the Yieldbroker Acquisition. The out-of-the-money foreign currency call option was unwound in August 2023 and we recognized losses during the year ended December 31, 2023 totaling $1.3 million relating to this option. We do not use derivative instruments for trading or speculative purposes.
As of December 31, 2023 and 2022, the notional amount of our foreign currency forward contracts was $192.9 million and $162.8 million, respectively. Realized and unrealized gains on foreign currency forward contracts totaled a gain of $0.8 million, $4.9 million and $9.0 million for the years ended December 31, 2023, 2022 and 2021, respectively.
By using derivative instruments to hedge exposures to foreign currency fluctuations, we are exposed to credit risk. Credit risk is the failure of the counterparty to perform under the terms of the derivative contract. When the fair value of a derivative contract is positive, the counterparty owes us, which creates credit risk for us. When the fair value of a derivative contract is negative, we owe the counterparty and, therefore, we are not exposed to the counterparty’s credit risk in those circumstances. We attempt to minimize counterparty credit risk in derivative instruments by entering into transactions with high-quality counterparties whose credit rating is at least upper-medium investment grade. As of December 31, 2023 and 2022, the counterparty on each of the foreign exchange derivative contracts was an affiliate of LSEG.
96
Credit Risk
Cash and cash equivalents includes cash and highly liquid investments held by a limited number of global financial institutions, including cash amounts in excess of federally insured limits. To mitigate this concentration of credit risk, the Company invests through high-credit-quality financial institutions, monitors the concentration of credit exposure of investments with any single obligor and diversifies as determined appropriate.
We have credit risk relating to our receivables, which are primarily receivables from financial institutions, including investment managers and brokers and dealers. As of December 31, 2023 and 2022, the allowance for credit losses with regard to these receivables totaled $0.3 million and $0.1 million, respectively.
In the normal course of our business we, as an agent, execute transactions with, and on behalf of, other brokers and dealers. If these transactions do not settle because of failure to perform by either counterparty, we may be obligated to discharge the obligation of the non-performing party and, as a result, may incur a loss if the market value of the instrument is different than the contractual amount. This credit risk exposure can be directly impacted by volatile trading markets, as our clients may be unable to satisfy their contractual obligations during volatile trading markets.
Our policy is to monitor our market exposure and counterparty risk. Counterparties are evaluated for creditworthiness and risk assessment prior to our initiating contract activities. The counterparties’ creditworthiness is then monitored on an ongoing basis, and credit levels are reviewed to ensure that there is not an inappropriate concentration of credit outstanding to any particular counterparty.
During the year ended December 31, 2022, we also recognized losses totaling $1.0 million, related to the write-off of an investment that was determined to be uncollectible.
97
ITEM 8. FINANCIAL STATEMENTS AND SUPPLEMENTARY DATA.
| Page | |||||
98
REPORT OF INDEPENDENT REGISTERED PUBLIC ACCOUNTING FIRM
To the Stockholders and the Board of Directors of Tradeweb Markets Inc.
Opinion on the Financial Statements
We have audited the accompanying consolidated statements of financial condition of Tradeweb Markets Inc. and subsidiaries (the “Company”) as of December 31, 2023 and 2022, the related consolidated statements of income, comprehensive income, changes in equity, and cash flows, for each of the three years in the period ended December 31, 2023, and the related notes (collectively referred to as the “financial statements”). In our opinion, the financial statements present fairly, in all material respects, the financial position of the Company as of December 31, 2023 and 2022, and the results of its operations and its cash flows for each of the three years in the period ended December 31, 2023, in conformity with accounting principles generally accepted in the United States of America.
We have also audited, in accordance with the standards of the Public Company Accounting Oversight Board (United States) (PCAOB), the Company’s internal control over financial reporting as of December 31, 2023, based on criteria established in Internal Control — Integrated Framework (2013) issued by the Committee of Sponsoring Organizations of the Treadway Commission and our report dated February 9, 2024, expressed an unqualified opinion on the Company’s internal control over financial reporting.
Basis for Opinion
These financial statements are the responsibility of the Company’s management. Our responsibility is to express an opinion on the Company’s financial statements based on our audits. We are a public accounting firm registered with the PCAOB and are required to be independent with respect to the Company in accordance with the U.S. federal securities laws and the applicable rules and regulations of the Securities and Exchange Commission and the PCAOB.
We conducted our audits in accordance with the standards of the PCAOB. Those standards require that we plan and perform the audit to obtain reasonable assurance about whether the financial statements are free of material misstatement, whether due to error or fraud. Our audits included performing procedures to assess the risks of material misstatement of the financial statements, whether due to error or fraud, and performing procedures that respond to those risks. Such procedures included examining, on a test basis, evidence regarding the amounts and disclosures in the financial statements. Our audits also included evaluating the accounting principles used and significant estimates made by management, as well as evaluating the overall presentation of the financial statements. We believe that our audits provide a reasonable basis for our opinion.
Critical Audit Matters
The critical audit matters communicated below are matters arising from the current-period audit of the financial statements that were communicated or required to be communicated to the audit committee and that (1) relate to accounts or disclosures that are material to the financial statements and (2) involved our especially challenging, subjective, or complex judgments. The communication of critical audit matters does not alter in any way our opinion on the financial statements, taken as a whole, and we are not, by communicating the critical audit matters below, providing separate opinions on the critical audit matters or on the accounts or disclosures to which they relate.
Income Taxes - Refer to Note 9 to the financial statements
Critical Audit Matter Description
Tradeweb Markets Inc. (the “Corporation” or the “Company” which refers to Tradeweb Markets Inc. and its consolidated subsidiaries) is subject to U.S. federal, state and local income taxes with respect to its taxable income, including its allocable share of any taxable income of Tradeweb Markets LLC (TWM LLC), and is taxed at prevailing corporate tax rates. TWM LLC is a multiple member limited liability company taxed as a partnership and accordingly, any taxable income generated by TWM LLC is passed through to and included in the taxable income of its members, including the Corporation. The Company has deferred tax assets and liabilities for the expected future tax consequences of temporary differences between financial reporting and tax bases of assets and liabilities. The Company also records uncertain tax positions and recognizes the amount of tax benefit that is more than 50 percent likely to be realized upon ultimate settlement with the related tax authority.
99
Auditing management’s estimates related to income taxes required a high degree of auditor judgment and an increased extent of effort, including the need to involve our income tax specialists, when performing procedures to audit the application of relevant domestic and foreign income tax laws, income allocations and apportionment among the taxing jurisdictions, and the flow-through of earnings to the partners of TWM LLC. Given the Company’s legal structure, the multiple jurisdictions in which the Company files its tax returns, and the breadth of applicable tax laws and regulations, auditing management’s tax balances is complex.
How the Critical Audit Matter Was Addressed in the Audit
Our audit procedures related to income taxes included, among others, the following:
•We tested the effectiveness of controls over income tax balances, including the provision for income taxes, deferred tax assets and liabilities and unrecognized tax benefits.
•With the assistance of our income tax specialists, we assessed the Company’s provision for income taxes by:
◦Evaluating the Company’s income tax provision calculation, including: (1) testing the appropriateness of income tax rates applied by agreeing to applicable Federal and state tax laws, (2) testing the accuracy of income allocations and apportionment among the taxing jurisdictions based on the Company’s structure, source of revenues, and other factors, (3) testing, on a sample basis, the completeness and accuracy of book to tax differences, and (4) testing the mathematical accuracy of the income tax provision calculation.
◦Evaluating the Company’s analyses supporting its conclusions, in the context of the Company’s specific structure, as to the recognition and measurement of deferred tax assets and liabilities, including the calculation of the deferred tax asset related to the tax basis step-up received in connection with the Company’s equity public offerings. We considered whether permanent and temporary differences had been appropriately identified by evaluating the Company’s trial balance and transactions and applying tax specialist’s knowledge of tax laws and the Company’s business. We also tested that the tax rates used to measure the deferred tax assets and liabilities were appropriate in accordance with Federal and state tax laws.
◦Evaluating both positive and negative evidence in management’s assessment of the Company’s ability to utilize the deferred tax assets in future years to conclude if it is appropriate to continue to recognize a deferred tax asset.
◦Evaluating the appropriateness of the recognition, measurement and accuracy of the Company’s unrecognized tax benefits (“UTB”) to determine if they have been correctly recognized if they meet the “more likely than not threshold” to be realized.
Tax Receivable Agreement Liability – Refer to Note 10 to the financial statements
Critical Audit Matter Description
In connection with the Company’s Reorganization Transactions, the Corporation entered into a Tax Receivable Agreement between the Company and former and continuing owners of Tradeweb Markets LLC (Continuing LLC Owner) which provides for the payment by the Corporation to a Continuing LLC Owner of 50% of the amount of U.S. federal, state and local income or franchise tax savings, if any, realized due to tax benefits resulting from the Reorganization Transaction. The Corporation accounts for the income tax effects resulting from taxable redemptions or exchanges of LLC Interests by the Continuing LLC Owners for shares of Class A common stock or Class B common stock or cash, as the case may be, and purchases by the Corporation of LLC Interests from the Continuing LLC Owners by recognizing a change to its Tax Receivable Agreement liability, reflecting the amount expected to be due to Continuing LLC Owners, discounted at present value.
In addition, the Corporation recognizes a change in the Corporation’s tax basis in its LLC interest (i.e., “tax basis step up”). The tax basis step up, in turn, results in a change to the Corporation’s deferred tax assets, based on enacted tax rates at the date of each redemption or exchange. The impact of any changes in the projected obligations under the Tax Receivable Agreement for the tax basis step up as a result of changes in the geographic mix of the Company’s earnings, changes in tax legislation and tax rates or other factors that may impact the Corporation’s tax savings will be reflected in income before taxes on the statement of income in the period in which the change occurs.
100
Given the complexity of the calculation and high volume of inputs used to estimate the Tax Receivable Agreement liability and related deferred tax assets, performing audit procedures to evaluate the accuracy of the calculation and appropriateness of the inputs required a high degree of auditor judgment and an increased extent of effort, including the need to involve our income tax specialists who possess significant tax regulation and Tax Receivable Agreement calculation expertise.
How the Critical Audit Matter Was Addressed in the Audit
Our audit procedures related to the Tax Receivable Agreement liability included, among others, the following:
•We tested the effectiveness of the controls established by the Company around the Tax Receivable Agreement liability and related deferred tax assets.
•With the assistance of our income tax specialists, we evaluated:
◦the impact of partnership exchange transactions on the computation of the Tax Receivable Agreement liability.
◦whether the sources of management’s estimated taxable income were of the appropriate character and sufficient to utilize the deferred tax assets and result in cash tax savings under the relevant tax laws.
◦the appropriateness of the tax rates, interest rates and tax amortization utilized in the determination of the Tax Receivable Agreement liability, by agreeing to the terms in the Tax Receivable Agreement and applicable Federal and state tax laws.
◦the reasonableness of the methods, inputs, and assumptions used by management to determine the Tax Receivable Agreement liability. We performed testing, on a sample basis, on contributions, distributions, and tax basis amounts and calculations related to the step-up in basis.
◦the mathematical accuracy of the Tax Receivable Agreement liability calculation and cash payments.
/s/ Deloitte & Touche LLP
February 9, 2024
We have served as the Company’s auditor since 2018.
101
REPORT OF INDEPENDENT REGISTERED PUBLIC ACCOUNTING FIRM
To the Stockholders and the Board of Directors of Tradeweb Markets Inc.
Opinion on Internal Control over Financial Reporting
We have audited the internal control over financial reporting of Tradeweb Markets Inc. and subsidiaries (the “Company”) as of December 31, 2023, based on criteria established in Internal Control — Integrated Framework (2013) issued by the Committee of Sponsoring Organizations of the Treadway Commission (COSO). In our opinion, the Company maintained, in all material respects, effective internal control over financial reporting as of December 31, 2023, based on criteria established in Internal Control — Integrated Framework (2013) issued by COSO.
We have also audited, in accordance with the standards of the Public Company Accounting Oversight Board (United States) (PCAOB), the consolidated financial statements as of and for the year ended December 31, 2023, of the Company and our report dated February 9, 2024, expressed an unqualified opinion on those financial statements.
Basis for Opinion
The Company’s management is responsible for maintaining effective internal control over financial reporting and for its assessment of the effectiveness of internal control over financial reporting, included in the accompanying Management’s Report on Internal Control over Financial Reporting. Our responsibility is to express an opinion on the Company’s internal control over financial reporting based on our audit. We are a public accounting firm registered with the PCAOB and are required to be independent with respect to the Company in accordance with the U.S. federal securities laws and the applicable rules and regulations of the Securities and Exchange Commission and the PCAOB.
We conducted our audit in accordance with the standards of the PCAOB. Those standards require that we plan and perform the audit to obtain reasonable assurance about whether effective internal control over financial reporting was maintained in all material respects. Our audit included obtaining an understanding of internal control over financial reporting, assessing the risk that a material weakness exists, testing and evaluating the design and operating effectiveness of internal control based on the assessed risk, and performing such other procedures as we considered necessary in the circumstances. We believe that our audit provides a reasonable basis for our opinion.
Definition and Limitations of Internal Control over Financial Reporting
A company’s internal control over financial reporting is a process designed to provide reasonable assurance regarding the reliability of financial reporting and the preparation of financial statements for external purposes in accordance with generally accepted accounting principles. A company’s internal control over financial reporting includes those policies and procedures that (1) pertain to the maintenance of records that, in reasonable detail, accurately and fairly reflect the transactions and dispositions of the assets of the company; (2) provide reasonable assurance that transactions are recorded as necessary to permit preparation of financial statements in accordance with generally accepted accounting principles, and that receipts and expenditures of the company are being made only in accordance with authorizations of management and directors of the company; and (3) provide reasonable assurance regarding prevention or timely detection of unauthorized acquisition, use, or disposition of the company’s assets that could have a material effect on the financial statements.
Because of its inherent limitations, internal control over financial reporting may not prevent or detect misstatements. Also, projections of any evaluation of effectiveness to future periods are subject to the risk that controls may become inadequate because of changes in conditions, or that the degree of compliance with the policies or procedures may deteriorate.
/s/ Deloitte & Touche LLP
February 9, 2024
102
Tradeweb Markets Inc. and Subsidiaries
Consolidated Statements of Financial Condition
(in thousands, except share and per share amounts)
| December 31, | ||||||||||||||
| 2023 | 2022 | |||||||||||||
Assets | ||||||||||||||
| Cash and cash equivalents | $ | $ | ||||||||||||
| Restricted cash | ||||||||||||||
| Receivable from brokers and dealers and clearing organizations | ||||||||||||||
| Deposits with clearing organizations | ||||||||||||||
Accounts receivable, net of allowance for credit losses of $ | ||||||||||||||
| Furniture, equipment, purchased software and leasehold improvements, net of accumulated depreciation and amortization | ||||||||||||||
| Lease right-of-use assets | ||||||||||||||
| Software development costs, net of accumulated amortization | ||||||||||||||
| Goodwill | ||||||||||||||
| Intangible assets, net of accumulated amortization | ||||||||||||||
| Receivable and due from affiliates | ||||||||||||||
| Deferred tax asset | ||||||||||||||
| Other assets | ||||||||||||||
| Total assets | $ | $ | ||||||||||||
| Liabilities and Equity | ||||||||||||||
| Liabilities | ||||||||||||||
| Securities sold under agreements to repurchase | $ | $ | ||||||||||||
| Payable to brokers and dealers and clearing organizations | ||||||||||||||
| Accrued compensation | ||||||||||||||
| Deferred revenue | ||||||||||||||
| Accounts payable, accrued expenses and other liabilities | ||||||||||||||
| Lease liabilities | ||||||||||||||
| Payable and due to affiliates | ||||||||||||||
| Deferred tax liability | ||||||||||||||
| Tax receivable agreement liability | ||||||||||||||
| Total liabilities | ||||||||||||||
Commitments and contingencies (Note 17) | ||||||||||||||
Preferred stock, $ | ||||||||||||||
Class A common stock, $ | ||||||||||||||
Class B common stock, $ | ||||||||||||||
Class C common stock, $ | ||||||||||||||
Class D common stock, $ | ||||||||||||||
| Additional paid-in capital | ||||||||||||||
| Accumulated other comprehensive income (loss) | ( | ( | ||||||||||||
| Retained earnings | ||||||||||||||
| Total stockholders’ equity attributable to Tradeweb Markets Inc. | ||||||||||||||
| Non-controlling interests | ||||||||||||||
| Total equity | ||||||||||||||
| Total liabilities and equity | $ | $ | ||||||||||||
The accompanying notes are an integral part of these consolidated financial statements.
103
Tradeweb Markets Inc. and Subsidiaries
Consolidated Statements of Income
(in thousands, except share and per share amounts)
| Year Ended | ||||||||||||||||||||
| December 31, | ||||||||||||||||||||
| 2023 | 2022 | 2021 | ||||||||||||||||||
| Revenues | ||||||||||||||||||||
| Transaction fees and commissions | $ | $ | $ | |||||||||||||||||
| Subscription fees | ||||||||||||||||||||
| LSEG market data fees | ||||||||||||||||||||
| Other | ||||||||||||||||||||
| Total revenue | ||||||||||||||||||||
| Expenses | ||||||||||||||||||||
| Employee compensation and benefits | ||||||||||||||||||||
| Depreciation and amortization | ||||||||||||||||||||
| Technology and communications | ||||||||||||||||||||
| General and administrative | ||||||||||||||||||||
| Professional fees | ||||||||||||||||||||
| Occupancy | ||||||||||||||||||||
| Total expenses | ||||||||||||||||||||
| Operating income | ||||||||||||||||||||
Tax receivable agreement liability adjustment (1) | ( | |||||||||||||||||||
| Net interest income (expense) | ( | |||||||||||||||||||
| Other income (loss), net | ( | ( | ||||||||||||||||||
| Income before taxes | ||||||||||||||||||||
| Provision for income taxes | ( | ( | ( | |||||||||||||||||
| Net income | ||||||||||||||||||||
| Less: Net income attributable to non-controlling interests | ||||||||||||||||||||
| Net income attributable to Tradeweb Markets Inc. | $ | $ | $ | |||||||||||||||||
| Earnings per share attributable to Tradeweb Markets Inc. Class A and B common stockholders: | ||||||||||||||||||||
| Basic | $ | $ | $ | |||||||||||||||||
| Diluted | $ | $ | $ | |||||||||||||||||
| Weighted average shares outstanding: | ||||||||||||||||||||
| Basic | ||||||||||||||||||||
| Diluted | ||||||||||||||||||||
(1)See Note 10 – Tax Receivable Agreement.
The accompanying notes are an integral part of these consolidated financial statements.
104
Tradeweb Markets Inc. and Subsidiaries
Consolidated Statements of Comprehensive Income
(in thousands)
| Year Ended | ||||||||||||||||||||
| December 31, | ||||||||||||||||||||
| 2023 | 2022 | 2021 | ||||||||||||||||||
| Net income | $ | $ | $ | |||||||||||||||||
| Other comprehensive income (loss), net of tax: | ||||||||||||||||||||
Foreign currency translation adjustments, with | ( | ( | ||||||||||||||||||
| Other comprehensive income (loss), net of tax | ( | ( | ||||||||||||||||||
| Comprehensive income | ||||||||||||||||||||
| Less: Net income attributable to non-controlling interests | ||||||||||||||||||||
| Less: Foreign currency translation adjustments attributable to non-controlling interests | ( | ( | ||||||||||||||||||
| Comprehensive income attributable to Tradeweb Markets Inc. | $ | $ | $ | |||||||||||||||||
The accompanying notes are an integral part of these consolidated financial statements.
105
Tradeweb Markets Inc. and Subsidiaries
Consolidated Statements of Changes in Equity
(in thousands, except share and per share amounts)
| Tradeweb Markets Inc. Stockholders’ Equity | ||||||||||||||||||||||||||||||||||||||||||||||||||||||||
| Par Value | ||||||||||||||||||||||||||||||||||||||||||||||||||||||||
| Class A Common Stock | Class B Common Stock | Class C Common Stock | Class D Common Stock | Additional Paid-In Capital | Accumulated Other Comprehensive Income (Loss) | Retained Earnings | Non- Controlling Interests | Total Equity | ||||||||||||||||||||||||||||||||||||||||||||||||
| Balance at December 31, 2020 | $ | $ | $ | $ | $ | $ | $ | $ | $ | |||||||||||||||||||||||||||||||||||||||||||||||
| Issuance of common stock from equity incentive plans | — | — | — | — | — | — | ||||||||||||||||||||||||||||||||||||||||||||||||||
| Share repurchases pursuant to share repurchase programs | — | — | — | — | — | — | ( | — | ( | |||||||||||||||||||||||||||||||||||||||||||||||
| Tax receivable agreement liability and deferred taxes arising from LLC Interest ownership exchanges and the issuance of common stock from equity incentive plans | — | — | — | — | — | — | — | |||||||||||||||||||||||||||||||||||||||||||||||||
| Adjustments to non-controlling interests | — | — | — | — | — | ( | ||||||||||||||||||||||||||||||||||||||||||||||||||
| Distributions to non-controlling interests | — | — | — | — | — | — | — | ( | ( | |||||||||||||||||||||||||||||||||||||||||||||||
Dividends ($ | — | — | — | — | — | — | ( | — | ( | |||||||||||||||||||||||||||||||||||||||||||||||
| Stock-based compensation expense | — | — | — | — | — | — | — | |||||||||||||||||||||||||||||||||||||||||||||||||
| Payroll taxes paid for stock-based compensation | — | — | — | — | ( | — | — | — | ( | |||||||||||||||||||||||||||||||||||||||||||||||
| Net income | — | — | — | — | — | — | ||||||||||||||||||||||||||||||||||||||||||||||||||
| Foreign currency translation adjustments | — | — | — | — | — | ( | — | ( | ( | |||||||||||||||||||||||||||||||||||||||||||||||
| Other - See Note 14 | — | — | — | — | — | — | — | |||||||||||||||||||||||||||||||||||||||||||||||||
| Balance at December 31, 2021 | $ | $ | $ | $ | $ | $ | $ | $ | $ | |||||||||||||||||||||||||||||||||||||||||||||||
| Issuance of common stock from equity incentive plans | — | — | — | — | — | — | ||||||||||||||||||||||||||||||||||||||||||||||||||
| Share repurchases pursuant to share repurchase programs | — | — | — | — | — | ( | — | ( | ||||||||||||||||||||||||||||||||||||||||||||||||
| Tax receivable agreement liability and deferred taxes arising from LLC Interest ownership exchanges and the issuance of common stock from equity incentive plans | — | — | — | — | — | — | ||||||||||||||||||||||||||||||||||||||||||||||||||
| Adjustments to non-controlling interests | — | — | — | — | ( | — | ( | |||||||||||||||||||||||||||||||||||||||||||||||||
| Distributions to non-controlling interests | — | — | — | — | — | — | — | ( | ( | |||||||||||||||||||||||||||||||||||||||||||||||
Dividends ($ | — | — | — | — | — | — | ( | — | ( | |||||||||||||||||||||||||||||||||||||||||||||||
| Stock-based compensation expense | — | — | — | — | — | — | — | |||||||||||||||||||||||||||||||||||||||||||||||||
| Payroll taxes paid for stock-based compensation | — | — | — | — | ( | — | — | — | ( | |||||||||||||||||||||||||||||||||||||||||||||||
| Net income | — | — | — | — | — | — | ||||||||||||||||||||||||||||||||||||||||||||||||||
| Foreign currency translation adjustments | — | — | — | — | — | ( | — | ( | ( | |||||||||||||||||||||||||||||||||||||||||||||||
| Other - See Note 14 | — | — | — | — | — | — | — | |||||||||||||||||||||||||||||||||||||||||||||||||
| Balance at December 31, 2022 | $ | $ | $ | $ | $ | $ | ( | $ | $ | $ | ||||||||||||||||||||||||||||||||||||||||||||||
| Issuance of common stock from equity incentive plans | — | — | — | — | — | — | — | |||||||||||||||||||||||||||||||||||||||||||||||||
| Share repurchases pursuant to the share repurchase programs | — | — | — | — | — | — | ( | — | ( | |||||||||||||||||||||||||||||||||||||||||||||||
| Tax receivable agreement liability and deferred taxes arising from LLC Interest ownership exchanges and the issuance of common stock from equity incentive plans | — | — | — | — | — | — | — | |||||||||||||||||||||||||||||||||||||||||||||||||
| Adjustments to non-controlling interests | — | — | — | — | ( | — | ( | |||||||||||||||||||||||||||||||||||||||||||||||||
| Distributions to non-controlling interests | — | — | — | — | — | — | — | ( | ( | |||||||||||||||||||||||||||||||||||||||||||||||
Dividends ($ | — | — | — | — | — | — | ( | — | ( | |||||||||||||||||||||||||||||||||||||||||||||||
| Stock-based compensation expense | — | — | — | — | — | — | — | |||||||||||||||||||||||||||||||||||||||||||||||||
| Payroll taxes paid for stock-based compensation | — | — | — | — | ( | — | — | — | ( | |||||||||||||||||||||||||||||||||||||||||||||||
| Net income | — | — | — | — | — | — | ||||||||||||||||||||||||||||||||||||||||||||||||||
| Foreign currency translation adjustments | — | — | — | — | — | — | ||||||||||||||||||||||||||||||||||||||||||||||||||
| Balance at December 31, 2023 | $ | $ | $ | $ | $ | $ | ( | $ | $ | $ | ||||||||||||||||||||||||||||||||||||||||||||||
The accompanying notes are an integral part of these consolidated financial statements.
106
Tradeweb Markets Inc. and Subsidiaries
Consolidated Statements of Cash Flows
(in thousands)
| Year Ended | ||||||||||||||||||||
| December 31, | ||||||||||||||||||||
| 2023 | 2022 | 2021 | ||||||||||||||||||
| Cash flows from operating activities | ||||||||||||||||||||
| Net income | $ | $ | $ | |||||||||||||||||
| Adjustments to reconcile net income to net cash provided by (used in) operating activities: | ||||||||||||||||||||
| Depreciation and amortization | ||||||||||||||||||||
| Stock-based compensation expense | ||||||||||||||||||||
| Deferred taxes | ||||||||||||||||||||
| Tax receivable agreement liability adjustment | ( | ( | ||||||||||||||||||
| Other (income) loss, net | ||||||||||||||||||||
| (Increase) decrease in operating assets: | ||||||||||||||||||||
| Receivable from/payable to brokers and dealers and clearing organizations, net | ( | ( | ||||||||||||||||||
| Deposits with clearing organizations | ( | ( | ||||||||||||||||||
| Accounts receivable | ( | ( | ( | |||||||||||||||||
| Receivable and due from affiliates/payable and due to affiliates, net | ( | ( | ||||||||||||||||||
| Other assets | ( | ( | ||||||||||||||||||
| Increase (decrease) in operating liabilities: | ||||||||||||||||||||
| Securities sold under agreements to repurchase | ||||||||||||||||||||
| Accrued compensation | ( | |||||||||||||||||||
| Deferred revenue | ( | |||||||||||||||||||
| Accounts payable, accrued expenses and other liabilities | ( | |||||||||||||||||||
| Employee equity compensation payable | ( | |||||||||||||||||||
| Net cash provided by operating activities | ||||||||||||||||||||
| Cash flows from investing activities | ||||||||||||||||||||
| Cash paid for acquisitions, net of cash acquired | ( | ( | ||||||||||||||||||
| Cash paid for foreign currency call option, net of sale proceeds | ( | |||||||||||||||||||
| Purchases of furniture, equipment, software and leasehold improvements | ( | ( | ( | |||||||||||||||||
| Capitalized software development costs | ( | ( | ( | |||||||||||||||||
| Net cash used in investing activities | ( | ( | ( | |||||||||||||||||
| Cash flows from financing activities | ||||||||||||||||||||
| Share repurchases pursuant to share repurchase programs | ( | ( | ( | |||||||||||||||||
| Proceeds from stock-based compensation exercises | ||||||||||||||||||||
| Deferred financing costs | ( | |||||||||||||||||||
| Dividends | ( | ( | ( | |||||||||||||||||
| Distributions to non-controlling interests | ( | ( | ( | |||||||||||||||||
| Payroll taxes paid for stock-based compensation | ( | ( | ( | |||||||||||||||||
| Payments on tax receivable agreement liability | ( | ( | ( | |||||||||||||||||
| Net cash used in financing activities | ( | ( | ( | |||||||||||||||||
| Effect of exchange rate changes on cash, cash equivalents and restricted cash | ( | ( | ||||||||||||||||||
| Net increase (decrease) in cash, cash equivalents and restricted cash | ||||||||||||||||||||
| Cash, cash equivalents and restricted cash | ||||||||||||||||||||
| Beginning of period | ||||||||||||||||||||
| End of period | $ | $ | $ | |||||||||||||||||
The accompanying notes are an integral part of these consolidated financial statements.
107
Tradeweb Markets Inc. and Subsidiaries
Consolidated Statements of Cash Flows - (Continued)
(in thousands)
| Year Ended | ||||||||||||||||||||
| December 31, | ||||||||||||||||||||
| 2023 | 2022 | 2021 | ||||||||||||||||||
| Supplemental disclosure of cash flow information: | ||||||||||||||||||||
| Income taxes paid, net of (refunds) | $ | $ | $ | |||||||||||||||||
| Non-cash investing and financing activities: | ||||||||||||||||||||
| Furniture, equipment, software and leasehold improvement additions included in accounts payable | $ | $ | $ | |||||||||||||||||
| Withholding taxes payable relating to stock-based compensation settlements included in accrued compensation | $ | $ | $ | |||||||||||||||||
| Lease right-of-use assets obtained in exchange for lease liabilities, net of modifications and terminations | $ | $ | $ | ( | ||||||||||||||||
| Stock-based compensation expense capitalized to software development costs | $ | $ | $ | |||||||||||||||||
| Items arising from follow-on offering and other LLC Interest ownership changes: | ||||||||||||||||||||
| Establishment of liabilities under Tax Receivable Agreement | $ | $ | $ | |||||||||||||||||
| Deferred tax asset | $ | $ | $ | |||||||||||||||||
| Other - See Note 14 | $ | $ | $ | |||||||||||||||||
| Reconciliation of cash, cash equivalents and restricted cash as shown on the statements of financial condition: | December 31, | |||||||||||||||||||
| 2023 | 2022 | 2021 | ||||||||||||||||||
| Cash and cash equivalents | $ | $ | $ | |||||||||||||||||
| Restricted cash | ||||||||||||||||||||
| Cash, cash equivalents and restricted cash shown in the statement of cash flows | $ | $ | $ | |||||||||||||||||
The accompanying notes are an integral part of these consolidated financial statements.
108
Notes to Consolidated Financial Statements
109
Tradeweb Markets Inc. and Subsidiaries
Notes to Consolidated Financial Statements
1. Organization
Tradeweb Markets Inc. (the “Corporation”) was incorporated as a Delaware corporation on November 7, 2018 to carry on the business of Tradeweb Markets LLC (“TWM LLC”) following the completion of a series of reorganization transactions on April 4, 2019 (the “Reorganization Transactions”), in connection with Tradeweb Markets Inc.’s initial public offering (the “IPO”), which closed on April 8, 2019. Following the Reorganization Transactions, Refinitiv (as defined below) owned an indirect majority ownership interest in the Company (as defined below).
On January 29, 2021, London Stock Exchange Group plc (“LSEG”) completed its acquisition of the Refinitiv business (currently referred to by LSEG as LSEG Data & Analytics) from a consortium, including certain investment funds affiliated with The Blackstone Group Inc. (f/k/a The Blackstone Group L.P.) (“Blackstone”) as well as Thomson Reuters Corporation (“TR”), in an all share transaction (the “LSEG Transaction”).
In connection with the LSEG Transaction, the Corporation became a consolidating subsidiary of LSEG. Prior to the LSEG Transaction, the Corporation was a consolidating subsidiary of BCP York Holdings (“BCP”), a company owned by certain investment funds affiliated with Blackstone, through BCP’s previous majority ownership interest in Refinitiv. As used herein, “Refinitiv,” prior to the LSEG Transaction, means Refinitiv Holdings Limited, and unless otherwise stated or the context otherwise requires, all of its direct and indirect subsidiaries, and subsequent to the LSEG Transaction, refers to Refinitiv Parent Limited, and unless otherwise stated or the context otherwise requires, all of its subsidiaries. Refinitiv owns substantially all of the former financial and risk business of Thomson Reuters (as defined below), including, prior to and following the completion of the Reorganization Transactions, an indirect majority ownership interest in the Company.
The Corporation is a holding company whose principal asset is LLC Interests (as defined below) of TWM LLC. As the sole manager of TWM LLC, the Corporation operates and controls all of the business and affairs of TWM LLC and, through TWM LLC and its subsidiaries, conducts the Corporation’s business. As a result of this control, and because the Corporation has a substantial financial interest in TWM LLC, the Corporation consolidates the financial results of TWM LLC and reports a non-controlling interest in the Corporation’s consolidated financial statements. As of December 31, 2023, Tradeweb Markets Inc. owns 90.2 % of TWM LLC and the non-controlling interest holders own the remaining 9.8 % of TWM LLC. As of December 31, 2022, Tradeweb Markets Inc. owned 88.7 % of TWM LLC and the non-controlling interest holders owned the remaining 11.3 % of TWM LLC.
Unless the context otherwise requires, references to the “Company” refer to Tradeweb Markets Inc. and its consolidated subsidiaries, including TWM LLC, following the completion of the Reorganization Transactions, and TWM LLC and its consolidated subsidiaries prior to the completion of the Reorganization Transactions.
The Company is a leader in building and operating electronic marketplaces for a global network of clients across the institutional, wholesale and retail client sectors. The Company’s principal subsidiaries include:
•Tradeweb LLC (“TWL”), a registered broker-dealer under the Securities Exchange Act of 1934, as amended (the “Exchange Act”), a member of the Financial Industry Regulatory Authority (“FINRA”), a member of the Municipal Securities Rulemaking Board (“MSRB”), a registered independent introducing broker with the Commodities Future Trading Commission (“CFTC”) and a member of the National Futures Association (“NFA”).
•Dealerweb Inc. (“DW”) (formerly known as Hilliard Farber & Co., Inc.), a registered broker-dealer under the Exchange Act and a member of FINRA and MSRB. DW is also registered as an introducing broker with the CFTC and a member of the NFA.
•Tradeweb Direct LLC (“TWD”) (formerly known as BondDesk Trading LLC), a registered broker-dealer under the Exchange Act and a member of FINRA and MSRB.
•Tradeweb Europe Limited (“TEL”), a MiFID Investment Firm regulated by the Financial Conduct Authority (the “FCA”) in the UK and certain other global regulators and that maintains branches in Asia.
•TW SEF LLC (“TW SEF”), a Swap Execution Facility (“SEF”) regulated by the CFTC and certain other global regulators.
•DW SEF LLC (“DW SEF”), a SEF regulated by the CFTC and certain other global regulators.
110
•Tradeweb Japan K.K. (“TWJ”), a security house regulated by the Japanese Financial Services Agency (“JFSA”) and the Japan Securities Dealers Association (“JSDA”).
•Tradeweb EU B.V. (“TWEU”), a MiFID Investment Firm regulated by the Netherlands Authority for the Financial Markets (“AFM”), the De Nederlandsche Bank (“DNB”) and certain other global regulators and that maintains a branch in France.
•Tradeweb Execution Services Limited (“TESL”), an Investment Firm (“BIPRU Firm”) regulated by the FCA in the UK.
•Tradeweb Information Technology Services (Shanghai) Co., Ltd is a wholly-owned foreign enterprise (WOFE) in China. Its business scope includes information, data and technology related services including development, sales, import and export and consulting. The Tradeweb offshore electronic trading platform is recognized by the People’s Bank of China (“PBOC”) for the provision of Bond Connect, CIBM Direct RFQ and Swap Connect.
•Tradeweb Execution Services B.V. (“TESBV”), a MiFID Investment Firm authorized and regulated by the AFM, with permission to trade on a matched principal basis.
•Tradeweb Australia Pty Ltd (formerly Yieldbroker Pty Limited) (“YB” or “Yieldbroker”), acquired in August 2023, a Tier 1 Australian Markets Licensee in Australia, regulated by the Australian Securities & Investments Commission (“ASIC”), that maintains a branch in Singapore that is regulated by the Monetary Authority of Singapore (“MAS”) as a Regulated Market Operator. Tradeweb Australia Pty Ltd changed its name from Yieldbroker Pty Limited in January 2024.
•Tradeweb (DIFC) Limited (“TDIFC”) is an Authorized Firm regulated by the Dubai Financial Services Authority (“DFSA”) with a license for “arranging deals in investments” for users to access the Company’s various trading venues that are also separately recognized by the DFSA.
In May 2023, the Company announced that it had entered into a definitive agreement to acquire all of the outstanding equity interests of Yieldbroker. Yieldbroker is a leading Australian trading platform for Australian and New Zealand government bonds and interest rate derivatives covering the institutional and wholesale client sectors. This acquisition combines Australia and New Zealand’s growing fixed income markets with Tradeweb’s international reach and scale. The A$123.6 million, all-cash transaction closed on August 31, 2023 (the “Yieldbroker Acquisition”), following the satisfaction of closing conditions and regulatory reviews. See Note 4 – Acquisitions for additional details on this acquisition.
In June 2021, the Company acquired Nasdaq’s U.S. fixed income electronic trading platform, formerly known as eSpeed (the “NFI Acquisition”), which is a fully executable central limit order book (CLOB) for electronic trading in on-the-run (OTR) U.S. government bonds. The NFI Acquisition included the acquisition of Execution Access, LLC, (“EA”), a registered broker-dealer under the Exchange Act and a member of FINRA. In November 2022, EA merged with and into DW with DW being the surviving entity.
A majority interest of Refinitiv (formerly the Thomson Reuters Financial & Risk Business) was acquired by BCP on October 1, 2018 (the “Refinitiv Transaction”) from TR. The Refinitiv Transaction resulted in a new basis of accounting for certain of the Company’s assets and liabilities beginning on October 1, 2018. See Note 2 – Significant Accounting Policies for a description of pushdown accounting applied as a result of the Refinitiv Transaction.
In connection with the Reorganization Transactions, TWM LLC’s limited liability company agreement (the “TWM LLC Agreement”) was amended and restated to, among other things, (i) provide for a new single class of common membership interests in TWM LLC (the “LLC Interests”), (ii) exchange all of the then existing membership interests in TWM LLC for LLC Interests and (iii) appoint the Corporation as the sole manager of TWM LLC. LLC Interests, other than those held by the Corporation, are redeemable or exchangeable in accordance with the TWM LLC Agreement for shares of Class A common stock, par value $0.00001 per share, of the Corporation (the “Class A common stock”) or Class B common stock, par value $0.00001 per share, of the Corporation (the “Class B common stock”), as the case may be, on a one -for-one basis.
111
As used herein, references to “Continuing LLC Owners” refer collectively to (i) those owners of TWM LLC prior to the Reorganization Transactions (the “Original LLC Owners”), including an indirect subsidiary of Refinitiv, certain investment and commercial banks (collectively, the “Bank Stockholders”), and members of management, that continued to own LLC Interests after the completion of the IPO and Reorganization Transactions and that received shares of Class C common stock, par value $0.00001 per share, of the Corporation (the “Class C common stock”), shares of Class D common stock, par value $0.00001 per share, of the Corporation (the “Class D common stock”) or a combination of both, as the case may be, in connection with the completion of the Reorganization Transactions, (ii) any subsequent transferee of any Original LLC Owner that has executed a joinder agreement to the TWM LLC Agreement and (iii) solely with respect to the Tax Receivable Agreement (as defined in Note 10 – Tax Receivable Agreement), (x) those Original LLC Owners, including certain of the Bank Stockholders, that disposed of all of their LLC Interests for cash in connection with the IPO and (y) any party that has executed a joinder agreement to the Tax Receivable Agreement in accordance with the Tax Receivable Agreement.
As of December 31, 2023:
•The public investors collectively owned 115,090,787 shares of Class A common stock, representing 10.0 % of the combined voting power of Tradeweb Markets Inc.’s issued and outstanding common stock and indirectly, through Tradeweb Markets Inc., owned 49.0 % of the economic interest in TWM LLC;
•Refinitiv collectively owned 96,933,192 shares of Class B common stock, 18,000,000 shares of Class C common stock and 4,988,329 shares of Class D common stock, representing 89.9 % of the combined voting power of Tradeweb Markets Inc.’s issued and outstanding common stock and directly and indirectly, through Tradeweb Markets Inc., owned 51.0 % of the economic interest in TWM LLC; and
•Other stockholders that continued to own LLC Interests also collectively owned 89,644 shares of Class D common stock, representing 0.1 % of the combined voting power of Tradeweb Markets Inc.’s issued and outstanding common stock. Collectively, these stockholders directly owned less than 0.1 % of the economic interest in TWM LLC.
In addition, for the year ended December 31, 2023, the Company’s basic and diluted earnings per share calculations were impacted by 270,249 of weighted average shares resulting from unvested restricted stock units and unsettled vested performance-based restricted stock units that were considered participating securities for purposes of calculating earnings per share in accordance with the two-class method. For the year ended December 31, 2023 the Company’s diluted earnings per share calculation also includes 1,872,006 of weighted average shares resulting from the dilutive effect of its equity incentive plans. See Note 18 – Earnings Per Share for additional details.
2. Significant Accounting Policies
The following is a summary of significant accounting policies:
Basis of Presentation
The consolidated financial statements have been presented in conformity with accounting principles generally accepted in the United States of America (“GAAP” or “U.S. GAAP”). The consolidated financial statements include the accounts of the Company and its subsidiaries. All intercompany transactions and balances have been eliminated in consolidation. As discussed in Note 1 – Organization, as a result of the Reorganization Transactions, Tradeweb Markets Inc. consolidates TWM LLC and its subsidiaries and TWM LLC is considered to be the predecessor to Tradeweb Markets Inc. for financial reporting purposes. Tradeweb Markets Inc. had no business transactions or activities and no substantial assets or liabilities prior to the Reorganization Transactions. The consolidated financial statements represent the financial condition and results of operations of the Company and report a non-controlling interest related to the LLC Interests held by Continuing LLC Owners.
Use of Estimates
The preparation of financial statements in conformity with GAAP requires management to make estimates and assumptions that affect the reported amounts of assets and liabilities and disclosures of contingent assets and liabilities at the date of the consolidated financial statements and the reported amounts of revenues and expenses during the reporting period. Actual results could differ from those estimates and the difference may be material to the consolidated financial statements.
112
Reclassifications
Certain reclassifications have been made to the December 31, 2022 consolidated statement of financial condition, and related financial information, to conform to the current period presentation. These primarily include reclassifying approximately $2.7 million of related party balances from other assets to receivable and due from affiliates and $5.8 million of related party balances from accounts payable, accrued expenses and other liabilities to payable and due to affiliates. These reclassifications had no impact on total assets, total liabilities or total equity on the consolidated statement of financial condition, nor did they have any impact on the consolidated statements of income, comprehensive income, changes in equity or cash flows.
Business Combinations
Business combinations are accounted for under the purchase method of accounting pursuant to Accounting Standards Codification (“ASC”) 805, Business Combinations (“ASC 805”). The total cost of an acquisition is allocated to the underlying net assets based on their respective estimated fair values. The excess of the purchase price over the estimated fair values of the net assets acquired is recorded as goodwill. The fair value of assets acquired and liabilities assumed is determined based on assumptions that reasonable market participants would use in the principal (or most advantageous) market for the asset or liability. Determining the fair value of certain assets acquired and liabilities assumed is judgmental in nature and often involves the use of significant estimates and assumptions, including assumptions with respect to future cash flows, discount rates, growth rates, customer attrition rates and asset lives.
Pushdown Accounting
In connection with the Refinitiv Transaction, a majority interest of Refinitiv was acquired by BCP on October 1, 2018 from TR. The Refinitiv Transaction was accounted for by Refinitiv in accordance with the acquisition method of accounting pursuant to ASC 805, and pushdown accounting was applied to Refinitiv to record the fair value of the assets and liabilities of Refinitiv as of October 1, 2018, the date of the Refinitiv Transaction. The Company, as a consolidating subsidiary of Refinitiv, also accounted for the Refinitiv Transaction using pushdown accounting which resulted in a new fair value basis of accounting for certain of the Company’s assets and liabilities beginning on October 1, 2018. Under the pushdown accounting applied, the excess of the fair value of the Company above the fair value accounting basis of the net assets and liabilities of the Company as of October 1, 2018 was recorded as goodwill. The fair value of assets acquired and liabilities assumed was determined based on assumptions that reasonable market participants would use in the principal (or most advantageous) market for the asset or liability. The adjusted valuations primarily affected the values of the Company’s long-lived and indefinite-lived intangible assets, including software development costs.
Cash and Cash Equivalents
Cash and cash equivalents consists of cash and highly liquid investments with remaining maturities at the time of purchase of three months or less.
Allowance for Credit Losses
Receivable from and Payable to Brokers and Dealers and Clearing Organizations
Receivable from and payable to brokers and dealers and clearing organizations consists of proceeds from transactions executed on the Company’s wholesale platform which failed to settle due to the inability of a transaction party to deliver or receive the transacted security. These securities transactions are generally collateralized by those securities. Until the failed transaction settles, a receivable from (and a matching payable to) brokers and dealers and clearing organizations is recognized for the proceeds from the unsettled transaction.
113
Deposits with Clearing Organizations
Furniture, Equipment, Purchased Software and Leasehold Improvements
Furniture, equipment, purchased software and leasehold improvements are carried at cost less accumulated depreciation. Depreciation for furniture, equipment and purchased software is computed on a straight-line basis over the estimated useful lives of the related assets, ranging from to seven years . Leasehold improvements are amortized over the lesser of the estimated useful lives of the leasehold improvements or the remaining term of the lease for office space.
Furniture, equipment, purchased software and leasehold improvements are tested for impairment whenever events or changes in circumstances suggest that an asset’s carrying value may not be fully recoverable.
As of December 31, 2023 and 2022, accumulated depreciation related to furniture, equipment, purchased software and leasehold improvements totaled $95.8 million and $73.8 million, respectively. Depreciation expense for furniture, equipment, purchased software and leasehold improvements for the years ended December 31, 2023, 2022 and 2021 was $21.3 million, $19.5 million and $20.9 million, respectively.
Software Development Costs
The Company capitalizes costs associated with the development of internal use software at the point at which the conceptual formulation, design and testing of possible software project alternatives have been completed. The Company capitalizes employee compensation and related benefits and third party consulting costs incurred during the application development stage which directly contribute to such development. Such costs are amortized on a straight-line basis over three years . Software development costs acquired as part of the Yieldbroker Acquisition and the NFI Acquisition were both amortized over one year nine years . The Company reviews the amounts capitalized for impairment whenever events or changes in circumstances indicate that the carrying amounts of the assets may not be fully recoverable, or that their useful lives are shorter than originally expected. Non-capitalized software costs and routine maintenance costs are expensed as incurred.
Goodwill
Goodwill includes the excess of the fair value of the Company above the fair value accounting basis of the net assets and liabilities of the Company as previously applied under pushdown accounting in connection with the Refinitiv Transaction. Goodwill also includes the cost of acquired companies in excess of the fair value of identifiable net assets at the acquisition date, including the Yieldbroker Acquisition and the NFI Acquisition. Goodwill is not amortized, but is tested for impairment annually on October 1st and between annual tests, whenever events or changes in circumstances indicate that the carrying amount may not be fully recoverable. Goodwill is tested at the reporting unit level, which is defined as an operating segment or one level below the operating segment. The Company consists of one reporting unit for goodwill impairment testing purposes. An impairment loss is recognized if the estimated fair value of a reporting unit is less than its net book value. Such loss is calculated as the difference between the estimated fair value of goodwill and its carrying value.
Goodwill was last tested for impairment on October 1, 2023 and no impairment of goodwill was identified.
Intangible Assets
Intangible assets with a finite life are amortized over the estimated lives, ranging from to thirteen years . These intangible assets subject to amortization are tested for impairment whenever events or changes in circumstances suggest that an asset’s or asset group’s carrying value may not be fully recoverable. Intangible assets with an indefinite useful life are tested for impairment at least annually. An impairment loss is recognized if the sum of the estimated discounted cash flows relating to the asset or asset group is less than the corresponding book value.
Equity Investments Without Readily Determinable Fair Values
114
Securities Sold Under Agreements to Repurchase
From time to time, the Company sells securities under agreements to repurchase in order to facilitate the clearance of securities. Securities sold under agreements to repurchase are treated as collateralized financings and are presented in the consolidated statements of financial condition at the amounts of cash received. Receivables and payables arising from these agreements are not offset in the consolidated statements of financial condition.
Leases
At lease commencement, a right-of-use asset and a lease liability are recognized for all leases with an initial term in excess of 12 months based on the initial present value of the fixed lease payments over the lease term. The lease right-of-use asset also reflects the present value of any initial direct costs, prepaid lease payments and lease incentives. The Company’s leases do not provide a readily determinable implicit discount rate. Therefore, management estimates the Company’s incremental borrowing rate used to discount the lease payments based on the information available at lease commencement. The Company includes the term covered by an option to extend a lease when the option is reasonably certain to be exercised. The Company has elected not to separate non-lease components from lease components for all leases. Significant assumptions and judgments in calculating the lease right-of-use assets and lease liabilities include the determination of the applicable borrowing rate for each lease. Operating lease expense is recognized on a straight-line basis over the lease term and included as a component of occupancy expense in the consolidated statements of income.
Deferred Offering Costs
Revenue Recognition
Translation of Foreign Currency and Foreign Exchange Derivative Contracts
Revenues, expenses, assets and liabilities denominated in non-functional currencies are recorded in the appropriate functional currency for the legal entity at the rate of exchange prevailing at the transaction date. Monetary assets and liabilities that are denominated in non-functional currencies are then remeasured at the end of each reporting period at the exchange rate prevailing at the end of the reporting period. Foreign currency remeasurement gains or losses on monetary assets and liabilities in nonfunctional currencies are recognized in the consolidated statements of income within general and administrative expenses. The realized and unrealized gains/losses totaled a loss of $1.6 million, $2.3 million and $4.0 million for the years ended December 31, 2023, 2022 and 2021, respectively. Since the consolidated financial statements are presented in U.S. dollars, the Company also translates all non-U.S. dollar functional currency revenues, expenses, assets and liabilities into U.S. dollars. All non-U.S. dollar functional currency revenue and expense amounts are translated into U.S. dollars monthly at the average exchange rate for the month. All non-U.S. dollar functional currency assets and liabilities are translated at the rate prevailing at the end of the reporting period. Gains or losses on translation in the financial statements, when the functional currency is other than the U.S. dollar, are included as a component of other comprehensive income.
115
Income Tax
The Corporation is subject to U.S. federal, state and local income taxes with respect to its taxable income, including its allocable share of any taxable income of TWM LLC, and is taxed at prevailing corporate tax rates. TWM LLC is a multiple member limited liability company taxed as a partnership and accordingly any taxable income generated by TWM LLC is passed through to and included in the taxable income of its members, including the Corporation. Income taxes also include unincorporated business taxes on income earned or losses incurred for conducting business in certain state and local jurisdictions, income taxes on income earned or losses incurred in foreign jurisdictions on certain operations and federal and state income taxes on income earned or losses incurred, both current and deferred, on subsidiaries that are taxed as corporations for U.S. tax purposes.
The Company records deferred tax assets and liabilities for the expected future tax consequences of temporary differences between the financial reporting and tax bases of assets and liabilities. The Company measures deferred taxes using the enacted tax rates and laws that will be in effect when such temporary differences are expected to reverse. The Company evaluates the need for valuation allowances based on the weight of positive and negative evidence. The Company records valuation allowances wherever management believes it is more likely than not that the Company will not be able to realize its deferred tax assets in the foreseeable future.
The Company records uncertain tax positions on the basis of a two-step process whereby (i) the Company determines whether it is more likely than not that the tax positions will be sustained on the basis of the technical merits of the position and (ii) for those tax positions that meet the more-likely-than-not recognition threshold, the Company recognizes the amount of tax benefit that is more than 50% likely to be realized upon ultimate settlement with the related tax authority.
The Company recognizes interest and penalties related to income taxes within the provision for income taxes in the consolidated statements of income. Accrued interest and penalties are included within accounts payable, accrued expenses and other liabilities in the consolidated statements of financial condition.
The Company has elected to treat taxes due on future U.S. inclusions in taxable income under the global intangible low-taxed income (“GILTI”) provision of the Tax Cuts and Jobs Act of 2017 as a current period expense when incurred.
On August 16, 2022, President Biden signed the Inflation Reduction Act of 2022 (“IRA”) into law. The IRA establishes a 15% corporate alternative minimum tax (“CAMT”) effective for taxable years beginning after December 31, 2022, and imposes a 1% excise tax on the repurchase after December 31, 2022 of stock by publicly traded U.S. corporations. The 1% excise tax did not have an impact to our financial condition, results of operations and cash flows as of and for the year ended December 31, 2023. The Company will be subject to the 15% CAMT, which is expected to change the estimated period in which the tax receivable agreement liability payments will be made. However, it is not expected to have a material impact on the Company’s effective tax rate.
116
On October 8, 2021, the Organization for Economic Cooperation and Development announced an accord endorsing and providing an implementation plan focused on global profit allocation, and implementing a global minimum tax rate of at least 15% for large multinational corporations on a jurisdiction-by-jurisdiction basis, known as the “Two Pillar Plan.” On December 15, 2022, the European Council formally adopted a European Union directive on the implementation of the plan by January 1, 2024. The Company may be subject to the provisions of the Two Pillar Plan, and related tax impacts per local country adoption, as it is a consolidating subsidiary of LSEG. The Company does not expect to have material impact of the Two Pillar Plan, but will continue to monitor legislative development.
Stock-Based Compensation
The stock-based payments received by the employees of the Company are accounted for as equity awards. The Company measures and recognizes the cost of employee services received in exchange for awards of equity instruments based on their estimated fair values measured as of the grant date. These costs are recognized as an expense over the requisite service period, with an offsetting increase to additional paid-in capital. The grant-date fair value of stock-based awards that do not require future service (i.e., vested awards) are expensed immediately. Forfeitures of stock-based compensation awards are recognized as they occur.
For grants made during the post-IPO period, the fair value of the equity instruments is determined based on the price of the Class A common stock on the grant date.
Prior to the IPO, the Company awarded options to management and other employees (collectively, the “Special Option Award”) under the Amended and Restated Tradeweb Markets Inc. Option Plan (the “Option Plan”). The significant assumptions used to estimate the fair value as of grant date of the options awarded prior to the IPO did not reflect changes that would have occurred to these assumptions as a result of the IPO. The non-cash stock-based compensation expense associated with the Special Option Award began being expensed in the second quarter of 2019.
The Company uses the Black-Scholes pricing model to value some of its option awards. Determining the appropriate fair value model and calculating the fair value of the option awards requires the input of highly subjective assumptions, including the expected life of the option awards and the stock price volatility.
For performance-based restricted stock units that vest based on market conditions, the Company recognizes stock-based compensation based on the estimated grant date fair value of the awards computed with the assistance of a valuation specialist using a Monte Carlo simulation on a binomial model. The significant assumptions used to estimate the fair value of the performance-based restricted stock units that vest based on market conditions are years of maturity, annualized volatility and the risk-free interest rate. The maturity period represents the period of time that the award granted was modeled into the future, the risk-free interest rate is based on the U.S. Treasury yield curve in effect at the time of measurement corresponding with the maturity period of the award and the expected volatility is based upon historical volatility of the Company’s Class A common stock.
Earnings Per Share
Basic and diluted earnings per share are computed in accordance with the two-class method as unvested restricted stock units and unsettled vested performance-based restricted stock units issued to certain retired executives are entitled to non-forfeitable dividend equivalent rights and are considered participating securities prior to being issued and outstanding shares of common stock. The two-class method is an earnings allocation formula that treats a participating security as having rights to earnings that otherwise would have been available to common shareholders. Basic earnings per share is computed by dividing the net income attributable to the Company’s outstanding shares of Class A and Class B common stock by the weighted-average number of the Company’s shares outstanding during the period. For purposes of computing diluted earnings per share, the weighted-average number of the Company’s shares reflects the dilutive effect that could occur if all potentially dilutive securities were converted into or exchanged or exercised for the Company’s Class A or Class B common stock.
117
The dilutive effect of stock options and other stock-based payment awards is calculated using the treasury stock method, which assumes the proceeds from the exercise of these instruments are used to purchase common shares at the average market price for the period. The dilutive effect of LLC Interests is evaluated under the if-converted method, where the securities are assumed to be converted at the beginning of the period, and the resulting common shares are included in the denominator of the diluted earnings per share calculation for the entire period presented. Performance-based awards are considered contingently issuable shares and their dilutive effect is included in the denominator of the diluted earnings per share calculation for the entire period, if those shares would be issuable as of the end of the reporting period, assuming the end of the reporting period was also the end of the contingency period.
Shares of Class C and Class D common stock do not have economic rights in Tradeweb Markets Inc. and, therefore, are not included in the calculation of basic earnings per share.
Fair Value Measurement
The fair value of a financial instrument is the amount that would be received to sell an asset or paid to transfer a liability in an orderly transaction between market participants at the measurement date (the exit price). Instruments that the Company owns (long positions) are marked to bid prices, and instruments that the Company has sold, but not yet purchased (short positions) are marked to offer prices. Fair value measurements do not include transaction costs.
The fair value hierarchy under ASC 820, Fair Value Measurement (“ASC 820”), prioritizes the inputs to valuation techniques used to measure fair value. The hierarchy gives the highest priority to unadjusted quoted prices in active markets for identical assets or liabilities (level 1 measurements) and the lowest priority to unobservable inputs (level 3 measurements). The three levels of the fair value hierarchy under ASC 820 are described below.
Basis of Fair Value Measurement
A financial instrument’s level within the fair value hierarchy is based on the lowest level of any input that is significant to the fair value measurement.
•Level 1: Unadjusted quoted prices in active markets that are accessible at the measurement date for identical, unrestricted assets or liabilities;
•Level 2: Quoted prices in markets that are not considered to be active or financial instruments for which all significant inputs are observable, either directly or indirectly;
•Level 3: Prices or valuations that require inputs that are both significant to the fair value measurement and unobservable.
Recent Accounting Pronouncements
In December 2023, the Financial Accounting Standards Board (“FASB”) issued Accounting Standards Update (“ASU”) 2023-09, Improvements to Income Tax Disclosures. The ASU requires disaggregated information about a reporting entity’s effective tax rate reconciliation and income taxes paid. The ASU is effective for the Company’s Annual Report on Form 10-K for the fiscal year ended December 31, 2025. The guidance may be applied on a prospective or retrospective basis and early adoption is permitted. The Company is currently evaluating the impact of adopting this ASU on its consolidated financial statements.
In November 2023, FASB issued ASU 2023-07, Segment Reporting (Topic 280): Improvements to Reportable Segment Disclosures. The ASU expands public entities’ segment disclosures by requiring disclosure of significant segment expenses that are regularly reviewed by the chief operating decision maker (“CODM”) and included within each reported measure of segment profit or loss, an amount and description of its composition for other segment items and interim disclosures of a reportable segment’s profit or loss and assets. The ASU also allows, in addition to the measure that is most consistent with U.S. GAAP, the disclosure of additional measures of segment profit or loss that are used by the CODM in assessing segment performance and deciding how to allocate resources. The ASU also requires the disclosure of the title and position of the CODM and an explanation of how the CODM uses the reported measure(s) of segment profit or loss in assessing segment performance and deciding how to to allocate resources. All disclosure requirements under ASU 2023-07 and existing segment disclosures in ASC 280, Segment Reporting are also required for public entities with a single reportable segment. The ASU is effective for the Company’s Annual Report on Form 10-K for the fiscal year ended December 31, 2024, and subsequent interim periods, with early adoption permitted. The ASU is to be applied retrospectively to all periods presented in the financial statements. The Company is currently evaluating the impact of adopting this ASU on its consolidated financial statements.
118
In June 2022, the FASB issued ASU 2022-03, Fair Value Measurement (Topic 820): Fair Value Measurement of Equity Securities Subject to Contractual Sale Restrictions (“ASU 2022-03”), which clarifies that a contractual restriction on the sale of an equity security is not considered part of the unit of account of the equity security and, therefore, is not considered in measuring fair value and that an entity cannot, as a separate unit of account, recognize and measure a contractual sale restriction. ASU 2022-03 also requires the disclosure of the fair value, as reflected in the statement of financial condition, of equity securities subject to contractual sale restrictions and the nature and the disclosure of the remaining duration of those restrictions. ASU 2022-03 is effective for the Company beginning on January 1, 2024 and early adoption is permitted for both interim and annual financial statements that have not yet been issued. The ASU is to be applied prospectively, with any adjustments from the adoption recognized in earnings on the date of adoption. As of December 31, 2023, the Company has not yet adopted ASU 2022-03 and does not expect that the adoption of this ASU will have a material impact on the Company’s consolidated financial statements.
3. Restricted Cash
Cash has been segregated in a special reserve bank account for the benefit of brokers and dealers under SEC Rule 15c3-3. The Company computes the proprietary accounts of broker-dealers (“PAB”) reserve, which requires the Company to maintain minimum segregated cash in the amount of excess total credits per the reserve computation. As of both December 31, 2023 and 2022, cash in the amount of $1.0
4. Acquisitions
Yieldbroker
On August 31, 2023, the Company completed its acquisition of all of the outstanding equity interests of Tradeweb Australia Pty Ltd (Tradeweb Australia Pty Ltd changed its name from Yieldbroker Pty Limited in January 2024). The all-cash purchase price of A$123.6 million ($80.1 million U.S. dollars as translated as of August 31, 2023) was net of cash acquired and prior to working capital and other closing adjustments. During the fourth quarter of 2023, the Company recorded final working capital and purchase price adjustments which resulted in a $0.5 million increase in total assets, a $0.4 million decrease in total liabilities and a $0.1 million increase in total cash paid.
Tradeweb Australia Pty Ltd is a corporation registered under the Corporations Act 2001 in Australia and a Tier 1 Australian Markets Licensee in Australia, regulated by the ASIC, that maintains a branch in Singapore which is regulated by the MAS as a Regulated Market Operator. Yieldbroker operates a leading Australian trading platform for Australian and New Zealand government bonds and interest rate derivatives, covering the institutional and wholesale client sectors.
The acquisition was accounted for as a business combination and the Company utilized the assistance of a third-party valuation specialist to determine the fair value of the assets acquired and liabilities assumed at the date of the closing of the acquisition. The fair values were determined based on assumptions that reasonable market participants would use in the principal (or most advantageous) market and primarily included significant unobservable inputs (Level 3). Customer relationships were valued using the income approach, specifically a multi-period excess earnings method. The excess earnings method examines the economic returns contributed by the identified tangible and intangible assets of a company, and then examines the excess return that is attributable to the intangible asset being valued. The discount rate used reflects the amount of risk associated with the hypothetical cash flows for the customer relationships relative to the overall business. In developing a discount rate for the customer relationships, the Company estimated a weighted-average cost of capital for the overall business and employed an intangible asset risk premium to this rate when discounting the excess earnings related to customer relationships. The resulting discounted cash flows were then tax-affected at the applicable statutory rate.
119
The final purchase price was allocated as follows:
| Purchase Price Allocation | ||||||||
| (in thousands) | ||||||||
| Cash and cash equivalents | $ | |||||||
| Accounts receivable | ||||||||
| Equipment | ||||||||
| Lease right-of-use assets | ||||||||
| Software development costs | ||||||||
| Goodwill | ||||||||
| Intangible assets – Customer relationships | ||||||||
| Intangible assets – Tradename | ||||||||
| Deferred tax asset | ||||||||
| Other assets | ||||||||
| Accrued compensation | ( | |||||||
| Deferred revenue | ( | |||||||
| Accounts payable, accrued expenses and other liabilities | ( | |||||||
| Lease liabilities | ( | |||||||
| Total cash paid | ||||||||
| Less: Cash acquired | ( | |||||||
| Less: Working capital and other closing adjustments | ||||||||
| Purchase price, net of cash acquired and excluding working capital and other closing adjustments | $ | |||||||
The acquired software development costs will be amortized over a useful life of one year , the acquired tradename will be amortized over a useful life of four years and the customer relationships will be amortized over a useful life of 13 years. The goodwill recognized in connection with the Yieldbroker Acquisition is primarily attributable to the acquisition of an assembled workforce and expected future customers, future technology and synergies from the integration of the operations of Yieldbroker into the Company's operations and its single business segment. All of the goodwill recognized in connection with the Yieldbroker Acquisition is expected to be deductible for income tax purposes.
During the year ended December 31, 2023, the Company recognized $2.3 million in transaction costs incurred to effect the Yieldbroker Acquisition, which are included as a component of professional fees in the accompanying consolidated statements of income. During the year ended December 31, 2023, the Company also recognized $0.9 million in transaction costs incurred to effect the Yieldbroker Acquisition, which are included as a component of general and administrative expenses in the accompanying consolidated statements of income. There were no acquisitions completed during the year ended December 31, 2022. During the year ended December 31, 2021, the Company recognized $5.1 million in transaction costs incurred to effect the NFI Acquisition, which are included as a component of professional fees in the accompanying consolidated statements of income.
The Yieldbroker Acquisition was not material to the Company’s consolidated financial statements and therefore pro forma and current period results of this acquisition have not been presented.
120
On June 1, 2023, the Company entered into a foreign currency call option on Australian dollars, giving the Company an option to buy A$120.7 million, in order to partially mitigate the Company’s U.S. dollar versus Australian dollar foreign exchange exposure on the then-anticipated payment of the Australian dollar denominated purchase price for the Yieldbroker Acquisition. The counterparty on the foreign currency call option contract was an affiliate of LSEG. On August 25, 2023, the Company unwound the out-of-the-money foreign currency call option and received $1.1 million from an affiliate of LSEG. Realized losses on the Australian dollar call option during the year ended December 31, 2023 totaled $1.3 million, which is included within other income/loss in the accompanying consolidated statements of income. See Note 15 – Fair Value of Financial Instruments for additional details.
r8fin
On November 16, 2023, TWM LLC and the Corporation entered into a definitive agreement for TWM LLC to acquire all of the outstanding equity interests of R8FIN Holdings LP (together with its subsidiaries, “r8fin”) in exchange for total consideration of $125 million, consisting of $90 million in cash and $35 million in shares of Class A common stock of the Corporation, subject to working capital and other adjustments. r8fin provides a suite of algorithmic-based tools as well as a thin-client execution management system (EMS) trading application to facilitate futures and cash trades. The solutions complement Tradeweb’s existing Dealerweb Active Streams, Dealerweb Central Limit Order Book (CLOB), Tradeweb Request-for-Quote (RFQ) and Tradeweb AiEX (Automated Intelligent Execution) offerings. The acquisition closed on January 19, 2024, following the satisfaction of closing conditions and regulatory reviews. On the closing date, the Corporation issued a total of 374,601 shares of Class A common stock as partial consideration for the acquisition.
5. Software Development Costs
The components of total software development costs, net of accumulated amortization are as follows:
| December 31, 2023 | December 31, 2022 | |||||||||||||||||||||||||||||||||||||
| Cost | Accumulated Amortization | Net Carrying Amount | Cost | Accumulated Amortization | Net Carrying Amount | |||||||||||||||||||||||||||||||||
| (in thousands) | ||||||||||||||||||||||||||||||||||||||
| Software development costs – Refinitiv Transaction | $ | $ | ( | $ | $ | $ | ( | $ | ||||||||||||||||||||||||||||||
| Software development costs – Other | ( | ( | ||||||||||||||||||||||||||||||||||||
| Total software development costs | $ | $ | ( | $ | $ | $ | ( | $ | ||||||||||||||||||||||||||||||
Capitalized software development costs and amortization expense are as follows:
| Year Ended | ||||||||||||||||||||
| December 31, | ||||||||||||||||||||
| 2023 | 2022 | 2021 | ||||||||||||||||||
| (in thousands) | ||||||||||||||||||||
Software development costs capitalized (1) | $ | $ | $ | |||||||||||||||||
| Amortization expense related to capitalized software development costs | $ | $ | $ | |||||||||||||||||
(1)Software development costs capitalized does not include the $0.6 million and $0.8 million in acquired software development costs acquired in connection with the Yieldbroker and NFI acquisitions during the years ended December 31, 2023 and 2021, respectively. See Note 4 – Acquisitions.
Non-capitalized software costs and routine maintenance costs are expensed as incurred and are included in employee compensation and benefits and professional fees on the consolidated statements of income.
The estimated annual future amortization for software development costs as of December 31, 2023 through December 31, 2028 is as follows:
Amount | ||||||||
| (in thousands) | ||||||||
| 2024 | $ | |||||||
| 2025 | $ | |||||||
| 2026 | $ | |||||||
| 2027 | $ | |||||||
| 2028 | $ | |||||||
121
6. Goodwill and Intangible Assets
Goodwill
Goodwill includes the following activity during the years ended December 31, 2023 and 2022:
| December 31, | ||||||||||||||
| 2023 | 2022 | |||||||||||||
| (in thousands) | ||||||||||||||
| Balance at beginning of period | $ | $ | ||||||||||||
| Goodwill recognized in connection with the Yieldbroker Acquisition | ||||||||||||||
| Balance at end of period | $ | $ | ||||||||||||
The components of goodwill are as follows:
| December 31, | ||||||||||||||
| 2023 | 2022 | |||||||||||||
| (in thousands) | ||||||||||||||
| Goodwill – Refinitiv Transaction | $ | $ | ||||||||||||
| Goodwill – Acquisitions and other | ||||||||||||||
| Total | $ | $ | ||||||||||||
Intangible Assets
Intangible assets with an indefinite useful life consisted of the following:
| December 31, | ||||||||||||||
| 2023 | 2022 | |||||||||||||
| (in thousands) | ||||||||||||||
| Licenses – Refinitiv Transaction | $ | $ | ||||||||||||
| Tradename – Refinitiv Transaction | ||||||||||||||
| Total | $ | $ | ||||||||||||
Intangible assets that are subject to amortization consisted of the following:
| December 31, 2023 | December 31, 2022 | |||||||||||||||||||||||||||||||||||||||||||
| Amortization Period | Cost | Accumulated Amortization | Net Carrying Amount | Cost | Accumulated Amortization | Net Carrying Amount | ||||||||||||||||||||||||||||||||||||||
| (in thousands) | ||||||||||||||||||||||||||||||||||||||||||||
| Customer relationships – Refinitiv Transaction | $ | $ | ( | $ | $ | $ | ( | $ | ||||||||||||||||||||||||||||||||||||
| Customer relationships – Acquisitions | ( | ( | ||||||||||||||||||||||||||||||||||||||||||
| Content and data – Refinitiv Transaction | ( | ( | ||||||||||||||||||||||||||||||||||||||||||
| Tradename – Acquisitions | ( | |||||||||||||||||||||||||||||||||||||||||||
| $ | $ | ( | $ | $ | $ | ( | $ | |||||||||||||||||||||||||||||||||||||
Amortization expense for definite-lived intangible assets during the years ended December 31, 2023, 2022 and 2021 was $108.3 million, $107.2 million and $103.3 million, respectively.
122
The estimated annual future amortization for definite-lived intangible assets as of December 31, 2023 through December 31, 2028 is as follows:
Amount | ||||||||
| (in thousands) | ||||||||
| 2024 | $ | |||||||
| 2025 | $ | |||||||
| 2026 | $ | |||||||
| 2027 | $ | |||||||
| 2028 | $ | |||||||
7. Leases
The Company has operating leases for corporate offices and data centers with initial lease terms ranging from to 10 years. The following is a summary of lease right-of-use assets and lease liabilities related to operating leases as of December 31, 2023 and 2022:
| December 31, | ||||||||||||||
| 2023 | 2022 | |||||||||||||
| (in thousands) | ||||||||||||||
| Operating lease right-of-use assets | $ | $ | ||||||||||||
| Operating lease liabilities | $ | $ | ||||||||||||
Activity related to the Company’s leases for the years ended December 31, 2023, 2022 and 2021 is as follows:
| Year Ended | ||||||||||||||||||||
| December 31, | ||||||||||||||||||||
| 2023 | 2022 | 2021 | ||||||||||||||||||
| (in thousands) | ||||||||||||||||||||
| Operating lease expense included as a component of occupancy expense on the accompanying consolidated statements of income | $ | $ | $ | |||||||||||||||||
| Cash paid for amounts included in the measurement of operating lease liability | $ | $ | $ | |||||||||||||||||
At December 31, 2023 and 2022, the weighted average borrowing rate and weighted average remaining lease term are as follows:
| December 31, | ||||||||||||||
| 2023 | 2022 | |||||||||||||
| Weighted average borrowing rate | % | % | ||||||||||||
| Weighted average remaining lease term (years) | ||||||||||||||
The following table presents the future minimum lease payments and the maturity of lease liabilities as of December 31, 2023:
| Amount | ||||||||
| (in thousands) | ||||||||
| 2024 | $ | |||||||
| 2025 | ||||||||
| 2026 | ||||||||
| 2027 | ||||||||
| 2028 | ||||||||
| Thereafter | ||||||||
| Total future lease payments | ||||||||
| Less imputed interest | ( | |||||||
| Lease liability | $ | |||||||
123
As of December 31, 2023 and 2022, one U.S. lease was secured by a $0.5
8. Revenue
Revenue Recognition
The Company enters into contracts with its clients to provide a stand-ready connection to its electronic marketplaces, which facilitates the execution of trades by its clients. The access to the Company’s electronic marketplaces includes market data, continuous pricing data refreshes and the processing of trades thereon. The stand-ready connection to the electronic marketplaces is considered a single performance obligation satisfied over time as the client simultaneously receives and consumes the benefit from the Company’s performance as access is provided (that is, the performance obligation constitutes a series of services that are substantially the same in nature and are provided over time using the same measure of progress). For its services, the Company earns subscription fees for granting access to its electronic marketplaces. Subscription fees, which are generally fixed fees, are recognized as revenue on a monthly basis, in the period that access is provided. The frequency of subscription fee billings varies from monthly to annually, depending on contract terms. Fees received by the Company which are not yet earned are included in deferred revenue on the consolidated statements of financial condition until the revenue recognition criteria have been met. The Company also earns transaction fees and/or commissions from transactions executed on the Company’s electronic marketplaces. The Company earns commission revenue from its electronic and voice brokerage services on a riskless principal basis. Riskless principal revenues are derived on matched principal transactions where revenues are earned on the spread between the buy and sell price of the transacted product. Transaction fees and commissions are generated both on a variable and fixed price basis and vary by geographic region, product type and trade size. Fixed monthly transaction fees or commissions, or monthly transaction fees or commission minimums, are earned on a monthly basis in the period the stand-ready trading services are provided and are generally billed monthly. For variable transaction fees or commissions, the Company charges its clients amounts calculated based on the mix of products traded and the volume of transactions executed. Variable transaction fee or commission revenue is recognized and recorded on a trade-date basis when the individual trade occurs and is generally billed when the trade settles or is billed monthly. Variable discounts or rebates on transaction fees or commissions are earned and applied monthly or quarterly, resolved within the same reporting period and are recorded as a reduction to revenue in the period the relevant trades occur.
Effective November 1, 2023, the Company amended and restated its market data agreement with an affiliate of LSEG (formerly referred to as Refinitiv), pursuant to which the Company will continue to earn fees relating to the sale of market data to LSEG, which distributes that data. Included in these fees, which are billed quarterly, are real-time market data fees which are recognized monthly on a straight-line basis, as LSEG receives and consumes the benefit evenly over the contract period, as the data is provided. Also included in these fees are fees for historical data sets, which are recognized when the historical data set is provided to LSEG.
Significant judgments used in accounting for the Company’s market data agreement with LSEG include the following determinations:
•The provision of real-time market data feeds and historical data sets are distinct performance obligations.
•The performance obligations under this contract are recognized over time from the initial delivery of the data feeds until the end of the contract term or at a point in time upon delivery of each historical data set.
•The transaction prices for the performance obligations were determined by using an adjusted market assessment analysis. Inputs in this analysis included publicly available price lists for data sets provided by other companies, planned internal pricing strategies and other market data points and adjustments obtained through consultations with market data industry experts regarding estimating a standalone selling price for each performance obligation.
124
Some revenues earned by the Company have fixed fee components, such as monthly minimums or fixed monthly fees, and variable components, such as transaction-based fees. The breakdown of revenues between fixed and variable revenues for the years ended December 31, 2023, 2022 and 2021 is as follows:
| Year Ended | Year Ended | Year Ended | ||||||||||||||||||||||||||||||||||||
| December 31, 2023 | December 31, 2022 | December 31, 2021 | ||||||||||||||||||||||||||||||||||||
(in thousands) | ||||||||||||||||||||||||||||||||||||||
Variable | Fixed | Variable | Fixed | Variable | Fixed | |||||||||||||||||||||||||||||||||
| Revenues | ||||||||||||||||||||||||||||||||||||||
| Transaction fees and commissions | $ | $ | $ | $ | $ | $ | ||||||||||||||||||||||||||||||||
| Subscription fees | ||||||||||||||||||||||||||||||||||||||
| LSEG market data fees | ||||||||||||||||||||||||||||||||||||||
| Other | ||||||||||||||||||||||||||||||||||||||
| Total revenue | $ | $ | $ | $ | $ | $ | ||||||||||||||||||||||||||||||||
Deferred Revenue
The Company records deferred revenue when cash payments are received or due in advance of services to be performed. The revenue recognized and the remaining deferred revenue balances are shown below:
Amount | ||||||||
| (in thousands) | ||||||||
| Deferred revenue balance - December 31, 2022 | $ | |||||||
| New billings | ||||||||
| Revenue recognized | ( | |||||||
| Deferred revenue acquired in connection with the Yieldbroker Acquisition | ||||||||
| Effect of foreign currency exchange rate changes | ||||||||
| Deferred revenue balance - December 31, 2023 | $ | |||||||
9. Income Taxes
The Corporation is subject to U.S. federal, state and local income taxes with respect to its taxable income, including its allocable share of any taxable income of TWM LLC, and is taxed at prevailing corporate tax rates. The Company’s actual effective tax rate will be impacted by the Corporation’s ownership share of TWM LLC, which will continue to increase as Continuing LLC Owners that continue to hold LLC Interests redeem or exchange their LLC Interests for shares of Class A common stock or Class B common stock, as applicable, or the Corporation purchases LLC Interests from such Continuing LLC Owners. The Company’s consolidated effective tax rate will also vary from period to period depending on changes in the mix of earnings, tax legislation and tax rates in various jurisdictions. The Company’s provision for income taxes includes U.S., federal, state, local and foreign taxes.
For the year ended December 31, 2023, total income before the provision for income taxes amounted to $548.0 million, consisting of $533.7 million in the United States and $14.3 million in foreign locations.
125
The provision for income taxes consists of the following:
| Year Ended | ||||||||||||||||||||
| December 31, | ||||||||||||||||||||
| 2023 | 2022 | 2021 | ||||||||||||||||||
| (in thousands) | ||||||||||||||||||||
| Current: | ||||||||||||||||||||
| Federal | $ | $ | $ | |||||||||||||||||
| State and Local | ||||||||||||||||||||
| Foreign | ||||||||||||||||||||
| Total current tax expense | ||||||||||||||||||||
| Deferred: | ||||||||||||||||||||
| Federal | ||||||||||||||||||||
| State and local | ( | |||||||||||||||||||
| Foreign | ( | ( | ||||||||||||||||||
| Total deferred tax expense | ||||||||||||||||||||
| Total provision for income taxes | $ | $ | $ | |||||||||||||||||
A reconciliation of the U.S. federal statutory tax rate to the effective rate is as follows:
| Year Ended | ||||||||||||||||||||
| December 31, | ||||||||||||||||||||
| 2023 | 2022 | 2021 | ||||||||||||||||||
| Statutory U.S. federal income tax rate | % | % | % | |||||||||||||||||
| State and local income taxes, net of federal income tax benefit | ||||||||||||||||||||
| Foreign tax rate differential | ( | |||||||||||||||||||
| Non-controlling interest | ( | ( | ( | |||||||||||||||||
| Tax Receivable Agreement adjustment | ( | ( | ||||||||||||||||||
| Rate change | ( | ( | ||||||||||||||||||
| Equity Compensation | ( | ( | ( | |||||||||||||||||
| Other | ( | |||||||||||||||||||
| Effective income tax rate | % | % | % | |||||||||||||||||
The effective tax rate for the year ended December 31, 2023 was approximately 23.4 %, compared with 17.7 % for the year ended December 31, 2022 and 26.2 % for the year ended December 31, 2021. The effective tax rate for the year ended December 31, 2023 differed from the U.S. federal statutory rate of 21.0% primarily due to state and local taxes net of the benefit related to the effect of non-controlling interest. The effective tax rates for the years ended December 31, 2022 and 2021 differed from the U.S. federal statutory rate of 21.0% primarily due to state and local taxes including the tax impact of state apportionment rates changes on total tax expense as a result of the remeasurement of the Company’s net tax deferred asset, the effect of non-controlling interests and the tax impact of the exercise of equity compensation.
126
The components of the Company’s net deferred tax asset (liability) are as follows:
| December 31, | ||||||||||||||
| 2023 | 2022 | |||||||||||||
| (in thousands) | ||||||||||||||
| Deferred tax assets: | ||||||||||||||
| Investment in partnership | $ | $ | ||||||||||||
| Net operating losses | ||||||||||||||
| Tax Receivable Agreement - Interest | ||||||||||||||
| Employee compensation | ||||||||||||||
| Tax credits | ||||||||||||||
| Other | ||||||||||||||
| Deferred tax assets, gross | ||||||||||||||
| Valuation Allowance | ||||||||||||||
| Total deferred tax assets, net | ||||||||||||||
| Deferred tax liabilities | ||||||||||||||
| Goodwill and Intangibles | ( | ( | ||||||||||||
| Total deferred tax liabilities | ( | ( | ||||||||||||
| Total net deferred tax asset (liability) | $ | $ | ||||||||||||
The Company has obtained, and expects to obtain an increase in its share of the tax basis of the assets of TWM LLC when LLC Interests are redeemed or exchanged by Continuing LLC Owners and in connection with certain other qualifying transactions. This increase in tax basis has had, and may in the future have, the effect of reducing the amounts that the Corporation would otherwise pay in the future to various tax authorities. Pursuant to the Tax Receivable Agreement, the Corporation is required to make cash payments to the Continuing LLC Owners equal to 50 % of the amount of U.S. federal, state and local income or franchise tax savings, if any, that the Corporation actually realizes (or in some circumstances are deemed to realize) as a result of certain future tax benefits to which the Corporation may become entitled. The Corporation expects to benefit from the remaining 50 % of tax benefits, if any, that the Corporation may actually realize. See Note 10 – Tax Receivable Agreement for further details. The tax benefit has been recognized in deferred tax assets on the consolidated statement of financial condition.
As of December 31, 2023, the Company had no tax effected U.S. federal net operating loss carryforwards for income tax purposes, state and local net operating loss carryforwards of $1.7 million, and foreign net operating loss carryforwards of $2.1 million. If not utilized, the state and local net operating loss carryforwards will begin to expire in 2035. The foreign net operating loss carryforwards can be carried forward indefinitely.
The components of the Company’s uncertain tax positions are as follows:
| Amount | ||||||||
| (in thousands) | ||||||||
| Gross unrecognized tax benefits as of January 1, 2023 | $ | |||||||
| Increase in current year tax positions | ||||||||
| Increase in prior year tax positions | ||||||||
| Decrease in prior year tax positions | ||||||||
| Acquired tax positions | ||||||||
| Settlements | ( | |||||||
| Gross unrecognized tax benefits as of December 31, 2023 | $ | |||||||
The Company recognizes interest and penalties related to income taxes within the provision for income taxes in the consolidated statements of income. Accrued interest and penalties are included within accounts payable, accrued expenses and other liabilities in the consolidated statements of financial condition. The total amount of interest and penalties payable as of December 31, 2023 was $1.2 million and $0.1 million, respectively.
127
In connection with the Reorganization Transactions, a Refinitiv entity was contributed to the Corporation, pursuant to which the Corporation received 96,933,192 LLC Interests and Refinitiv received 96,933,192 shares of Class B common stock (“Refinitiv Contribution”). As a result of the Refinitiv Contribution, the Company assumed the tax liabilities of the contributed entity. During the year ended December 31, 2023, the contributed entity reached an audit settlement with the State of New Jersey for the tax years 2008 - 2015. As of December 31, 2023 and 2022, none and $2.7 million, respectively, is included in accounts payable, accrued expenses and other liabilities on the consolidated statements of financial condition relating to these tax liabilities. The Company is indemnified by Refinitiv for these tax liabilities that were assumed by the Company as a result of the Refinitiv Contribution. As of December 31, 2023 and 2022, none and $2.7 million, respectively, is included in receivable and due from affiliates on the consolidated statements of financial condition associated with this related party indemnification.
The above tax positions were recognized using the best estimate of the amount expected to be paid based on available information and assessment of all relevant factors. Due to the uncertainty associated with tax audits, it is possible that at some future date liabilities resulting from these audits could vary significantly from these positions. Nevertheless, based on currently enacted legislation and information currently known to us, the Company believes that the ultimate resolution of these audits will not have a material adverse impact on the Company’s financial condition taken as a whole. Furthermore, the Company does not anticipate any material changes to net uncertain tax benefits within the next twelve months.
10. Tax Receivable Agreement
In connection with the Reorganization Transactions, the Corporation entered into a tax receivable agreement (the “Tax Receivable Agreement”) with TWM LLC and the Continuing LLC Owners, which provides for the payment by the Corporation to a Continuing LLC Owner of 50 % of the amount of U.S. federal, state and local income or franchise tax savings, if any, that the Corporation actually realizes (or in some circumstances is deemed to realize) as a result of (i) increases in the tax basis of TWM LLC’s assets resulting from (a) the purchase of LLC Interests from such Continuing LLC Owner, including with the net proceeds from the IPO and any subsequent offerings or (b) redemptions or exchanges by such Continuing LLC Owner of LLC Interests for shares of Class A common stock or Class B common stock or for cash, as applicable, and (ii) certain other tax benefits related to the Corporation making payments under the Tax Receivable Agreement. Payments under the Tax Receivable Agreement are made within 150 days after the filing of the tax return based on the actual tax savings realized by the Corporation. The first payment of the Tax Receivable Agreement was made in January 2021. Substantially all payments due under the Tax Receivable Agreement are payable over fifteen years following the purchase of LLC Interests from Continuing LLC Owners or redemption or exchanges by Continuing LLC Owners of LLC Interests.
The Corporation accounts for the income tax effects resulting from taxable redemptions or exchanges of LLC Interests by Continuing LLC Owners for shares of Class A common stock or Class B common stock or cash, as the case may be, and purchases by the Corporation of LLC Interests from Continuing LLC Owners by recognizing an increase in deferred tax assets, based on enacted tax rates at the date of each redemption, exchange, or purchase, as the case may be. Further, the Corporation evaluates the likelihood that it will realize the benefit represented by the deferred tax asset, and, to the extent that the Corporation estimates that it is more likely than not that it will not realize the benefit, it reduces the carrying amount of the deferred tax asset with a valuation allowance.
128
11. Stockholders’ Equity
Common Stock
Each share of Class A common stock and Class C common stock entitles its holder to one ten These attributes are summarized in the following table:
| Class of Common Stock | Par Value | Votes | Economic Rights | |||||||||||||||||
| Class A common stock | $ | Yes | ||||||||||||||||||
| Class B common stock | $ | Yes | ||||||||||||||||||
| Class C common stock | $ | No | ||||||||||||||||||
| Class D common stock | $ | No | ||||||||||||||||||
Holders of outstanding shares of Class A common stock, Class B common stock, Class C common stock and Class D common stock will vote together as a single class on all matters presented to the Corporation’s stockholders for their vote or approval, except as otherwise required by applicable law.
Holders of Class B common stock may from time to time exchange all or a portion of their shares of Class B common stock for newly issued shares of Class A common stock on a one -for-one basis (in which case their shares of Class B common stock will be cancelled on a one -for-one basis upon any such issuance). Continuing LLC Owners that hold shares of Class D common stock may from time to time exchange all or a portion of their shares of Class D common stock for newly issued shares of Class C common stock on a one -for-one basis (in which case their shares of Class D common stock will be cancelled on a one -for-one basis upon such issuance).
Each share of Class B common stock will automatically convert into one share of Class A common stock and each share of Class D common stock will automatically convert into one share of Class C common stock (i) immediately prior to any sale or other transfer of such share by a holder or its permitted transferees to a non-permitted transferee or (ii) once Refinitiv no longer beneficially owns a number of shares of common stock and LLC Interests that together entitle them to at least 10 % of TWM LLC’s economic interest. Holders of LLC Interests that receive shares of Class C common stock upon any such conversion may continue to elect to have their LLC Interests redeemed for newly issued shares of Class A common stock as described below (in which case their shares of Class C common stock will be cancelled on a one -for-one basis upon such issuance).
In addition, the Corporation’s board of directors adopted the Omnibus Equity Plan, under which equity awards may be made in respect of shares of Class A common stock. It also assumed sponsorship of the Option Plan and a PRSU plan formerly sponsored by TWM LLC. See Note 13 – Stock-Based Compensation Plans for further details.
129
The following table details the movement in the Company’s outstanding shares of common stock during the period:
| Class A | Class B | Class C | Class D | Total | ||||||||||||||||||||||||||||
| Balance at December 31, 2020 | ||||||||||||||||||||||||||||||||
| Activities related to exchanges of LLC Interests | — | ( | ( | |||||||||||||||||||||||||||||
| Issuance of common stock from equity incentive plans | — | — | — | |||||||||||||||||||||||||||||
| Share repurchases pursuant to share repurchase programs | ( | — | — | — | ( | |||||||||||||||||||||||||||
| Balance at December 31, 2021 | ||||||||||||||||||||||||||||||||
| Activities related to exchanges of LLC Interests | — | ( | ||||||||||||||||||||||||||||||
| Issuance of common stock from equity incentive plans | — | — | — | |||||||||||||||||||||||||||||
| Share repurchases pursuant to share repurchase programs | ( | — | — | — | ( | |||||||||||||||||||||||||||
| Balance at December 31, 2022 | ||||||||||||||||||||||||||||||||
| Activities related to exchanges of LLC Interests | — | ( | ||||||||||||||||||||||||||||||
| Issuance of common stock from equity incentive plans | — | — | — | |||||||||||||||||||||||||||||
| Share repurchases pursuant to share repurchase programs | ( | — | — | — | ( | |||||||||||||||||||||||||||
| Balance at December 31, 2023 | ||||||||||||||||||||||||||||||||
LLC Interests
The TWM LLC Agreement requires that TWM LLC at all times maintain (i) a one -to-one ratio between the number of shares of Class A common stock and Class B common stock issued by the Corporation and the number of LLC Interests owned by the Corporation and (ii) a one -to-one ratio between the number of shares of Class C common stock and Class D common stock issued by the Corporation and the number of LLC Interests owned by the holders of such Class C common stock and Class D common stock.
LLC Interests held by Continuing LLC Owners are redeemable in accordance with the TWM LLC Agreement, at the election of such holders, for newly issued shares of Class A common stock or Class B common stock, as the case may be, on a one -for-one basis (and such holders’ shares of Class C common stock or Class D common stock, as the case may be, will be cancelled on a one -for-one basis upon any such issuance). In the event of such election by a Continuing LLC Owner, the Corporation may, at its option, effect a direct exchange of Class A common stock or Class B common stock for such LLC Interests of such Continuing LLC Owner in lieu of such redemption. In addition, the Corporation’s board of directors may, at its option, instead of the foregoing redemptions or exchanges of LLC Interests, cause the Corporation to make a cash payment equal to the volume weighted average market price of one share of Class A common stock for each LLC Interest redeemed or exchanged (subject to customary adjustments, including for stock splits, stock dividends and reclassifications) in accordance with the terms of the TWM LLC Agreement.
Redemptions and Exchanges of LLC Interests
Continuing LLC Owners may, from time to time, exercise their redemption rights under the TWM LLC Agreement, pursuant to which LLC Interests are exchanged for newly-issued shares of Class A common stock. Simultaneously, and in connection with these exchanges, shares of Class C and/or Class D common stock are surrendered by Continuing LLC Owners and cancelled. In connection with these exchanges, Tradeweb Markets Inc. receives LLC Interests, increasing its total ownership interest in TWM LLC.
130
Share Repurchase Programs
On February 4, 2021, the Company announced that its board of directors authorized a share repurchase program (the “2021 Share Repurchase Program”), primarily to offset annual dilution from stock-based compensation plans. The 2021 Share Repurchase Program authorized the purchase of up to $150.0 million of the Company’s Class A common stock at the Company’s discretion through the end of fiscal year 2023. The 2021 Share Repurchase Program was effected through regular open-market purchases (which included repurchase plans designed to comply with Rule 10b5-1). The amounts and timing of the repurchases were subject to general market conditions and the prevailing price and trading volumes of the Company’s Class A common stock. The 2021 Share Repurchase Program did not require the Company to acquire a specific number of shares and was able to be suspended, amended or discontinued at any time.
The Company began buying back shares pursuant to the 2021 Share Repurchase Program during the second quarter of 2021. During the years ended December 31, 2022 and 2021, the Company acquired a total of 959,869 and 901,968 shares of Class A common stock, respectively, at an average price of $77.43 and $83.90 , respectively, for purchases totaling $74.3 million and $75.7 million, respectively, pursuant to the 2021 Share Repurchase Program. As of December 31, 2022, no shares remained available for repurchase pursuant to the 2021 Share Repurchase Program.
On December 5, 2022, the Company announced that its board of directors authorized a new share repurchase program (the “2022 Share Repurchase Program”), to continue to offset annual dilution from stock-based compensation plans, as well as to opportunistically repurchase the Company’s stock. The 2022 Share Repurchase Program authorizes the purchase of up to $300.0 million of the Company’s Class A common stock at the Company’s discretion and has no termination date. The 2022 Share Repurchase Program can be effected through regular open-market purchases (which may include repurchase plans designed to comply with Rule 10b5-1), through privately negotiated transactions or through accelerated share repurchases, each in accordance with applicable securities laws and other restrictions. The amounts, timing and manner of the repurchases will be subject to general market conditions, the prevailing price and trading volumes of the Company’s Class A common stock and other factors. The 2022 Share Repurchase Program does not require the Company to acquire a specific number of shares and may be suspended, amended or discontinued at any time. During the years ended December 31, 2023 and 2022, the Company acquired a total of 485,730 and 387,198 shares of Class A common stock, at an average price of $72.48 and $64.57 , respectively, for purchases totaling $35.2 million and $25.0 million, respectively, pursuant to the 2022 Share Repurchase Program.
Each share of Class A common stock repurchased pursuant to the 2021 and 2022 Share Repurchase Programs was funded with the proceeds, on a dollar-for-dollar basis, from the repurchase by Tradeweb Markets LLC of an LLC Interest from the Corporation in order to maintain the one 239.8 million remained available for repurchase pursuant to the 2022 Share Repurchase Program.
For shares repurchased pursuant to the 2021 and 2022 Share Repurchase Programs, the excess of the repurchase price paid over the par value of the Class A common stock will be recorded as a reduction to retained earnings.
Other Share Repurchases
During the years ended December 31, 2023, 2022 and 2021, the Company withheld 715,101 , 1,074,467 and 983,072 shares, respectively, of Class A common stock from employee stock option, PRSU and RSU awards, at an average price per share of $72.02 , $94.64 and $72.25 , respectively, and an aggregate value of $51.5 million, $101.7 million and $71.0 million, respectively, based on the price of the Class A common stock on the date the relevant withholding occurred.
These shares are withheld in order for the Company to cover the payroll tax withholding obligations upon the exercise of stock options and settlement of RSUs and PRSUs and such shares were not withheld in connection with the share repurchase programs discussed above.
12. Non-Controlling Interests
In connection with the Reorganization Transactions, Tradeweb Markets Inc. became the sole manager of TWM LLC and, as a result of this control, and because Tradeweb Markets Inc. has a substantial financial interest in TWM LLC, consolidates the financial results of TWM LLC into its consolidated financial statements. The non-controlling interests balance reported on the consolidated statements of financial condition represents the economic interests of TWM LLC held by the holders of LLC Interests other than Tradeweb Markets Inc. Income or loss is attributed to the non-controlling interests based on the relative ownership percentages of LLC Interests held during the period by Tradeweb Markets Inc. and the other holders of LLC Interests.
131
The following table summarizes the ownership interest in Tradeweb Markets LLC:
| December 31, 2023 | December 31, 2022 | |||||||||||||||||||||||||
| LLC Interests | Ownership % | LLC Interests | Ownership % | |||||||||||||||||||||||
| Number of LLC Interests held by Tradeweb Markets Inc. | % | % | ||||||||||||||||||||||||
| Number of LLC Interests held by non-controlling interests | % | % | ||||||||||||||||||||||||
| Total LLC Interests outstanding | % | % | ||||||||||||||||||||||||
LLC Interests held by the Continuing LLC Owners are redeemable in accordance with the TWM LLC Agreement at the election of the members for shares of Class A common stock or Class B common stock, as applicable, on a one
The following table summarizes the impact on Tradeweb Market Inc.’s equity due to changes in the Corporation’s ownership interest in TWM LLC:
| Net Income Attributable to Tradeweb Markets Inc. and Transfers (to) from the Non-Controlling Interests | Year Ended | |||||||||||||||||||
| December 31, | ||||||||||||||||||||
| 2023 | 2022 | 2021 | ||||||||||||||||||
| (in thousands) | ||||||||||||||||||||
| Net income attributable to Tradeweb Markets Inc. | $ | $ | $ | |||||||||||||||||
| Transfers (to) from non-controlling interests: | ||||||||||||||||||||
| Increase/(decrease) in Tradeweb Markets Inc.’s additional paid-in capital as a result of ownership changes in TWM LLC | ||||||||||||||||||||
| Net transfers (to) from non-controlling interests | ||||||||||||||||||||
| Change from net income attributable to Tradeweb Markets Inc. and transfers (to) from non-controlling interests | $ | $ | $ | |||||||||||||||||
13. Stock-Based Compensation Plans
Under the Tradeweb Markets Inc. 2019 Omnibus Equity Incentive Plan, the Company is authorized to issue up to 8,841,864 new shares of Class A common stock to employees, officers and non-employee directors. Under this plan, the Company may grant awards in respect of shares of Class A common stock, including performance-based restricted stock units, stock options, restricted stock units (“RSUs”) and dividend equivalent rights. The awards may have performance-based and/or time-based vesting conditions. Stock options have a maximum contractual term of 10 years.
On February 16, 2022, the Company announced that Mr. Olesky would retire as Chief Executive Officer (“CEO”) of the Company, effective December 31, 2022, resulting in an acceleration of the total unamortized stock-based compensation associated with equity awards granted to him. The unamortized expense was accelerated over a revised estimated service period that ended on August 11, 2022, representing Mr. Olesky’s required six month notice period under the Company’s 2019 Omnibus Equity Incentive Plan. In addition, in December 2022, $5.5 million in stock-based compensation awards, relating to 2022 performance, were granted to Mr. Olesky and immediately recognized into expense upon grant.
During the year ended December 31, 2022, the Company recorded a total of $15.0 million in accelerated stock-based compensation expenses (“CEO Retirement Accelerated Stock-Based Compensation Expense”) and related payroll that would not have been recognized if Mr. Olesky had not announced his retirement. There was no CEO Retirement Accelerated Stock-Based Compensation Expense recorded during the year ended December 31, 2023.
132
PRSU
Performance-based restricted stock units that are promises to issue actual shares of Class A common stock based on the financial performance of the Company are referred to as “PRSUs”. PRSUs generally cliff vest on January 1 of the third calendar year from the calendar year of the date of grant. The fair value of PRSUs is calculated on the grant date using the stock price of the Class A common stock. The number of shares a participant will receive upon vesting is determined by a performance modifier, which is adjusted as a result of the financial performance of the Company in the grant year. The performance modifier can vary between 0 % (minimum) and 200 % (maximum) of the target (100 %) award amount for awards granted during 2022 and prior years. PRSUs granted during 2023 had a 250 % maximum performance modifier. Compensation expense for PRSUs that cliff vest is recognized on a straight-line basis over the vesting period for the entire award. The number of shares included in expense each period is based on management’s estimate of the probable final performance modifier for those grants, with such estimate updated each period until the performance modifier is finalized.
A summary of the Company’s outstanding PRSUs is presented below:
| PRSUs | Weighted Average Grant-Date Fair Value | |||||||||||||
| PRSUs outstanding at December 31, 2022 | $ | |||||||||||||
| Grants | $ | |||||||||||||
| Vests | ( | $ | ||||||||||||
| Performance adjustment | $ | |||||||||||||
| Forfeitures and adjustments | ( | $ | ||||||||||||
| PRSUs outstanding at December 31, 2023 | $ | |||||||||||||
The following table summarizes information about PRSU awards:
| Year Ended | ||||||||||||||||||||
| December 31, | ||||||||||||||||||||
| 2023 | 2022 | 2021 | ||||||||||||||||||
| (in thousands) | ||||||||||||||||||||
| PRSU compensation expense | $ | $ | $ | |||||||||||||||||
| Income tax benefit | $ | ( | $ | ( | $ | ( | ||||||||||||||
The weighted-average grant-date fair value of equity-settled PRSUs granted during the years ended December 31, 2022 and 2021 was $83.74 and $74.29 , respectively.
The total fair value of PRSUs vested during the years ended December 31, 2023, 2022 and 2021 was $46.2 million, $152.8 million and $67.4 million, respectively.
PSU
Performance-based restricted stock units that are promises to issue actual shares of Class A common stock based on market conditions are referred to as “PSUs”. PSUs cliff vest on January 1 of the third calendar year from the calendar year of the date of grant. The number of shares a participant will receive upon vesting is determined by a performance modifier, which is adjusted as a result of the Company’s total shareholder return over a three-year performance period. The performance modifier can vary between 0 % (minimum) and 250 % (maximum) of the target (100 %) award amount. The grant date fair value of the PSUs, determined using the Monte Carlo simulation model, is recognized as compensation expense on a straight-line basis over the vesting period for the entire award, regardless of the number of shares received by the participant at vesting.
133
A summary of the Company’s outstanding PSUs is presented below:
| PSUs | Weighted Average Grant-Date Fair Value | |||||||||||||
| PSUs outstanding at December 31, 2022 | $ | |||||||||||||
| Grants | $ | |||||||||||||
| Vests | $ | |||||||||||||
| Performance adjustment | $ | |||||||||||||
| Forfeitures and adjustments | $ | |||||||||||||
| PSUs outstanding at December 31, 2023 | ||||||||||||||
The following table summarizes information about PSU awards:
| Year Ended | ||||||||||||||||||||
| December 31, | ||||||||||||||||||||
| 2023 | 2022 | 2021 | ||||||||||||||||||
| (in thousands) | ||||||||||||||||||||
| PSU compensation expense | $ | $ | $ | |||||||||||||||||
| Income tax benefit | $ | ( | $ | $ | ||||||||||||||||
There were no
The significant assumptions used to estimate the fair value of PSUs estimated using the Monte Carlo simulation model were as follows:
| March 15, 2023 PSU Grant | ||||||||
| Maturity (years) | ||||||||
| Annualized Volatility | % | |||||||
| Risk-Free Interest Rate | % | |||||||
Options
Prior to the IPO, the Company granted the Special Option Award to management and other employees and granted additional options subsequent to the IPO in July 2019 and December 2019, in each case under the Option Plan (the “July 2019 Grants” and the “December 2019 Grants,” respectively). Each option award vests one half based solely on the passage of time and one half only if the Company achieves certain performance targets. The options have a four-year graded vesting schedule, with accelerated vesting for the time-based Special Option Award options originally scheduled to vest in years three and four that were accelerated upon completion of the IPO. The stock-based compensation expense recognition commenced upon the completion of the IPO.
The grant-date fair value of the time-based options related to the Special Option Award and the July 2019 Grants are amortized into expense over the requisite service period on a straight-line basis, with each tranche separately measured. The grant-date fair value of the time-based December 2019 Grants are amortized into expense on a straight-line basis over the requisite service period for the entire award.
For the portion of all awards that require both future service and the achievement of Company performance-based conditions, the grant-date fair value for each tranche is separately amortized into expense over the requisite service period for the requisite performance-based condition. If in a reporting period it is determined that the achievement of a performance target for a performance-based tranche is not probable, then no expense is recognized for that tranche and any expenses already recognized relating to that tranche in prior reporting periods are reversed in the current reporting period.
The Company can elect to net-settle exercised options by reducing the shares of Class A common stock to be issued upon such exercise by the number of shares of Class A common stock having a fair market value on the date of exercise equal to the aggregate option price and withholding taxes payable in respect of the number of options exercised. The Company may then pay these employee payroll taxes from the Company’s cash.
134
| Options | Weighted Average Grant-Date Fair Value | Weighted Average Exercise Price | ||||||||||||||||||
| Options outstanding at December 31, 2022 | $ | $ | ||||||||||||||||||
| Grants | $ | $ | ||||||||||||||||||
| Exercises | ( | $ | $ | |||||||||||||||||
| Forfeitures and adjustments | $ | $ | ||||||||||||||||||
| Expired | $ | $ | ||||||||||||||||||
| Options outstanding at December 31, 2023 | $ | $ | ||||||||||||||||||
| Vested options outstanding at December 31, 2023 - all exercisable | $ | $ | ||||||||||||||||||
The following table summarizes information about options awards:
| Year Ended | ||||||||||||||||||||
| December 31, | ||||||||||||||||||||
| 2023 | 2022 | 2021 | ||||||||||||||||||
| (in thousands) | ||||||||||||||||||||
| Options compensation expense | $ | $ | $ | |||||||||||||||||
| Income tax benefit | $ | ( | $ | ( | $ | ( | ||||||||||||||
There were no
The total intrinsic value of options exercised during the years ended December 31, 2023, 2022 and 2021 was $77.4 million, $59.3 million and $333.8 million, respectively.
The total intrinsic value of all options outstanding as of December 31, 2023 was $67.3 million. The weighted average remaining contractual life of all options outstanding as of December 31, 2023 was 5.0 years.
The total intrinsic value of all vested options outstanding as of December 31, 2023 was $61.7 million, all of which are currently exercisable. The weighted average remaining contractual life of all vested options outstanding as of December 31, 2023 was 4.9 years.
RSUs
RSUs are promises to issue shares of Class A common stock at the end of a vesting period. RSUs granted to employees generally vest one-third each year over a three-year period. RSUs granted to non-employee directors generally vest after one year . The fair value of RSUs is calculated on the grant date using the stock price of the Class A common stock. The grant-date fair value of RSUs are amortized into expense on a straight-line basis over the requisite service period for the entire award.
A summary of the Company’s outstanding RSUs is presented below:
| RSUs | Weighted Average Grant-Date Fair Value | |||||||||||||
| RSUs outstanding at December 31, 2022 | $ | |||||||||||||
| Grants | $ | |||||||||||||
| Vests | ( | $ | ||||||||||||
| Forfeitures | ( | $ | ||||||||||||
| RSUs outstanding at December 31, 2023 | $ | |||||||||||||
135
The following table summarizes information about RSU awards:
| Year Ended | ||||||||||||||||||||
| December 31, | ||||||||||||||||||||
| 2023 | 2022 | 2021 | ||||||||||||||||||
| (in thousands) | ||||||||||||||||||||
| RSU compensation expense | $ | $ | $ | |||||||||||||||||
| Income tax benefit | $ | ( | $ | ( | $ | ( | ||||||||||||||
The weighted-average grant-date fair value of RSUs granted during the years ended December 31, 2022 and 2021 was $80.27 and $75.09 , respectively.
The total fair value of RSUs vested during the years ended December 31, 2023, 2022 and 2021 was $30.7 million, $25.6 million, and $12.5 million, respectively.
Compensation Expense
The Company records stock-based compensation expense for employees and directors in the consolidated statements of income. A summary of the Company’s total stock-based compensation expense relating to its equity-settled PRSUs, options and RSUs, including the CEO Retirement Accelerated Stock-Based Compensation Expense, is presented below:
| Year Ended | ||||||||||||||||||||
| December 31, | ||||||||||||||||||||
| 2023 | 2022 | 2021 | ||||||||||||||||||
| (in thousands) | ||||||||||||||||||||
| Total stock-based compensation expense | $ | $ | $ | |||||||||||||||||
The stock-based compensation expense above excludes $1.5 million and $0.9 million of stock-based compensation expense capitalized to software development costs during the years ended December 31, 2023 and 2022, respectively.
As of December 31, 2023, total unrecognized compensation expense related to unvested stock-based compensation arrangements and the expected recognition period are as follows:
PRSUs | PSUs | Options | RSUs | |||||||||||||||||||||||
| (dollars in thousands) | ||||||||||||||||||||||||||
| Total unrecognized compensation cost | $ | $ | $ | $ | ||||||||||||||||||||||
| Weighted-average recognition period (in years) | ||||||||||||||||||||||||||
14. Related Party Transactions
The Company enters into transactions with its affiliates from time to time which are considered to be related party transactions.
As of December 31, 2023 and 2022, the following balances with such affiliates were included in the consolidated statements of financial condition in the following line items:
| December 31, | ||||||||||||||
| 2023 | 2022 | |||||||||||||
| (in thousands) | ||||||||||||||
| Accounts receivable | $ | $ | ||||||||||||
| Receivable and due from affiliates | ||||||||||||||
| Other assets | ||||||||||||||
Accounts payable, accrued expenses and other liabilities | ||||||||||||||
| Deferred revenue | ||||||||||||||
| Payable and due to affiliates | ||||||||||||||
136
The following balances with such affiliates were included in the consolidated statements of income in the following line items:
| Year Ended | ||||||||||||||||||||
| December 31, | ||||||||||||||||||||
| 2023 | 2022 | 2021 | ||||||||||||||||||
| (in thousands) | ||||||||||||||||||||
| Revenue: | ||||||||||||||||||||
Subscription fees | $ | $ | $ | |||||||||||||||||
LSEG market data fees (1) | ||||||||||||||||||||
| Other fees | ||||||||||||||||||||
Expenses: (2) | ||||||||||||||||||||
| Employee compensation and benefits | ||||||||||||||||||||
| Technology and communications | ||||||||||||||||||||
| General and administrative | ||||||||||||||||||||
| Professional fees | ||||||||||||||||||||
| Occupancy | ||||||||||||||||||||
(1)The Company maintains a market data license agreement with an affiliate of LSEG (formerly referred to as Refinitiv). Under the agreement, the Company delivers to LSEG certain market data feeds which LSEG distributes to its customers. The Company earns license fees and royalties for these feeds.
(2)The Company maintains agreements with LSEG to provide the Company with certain real estate, payroll, benefits administration and other administrative services.
During the years ended December 31, 2023, 2022 and 2021, none , $3.1 million and $1.6 million, respectively of previously accrued expenses payable to affiliates of LSEG were waived and the liabilities were reversed through an increase to additional paid-in capital.
137
15. Fair Value of Financial Instruments
Financial Instruments Measured at Fair Value
The Company’s financial instruments measured at fair value on the consolidated statements of financial condition as of December 31, 2023 and 2022 have been categorized based upon the fair value hierarchy as follows:
Quoted Prices in active Markets for Identical Assets (Level 1) | Significant Observable Inputs (Level 2) | Significant Unobservable Inputs (Level 3) | Total | |||||||||||||||||||||||
| As of December 31, 2023 | (in thousands) | |||||||||||||||||||||||||
| Assets | ||||||||||||||||||||||||||
| Cash equivalents – Money market funds and other highly liquid investments | $ | $ | $ | $ | ||||||||||||||||||||||
| Total assets measured at fair value | $ | $ | $ | $ | ||||||||||||||||||||||
| Liabilities | ||||||||||||||||||||||||||
| $ | $ | $ | $ | |||||||||||||||||||||||
| Total liabilities measured at fair value | $ | $ | $ | $ | ||||||||||||||||||||||
| As of December 31, 2022 | ||||||||||||||||||||||||||
| Assets | ||||||||||||||||||||||||||
| Cash equivalents – Money market funds and other highly liquid investments | $ | $ | $ | $ | ||||||||||||||||||||||
| Total assets measured at fair value | $ | $ | $ | $ | ||||||||||||||||||||||
| Liabilities | ||||||||||||||||||||||||||
Payable and due to affiliates – Foreign exchange derivative contracts | $ | $ | $ | $ | ||||||||||||||||||||||
| Total liabilities measured at fair value | $ | $ | $ | $ | ||||||||||||||||||||||
The Company’s cash equivalents are classified within level 1 of the fair value hierarchy because they are valued using quoted market prices in active markets.
The Company enters into foreign currency forward contracts to mitigate its U.S. dollar and British pound sterling versus euro exposure, generally with a duration of less than 12 months. The valuations for the Company’s foreign currency forward contracts are primarily based on the difference between the exchange rate associated with the contract and the exchange rate at the current period end for the tenor of the contract. Foreign currency forward contracts are categorized as Level 2 in the fair value hierarchy. As of December 31, 2023 and 2022, the counterparty on each of these foreign exchange derivative contracts was an affiliate of LSEG and therefore the corresponding assets or liabilities on such contracts were included in receivable and due from affiliates or payable and due to affiliates, respectively, on the accompanying consolidated statements of financial condition.
The following table summarizes the aggregate U.S. dollar equivalent notional amount of the Company’s foreign exchange derivative contracts not designated as hedges for accounting purposes:
| December 31, | ||||||||||||||
| 2023 | 2022 | |||||||||||||
| (in thousands) | ||||||||||||||
| Foreign currency forward contracts – Gross notional amount | $ | $ | ||||||||||||
138
The Company’s foreign exchange derivative contracts are not designated as hedges for accounting purposes and changes in the fair value of these contracts during the period are recognized in the consolidated statements of income. The total realized and unrealized gains (losses) on foreign exchange derivative contracts recorded within the consolidated statements of income are as follows:
| Year Ended | ||||||||||||||||||||
| December 31, | ||||||||||||||||||||
| 2023 | 2022 | 2021 | ||||||||||||||||||
| (in thousands) | ||||||||||||||||||||
| Foreign currency forward contracts not designated in accounting hedge relationship – General and administrative (expenses)/income | $ | $ | $ | |||||||||||||||||
Foreign currency call option contract not designated in accounting hedge relationship – Other income/(loss) (1) | $ | ( | $ | $ | ||||||||||||||||
139
Financial Instruments Not Measured at Fair Value
The Company’s financial instruments not measured at fair value on the consolidated statements of financial condition as of December 31, 2023 and 2022 have been categorized based upon the fair value hierarchy as follows:
| Carrying Value | Quoted Prices in active Markets for Identical Assets (Level 1) | Significant Observable Inputs (Level 2) | Significant Unobservable Inputs (Level 3) | Total Fair Value | ||||||||||||||||||||||||||||
| As of December 31, 2023 | (in thousands) | |||||||||||||||||||||||||||||||
| Assets | ||||||||||||||||||||||||||||||||
| Cash and restricted cash | $ | $ | $ | $ | $ | |||||||||||||||||||||||||||
| Receivable from brokers and dealers and clearing organizations | ||||||||||||||||||||||||||||||||
| Deposits with clearing organizations | ||||||||||||||||||||||||||||||||
| Accounts receivable | ||||||||||||||||||||||||||||||||
Other assets – Memberships in clearing organizations | ||||||||||||||||||||||||||||||||
| Total | $ | $ | $ | $ | $ | |||||||||||||||||||||||||||
| Liabilities | ||||||||||||||||||||||||||||||||
Securities sold under agreements to repurchase(1) | $ | $ | $ | $ | $ | |||||||||||||||||||||||||||
| Payable to brokers and dealers and clearing organizations | ||||||||||||||||||||||||||||||||
| Total | $ | $ | $ | $ | $ | |||||||||||||||||||||||||||
| As of December 31, 2022 | ||||||||||||||||||||||||||||||||
| Assets | ||||||||||||||||||||||||||||||||
| Cash and restricted cash | $ | $ | $ | $ | $ | |||||||||||||||||||||||||||
| Receivable from brokers and dealers and clearing organizations | ||||||||||||||||||||||||||||||||
| Deposits with clearing organizations | ||||||||||||||||||||||||||||||||
| Accounts receivable | ||||||||||||||||||||||||||||||||
Other assets – Memberships in clearing organizations | ||||||||||||||||||||||||||||||||
| Total | $ | $ | $ | $ | $ | |||||||||||||||||||||||||||
| Liabilities | ||||||||||||||||||||||||||||||||
| Securities sold under agreements to repurchase | $ | $ | $ | $ | $ | |||||||||||||||||||||||||||
| Payable to brokers and dealers and clearing organizations | ||||||||||||||||||||||||||||||||
| Total | $ | $ | $ | $ | $ | |||||||||||||||||||||||||||
(1) As of December 31, 2023, Treasury securities with a fair value of $21.6 million collateralized the securities sold under agreements to repurchase liability. The liability amount presented represents the gross liability and is not offset on the consolidated statement of financial condition. The securities sold under agreements to repurchase liability were subsequently settled on January 2, 2024.
The carrying value of financial instruments not measured at fair value classified within level 1 or level 2 of the fair value hierarchy approximates fair value because of the relatively short term nature of the underlying assets or liabilities. The memberships in clearing organizations, which are included in other assets on the consolidated statements of financial condition, are classified within level 3 of the fair value hierarchy because the valuation requires assumptions that are both significant and unobservable.
140
Non-recurring Fair Value Measurements
The Company measures certain assets and liabilities, such as assets acquired in a business combination, at fair value as of the acquisition date. See Note 4 – Acquisitions for further details regarding these non-recurring fair value measurements.
Financial Instruments Without Readily Determinable Fair Values
Included in other assets on the consolidated statements of financial condition are equity investments without readily determinable fair values of $8.9 million and $20.0 million as of December 31, 2023 and 2022, respectively. During the year ended December 31, 2023, and as of December 31, 2023, the Company recorded an impairment on its equity investment totaling $11.1 million, as the investment’s carrying amount exceeded its fair value. The investment impairment is included in other income (loss) in the consolidated statements of income. The investment’s fair value was determined using a discounted cash flow model, using primarily Level 3 inputs. Significant unobservable inputs included a discount rate of 20 % and a perpetual growth rate of 3.0 %.
16. Credit Risk
Cash and cash equivalents includes cash and highly liquid investments held by a limited number of global financial institutions, including cash amounts in excess of federally insured limits. To mitigate this concentration of credit risk, the Company invests through high-credit-quality financial institutions, monitors the concentration of credit exposure of investments with any single obligor and diversifies as determined appropriate.
In the normal course of business the Company, as agent, executes transactions with, and on behalf of, other brokers and dealers. If the agency transactions do not settle because of failure to perform by either counterparty, the Company will recognize a receivable from (and a matching payable to) brokers and dealers and clearing organizations for the proceeds from the unsettled transaction, until the failed transaction settles. The Company may be obligated to discharge the obligation of the non-performing party and, as a result, may incur a loss if the market value of the security is different from the contract amount of the transaction. However, from time to time, the Company enters into repurchase and/or reverse repurchase agreements to facilitate the clearance of securities relating to fails to deliver or receive. The Company seeks to manage credit exposure related to these agreements to repurchase (or reverse repurchase), including the risk related to a decline in market value of collateral (pledged or received), by entering into agreements to repurchase with overnight or short-term maturity dates and only entering into repurchase transactions with netting members of the Fixed Income Clearing Corporation (“FICC”). The FICC operates a continuous net settlement system, whereby as trades are submitted and compared, the FICC becomes the counterparty.
A substantial number of the Company’s transactions are collateralized and executed with, and on behalf of, a limited number of broker-dealers. The Company’s exposure to credit risk associated with the nonperformance of these clients in fulfilling their contractual obligations pursuant to securities transactions can be directly impacted by volatile trading markets which may impair the clients’ ability to satisfy their obligations to the Company.
The Company does not expect nonperformance by counterparties in the above situations. However, the Company’s policy is to monitor its market exposure and counterparty risk. In addition, the Company has a policy of reviewing, as considered necessary, the credit standing of each counterparty with which it conducts business.
Allowance for Credit Losses
The Company may be exposed to credit risk regarding its receivables, which are primarily receivables from financial institutions, including investment managers and broker-dealers. The Company maintains an allowance for credit losses based upon an estimate of the amount of potential credit losses in existing accounts receivable, as determined from a review of aging schedules, past due balances, historical collection experience and other specific account data. Careful analysis of the financial condition of the Company’s counterparties is also performed.
Account balances are pooled based on the following risk characteristics:
•Geographic location
•Transaction fee type (billing type)
•Legal entity
141
Write-Offs
Once determined uncollectible, aged balances are written off against the allowance for credit losses. This determination is based on careful analysis of individual receivables and aging schedules, which are disaggregated based on the risk characteristics described above. Based on current policy, this generally occurs when the receivable is 360 days past due.
As of December 31, 2023 and 2022, the Company maintained an allowance for credit losses with regard to these receivables of $0.3 million and $0.1 million, respectively. For the years ended December 31, 2023 and 2021 credit loss expense was $208,000 and $13,000 , respectively. For the year ended December 31, 2022, recoveries resulted in a reversal of credit loss expense of $14,000 .
17. Commitments and Contingencies
From time to time, the Company is subject to various claims, lawsuits and other legal proceedings, including reviews, investigations and proceedings by governmental and self-regulatory agencies regarding its business. While the ultimate resolution of these matters cannot presently be determined, the Company does not believe that, taking into account any applicable insurance coverage, any of the pending legal proceedings, including the matters set forth below, could reasonably be expected to have a material adverse effect on its business, financial condition or results of operations.
In the normal course of business, the Company enters into agreements with its customers which provide the customers with indemnification rights, including in the event that the electronic marketplaces of the Company infringe upon the intellectual property or other proprietary right of a third party. The Company’s exposure under these agreements is unknown as this would involve estimating future claims against the Company which have not yet occurred. However, based on its experience, the Company expects the risk of a material loss to be remote.
The Company has been named as a defendant, along with other financial institutions, in two consolidated antitrust class actions relating to trading practices in United States Treasury securities auctions. The cases were dismissed in March 2021, with the Court granting the Plaintiffs leave to further amend the complaint by no later than May 14, 2021. The plaintiffs filed an amended complaint on or about May 14, 2021, and the Company moved to dismiss the amended complaint on June 14, 2021. By order dated March 31, 2022, the Court granted the Company’s motion and dismissed all of the claims against it in the amended complaint. The Court also denied the plaintiffs’ request for leave to file a further amended complaint. On April 28, 2022, the Plaintiffs filed a Notice of Appeal of the decision and filed their opening brief on the appeal in the United States Court of Appeals for the Second Circuit on August 18, 2022. The Company filed its brief in response on November 17, 2022. Plaintiffs filed their brief in reply in further support of their appeal on December 14, 2022. Oral argument in the appeal was held on October 3, 2023, and by order and opinion issued on February 1, 2024, the Second Circuit affirmed the District Court’s order dismissing all claims against all defendants, including the claims against the Company.
Additionally, the Company was dismissed from a class action relating to an interest rate swaps matter in 2017, but that matter continues against the remaining defendant financial institutions.
The Company records its best estimate of a loss, including estimated defense costs, when the loss is considered probable and the amount of such loss can be reasonably estimated. Based on its experience, the Company believes that the amount of damages claimed in a legal proceeding is not a meaningful indicator of the potential liability. At this time, the Company cannot reasonably predict the timing or outcomes of, or estimate the amount of loss, or range of loss, if any, related to its pending legal proceedings, including the matters described above, and therefore does not have any contingency reserves established for any of these matters.
Revolving Credit Facility
On November 21, 2023, the Company entered into a five year , $500.0 million unsecured revolving credit facility (the “2023 Revolving Credit Facility”) with a syndicate of banks, which replaced its $500.0 million secured credit facility entered into on April 8, 2019 and as amended on March 31, 2023 (the “2019 Revolving Credit Facility”). The 2019 Revolving Credit Facility had a scheduled maturity date of April 2024, but was terminated on November 21, 2023 in conjunction with entering into the 2023 Revolving Credit Facility. There were no outstanding borrowings under the 2019 Revolving Credit Facility at the time of termination and no penalties were due or owing and no penalties were required to be paid as a result of the termination.
142
The 2023 Revolving Credit Facility provides borrowing capacity to be used to fund ongoing working capital needs, letters of credit and for general corporate purposes, including potential future acquisitions and expansions. Subject to the satisfaction of certain conditions, the Company is able to increase the 2023 Revolving Credit Facility by $250.0 million with the consent of the lenders participating in the increase. Borrowings under the 2023 Revolving Credit Facility may be, at the option of the Company, in US Dollars, Euros or Sterling. The 2023 Revolving Credit Facility also provides for the issuance of up to $5.0 million of letters of credit as well as borrowings on same-day notice, referred to as swingline loans, in an amount of up to $50.0 million. On November 21, 2023, the closing date, the $0.5 million letters of credit outstanding under the 2019 Revolving Credit Facility were rolled over under the 2023 Revolving Credit Facility. The 2023 Revolving Credit Facility will mature on November 21, 2028.
Borrowings under the 2023 Revolving Credit Facility bear interest at a rate equal to, at the Company’s option, either (a) a base rate equal to the greatest of (i) the administrative agent’s prime rate, (ii) the federal funds effective rate plus ½ of 1.00 % and (iii) one month Term SOFR plus 1.00 % plus a credit adjustment spread of 0.10 %, in each case plus a margin based on the Company’s consolidated net leverage ratio ranging from 0.25 % to 0.75 %, or (b) a rate equal to (i) in the case of borrowings in US Dollars, Term SOFR plus a credit adjustment spread of 0.10 %, subject to a 0.00 % floor, (ii) in the case of borrowings in Sterling, SONIA subject to a 0.00 % floor, and (iii) in the case of borrowings in Euros, EURIBOR, subject to a 0.00 % floor, in each case plus a margin based on the Company’s consolidated net leverage ratio ranging from 1.25 % to 1.75 %. The agreement also includes a commitment fee of 0.25 % for available but unborrowed amounts and other administrative fees that are payable quarterly. Financial covenant requirements include maintaining minimum ratios related to interest coverage and leverage.
As of both December 31, 2023 and 2022, there were $0.5 no
Other Commitments
143
18. Earnings Per Share
The following table summarizes the calculations of basic and diluted earnings per share of Class A and Class B common stock for Tradeweb Markets Inc:
| Year Ended | ||||||||||||||||||||
| December 31, | ||||||||||||||||||||
| 2023 | 2022 | 2021 | ||||||||||||||||||
| (in thousands, except share and per share amounts) | ||||||||||||||||||||
Numerator: | ||||||||||||||||||||
| Net income attributable to Tradeweb Markets Inc. | $ | $ | $ | |||||||||||||||||
Less: Distributed and undistributed earnings allocated to unvested RSUs and unsettled vested PRSUs (1) | ( | ( | ||||||||||||||||||
| Net income attributable to outstanding shares of Class A and Class B common stock - Basic and Diluted | ||||||||||||||||||||
Denominator: | ||||||||||||||||||||
| Weighted average shares of Class A and Class B common stock outstanding - Basic | ||||||||||||||||||||
| Dilutive effect of PRSUs | ||||||||||||||||||||
| Dilutive effect of options | ||||||||||||||||||||
| Dilutive effect of RSUs | ||||||||||||||||||||
| Dilutive effect of PSUs | ||||||||||||||||||||
| Weighted average shares of Class A and Class B common stock outstanding - Diluted | ||||||||||||||||||||
| Earnings per share - Basic | $ | $ | $ | |||||||||||||||||
| Earnings per share - Diluted | $ | $ | $ | |||||||||||||||||
(1)During the years ended December 31, 2023 and 2022, there was a total of 270,249 and 193,441 , respectively, weighted average unvested RSUs and unsettled vested PRSUs that were considered a participating security for purposes of calculating earnings per share in accordance with the two-class method. There were none during the year ended December 31, 2021.
LLC Interests held by Continuing LLC Owners are redeemable in accordance with the TWM LLC Agreement, at the election of such holders, for shares of Class A or Class B common stock, as applicable, of Tradeweb Markets Inc. The potential dilutive effect of LLC Interests are evaluated under the if-converted method. The potential dilutive effect of PRSUs, shares underlying options, RSUs and PSUs are evaluated under the treasury stock method.
The following table summarizes the PRSUs, shares underlying options, RSUs, PSUs and weighted-average LLC Interests that were anti-dilutive for the periods indicated. As a result, these shares, which were outstanding, were excluded from the computation of diluted earnings per share for the periods indicated:
| Year Ended | ||||||||||||||||||||
| December 31, | ||||||||||||||||||||
| 2023 | 2022 | 2021 | ||||||||||||||||||
Anti-dilutive Shares: | ||||||||||||||||||||
| PRSUs | ||||||||||||||||||||
| Options | ||||||||||||||||||||
| RSUs | ||||||||||||||||||||
| PSUs | ||||||||||||||||||||
| LLC Interests | ||||||||||||||||||||
Shares of Class C and Class D common stock do not have economic rights in Tradeweb Markets Inc. and, therefore, are not included in the calculation of basic earnings per share and are not participating securities for purposes of the computation of diluted earnings per share.
144
19. Regulatory Capital Requirements
TWL, DW and TWD are subject to the Uniform Net Capital Rule 15c3-1 under the Exchange Act. TEL and TESL are subject to certain financial resource requirements with the FCA in the UK, TWJ is subject to certain financial resource requirements with the FCA in Japan, TWEU and TESBV are subject to certain finance resource requirements with the AFM in the Netherlands, YB is subject to certain financial resource requirements with ASIC in Australia and TDIFC is subject to certain financial resource requirements with DFSA in the Dubai International Financial Centre. At December 31, 2023 and 2022, the regulatory capital requirements and regulatory capital for these entities are as follows:
| December 31, 2023 | December 31, 2022 | |||||||||||||||||||||||||||||||||||||
| Regulatory Capital | Regulatory Capital Requirement | Excess Regulatory Capital | Regulatory Capital | Regulatory Capital Requirement | Excess Regulatory Capital | |||||||||||||||||||||||||||||||||
| (in thousands) | ||||||||||||||||||||||||||||||||||||||
| TWL | $ | $ | $ | $ | $ | $ | ||||||||||||||||||||||||||||||||
| DW | ||||||||||||||||||||||||||||||||||||||
| TWD | ||||||||||||||||||||||||||||||||||||||
| TEL | ||||||||||||||||||||||||||||||||||||||
| TWJ | ||||||||||||||||||||||||||||||||||||||
| TWEU | ||||||||||||||||||||||||||||||||||||||
| TESL | ||||||||||||||||||||||||||||||||||||||
| TESBV | ||||||||||||||||||||||||||||||||||||||
| YB | ||||||||||||||||||||||||||||||||||||||
| TDIFC | ||||||||||||||||||||||||||||||||||||||
As SEFs, TW SEF and DW SEF are required to maintain adequate financial resources and liquid financial assets in accordance with CFTC regulations. The required and maintained financial resources and liquid financial assets at December 31, 2023 and 2022 are as follows:
| December 31, 2023 | December 31, 2022 | |||||||||||||||||||||||||||||||||||||
| Financial Resources | Required Financial Resources | Excess Financial Resources | Financial Resources | Required Financial Resources | Excess Financial Resources | |||||||||||||||||||||||||||||||||
| (in thousands) | ||||||||||||||||||||||||||||||||||||||
| TW SEF | $ | $ | $ | $ | $ | $ | ||||||||||||||||||||||||||||||||
| DW SEF | $ | |||||||||||||||||||||||||||||||||||||
| December 31, 2023 | December 31, 2022 | |||||||||||||||||||||||||||||||||||||
| Liquid Financial Assets | Required Liquid Financial Assets | Excess Liquid Financial Assets | Liquid Financial Assets | Required Liquid Financial Assets | Excess Liquid Financial Assets | |||||||||||||||||||||||||||||||||
| (in thousands) | ||||||||||||||||||||||||||||||||||||||
| TW SEF | $ | $ | $ | $ | $ | $ | ||||||||||||||||||||||||||||||||
| DW SEF | ||||||||||||||||||||||||||||||||||||||
145
20. Business Segment and Geographic Information
The Company operates electronic marketplaces for the trading of products across the rates, credit, equities and money markets asset classes and provides related pre-trade and post-trade services. The Company’s operations constitute a single business segment because of the integrated nature of these marketplaces and services.
Information regarding revenue by client sector is as follows:
| Year Ended | ||||||||||||||||||||
| December 31, | ||||||||||||||||||||
| 2023 | 2022 | 2021 | ||||||||||||||||||
| (in thousands) | ||||||||||||||||||||
| Revenues | ||||||||||||||||||||
| Institutional | $ | $ | $ | |||||||||||||||||
| Wholesale | ||||||||||||||||||||
| Retail | ||||||||||||||||||||
| Market Data | ||||||||||||||||||||
| Total revenue | ||||||||||||||||||||
Operating expenses | ||||||||||||||||||||
Operating income | $ | $ | $ | |||||||||||||||||
The Company operates in the U.S. and internationally, primarily in the Europe, Asia and Australia regions. Revenues are attributed to geographic area based on the jurisdiction where the underlying transactions take place. The results by geographic region are not meaningful in understanding the Company’s business. Long-lived assets are attributed to the geographic area based on the location of the particular subsidiary.
The following table provides revenue by geographic area:
| Year Ended | ||||||||||||||||||||
| December 31, | ||||||||||||||||||||
| 2023 | 2022 | 2021 | ||||||||||||||||||
| (in thousands) | ||||||||||||||||||||
| Revenues | ||||||||||||||||||||
| U.S. | $ | $ | $ | |||||||||||||||||
| International | ||||||||||||||||||||
| Total revenue | $ | $ | $ | |||||||||||||||||
The following table provides information on the attribution of long-lived assets by geographic area:
| December 31, | ||||||||||||||
| 2023 | 2022 | |||||||||||||
| (in thousands) | ||||||||||||||
| Long-lived assets | ||||||||||||||
| U.S. | $ | $ | ||||||||||||
| International | ||||||||||||||
| Total | $ | $ | ||||||||||||
146
21. Subsequent Events
On February 2, 2024, the board of directors of Tradeweb Markets Inc. declared a cash dividend of $0.10
On February 2, 2024, Tradeweb Markets Inc., as the sole manager, approved a distribution by TWM LLC to its equityholders, including Tradeweb Markets Inc., in an aggregate amount of $62.1 million, as adjusted by required state and local tax withholdings that will be determined prior to the record date of March 1, 2024, payable on March 13, 2024.
147
ITEM 9. CHANGES IN AND DISAGREEMENTS WITH ACCOUNTANTS ON ACCOUNTING AND FINANCIAL DISCLOSURE.
None.
ITEM 9A. CONTROLS AND PROCEDURES.
Evaluation of Disclosure Controls and Procedures
Our management has evaluated, under the supervision of our Chief Executive Officer (“CEO”) and Chief Financial Officer (“CFO”), the effectiveness of our disclosure controls and procedures, as defined in Rule 13a‑15(e) of the Exchange Act, as of the end of the period covered by this Annual Report on Form 10‑K. Based on that evaluation, our CEO and CFO have concluded that our disclosure controls and procedures as of the end of the period covered by this Annual Report on Form 10‑K are effective at a reasonable assurance level in ensuring that information required to be disclosed in our Exchange Act reports is (1) recorded, processed, summarized and reported in a timely manner and (2) accumulated and communicated to our management, including our CEO and CFO, as appropriate to allow timely decisions regarding required disclosure. Our management, including our CEO and CFO, does not expect that our disclosure controls and procedures will prevent or detect all errors and all fraud. While our disclosure controls and procedures are designed to provide reasonable assurance of their effectiveness, because of the inherent limitations in all control systems, no evaluation of controls can provide absolute assurance that all control issues and instances of fraud, if any, within the Company have been detected.
Management’s Report on Internal Control Over Financial Reporting
Our management is responsible for establishing and maintaining adequate internal control over financial reporting for us as defined in Rule 13a-15(f) or 15d-15(f) under the Exchange Act.
A company’s internal control over financial reporting is a process designed to provide reasonable assurance regarding the reliability of financial reporting and the preparation of financial statements for external purposes in accordance with U.S. GAAP. A company’s internal control over financial reporting includes policies and procedures that: (1) pertain to the maintenance of records that in reasonable detail accurately and fairly reflect the transactions and dispositions of the assets of the company; (2) provide reasonable assurance that transactions are recorded as necessary to permit preparation of financial statements in accordance with U.S. GAAP, and that receipts and expenditures of the company are being made only in accordance with authorizations of management and directors of the company; and (3) provide reasonable assurance regarding prevention or timely detection of unauthorized acquisition, use or disposition of the company’s assets that could have a material effect on the financial statements. Because of its inherent limitations, internal control over financial reporting may not prevent or detect misstatements. Also, projections of any evaluation of effectiveness to future periods are subject to the risk that controls may become inadequate because of changes in conditions, or that the degree of compliance with the policies or procedures may deteriorate.
Our management, under the supervision and with the participation of our CEO and CFO, evaluated the effectiveness of our internal control over financial reporting as of December 31, 2023 using criteria established in Internal Control – Integrated Framework (2013) issued by the Committee of Sponsoring Organizations of the Treadway Commission (COSO).
Management, including our CEO and CFO, based on its assessment and those criteria, has concluded that our internal control over financial reporting was effective as of December 31, 2023.
The effectiveness of our internal control over financial reporting as of December 31, 2023 has been audited by Deloitte & Touche LLP, an independent registered public accounting firm, as stated in their report which appears herein.
Internal Control over Financial Reporting
There were no changes to our internal control over financial reporting during the quarter ended December 31, 2023 that have materially affected, or that are reasonably likely to materially affect, our internal control over financial reporting.
ITEM 9B. OTHER INFORMATION.
(a) None.
148
(b) Securities Trading Plans of Executive Officers and Directors
The following table describes trading plans intended to satisfy the affirmative defense conditions of Rule 10b5-1(c) under the Exchange Act, as defined in Item 408 of Regulation S-K (“Rule 10b5-1 trading arrangements”), adopted, modified or terminated by our executive officers and directors during the three months ended December 31, 2023.
| Name and Title | Action | Date | Aggregate Number of Securities to be Purchased or Sold | Scheduled Expiration Date (1) | |||||||||||||
Sale of an amount equal to up to: (A) | May 24, 2024 | ||||||||||||||||
Sale of an amount equal to up to: (A) | September 25, 2024 | ||||||||||||||||
(1) The Rule 10b5-1 trading arrangement may also expire on such earlier date as all such transactions under the trading arrangement are completed or at such time as such trading arrangement is otherwise terminated in accordance with its terms.
During the three months ended December 31, 2023, none of our directors or executive officers adopted , modified or terminated a non-Rule 10b5-1 trading arrangement (as defined in Item 408 of Regulation S-K).
ITEM 9C. DISCLOSURE REGARDING FOREIGN JURISDICTIONS THAT PREVENT INSPECTIONS.
Not applicable.
149
PART III
ITEM 10. DIRECTORS, EXECUTIVE OFFICERS AND CORPORATE GOVERNANCE.
The information required by this item will be included in our definitive proxy statement for the 2024 Annual Meeting of Stockholders and is incorporated herein by reference. We will file such definitive proxy statement with the SEC pursuant to Regulation 14A within 120 days after the fiscal year ended December 31, 2023.
ITEM 11. EXECUTIVE COMPENSATION.
The information required by this item will be included in our definitive proxy statement for the 2024 Annual Meeting of Stockholders and is incorporated herein by reference. We will file such definitive proxy statement with the SEC pursuant to Regulation 14A within 120 days after the fiscal year ended December 31, 2023.
ITEM 12. SECURITIES OWNERSHIP OF CERTAIN BENEFICIAL OWNERS AND MANAGEMENT AND RELATED STOCKHOLDER MATTERS.
The information required by this item will be included in our definitive proxy statement for the 2024 Annual Meeting of Stockholders and is incorporated herein by reference. We will file such definitive proxy statement with the SEC pursuant to Regulation 14A within 120 days after the fiscal year ended December 31, 2023.
ITEM 13. CERTAIN RELATIONSHIPS AND RELATED TRANSACTIONS, AND DIRECTOR INDEPENDENCE.
The information required by this item will be included in our definitive proxy statement for the 2024 Annual Meeting of Stockholders and is incorporated herein by reference. We will file such definitive proxy statement with the SEC pursuant to Regulation 14A within 120 days after the fiscal year ended December 31, 2023.
ITEM 14. PRINCIPAL ACCOUNTANT FEES AND SERVICES.
The information required by this item will be included in our definitive proxy statement for the 2024 Annual Meeting of Stockholders and is incorporated herein by reference. We will file such definitive proxy statement with the SEC pursuant to Regulation 14A within 120 days after the fiscal year ended December 31, 2023.
150
PART IV
ITEM 15. EXHIBITS AND FINANCIAL STATEMENT SCHEDULES.
1. Financial Statements.
The financial statements are set forth under Part II, Item 8. – “Financial Statements and Supplementary Data” of this Annual Report.
2. Financial Statement Schedules.
Financial statement schedules have been omitted because they are not required, are not applicable or the required information is included in the financial statements or the notes thereto in Part II, Item 8. – “Financial Statements and Supplementary Data.”
3. Exhibits.
The following exhibits are filed or furnished as a part of this Annual Report on Form 10-K:
| Exhibit Number | Description of Exhibit | |||||||
| 3.1 | ||||||||
| 3.2 | ||||||||
| 4.1 | ||||||||
| 4.2 | ||||||||
| 10.1 | ||||||||
| 10.2 | ||||||||
| 10.3 | ||||||||
| 10.4 | ||||||||
| 10.5 | ||||||||
| 10.6 | ||||||||
| 10.6.1 | ||||||||
151
| Exhibit Number | Description of Exhibit | |||||||
| 10.6.2 | ||||||||
| 10.7 | ||||||||
| 10.8† | ||||||||
| 10.9† | ||||||||
| 10.10† | ||||||||
| 10.11† | ||||||||
| 10.12† | ||||||||
| 10.13† | ||||||||
| 10.14† | ||||||||
| 10.15† | ||||||||
| 10.16† | ||||||||
| 10.17† | ||||||||
| 10.18† | ||||||||
| 10.19† | ||||||||
10.20+ | ||||||||
| 10.21† | ||||||||
| 10.22 | ||||||||
| 10.23++ | ||||||||
152
| Exhibit Number | Description of Exhibit | |||||||
| 10.24++ | ||||||||
| 10.25++ | ||||||||
| 10.26 | ||||||||
| 10.27++ | ||||||||
| 10.28++ | ||||||||
| 10.29† | ||||||||
| 10.30† | ||||||||
| 10.31† | ||||||||
| 10.32† | ||||||||
| 10.33† | ||||||||
| 10.34† | ||||||||
| 10.35† | ||||||||
| 10.36*++ | ||||||||
| 10.37 | ||||||||
| 21.1* | ||||||||
| 23.1* | ||||||||
| 31.1* | ||||||||
153
| Exhibit Number | Description of Exhibit | |||||||
| 31.2* | ||||||||
| 32.1** | ||||||||
| 32.2** | ||||||||
| 97.1*† | ||||||||
| 101.INS* | XBRL Instance Document - the instance document does not appear in the Interactive Data File because its XBRL tags are embedded within the Inline XBRL Document. | |||||||
| 101.SCH* | Inline XBRL Taxonomy Extension Schema Document. | |||||||
| 101.CAL* | Inline XBRL Taxonomy Extension Calculation Linkbase Document. | |||||||
| 101.DEF* | Inline XBRL Taxonomy Extension Definition Linkbase Document. | |||||||
| 101.LAB* | Inline XBRL Taxonomy Extension Label Linkbase Document. | |||||||
| 101.PRE* | Inline XBRL Taxonomy Extension Presentation Linkbase Document. | |||||||
| 104* | Cover Page Interactive Data File (formatted as Inline XBRL and contained in Exhibit 101) | |||||||
* Filed herewith.
** Furnished herewith.
† Indicates a management contract or compensatory plan or arrangement.
+ Certain portions of this exhibit have been omitted and separately filed with the SEC pursuant to a request for confidential treatment which has been granted by the SEC.
++ Portions of this exhibit have been redacted in compliance with Regulation S-K Item 601(b)(10).
ITEM 16. FORM 10-K SUMMARY.
None.
154
SIGNATURES
Pursuant to the requirements of Section 13 or 15(d) of the Securities Exchange Act of 1934, the registrant has duly caused this report to be signed on its behalf by the undersigned, thereunto duly authorized.
| TRADEWEB MARKETS INC. | ||||||||
| February 9, 2024 | /s/ William Hult | |||||||
| By: | William Hult | |||||||
| Chief Executive Officer | ||||||||
Pursuant to the requirements of Section 13 or 15(d) of the Securities Exchange Act of 1934, this report has been signed below by the following persons on behalf of the registrant and in the capacities and on the dates indicated.
Signature | Title | Date | ||||||||||||
/s/ William Hult | Chief Executive Officer (Principal Executive Officer) and Director | February 9, 2024 | ||||||||||||
William Hult | ||||||||||||||
/s/ Sara Furber | Chief Financial Officer (Principal Financial Officer and Principal Accounting Officer) | February 9, 2024 | ||||||||||||
Sara Furber | ||||||||||||||
/s/ Jacques Aigrain | Director | February 9, 2024 | ||||||||||||
Jacques Aigrain | ||||||||||||||
/s/ Balbir Bakhshi | Director | February 9, 2024 | ||||||||||||
| Balbir Bakhshi | ||||||||||||||
/s/ Steven Berns | Director | February 9, 2024 | ||||||||||||
| Steven Berns | ||||||||||||||
/s/ Troy Dixon | Director | February 9, 2024 | ||||||||||||
Troy Dixon | ||||||||||||||
/s/ Scott C. Ganeles | Director | February 9, 2024 | ||||||||||||
Scott C. Ganeles | ||||||||||||||
/s/ Catherine Johnson | Director | February 9, 2024 | ||||||||||||
Catherine Johnson | ||||||||||||||
/s/ Paula B. Madoff | Director | February 9, 2024 | ||||||||||||
Paula B. Madoff | ||||||||||||||
/s/ Thomas Pluta | Director | February 9, 2024 | ||||||||||||
Thomas Pluta | ||||||||||||||
/s/ Murray Roos | Director | February 9, 2024 | ||||||||||||
Murray Roos | ||||||||||||||
/s/ Rana Yared | Director | February 9, 2024 | ||||||||||||
Rana Yared | ||||||||||||||
155