(State or other jurisdiction of incorporation or organization) |
(I.R.S. Employer Identification No.) | |
| (Address of principal executive offices) | (Zip Code) | |
Title of each class |
Trading Symbol(s) |
Name of each exchange on which registered | ||
| Accelerated filer ☐ | ||
Non-accelerated filer ☐ |
Smaller reporting company | |
| Emerging growth company |
Auditor Firm PCAOB ID: |
Auditor Name: |
Auditor Location: |
UNITED BANKSHARES, INC.
FORM 10-K
(Continued)
As of the date of filing this Annual report, neither the annual shareholders’ report for the year ended December 31, 2023, nor the proxy statement for the annual United shareholders’ meeting has been mailed to shareholders.
CROSS-REFERENCE INDEX
| Page | ||||||
| Item 1. |
3 | |||||
| Item 1A. |
18 | |||||
| Item 1B. |
30 | |||||
| Item 1C. |
30 | |||||
| Item 2. |
31 | |||||
| Item 3. |
32 | |||||
| Item 4. |
32 | |||||
| Item 5. |
33 | |||||
| Item 6. |
35 | |||||
| Item 7. |
MANAGEMENT’S DISCUSSION AND ANALYSIS OF FINANCIAL CONDITION AND RESULTS OF OPERATIONS |
35 | ||||
| Item 7A. |
61 | |||||
| Item 8. |
66 | |||||
| Item 9. |
CHANGES IN AND DISAGREEMENTS WITH ACCOUNTANTS ON ACCOUNTING AND FINANCIAL DISCLOSURES |
135 | ||||
| Item 9A. |
135 | |||||
| Item 9B. |
135 | |||||
| Item 9C. |
DISCLOSURE REGARDING FOREIGN JURISDICTIONS THAT PREVENT INSPECTIONS |
136 | ||||
| Item 10. |
137 | |||||
| Item 11. |
137 | |||||
| Item 12. |
SECURITY OWNERSHIP OF CERTAIN BENEFICIAL OWNERS AND MANAGEMENT AND RELATED STOCKHOLDER MATTERS |
137 | ||||
| Item 13. |
CERTAIN RELATIONSHIPS AND RELATED TRANSACTIONS, AND DIRECTOR INDEPENDENCE |
137 | ||||
| Item 14. |
138 | |||||
| Item 15. |
139 | |||||
| Item 16. |
142 | |||||
2
UNITED BANKSHARES, INC.
FORM 10-K, PART I
| Item 1. | BUSINESS |
Organizational History and Subsidiaries
United Bankshares, Inc. (“United,” “we,” “us,” “our,” or the “Company”) is a West Virginia corporation registered as a financial holding company pursuant to the Bank Holding Company Act of 1956, as amended. United was incorporated on March 26, 1982, organized on September 9, 1982, and began conducting business on May 1, 1984 with the acquisition of three wholly-owned subsidiaries. Since its formation in 1982, United has acquired thirty-three banking institutions. United has one banking subsidiary “doing business” under the name of United Bank, operating under the laws of Virginia. United Bank offers a full range of commercial and retail banking services and products. United also owns nonbank subsidiaries which engage in other community banking services such as asset management, real property title insurance, financial planning, mortgage banking, and brokerage services.
Web Site Address
United’s web site address is “www.ubsi-inc.com”. United makes available free of charge on its web site the annual report on Form 10-K, quarterly reports on Form 10-Q, current reports on Form 8-K, and amendments thereto, as soon as reasonably practicable after United files such reports with the Securities and Exchange Commission (“SEC”). The reference to United’s web site does not constitute incorporation by reference of the information contained in the web site and should not be considered part of this document. The SEC also maintains a website at www.sec.gov that contains reports, proxy and information statements and other information regarding issuers that file electronically with the SEC.
Business of United
As a financial holding company, United’s present businesses are community banking and mortgage banking. As of December 31, 2023, United’s consolidated assets approximated $29.9 billion and total shareholders’ equity approximated $4.8 billion.
United is permitted to acquire other banks and bank holding companies, as well as thrift institutions. United is also permitted to engage in certain non-banking activities which are closely related to banking under the provisions of the Bank Holding Company Act and the Federal Reserve Board’s Regulation Y. Management continues to consider such opportunities as they arise, and in this regard, management from time to time makes inquiries, proposals, or expressions of interest as to potential opportunities, although no agreements or understandings to acquire other banks or bank holding companies or non-banking subsidiaries or to engage in other nonbanking activities, other than those identified herein, presently exist.
On December 3, 2021, United completed its acquisition of Community Bankers Trust Corporation (“Community Bankers Trust”), the parent company of Essex Bank (“Essex”) with $1.8 billion in assets, headquartered in Richmond, Virginia. The acquisition of Community Bankers Trust enhanced United’s existing presence in the DC Metro MSA and took United into new markets including Baltimore, Annapolis, Lynchburg, Richmond, and the Northern Neck of Virginia. It also strategically connected our Mid-Atlantic and Southeast footprints. On May 1, 2020, United completed its acquisition of Carolina Financial Corporation (“Carolina Financial”), the parent company of CresCom Bank (“CresCom”) with $5.0 billion in assets, headquartered in Charleston, South Carolina. The acquisition of Carolina Financial broadened United’s footprint in the Southeast region with some of the most desirable banking markets in the nation. Prior to Carolina Financial, United more than doubled its size through three acquisitions in less than three and a half years. In January 2014, United closed its acquisition of Virginia Commerce Bancorp, Inc., followed by the November 2015 announcement of the Bank of Georgetown transaction which closed June 2016. In August 2016, United announced the Cardinal Financial Corporation acquisition which closed April 2017.
3
Business of Subsidiaries
United, through its subsidiaries, engages primarily in community banking and mortgage banking offering most types of business permitted by law and regulation. Included among the banking services offered are the acceptance of deposits in checking, savings, time and money market accounts; the making and servicing of personal, commercial, and floor plan loans; and the making of construction and real estate loans. Also offered are individual retirement accounts, safe deposit boxes, wire transfers and other standard banking products and services. As part of its lending function, United Bank offers credit card services.
United Bank maintains a trust department which acts as trustee under wills, trusts and pension and profit sharing plans, as executor and administrator of estates, and as guardian for estates of minors and incompetents, and in addition performs a variety of investment and security services. United Bank provides services to its correspondent banks such as the buying and selling of federal funds.
George Mason Mortgage, LLC (“George Mason”), a wholly-owned subsidiary of United Bank, is engaged in the operation of a general mortgage and agency business, including the origination and acquisition of residential real estate loans for resale and generally the activities commonly conducted by a mortgage banking company. Residential real estate loans are sold without the servicing rights retained. These loans are for single-family, owner-occupied residences with either adjustable or fixed rate terms, with a variety of maturities tailored to effectively serve its markets.
Crescent Mortgage Company (“Crescent”), a wholly-owned subsidiary of United Bank, is a mortgage company approved to originate loans in 48 states partnering with community banks, credit unions and mortgage brokers. Much like George Mason, Crescent is also engaged in the operation of a general mortgage and agency business, including the origination and acquisition of residential real estate loans for resale and the activities commonly conducted by a mortgage banking company. Depending on the pricing of residential real estate loans sold, Crescent may retain the servicing rights. In addition, at certain times, Crescent may purchase or sell rights to service mortgage loans from or to third parties. During the fourth quarter of 2023, Crescent exited the third-party origination (“TPO”) business.
United Brokerage Services, Inc., a wholly-owned subsidiary of United Bank, is a fully-disclosed broker/dealer and a Registered Investment Advisor with the Financial Industry Regulatory Authority (“FINRA”), the Securities and Exchange Commission, and a member of the Securities Investor Protection Corporation. United Brokerage Services, Inc. offers a wide range of investment products as well as comprehensive financial planning and asset management services to the general public.
United Bank is a member of a network of automated teller machines known as the New York Currency Exchange (“NYCE”) ATM network. The NYCE is an interbank network connecting the ATMs of various financial institutions in the United States and Canada.
United Bank offers secure Digital Banking for consumer and commercial customers. Digital Banking is available on a multitude of devices to include a browser-based experience, mobile (Apple, Android) and tablet applications. Digital Banking allows customers to manage their financial lives from any place they can access the internet (cellular or Wi-Fi). Customers can quickly check balances, pay bills, complete internal and Zelle® transfers; all from the convenience of their devices. They can also set-up text and email alerts to notify them of large transactions and help them avoid overdraft fees. Commercial customers have many of the same services, including balance inquiry, cash management, sweeps and wire transfers. Consumers can also research United Bank products and open deposits accounts online and apply for mortgages from United Bank’s website.
United Bank also offers an automated telephone banking system, Telebanc, which allows customers to access their personal account(s) or business account(s) information from a touch-tone telephone.
4
Lending Activities
United’s loan and lease portfolio, net of unearned income, increased $800.9 million or 3.90% in 2023 due mainly to loan growth in almost all major categories of loans. The loan and lease portfolio is mainly comprised of commercial, real estate and consumer loans including credit card and home equity loans. Since year-end 2022, commercial, financial and agricultural loans increased $264.5 million or 2.28%. In particular, commercial real estate loans increased $304.7 million or 3.80% while commercial loans (not secured by real estate) decreased $40.1 million or 1.11%. Within commercial loans (not secured by real estate), Payment Protection Program (“PPP”) loans declined $14.8 million. Construction and land development loans increased $221.3 million or 7.56%, residential real estate loans increased $608.3 million or 13.05%, and consumer loans decreased $301.1 million or 22.05% due mainly to a decrease in indirect automobile financing.
Commercial Loans and Leases
The commercial loan and lease portfolio consists of loans and leases to corporate borrowers primarily in small to mid-size industrial and commercial companies, as well as automobile dealers, service, retail and wholesale merchants. Collateral securing these loans includes equipment, machinery, inventory, receivables, vehicles and commercial real estate. Commercial loans and leases are considered to contain a higher level of risk than other loan types although care is taken to minimize these risks. Numerous risk factors impact this portfolio including industry specific risks such as economy, new technology, labor rates and cyclicality, as well as customer specific factors, such as cash flow, financial structure, operating controls and asset quality. United diversifies risk within this portfolio by closely monitoring industry concentrations and portfolios to ensure that it does not exceed established lending guidelines. Diversification is intended to limit the risk of loss from any single unexpected economic event or trend. Underwriting standards require a comprehensive credit analysis and independent evaluation of virtually all larger balance commercial loans by the loan committee prior to approval.
Real Estate Loans
Commercial real estate loans consist of commercial mortgages, which generally are secured by nonresidential and multi-family residential properties. Also included in this portfolio are loans that are secured by owner-occupied real estate, but made for purposes other than the construction or purchase of real estate. Commercial real estate loans are to many of the same customers and carry similar industry risks as the commercial loan portfolio. Real estate mortgage loans to consumers are secured primarily by a first lien deed of trust. These loans are traditional one-to-four family residential mortgages. The loans generally do not exceed an 80% loan to value ratio at the loan origination date and are at either a variable rate or fixed rate of interest. These loans are considered to be of normal risk. Also included in the category of real estate mortgage loans are home equity loans.
As of December 31, 2023, approximately $526.4 million or 2.46% of United’s loan portfolio were real estate loans that met the regulatory definition of a high loan-to-value loan. A high loan-to-value real estate loan is defined as any loan, line of credit, or combination of credits secured by liens on or interests in real estate that equals or exceeds a certain percentage established by United’s primary regulator of the real estate’s appraised value, unless the loan has other appropriate credit support. The certain percentage varies depending on the loan type and collateral. Appropriate credit support may include mortgage insurance, readily marketable collateral, or other acceptable collateral that reduces the loan-to-value ratio below the certain percentage.
Consumer Loans
Consumer loans are secured by automobiles, boats, recreational vehicles, and other personal property. Personal loans, student loans and unsecured credit card receivables are also included as consumer loans. United monitors the risk associated with these types of loans by monitoring such factors as portfolio growth, lending policies and economic conditions. Underwriting standards are continually evaluated and modified based upon these factors.
Underwriting Standards
United’s loan underwriting guidelines and standards are updated periodically and are presented for approval by the Board of Directors of United Bank. The purpose of the standards and guidelines is to grant loans on a sound and collectible basis; to invest available funds in a safe, profitable manner; to serve the legitimate credit needs of the communities of United’s primary market area; and to ensure that all loan applicants receive fair and equal treatment in the lending process. It is the intent of the underwriting guidelines and standards to minimize loan losses by carefully investigating the credit history of each applicant, verify the source of repayment and the ability of the applicant to repay, collateralize those loans in which collateral is deemed to be required, exercise care in the documentation of the application, review, approval, and origination process, and administer a comprehensive loan collection program.
5
United’s underwriting standards and practices are designed to originate both fixed and variable rate loan products in a manner which is consistent with the prudent banking practices applicable to these exposures. Typically, both fixed and variable rate loan underwriting practices incorporate conservative methodology, including the use of stress testing for commercial loans, and other product appropriate measures designed to provide an adequate margin of safety for the full collection of both principal and interest within contractual terms. Consumer real estate secured loans are underwritten to the initial rate, and to a higher assumed rate commensurate with normal market conditions. Therefore, it is the intent of United’s underwriting standards to ensure that adequate primary repayment capacity exists to address both future increases in interest rates, and fluctuations in the underlying cash flows available for repayment. Historically, and at December 31, 2023, United has not offered “teaser rate” loans, and had no loan portfolio products which were specifically designed for “sub-prime” borrowers. Management defines “sub-prime” borrowers as consumer borrowers with a credit score of less than 660.
The above guidelines are adhered to and subject to the experience, background and personal judgment of the loan officer assigned to the loan application. A loan officer may grant, with justification, a loan with variances from the underwriting guidelines and standards. However, the loan officer may not exceed his or her respective lending authority without obtaining the prior, proper approval as outlined in United’s loan policy from a superior, a regional supervisor or market president (dual approval per policy) or the Loan Committee, whichever is deemed appropriate for the nature of the variance.
Loan Concentrations
United has commercial loans, including real estate and owner-occupied, income-producing real estate and land development loans, of approximately $14.8 billion as of December 31, 2023. These loans are primarily secured by real estate located in West Virginia, southeastern Ohio, southwestern Pennsylvania, Virginia, Maryland, North Carolina, South Carolina and the District of Columbia. United categorizes these commercial loans by industry according to the North American Industry Classification System (“NAICS”) to monitor the portfolio for possible concentrations in one or more industries. As of the most recent fiscal year-end, United has one such industry classification that exceeded 10% of total loans. As of December 31, 2023, approximately $9.9 billion or 46.4% of United’s total loan portfolio were for real estate and construction. The loans were originated by United’s subsidiary bank using underwriting standards as set forth by management. United’s loan administration policies are focused on the risk characteristics of the loan portfolio, including commercial real estate loans, in terms of loan approval and credit quality. It is the opinion of management that these loans do not pose any unusual risks and that adequate consideration has been given to the above loans in establishing the allowance for loan losses.
United does not have a loan classification concentration in the restaurants, hotel and accommodations industry. As of December 31, 2023, approximately $1.3 billion or 5.98% of United’s total loan portfolio were to hotels and other traveler accommodations. In addition, United does not have a loan classification concentration in the mining, quarrying and oil and gas extraction industry. As of December 31, 2023, approximately $162.6 million or less than 1% of United’s total loan portfolio were for the purpose of extracting, manufacturing and distributing oil, coal and natural gas.
Secondary Markets
United generally originates loans within the primary market area of United Bank. United may from time to time make loans to borrowers and/or on properties outside of its primary market area as an accommodation to its existing customers.
United Bank, George Mason, and Crescent originate and acquire residential real estate loans for resale in the secondary market. Mortgage loan originations are generally intended to be sold in the secondary market on a best efforts or mandatory basis. Depending on the pricing in the marketplace, servicing rights are either sold or retained.
6
During 2023, United originated $860.9 million of real estate loans for sale in the secondary market and sold $861.5 million of loans designated as held for sale in the secondary market. Net gains on the sales of these loans during 2023 were $25.9 million.
The principal sources of revenue from United’s mortgage banking business are: (i) loan origination fees; (ii) gains or losses from the sale of loans, (iii) interest earned on mortgage loans during the period that they are held by United pending sale, if any; and (iv) income on mortgage loans with servicing retained.
Loan Servicing
United through its mortgage banking subsidiary, Crescent, may retain the rights to service a portion of the loans sold in the third-party market, as part of its mortgage banking activities, for which United receives service fee income. In addition, at certain times United may purchase rights to service from third parties. These rights are known as mortgage servicing rights, or MSRs, where the owner of the MSR acts on behalf of the mortgage loan owner and has the contractual right to receive a stream of cash flows in exchange for performing specified mortgage servicing functions. These duties typically include, but are not limited to, performing loan administration, collection, and default activities, including the collection and remittance of loan payments, responding to customer inquiries, accounting for principal and interest, holding custodial (impound) funds for the payment of property taxes and insurance premiums, counseling delinquent mortgagors, modifying loans and supervising foreclosures and property dispositions. United subservices the duties and responsibilities obligated to the owner of the MSR to a third party provider for which we pay a fee.
Investment Activities
United’s investment policy stresses the management of the investment securities portfolio, which includes both securities held to maturity and securities available for sale, to maximize return over the long-term in a manner that is consistent with good banking practices and relative safety of principal. United currently does not engage in trading account activity. The Asset/Liability Management Committee of United is responsible for the coordination and evaluation of the investment portfolio.
Sources of funds for investment activities include “core deposits”. Core deposits include certain demand deposits, savings and NOW accounts. These deposits are relatively stable and they are the lowest cost source of funds available to United. Short-term borrowings have also been a significant source of funds. These include federal funds purchased, securities sold under agreements to repurchase and FHLB borrowings.
United’s investment portfolio is comprised of a significant amount of mortgage-backed securities, asset-backed securities, obligations of states and political subdivisions, U.S. Treasury securities and obligations of U.S. Government corporations and agencies and corporate securities. Obligations of states and political subdivisions are comprised of primarily “investment grade” rated municipal securities. Interest and dividends on securities for the years of 2023, 2022, and 2021 were $151.1 million, $114.5 million, and $61.9 million, respectively. For the year of 2023, United realized net losses on sales of securities of $7.7 million. For the years of 2022 and 2021, United realized net gains on sales of securities of $2 thousand and $2.8 million, respectively.
Human Capital
At United, one of our key competitive advantages is our people. Investment in our human capital is a top priority for the Company. As of December 31, 2023, United and its subsidiaries had 2,635 employees and officers. Of the 2,635 employees and officers, 2,298 are employed in the community banking segment, 265 are employed in the mortgage banking segment and 72 are in a general support and administrative function for the Company. None of these employees are represented by a collective bargaining unit and management considers employee relations to be excellent. We emphasize positive attitudes, communication, teamwork, goal attainment, personal growth, and the pursuit of excellence when it comes to delivering high-quality service to our customers and fellow employees.
Our human capital management strategy focuses on recruiting, developing, and engaging a talented and diverse workforce. Our strategy embodies our core values of integrity, teamwork, hard work, and caring, and foster positive attitudes, communication, goal attainment, personal growth, and the pursuit of United’s mission of excellence in service to our shareholders, our customers, our communities, and our employees.
7
Focusing on talent selection and developing top talent remains a strong pillar of our organization. Our primary focus is to attract and advance the careers of employees with diverse backgrounds, experiences, ideas, and skills.
We host college recruiting and internship programs that attract candidates from a variety of colleges and universities within our footprint. These two programs build a talent pipeline and prioritize these individuals for internal openings.
Our Leadership Development Program provides an opportunity for the Company’s rising talent from across our footprint and various business lines to strengthen their leadership and communication skills, increase their visibility within the organization, and establish internal networks. This program helps to cultivate a future pipeline of leaders across the institution. Over a period of four years, these individuals are empowered to work on pertinent projects designed to enhance revenue, reduce expenses, and improve risk management functions, while developing the members’ leadership, interactive, and managerial skills. Past members now hold key positions across the Company ranging from Department Managers to Line of Business Leaders to Executive Officers.
One of our strategic priorities to ensure leadership continuity is effective succession planning. The Company has a formal plan to identify potential successors and actively develop those employees. The plan includes all critical management positions throughout the organization and is updated annually. This process is dynamic, and we have added additional management positions to the plan as the Company continues to evolve and grow. The Company’s executives constantly review and evaluate personnel to identify pools of candidates with high levels of leadership potential and promote their progress by engineering their range of work experiences. We also have an internal and external training platform to ensure our employees have the necessary tools to fill these key positions effectively.
United also has an effective and efficient onboarding program, introducing new team members to the culture and enabling an environment that helps them be engaged in their roles. We have rigorous interdepartmental training and development programs that provide employees with capabilities to perform their job functions, deliver results, and advance their careers.
We partnered with West Virginia University to develop an executive training program aimed at developing the technical, theoretical, and applied skills needed for a successful launch into a career in Business Banking. High-performing employees are given opportunities to attend state and national banking schools, conferences, industry peer groups, and training webinars. All United employees have access to career development and skills-based training through our internal online Human Resources (“HR”) management system.
United makes every effort to ensure that our compensation and benefits packages are inclusive and competitive to attract and retain talent. Our comprehensive benefit plans are designed to fully support our full-time and eligible part-time employees and their families through every stage of their life cycle, recognizing our employees’ individual needs and offering flexible benefit options. As an enhanced benefit, we recently increased our parental leave and family medical leave and added coverage for enhanced infertility coverage. We provide comprehensive health and wellness plans for all eligible employees as well as retirees of United. We also provide other paid-time off benefits such as vacation, sick time, personal days, and birthdays. The Company also provides financial wellness benefits to all employees through our 401K Plan in which the Company provides a competitive match of employee contributions. All employees are eligible to take advantage of United’s Employee Stock Purchase Plan through payroll deductions.
United Bank’s annual performance evaluation process provides the opportunity for discussing, planning, and reviewing the performance of each employee. The goal is to help employees clearly define and understand the responsibilities and expectations of their position while also identifying employees with high potential for advancement within the company. Performance evaluations also provide an opportunity for employees to be awarded additional compensation based on merit. Managers are expected to maintain open communication throughout the year as it pertains to the performance and mentorship of their employees. Training is provided to managers annually to prepare them for difficult conversations, analyzing team compensation, and maintaining fairness, among other topics.
8
We are committed to providing a safe and healthy work environment for our employees and offer services to foster the best physical, mental, and social well-being of our workforce. United’s Employee Assistance Program provides all employees a comprehensive and personalized process with a tailored approach to meet employees where they are and supports them through whatever journey they may be facing. The Employee Assistance Program provides unlimited phone access for information, resources, and referrals and provides sessions with a counselor for the employee and their family members. The employee, and their family, can also take advantage of a host of web-based resources the program provides.
The commitment to our employees and their family’s well-being is at the forefront for United and allows us to be competitive in attracting and retaining top talent and ensuring our employee benefits remain competitive when compared with other institutions.
In addition, at United, we are committed to nurturing an inclusive culture that: is reflective of the communities we serve; celebrates diversity of thought, backgrounds, and experience; promotes respect and a shared purpose; and aligns with our core values. United has a cross-functional Diversity, Equity, and Inclusion Council (“DE&I Council”) to advise executive and senior leadership on the Company’s diversity, equity, and inclusion strategy and to implement and manage programs to accomplish and support these priorities. United added a diversity trainer to the Learning & Talent Development Team who facilitates workshops available to all employees. In 2023, 100% of new hires completed implicit bias training and new supervisors participated in cultivating inclusive team workshops.
DE&I employee liaisons were selected through an application process, received training on courageous conversations, and then held open forums with local colleagues related to various DE&I topics. The Management Information System (“MIS”) team has collaborated with the HR department to apply best practices in data governance to the metrics that are so critical to measuring success in DE&I.
To continue to cultivate our inclusive culture, United offers employees a way to report confidential and anonymous issues of concern through our website. Whether it is a compliance or regulatory violation, wrongdoing, improper conduct, or harassment, the confidential report will be instantly and discreetly forwarded for review.
Competition
United faces a high degree of competition in all of the markets it serves. We face strong competition in gathering deposits, making loans and obtaining client assets for management by our investment or trust operations. United considers all of West Virginia to be included in its market area. This area includes the five largest West Virginia Metropolitan Statistical Areas (“MSA”): the Parkersburg MSA, the Charleston MSA, the Huntington MSA, the Morgantown MSA and the Wheeling MSA. United serves the Ohio counties of Lawrence, Belmont, Jefferson and Washington and Fayette county in Pennsylvania primarily because of their close proximity to the Ohio and Pennsylvania borders and United banking offices located in those counties or in nearby West Virginia. United’s Virginia markets include the Maryland, northern Virginia and Washington, D.C. MSA, the Winchester MSA, the Harrisonburg MSA, and the Charlottesville MSA. Through its acquisition of Carolina Financial, United’s market also includes the Coastal, Midlands, and Upstate regions of South Carolina, including the Charleston (Charleston, Dorchester and Berkeley Counties), Myrtle Beach (Horry and Georgetown Counties), Columbia (Richland and Lexington Counties), and the Upstate (Greenville and Spartanburg Counties) areas as well as areas in North Carolina including Wilmington (New Hanover County), Raleigh-Durham (Durham and Wake Counties), Charlotte-Concord-Gastonia (NC and SC) and the southeastern coastal region of North Carolina (Bladen, Brunswick, Columbus, Cumberland, Duplin and Robeson Counties). Through its acquisition of Community Bankers Trust, United added new markets in Baltimore and Annapolis, Maryland and Lynchburg and Richmond, Virginia as well as the Northern Neck of Virginia. United considers all of the above locations to be the primary market areas for the business of its banking and mortgage banking subsidiaries.
With prior regulatory approval, Virginia banks are permitted unlimited branch banking throughout each state. In addition, interstate acquisitions of and by Virginia banks and bank holding companies are permissible on a reciprocal basis, as well as reciprocal interstate acquisitions by thrift institutions. These conditions serve to intensify competition within United’s market.
9
As of December 31, 2023, there were 58 bank holding companies operating in the State of West Virginia registered with the Federal Reserve System and the West Virginia Board of Banking and Financial Institutions, 64 bank holding companies operating in the Commonwealth of Virginia registered with the Federal Reserve System and the Virginia State Corporation Commission, 66 bank holding companies operating in the State of North Carolina registered with the Federal Reserve System and the N.C. Office of the Commissioner of Banks and 99 bank holding companies operating in the State of South Carolina registered with the Federal Reserve System and the South Carolina State Board of Financial Institutions. These holding companies are headquartered in various states and control banks throughout West Virginia, Virginia, North Carolina and South Carolina, which compete for business as well as for the acquisition of additional banks.
Regulation and Supervision
United, as a financial holding company, is subject to the restrictions of the Bank Holding Company Act of 1956, as amended, and is registered pursuant to its provisions. As such, United is subject to the reporting requirements of and examination by the Board of Governors of the Federal Reserve System (“Board of Governors”).
The Bank Holding Company Act prohibits the acquisition by a bank holding company of direct or indirect ownership of more than five percent of the voting shares of any bank within the United States without prior approval of the Board of Governors. With certain exceptions, a bank holding company also is prohibited from acquiring direct or indirect ownership or control of more than five percent of the voting shares of any company which is not a bank, and from engaging directly or indirectly in business unrelated to the business of banking, or managing or controlling banks.
The Board of Governors, in its Regulation Y, permits financial holding companies to engage in preapproved non-banking activities closely related to banking or managing or controlling banks. Approval of the Board of Governors is necessary to engage in certain other non-banking activities which are not preapproved or to make acquisitions of corporations engaging in these activities. In addition, on a case-by-case basis, the Board of Governors may approve other non-banking activities. A financial holding company may also engage in financial activities, including securities underwriting and dealing, insurance agency and underwriting activities, and merchant banking activities.
As a financial holding company doing business in West Virginia, United is also subject to regulation and examination by the West Virginia Board of Banking and Financial Institutions (the “West Virginia Banking Board”) and must submit annual reports to the West Virginia Banking Board. Further, any acquisition application that United must submit to the Board of Governors must also be submitted to the West Virginia Banking Board for approval.
The Board of Governors has broad authority to prohibit activities of financial holding companies and their non-banking subsidiaries that represent unsafe and unsound banking practices or which constitute violations of laws or regulations. The Board of Governors also can assess civil money penalties for certain activities conducted on a knowing and reckless basis, if those activities caused a substantial loss to a depository institution. The penalties can be as high as $1 million for each day the activity continues.
United Bank, as a Virginia state member bank, is subject to supervision, examination, and regulation by the Federal Reserve System, and as such, is subject to applicable provisions of the Federal Reserve Act and regulations issued thereunder. United Bank is subject to the Virginia banking statutes and regulations, and is primarily regulated by the Virginia Bureau of Financial Institutions. As a member of the Federal Deposit Insurance Corporation (“FDIC”), United Bank’s deposits are insured as required by federal law. Bank regulatory authorities regularly examine revenues, loans, investments, management practices, and other aspects of United Bank. These examinations are conducted primarily to protect depositors and not shareholders. In addition to these regular examinations, United Bank must furnish to regulatory authorities quarterly reports containing full and accurate statements of its affairs.
United is also under the jurisdiction of the SEC and certain state securities commissions in regard to the offering and sale of its securities. Generally, United must file under the Securities Exchange Act of 1933, as amended, to issue additional shares of its common stock. United is also registered under and is subject to the regulatory and disclosure requirements of the Securities Exchange Act of 1934, as amended, as administered by the SEC. United is listed on the NASDAQ Global Select Market under the quotation symbol “UBSI,” and is subject to the rules of the NASDAQ for listed companies.
10
SEC regulations require us to disclose certain types of business and financial data on a regular basis to the SEC and to our shareholders. We are required to file annual, quarterly and current reports with the SEC. We prepare and file an annual report on Form 10-K with the SEC that contains detailed financial and operating information, as well as a management response to specific questions about United’s operations. SEC regulations require that our annual reports to shareholders contain certified financial statements and other specific items such as management’s discussion and analysis of our financial condition and results of operations. We must also file quarterly reports with the SEC on Form 10-Q that contain detailed financial and operating information for the prior quarter and we must file current reports on Form 8-K to provide the pubic with information on recent material events.
In addition to periodic reporting to the SEC, we are subject to proxy rules and tender offer rules issued by the SEC. Our officers, directors and principal shareholders (holding 10% or more of our stock) must also submit reports to the SEC regarding their holdings of our stock and any changes to such holdings, and they are subject to short-swing profit liability.
Dividends and Stock Repurchases
The principal source of United’s liquidity is dividends from United Bank. The prior approval of the Federal Reserve Board is required if the total of all dividends declared by a state-chartered member bank in any calendar year would exceed the sum of the bank’s net profits for that year and its retained net profits for the preceding two calendar years, less any required transfers to surplus or to fund the retirement of preferred stock. Federal law also prohibits a state-chartered, member bank from paying dividends that would be greater than the bank’s undivided profits. United Bank is also subject to limitations under Virginia state law regarding the level of dividends that may be paid.
In addition, United and United Bank are subject to other regulatory policies and requirements relating to the payment of dividends, including requirements to maintain adequate capital above regulatory minimums. The appropriate federal regulatory authority is authorized to determine under certain circumstances relating to the financial condition of a bank holding company or a bank that the payment of dividends would be an unsafe or unsound practice and to prohibit payment thereof. The appropriate federal regulatory authorities have stated that paying dividends that deplete a bank’s capital base to an inadequate level would be an unsafe and unsound banking practice and that banking organizations should generally pay dividends only out of current operating earnings. In addition, in the current financial and economic environment, the Federal Reserve Board has indicated that bank holding companies should carefully review their dividend policy and has discouraged payment ratios that are at maximum allowable levels unless both asset quality and capital are very strong.
In July 2019, the federal bank regulators adopted final rules (the “Capital Simplifications Rules”) that, among other things, eliminated the standalone prior approval requirement in the Basel III Capital Rules for any repurchase of common stock. In certain circumstances, United’s repurchases of its common stock may be subject to a prior approval or notice requirement under other regulations, policies or supervisory expectations of the Federal Reserve Board. Any redemption or repurchase of preferred stock or subordinated debt remains subject to the prior approval of the Federal Reserve Board.
The Inflation Reduction Act of 2022 (the “IRA”) imposes a new 1% excise tax on the fair market value of stock repurchased after December 31, 2022 by publicly traded U.S. corporations. With certain exceptions, the value of stock repurchased is determined net of stock issued in the year, including shares issued pursuant to compensatory arrangements.
Dodd-Frank Wall Street Reform and Consumer Protection Act of 2010
On July 21, 2010, President Obama signed the Dodd-Frank Wall Street Reform and Consumer Protection Act (the Dodd-Frank Act), into law. The Dodd-Frank Act significantly changes regulation of financial institutions and the financial services industry. The Dodd-Frank Act includes, among other things, provisions creating a Financial Services Oversight Council to identify emerging systemic risks and improve interagency cooperation; centralizing the responsibility for consumer financial protection by creating a new agency, the Consumer Financial Protection Bureau, which is responsible for implementing, examining and enforcing compliance with federal consumer financial laws; permanently raising the current standard maximum deposit insurance amount to $250,000; establishing strengthened capital standards for banks, and disallowing trust preferred securities as qualifying for Tier 1 capital (subject to certain grandfather provisions for existing trust preferred securities); establishing new minimum mortgage underwriting standards; granting the Federal Reserve Board the power to regulate debit card interchange fees; and implementing corporate governance changes.
11
On May 24, 2018, President Trump signed into law the “Economic Growth, Regulatory Relief, and Consumer Protection Act (the EGRRCPA Act)” which provides certain limited amendments to the Dodd-Frank Act, as well as certain targeted modifications to other post-financial crisis regulatory requirements. In addition, the legislation establishes new consumer protections and amends various securities- and investment company-related requirements. The EGRRCPA Act primarily amends several other laws, including the Truth in Lending Act (TILA), Federal Credit Union Act, Federal Deposit Insurance Act, Fair Credit Reporting Act (FCRA) and Securities Act of 1933. The Act is divided into six titles, which aim to: improve consumer access to mortgage credit (Title I); provide regulatory relief and protect consumer access to credit (Title II); protect the credit information of consumers, including veterans and servicemembers (Title III); tailor regulations for certain bank holding companies, including raising the threshold levels for exemption from certain prudential standards and stress testing (Title IV); encourage capital formation by reforming certain Securities and Exchange Commission (SEC) regulations (Title V); and protect student borrowers (Title VI).
Deposit Insurance
The deposits of United Bank are insured by the FDIC to the extent provided by law. Accordingly, United Bank is also subject to regulation by the FDIC. United Bank is subject to deposit insurance assessments to maintain the Deposit Insurance Fund (“DIF”) of the FDIC. The FDIC utilizes a risk-based assessment system that imposes insurance premiums based upon a risk matrix that takes into account a bank’s capital level and supervisory rating (CAMELS rating) and certain financial measures to assess an institution’s ability to withstand asset-related stress and funding-related stress. The risk matrix utilizes four risk categories which are distinguished by capital levels and supervisory ratings.
In April 2011, the FDIC implemented rulemaking under the Dodd-Frank Act to reform the deposit insurance assessment system. The final rule redefined the assessment base used for calculating deposit insurance assessments. Specifically, the rule bases assessments on an institution’s total assets less tangible capital, as opposed to total deposits. Since the new base is larger than the prior base, the FDIC also proposed lowering assessment rates so that the rules would not significantly alter the total amount of revenue collected from the industry. The new assessment scale ranges from 2.5 basis points for the least risky institutions to 45 basis points for the riskiest.
As part of its changes in April 2011, the FDIC established a new methodology for determining assessment rates for large and highly complex institutions, as defined in the rules. In October 2012, the FDIC announced revised changes to some of the definitions used to determine assessment rates for these large and highly complex insured depository institutions. The rule generally applies to FDIC-regulated banks with assets greater than $10 billion and took effect April 1, 2013. In the second quarter of 2018, United Bank was reclassified as a large institution for deposit insurance assessment purposes. Generally, this new classification resulted in higher FDIC insurance premiums.
On September 30, 2018, the Deposit Insurance Fund Reserve Ratio reached 1.36%, exceeding the statutorily required minimum reserve ratio of 1.35% ahead of the September 30, 2020, deadline required under the Dodd-Frank Act. FDIC regulations provide for two changes to deposit insurance assessments upon reaching the minimum: (1) surcharges on insured depository institutions with total consolidated assets of $10 billion or more (large banks) ceased on December 28, 2018; and (2) small banks will receive assessment credits for the portion of their assessments that contributed to the growth in the reserve ratio from between 1.15% and 1.35%, to be applied when the reserve ratio is at or above 1.38%. United benefited from both these changes.
On October 18, 2022, the FDIC adopted a final rule to increase initial base deposit insurance assessment rates for insured depository institutions by 2 basis points, beginning with the first quarterly assessment period of 2023. The increased assessment rate schedules would remain in effect unless and until the reserve ratio of the Deposit Insurance Fund meets or exceeds 2 percent. As a result of the new rule, the FDIC insurance costs of insured depository institutions, including United Bank, would generally increase.
12
On November 16, 2023, the FDIC Board of Directors approved a final rule to implement a special assessment to recover the loss to the DIF associated with protecting uninsured depositors following the closures of Silicon Valley Bank and Signature Bank. The Federal Deposit Insurance Act (“FDI Act”) requires the FDIC to take this action in connection with the systemic risk determination announced on March 12, 2023. The special assessment did not apply to any banking organization (defined to include FDIC-insured financial institutions that are not subsidiaries of a holding company and FDIC–insured financial institutions that are subsidiaries of a holding company with one or more FDIC–insured financial institution subsidiaries) with less than $5 billion in total consolidated assets. The FDIC estimated that of the total cost of the failures of Silicon Valley Bank and Signature Bank of approximately $16.3 billion was attributable to the protection of uninsured depositors. The assessment base for the special assessment is equal to an insured depository institution’s (“IDI’s”) estimated uninsured deposits reported as of December 31, 2022, adjusted to exclude the first $5 billion, applicable either to the IDI, if an IDI is not a subsidiary of a holding company, or at the banking organization level, to the extent that an IDI is part of a holding company with one or more subsidiary IDIs. The special assessment will be collected at an annual rate of approximately 13.4 basis points for an anticipated total of eight quarterly assessment periods. The special assessment will be collected beginning with the first quarterly assessment period of 2024 (i.e., January 1 through March 31, 2024) with an invoice payment date of June 28, 2024. Because the estimated loss pursuant to the systemic risk determination will be periodically adjusted, the FDIC could: (1) cease collection early, if it has collected enough to recover actual or estimated losses; (2) extend the special assessment collection period one or more quarters beyond the initial eight-quarter collection period, if actual or estimated losses exceed the amounts collected; and (3) impose a final shortfall special assessment on a one-time basis after the receiverships for Silicon Valley Bank and Signature Bank terminate, if actual losses exceed the amounts collected. As a result of this final rule, United accrued $12.0 million in the fourth quarter of 2023 to pay the special assessment over the next eight assessment periods. United expects the special assessments will be tax deductible.
United’s FDIC insurance expense totaled $30.4 million, $12.0 million, and $8.3 million in 2023, 2022 and 2021, respectively.
Capital Requirements
United and United Bank are each required to comply with applicable capital adequacy standards established by the Federal Reserve Board (the “Basel III Capital Rules”). Since fully phased in on January 1, 2019, the Basel III Capital Rules require United and United Bank to maintain the following:
| • | A minimum ratio of Common Equity Tier 1 (“CET1”) to risk-weighted assets of at least 4.5%, plus a 2.5% “capital conservation buffer” (resulting in a minimum ratio of CET1 to risk-weighted assets of 7.0%); |
| • | A minimum ratio of Tier 1 capital to risk-weighted assets of at least 6.0%, plus the capital conservation buffer (resulting in a minimum Tier 1 capital ratio of 8.5%); |
| • | A minimum ratio of total capital (Tier 1 capital plus Tier 2 capital) to risk-weighted assets of at least 8.0%, plus the capital conservation buffer (resulting in a minimum total capital ratio of 10.5%); and |
| • | A minimum leverage ratio of 4.0%, calculated as the ratio of Tier 1 capital to average consolidated assets as reported on consolidated financial statements (known as the “leverage ratio”). |
Banking institutions that fail to meet the effective minimum ratios once the capital conservation buffer is taken into account, as detailed above, will be subject to constraints on capital distributions, including dividends and share repurchases, and certain discretionary executive compensation. The severity of the constraints depends on the amount of the shortfall and the institution’s “eligible retained income” (that is, the greater of (i) net income for the preceding four quarters, net of distributions and associated tax effects not reflected in net income and (ii) the average net income over the preceding four quarters).
The Basel III Capital Rules and the Capital Simplification Rules also provide for a number of deductions from and adjustments to CET1. These include, for example, the requirement that certain deferred tax assets and significant investments in non-consolidated financial entities be deducted from CET1 to the extent that any one such category exceeds 25% of CET1. Prior to the adoption of the Capital Simplification Rules in July 2019, amounts were deducted from CET1 to the extent that any one such category exceeded 10% of CET1 or all such items, in the aggregate, exceeded 15% of CET1. The Capital Simplification Rules took effect for United and United Bank as of January 1, 2020. These limitations did not impact our regulatory capital during any of the reported periods.
13
In addition, under the general risk-based capital rules, the effects of accumulated other comprehensive income items included in capital were excluded for the purposes of determining regulatory capital ratios. Under the Basel III Capital Rules, the effects of certain accumulated other comprehensive income items are not excluded; however, non-advanced approaches banking organizations, including United and United Bank, were able to make a one-time permanent election to continue to exclude these items. Both United and United Bank made this election in order to avoid significant variations in the level of capital depending upon the impact of interest rate fluctuations on the fair value of their available-for-sale securities portfolio. Under the Basel III Capital Rules, trust preferred securities no longer included in our Tier 1 capital may nonetheless be included as a component of Tier 2 capital on a permanent basis without phase-out.
In February 2019, the federal bank regulatory agencies issued a final rule (the “2019 CECL Rule”) that revised certain capital regulations to account for changes to credit loss accounting under U.S. GAAP. The 2019 CECL Rule included a transition option that allows banking organizations to phase in, over a three-year period, the day-one adverse effects of adopting a new accounting standard related to the measurement of current expected credit losses (“CECL”) on their regulatory capital ratios (three-year transition option). In March 2020, the federal bank regulatory agencies issued an interim final rule that maintains the three-year transition option of the 2019 CECL Rule and also provides banking organizations that were required under U.S. GAAP (as of January 2020) to implement CECL before the end of 2020 the option to delay for two years an estimate of the effect of CECL on regulatory capital, relative to the incurred loss methodology’s effect on regulatory capital, followed by a three-year transition period (five-year transition option). We elected to adopt the five-year transition option.
The Basel III Capital Rules prescribe a standardized approach for risk weightings that expanded the risk-weighting categories from the general risk-based capital rules to a much larger and more risk-sensitive number of categories, depending on the nature of the assets, generally ranging from 0% for U.S. government and agency securities, to 600% for certain equity exposures (and higher percentages for certain other types of interests), and resulting in higher risk weights for a variety of asset categories. In November 2019, the federal banking agencies adopted a rule revising the scope of commercial real estate mortgages subject to a 150% risk weight.
In December 2017, the Basel Committee published standards that it described as the finalization of the Basel III post-crisis regulatory reforms. Among other things, these standards revise the Basel Committee’s standardized approach for credit risk (including by recalibrating risk weights and introducing new capital requirements for certain “unconditionally cancellable commitments,” such as unused credit card lines of credit) and provides a new standardized approach for operational risk capital. Under the current U.S. capital rules, operational risk capital requirements and a capital floor apply only to advanced approaches institutions, and not to United or United Bank.
In July 2023, the federal banking regulators proposed revisions to the Basel III Capital Rules to implement the Basel Committee’s 2017 standards and make other changes to the Basel III Capital Rules. The proposal introduces revised credit risk, equity risk, operational risk, credit valuation adjustment risk and market risk requirements, among other changes. However, the revised capital requirements of the proposed rule would not apply to United or United Bank because they have less than $100 billion in total consolidated assets and trading assets and liabilities below the threshold for market risk requirements.
Failure to meet statutorily mandated capital guidelines or more restrictive ratios separately established for a financial institution could subject United to a variety of enforcement remedies, including issuance of a capital directive, the termination of deposit insurance by the FDIC, a prohibition on accepting or renewing brokered deposits, limitations on the rates of interest that the institution may pay on its deposits and other restrictions on its business. As described below, significant additional restrictions can be imposed on United if it would fail to meet applicable capital requirements.
Prompt Corrective Action
The Federal Deposit Insurance Corporation Improvement Act of 1991 (“FDICIA”) establishes a regulatory scheme, which ties the level of supervisory intervention by bank regulatory authorities primarily to a depository institution’s capital category. Among other things, FDICIA authorizes regulatory authorities to take “prompt corrective action” with respect to depository institutions that do not meet minimum capital requirements. FDICIA establishes five capital tiers: well capitalized, adequately capitalized, undercapitalized, significantly undercapitalized and critically undercapitalized.
14
Effective January 1, 2015, under the Basel III Capital Rules, the current prompt corrective action requirements for an institution to be “well-capitalized” is a total risk-based capital ratio of 10% or greater, a Tier 1 risk-based capital ratio of 8% or greater, a CET1 ratio of 6.5% or greater and a Tier 1 leverage ratio of 5 percent or greater.
United Bank was considered a “well capitalized” institution as of December 31, 2023. Well-capitalized institutions are permitted to engage in a wider range of banking activities, including among other things, the accepting of “brokered deposits,” and the offering of interest rates on deposits higher than the prevailing rate in their respective markets.
Community Reinvestment Act
The Community Reinvestment Act of 1977 (“CRA”) requires depository institutions to assist in meeting the credit needs of their market areas consistent with safe and sound banking practice. Under the CRA, each depository institution is required to help meet the credit needs of its market areas by, among other things, providing credit to low- and moderate-income individuals and communities. Depository institutions are periodically examined for compliance with the CRA and are assigned ratings. Banking regulators take into account CRA ratings when considering approval of a proposed transaction.
In 2023, United Bank received a CRA Performance Evaluation from the Federal Reserve Bank of Richmond (the “FRB”) with a rating of “Satisfactory.”
On October 24, 2023, the Federal Reserve Board, the FDIC, and the Office of the Comptroller of the Currency (“OCC”) published a final CRA rule that creates a modernized rule for the banking industry. The final rule updates the CRA regulations to achieve the following key goals: (1) encourage banks to expand access to credit, investment, and banking services in LMI communities; (2) adapt to changes in the banking industry, including mobile and online banking; (3) provide greater clarity and consistency in the application of the CRA regulations; and (4) tailor CRA evaluations and data collection to bank size and type. Most of the rule’s requirements will be applicable beginning January 1, 2026. The remaining requirements, including the data reporting requirements, will be applicable on January 1, 2027. We will evaluate the impact of these changes to these new CRA rules and their impact to our financial condition, results of operations, and/or liquidity, which is not known at this time.
Deposit Acquisition Limitation
Under West Virginia banking law, an acquisition or merger is not permitted if the resulting depository institution or its holding company, including its affiliated depository institutions, would assume additional deposits to cause it to control deposits in the State of West Virginia in excess of twenty five percent (25%) of such total amount of all deposits held by insured depository institutions in West Virginia. This limitation may be waived by the Commissioner of Banking by showing good cause.
Consumer Laws and Regulations
In addition to the banking laws and regulations discussed above, bank subsidiaries are also subject to certain consumer laws and regulations that are designed to protect consumers in transactions with banks. Among the more prominent of such laws and regulations are the Truth in Lending Act, the Home Mortgage Disclosure Act, the Truth in Savings Act, the Electronic Funds Transfer Act, the Expedited Funds Availability Act, the Equal Credit Opportunity Act, the Fair Credit Reporting Act, the Fair Debt Collection Practices Act, the Right to Financial Privacy Act and the Fair Housing Act. These laws and regulations mandate certain disclosure requirements and regulate the manner in which financial institutions must deal with customers when taking deposits or making loans to such customers. United’s bank subsidiary must comply with the applicable provisions of these consumer protection laws and regulations as part of its ongoing customer relations.
15
As discussed above, the Dodd-Frank Act centralized responsibility for consumer financial protection by creating the CFPB, and giving it responsibility for implementing, examining and enforcing compliance with federal consumer protection laws. The CFPB has broad rulemaking, supervisory and enforcement authority over consumer financial products and services, including deposit products, residential mortgages, home-equity loans, and credit cards. The CFPB’s functions include investigating consumer complaints, rulemaking, supervising and examining banks’ consumer transactions, and enforcing rules related to consumer financial products and services. Banks with more than $10 billion in assets, such as United Bank, are subject to supervision by the CFPB with respect to these federal consumer financial laws.
Anti-Money Laundering and the USA Patriot Act
A major focus of governmental policy on financial institutions in recent years has been aimed at combating money laundering and terrorist financing. The USA PATRIOT Act of 2001, or the USA Patriot Act, substantially broadened the scope of United States anti-money laundering laws and regulations by imposing significant new compliance and due diligence obligations, creating new crimes and penalties and expanding the extra-territorial jurisdiction of the United States. Financial institutions are also prohibited from entering into specified financial transactions and account relationships and must use enhanced due diligence procedures in their dealings with certain types of high-risk customers and implement a written customer identification program. Financial institutions must take certain steps to assist government agencies in detecting and preventing money laundering and report certain types of suspicious transactions. Regulatory authorities routinely examine financial institutions for compliance with these obligations, and failure of a financial institution to maintain and implement adequate programs to combat money laundering and terrorist financing, or to comply with all of the relevant laws or regulations, could have serious financial, legal and reputational consequences for the institution, including causing applicable bank regulatory authorities not to approve merger or acquisition transactions when regulatory approval is required or to prohibit such transactions even if approval is not required. Regulatory authorities have imposed cease and desist orders and civil money penalties against institutions found to be violating these obligations.
The Anti-Money Laundering Act of 2020 (“AMLA”), which amends the Bank Secrecy Act of 1970 (“BSA”), was enacted in January 2021. The AMLA is intended to be a comprehensive reform and modernization to U.S. bank secrecy and anti-money laundering laws. Among other things, it codifies a risk-based approach to anti-money laundering compliance for financial institutions; requires the U.S. Department of the Treasury to promulgate priorities for anti-money laundering and countering the financing of terrorism policy; requires the development of standards for testing technology and internal processes for BSA compliance; expands enforcement- and investigation-related authority, including increasing available sanctions for certain BSA violations; and expands BSA whistleblower incentives and protections. Many of the statutory provisions in the AMLA will require additional rulemakings, reports and other measures, and the impact of the AMLA will depend on, among other things, rulemaking and implementation guidance. In June 2021, the Financial Crimes Enforcement Network, a bureau of the U.S. Department of the Treasury, issued the priorities for anti-money laundering and countering the financing of terrorism policy required under the AMLA. The priorities include: corruption, cybercrime, terrorist financing, fraud, transnational crime, drug trafficking, human trafficking and proliferation financing.
Incentive Compensation
The Federal Reserve Board reviews, as part of its regular, risk-focused examination process, the incentive compensation arrangements of banking organizations, such as United, that are not “large, complex banking organizations.” These reviews are tailored to each organization based on the scope and complexity of the organization’s activities and the prevalence of incentive compensation arrangements. The findings of this supervisory initiative will be included in reports of examination. Deficiencies will be incorporated into the organization’s supervisory ratings, which can affect the organization’s ability to make acquisitions and take other actions. Enforcement actions may be taken against a banking organization if its incentive compensation arrangements, or related risk-management control or governance processes, pose a risk to the organization’s safety and soundness and the organization is not taking prompt and effective measures to correct the deficiencies.
In June 2010, the Federal Reserve Board, OCC and FDIC issued comprehensive final guidance on incentive compensation policies intended to ensure that the incentive compensation policies of banking organizations do not undermine the safety and soundness of such organizations by encouraging excessive risk-taking. The guidance, which covers all employees that have the ability to materially affect the risk profile of an organization, either individually or as part of a group, is based upon the key principles that a banking organization’s incentive compensation arrangements should (i) provide incentives that do not encourage risk-taking beyond the organization’s ability to effectively identify and manage risks, (ii) be compatible with effective internal controls and risk management, and (iii) be supported by strong corporate governance, including active and effective oversight by the organization’s board of directors.
16
In April and May of 2016, the Federal Reserve Board, other federal banking agencies and the SEC (the “Agencies”) jointly published proposed rulemaking designed to implement provisions of the Dodd-Frank Act prohibiting incentive compensation arrangements that would encourage inappropriate risk taking at a covered institution, which includes a bank or bank holding company with $1 billion or more of assets, such as United. The proposed rule expanded beyond the June 2010 principals based guidance and broadened the scope to include community banks. The proposed rules (i) prohibit incentive-based compensation arrangements that encourage executive officers, employees, directors or principal shareholders to expose the institution to inappropriate risks by providing excessive compensation (based on the standards for excessive compensation adopted pursuant to the FDIA) and (ii) prohibit incentive-based compensation arrangements for executive officers, employees, directors or principal shareholders that could lead to a material financial loss for the institution. The proposed rule requires covered institutions to establish policies and procedures for monitoring and evaluating their compensation practices.
In August 2022, the SEC adopted final rules requiring public companies to disclose the relationship between the executive compensation actually paid to the company’s named executive officers (“NEOs”) and the company’s financial performance. The final rules implement the “pay versus performance” disclosure requirements mandated by Section 953(a) of the Dodd-Frank Act. Disclosure related to these final rules was effective for United’s proxy statement filed in 2023.
In October 2022, the SEC adopted the final “clawback” rule mandated by Section 954 of the Dodd-Frank Act directing national securities exchanges and associations, including the NASDAQ, to implement listing standards that require listed companies to adopt policies mandating the recovery or “clawback” of excess incentive-based compensation earned by a current or former executive officer during the three fiscal years preceding the date the listed company is required to prepare an accounting restatement, including to correct an error that would result in a material misstatement if the error were corrected in the current period or left uncorrected in the current period. The final rule required United to adopt a clawback policy within 60 days after such listing standard became effective.
In June 2023, the New York Stock Exchange and Nasdaq Stock Market adopted these required listing standards mandated by Section 954 of the Dodd-Frank Act, which were effective on October 2, 2023. Each listed issuer was required to adopt a policy relating to the recovery of erroneously awarded compensation no later than December 1, 2023, which is 60 days following the effective date. The incentive compensation received by executives on or after October 2, 2023 is subject to the issuer’s recovery policies. Issuers that do not adopt and comply with the compensation recovery policies or those that do not disclose the policy will be subject to delisting. United adopted a “clawback” policy on November 17, 2023 and is filed as Exhibit 97 to this Form 10-K.
Cybersecurity
The federal banking regulators regularly issue new guidance and standards, and update existing guidance and standards, regarding cybersecurity intended to enhance cyber risk management among financial institutions. Financial institutions are expected to comply with such guidance and standards and to accordingly develop appropriate security controls and risk management processes. If we fail to observe such regulatory guidance or standards, we could be subject to various regulatory sanctions, including financial penalties.
In November 2021, the federal banking agencies adopted a final rule, with compliance by May 1, 2022, that requires banking organizations to notify their primary banking regulator within 36 hours of determining that a “computer-security incident” has materially disrupted or degraded, or is reasonably likely to materially disrupt or degrade, the banking organization’s ability to carry out banking operations or deliver banking products and services to a material portion of its customer base, its businesses and operations that would result in material loss, or its operations that would impact the stability of the United States.
17
In July 2023, the SEC issued a final rule, “Cybersecurity Risk Management, Strategy, Governance, and Incident Disclosure,” which requires registrants to provide investors, through enhanced and standardized disclosures, greater insight into material cybersecurity incidents and the registrants’ cybersecurity risk management, strategy and governance. See Item 1C. Cybersecurity for information on United’s risk management, strategy and governance processes related to cybersecurity.
| Item 1A. | RISK FACTORS |
United is subject to risks inherent to the Company’s business. The material risks and uncertainties that management believes affect the Company are described below. Before making an investment decision, you should carefully consider the risks and uncertainties described below together with all of the other information included or incorporated by reference in this report. The risks and uncertainties described below are not the only ones facing the Company. Additional risks and uncertainties that management is not aware of or focused on or that management currently deems immaterial may also impair United’s business operations. This report is qualified in its entirety by these risk factors.
REGULATORY AND LITIGATION RISKS
United is subject to extensive government regulation and supervision.
United is subject to extensive federal and state regulation, supervision and examination which vests significant discretion in the various regulatory authorities. Banking regulations are primarily intended to protect depositors’ funds, federal deposit insurance funds and the banking system as a whole, not shareholders. These regulations affect United’s lending practices, capital structure, investment practices, dividend policy, operations and growth, among other things. These regulations also impose obligations to maintain appropriate policies, procedures and controls, among other things, to detect, prevent and report money laundering and terrorist financing and to verify the identities of United’s customers. Congress and federal regulatory agencies continually review banking laws, regulations and policies for possible changes. The Dodd-Frank Act, enacted in July 2010, instituted major changes to the banking and financial institutions regulatory regimes. Other changes to statutes, regulations or regulatory policies, including changes in interpretation or implementation of statutes, regulations or policies, could affect United in substantial and unpredictable ways. Such changes could subject the Company to additional costs, limit the types of financial services and products United may offer and/or increase the ability of nonbanks to offer competing financial services and products, among other things. United expends substantial effort and incurs costs to improve its systems, audit capabilities, staffing and training in order to satisfy regulatory requirements, but the regulatory authorities may determine that such efforts are insufficient. Failure to comply with relevant laws, regulations or policies could result in enforcement and other legal actions, sanctions by regulatory agencies, civil money and criminal penalties, the loss of FDIC insurance, the revocation of a banking charter, significant fines and/or reputation damage, which could have a material adverse effect on United’s business, financial condition and results of operations. In this regard, government authorities, including the bank regulatory agencies, are pursuing aggressive enforcement actions with respect to compliance and other legal matters involving financial activities, which heightens the risks associated with actual and perceived compliance failures. Directives issued to enforce such actions may be confidential and thus, in some instances, we are not permitted to publicly disclose these actions. Any of the foregoing could have a material adverse effect on our business, financial condition and results of operations. See the section captioned “Regulation and Supervision” included in Item 1. While the Company has policies and procedures designed to prevent any such violations, there can be no assurance that such violations will not occur.
In the normal course of business, United and its subsidiaries are routinely subject to examinations and challenges from federal and state tax authorities regarding the amount of taxes due in connection with investments that the Company has made and the businesses in which United has engaged. Recently, federal and state taxing authorities have become increasingly aggressive in challenging tax positions taken by financial institutions. These tax positions may relate to tax compliance, sales and use, franchise, gross receipts, payroll, property and income tax issues, including tax base, apportionment and tax credit planning. The challenges made by tax authorities may result in adjustments to the timing or amount of taxable income or deductions or the allocation of income among tax jurisdictions. If any such challenges are made and are not resolved in the Company’s favor, they could have a material adverse effect on United’s financial condition and results of operations.
18
The Consumer Financial Protection Bureau (“CFPB”) may reshape the consumer financial laws through rulemaking and enforcement of the prohibitions against unfair, deceptive and abusive business practices. Compliance with any such change may impact the business operations of depository institutions offering consumer financial products or services, including United Bank.
The CFPB has broad rulemaking authority to administer and carry out the provisions of the Dodd-Frank Act with respect to financial institutions that offer covered financial products and services to consumers. The CFPB has also been directed to write rules identifying practices or acts that are unfair, deceptive or abusive in connection with any transaction with a consumer for a consumer financial product or service, or the offering of a consumer financial product or service. The concept of what may be considered to be an “abusive” practice is relatively new under the law. Moreover, United Bank is supervised and examined by the CFPB for compliance with the CFPB’s regulations and policies. The costs and limitations related to this additional regulatory reporting regimen have yet to be fully determined, although they may be material and the limitations and restrictions that will be placed upon United Bank with respect to its consumer product offering and services may produce significant, material effects on United Bank (and United’s) profitability.
United is subject to higher regulatory capital requirements and failure to comply with these standards may impact dividend payments, equity repurchases and executive compensation.
United and United Bank are each required to comply with applicable capital adequacy standards established by the Federal Reserve Board (the “FRB”). From time to time, the FRB changes these capital adequacy standards. In particular, the capital requirements applicable to United under the Basel III rules became fully effective on January 1, 2019. Under the Basel III rules, United is required to maintain a common equity Tier 1 capital ratio of 4.5%, a Tier 1 capital ratio of 6%, a total capital ratio of 8%, and a leverage ratio of 4%. In addition, United must maintain an additional capital conservation buffer of 2.5% of total risk weighted assets.
Banking institutions that fail to meet the effective minimum ratios including the capital conservation buffer will be subject to constraints on capital distributions, including dividends and share repurchases, and certain discretionary executive compensation. The severity of the constraints depends on the amount of the shortfall and the institution’s “eligible retained income” (that is, four quarter trailing net income, net of distributions and tax effects not reflected in net income).
The Basel III changes have resulted in generally higher minimum capital ratios than in the past that requires United and its subsidiaries to maintain capital buffers above minimum requirements to avoid restrictions on capital distributions and executive bonus payments. In addition, the application of more stringent capital requirements for United could, among other things, result in lower returns on invested capital, require the raising of additional capital and result in additional regulatory actions if United were to be unable to comply with such requirements. Implementation of changes to asset risk weightings for risk based capital calculations, items included or deducted in calculating regulatory capital and/or additional capital conservation buffers could result in management modifying its business strategy and could limit United’s ability to make distributions, including paying dividends.
United’s earnings are significantly affected by the fiscal and monetary policies of the federal government and its agencies.
The policies of the Federal Reserve impact United significantly. The Federal Reserve regulates the supply of money and credit in the United States. Its policies directly and indirectly influence the rate of interest earned on loans and paid on borrowings and interest-bearing deposits and can also affect the value of financial instruments we hold. Those policies determine to a significant extent our cost of funds for lending and investing. Changes in those policies are beyond our control and are difficult to predict. Federal Reserve policies can also affect our borrowers, potentially increasing the risk that they may fail to repay their loans. For example, a tightening of the money supply by the Federal Reserve could reduce the demand for a borrower’s products and services. This could adversely affect the borrower’s earnings and ability to repay its loan, which could have a material adverse effect on our financial condition and results of operations.
19
United may be terminated as a servicer of mortgage loans, be required to repurchase a mortgage loan or reimburse investors for credit losses on a mortgage loan, or incur costs, liabilities, fines and other sanctions if we fail to satisfy our servicing obligations, including our obligations with respect to mortgage loan foreclosure actions.
United, through its mortgage banking subsidiary, Crescent, acts as servicer for approximately $1.2 billion of mortgage loans owned by third parties as of December 31, 2023. As a servicer for those loans, United has certain contractual obligations, including foreclosing on defaulted mortgage loans or, to the extent applicable, considering alternatives to foreclosure such as loan modifications or short sales. If United commits a material breach of its obligations as servicer, United may be subject to termination as servicer if the breach is not cured within a specified period of time following notice, causing United to lose servicing income.
In some cases, United may be contractually obligated to repurchase a mortgage loan or reimburse the investor for credit losses incurred on the loan as a remedy for servicing errors with respect to the loan. If United has increased repurchase obligations because of claims that United did not satisfy our obligations as a servicer, or increased loss severity on such repurchases, United may have a significant reduction to net servicing income within its noninterest income. United may incur costs if United is required to, or if United elects to, re-execute or re-file documents or take other action in its capacity as a servicer in connection with pending or completed foreclosures. United may incur litigation costs if the validity of a foreclosure action is challenged by a borrower. If a court were to overturn a foreclosure because of errors or deficiencies in the foreclosure process, United may have liability to the borrower and/or to any title insurer of the property sold in foreclosure if the required process was not followed. These costs and liabilities may not be legally or otherwise reimbursable to United. In addition, if certain documents required for a foreclosure action are missing or defective, United could be obligated to cure the defect or repurchase the loan. United may incur liability to securitization investors relating to delays or deficiencies in its processing of mortgage assignments or other documents necessary to comply with state law governing foreclosures. The fair value of United’s mortgage servicing rights may be negatively affected to the extent our servicing costs increase because of higher foreclosure costs. United may be subject to fines and other sanctions imposed by federal or state regulators as a result of actual or perceived deficiencies in our foreclosure practices or in the foreclosure practices of other mortgage loan servicers. Any of these actions may harm United’s reputation or negatively affect its home lending or servicing business.
United may be required to repurchase mortgage loans or indemnify buyers against losses in some circumstances, which could harm liquidity, results of operations and financial condition.
When mortgage loans are sold, whether as whole loans or pursuant to a securitization, United is required to make customary representations and warranties to purchasers, guarantors and insurers, including the government sponsored enterprises, about the mortgage loans and the manner in which they were originated. Whole loan sale agreements require repurchase or substitute mortgage loans, or indemnification of buyers against losses, in the event United breaches these representations or warranties. In addition, United may be required to repurchase mortgage loans as a result of early payment default of the borrower on a mortgage loan. With respect to loans that are originated through United’s broker or correspondent channels, the remedies available against the originating broker or correspondent, if any, may not be as broad as the remedies available to purchasers, guarantors and insurers of mortgage loans against United. United faces further risk that the originating broker or correspondent, if any, may not have financial capacity to perform remedies that otherwise may be available. Therefore, if a purchaser, guarantor or insurer enforces its remedies against United, it may not be able to recover losses from the originating broker or correspondent. If repurchase and indemnity demands increase and such demands are valid claims and are in excess of United’s provision for potential losses, its liquidity, results of operations and financial condition may be adversely affected.
CREDIT RISKS
There are no assurances as to adequacy of the allowance for credit losses.
The FASB’s Accounting Standards Update 2016-13, effective for United as of January 1, 2020, substantially changes the accounting for credit losses on loans, leases and other financial assets held by banks, financial institutions and other organizations. The new standard requires the recognition of credit losses on loans, leases and other financial assets based on an entity’s current estimate of expected losses over the lifetime of each loan, lease or other financial asset,
20
referred to as the Current Expected Credit Loss (“CECL”) model as opposed to the previous “incurred loss” model, which required recognition of losses on loans, leases and other financial assets only when those losses had incurred. Under the CECL model, United is required to present these certain financial assets, carried at amortized cost, at the net amount expected to be collected over the life of the financial asset. The measurement of expected credit losses is based on information about past events, including credit quality, our historical experience, current conditions, and reasonable and supportable macroeconomic forecasts that may affect the collectability of the reported amount. This measurement will take place at the time a financial asset is first added to the balance sheet and at least quarterly thereafter.
CECL also requires management judgment that is supported by new models and more data elements, including macroeconomic forecasts, than the previous allowance standard. This increased the complexity and associated risk, particularly in times of economic uncertainty or other unforeseen circumstances, which could impact United’s results of operations and capital levels as well as place stress on our internal controls over financial reporting.
The determination of the appropriate level of allowance for credit losses inherently involves a high degree of subjectivity and requires us to make significant estimates related to current and expected future credit risks and trends, all of which may undergo material changes. Deterioration in economic conditions affecting borrowers and securities issuers; new information regarding existing loans, credit commitments and securities holdings; natural disasters and risks related to climate change; and identification of additional problem loans, ratings down-grades and other factors, both within and outside of our control, may require an increase in the allowances for credit losses on loans, securities and off-balance sheet credit exposures. In addition, federal and state regulators, as an integral part of their respective supervisory functions, periodically review United’s allowance for credit losses on loans, and may require an increase in the provision for credit losses or the recognition of further loan charge-offs, based on judgments different than those of management. Any increases in the allowance for credit losses on loans will result in a decrease in net income and, possibly, capital, and may have a material adverse effect on United’s business, financial condition and results of operations.
See the section captioned “Provision for Credit Losses” in in the Management’s Discussion and Analysis of Financial Condition and Results of Operations included in Part II, Item 7 of this Form 10-K for further discussion related to our process for determining the appropriate level of the allowance for credit losses.
United is subject to credit risk in its loan portfolio.
There are risks inherent in making any loan, including risks with respect to the period of time over which the loan may be repaid, risks resulting from changes in economic and industry conditions, risks inherent in dealing with individual borrowers and risks resulting from uncertainties as to the future value of collateral. United seeks to mitigate the risk inherent in its loan portfolio by adhering to prudent loan approval practices. Although United believes that its loan approval criteria are appropriate for the various kinds of loans the Company makes, United may incur losses on loans that meet our loan approval criteria. A significant decline in general economic conditions caused by inflation or deflation, recession, unemployment, changes in government fiscal and monetary policies, acts of terrorism, or other factors beyond our control could cause our borrowers to default on their loan payments, and the collateral values securing such loans to decline and be insufficient to repay any outstanding indebtedness. In such events, we could experience significant loan losses, which could have a material adverse effect on our financial condition and results of operations.
Certain of our credit exposures are concentrated in industries that may be more susceptible to the long-term risks of climate change, natural disasters or global pandemics. To the extent that these risks may have a negative impact on the financial condition of borrowers, it could also have a material adverse effect on our business, financial condition and results of operations. See the section captioned “Loans” in Item 7, Management’s Discussion and Analysis of Financial Condition and Results of Operations elsewhere in this report for further discussion related to commercial and industrial, energy, construction and commercial real estate loans.
21
OPERATIONAL RISKS
United’s information systems may experience an interruption or breach in security.
United relies heavily on communications and information systems to conduct its business. In addition, as part of its business, United collects, processes and retains sensitive and confidential client and customer information. United’s facilities and systems, and those of our third-party service providers, may be vulnerable to security breaches, acts of vandalism, computer viruses, misplaced or lost data, programming and/or human errors, or other similar events. Any failure, interruption or breach in security of these systems could result in failures or disruptions in the Company’s customer relationship management, general ledger, deposit, loan and other systems. While United has policies and procedures designed to prevent or limit the effect of the failure, interruption or security breach of its information systems, there can be no assurance that any such failures, interruptions or security breaches will not occur or, if they do occur, that they will be adequately addressed. The occurrence of any failures, interruptions or security breaches of the Company’s information systems could damage United’s reputation, result in a loss of customer business, subject United to additional regulatory scrutiny, or expose the Company to civil litigation and possible financial liability, any of which could have a material adverse effect on United’s financial condition and results of operations.
Unauthorized disclosure of sensitive or confidential client or customer information, whether through a cyber-attack, other breach of our computer systems or otherwise, could severely harm our business.
In the normal course of our business, we collect, process and retain sensitive and confidential client and customer information on our behalf and on behalf of other third parties. Despite the security measures we have in place, our facilities and systems may be vulnerable to cyber-attacks, security breaches, acts of vandalism, computer viruses, misplaced or lost data, programming and/or human errors, or other similar events.
Information security risks for financial institutions like us have increased recently in part because of new technologies, the use of the internet and telecommunications technologies (including mobile devices) to conduct financial and other business transactions, employees working from home and the increased sophistication and activities of organized crime, perpetrators of fraud, hackers, terrorists and others. In addition to cyber-attacks or other security breaches involving the theft of sensitive and confidential information, hackers have engaged in attacks against large financial institutions, particularly denial of service attacks, designed to disrupt key business services such as customer-facing web sites. We are not able to anticipate or implement effective preventive measures against all security breaches of these types. Although we employ detection and response mechanisms designed to contain and mitigate security incidents, early detection may be thwarted by persistent sophisticated attacks and malware designed to avoid detection.
We also face risks related to cyber-attacks and other security breaches in connection with card transactions that typically involve the transmission of sensitive information regarding our customers through various third parties. Some of these parties have in the past been the target of security breaches and cyber-attacks, and because the transactions involve third parties and environments that we do not control or secure, future security breaches or cyber-attacks affecting any of these third parties could impact us through no fault of our own, and in some cases we may have exposure and suffer losses for breaches or attacks relating to them. We also rely on numerous other third-party service providers to conduct other aspects of our business operations and face similar risks relating to them. While we conduct security assessments on our higher risk third parties, we cannot be sure that their information security protocols are sufficient to withstand a cyber-attack or other security breach.
Any cyber-attack or other security breach involving the misappropriation, loss or other unauthorized disclosure of confidential customer information could severely damage our reputation, erode confidence in the security of our systems, products and services, expose us to the risk of litigation and liability, disrupt our operations and have a material adverse effect on our business.
22
United’s business continuity plans or data security systems could prove to be inadequate, resulting in a material interruption in, or disruption to, its business and a negative impact on results of operations.
United relies heavily on communications and information systems to conduct its business. Any failure, interruption or breach in security of these systems, whether due to severe weather, natural disasters, cyber-attack, acts of war or terrorism, criminal activity or other factors, could result in failures or disruptions in general ledger, deposit, loan, customer relationship management and other systems. While United has disaster recovery and other policies and procedures designed to prevent or limit the effect of the failure, interruption or security breach of its information systems, there can be no assurance that any such failures, interruptions or security breaches will not occur or, if they do occur, that they will be adequately addressed. The occurrence of any failures, interruptions or security breaches of United’s information systems could damage its reputation, result in a loss of customer business, subject it to additional regulatory scrutiny or expose it to civil litigation and possible financial liability, any of which could have a material adverse effect on results of operations.
The negative economic effects caused by terrorist attacks, including cyber-attacks, potential attacks and other destabilizing events would likely contribute to the deterioration of the quality of United’s loan portfolio and could reduce its customer base, level of deposits, and demand for its financial products such as loans.
High inflation, natural disasters, acts of terrorism, including cyber-attacks, an escalation of hostilities or other international or domestic occurrences, and other factors could have a negative impact on the economy of the Mid-Atlantic and Southeast regions in which United operates. An additional economic downturn in its markets would likely contribute to the deterioration of the quality of United’s loan portfolio by impacting the ability of its customers to repay loans, the value of the collateral securing loans, and may reduce the level of deposits in its bank and the stability of its deposit funding sources. An additional economic downturn could also have a significant impact on the demand for United’s products and services. The cumulative effect of these matters on United’s results of operations and financial condition would likely be adverse and material.
Our growth-oriented business strategy could be adversely affected if we are not able to attract and retain skilled employees or if we lose the services of our senior management team.
Our ability to manage growth will depend upon our ability to continue to attract, hire and retain skilled employees. The unanticipated loss of members of our senior management team, could have a material adverse effect on our results of operations and ability to execute our strategic goals. Our success will also depend on the ability of our officers and key employees to continue to implement and improve our operational and other systems, to manage multiple, concurrent customer relationships and to hire, train and manage our employees.
United’s vendors could fail to fulfill their contractual obligations, resulting in a material interruption in, or disruption to, its business and a negative impact on results of operations.
United is dependent upon third parties for certain information system, data management and processing services and to provide key components of its business infrastructure. United has entered into subcontracts for the supply of current and future services, such as data processing, mortgage loan processing and servicing, and certain property management functions. These services must be available on a continuous and timely basis and be in compliance with any regulatory requirements. Failure to do so could substantially harm United’s business.
United often purchases services from vendors under agreements that typically can be terminated on a periodic basis. There can be no assurance, however, that vendors will be able to meet their obligations under these agreements or that United will be able to compel them to do so. Risks of relying on vendors include the following:
| • | If an existing agreement expires or a certain service is discontinued by a vendor, then United may not be able to continue to offer its customers the same breadth of products and its operating results would likely suffer unless it is able to find an alternate supply of a similar service. |
| • | Agreements United may negotiate in the future may commit it to certain minimum spending obligations. It is possible United will not be able to create the market demand to meet such obligations. |
| • | If market demand for United’s products increases suddenly, its current vendors might not be able to fulfill United’s commercial needs, which would require it to seek new arrangements or new sources of supply, and may result in substantial delays in meeting market demand. |
| • | United may not be able to control or adequately monitor the quality of services it receives from its vendors. Poor quality services could damage United’s reputation with its customers. |
23
In addition, these third party service providers are sources of operational and informational security risk to United, including risks associated with operational errors, information system interruptions or breaches, and unauthorized disclosures of sensitive or confidential client or customer information. If third party service providers encounter any of these issues, or if United has difficulty communicating with them, United could be exposed to disruption of operations, loss of service or connectivity to customers, reputational damage, and litigation risk that could have a material adverse effect on our results of operations or our business.
Potential problems with vendors such as those discussed above could have a significant adverse effect on United’s business, lead to higher costs and damage its reputation with its customers and, in turn, have a material adverse effect on its financial condition and results of operations.
MARKET, LIQUIDITY AND INTEREST RATE RISKS
Changes in economic and political conditions could adversely affect our earnings, as our borrowers’ ability to repay loans and the value of the collateral securing our loans decline.
United’s success depends, to a certain extent, upon local and national economic and political conditions, as well as governmental monetary policies. Conditions such as an economic recession, rising unemployment, changes in interest rates, money supply and other factors beyond its control may adversely affect United’s and United Bank’s asset quality, deposit levels and loan demand and, therefore, its earnings. Because United has a significant amount of real estate loans, decreases in real estate values could adversely affect the value of property used as collateral. Adverse changes in the economy may also have a negative effect on the ability of our borrowers to make timely repayments of their loans, which could have an adverse impact on our earnings. Consequently, declines in the economy in our market area could have a material adverse effect on our financial condition and results of operations.
In addition, economic and inflationary pressure on consumers and uncertainty regarding the economy could result in changes in consumer and business spending, borrowing and savings habits. Such conditions could also have a material adverse effect on the credit quality of our loans and our business, financial condition and results of operations.
The value of certain investment securities is volatile and future declines in value could have a materially adverse effect on future earnings and regulatory capital.
Continued volatility in the fair value for certain investment securities, whether caused by changes in market conditions, interest rates, credit risk of the issuer, the expected yield of the security, or actual defaults in the portfolio could result in significant fluctuations in the value of the securities as well as any regulatory rulemaking could exclude or limit the holdings of certain investment securities. This could have a material adverse impact on United’s accumulated other comprehensive income and shareholders’ equity depending on the direction of the fluctuations. Furthermore, future downgrades, defaults or prepayments, including the liquidation of the underlying collateral in certain securities, could result in the recording of an allowance for credit losses related to these securities. This could have a material impact on United’s future earnings, although the impact on shareholders’ equity will be offset by any amount already included in other comprehensive income.
United operates in a highly competitive market.
United faces a high degree of competition in all of the markets it serves. United faces strong competition in gathering deposits, making loans and obtaining client assets for management by its investment or trust operations. United considers all of West Virginia to be included in its market area. This area includes the five largest West Virginia Metropolitan Statistical Areas (“MSA”): the Parkersburg MSA, the Charleston MSA, the Huntington MSA, the Morgantown MSA and the Wheeling MSA. United serves the Ohio counties of Lawrence, Belmont, Jefferson and Washington and Fayette county in Pennsylvania primarily because of their close proximity to the Ohio and Pennsylvania borders and United banking offices located in those counties or in nearby West Virginia. United’s Virginia markets
24
include the Maryland, northern Virginia and Washington, D.C. MSA, the Winchester MSA, the Harrisonburg MSA, and the Charlottesville MSA. Through its acquisition of Carolina Financial, United’s market also includes the Coastal, Midlands, and Upstate regions of South Carolina, including the Charleston (Charleston, Dorchester and Berkeley Counties), Myrtle Beach (Horry and Georgetown Counties), Columbia (Richland and Lexington Counties), and the Upstate (Greenville and Spartanburg Counties) areas as well as areas in North Carolina including Wilmington (New Hanover County), Raleigh-Durham (Durham and Wake Counties), Charlotte-Concord-Gastonia (NC and SC) and the southeastern coastal region of North Carolina (Bladen, Brunswick, Columbus, Cumberland, Duplin and Robeson Counties). Through its acquisition of Community Bankers Trust, United added new markets in Baltimore and Annapolis, Maryland and Lynchburg and Richmond, Virginia as well as the Northern Neck of Virginia. United considers all of the above locations to be the primary market area for the business of its banking and mortgage banking subsidiaries.
There is a risk that aggressive competition could result in United controlling a smaller share of these markets. A decline in market share could lead to a decline in net income which would have a negative impact on shareholder value.
United is subject to liquidity risk.
We require liquidity to meet our deposit and debt obligations as they come due. Our access to funding sources in amounts adequate to finance our activities or on terms that are acceptable to us could be impaired by factors that affect us specifically or the financial services industry or economy generally. A substantial majority of our liabilities are demand, savings, interest checking and money market deposits, which are payable on demand or upon several days’ notice, while by comparison, a substantial portion of our assets are loans, which cannot be called or sold in the same time frame. We may not be able to replace maturing deposits and advances as necessary in the future, especially if a large number of our depositors sought to withdraw their accounts, regardless of the reason. Our access to deposits may be negatively impacted by, among other factors, periods of low interest rates or higher interest rates, which could promote increased competition for deposits or provide customers with alternative investment options. Additionally, negative news about us or the banking industry in general could negatively impact market and/or customer perceptions of our company, which could lead to a loss of depositor confidence and an increase in deposit withdrawals, particularly among those with uninsured deposits. Furthermore, as we and other regional banking organizations experienced in 2023, the failure of other financial institutions may cause deposit outflows as customers spread deposits among several different banks so as to maximize their amount of FDIC insurance, move deposits to banks deemed “too big to fail” or remove deposits from the banking system entirely. A failure to maintain adequate liquidity could have a material adverse effect on our business, financial condition and results of operations.
United may be adversely affected by the soundness of other financial institutions.
Financial services institutions are interrelated as a result of trading, clearing, counterparty, or other relationships. United has exposure to many different industries and counterparties, and routinely executes transactions with counterparties in the financial services industry, including brokers and dealers, commercial banks, investment banks, mutual and hedge funds, or other institutional clients. Defaults by financial services institutions, and even rumors or questions about a financial institution or the financial services industry in general, may lead to market wide liquidity problems and could lead to losses or defaults by United or other institutions. Any such losses could adversely affect United’s financial condition or results of operations.
Changes in interest rates may adversely affect United’s business.
United’s earnings, like most financial institutions, are significantly dependent on its net interest income. Net interest income is the difference between the interest income United earns on loans and other assets which earn interest and the interest expense incurred to fund those assets, such as on savings deposits and borrowed money. Therefore, changes in general market interest rates, such as a change in the monetary policy of the Board of Governors of the Federal Reserve System or otherwise beyond those which are contemplated by United’s interest rate risk model and policy, could have an effect on net interest income. For more information concerning United’s interest rate risk model and policy, see the discussion in Quantitative and Qualitative Disclosures About Market Risk included in Part II, under Item 7A of this Form 10-K.
25
RISKS RELATED TO ACQUISITION ACTIVITY
Potential acquisitions may disrupt our business and dilute shareholder value
We generally seek merger or acquisition partners that are culturally similar and have experienced management and possess either significant market presence or have potential for improved profitability through financial management, economies of scale or expanded services. Acquiring other banks, businesses, or branches involves various risks commonly associated with acquisitions, including, among other things, (i) potential exposure to unknown or contingent liabilities of the target company; (ii) exposure to potential asset quality issues of the target company; (iii) potential disruption to our business; (iv) potential diversion of our management’s time and attention; (v) the possible loss of key employees and customers of the target company; (vi) difficulty in estimating the value of the target company; and (vii) potential changes in banking or tax laws or regulations that may affect the target company.
Acquisitions typically involve the payment of a premium over book and market values, and, therefore, some dilution of our tangible book value and net income per common share may occur in connection with any future transaction. Acquisitions may also result in potential dilution to existing shareholders of our earnings per share if we issue common stock in connection with the acquisition. Furthermore, failure to realize the expected revenue increases, cost savings, increases in geographic or product presence, and/or other projected benefits from an acquisition could have a material adverse effect on our business, financial condition and results of operations. In addition, from time to time, bank regulators may restrict the Company from making acquisitions. See “Regulation and Supervision” in Item 1, “Business,” of this Form 10-K for additional detail and further discussion of these matters.
Acquisitions may be delayed, impeded, or prohibited due to regulatory issues
Acquisitions by financial institutions, including us, are subject to approval by a variety of federal and state regulatory agencies (collectively, “regulatory approvals”). The process for obtaining these required regulatory approvals has become substantially more difficult since the global financial crisis, and our ability to engage in certain merger or acquisition transactions depends on the bank regulators’ views at the time as to our capital levels, quality of management, and overall condition, in addition to their assessment of a variety of other factors, including our compliance with law. Regulatory approvals could be delayed, impeded, restrictively conditioned or denied due to existing or new regulatory issues we have, or may have, with regulatory agencies, including, without limitation, issues related to Bank Secrecy Act compliance, Community Reinvestment Act issues, fair lending laws, fair housing laws, consumer protection laws, unfair, deceptive, or abusive acts or practices regulations and other laws and regulations. We may fail to pursue, evaluate or complete strategic and competitively significant acquisition opportunities as a result of our inability, or perceived or anticipated inability, to obtain regulatory approvals in a timely manner, under reasonable conditions or at all. Difficulties associated with potential acquisitions that may result from these factors could have a material adverse effect on our business, financial condition and results of operations.
SECURITY OWNERSHIP RISKS
United’s stock price can be volatile.
Stock price volatility may make it more difficult for United shareholders to resell their common stock when they want and at prices they find attractive. United’s stock price can fluctuate significantly in response to a variety of factors, including, among other things:
| • | Actual or anticipated negative variations in quarterly results of operations; |
| • | Negative recommendations by securities analysts; |
| • | Poor operating and stock price performance of other companies that investors deem comparable to United; |
| • | News reports relating to negative trends, concerns and other issues in the financial services industry or the economy in general; |
| • | Negative perceptions in the marketplace regarding United and/or its competitors; |
26
| • | New technology used, or services offered, by competitors; |
| • | Adverse changes in interest rates or a lending environment with prolonged low interest rates; |
| • | Adverse changes in the real estate market; |
| • | Negative economic news; |
| • | Failure to integrate acquisitions or realize anticipated benefits from acquisitions; |
| • | Adverse changes in government regulations; and |
| • | Geopolitical conditions such as acts or threats of terrorism or military conflicts. |
General market fluctuations, industry factors and general economic and political conditions and events, such as economic slowdowns or recessions, interest rate changes or credit loss trends, could also cause United’s stock price to decrease regardless of operating results.
Dividend payments by United’s subsidiaries to United and by United to its shareholders can be restricted.
The declaration and payment of future cash dividends will depend on, among other things, United’s earnings, the general economic and regulatory climate, United’s liquidity and capital requirements, and other factors deemed relevant by United’s board of directors. Federal Reserve Board policy limits the payment of cash dividends by bank holding companies, without regulatory approval, and requires that a holding company serve as a source of strength to its banking subsidiaries.
United’s principal source of funds to pay dividends on its common stock is cash dividends from its subsidiaries. The payment of these dividends by its subsidiaries is also restricted by federal and state banking laws and regulations. As of December 31, 2023, approximately $372.1 million was available for dividend payments from United Bank to United without regulatory approval.
An investment in United common stock is not an insured deposit.
United common stock is not a bank deposit and, therefore, is not insured against loss by the Federal Deposit Insurance Corporation, any other deposit insurance fund or by any other public or private entity. Investment in United common stock is inherently risky for the reasons described in this section and elsewhere in this report and is subject to the same market forces that affect the price of common stock in any company. As a result, someone who acquires United common stock, could lose some or all of their investment.
Failure to maintain effective internal controls over financial reporting in the future could impair United’s ability to accurately and timely report its financial results or prevent fraud, resulting in loss of investor confidence and adversely affecting United’s business and stock price.
Effective internal controls over financial reporting are necessary to provide reliable financial reports and prevent fraud. Management believes that United’s internal controls over financial reporting are currently effective. Management will continually review and analyze the Company’s internal controls over financial reporting for Sarbanes-Oxley Section 404 compliance. Any failure to maintain, in the future, an effective internal control environment could impact United’s ability to report its financial results on an accurate and timely basis, which could result in regulatory actions, loss of investor confidence, and adversely impact United’s business and stock price.
Certain banking laws may have an anti-takeover effect.
Provisions of federal banking laws, including regulatory approval requirements, could make it more difficult to be acquired by a third party, even if perceived to be beneficial to United’s shareholders. These provisions effectively inhibit a non-negotiated merger or other business combination, which could adversely affect the market price of United’s common stock.
27
GENERAL RISKS
United may elect or be compelled to seek additional capital in the future, but capital may not be available when it is needed.
United is required by federal and state regulatory authorities to maintain adequate levels of capital to support the Company’s operations. In addition, United may elect to raise additional capital to support the Company’s business or to finance acquisitions, if any, or United may otherwise elect to raise additional capital.
United’s ability to raise additional capital, if needed, will depend on conditions in the capital markets, economic conditions and a number of other factors, many of which are outside the Company’s control, and on United’s financial performance. Accordingly, United cannot be assured of its ability to raise additional capital if needed or on terms acceptable to the Company. If United cannot raise additional capital when needed, it may have a material adverse effect on the Company’s financial condition, results of operations and prospects.
New accounting or tax pronouncements or interpretations may be issued by the accounting profession, regulators or other government bodies which could change existing accounting methods. Changes in accounting methods could negatively impact United’s results of operations and financial condition.
Current accounting and tax rules, standards, policies and interpretations influence the methods by which financial institutions conduct business, implement strategic initiatives and tax compliance, and govern financial reporting and disclosures. These laws, regulations, rules, standards, policies, and interpretations are constantly evolving and may change significantly over time. Events that may not have a direct impact on United, such as the bankruptcy of major U.S. companies, have resulted in legislators, regulators and authoritative bodies, such as the Financial Accounting Standards Board, the SEC, the Public Company Accounting Oversight Board, and various taxing authorities, responding by adopting and/or proposing substantive revision to laws, regulations, rules, standards, policies, and interpretations. New accounting pronouncements and varying interpretations of accounting pronouncements have occurred and may occur in the future. A change in accounting standards may adversely affect reported financial condition and results of operations.
United could face unanticipated environmental liabilities or costs related to real property owned or acquired through foreclosure. Compliance with federal, state and local environmental laws and regulations, including those related to investigation and clean-up of contaminated sites, could have a negative effect on expenses and results of operations.
A significant portion of United’s loan portfolio is secured by real property. During the ordinary course of business, United may foreclose on and take title to properties securing certain loans. In doing so, there is a risk that hazardous or toxic substances could be found on these properties. If hazardous or toxic substances are found, United may be liable for remediation costs, as well as for personal injury and property damage. Environmental laws may require United to incur substantial expenses and may materially reduce the affected property’s value or limit United’s ability to use or sell the affected property. In addition, future laws or more stringent interpretations or enforcement policies with respect to existing laws may increase exposure to environmental liability. Although United has policies and procedures to perform an environmental review before initiating any foreclosure action on real property, these reviews may not be sufficient to detect all potential environmental hazards. The remediation costs and any other financial liabilities associated with an environmental hazard could have a material adverse effect on results of operations.
Severe weather, natural disasters, public health issues, acts of war or terrorism, and other external events could significantly impact United’s ability to conduct business.
Severe weather, natural disasters, public health issues, acts of war or terrorism, and other external events could affect the stability of United’s deposit base, impair the ability of borrowers to repay outstanding loans, impair the value of collateral securing loans, adversely impact United’s employee base, cause significant property damage, result in loss of revenue, and / or cause the Company to incur additional expenses. Although management has established disaster recovery policies and procedures, the occurrence of any such event could have a material adverse effect on United’s business, which, in turn, could have a material adverse effect on the Company’s financial condition and results of operations.
28
Increasing scrutiny and evolving expectations from customers, regulators, investors, and other stakeholders with respect to United’s environmental, social and governance practices may impose additional costs on us or expose us to new or additional risks.
Companies are facing increasing scrutiny from customers, regulators, investors, and other stakeholders related to their environmental, social and governance (“ESG”) practices and disclosure. Investor advocacy groups, investment funds and influential investors are also increasingly focused on these practices, especially as they relate to the environment, health and safety, diversity, labor conditions and human rights. Increased ESG-related compliance costs for United as well as among our suppliers, vendors and various other parties within our supply chain could result in increases to our overall operational costs. Failure to adapt to or comply with regulatory requirements or investor or stakeholder expectations and standards could negatively impact United’s reputation, ability to do business with certain partners, access to capital, and our stock price. New government regulations could also result in new or more stringent forms of ESG oversight and expanding mandatory and voluntary reporting, diligence, and disclosure.
Climate change and related legislative and regulatory initiatives may materially affect United’s business and results of operations.
The effects of climate change continue to create an alarming level of concern for the state of the global environment. As a result, the global business community has increased its political and social awareness surrounding the issue, and the United States has entered into international agreements in an attempt to reduce global temperatures, such as reentering the Paris Agreement. Further, the U.S. Congress, state legislatures and federal and state regulatory agencies continue to propose numerous initiatives to supplement the global effort to combat climate change. Similar and even more expansive initiatives are expected under the current administration, including potentially increasing supervisory expectations with respect to banks’ risk management practices, accounting for the effects of climate change in stress testing scenarios and systemic risk assessments, revising expectations for credit portfolio concentrations based on climate-related factors and encouraging investment by banks in climate-related initiatives and lending to communities disproportionately impacted by the effects of climate change. The lack of empirical data surrounding the credit and other financial risks posed by climate change render it impossible to predict how specifically climate change may impact our financial condition and results of operations; however, the physical effects of climate change may also directly impact us. Specifically, unpredictable and more frequent weather disasters may adversely impact the value of real property securing the loans in our portfolios. Additionally, if insurance obtained by our borrowers is insufficient to cover any losses sustained to the collateral, or if insurance coverage is otherwise unavailable to our borrowers, the collateral securing our loans may be negatively impacted by climate change, which could impact our financial condition and results of operations. Further, the effects of climate change may negatively impact regional and local economic activity, which could lead to an adverse effect on our customers and impact the communities in which we operate.
We are also subject to reputational risk from shareholder concerns about our practices related to climate change, our carbon footprint and our business relationships with customers who operate in carbon-intensive industries. Our business, reputation and ability to attract and retain employees may also be harmed if our response to climate change is perceived to be ineffective or insufficient.
Climate change also exposes us to transition risks associated with the transition to a less carbon-dependent economy. Transition risks may result from changes in policies; laws and regulations; technologies; and/or market preferences to address climate change. Such changes could materially, negatively impact our business, results of operations, financial condition and/or our reputation, in addition to having a similar impact on our customers. We have customers who operate in carbon-intensive industries like oil and gas that are exposed to climate risks, such as those risks related to the transition to a less carbon-dependent economy, as well as customers who operate in low-carbon industries that may be subject to risks associated with new technologies. Federal and state banking regulators and supervisory authorities, investors and other stakeholders have increasingly viewed financial institutions as important in helping to address the risks related to climate change both directly and with respect to their customers, which may result in financial institutions coming under increased pressure regarding the disclosure and management of their climate risks and related lending and investment activities. Given that climate change could impose systemic risks upon the financial sector, either via disruptions in economic activity resulting from the physical impacts of climate change or changes in policies as the economy transitions to a less carbon-intensive environment, we face regulatory risk of increasing focus on our resilience to climate-related risks, including in the context of stress testing for various climate stress scenarios. Ongoing legislative or regulatory uncertainties and changes regarding climate risk management and practices may result in higher regulatory, compliance, credit and reputational risks and costs.
29
| Item 1B. | UNRESOLVED STAFF COMMENTS |
None
| Item 1C. | CYBERSECURITY |
Risk Management and Strategy
In the ordinary course of business, United relies on electronic communications and information systems to conduct its operations and to store sensitive data. United employs an in-depth, layered, defensive approach that leverages people, processes and technology to manage and maintain cybersecurity controls. United employs a variety of preventative and detective tools to monitor, block, and provide alerts regarding suspicious activity, as well as to report on any suspected advanced persistent threats. Notwithstanding the strength of its defensive measures, the threat from cyber-attacks is severe, attacks are sophisticated and increasing in volume, and attackers respond rapidly to changes in defensive measures. While to date, United and United Bank have not experienced a material compromise, material data loss or any material financial losses related to cybersecurity attacks, United’s systems and those of its customers and third-party service providers are under constant threat and it is possible that United could experience a significant event in the future.
United recognizes the critical importance of cybersecurity in our business operations. Our cybersecurity processes are fully integrated into our overall risk management system and processes. We believe that effective management of cybersecurity risks is integral to the protection of our assets, reputation, and the trust of our stakeholders. Our proactive approach to cybersecurity involves numerous processes including, regular risk assessments, employee training, incident response planning and testing, and continuous improvement in our cybersecurity practices. To ensure the robustness of our cybersecurity processes, we engage qualified assessors, consultants, and auditors on a periodic basis. These experts evaluate the effectiveness of our cybersecurity controls, identify vulnerabilities, and recommend improvements. We maintain ongoing relationships with reputable third-party firms specializing in cybersecurity to assess our systems, conduct penetration testing, and audit our processes for compliance with industry standards and regulations.
United recognizes the inherent cybersecurity risks associated with third-party service providers. To manage these risks, we have implemented processes to oversee and identify material risks from cybersecurity threats linked to our use of third-party service providers. These processes include due diligence assessments, contractual provisions, and ongoing monitoring of our service providers’ cybersecurity practices. We continually assess the cybersecurity measures of our service providers to ensure they align with our own security standards and requirements.
We do not currently believe that any current cybersecurity threats, including as a result of any previous cybersecurity incidents, have materially affected, or are reasonably likely to materially affect, United, including its business strategy, results of operations or financial condition. However, risks and exposures related to cybersecurity attacks, including litigation and enforcement risks, are expected to be elevated for the foreseeable future due to the rapidly evolving nature and sophistication of these threats, as well as due to the expanding use of Internet banking, mobile banking and other technology-based products and services by United and its customers. See Item 1A. Risk Factors for a further discussion of risk related to cybersecurity.
Governance
The Board of Directors’ risk management oversight is provided primarily by the Board Risk Committee. The Risk Committee oversees the Company’s Enterprise Risk Management Program and the processes established identify, measure, manage and monitor United’s significant financial and other risk exposures. In particular, the Risk Committee is responsible for oversight of information security, including cybersecurity, vendor management, and business continuity planning. The Risk Committee periodically reviews management’s strategies and policies for assessing and managing risk, including, but not limited to, the approval of the overall risk appetite and review of the risk management structure.
30
At the management level, the responsibility for oversight of the risk management function lies with the Chief Risk & Information Officer. The Chief Risk & Information Officer (“CIRO”) is an executive officer of the Company who reports directly to the Chief Executive Officer. The CIRO provides regular risk management reports to the Risk Committee and the full Board of Directors, as well as at meetings of the independent directors.
The management of the Company’s cybersecurity team has over a 100 years of industry experience combined, holds numerous certifications, and is regularly trained through continuing professional education. Information security, and specifically cyber security, is formally discussed quarterly at the Governance Steering Committee (“GSC”). The GSC is comprised of executive management, IT internal audit, digital banking leadership, and United’s Chief Information Security Officer (“CISO”). The activities of the GSC are reported quarterly to the Board Risk Committee.
The CISO is responsible for leading and coordinating our daily cybersecurity efforts, including leading a team of qualified individuals with significant relevant experience and certifications. In addition, United’s CISO has served in various roles in Operations, Physical Security, Fraud Investigations, and Information Security for over 24 years with United. The CISO holds a Bachelor of Science in Criminal Justice and has led the Information Security department since 2014. The Information Security and IT Security teams stay up to date on industry best practices, participate in industry threat intelligence feeds, and maintain multiple professional certifications in the areas of privacy and security.
The Information Security department is integrated with vendor management, business continuity planning, disaster recovery, and incident response. Additionally, we have a formal cybersecurity program based on the NIST CSF (“National Institute of Standards and Technology Cybersecurity Framework”) and the CIS (“Center for Internet Security”) Benchmarks that identifies and assesses cybersecurity risks. We deploy a variety of preventative and detective tools to monitor, block, and provide alerts regarding suspicious activity. All employees have a responsibility to report suspected or verified incidents to the Information Security department and/or the CISO, and all employees are trained annually regarding the identification and reporting of incidents. The CISO maintains a centralized record all incidents and reports on these quarterly to the GSC and the Board Risk Committee. The CIRO is also immediately notified of any incident that exceeds pre-defined thresholds.
| Item 2. | PROPERTIES |
Offices
United is headquartered in the United Center at 500 Virginia Street, East, Charleston, West Virginia. United’s executive offices are located in Parkersburg, West Virginia at Fifth and Avery Streets. United operates two hundred and nineteen (219) full service offices—forty-seven (47) offices located throughout West Virginia, ninety-nine (99) offices in the Shenandoah Valley region, the Northern Neck, the Richmond and Lynchburg metropolitan areas of Virginia and the Northern Virginia, Maryland and Washington, D.C. metropolitan area, forty-three (43) offices in the Mountains, Piedmont, Coastal Plains and Tidewater regions of North Carolina, twenty-five (25) offices in the Coastal, Midlands, and Upstate regions of South Carolina, four (4) offices in southwestern Pennsylvania and one (1) office in southeastern Ohio. United owns forty-one (41) of its West Virginia facilities while leasing six (6) of its offices under operating leases. In Virginia, United leases forty-two (42) of its branches under operating leases while owning thirty-eight (38) branches. United owns three (3) branches and leases nine (9) of its branches under operating leases in Maryland. In Washington, DC, United leases all seven (7) of its branch facilities under operating leases. United leases twenty-five (25) of its branch offices in North Carolina under operating leases while owning eighteen (18) branches. In South Carolina, United owns twenty-one (21) of its facilities while leasing under operating leases four (4) branch offices. United owns all four (4) of its Pennsylvania facilities. In Ohio, United owns its one branch. United leases operations centers in the Charleston, West Virginia and Chantilly, Virginia areas and owns two operations centers in the Morgantown, West Virginia area and Washington, North Carolina.
31
| Item 3. | LEGAL PROCEEDINGS |
United and its subsidiaries are currently involved in various legal proceedings in the normal course of business. Management is vigorously pursuing all its legal and factual defenses and, after consultation with legal counsel, believes that all such litigation will be resolved with no material effect on United’s financial position.
| Item 4. | MINE SAFETY DISCLOSURES |
Not applicable.
32
UNITED BANKSHARES, INC.
FORM 10-K, PART II
| Item 5. | MARKET FOR REGISTRANT’S COMMON EQUITY, RELATED STOCKHOLDER MATTERS AND ISSUER PURCHASES OF EQUITY SECURITIES |
Stock
As of January 31, 2024, 200,000,000 shares of common stock, par value $2.50 per share, were authorized for United, of which 134,952,678 were issued, including 7,308,583 shares held as treasury shares. The outstanding shares are held by approximately 9,233 shareholders of record, as well as 43,255 shareholders in street name as of January 31, 2024. The unissued portion of United’ s authorized common stock (subject to registration approval by the SEC) and the treasury shares are available for issuance as the Board of Directors determines advisable. United offers its shareholders the opportunity to invest dividends in shares of United stock through its dividend reinvestment plan. United has also established stock option plans and a stock bonus plan as incentive for certain eligible officers. In addition to the above incentive plans, United is occasionally involved in certain mergers in which additional shares could be issued and recognizes that additional shares could be issued for other appropriate purposes.
In October of 2019, United’s Board of Directors approved a stock repurchase plan (the “2019 Plan”) to repurchase up to 4,000,000 shares of the Company’s common stock on the open market at prevailing prices. United repurchased 2,846,989 shares under this plan. On May 11, 2022, the Board of Directors approved a new repurchase plan (the “2022 Plan”) to repurchase up to 4,750,000 shares of United’s common stock on the open market. The 2022 Plan replaced the 2019 Plan. During 2022, United repurchased 378,761 shares under the 2022 Plan. United did not repurchase any shares in 2023. As of December 31, 2023, United still has 4,371,239 shares available for repurchase under the 2022 Plan.
The Board of Directors believes that the availability of authorized but unissued common stock of United is of considerable value if opportunities should arise for the acquisition of other businesses through the issuance of United’s stock. Shareholders do not have preemptive rights, which allow United to issue additional authorized shares without first offering them to current shareholders.
Currently, United has only one voting class of stock issued and outstanding and all voting rights are vested in the holders of United’s common stock. On all matters subject to a vote of shareholders, the shareholders of United will be entitled to one vote for each share of common stock owned. Shareholders of United have cumulative voting rights with regard to election of directors.
United’s common stock is traded over the counter on the National Association of Securities Dealers Automated Quotations System, Global Select Market (“NASDAQ”) under the trading symbol UBSI. The closing sale price reported for United’s common stock on February 22, 2024, the last practicable date, was $34.36.
On December 23, 2008, the shareholders of United authorized the issuance of preferred stock up to 50,000,000 shares with a par value of $1.00 per share. The authorized preferred stock may be issued by the Company’s Board of Directors in one or more series, from time to time, with each such series to consist of such number of shares and to have such voting powers, full or limited, or no voting powers, and such designations, preferences and relative, participating, optional or other special rights, and the qualifications, limitations or restrictions thereof, as shall be stated in the resolution or resolutions providing for the issuance of such series adopted by the Board of Directors. Currently, no shares of preferred stock have been issued.
The authorization of preferred stock will not have an immediate effect on the holders of the Company’s common stock. The actual effect of the issuance of any shares of preferred stock upon the rights of the holders of common stock cannot be stated until the Board of Directors determines the specific rights of any shares of preferred stock. However, the effects might include, among other things, restricting dividends on common stock, diluting the voting power of common stock, reducing the market price of common stock or impairing the liquidation rights of the common stock without further action by the shareholders. Holders of the common stock will not have preemptive rights with respect to the preferred stock.
33
There are no preemptive or conversion rights or, redemption or sinking fund provisions with respect to United’s stock. All of the issued and outstanding shares of United’s stock are fully paid and non-assessable.
Stock Performance Graph
The following Stock Performance Graph and related information shall not be deemed “soliciting material” or to be “filed” with the Securities and Exchange Commission, nor shall such information be incorporated by reference into any future filing under the Securities Act of 1933 or Securities Exchange Act of 1934, each as amended, except to the extent that United specifically incorporates it by reference into such filing.
The following graph compares United’s cumulative total shareholder return (assuming reinvestment of dividends) on its common stock for the five-year period ending December 31, 2023, with the cumulative total return (assuming reinvestment of dividends) of the Standard and Poor’s Midcap 400 Index and with the NASDAQ Bank Index. The cumulative total shareholder return assumes a $100 investment on December 31, 2018 in the common stock of United and each index and the cumulative return is measured as of each subsequent fiscal year-end. There is no assurance that United’s common stock performance will continue in the future with the same or similar trends as depicted in the graph.
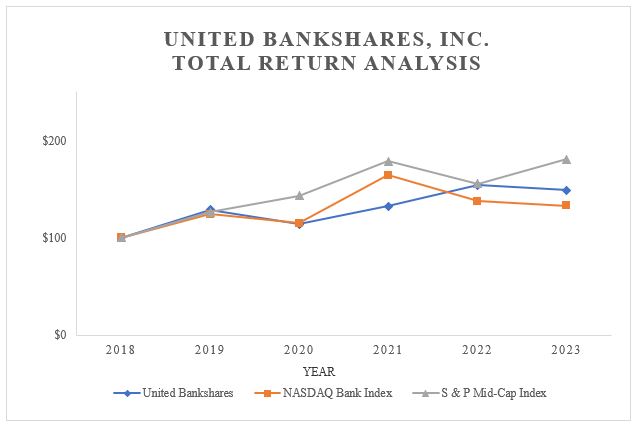
| Period Ending | ||||||||||||||||||||||||
| 12/31/18 | 12/31/19 | 12/31/20 | 12/31/21 | 12/31/22 | 12/31/23 | |||||||||||||||||||
| United Bankshares, Inc. |
100.00 | 128.82 | 114.05 | 132.70 | 153.99 | 149.17 | ||||||||||||||||||
| NASDAQ Bank Index |
100.00 | 124.37 | 115.04 | 164.41 | 137.64 | 132.91 | ||||||||||||||||||
| S&P Mid-Cap Index |
100.00 | 126.17 | 143.39 | 178.85 | 155.42 | 180.90 | ||||||||||||||||||
34
Issuer Repurchases
The table below includes certain information regarding United’s purchase of its common shares during the three months ended December 31, 2023:
| Period | Total Number of Shares Purchased (1) (2) |
Average Price Paid per Share |
Total Number of Shares Purchased as Part of Publicly Announced Plans (3) |
Maximum Number of Shares that May Yet be Purchased Under the Plans (3) |
||||||||||||
| 10/01 – 10/31/2023 |
0 | $ | 00.00 | 0 | 4,371,239 | |||||||||||
| 11/01 – 11/30/2023 |
7 | $ | 27.37 | 0 | 4,371,239 | |||||||||||
| 12/01 – 12/31/2023 |
0 | $ | 00.00 | 0 | 4,371,239 | |||||||||||
|
|
|
|||||||||||||||
| Total |
7 | $ | 27.37 | |||||||||||||
|
|
|
|||||||||||||||
| (1) | Includes shares exchanged in connection with the exercise of stock options or the vesting of restricted stock under United’s long-term incentive plans. Shares are purchased pursuant to the terms of the applicable plan and not pursuant to a publicly announced stock repurchase plan. For the quarter ended December 31, 2023 – no shares were exchanged by participants in United’s long-term incentive plans. |
| (2) | Includes shares purchased in open market transactions by United for a rabbi trust to provide payment of benefits under a deferred compensation plan for certain key officers of United and its subsidiaries. For the quarter ended December 31, 2023, the following shares were purchased for the deferred compensation plan: November 2023 – 7 shares at an average price of $27.37. |
| (3) | In May of 2022, United’s Board of Directors approved a repurchase plan to repurchase up to 4,750,000 shares of United’s common stock on the open market (the “2022 Plan”). The timing, price and quantity of purchases under the plans are at the discretion of management and the plan may be discontinued, suspended or restarted at any time depending on the facts and circumstances. The 2022 Plan replaces a repurchase plan approved by United’s Board of Directors in October of 2019. |
| Item 6. | [RESERVED] |
| Item 7. | MANAGEMENT’S DISCUSSION AND ANALYSIS OF FINANCIAL CONDITION AND RESULTS OF OPERATIONS |
FORWARD-LOOKING STATEMENTS
Congress passed the Private Securities Litigation Act of 1995 to encourage corporations to provide investors with information about the company’s anticipated future financial performance, goals, and strategies. The act provides a safe haven for such disclosure; in other words, protection from unwarranted litigation if actual results are not the same as management expectations.
United desires to provide its shareholders with sound information about past performance and future trends. Consequently, any forward-looking statements contained in this report, in a report incorporated by reference to this report, or made by management of United in this report, in any other reports and filings, in press releases and in oral statements, involve numerous assumptions, risks and uncertainties. Forward-looking statements can be identified by the use of the words “expect,” “may,” “could,” “intend,” “project,” “estimate,” “believe,” “anticipate,” and other words of similar meaning. Such forward-looking statements are based on assumptions and estimates, which although believed to be reasonable, may turn out to be incorrect. Therefore, undue reliance should not be placed upon these estimates and statements. United cannot assure that any of these statements, estimates, or beliefs will be realized and actual results may differ from those contemplated in these “forward-looking statements.” United undertakes no obligation to publicly update any forward-looking statements, whether as a result of new information, future events, or otherwise.
35
The discussion in Item 1A, “Risk Factors,” lists some of the factors that could cause United’s actual results to vary materially from those expressed or implied by any forward-looking statements, and such discussion is incorporated into this discussion by reference.
RECENT DEVELOPMENTS
United plans to complete a consolidation of its mortgage delivery channels during the early part of 2024. The plan is to consolidate George Mason’s and Crescent’s mortgage origination and sales business with United Bank. As part of the planned consolidation, United exited the third-party origination (“TPO”) business during the fourth quarter of 2023. United will continue to offer mortgage products through its bank mortgage channel and existing George Mason offices (which will be re-branded under the United umbrella). The consolidation will streamline operations and enhance the customer experience.
TRANSITION FROM THE LONDON INTERBANK OFFERED RATE (LIBOR)
As disclosed in the “Transition From The London Interbank Offered Rate (LIBOR)” section within the MD&A of United’s 2022 Annual Report on Form 10-K (the 2022 Form 10-K), as a result of the efforts led by the United Kingdom’s Financial Conduct Authority, which regulates LIBOR, the publication of the one-week and two-month U.S. Dollar LIBOR settings were discontinued on December 31, 2021. Subsequently, publication of the remaining overnight, one-month, three-month, six-month, and twelve-month U.S. Dollar LIBOR settings were discontinued on June 30, 2023. United implemented a comprehensive project plan to execute the transition of its LIBOR-based financial instruments to alternative reference rates. United utilized the Secured Overnight Financing Rate (“SOFR”) and Prime as the preferred alternatives to LIBOR.
INTRODUCTION
The following discussion and analysis presents the more significant changes in financial condition as of December 31, 2023 and 2022 and the results of operations of United and its subsidiaries for each of the years then ended. This discussion and the consolidated financial statements and the notes to Consolidated Financial Statements include the accounts of United Bankshares, Inc. and its wholly-owned subsidiaries, unless otherwise indicated. Management has evaluated all significant events and transactions that occurred after December 31, 2023, but prior to the date these financial statements were issued, for potential recognition or disclosure required in these financial statements. Refer to Management’s Discussion and Analysis of Financial Condition and Results of Operations included in our Annual Report on Form 10-K filed with the SEC on March 1, 2023 (the 2022 Form 10-K) for a discussion and analysis of the more significant factors that affected periods prior to 2022.
This discussion and analysis should be read in conjunction with the audited Consolidated Financial Statements and accompanying notes thereto, which are included elsewhere in this document.
USE OF NON-GAAP FINANCIAL MEASURES
This discussion and analysis contains certain financial measures that are not recognized under GAAP. Under SEC Regulation G, public companies making disclosures containing financial measures that are not in accordance with GAAP must also disclose, along with each “non-GAAP” financial measure, certain additional information, including a reconciliation of the non-GAAP financial measure to the closest comparable GAAP financial measure, as well as a statement of the company’s reasons for utilizing the non-GAAP financial measure.
Generally, United has presented a non-GAAP financial measure because it believes that this measure provides meaningful additional information to assist in the evaluation of United’s results of operations or financial position. Presentation of a non-GAAP financial measure is consistent with how United’s management evaluates its performance internally and this non-GAAP financial measure is frequently used by securities analysts, investors and other interested parties in the evaluation of companies in the banking industry. Specifically, this discussion contains certain references to financial measures identified as tax-equivalent (“FTE”) net interest income and return on average tangible equity. Management believes these non-GAAP financial measures to be helpful in understanding United’s results of operations or financial position.
36
Net interest income is presented in this discussion on a tax-equivalent basis. The tax-equivalent basis adjusts for the tax-favored status of income from certain loans and investments. Although this is a non-GAAP measure, United’s management believes this measure is more widely used within the financial services industry and provides better comparability of net interest income arising from taxable and tax-exempt sources. United uses this measure to monitor net interest income performance and to manage its balance sheet composition.
Average tangible equity is calculated as GAAP total shareholders’ equity minus total intangible assets. Tangible equity can thus be considered a more conservative valuation of the company. When considering net income, a return on average tangible equity can be calculated. Management provides a return on average equity to facilitate the understanding of as well as to assess the quality and composition of United’s capital structure. This measure, along with others, is used by management to analyze capital adequacy and performance.
However, this non-GAAP information should be considered supplemental in nature and not as a substitute for related financial information prepared in accordance with GAAP. Where the non-GAAP financial measure is used, the comparable GAAP financial measure, as well as reconciliation to that comparable GAAP financial measure, as well as a statement of the company’s reasons for utilizing the non-GAAP financial measure, can be found within this discussion and analysis. Investors should recognize that United’s presentation of this non-GAAP financial measure might not be comparable to a similarly titled measure at other companies.
APPLICATION OF CRITICAL ACCOUNTING POLICIES
The accounting and reporting policies of United conform with U.S. generally accepted accounting principles. In preparing the consolidated financial statements, management is required to make estimates, assumptions and judgments that affect the amounts reported in the financial statements and accompanying notes. These estimates, assumptions and judgments, which are reviewed with the Audit Committee of the Board of Directors, are based on information available as of the date of the financial statements. Actual results could differ from these estimates. These policies, along with the disclosures presented in the financial statement notes and in this financial review, provide information on how significant assets and liabilities are valued in the financial statements and how those values are determined. Based on the valuation techniques used and the sensitivity of financial statement amounts to the methods, assumptions, and estimates underlying those amounts, management has identified the determination of the allowance for loan and lease losses, the calculation of the income tax provision, and the use of fair value measurements to account for certain financial instruments to be the accounting areas that require the most subjective or complex judgments, and as such could be most subject to revision as new information becomes available. The most significant accounting policies followed by United are presented in Note A, Notes to Consolidated Financial Statements.
Allowance for Loan and Lease Losses
The allowance for loan and lease losses is an estimate of the expected credit losses on financial assets measured at amortized cost to present the net amount expected to be collected as of the balance sheet date. Such allowance is based on the credit losses expected to arise over the life of the asset (contractual term). Determining the allowance for loan and lease losses requires management to make estimates of expected credit losses that are highly uncertain and require a high degree of judgment. At December 31, 2023, the allowance for loan and lease losses was $259.24 million and is subject to periodic adjustment based on management’s assessment of expected credit losses in the loan portfolio. Such adjustment from period to period can have a significant impact on United’s consolidated financial statements. To illustrate the potential effect on the financial statements of our estimates of the allowance for loan and lease losses, a 10% increase in the allowance for loan and lease losses would have required $25.92 million in additional allowance (funded by additional provision for loan and lease losses), which would have negatively impacted the year of 2023 net income by approximately $20.48 million, after-tax or $0.15 diluted earnings per common share. Management’s evaluation of the adequacy of the allowance for loan and lease losses and the appropriate provision for loan and lease losses is based upon a quarterly evaluation of the loan portfolio. This evaluation is inherently subjective and requires significant estimates, including estimates related to the amounts and timing of future cash flows, value of collateral, losses on pools of homogeneous loans and leases based on historical loss experience, and consideration of qualitative factors such as current economic trends, all of which are susceptible to constant and
37
significant change. The allowance allocated to specific credits and loan pools grouped by similar risk characteristics is reviewed on a quarterly basis and adjusted as necessary based upon subsequent changes in circumstances. In determining the components of the allowance for loan and lease losses, management considers the risk arising in part from, but not limited to, qualitative factors which include charge-off and delinquency trends, current business conditions and reasonable and supportable economic forecasts, lending policies and procedures, the size and risk characteristics of the loan portfolio, concentrations of credit, and other various factors. The methodology used to determine the allowance for loan and lease losses is described in Note A, Notes to Consolidated Financial Statements. A discussion of the factors leading to changes in the amount of the allowance for loan and lease losses is included in the Provision for Credit Losses section of this Management’s Discussion and Analysis of Financial Condition and Results of Operations (“MD&A”). For a discussion of concentrations of credit risk, see Item 1, under the caption of Loan Concentrations in this Form 10-K.
Income Taxes
United’s calculation of income tax provision is inherently complex due to the various different tax laws and jurisdictions in which we operate and requires management’s use of estimates and judgments in its determination. The current income tax liability also includes income tax expense related to our uncertain tax positions as required in ASC Topic 740, “Income Taxes.” Changes to the estimated accrued taxes can occur due to changes in tax rates, implementation of new business strategies, resolution of issues with taxing authorities and recently enacted statutory, judicial and regulatory guidance. These changes can be material to the Company’s operating results for any particular reporting period. The analysis of the income tax provision requires the assessments of the relative risks and merits of the appropriate tax treatment of transactions, filing positions, filing methods and taxable income calculations after considering statutes, regulations, judicial precedent and other information. United strives to keep abreast of changes in the tax laws and the issuance of regulations which may impact tax reporting and provisions for income tax expense. United is also subject to audit by federal and state authorities. Because the application of tax laws is subject to varying interpretations, results of these audits may produce indicated liabilities which differ from United’s estimates and provisions. United continually evaluates its exposure to possible tax assessments arising from audits and records its estimate of probable exposure based on current facts and circumstances. The potential impact to United’s operating results for any of the changes cannot be reasonably estimated. See Note N, Notes to Consolidated Financial Statements for information regarding United’s ASC Topic 740 disclosures.
Use of Fair Value Measurements
United determines the fair value of its financial instruments based on the fair value hierarchy established in ASC Topic 820, whereby the fair value of certain assets and liabilities is an exit price, representing the amount that would be received to sell an asset or paid to transfer a liability in an orderly transaction between market participants. ASC Topic 820 establishes a three-level hierarchy for disclosure of assets and liabilities recorded at fair value. The classification of assets and liabilities within the hierarchy is based on whether the inputs in the methodology for determining fair value are observable or unobservable. Observable inputs reflect market-based information obtained from independent sources (Level 1 or Level 2), while unobservable inputs reflect management’s estimate of market data (Level 3). For assets and liabilities that are actively traded and have quoted prices or observable market data, a minimal amount of subjectivity concerning fair value is needed. Prices and values obtained from third party vendors that do not reflect forced liquidation or distressed sales are not adjusted by management. When quoted prices or observable market data are not available, management’s judgment is necessary to estimate fair value.
At December 31, 2023, approximately 13.04% of total assets, or $3.90 billion, consisted of financial instruments recorded at fair value. Of this total, approximately 98.63% or $3.85 billion of these financial instruments used valuation methodologies involving observable market data, collectively Level 1 and Level 2 measurements, to determine fair value. Approximately 1.37% or $53.60 million of these financial instruments were valued using unobservable market information or Level 3 measurements. Most of these financial instruments valued using unobservable market information were loans held for sale at our mortgage banking segment. At December 31, 2023, only $678 thousand or less than 1% of total liabilities were recorded at fair value. This entire amount was valued using methodologies involving observable market data. United does not believe that any changes in the unobservable inputs used to value the financial instruments mentioned above would have a material impact on United’s results of operations, liquidity, or capital resources. See Note V for additional information regarding ASC Topic 820 and its impact on United’s financial statements.
38
Any material effect on the financial statements related to these critical accounting areas is further discussed in this Management’s Discussion and Analysis of Financial Condition and Results of Operations.
2023 COMPARED TO 2022
United’s total assets as of December 31, 2023 were $29.93 billion, which was an increase of $437.10 million or 1.48% from December 31, 2022. This increase was mainly due to a $800.92 million or 3.90% increase in portfolio loans, a $422.29 million or 35.89% increase in cash and cash equivalents, a $16.53 million or 17.42% increase in interest receivable, and a $15.84 million or 22.27% increase in the operating lease asset. These increases in assets were partially offset by a $746.85 million or 15.33% decrease in investment securities and a $16.47 million or 78.34% decrease in mortgage servicing rights. Total liabilities increased $182.06 million or less than 1% from year-end 2022. This increase was due to a $516.15 million or 2.31% increase in deposits, a $17.14 million or 22.62% increase in the operating lease liability, and a $23.41 million or 12.34% increase in accrued expenses and other liabilities. Partially offsetting these increases in liabilities was a $373.16 million or 15.82% decrease in borrowings. Shareholders’ equity increased $255.05 million or 5.65%.
The following discussion explains in more detail the changes in financial condition by major category.
Cash and Cash Equivalents
Cash and cash equivalents at December 31, 2023 increased $422.29 million or 35.89% from year-end 2022. In particular, interest-bearing deposits with other banks increased $459.20 million or 52.10% while cash and due from banks decreased $37.00 million or 12.58%. Federal funds sold increased $91 thousand or 8.43%. During the year of 2023, net cash of $435.24 million and $38.99 million were provided by operating and investing activities, respectively, while net cash of $51.94 million was used in financing activities. Further details related to changes in cash and cash equivalents are presented in the Consolidated Statements of Cash Flows.
Securities
Total investment securities at December 31, 2023 decreased $746.85 million or 15.33%. Securities available for sale decreased $755.55 million or 16.63%. This change in securities available for sale reflects $107.87 million in purchases, $959.87 million in sales, maturities and calls of securities, and an increase of $106.29 million in market value. The majority of the sales activity was related to state and political subdivision securities. Equity securities were $8.95 million at December 31, 2023, an increase of $1.32 million or 17.25% due mainly to net purchases. Other investment securities increased $7.38 million or 2.29% from year-end 2022 due to a $12.53 million increase in investment tax credits partially offset by a $6.14 million decrease in FHLB stock.
The following table summarizes the changes in the available for sale securities since year-end 2022:
| (Dollars in thousands) | December 31 2023 |
December 31 2022 |
$ Change |
% Change |
||||||||||||
| U.S. Treasury securities and obligations of U.S. Government corporations and agencies |
$ | 484,950 | $ | 529,492 | $ | (44,542 | ) | (8.41 | %) | |||||||
| State and political subdivisions |
533,831 | 709,530 | (175,699 | ) | (24.76 | %) | ||||||||||
| Mortgage-backed securities |
1,599,850 | 1,849,470 | (249,620 | ) | (13.50 | %) | ||||||||||
| Asset-backed securities |
860,638 | 911,611 | (50,973 | ) | (5.59 | %) | ||||||||||
| Single issue trust preferred securities |
15,141 | 16,284 | (1,143 | ) | (7.02 | %) | ||||||||||
| Other corporate securities |
291,967 | 525,538 | (233,571 | ) | (44.44 | %) | ||||||||||
|
|
|
|
|
|
|
|
|
|||||||||
| Total available for sale securities, at fair value |
$ | 3,786,377 | $ | 4,541,925 | $ | (755,548 | ) | (16.63 | %) | |||||||
|
|
|
|
|
|
|
|
|
|||||||||
39
The following table summarizes the changes in the held to maturity securities since year-end 2022:
| (Dollars in thousands) | December 31 2023 |
December 31 2022 |
$ Change |
% Change |
||||||||||||
| State and political subdivisions |
$ | 983 | (1) | $ | 982 | (2) | $ | 1 | 0.10 | % | ||||||
| Other corporate securities |
20 | 20 | 0 | 0.00 | % | |||||||||||
|
|
|
|
|
|
|
|
|
|||||||||
| Total held to maturity securities, at amortized cost |
$ | 1,003 | $ | 1,002 | $ | 1 | 0.10 | % | ||||||||
|
|
|
|
|
|
|
|
|
|||||||||
| (1) net of allowance for credit losses of $17 thousand. |
| (2) net of allowance for credit losses of $18 thousand. |
At December 31, 2023, gross unrealized losses on available for sale securities were $363.60 million. Securities with the most significant gross unrealized losses at December 31, 2023 consisted primarily of agency residential mortgage-backed securities, state and political subdivision securities, agency commercial mortgage-backed securities, asset-backed securities and other corporate securities.
As of December 31, 2023, United’s available for sale mortgage-backed securities had an amortized cost of $1.83 billion, with an estimated fair value of $1.60 billion. The portfolio consisted primarily of $1.22 billion in agency residential mortgage-backed securities with a fair value of $1.05 billion, $100.36 million in non-agency residential mortgage-backed securities with an estimated fair value of $90.61 million, and $511.56 million in commercial agency mortgage-backed securities with an estimated fair value of $459.30 million.
As of December 31, 2023, United’s available for sale state and political subdivisions securities had an amortized cost of $613.59 million, with an estimated fair value of $533.83 million. The portfolio relates to securities issued by various municipalities located throughout the United States, and no securities within the portfolio were rated below investment grade as of December 31, 2023.
As of December 31, 2023, United’s available for sale corporate securities had an amortized cost of $1.21 billion, with an estimated fair value of $1.17 billion. The portfolio consisted of $16.38 million in single issue trust preferred securities with an estimated fair value of $15.14 million. Of the $15.14 million, $6.90 million or 45.59% were investment grade; $2.92 million or 19.30% were split rated; and $5.32 million or 35.11% were unrated. The two largest exposures accounted for 80.70% of the $15.14 million. These included Truist Bank at $6.90 million and Emigrant Bank at $5.32 million. All single issue trust preferred securities are currently receiving full scheduled principal and interest payments. In addition to the single issue trust preferred securities, the Company held positions in various other corporate securities, including asset-backed securities with an amortized cost of $872.05 million and a fair value of $860.64 million and other corporate securities, with an amortized cost of $325.57 million and a fair value of $291.97 million.
During 2023, United did not recognize any credit losses on its available for sale investment securities. Management does not believe that any individual security with an unrealized loss as of December 31, 2023 is impaired. United believes the decline in value resulted from changes in market interest rates, credit spreads and liquidity, not a deterioration of credit. Based on a review of each of the securities in the available for sale investment portfolio, management concluded that it was more-likely-than-not that it would be able to realize the cost basis investment and appropriate interest payments on such securities. United has the intent and the ability to hold these securities until such time as the value recovers or the securities mature. As of December 31, 2023, there was no allowance for credit losses related to the Company’s available for sale securities. However, United acknowledges that any securities in an unrealized loss position may be sold in future periods in response to significant, unanticipated changes in asset/liability management decisions, unanticipated future market movements or business plan changes.
Further information regarding the amortized cost and estimated fair value of investment securities, including remaining maturities as well as a more detailed discussion of management’s impairment analysis, is presented in Note B, Notes to Consolidated Financial Statements.
Loans Held For Sale
Loans held for sale decreased $618 thousand or 1.09% from year-end 2022. Loan sales in the secondary market exceeded originations during the year of 2023. Originations of loans for the year of 2023 were $860.90 million while sales of loans were $861.52 million. Loans held for sale were $56.26 million at December 31, 2023 as compared to $56.88 million at year-end 2022.
40
Portfolio Loans
Loans, net of unearned income, increased $800.92 million or 3.90%. Since year-end 2022, commercial, financial and agricultural loans increased $264.55 million or 2.28% as a result of a $304.67 million or 3.80% increase in commercial real estate loans which was partially offset by a $40.13 million or 1.11% decrease in commercial loans (not secured by real estate). Construction and land development loans increased $221.27 million or 7.56% and residential real estate loans increased $608.33 million or 13.05%, while consumer loans decreased $301.12 million or 22.05% due to a decrease in indirect automobile financing.
The following table summarizes the changes in the major loan classes since year-end 2022:
| (Dollars in thousands) | December 31 2023 |
December 31 2022 |
$ Change |
% Change |
||||||||||||
| Loans held for sale |
$ | 56,261 | $ | 56,879 | $ | (618 | ) | (1.09 | %) | |||||||
|
|
|
|
|
|
|
|
|
|||||||||
| Commercial, financial, and agricultural: |
||||||||||||||||
| Owner-occupied commercial real estate |
$ | 1,598,231 | $ | 1,724,927 | $ | (126,696 | ) | (7.35 | %) | |||||||
| Nonowner-occupied commercial real estate |
6,718,343 | 6,286,974 | 431,369 | 6.86 | % | |||||||||||
| Other commercial loans |
3,572,440 | 3,612,568 | (40,128 | ) | (1.11 | %) | ||||||||||
|
|
|
|
|
|
|
|
|
|||||||||
| Total commercial, financial, and agricultural |
$ | 11,889,014 | $ | 11,624,469 | $ | 264,545 | 2.28 | % | ||||||||
| Residential real estate |
5,271,236 | 4,662,911 | 608,325 | 13.05 | % | |||||||||||
| Construction & land development |
3,148,245 | 2,926,971 | 221,274 | 7.56 | % | |||||||||||
| Consumer: |
||||||||||||||||
| Bankcard |
9,962 | 9,273 | 689 | 7.43 | % | |||||||||||
| Other consumer |
1,054,728 | 1,356,539 | (301,811 | ) | (22.25 | %) | ||||||||||
|
|
|
|
|
|
|
|
|
|||||||||
| Total Loans and leases |
$ | 21,373,185 | $ | 20,580,163 | $ | 793,022 | 3.85 | % | ||||||||
| Less: Unearned income |
(14,101 | ) | (21,997 | ) | 7,896 | (35.90 | %) | |||||||||
|
|
|
|
|
|
|
|
|
|||||||||
| Total Loans and leases, net of unearned income |
$ | 21,359,084 | $ | 20,558,166 | $ | 800,918 | 3.90 | % | ||||||||
|
|
|
|
|
|
|
|
|
|||||||||
The following table shows the amount of loans acquired and outstanding by major loan classes as of December 31, 2023 and 2022:
| December 31, 2023 | December 31, 2022 | |||||||||||||||||||||||
| (In thousands) | Originated | Acquired | Total | Originated | Acquired | Total | ||||||||||||||||||
| Commercial, financial, and agricultural: |
||||||||||||||||||||||||
| Owner-occupied commercial real estate |
$ | 999,471 | $ | 598,760 | $ | 1,598,231 | $ | 1,031,330 | $ | 693,597 | $ | 1,724,927 | ||||||||||||
| Nonowner-occupied commercial real estate |
5,096,074 | 1,622,269 | 6,718,343 | 4,515,059 | 1,771,915 | 6,286,974 | ||||||||||||||||||
| Other commercial loans |
3,144,321 | 428,119 | 3,572,440 | 3,110,273 | 502,295 | 3,612,568 | ||||||||||||||||||
|
|
|
|
|
|
|
|
|
|
|
|
|
|||||||||||||
| Total commercial, financial, and agricultural |
$ | 9,239,866 | $ | 2,649,148 | $ | 11,889,014 | $ | 8,656,662 | $ | 2,967,807 | $ | 11,624,469 | ||||||||||||
| Residential real estate |
4,731,392 | 539,844 | 5,271,236 | 3,999,088 | 663,823 | 4,662,911 | ||||||||||||||||||
| Construction & land development |
2,998,152 | 150,093 | 3,148,245 | 2,618,810 | 308,161 | 2,926,971 | ||||||||||||||||||
| Consumer: |
||||||||||||||||||||||||
| Bankcard |
9,962 | 0 | 9,962 | 9,273 | 0 | 9,273 | ||||||||||||||||||
| Other consumer |
1,048,428 | 6,299 | 1,054,728 | 1,346,699 | 9,840 | 1,356,539 | ||||||||||||||||||
|
|
|
|
|
|
|
|
|
|
|
|
|
|||||||||||||
| Total Loans and leases |
$ | 18,027,801 | $ | 3,345,384 | $ | 21,373,185 | $ | 16,630,532 | $ | 3,949,631 | $ | 20,580,163 | ||||||||||||
|
|
|
|
|
|
|
|
|
|
|
|
|
|||||||||||||
41
The following table shows the maturity of loans and leases, outstanding as of December 31, 2023:
| (In thousands) | Less Than One Year |
One To Five Years |
Five to Fifteen Years |
Greater than Fifteen Years |
Total | |||||||||||||||
| Commercial, financial and agricultural: |
||||||||||||||||||||
| Owner-occupied commercial real estate |
$ | 120,013 | $ | 806,380 | $ | 646,165 | $ | 25,673 | $ | 1,598,231 | ||||||||||
| Nonowner-occupied commercial real estate |
1,130,592 | 3,804,852 | 1,680,261 | 102,638 | 6,718,343 | |||||||||||||||
| Other commercial loans |
898,817 | 1,929,157 | 642,509 | 101,957 | 3,572,440 | |||||||||||||||
|
|
|
|
|
|
|
|
|
|
|
|||||||||||
| Total commercial, financial, and agricultural |
$ | 2,149,422 | $ | 6,540,389 | $ | 2,968,935 | $ | 230,268 | $ | 11,889,014 | ||||||||||
| Residential real estate |
179,087 | 539,068 | 578,548 | 3,974,533 | 5,271,236 | |||||||||||||||
| Construction & land development |
843,468 | 1,986,371 | 230,291 | 88,115 | 3,148,245 | |||||||||||||||
| Consumer: |
||||||||||||||||||||
| Bankcard |
1,955 | 7,900 | 107 | 0 | 9,962 | |||||||||||||||
| Other consumer |
16,466 | 762,925 | 274,020 | 1,317 | 1,054,728 | |||||||||||||||
|
|
|
|
|
|
|
|
|
|
|
|||||||||||
| Total Loans and leases |
$ | 3,190,398 | $ | 9,836,653 | $ | 4,051,901 | $ | 4,294,233 | $ | 21,373,185 | ||||||||||
|
|
|
|
|
|
|
|
|
|
|
|||||||||||
At December 31, 2023, for loans and leases due after one year, interest rate information is as follows:
| (In thousands) | One To Five Years |
Five to Fifteen Years |
Greater than Fifteen Years |
Total | ||||||||||||
| Commercial, financial and agricultural: |
||||||||||||||||
| Owner-occupied commercial real estate |
||||||||||||||||
| Outstanding with fixed interest rates |
$ | 687,804 | $ | 232,859 | $ | 8,458 | $ | 929,121 | ||||||||
| Outstanding with adjustable interest rates |
118,576 | 413,306 | 17,215 | 549,097 | ||||||||||||
|
|
|
|
|
|
|
|
|
|||||||||
| Total owner-occupied |
806,380 | 646,165 | 25,673 | 1,478,218 | ||||||||||||
| Nonowner-occupied commercial real estate |
||||||||||||||||
| Outstanding with fixed interest rates |
$ | 2,895,188 | $ | 979,938 | $ | 17,601 | $ | 3,892,727 | ||||||||
| Outstanding with adjustable interest rates |
909,664 | 700,323 | 85,037 | 1,695,024 | ||||||||||||
|
|
|
|
|
|
|
|
|
|||||||||
| Total non-owner occupied |
3,804,852 | 1,680,261 | 102,638 | 5,587,751 | ||||||||||||
| Other commercial loans |
||||||||||||||||
| Outstanding with fixed interest rates |
$ | 1,623,875 | $ | 411,164 | $ | 66,882 | $ | 2,101,921 | ||||||||
| Outstanding with adjustable interest rates |
305,282 | 231,345 | 35,075 | 571,702 | ||||||||||||
|
|
|
|
|
|
|
|
|
|||||||||
| Total other commercial |
1,929,157 | 642,509 | 101,957 | 2,673,623 | ||||||||||||
| Residential real estate |
||||||||||||||||
| Outstanding with fixed interest rates |
$ | 338,212 | $ | 242,599 | $ | 1,974,362 | $ | 2,555,173 | ||||||||
| Outstanding with adjustable interest rates |
200,856 | 335,949 | 2,000,171 | 2,536,976 | ||||||||||||
|
|
|
|
|
|
|
|
|
|||||||||
| Total residential real estate |
539,068 | 578,548 | 3,974,533 | 5,092,149 | ||||||||||||
| Construction |
||||||||||||||||
| Outstanding with fixed interest rates |
$ | 654,280 | $ | 101,523 | $ | 73,413 | $ | 829,216 | ||||||||
| Outstanding with adjustable interest rates |
1,332,091 | 128,768 | 14,702 | 1,475,561 | ||||||||||||
|
|
|
|
|
|
|
|
|
|||||||||
| Total construction |
1,986,371 | 230,291 | 88,115 | 2,304,777 | ||||||||||||
| Consumer: |
||||||||||||||||
| Bankcard |
||||||||||||||||
| Outstanding with fixed interest rates |
$ | 788 | $ | 0 | $ | 0 | $ | 788 | ||||||||
| Outstanding with adjustable interest rates |
7,112 | 107 | 0 | 7,219 | ||||||||||||
|
|
|
|
|
|
|
|
|
|||||||||
| Total bankcard |
7,900 | 107 | 0 | 8,007 | ||||||||||||
| Other consumer |
||||||||||||||||
| Outstanding with fixed interest rates |
$ | 762,473 | $ | 273,989 | $ | 1,317 | $ | 1,037,779 | ||||||||
| Outstanding with adjustable interest rates |
452 | 31 | 0 | 483 | ||||||||||||
|
|
|
|
|
|
|
|
|
|||||||||
| Total other consumer |
762,925 | 274,020 | 1,317 | 1,038,262 | ||||||||||||
| Total outstanding with fixed interest rates |
$ | 6,962,620 | $ | 2,242,072 | $ | 2,142,033 | $ | 11,346,725 | ||||||||
|
|
|
|
|
|
|
|
|
|||||||||
| Total outstanding with adjustable rates |
$ | 2,874,033 | $ | 1,809,829 | $ | 2,152,200 | $ | 6,836,062 | ||||||||
|
|
|
|
|
|
|
|
|
|||||||||
| Total |
$ | 9,836,653 | $ | 4,051,901 | $ | 4,294,233 | $ | 18,182,787 | ||||||||
|
|
|
|
|
|
|
|
|
|||||||||
42
More information relating to loans is presented in Note D, Notes to Consolidated Financial Statements.
Other Assets
Other assets decreased $28.12 million or 9.23% from year-end 2022. Deferred tax assets decreased $19.62 million due to the increase in the fair value of available-for sale securities, while derivative assets decreased $3.69 million. In addition, dealer reserve decreased $10.01 million due to a decrease in indirect automobile financing and core deposits intangibles decreased $6.39 million due to amortization and impairment of trade name intangibles due to the planned consolidation of George Mason’s and Crescent’s mortgage banking business into United Bank. Partially offsetting these decreases in other assets were a $3.88 million increase in income tax receivable due to timing differences, a $2.66 million increase in accounts receivable due to timing differences, and a $5.82 million increase in the pension asset.
Deposits
Deposits represent United’s primary source of funding. Total deposits at December 31, 2023 increased $516.15 million or 2.31%. In terms of composition, noninterest-bearing deposits decreased $1.05 billion or 14.59% while interest-bearing deposits increased $1.57 billion or 10.37% from December 31, 2022.
Noninterest-bearing deposits consist of demand deposit and noninterest bearing money market (“MMDA”) account balances. The $1.05 billion decrease in noninterest-bearing deposits was due mainly to a $915.32 million or 16.93% decrease in commercial noninterest-bearing deposits, a $127.17 million or 8.51% decrease in personal noninterest-bearing deposits, and a $32.32 million or 17.02% decrease in public noninterest-bearing deposits.
Interest-bearing deposits consist of interest-bearing transaction accounts, regular savings, interest-bearing MMDA, and time deposit account balances. Interest-bearing transaction accounts increased $531.17 million or 10.38% since year-end 2022 as the result of an increase of $1.09 billion in commercial interest-bearing transaction accounts, which was partially offset by a $507.72 million decrease in personal interest-bearing transaction accounts and a $54.03 million decrease in public funds interest-bearing transaction accounts. Regular savings accounts decreased $333.04 million or 19.84% mainly as a result of a $301.42 million decrease in personal savings accounts and a $34.58 million decrease in commercial savings accounts. Interest-bearing MMDAs increased $50.05 million or less than 1%. In particular, personal interest-bearing MMDAs decreased $245.74 million while commercial interest-bearing MMDAs increased $265.10 million. Public funds interest-bearing MMDAs increased $30.68 million.
Time deposits under $100,000 increased $222.14 million or 26.32% from year-end 2022. This increase in time deposits under $100,000 was the result of a $233.17 million increase in fixed rate Certificates of Deposits (“CDs”) under $100,000, and a $3.87 million increase in Certificate of Deposit Account Registry Service (“CDARS”) under $100,000. CDs under $100,000 obtained through the use of deposit listing services decreased $5.17 million.
Since year-end 2022, time deposits over $100,000 increased $1.10 billion or 94.13% as fixed rate CDs increased $759.93 million, brokered certificates of deposits increased $266.45 million, and CDARS over $100,000 increased $72.54 million.
The table below summarizes the changes by deposit category since year-end 2022:
| (Dollars in thousands) | December 31 2023 |
December 31 2022 |
$ Change |
% Change |
||||||||||||
| Noninterest-bearing accounts |
$ | 6,149,080 | $ | 7,199,678 | $ | (1,050,598 | ) | (14.59 | %) | |||||||
| Interest-bearing transaction accounts |
5,648,135 | 5,116,966 | 531,169 | 10.38 | % | |||||||||||
| Regular savings |
1,345,258 | 1,678,302 | (333,044 | ) | (19.84 | %) | ||||||||||
| Interest-bearing money market accounts |
6,349,453 | 6,299,404 | 50,049 | 0.79 | % | |||||||||||
| Time deposits under $100,000 |
1,066,092 | 843,950 | 222,142 | 26.32 | % | |||||||||||
| Time deposits over $100,000 (1) |
2,261,301 | 1,164,866 | 1,096,435 | 94.13 | % | |||||||||||
|
|
|
|
|
|
|
|
|
|||||||||
| Total deposits |
$ | 22,819,319 | $ | 22,303,166 | $ | 516,153 | 2.31 | % | ||||||||
|
|
|
|
|
|
|
|
|
|||||||||
| (1) | Includes time deposits of $250,000 or more of $842,118 and $454,477 at December 31, 2023 and December 31, 2022, respectively. |
43
At December 31, 2023, the scheduled maturities of time deposits are as follows:
| Year |
Amount | |||
| (In thousands) | ||||
| 2024 |
$ | 2,947,581 | ||
| 2025 |
278,183 | |||
| 2026 |
41,945 | |||
| 2027 |
45,424 | |||
| 2028 and thereafter |
14,260 | |||
|
|
|
|||
| TOTAL |
$ | 3,327,393 | ||
|
|
|
|||
Maturities of estimated uninsured time deposits of $100,000 or more outstanding at December 31, 2023 are summarized as follows:
| (Dollars in thousands) | 3 months or less |
Over 3 through 6 months |
Over 6 through 12 months |
Over 12 months |
||||||||||||
| Time deposits in amounts in excess of the FDIC Insurance limit |
$ | 115,055 | $ | 86,105 | $ | 137,316 | $ | 63,379 | ||||||||
The amounts of uninsured time deposits of $100,000 or more outstanding at December 31, 2023 are based on estimates using the same methodologies and assumptions used for regulatory reporting requirements.
The average daily amount of deposits and rates paid on such deposits is summarized for the years ended December 31:
| 2023 | 2022 | 2021 | ||||||||||||||||||||||||||||||||||
| Interest | Interest | Interest | ||||||||||||||||||||||||||||||||||
| Amount | Expense | Rate | Amount | Expense | Rate | Amount (1) | Expense | Rate | ||||||||||||||||||||||||||||
| (Dollars in thousands) | ||||||||||||||||||||||||||||||||||||
| Noninterest-bearing |
$ | 6,475,051 | $ | 0 | 0.00 | % | $ | 7,580,624 | $ | 0 | 0.00 | % | $ | 6,709,510 | $ | 0 | 0.00 | % | ||||||||||||||||||
| Interest-bearing transaction and money market |
11,397,302 | 299,306 | 2.63 | % | 11,540,192 | 67,240 | 0.58 | % | 11,010,496 | 23,498 | 0.21 | % | ||||||||||||||||||||||||
| Regular savings |
1,520,201 | 3,128 | 0.21 | % | 1,744,841 | 2,427 | 0.14 | % | 1,455,305 | 2,085 | 0.14 | % | ||||||||||||||||||||||||
| Time deposits |
2,865,258 | 88,660 | 3.09 | % | 2,181,353 | 10,570 | 0.48 | % | 2,462,044 | 16,037 | 0.65 | % | ||||||||||||||||||||||||
|
|
|
|
|
|
|
|
|
|
|
|
|
|||||||||||||||||||||||||
| TOTAL |
$ | 22,257,812 | $ | 391,094 | 1.76 | % | $ | 23,047,010 | $ | 80,237 | 0.35 | % | $ | 21,637,355 | $ | 41,620 | 0.19 | % | ||||||||||||||||||
|
|
|
|
|
|
|
|
|
|
|
|
|
|||||||||||||||||||||||||
| (1) | For the year of 2021, $1,571,758 was reclassed from noninterest-bearing accounts to interest-bearing transaction accounts. |
More information relating to deposits is presented in Note J, Notes to Consolidated Financial Statements.
Borrowings
Total borrowings at December 31, 2023 decreased $373.16 million or 15.82% since year-end 2022. During the year of 2023, short-term borrowings increased $35.40 million or 22.03% due to an increase in securities sold under agreements to repurchase. Long-term borrowings decreased $408.55 million or 18.59% from year-end 2022 due to net repayments of $400.29 million in long-term FHLB advances and the redemption of $9.89 million in subordinated debt during year of 2023.
44
The table below summarizes the change in the borrowing categories since year-end 2022:
| (Dollars in thousands) | December 31 2023 |
December 31 2022 |
$ Change |
% Change |
||||||||||||
| Short-term securities sold under agreements to repurchase |
$ | 196,095 | $ | 160,698 | $ | 35,397 | 22.03 | % | ||||||||
| Long-term FHLB advances |
1,510,487 | 1,910,775 | (400,288 | ) | (20.95 | %) | ||||||||||
| Subordinated debt |
0 | 9,892 | (9,892 | ) | (100.00 | %) | ||||||||||
| Issuances of trust preferred capital securities |
278,616 | 276,989 | 1,627 | 0.59 | % | |||||||||||
|
|
|
|
|
|
|
|
|
|||||||||
| Total borrowings |
$ | 1,985,198 | $ | 2,358,354 | $ | (373,156 | ) | (15.82 | %) | |||||||
|
|
|
|
|
|
|
|
|
|||||||||
For a further discussion of borrowings see Notes K and L, Notes to Consolidated Financial Statements.
Accrued Expenses and Other Liabilities
Accrued expenses and other liabilities at December 31, 2023 increased $23.41 million or 12.34% from year-end 2022. In particular, interest payable increased $13.19 million due to an increase in CDs, brokered deposits and MMDAs as well as rising interest rates. In addition, other accrued expenses increased $12.50 million due primarily to a special FDIC assessment of $11.99 million during the fourth quarter of 2023. Partially offsetting these increases was a decrease of $3.22 million in deferred compensation, a decrease of $2.98 million in accrued loan expenses, and decreases of $2.23 million and $2.21 million in income tax payable and business franchise taxes, respectively, due to timing differences.
Shareholders’ Equity
Shareholders’ equity at December 31, 2023 was $4.77 billion, which was an increase of $255.05 million or 5.65% from year-end 2022.
Retained earnings increased $170.19 million or 10.80% from year-end 2022. Earnings net of dividends for the year of 2023 were $170.19 million.
Accumulated other comprehensive income increased $73.05 million or 21.95% from year-end 2022 due to an increase of $81.52 million in the fair value of United’s available for sale investment portfolio, net of deferred income taxes. In addition, the fair value of cash flow hedges, net of deferred income taxes decreased $13.06 million. The after-tax amortization of the pension net actuarial loss was $2.57 million for the year of 2023.
RESULTS OF OPERATIONS
Overview
The following table sets forth certain consolidated income statement information of United:
| Year Ended | ||||||||||||
| Dollars in thousands except per share amounts) | 2023 | 2022 | 2021 | |||||||||
| Interest income |
$ | 1,401,320 | $ | 1,001,990 | $ | 795,117 | ||||||
| Interest expense |
481,396 | 105,559 | 52,383 | |||||||||
|
|
|
|
|
|
|
|||||||
| Net interest income |
919,924 | 896,431 | 742,734 | |||||||||
| Provision for credit losses |
31,153 | 18,822 | (23,970 | ) | ||||||||
| Noninterest income |
135,258 | 153,261 | 278,128 | |||||||||
| Noninterest expense |
560,224 | 555,087 | 581,979 | |||||||||
|
|
|
|
|
|
|
|||||||
| Income before income taxes |
463,805 | 475,783 | 462,853 | |||||||||
| Income taxes |
97,492 | 96,156 | 95,115 | |||||||||
|
|
|
|
|
|
|
|||||||
| Net income |
$ | 366,313 | $ | 379,627 | $ | 367,738 | ||||||
|
|
|
|
|
|
|
|||||||
| PER COMMON SHARE: |
||||||||||||
| Net income: |
||||||||||||
| Basic |
$ | 2.72 | $ | 2.81 | $ | 2.84 | ||||||
| Diluted |
2.71 | 2.80 | 2.83 | |||||||||
45
Net income for the year 2023 was $366.31 million or $2.71 per diluted share, a decrease of $13.31 million or 3.51% from $379.63 million or $2.80 per diluted share for the year of 2022. Lower net income for the year 2023 compared to the year of 2022 was primarily driven by higher provision for credit losses expense, lower income from mortgage banking and a special FDIC assessment charge.
United’s return on average assets for the year of 2023 was 1.25% and the return on average shareholders’ equity was 7.87% as compared to 1.31% and 8.25% for the year of 2022. For the year of 2023, United’s return on average tangible equity, a non-GAAP measure, was 13.33%, as compared to 14.11% for the year of 2022.
| Year Ended | ||||||||
| (Dollars in thousands) | December 31, 2023 |
December 31, 2022 |
||||||
| Return on Average Tangible Equity: |
||||||||
| (a) Net Income (GAAP) |
$ | 366,313 | $ | 379,627 | ||||
| Average Total Shareholders’ Equity (GAAP) |
4,654,103 | 4,601,440 | ||||||
| Less: Average Total Intangibles |
(1,905,390 | ) | (1,910,377 | ) | ||||
|
|
|
|
|
|||||
| (b) Average Tangible Equity (non-GAAP) |
$ | 2,748,713 | $ | 2,691,063 | ||||
| Return on Tangible Equity (non-GAAP) [(a) / (b)] |
13.33 | % | 14.11 | % | ||||
Net interest income for the year of 2023 was $919.92 million, an increase of $23.49 million or 2.62% from the prior year. The increase of $23.49 million in net interest income occurred because total interest income increased $399.33 million while total interest expense increased $375.84 million from the year of 2022. Generally, interest income increased in 2023 due to the impact of rising market interest rates on earning assets, organic loan growth and a change in the asset mix to higher earning assets while interest expense increased mainly due to higher funding costs as a result of the rising market interest rates on higher interest-bearing balances.
The provision for credit losses was $31.15 million for the year 2023 as compared to $18.82 million for the year 2022. Noninterest income was $135.26 million for the year of 2023, which was a decrease of $18.00 million or 11.75% from the year of 2022. Noninterest expense for the year of 2023 was $560.22 million, which was flat from the year of 2022, increasing $5.14 million or less than 1%.
Income taxes for the year of 2023 were $97.49 million as compared to $96.16 million for the year of 2022. United’s effective tax rate was approximately 21.0% and 20.2% for years ended December 31, 2023 and 2022, respectively, as compared to 20.6% for 2021.
Business Segments
United operates in two business segments: community banking and mortgage banking.
Community Banking
Net income attributable to the community banking segment for the year of 2023 was $387.80 million compared to net income of $397.32 million for the year of 2022. The lower net income within the community banking segment in 2023 was due primarily to a higher provision for credit losses and a special FDIC assessment charge.
Net interest income increased $36.90 million to $927.48 million for the year of 2023, compared to $890.58 million for the same period of 2022. Generally, net interest income for the year of 2023 increased from the year of 2022 due mainly to the impact of rising market interest rates on earning assets, organic loan growth and a change in the asset mix to higher earning assets.
46
Provision for credit losses was $31.15 million for the year of 2023 compared to $18.82 million for the same period of 2022. The increase in the provision for credit losses was mainly due to a change in the impact of the reasonable and supportable forecasts of future macroeconomic conditions and loan growth.
Noninterest income for the year of 2023 decreased $4.60 million to $94.53 million for the year of 2023 as compared to $99.13 million for the year of 2022. This decrease from the year of 2022 was due mainly to net losses on the sales of AFS investment securities and declines in fees from deposit services and income from bank-owned life insurance.
Noninterest expense was $498.54 million for the year ended December 31, 2023, compared to $472.81 million for the same period of 2022. The increase of $25.72 million in noninterest expense was primarily attributable to an increase in FDIC expense due to a special assessment charge and a higher assessment rate.
Mortgage Banking
The mortgage banking segment reported net income of $194 thousand for the year of 2023 as compared to a net loss of $7.22 million for the year of 2022. Noninterest income, which consists mainly of realized and unrealized gains associated with the fair value of commitments and loans held for sale, was $49.36 million for the year of 2023 as compared to $69.31 million for the year of 2022. This decrease in noninterest income from 2022 was due mainly to decreased sales of mortgage loans in the secondary market primarily as a result of a rising interest rate environment. Noninterest expense was $59.20 million for the year of 2023 as compared to $88.98 million the year of 2022. Noninterest expense consists mainly of salaries, commissions, and benefits of mortgage segment employees. The decrease in 2023 was due mainly to lower employee commissions and incentives related to the decreased mortgage banking production.
The following discussion explains in more detail the consolidated results of operations by major category.
Net Interest Income
Net interest income represents the primary component of United’s earnings. It is the difference between interest income from earning assets and interest expense incurred to fund these assets. Net interest income is impacted by changes in the volume and mix of interest-earning assets and interest-bearing liabilities, as well as changes in market interest rates. Such changes, and their impact on net interest income in 2023 and 2022, are presented below.
Net interest income for the year of 2023 was $919.92 million, which was an increase of $23.49 million or 2.62% from the year of 2022. The $23.49 million increase in net interest income occurred because total interest income increased $399.33 million while total interest expense increased $375.84 million from the year of 2022. For the purpose of this remaining discussion, net interest income is presented on a tax-equivalent basis to provide a comparison among all types of interest earning assets. The tax-equivalent basis adjusts for the tax-favored status of income from certain loans and investments. Although this is a non-GAAP measure, United’s management believes this measure is more widely used within the financial services industry and provides better comparability of net interest income arising from taxable and tax-exempt sources. United uses this measure to monitor net interest income performance and to manage its balance sheet composition.
Tax-equivalent net interest income for the year of 2023 increased $23.04 million, or 2.56%, from the year of 2022. The increase in tax-equivalent net interest income was primarily due to the impact of rising market interest rates on earning assets, organic loan growth and a change in the asset mix to higher earning assets. These increases were partially offset by higher interest expense primarily driven by deposit rate repricing, higher average balances and the cost of long-term borrowings, lower income from Paycheck Protection Program (“PPP”) loan fees and lower acquired loan accretion income. The yield on average earning assets increased 150 basis points from the year of 2022 to 5.41%. Within the increase in the average yield on earning assets, the yield on short-term investments increased 379 basis points, the yield on net loans, including loans held for sale, increased 131 basis points, and the yield on investment securities increased 110 basis
47
points. Average earning assets for the year of 2023 increased $270.97 million, or 1.05%, from the year of 2022 due to a $1.49 billion increase in average net loans, including loans held for sale, partially offset by a $697.03 million decrease in average short-term investments and a $522.48 million decrease in average investment securities. The average cost of funds increased 205 basis points from the year of 2022 to 2.69% primarily due to increases of 196 basis points and 204 basis points in the cost of average interest-bearing deposits and in the cost of average long-term borrowings, respectively. Average interest-bearing deposits increased $316.38 million and average long-term borrowings increased $909.27 million from the year of 2022. Net PPP loan fee income decreased $9.16 million from the year of 2022. Acquired loan accretion income was $11.55 million and $18.32 million for the year of 2023 and 2022, respectively, a decrease of $6.77 million. The net interest margin of 3.56% for the year of 2023 was an increase of 6 basis points from the net interest margin of 3.50% for the year of 2022.
United’s tax-equivalent net interest income also includes the impact of acquisition accounting fair value adjustments. The following table provides the discount/premium and net accretion impact to tax-equivalent net interest income for the year ended December 31, 2023, 2022 and 2021.
| Year Ended | ||||||||||||
| (Dollars in thousands) | December 31 2023 |
December 31 2022 |
December 31 2021 |
|||||||||
| Loan accretion |
$ | 11,548 | $ | 18,315 | $ | 33,857 | ||||||
| Certificates of deposit |
1,119 | 2,765 | 4,305 | |||||||||
| Long-term borrowings |
(1,353 | ) | (262 | ) | 684 | |||||||
|
|
|
|
|
|
|
|||||||
| Total |
$ | 11,314 | $ | 20,818 | $ | 38,846 | ||||||
|
|
|
|
|
|
|
|||||||
The following table reconciles the difference between net interest income and tax-equivalent net interest income for the year ended December 31, 2023, 2022 and 2021.
| Year Ended | ||||||||||||
| (Dollars in thousands) | December 31 2023 |
December 31 2022 |
December 31 2021 |
|||||||||
| Net interest income (GAAP) |
$ | 919,924 | $ | 896,431 | $ | 742,734 | ||||||
| Tax-equivalent adjustment (non-GAAP) (1) |
4,014 | 4,467 | 4,218 | |||||||||
|
|
|
|
|
|
|
|||||||
| Tax-equivalent net interest income (non-GAAP) |
$ | 923,938 | $ | 900,898 | $ | 746,952 | ||||||
|
|
|
|
|
|
|
|||||||
| (1) | The tax-equivalent adjustment combines amounts of interest income on federally nontaxable loans and investment securities using the statutory federal income tax rate of 21% for 2023, 2022, and 2021. All interest income on loans and investment securities was subject to state income taxes. |
48
The following table shows the consolidated daily average balance of major categories of assets and liabilities for each of the three years ended December 31, 2023, 2022, and 2021 with the consolidated interest and rate earned or paid on such amount. The interest income and yields on federally nontaxable loans and investment securities are presented on a tax-equivalent basis using the statutory federal income tax rate of 21% for the years ended December 31, 2023, 2022, and 2021. Interest income on all loans and investment securities was subject to state taxes.
| Year Ended December 31, 2023 |
Year Ended December 31, 2022 |
Year Ended December 31, 2021 |
||||||||||||||||||||||||||||||||||
| (Dollars in thousands) | Average Balance |
Interest (1) |
Avg. Rate (1) |
Average Balance |
Interest (1) |
Avg. Rate (1) |
Average Balance |
Interest (1) |
Avg. Rate (1) |
|||||||||||||||||||||||||||
| ASSETS |
||||||||||||||||||||||||||||||||||||
| Earning Assets: |
||||||||||||||||||||||||||||||||||||
| Federal funds sold, securities repurchased under agreements to resell & other short-term investments |
$ | 900,077 | $ | 47,069 | 5.23 | % | $ | 1,597,108 | $ | 22,950 | 1.44 | % | $ | 3,162,814 | $ | 8,734 | 0.28 | % | ||||||||||||||||||
| Investment Securities: |
||||||||||||||||||||||||||||||||||||
| Taxable |
4,125,467 | 144,420 | 3.50 | % | 4,532,713 | 105,780 | 2.33 | % | 3,193,414 | 54,678 | 1.71 | % | ||||||||||||||||||||||||
| Tax-exempt |
294,802 | 8,411 | 2.85 | % | 410,037 | 10,983 | 2.68 | % | 352,843 | 9,129 | 2.59 | % | ||||||||||||||||||||||||
|
|
|
|
|
|
|
|
|
|
|
|
|
|
|
|
|
|
|
|||||||||||||||||||
| Total Securities |
4,420,269 | 152,831 | 3.46 | % | 4,942,750 | 116,763 | 2.36 | % | 3,546,257 | 63,807 | 1.80 | % | ||||||||||||||||||||||||
| Loans and leases, net of unearned income (2) |
20,909,248 | 1,205,434 | 5.77 | % | 19,389,485 | 866,744 | 4.47 | % | 17,714,288 | 726,794 | 4.10 | % | ||||||||||||||||||||||||
| Allowance for credit losses |
(245,386 | ) | (216,104 | ) | (225,740 | ) | ||||||||||||||||||||||||||||||
|
|
|
|
|
|
|
|||||||||||||||||||||||||||||||
| Net loans and leases |
20,663,862 | 5.83 | % | 19,173,381 | 4.52 | % | 17,488,548 | 4.16 | % | |||||||||||||||||||||||||||
|
|
|
|
|
|
|
|
|
|
|
|
|
|
|
|
|
|
|
|||||||||||||||||||
| Total earning assets |
25,984,208 | $ | 1,405,334 | 5.41 | % | 25,713,239 | $ | 1,006,457 | 3.91 | % | 24,197,619 | $ | 799,335 | 3.30 | % | |||||||||||||||||||||
|
|
|
|
|
|
|
|||||||||||||||||||||||||||||||
| Other assets |
3,311,450 | 3,360,609 | 3,058,476 | |||||||||||||||||||||||||||||||||
|
|
|
|
|
|
|
|||||||||||||||||||||||||||||||
| TOTAL ASSETS |
$ | 29,295,658 | $ | 29,073,848 | $ | 27,256,095 | ||||||||||||||||||||||||||||||
|
|
|
|
|
|
|
|||||||||||||||||||||||||||||||
| LIABILITIES |
||||||||||||||||||||||||||||||||||||
| Interest-Bearing Funds: |
||||||||||||||||||||||||||||||||||||
| Interest-bearing deposits (3) |
$ | 15,782,761 | $ | 391,094 | 2.48 | % | $ | 15,466,386 | $ | 80,237 | 0.52 | % | $ | 14,927,845 | $ | 41,620 | 0.28 | % | ||||||||||||||||||
| Short-term borrowings |
182,936 | 6,449 | 3.53 | % | 140,773 | 1,785 | 1.27 | % | 132,489 | 693 | 0.52 | % | ||||||||||||||||||||||||
| Long- term borrowings |
1,923,924 | 83,853 | 4.36 | % | 1,014,655 | 23,537 | 2.32 | % | 819,440 | 10,070 | 1.23 | % | ||||||||||||||||||||||||
|
|
|
|
|
|
|
|
|
|
|
|
|
|
|
|
|
|
|
|||||||||||||||||||
| Total Interest-Bearing Funds |
17,889,621 | 481,396 | 2.69 | % | 16,621,814 | 105,559 | 0.64 | % | 15,879,774 | 52,383 | 0.33 | % | ||||||||||||||||||||||||
|
|
|
|
|
|
|
|||||||||||||||||||||||||||||||
| Noninterest-bearing deposits (3) |
6,475,051 | 7,580,624 | 6,709,510 | |||||||||||||||||||||||||||||||||
| Accrued expenses and other liabilities |
276,883 | 269,970 | 236,123 | |||||||||||||||||||||||||||||||||
|
|
|
|
|
|
|
|||||||||||||||||||||||||||||||
| TOTAL LIABILITIES |
24,641,555 | 24,472,408 | 22,825,407 | |||||||||||||||||||||||||||||||||
| SHAREHOLDERS’ EQUITY |
4,654,103 | 4,601,440 | 4,430,688 | |||||||||||||||||||||||||||||||||
|
|
|
|
|
|
|
|||||||||||||||||||||||||||||||
| TOTAL LIABILITIES AND SHAREHOLDERS’ EQUITY |
$ | 29,295,658 | $ | 29,073,848 | $ | 27,256,095 | ||||||||||||||||||||||||||||||
|
|
|
|
|
|
|
|||||||||||||||||||||||||||||||
| NET INTEREST INCOME |
$ | 923,938 | $ | 900,898 | $ | 746,952 | ||||||||||||||||||||||||||||||
|
|
|
|
|
|
|
|||||||||||||||||||||||||||||||
| INTEREST SPREAD |
2.72 | % | 3.27 | % | 2.97 | % | ||||||||||||||||||||||||||||||
| NET INTEREST MARGIN |
3.56 | % | 3.50 | % | 3.09 | % | ||||||||||||||||||||||||||||||
| (1) | The interest income and the yields on federally nontaxable loans and investment securities are presented on a tax-equivalent basis using the statutory federal income tax rate of 21% for 2023, 2022 and 2021. |
| (2) | Nonaccruing loans and loans held for sale are included in the daily average loan amounts outstanding. |
| (3) | For the year of 2021, average balances of $1,571,758 were reclassed from noninterest- bearing deposits to interest-bearing deposits. |
49
The following table sets forth a summary for the periods indicated of the changes in consolidated interest earned and interest paid detailing the amounts attributable to (i) changes in volume (change in the average volume times the prior year’s average rate), (ii) changes in rate (change in the average rate times the prior year’s average volume), and (iii) changes in rate/volume (change in the average volume times the change in average rate).
| 2023 Compared to 2022 | 2022 Compared to 2021 | |||||||||||||||||||||||||||||||
| Increase (Decrease) Due to | Increase (Decrease) Due to | |||||||||||||||||||||||||||||||
| (In thousands) | Volume | Rate | Rate/ Volume |
Total | Volume | Rate | Rate/ Volume |
Total | ||||||||||||||||||||||||
| Interest income: |
||||||||||||||||||||||||||||||||
| Federal funds sold, securities purchased under agreements to resell and other short-term investments |
$ | (10,037 | ) | $ | 60,530 | $ | (26,374 | ) | $ | 24,119 | $ | (4,384 | ) | $ | 36,689 | $ | (18,089 | ) | $ | 14,216 | ||||||||||||
| Investment securities: |
||||||||||||||||||||||||||||||||
| Taxable |
(9,489 | ) | 53,033 | (4,904 | ) | 38,640 | 22,902 | 19,799 | 8,401 | 51,102 | ||||||||||||||||||||||
| Tax-exempt (1) |
(3,088 | ) | 697 | (181 | ) | (2,572 | ) | 1,481 | 318 | 55 | 1,854 | |||||||||||||||||||||
| Loans (1),(2) |
67,370 | 251,171 | 20,149 | 338,690 | 70,089 | 62,959 | 6,902 | 139,950 | ||||||||||||||||||||||||
|
|
|
|
|
|
|
|
|
|
|
|
|
|
|
|
|
|||||||||||||||||
| TOTAL INTEREST INCOME |
44,756 | 365,431 | (11,310 | ) | 398,877 | 90,088 | 119,765 | (2,731 | ) | 207,122 | ||||||||||||||||||||||
|
|
|
|
|
|
|
|
|
|
|
|
|
|
|
|
|
|||||||||||||||||
| Interest expense: |
||||||||||||||||||||||||||||||||
| Interest-bearing deposits |
$ | 1,645 | $ | 303,141 | $ | 6,071 | $ | 310,857 | $ | 1,508 | $ | 35,827 | $ | 1,282 | $ | 38,617 | ||||||||||||||||
| Short-term borrowings |
535 | 3,181 | 948 | 4,664 | 43 | 994 | 55 | 1,092 | ||||||||||||||||||||||||
| Long-term borrowings |
21,095 | 20,699 | 18,522 | 60,316 | 2,401 | 8,932 | 2,134 | 13,467 | ||||||||||||||||||||||||
|
|
|
|
|
|
|
|
|
|
|
|
|
|
|
|
|
|||||||||||||||||
| TOTAL INTEREST EXPENSE |
23,275 | 327,021 | 25,541 | 375,837 | 3,952 | 45,753 | 3,471 | 53,176 | ||||||||||||||||||||||||
|
|
|
|
|
|
|
|
|
|
|
|
|
|
|
|
|
|||||||||||||||||
| NET INTEREST INCOME |
$ | 21,481 | $ | 38,410 | $ | (36,851 | ) | $ | 23,040 | $ | 86,136 | $ | 74,012 | $ | (6,202 | ) | $ | 153,946 | ||||||||||||||
|
|
|
|
|
|
|
|
|
|
|
|
|
|
|
|
|
|||||||||||||||||
| (1) | Yields and interest income on federally tax-exempt loans and investment securities are computed on a fully tax-equivalent basis using the statutory federal income tax rate of 21% for 2023, 2022 and 2021. |
| (2) | Nonaccruing loans and loans held for sale are included in the daily average loan amounts outstanding. |
Provision for Credit Losses
United’s provision for credit losses was $31.15 million for the year of 2023 while the provision for credit losses was $18.82 million for the year of 2022. United’s provision for credit losses relates to its portfolio of loans and leases, held to maturity securities and interest receivable on loans which are discussed in more detail in the following paragraphs.
The provision for loan and lease losses for the year of 2023 was $31.15 million as compared to $18.83 million for the year of 2022. The higher amount of provision expense for the year of 2023 compared to the year of 2022 was mainly due to a change in the reasonable and supportable forecasts of future macroeconomic conditions and loan growth. Net charge-offs for the year of 2023 were $6.66 million as compared to $101 thousand for the year of 2022. The higher amount of net charge-offs for the year of 2023 as compared to year of 2022 was primarily due to an increase in charge-offs in 2023 for the consumer loan segment as well as a lower amount of recoveries in 2023 of previously charged-off amounts for the other commercial loan segment. Net charge-offs as a percentage of average loans and leases were 0.03% and zero for the year of 2023 and 2022, respectively.
50
The following table shows a summary of United’s nonperforming assets including nonperforming loans and other real estate owned (“OREO”) at December 31, 2023 and December 31, 2022:
| (In thousands) | December 31 2023 |
December 31 2022 |
||||||
| Nonaccrual loans |
$ | 30,919 | $ | 23,685 | ||||
| Loans past due 90 days of more |
14,579 | 15,565 | ||||||
| Restructured loans (1) |
n/a | 19,388 | ||||||
|
|
|
|
|
|||||
| Total nonperforming loans |
$ | 45,498 | $ | 58,638 | ||||
| Other real estate owned |
2,615 | 2,052 | ||||||
|
|
|
|
|
|||||
| Total nonperforming assets |
$ | 48,113 | $ | 60,690 | ||||
|
|
|
|
|
|||||
Note:
| (1) | On January 1, 2023, United adopted ASU 2022-02, “Troubled Debt Restructurings and Vintage Disclosures” prospectively which eliminated the accounting guidance on troubled debt restructurings and enhanced creditors’ disclosure requirements related to loan refinancings and restructurings for borrowers experiencing financial difficulty. After the adoption of ASU 2022-02, United no longer considers accruing restructured loans that are fewer than 90 days past due as nonperforming loans or nonperforming assets. Nonperforming loans and nonperforming assets at December 31, 2022 included $9,127 of restructured loans that were on accruing status and fewer than 90 days past due but classified as nonperforming loans and nonperforming assets. Restructured loans that are on nonaccrual or 90-day past due are included in the above nonperforming loan and nonperforming asset categories at December 31, 2023. |
Restructured loans with an aggregate balance of $7,186 at December 31, 2022 were on nonaccrual status, but are not included in “Nonaccrual loans” above. Restructured loans with an aggregate balance of $3,075 at December 31, 2022 were 90 days past due, but not included in “Loans past due 90 days or more” above.
United maintains an allowance for loan and lease losses and a reserve for lending-related commitments. The combined allowance for loan and lease losses and reserve for lending-related commitments is considered the allowance for credit losses. At December 31, 2023, the allowance for credit losses was $303.94 million as compared to $280.94 million at December 31, 2022.
At December 31, 2023, the allowance for loan and lease losses was $259.24 million as compared to $234.75 million at December 31, 2022. The increase in the allowance for loan and lease losses was primarily due to increased reserves for the nonowner-occupied commercial real estate and construction and land development loan segments. As a percentage of loans and leases, net of unearned income, the allowance for loan losses was 1.21% at December 31, 2023 and 1.14% at December 31, 2022. The ratio of the allowance for loan and lease losses to nonperforming loans and leases or coverage ratio was 569.78% and 400.33% at December 31, 2023 and December 31, 2022, respectively. The increase in this ratio was due an increase in the allowance for loan losses and a decline in nonperforming loans.
The following table summarizes United’s credit loss experience for loan and leases losses, based on loan categories, for the year of 2023 and 2022:
| (Dollars in thousands) | 2023 | 2022 | ||||||
| Commercial, financial and agricultural: |
||||||||
| Owner-occupied commercial real estate |
||||||||
| Loans & leases charged off |
$ | 855 | $ | 68 | ||||
| Recoveries |
187 | 489 | ||||||
|
|
|
|
|
|||||
| Net loans & leases charged off (recovered) |
$ | 668 | $ | (421 | ) | |||
| Average gross loans & leases outstanding |
1,687,029 | 1,716,201 | ||||||
| Net charge-offs (recoveries) as a percentage of average gross loans & leases outstanding |
0.04 | % | (0.02 | %) | ||||
| Nonowner-occupied commercial real estate |
||||||||
| Loans & leases charged off |
$ | 24 | $ | 0 | ||||
| Recoveries |
1,233 | 234 | ||||||
|
|
|
|
|
|||||
| Net loans & leases (recovered) charged off |
$ | (1,209 | ) | $ | (234 | ) | ||
| Average gross loans & leases outstanding |
6,472,608 | 6,042,221 | ||||||
| Net (recoveries) charge-offs as a percentage of average gross loans & leases outstanding |
(0.02 | %) | 0.00 | % | ||||
51
| (Dollars in thousands) | 2023 | 2022 | ||||||
| Other Commercial |
||||||||
| Loans & leases charged off |
$ | 2,007 | $ | 4,308 | ||||
| Recoveries |
1,729 | 5,367 | ||||||
|
|
|
|
|
|||||
| Net loans & leases charged off (recovered) |
$ | 278 | $ | (1,059 | ) | |||
| Average gross loans & leases outstanding |
3,568,986 | 3,613,204 | ||||||
| Net charge-offs (recoveries) as a percentage of average gross loans & leases outstanding |
0.01 | % | (0.03 | %) | ||||
| Residential Real Estate |
||||||||
| Loans & leases charged off |
$ | 785 | $ | 1,546 | ||||
| Recoveries |
697 | 1,507 | ||||||
|
|
|
|
|
|||||
| Net loans & leases charged off |
$ | 88 | $ | 39 | ||||
| Average gross loans & leases outstanding |
4,894,091 | 4,080,515 | ||||||
| Net charge-offs as a percentage of average gross loans & leases outstanding |
0.00 | % | 0.00 | % | ||||
| Construction |
||||||||
| Loans & leases charged off |
$ | 14 | $ | 2 | ||||
| Recoveries |
80 | 1,414 | ||||||
|
|
|
|
|
|||||
| Net loans & leases recovered |
$ | (66 | ) | $ | (1,412 | ) | ||
| Average gross loans & leases outstanding |
3,025,815 | 2,517,561 | ||||||
| Net recoveries as a percentage of average gross loans & leases outstanding |
0.00 | % | (0.06 | %) | ||||
| Consumer: |
||||||||
| Bankcard |
||||||||
| Loans & leases charged off |
$ | 263 | $ | 355 | ||||
| Recoveries |
28 | 9 | ||||||
|
|
|
|
|
|||||
| Net loans & leases charged off |
$ | 235 | $ | 346 | ||||
| Average gross loans & leases outstanding |
9,290 | 8,766 | ||||||
| Net charge-offs as a percentage of average gross loans & leases outstanding |
2.53 | % | 3.95 | % | ||||
| Other consumer |
||||||||
| Loans & leases charged off |
$ | 7,356 | $ | 3,371 | ||||
| Recoveries |
687 | 529 | ||||||
|
|
|
|
|
|||||
| Net loans & leases charged off |
$ | 6,669 | $ | 2,842 | ||||
| Average gross loans & leases outstanding |
1,211,568 | 1,309,773 | ||||||
| Net charge-offs as a percentage of average gross loans & leases outstanding |
0.55 | % | 0.22 | % | ||||
| Total |
||||||||
| Loans & leases charged off |
$ | 11,304 | $ | 9,650 | ||||
| Recoveries |
4,641 | 9,549 | ||||||
|
|
|
|
|
|||||
| Net loans & leases charged off |
$ | 6,663 | $ | 101 | ||||
| Average gross loans & leases outstanding |
20,869,387 | 19,288,241 | ||||||
| Net charge-offs as a percentage of average gross loans & leases outstanding |
0.03 | % | 0.00 | % | ||||
| Nonaccrual loans & leases |
$ | 30,919 | $ | 30,871 | ||||
| Allowance for loan & lease losses |
259,237 | 234,746 | ||||||
| Loans & leases (net of unearned income) |
21,359,084 | 20,558,166 | ||||||
| Allowance for loan & lease losses as a percentage of loans (net of unearned income) |
1.21 | % | 1.14 | % | ||||
| Nonaccrual loans as a percentage of loans & leases (net of unearned income) |
0.14 | % | 0.15 | % | ||||
| Allowance for loan & lease losses as a percentage of nonaccrual loans & leases |
838.45 | % | 760.41 | % | ||||
52
United continues to evaluate risks which may impact its loan and lease portfolios. Reserves are initially determined based on losses identified from the PD/LGD and Cohort models which utilize the Company’s historical information. Then, any qualitative adjustments are applied to account for the Company’s view of the future and other factors. If current conditions underlying any qualitative adjustment factor were deemed to be materially different than historical conditions, an adjustment was made for that factor.
The year of 2023 qualitative adjustments include analyses of the following:
| • | Current conditions – United considered the impact of inflation, interest rates, the potential impact of the geopolitical situation, the banking regulatory environment and a potential government shutdown when making determinations related to factor adjustments, such as changes in economic and business conditions; collateral values for dependent loans; past due, nonaccrual and adversely classified loans and leases; concentrations of credit and external factors. |
| • | Reasonable and supportable forecasts – The forecast is determined on a portfolio-by-portfolio basis by relating the correlation of real GDP and the unemployment rate to loss rates to forecasts of those variables. The reasonable and supportable forecast selection is subjective in nature and requires more judgment compared to the other components of the allowance. Assumptions for the economic variables were the following: |
| Ø | The forecast for real GDP shifted slightly in the fourth quarter, from a projection of 1.50% for 2024 as of mid-September 2023 to 1.40% for 2024 as of mid-December with a projection of 1.80% for 2025. The unemployment rate forecast for 2024 and 2025 remained the same at 4.10%. |
| Ø | Greater risk of loss in the office portfolio due to continued hybrid and remote work that may be exacerbated by future economic conditions and in the commercial other and construction portfolios due to weakened economic conditions. |
| Ø | Reversion to historical loss data occurs via a straight-line method during the year following the one-year reasonable and supportable forecast period. |
The following table presents the allocation of United’s allowance for credit losses for the years ended December 31:
| 2023 | 2022 | |||||||
| (in thousands) | ||||||||
| Commercial, financial & agricultural: |
||||||||
| Owner-occupied commercial real estate |
$ | 11,895 | $ | 13,945 | ||||
| Nonowner-occupied commercial real estate |
57,935 | 38,543 | ||||||
| Other commercial |
75,007 | 79,706 | ||||||
|
|
|
|
|
|||||
| Total commercial, financial & agricultural |
144,837 | 132,194 | ||||||
| Residential real estate |
41,167 | 36,227 | ||||||
| Construction & land development |
59,913 | 48,390 | ||||||
| Consumer: |
||||||||
| Bankcard |
810 | 561 | ||||||
| Other consumer |
12,510 | 17,374 | ||||||
|
|
|
|
|
|||||
| Allowance for loan losses |
$ | 259,237 | $ | 234,746 | ||||
| Reserve for lending-related commitments |
44,706 | 46,189 | ||||||
|
|
|
|
|
|||||
| Allowance for credit losses |
$ | 303,943 | $ | 280,935 | ||||
|
|
|
|
|
|||||
The following is a summary of loans and leases outstanding as a percent of gross loans at December 31:
| 2023 | 2022 | |||||||
| Commercial, financial & agricultural: |
||||||||
| Owner-occupied commercial real estate |
7.48 | % | 8.38 | % | ||||
| Nonowner-occupied commercial real estate |
31.43 | % | 30.55 | % | ||||
| Other commercial |
16.72 | % | 17.55 | % | ||||
|
|
|
|
|
|||||
| Total commercial, financial & agricultural |
55.63 | % | 56.48 | % | ||||
| Residential real estate |
24.66 | % | 22.66 | % | ||||
| Construction & land development |
14.73 | % | 14.22 | % | ||||
| Consumer: |
||||||||
| Bankcard |
0.05 | % | 0.05 | % | ||||
| Other consumer |
4.93 | % | 6.59 | % | ||||
|
|
|
|
|
|||||
| Total |
100.00 | % | 100.00 | % | ||||
|
|
|
|
|
|||||
53
United’s review of the allowance for loan and lease losses at December 31, 2023 produced increased reserves in three of the four loan categories as compared to December 31, 2022. The allowance related to the commercial, financial & agricultural loan pool increased $12.64 million due to increased outstanding balances and increased reasonable and supportable forecast adjustments particularly as it pertains to office loans. The construction and land development loan pool reserve increased $11.52 million due to increased outstanding balances as well as increased risk of loss for collateral value for dependent loans and increased reasonable and supportable forecast adjustments. The residential real estate reserve increased $4.94 million due to increased outstanding balances. The consumer loan pool reserve decreased $4.61 million primarily due to a decrease in outstanding balances.
An allowance is established for estimated lifetime losses for loans that are individually assessed. Nonperforming commercial loans and leases are regularly reviewed to identify expected credit losses. A loan is individually assessed for expected credit losses when the loan does not share similar characteristics with other loans in the portfolio. Measuring expected credit losses of a loan requires judgment and estimates, and the eventual outcomes may differ from those estimates. Expected credit losses are measured based upon the present value of expected future cash flows from the loan discounted at the loan’s effective rate or the fair value of collateral if the loan is collateral dependent. When the selected measure is less than the recorded investment in the loan, an expected credit loss has occurred. The allowance for loans and leases that were individually assessed was $13.15 million at December 31, 2023 and $1.27 million at December 31, 2022. In comparison to the prior year-end, this element of the allowance increased $11.88 million due to a commercial relationship identified in 2023 with a loss potential requiring individually assessed reserves of $12.16 million.
Management believes that the allowance for credit losses of $303.94 million at December 31, 2023 is adequate to provide for expected losses on existing loans and lending-related commitments based on information currently available. United’s loan administration policies are focused on the risk characteristics of the loan portfolio in terms of loan approval and credit quality. The commercial loan portfolio is monitored for possible concentrations of credit in one or more industries. Management has lending limits as a percentage of capital per type of credit concentration in an effort to ensure adequate diversification within the portfolio. Most of United’s commercial loans are secured by real estate located in West Virginia, southeastern Ohio, Pennsylvania, Virginia, Maryland, North Carolina, South Carolina, and the District of Columbia. It is the opinion of management that these commercial loans do not pose any unusual risks and that adequate consideration has been given to these loans in establishing the allowance for credit losses.
The provision for credit losses related to held to maturity securities for the year of 2023 and 2022 was immaterial. The allowance for credit losses related to held to maturity securities was $17 thousand as of December 31, 2023 as compared to $18 thousand as of December 31, 2022. There was no provision for credit losses recorded on available for sale investment securities for the year of 2023 and 2022 and no allowance for credit losses on available for sale investment securities as of December 31, 2023 and 2022.
Management is not aware of any potential problem loans or leases, trends or uncertainties, which it reasonably expects, will materially impact future operating results, liquidity, or capital resources which have not been disclosed.
Other Income
Other income consists of all revenues, which are not included in interest and fee income related to earning assets. Noninterest income has been and will continue to be an important factor for improving United’s profitability. Recognizing the importance, management continues to evaluate areas where noninterest income can be enhanced.
Noninterest income for the year of 2023 was $135.26 million, which was a decrease of $18.00 million or 11.75% from the year of 2022. The decrease was due mainly to net losses recognized on the sales of AFS investment securities, decreases in income from mortgage banking activities and fees from deposit services partially offset by a net gain on the sale of MSRs within mortgage loan servicing income.
54
For the year of 2023, net losses on investment securities were $7.65 million as compared to net gains on investment securities of $776 thousand for the year of 2022. The net losses in 2023 were mainly due to a net loss of $7.24 million on the sale of approximately $187 million of AFS investment securities in the second quarter of 2023. United recognized a net gain of $1.36 million on an equity security without a readily determinable market value and a $589 thousand net loss on equity securities for the year of 2022. United did not recognize any impairment on investment securities for the year of 2023 and 2022.
Income from mortgage banking activities totaled $26.59 million for the year of 2023 compared to $42.69 million for the year of 2022. The decrease of $16.10 million or 37.71% for the year of 2023 was primarily a result of lower mortgage loan originations and sales volume driven by a rising interest rate environment and a lower margin on loans sold in the secondary market. Mortgage loan sales were $861.52 million in the year of 2023 as compared to $2.20 billion in the year of 2022. Mortgage loans originated for sale were $860.90 million for the year of 2023 as compared to $1.90 billion for the year of 2022.
Fees from deposit services for the year of 2023 were $37.08 million, a decrease of $3.48 million or 8.58% from the year of 2022. In particular, overdraft fees were down $2.69 million due to the impact of changes in United’s overdraft policy and account analysis fees declined $2.13 million. Partially offsetting these decreases were increases of $725 thousand and $581 thousand on early withdrawal penalties on CDs and debit card income, respectively.
Mortgage servicing income was $13.75 million for the year of 2023, an increase of $4.51 million or 48.85% from the year of 2022 due primarily to a net gain of $8.31 million on the sale of mortgage servicing rights during 2023.
Fees from trust services for the year of 2023 were $18.32 million, an increase of $1.10 million or 6.40% from the year of 2022 due to an increase in managed assets.
Income from bank-owned life insurance (“BOLI”) for the year of 2023 decreased $858 thousand or 9.34% from the year of 2022 due to a decrease of $2.76 million in death benefits. Death benefits were $571 thousand for the year of 2023 as compared to death benefits of $3.33 million in year of 2022.
Other miscellaneous income for the year of 2023 increased $3.72 million or 50.63% from the year of 2022 due mainly to a net gain of $2.66 million from the payoff of a fixed rate commercial loan that had an associated interest rate swap derivative.
Other Expense
Just as management continues to evaluate areas where noninterest income can be enhanced, it strives to improve the efficiency of its operations to reduce costs. Other expense includes all items of expense other than interest expense, the provision for credit losses and income tax expense. Noninterest expense for the year of 2023 was $560.22 million, which was flat from the year of 2022, increasing $5.14 million or less than 1% driven by increases in FDIC insurance expense, employee benefits expense, and net occupancy expense. Partially offsetting these increases were decreases in OREO expenses on as well as net losses from sales of OREO properties, mortgage loan servicing expense and impairment, and other noninterest expense.
Employee compensation for the year of 2023 decreased $11.60 million or 4.78% from the year of 2022. The decrease for 2023 was due mainly to lower employee commissions and incentives related to a decline in mortgage banking production and a decline in base salaries due to a lower employee headcount.
Employee benefits expense for the year of 2023 increased $2.42 million or 5.28% as compared to the year of 2022. For the year of 2023, postretirement expense, which includes expense associated with United’s pension plan, supplemental early retirement plans (“SERPs”) and Savings and Stock Investment Plan (“401K plan”), decreased $2.09 million from the year of 2022. United uses certain valuation methodologies to measure the fair value of the assets within United’s pension plan which are presented in Note O, Notes to Consolidated Financial Statements. The funded status of
55
United’s pension plan is based upon the fair value of the plan assets compared to the projected benefit obligation. The determination of the projected benefit obligation and the associated periodic benefit expense involves significant judgment and estimation of future employee compensation levels, the discount rate and the expected long-term rate of return on plan assets. If United assumes a 1% increase or decrease in the estimation of future employee compensation levels while keeping all other assumptions constant, the benefit cost associated with the pension plan would increase by approximately $604 thousand and decrease by approximately $572 thousand, respectively. If United assumes a 1% increase or decrease in the discount rate while keeping all other assumptions constant, the benefit cost associated with the pension plan would decrease by approximately $2.18 million and increase by approximately $2.61 million, respectively. If United assumes a 1% increase or decrease in the expected long-term rate of return on plan assets while keeping all other assumptions constant, the benefit cost associated with the pension plan would decrease by and increase by approximately $1.62 million, respectively.
Net occupancy expense increased $1.30 million or 2.87% for the year of 2023 as compared to the prior year. This increase was primarily due to higher amounts of building rental and depreciation expense partially offset by lower maintenance costs.
OREO expense for the year of 2023 decreased $783 thousand or 36.62% from the year of 2022 due mainly to fewer declines in the fair value of OREO properties.
Net losses on the sales of OREO properties declined $760 thousand or 108.57% for the year of 2023 as compared to the year of 2022.
Mortgage loan servicing expense and impairment for the year of 2023 decreased $1.50 million or 21.17% from the year of 2022. The decrease was due to the recovery of past temporary impairment and lower amortization expense of mortgage servicing rights.
FDIC expense for the year of 2023 increased $18.39 million or 153.39% from the year of 2022. The increase was due mainly to a $11.99 million special assessment fee levied on banking organizations to recover losses to the Deposit Insurance Fund as well as a higher overall assessment rate and base.
Other expense for the year of 2023 decreased $2.39 million or 1.73% from the year of 2022. The decrease in other noninterest expense mainly resulted from a decline $16.23 million in the reserve for unfunded loan commitments. Partially offsetting this decrease were increases in business franchise taxes of $2.66 million, expense of $2.65 million for mortgage loan down payment and closing cost assistance programs, amortization of $1.67 million for tax credit investments, impairment of $1.28 million on trade name tangibles due to the planned consolidation of George Mason’s and Crescent’s mortgage banking business into United Bank, consulting and legal expense of $1.20 million, loan collection expense of $1.03 million as well as higher amounts of certain other general operating expenses.
Income Taxes
For the year ended December 31, 2023, income taxes were $97.49 million, compared to $96.16 million for 2022, an increase of $1.34 million or 1.39%. The increase was due to a higher effective tax rate partially offset by lower earnings. United’s effective tax rate was approximately 21.0% and 20.2% for years ended December 31, 2023 and 2022, respectively. The increase in the effective tax rate for the year of 2023 was primarily driven by increases in the federal and state tax provisions as well as lower benefits related to the issuance of shares in share-based compensation plans. For further details related to income taxes, see Note N, Notes to Consolidated Financial Statements.
Quarterly Results
Net income for the first quarter of 2023 was $98.31 million as compared to earnings of $81.66 million for the first quarter of 2022. Earnings for the first quarter of 2023, as compared to the first quarter of 2022, increased primarily due to higher net interest income as a result of the impact of rising market interest rates on earning assets, organic loan growth and a change in the asset mix to higher earning assets. Diluted earnings per share were $0.73 for the first quarter of 2023 and $0.60 for the first quarter of 2022. Net interest income for the first quarter of 2023 increased $42.82 million,
56
or 22.36%, to $234.32 million from net interest income of $191.50 million for the first three months of 2022. The increase of $42.82 million in net interest income occurred because total interest income increased $126.51 million while total interest expense increased $83.69 million from the first quarter of 2022. The provision for credit losses was $6.89 million for the first quarter of 2023 as compared to a net benefit of $3.41 million for the first quarter of 2022. The increase in the provision for credit losses was mainly due to a change in qualitative factors and the impact of reasonable and supportable forecasts of future macroeconomic conditions. Noninterest income was $32.74 million for the first three months of 2023, a decrease of $13.28 million or 28.86% from the first three months of 2022 due mainly to decreased income from mortgage banking activities primarily due to lower mortgage loan origination and sale volume and a lower margin on loans sold in the secondary market. Noninterest expense for the first three months of 2023 decreased $1.76 million or 1.26% from the first three months of 2022 due mainly to lower employee compensation expense as a result of lower employee commissions and incentives related to mortgage banking production and a lower employee headcount. Income taxes increased $4.35 million or 21.64% for the first three months of 2023 as compared to the first three months of 2022 primarily due to increased earnings and a higher effective tax rate.
Net income for the second quarter of 2023 was $92.46 million or $0.68 per diluted share, as compared to $95.61 million or $0.71 per diluted share for the prior year second quarter. During the second quarter of 2023, United sold MSRs with an aggregate unpaid principal balance of approximately $2 billion at a net gain of $8.15 million. Additionally, during the second quarter of 2023, United sold approximately $187 million of AFS investment securities at a net loss of $7.24 million. Net interest income for the second quarter of 2023 was $227.46 million, which was an increase of $12.56 million, or 5.84%, from the second quarter of 2022. The increase of $12.56 million in net interest income occurred because total interest income increased $118.16 million while total interest expense increased $105.60 million from the second quarter of 2022. The provision for credit losses was $11.44 million for the second quarter of 2023 while the provision for credit losses was a net benefit of $1.81 million for the second quarter 2022. The increase in the provision for credit losses was mainly due to a change in qualitative factors and the impact of reasonable and supportable forecasts of future macroeconomic conditions. For the second quarter of 2023, noninterest income was $35.18 million, which was a decrease of $8.43 million or 19.33% from the second quarter of 2022. The decrease in noninterest income was due mainly to lower mortgage loan origination and sale volume and a lower margin on loans sold in the secondary market as well as the previously mentioned net losses on the sales of securities in 2023. For the second quarter of 2023, noninterest expense decreased $5.89 million or 4.17% from the second quarter of 2022 due mainly to a decrease in the expense for the reserve for unfunded loan commitments within other expenses. Income taxes for the second quarter of 2023 were $23.45 million as compared to $23.53 million for the second quarter of 2022. For the quarters ended June 30, 2023 and 2022, United’s effective tax rate was 20.23% and 19.75%, respectively.
Net income for the third quarter of 2023 was $96.16 million or $0.71 per diluted share, as compared to $102.59 million or $0.76 per diluted share for the prior year third quarter. Net interest income for the third quarter of 2023 was $228.45 million, which was a decrease of $12.17 million, or 5.06%, from the third quarter of 2022. The decrease of $12.17 million in net interest income occurred because total interest income increased $93.23 million while total interest expense increased $105.40 million from the third quarter of 2022. The provision for credit losses was $5.95 million for the third quarter of 2023 while the provision for credit losses was $7.67 million for the third quarter of 2022. The lower amount of provision expense for the third quarter of 2023 as compared to the third quarter of 2022 was mainly due to the impact of reasonable and supportable forecasts of future macroeconomic conditions. For the third quarter of 2023, noninterest income was $33.66 million, which was an increase of $912 thousand or 2.78% from the third quarter of 2022. This increase was primarily due to increases in income from mortgage banking activities and income from BOLI partially offset by a decrease in mortgage loan servicing income. For the third quarter of 2023, noninterest expense decreased $1.97 million or 1.43% from the third quarter of 2022 primarily due to decreases in OREO expense, mortgage loan servicing expense and certain general operating expenses within other noninterest expenses partially offset by increases in employee benefits and FDIC insurance expense. Income taxes for the third quarter of 2023 were $24.78 million as compared to $25.92 million for the third quarter of 2022. For the quarters ended September 30, 2023 and June 30, 2023, United’s effective tax rate was 20.49% and 20.23%, respectively.
Net income for the fourth quarter of 2023 was $79.39 million or $0.59 per diluted share as compared to earnings of $99.77 million or $0.74 per diluted share for the fourth quarter of 2022. Net interest income for the fourth quarter of 2023 was $229.69 million, which was a decrease of $19.71 million or 7.90% from the fourth quarter of 2022. The $19.71 million decrease in net interest income occurred because total interest income increased $61.43 million while total interest
57
expense increased $81.15 million from the fourth quarter of 2022. The provision for credit losses was $6.88 million for the fourth quarter of 2023 as compared to a provision for credit losses of $16.37 million for the fourth quarter of 2022. The decrease in the provision for credit losses was primarily due the impact of reasonable and supportable forecasts of future macroeconomic conditions. Noninterest income for the fourth quarter of 2023 was $33.68 million, which was an increase of $2.80 million, or 9.05% from the fourth quarter of 2022. The increase in noninterest income was driven by an increase of $2.73 million in other noninterest income due to the $2.66 million gain on the from the payoff of a fixed rate commercial loan that had an associated interest rate swap derivative. Noninterest expense for the fourth quarter of 2023 was $152.29 million, an increase of $14.75 million, or 10.72%, from the fourth quarter of 2022 primarily due to increases of $13.37 million in FDIC insurance expense due to the $11.99 million special assessment recognized in the fourth quarter of 2023 as well as a higher overall assessment rate. For the fourth quarter of 2023, income tax expense was $24.81 million as compared to $26.61 million for the fourth quarter of 2022. The decrease of $1.80 million was primarily due to lower earnings and partially offset by a higher effective tax rate. United’s effective tax rate was 23.81% for the fourth quarter of 2023 and 21.06% for the fourth quarter of 2022.
Additional quarterly financial data for 2023 and 2022 may be found in Note Y, Notes to Consolidated Financial Statements.
The Effect of Inflation
United’s income statements generally reflect the effects of inflation. Since interest rates, loan demand and deposit levels are impacted by inflation, the resulting changes in the interest-sensitive assets and liabilities are included in net interest income. Similarly, operating expenses such as salaries, rents and maintenance include changing prices resulting from inflation. One item that would not reflect inflationary changes is depreciation expense. Subsequent to the acquisition of depreciable assets, inflation causes price levels to rise; therefore, historically presented dollar values do not reflect this inflationary condition. Inflationary pressure on consumers and uncertainty regarding the economy could result in changes in consumer and business spending, borrowing and savings habits. Such conditions could have a material adverse effect on the credit quality of our loans and our business, financial condition and results of operations. Management will monitor the impact of inflation as conditions warrant.
The Effect of Regulatory Policies and Economic Conditions
United’s business and earnings are affected by the monetary and fiscal policies of the United States government, its agencies and various other governmental regulatory authorities. The Federal Reserve Board regulates the supply of money in order to influence general economic conditions. Among the instruments of monetary policy available to the Federal Reserve Board are (i) conducting open market operations in United States government obligations, (ii) changing the discount rate on financial institution borrowings, (iii) imposing or changing reserve requirements against financial institution deposits, and (iv) restricting certain borrowings and imposing or changing reserve requirements against certain borrowings by financial institutions and their affiliates. These methods are used in varying degrees and combinations to affect directly the availability of bank loans and deposits, as well as the interest rates charged on loans and paid on deposits.
United’s business and earnings are also affected by general and local economic conditions. Certain credit markets can experience difficult conditions and volatility. Downturns in the credit market can cause a decline in the value of certain loans and securities, a reduction in liquidity and a tightening of credit. A downturn in the credit market often signals a weakening economy that can cause job losses and thus distress on borrowers and their ability to repay loans. Uncertainties in credit markets and the economy present significant challenges for the financial services industry.
Regulatory policies and economic conditions have had a significant effect on the operating results of financial institutions in the past and are expected to continue to do so in the future; however, United cannot accurately predict the nature, timing or extent of any effect such policies or economic conditions may have on its future business and earnings.
58
Liquidity and Capital Resources
In the opinion of management, United maintains liquidity that is sufficient to satisfy its depositors’ requirements and the credit needs of its customers. Like all banks, United depends upon its ability to renew maturing deposits and other liabilities on a daily basis and to acquire new funds in a variety of markets. A significant source of funds available to United is “core deposits”. Core deposits include certain demand deposits, statement and special savings and NOW accounts. These deposits are relatively stable, and they are the lowest cost source of funds available to United. Short-term borrowings have also been a significant source of funds. These include federal funds purchased and securities sold under agreements to repurchase as well as advances from the FHLB. Repurchase agreements represent funds which are obtained as the result of a competitive bidding process.
Liquid assets are cash and those items readily convertible to cash. All banks must maintain sufficient balances of cash and near-cash items to meet the day-to-day demands of customers and United’s cash needs. Other than cash and due from banks, the available for sale securities portfolio and maturing loans are the primary sources of liquidity.
The goal of liquidity management is to ensure the ability to access funding which enables United to efficiently satisfy the cash flow requirements of depositors and borrowers and meet United’s cash needs. Liquidity is managed by monitoring funds’ availability from a number of primary sources. Substantial funding is available from cash and cash equivalents, unused short-term borrowing and a geographically dispersed network of branches providing access to a diversified and substantial retail deposit market.
Short-term needs can be met through a wide array of outside sources such as correspondent and downstream correspondent federal funds and utilization of Federal Home Loan Bank advances.
Other sources of liquidity available to United to provide long-term as well as short-term funding alternatives, in addition to FHLB advances, are long-term certificates of deposit, lines of credit, borrowings that are secured by bank premises or stock of United’s subsidiaries and issuances of trust preferred securities. In the normal course of business, United through its Asset Liability Committee evaluates these as well as other alternative funding strategies that may be utilized to meet short-term and long-term funding needs. See Notes K and L, Notes to Consolidated Financial Statements.
During the year of 2023, United increased its interest-bearing deposit balance at the FRB by $438.02 million to $1.24 billion. The change in the balance at the FRB was mostly the result of net sales, maturities, and paydowns in the available for sale debt securities portfolio of $952.01 million and an increase in deposits of $516.15 million partially offset by loan growth of $800.97 million and the net repayment of $400.29 million in FHLB advances.
Cash flows provided by operations in 2023 were $435.24 million due mainly to net income of $366.31 million for the year of 2023. In 2022, cash flows provided by operations were $760.82 million due mainly to net income of $379.63 million for the year of 2022. In 2023, net cash of $38.99 million was provided by investing activities which was primarily due to proceeds of $819.87 million from sales, calls and maturities of investment securities over purchases partially offset by loan growth of $800.97 million. In 2022, net cash of $3.45 billion was used in investing activities which was primarily due to loan growth of $2.37 billion and purchases of $1.09 billion of investment securities over proceeds from sales, calls and maturities of investment securities. During the year of 2023, net cash of $51.94 million was used in financing activities due primarily to net repayments of $400.00 million from long-term FHLB borrowings partially offset by an increase of $517.27 million in deposits. Other uses of cash within funding activities for the year of 2023 were $194.73 million for cash dividends paid. During the year of 2022, net cash of $105.32 million was provided by financing activities due primarily to net advances of $1.38 billion from long-term FHLB borrowings partially offset by a decline of $1.04 billion in deposits. Other uses of cash within funding activities for the year of 2022 were $193.04 million for cash dividends paid and $79.46 million for the acquisition of treasury stock. The net effect of the cash flow activities was an increase in cash and cash equivalents of $422.29 million for the year of 2023 as compared to a decrease in cash and cash equivalents of $2.58 billion for the year of 2022. See the Consolidated Statement of Cash Flows in the Consolidated Financial Statements.
59
At December 31, 2023, United had an unused borrowing amount at the FHLB of approximately $6.74 billion subject to delivery of collateral after certain trigger points and $2.67 billion without the delivery of additional collateral. United has various unused lines of credit available from certain of its correspondent banks in the aggregate amount of $230 million, all of which was available at December 31, 2023. United also has a $20 million unsecured, revolving line of credit with an unrelated financial institution to provide for general liquidity needs, all of which were available at December 31, 2023. At December 31, 2023, United’s borrowing capacity for the FRB Discount Window was $2.67 billion. United did not have any borrowings from the FRB’s Discount Window, or its Bank Term Funding Program, during the year of 2023.
United enters into derivative contracts, mainly to protect against adverse interest rate movements on the value of certain assets or liabilities, under which it is required to either pay cash to or receive cash from counterparties depending on changes in interest rates. Derivative contracts are carried at fair value and not notional value on the consolidated balance sheet and therefore do not represent the amounts that may ultimately be paid under these contracts. Further discussion of derivative instruments is included in Note R, Notes to Consolidated Financial Statements.
United is also a party to financial instruments with off-balance-sheet risk in the normal course of business to meet the financing needs of its customers. These financial instruments include loan commitments and standby letters of credit. United’s maximum exposure to credit loss in the event of nonperformance by the counterparty to the financial instrument for the loan commitments and standby letters of credit is the contractual or notional amount of those instruments. United uses the same policies in making commitments and conditional obligations as it does for on-balance sheet instruments. Since many of the commitments are expected to expire without being drawn upon, the total commitment amounts do not necessarily represent future cash requirements.
The following table details the amounts of significant commitments and letters of credit as of December 31, 2023:
| (In thousands) | Amount | |||
| Commitments to extend credit: |
||||
| Revolving open-end secured by 1-4 residential |
$ | 841,754 | ||
| Credit card and personal revolving lines |
247,616 | |||
| Commercial |
5,762,520 | |||
|
|
|
|||
| Total unused commitments |
$ | 6,851,890 | ||
|
|
|
|||
| Financial standby letters of credit |
$ | 72,631 | ||
| Performance standby letters of credit |
75,074 | |||
| Commercial letters of credit |
16,233 | |||
|
|
|
|||
| Total letters of credit |
$ | 163,938 | ||
|
|
|
|||
Commitments generally have fixed expiration dates or other termination clauses, generally within one year, and may require the payment of a fee. Further discussion of commitments is included in Note Q, Notes to Consolidated Financial Statements.
United anticipates it can meet its obligations over the next 12 months and has no material commitments for capital expenditures. There are no known trends, demands, commitments, or events that will result in or that are reasonably likely to result in United’s liquidity increasing or decreasing in any material way. United also has lines of credit available. See Notes K and L to the accompanying unaudited Notes to Consolidated Financial Statements for more details regarding the amounts available to United under lines of credit.
The Asset Liability Committee monitors liquidity to ascertain that a liquidity position within certain prescribed parameters is maintained. No changes are anticipated in the policies of United’s Asset Liability Committee.
United’s capital position is financially sound. United seeks to maintain a proper relationship between capital and total assets to support growth and sustain earnings. United has historically generated attractive returns on shareholders’ equity. United is well-capitalized based upon regulatory guidelines. United’s risk-based capital ratio is 15.38% at December 31, 2023 while its Common Equity Tier 1 capital, Tier 1 capital and leverage ratios are 13.14%, 13.14% and 11.39%, respectively. The December 31, 2023 ratios reflects United’s election of a five-year transition provision, allowed by the Federal Reserve Board and other federal banking agencies in response to the COVID-19 pandemic, to delay for two years the full impact of CECL on regulatory capital, followed by a three-year transition period. The regulatory requirements for a well-capitalized financial institution are a risk-based capital ratio of 10.0%, a Common Equity Tier 1 capital ratio of 6.5%, a Tier 1 capital ratio of 8.0% and a leverage ratio of 5.0%.
60
Total shareholders’ equity was $4.77 billion at December 31, 2023, which was an increase of $255.05 million or 5.65% from December 31, 2022. This increase is primarily due to increases of $170.19 million in net earnings and $73.05 million in accumulated other comprehensive income due mainly to an after-tax increase in the fair value of available for sale securities.
United’s equity to assets ratio was 15.94% at December 31, 2023 as compared to 15.31% at December 31, 2022. The primary capital ratio, capital and reserves to total assets and reserves, was 16.79% at December 31, 2023 as compared to 16.11% at December 31, 2022. United’s average equity to average asset ratio was 15.89% at December 31, 2023 as compared to 15.83% at December 31, 2022. All of these financial measurements reflect a financially sound position.
During the fourth quarter of 2023, United’s Board of Directors declared a cash dividend of $0.37 per share. Dividends per share of $1.45 for the year of 2023 represented an increase over the $1.44 per share paid for 2022. Total cash dividends declared to common shareholders were $196.12 million for the year of 2023 as compared to $194.98 million for the year of 2022. The year 2023 was the fiftieth consecutive year of dividend increases to United shareholders.
| Item 7A. | QUANTITATIVE AND QUALITATIVE DISCLOSURES ABOUT MARKET RISK |
The objective of United’s Asset/Liability Management function is to maintain consistent growth in net interest income within United’s policy guidelines. This objective is accomplished through the management of balance sheet liquidity and interest rate risk exposures due to changes in economic conditions, interest rate levels and customer preferences.
Interest Rate Risk
Management considers interest rate risk to be United’s most significant market risk. Interest rate risk is the exposure to adverse changes in United’s net interest income as a result of changes in interest rates. United’s earnings are largely dependent on the effective management of interest rate risk.
Management of interest rate risk focuses on maintaining consistent growth in net interest income within Board-approved policy limits. United’s Asset/Liability Management Committee (“ALCO”), which includes senior management representatives and reports to the Board of Directors, monitors and manages interest rate risk to maintain an acceptable level of change to net interest income as a result of changes in interest rates. Policy established for interest rate risk is stated in terms of the change in net interest income over a one-year and two-year horizon given an immediate and sustained increase or decrease in interest rates. The current limits approved by the Board of Directors are structured on a staged basis with each stage requiring specific actions.
United employs a variety of measurement techniques to identify and manage its exposure to changing interest rates. One such technique utilizes an earnings simulation model to analyze the sensitivity of net interest income to movements in interest rates. The model is based on actual cash flows and repricing characteristics for on and off-balance sheet instruments and incorporates market-based assumptions regarding the impact of changing interest rates on the prepayment rate of certain assets and liabilities. The model also includes executive management projections for activity levels in product lines offered by United. Assumptions based on the historical behavior of deposit rates and balances in relation to changes in interest rates are also incorporated into the model. Rate scenarios could involve parallel or nonparallel shifts in the yield curve, depending on historical, current, and expected conditions, as well as the need to capture any material effects of explicit or embedded options. These assumptions are inherently uncertain and, as a result, the model cannot precisely measure net interest income or precisely predict the impact of fluctuations in interest rates on net interest income. Actual results will differ from simulated results due to timing, magnitude and frequency of interest rate changes as well as changes in market conditions and management’s strategies.
61
Interest sensitive assets and liabilities are defined as those assets or liabilities that mature or are repriced within a designated time frame. The principal function of managing interest rate risk is to maintain an appropriate relationship between those assets and liabilities that are sensitive to changing market interest rates. The difference between rate sensitive assets and rate sensitive liabilities for specified periods of time is known as the “GAP.” Earnings-simulation analysis captures not only the potential of these interest sensitive assets and liabilities to mature or reprice, but also the probability that they will do so. Moreover, earnings-simulation analysis considers the relative sensitivities of these balance sheet items and projects their behavior over an extended period of time. United closely monitors the sensitivity of its assets and liabilities on an on-going basis and projects the effect of various interest rate changes on its net interest margin.
The following table shows United’s estimated earnings sensitivity profile as of December 31, 2023 and December 31, 2022:
| Change in Interest Rates |
Percentage Change in Net Interest Income | |||||
| (basis points) |
December 31, 2023 |
December 31, 2022 | ||||
| +200 |
(0.28%) | (6.83%) | ||||
| +100 |
0.24% | (3.00%) | ||||
| -100 |
2.66% | 2.12% | ||||
| -200 |
4.35% | 2.16% | ||||
At December 31, 2023, given an immediate, sustained 100 basis point upward shock to the yield curve used in the simulation model, net interest income for United is estimated to increase by 0.24% over one year as compared to a decrease by 3.00% at December 31, 2022. A 200 basis point immediate, sustained upward shock in the yield curve would decrease net interest income by an estimated 0.28% over one year as of December 31, 2023, as compared to a decrease of 6.83% as of December 31, 2022. A 100 basis point immediate, sustained downward shock in the yield curve would increase net interest income by an estimated 2.66% over one year as of December 31, 2023 as compared to an increase of 2.12%, over one year as of December 31, 2022. A 200 basis point immediate, sustained downward shock in the yield curve would increase net interest income by an estimated 4.35% over one year as of December 31, 2023 as compared to an increase of 2.16% over one year as of December 31, 2022.
In addition to the one year earnings sensitivity analysis, a two-year analysis is also performed. Compared to the one year analysis, United is projected to show improved performance in year two within the upward rate shock scenarios. Given an immediate, sustained 100 basis point upward shock to the yield curve used in the simulation model, net interest income for United is estimated to increase by 2.47% in year two as of December 31, 2023. A 200 basis point immediate, sustained upward shock in the yield curve would increase net interest income by an estimated 3.85% in year two as of December 31, 2023. A 100 basis point immediate, sustained downward shock in the yield curve would increase net interest income by an estimated 0.05% in year two as of December 31, 2023. A 200 basis point immediate, sustained downward shock in the yield curve would decrease net interest income by an estimated 1.34% in year two as of December 31, 2023.
While it is unlikely market rates would immediately move 100 or 200 basis points upward or downward on a sustained basis, this is another tool used by management and the Board of Directors to gauge interest rate risk. All of these estimated changes in net interest income are and were within the policy guidelines established by the Board of Directors.
To further aid in interest rate management, United’s subsidiary bank is a member of the Federal Home Loan Bank (“FHLB”). The use of FHLB advances provides United with a low risk means of matching maturities of earning assets and interest-bearing funds to achieve a desired interest rate spread over the life of the earning assets. In addition, United uses credit with large regional banks and trust preferred securities to provide funding.
As part of its interest rate risk management strategy, United may use derivative instruments to protect against adverse price or interest rate movements on the value of certain assets or liabilities and on future cash flows. These derivatives commonly consist of interest rate swaps, caps, floors, collars, futures, forward contracts, written and purchased options. Interest rate swaps obligate two parties to exchange one or more payments generally calculated with reference to a fixed or variable rate of interest applied to the notional amount. United accounts for its derivative activities in accordance with the provisions of ASC Topic 815, “Derivatives and Hedging.”
62
Extension Risk
A key feature of most mortgage loans is the ability of the borrower to repay principal earlier than scheduled. This is called a prepayment. Prepayments arise primarily due to sale of the underlying property, refinancing, or foreclosure. In general, declining interest rates tend to increase prepayments, and rising interest rates tend to slow prepayments. Like other fixed-income securities, when interest rates rise, the value of mortgage- related securities generally declines. The rate of prepayments on underlying mortgages will affect the price and volatility of mortgage-related securities and may shorten or extend the effective maturity of the security beyond what was anticipated at the time of purchase. If interest rates rise, United’s holdings of mortgage-related securities may experience reduced returns if the borrowers of the underlying mortgages pay off their mortgages later than anticipated. This is generally referred to as extension risk.
At December 31, 2023, United’s mortgage related securities portfolio had an amortized cost of $1.8 billion, of which approximately $786.5 million or 43% were fixed rate collateralized mortgage obligations (CMOs). These fixed rate CMOs consisted primarily of planned amortization class (PACs), sequential-pay and accretion directed (VADMs) bonds having an average life of approximately 5.5 years and a weighted average yield of 2.10%, under current projected prepayment assumptions. These securities are expected to have moderate extension risk in a rising rate environment. Current models show that given an immediate, sustained upward shock of 300 basis points, the average life of these securities would only extend to 6.5 years. The projected price decline of the fixed rate CMO portfolio in rates up 300 basis points would be 15.6%, or less than the price decline of a 7- year treasury note. By comparison, the price decline of a 30-year 5.5% current coupon mortgage backed security (MBS) in rates higher by 300 basis points would be approximately 12.2%.
United had approximately $490.8 million in fixed rate Commercial mortgage backed Securities (CMBS) with a projected yield of 2.01% and a projected average life of 4.8 years on December 31, 2023. This portfolio consisted primarily of Freddie Mac Multifamily K securities and Fannie Mae Delegated Underwriting and Servicing (DUS) securities with a weighted average maturity (WAM) of 8.4 years.
United had approximately $23.8 million in 15-year mortgage backed securities with a projected yield of 1.99% and a projected average life of 4.5 years as of December 31, 2023. This portfolio consisted of seasoned 15-year mortgage paper with a weighted average loan age (WALA) of 4 years and a weighted average maturity (WAM) of 11.3 years.
United had approximately $325.4 million in 20-year mortgage backed securities with a projected yield of 1.82% and a projected average life of 6.6 years on December 31, 2023. This portfolio consisted of seasoned 20-year mortgage paper with a weighted average loan age (WALA) of 2.8 years and a weighted average maturity (WAM) of 17 years.
United had approximately $154.7 million in 30-year mortgage backed securities with a projected yield of 2.62% and a projected average life of 7.6 years on December 31, 2023. This portfolio consisted of seasoned 30-year mortgage paper with a weighted average loan age (WALA) of 4.3 years and a weighted average maturity (WAM) of 23.8 years.
The remaining 3% of the mortgage related securities portfolio on December 31, 2023, included floating rate CMO, CMBS and mortgage backed securities.
63
MANAGEMENT’S REPORT ON INTERNAL CONTROL OVER FINANCIAL REPORTING
Management of United Bankshares, Inc. (the “Company”) is responsible for establishing and maintaining effective internal control over financial reporting as defined in Rules 13a-15(f) under the Securities Exchange Act of 1934. The Company’s internal control over financial reporting is designed to provide reasonable assurance to the Company’s management and board of directors regarding the preparation and fair presentation of published financial statements.
Because of its inherent limitations, internal control over financial reporting may not prevent or detect misstatements. Therefore, even those systems determined to be effective can provide only reasonable assurance with respect to financial statement preparation and presentation.
Management assessed the effectiveness of the Company’s internal control over financial reporting as of December 31, 2023. In making this assessment, management used the criteria set forth by the Committee of Sponsoring Organizations of the Treadway Commission (COSO) in Internal Control – Integrated Framework (2013 framework). Based on our assessment, we believe that, as of December 31, 2023, the Company’s internal control over financial reporting is effective based on those criteria.
Ernst & Young LLP (“Ernst & Young”), the independent registered public accounting firm who audited the Company’s consolidated financial statements, has also issued an attestation report on the effectiveness of the Company’s internal control over financial reporting as of December 31, 2023. Ernst & Young’s report on the effectiveness of the Company’s internal control over financial reporting appears on the following page.
| /s/ Richard M. Adams, Jr. |
/s/ W. Mark Tatterson | |||
| Richard M. Adams, Jr. Chief Executive Officer |
W. Mark Tatterson Executive Vice President and Chief Financial Officer |
February 29, 2024
64
Report of Independent Registered Public Accounting Firm
To the Shareholders and the Board of Directors of United Bankshares, Inc.
Opinion on Internal Control over Financial Reporting
We have audited United Bankshares, Inc. and subsidiaries’ internal control over financial reporting as of December 31, 2023, based on criteria established in Internal Control—Integrated Framework issued by the Committee of Sponsoring Organizations of the Treadway Commission (2013 framework) (the COSO criteria). In our opinion, United Bankshares, Inc. and subsidiaries (the Company) maintained, in all material respects, effective internal control over financial reporting as of December 31, 2023, based on the COSO criteria.
We also have audited, in accordance with the standards of the Public Company Accounting Oversight Board (United States) (PCAOB), the consolidated balance sheets of the Company as of December 31, 2023 and 2022, and the related consolidated statements of income, comprehensive income, changes in shareholders’ equity and cash flows for each of the three years in the period ended December 31, 2023, and the related notes and our report dated February 29, 2024 expressed an unqualified opinion thereon.
Basis for Opinion
The Company’s management is responsible for maintaining effective internal control over financial reporting and for its assessment of the effectiveness of internal control over financial reporting included in the accompanying Management’s Report on Internal Control Over Financial Reporting. Our responsibility is to express an opinion on the Company’s internal control over financial reporting based on our audit. We are a public accounting firm registered with the PCAOB and are required to be independent with respect to the Company in accordance with the U.S. federal securities laws and the applicable rules and regulations of the Securities and Exchange Commission and the PCAOB.
We conducted our audit in accordance with the standards of the PCAOB. Those standards require that we plan and perform the audit to obtain reasonable assurance about whether effective internal control over financial reporting was maintained in all material respects.
Our audit included obtaining an understanding of internal control over financial reporting, assessing the risk that a material weakness exists, testing and evaluating the design and operating effectiveness of internal control based on the assessed risk, and performing such other procedures as we considered necessary in the circumstances. We believe that our audit provides a reasonable basis for our opinion.
Definition and Limitations of Internal Control over Financial Reporting
A company’s internal control over financial reporting is a process designed to provide reasonable assurance regarding the reliability of financial reporting and the preparation of financial statements for external purposes in accordance with generally accepted accounting principles. A company’s internal control over financial reporting includes those policies and procedures that (1) pertain to the maintenance of records that, in reasonable detail, accurately and fairly reflect the transactions and dispositions of the assets of the company; (2) provide reasonable assurance that transactions are recorded as necessary to permit preparation of financial statements in accordance with generally accepted accounting principles, and that receipts and expenditures of the company are being made only in accordance with authorizations of management and directors of the company; and (3) provide reasonable assurance regarding prevention or timely detection of unauthorized acquisition, use, or disposition of the company’s assets that could have a material effect on the financial statements.
Because of its inherent limitations, internal control over financial reporting may not prevent or detect misstatements. Also, projections of any evaluation of effectiveness to future periods are subject to the risk that controls may become inadequate because of changes in conditions, or that the degree of compliance with the policies or procedures may deteriorate.
| /s/ Ernst & Young LLP |
| Charleston, West Virginia February 29, 2024 |
65
| Item 8. | FINANCIAL STATEMENTS AND SUPPLEMENTARY DATA |
Report of Independent Registered Public Accounting Firm
To the Shareholders and the Board of Directors of United Bankshares, Inc.
Opinion on the Financial Statements
We have audited the accompanying consolidated balance sheets of United Bankshares, Inc. and subsidiaries (the Company) as of December 31, 2023 and 2022, and the related consolidated statements of income, comprehensive income, changes in shareholders’ equity and cash flows for each of the three years in the period ended December 31, 2023, and the related notes (collectively referred to as the “consolidated financial statements”). In our opinion, the consolidated financial statements present fairly, in all material respects, the financial position of the Company at December 31, 2023 and 2022, and the results of its operations and its cash flows for each of the three years in the period ended December 31, 2023, in conformity with U.S. generally accepted accounting principles.
We also have audited, in accordance with the standards of the Public Company Accounting Oversight Board (United States) (PCAOB), the Company’s internal control over financial reporting as of December 31, 2023, based on criteria established in Internal Control-Integrated Framework issued by the Committee of Sponsoring Organizations of the Treadway Commission (2013 framework), and our report dated February 29, 2024 expressed an unqualified opinion thereon.
Basis for Opinion
These financial statements are the responsibility of the Company’s management. Our responsibility is to express an opinion on the Company’s financial statements based on our audits. We are a public accounting firm registered with the PCAOB and are required to be independent with respect to the Company in accordance with the U.S. federal securities laws and the applicable rules and regulations of the Securities and Exchange Commission and the PCAOB.
We conducted our audits in accordance with the standards of the PCAOB. Those standards require that we plan and perform the audit to obtain reasonable assurance about whether the financial statements are free of material misstatement, whether due to error or fraud. Our audits included performing procedures to assess the risks of material misstatement of the financial statements, whether due to error or fraud, and performing procedures that respond to those risks. Such procedures included examining, on a test basis, evidence regarding the amounts and disclosures in the financial statements. Our audits also included evaluating the accounting principles used and significant estimates made by management, as well as evaluating the overall presentation of the financial statements. We believe that our audits provide a reasonable basis for our opinion.
Critical Audit Matter
The critical audit matter communicated below is a matter arising from the current period audit of the financial statements that was communicated or required to be communicated to the audit committee and that: (1) relates to accounts or disclosures that are material to the financial statements and (2) involved our especially challenging, subjective, or complex judgments. The communication of the critical audit matter does not alter in any way our opinion on the financial statements, taken as a whole, and we are not, by communicating the critical audit matter below, providing a separate opinion on the critical audit matter or on the accounts or disclosures to which it relates.
66
Allowance for Loan Losses
| Description of the Matter |
The Company’s loan portfolio totaled $21.4 billion as of December 31, 2023, and the associated allowance for loan losses (ALL) for the loan portfolio was $259 million. As discussed in Notes A and E to the consolidated financial statements, the ALL is an estimate of the expected credit losses on loans at amortized cost to present the net amount expected to be collected as of the balance sheet date. The ALL is based on the credit losses expected to arise over the life of the asset. Management pools its loans based on similar risk characteristics and assigns an appropriate calculation method to estimate the expected credit losses. For loans that do not share risk characteristics, management evaluates the ALL on an individual basis based on the present value of expected future cash flows using the loan’s effective interest rate, or as a practical expedient, the fair value of the collateral if the loan is collateral-dependent. For loans not specifically reviewed on an individual basis, management measures the ALL using a probability of default/loss given default method or cohort method based on portfolio segment. Management also records qualitative adjustments to expected credit losses for differences in current loan-specific risk characteristics such as differences in underwriting standards, portfolio mix, delinquency level or term as well as reasonable and supportable forecast adjustments for changes in macroeconomic and environmental conditions, such as changes in unemployment rates, gross domestic product or other relevant factors, that have not been fully captured in the allowance calculation. | |
| Auditing management’s estimate used in determining the ALL for the loan portfolio involved a high degree of subjectivity in evaluating management’s determination of the forecast selection used to derive the reasonable and supportable forecast qualitative adjustment. | ||
| How We Addressed the Matter in Our Audit |
We obtained an understanding, evaluated the design and tested the operating effectiveness of controls over the Company’s ALL process for the loan portfolio. Controls tested included, among others, those over the risk rating process, management’s review and approval of the calculations used to determine the ALL, including the underlying data and data inputs and outputs of those calculations, and management’s evaluation and review of the qualitative adjustments, including the reasonable and supportable forecast qualitative adjustment. | |
| To test the Company’s reasonable and supportable forecast qualitative adjustment for the loan portfolio, we tested the underlying data used in the estimate calculation to determine it was accurate, complete and relevant. Further, we evaluated management’s basis for the adjustment in relation to changes in economic conditions and forecasts. Our procedures included evaluating management’s inputs and assumptions used in determining the qualitative adjustment by comparing the information to internal and external source data including, among others, the economic forecasts utilized by the Company and third-party economic outlook reports. We involved our internal modeling specialists in evaluating the model performance. In addition, we evaluated the overall ALL amount, inclusive of the qualitative adjustments, and whether the amount appropriately reflects losses expected in the loan portfolios as of the consolidated balance sheet date. For example, we evaluated the Company’s analysis of their historical loss experience and peer losses to the Company’s recorded ALL to test the ALL in totality. We also reviewed subsequent events and transactions and considered whether they corroborate or contradict the Company’s conclusion. | ||
| /s/ Ernst & Young LLP |
| We have served as the Company’s auditor since 1986. |
| Charleston, West Virginia |
| February 29, 2024 |
67
December 31 |
December 31 | |||||||
2023 |
2022 | |||||||
Assets |
||||||||
Cash and due from banks |
$ | $ | ||||||
Interest-bearing deposits with other banks |
||||||||
Federal funds sold |
||||||||
Total cash and cash equivalents |
||||||||
Securities available for sale at estimated fair value (amortized cost-$ |
||||||||
Securities held to maturity, net of allowance for credit losses of $ |
||||||||
Equity securities at estimated fair value |
||||||||
Other investment securities |
||||||||
Loans held for sale measured using fair value option |
||||||||
Loans and leases |
||||||||
Less: Unearned income |
( |
) | ( |
) | ||||
Loans and leases, net of unearned income |
||||||||
Less: Allowance for loan and lease losses |
( |
) | ( |
) | ||||
Net loans and leases |
||||||||
Bank premises and equipment |
||||||||
Operating lease right-of-use |
||||||||
Goodwill |
||||||||
Mortgage servicing rights |
||||||||
Bank-owned life insurance (“BOLI”) |
||||||||
Accrued interest receivable |
||||||||
Other assets |
||||||||
TOTAL ASSETS |
$ | $ | ||||||
Liabilities |
||||||||
Deposits: |
||||||||
Noninterest-bearing |
$ | $ | ||||||
Interest-bearing |
||||||||
Total deposits |
||||||||
Borrowings: |
||||||||
Securities sold under agreements to repurchase |
||||||||
Federal Home Loan Bank (“FHLB”) borrowings |
||||||||
Other long-term borrowings |
||||||||
Reserve for lending-related commitments |
||||||||
Operating lease liabilities |
||||||||
Accrued expenses and other liabilities |
||||||||
TOTAL LIABILITIES |
||||||||
Shareholders’ Equity |
||||||||
Preferred stock, $ Authorized- shares, |
||||||||
Common stock, $ Authorized- shares; issued- and |
||||||||
Surplus |
||||||||
Retained earnings |
||||||||
Accumulated other comprehensive loss |
( |
) | ( |
) | ||||
Treasury stock, at cost |
( |
) | ( |
) | ||||
TOTAL SHAREHOLDERS’ EQUITY |
||||||||
TOTAL LIABILITIES AND SHAREHOLDERS’ EQUITY |
$ | $ | ||||||
Year Ended December 31 | ||||||||||||
2023 |
2022 |
2021 | ||||||||||
Interest income |
||||||||||||
Interest and fees on loans and leases |
$ | |
$ | |
$ | |
||||||
Interest on federal funds sold and other short-term investments |
||||||||||||
Interest and dividends on securities: |
||||||||||||
Taxable |
||||||||||||
Tax-exempt |
||||||||||||
Total interest income |
||||||||||||
Interest expense |
||||||||||||
Interest on deposits |
||||||||||||
Interest on short-term borrowings |
||||||||||||
Interest on long-term borrowings |
||||||||||||
Total interest expense |
||||||||||||
Net interest income |
||||||||||||
Provision for credit losses |
( |
) | ||||||||||
Net interest income after provision for credit losses |
||||||||||||
Other income |
||||||||||||
Fees from trust services |
||||||||||||
Fees from brokerage services |
||||||||||||
Fees from deposit services |
||||||||||||
Bankcard fees and merchant discounts |
||||||||||||
Other service charges, commissions, and fees |
||||||||||||
Income from bank-owned life insurance |
||||||||||||
Income from mortgage banking activities |
||||||||||||
Mortgage loan servicing income |
||||||||||||
Net investment securities (losses) gains |
( |
) | ||||||||||
Other income |
||||||||||||
Total other income |
||||||||||||
Other expense |
||||||||||||
Employee compensation |
||||||||||||
Employee benefits |
||||||||||||
Net occupancy expense |
||||||||||||
Other real estate owned (“OREO”) expense |
||||||||||||
Net (gains) losses on the sales of OREO properties |
( |
) | ||||||||||
Equipment expense |
||||||||||||
Data processing expense |
||||||||||||
Mortgage loan servicing expense and impairment |
||||||||||||
Bankcard processing expense |
||||||||||||
FDIC insurance expense |
||||||||||||
FHLB prepayment penalties |
||||||||||||
Other expense |
||||||||||||
Total other expense |
||||||||||||
Income before income taxes |
||||||||||||
Income taxes |
||||||||||||
Net income |
$ | $ | $ | |||||||||
Year Ended December 31 | ||||||||||||
2023 |
2022 |
2021 | ||||||||||
| Earnings per common share: |
||||||||||||
| Basic |
$ | $ | $ | |||||||||
| |
|
|
|
|
|
|
|
| ||||
| Diluted |
$ | $ | $ | |||||||||
| |
|
|
|
|
|
|
|
| ||||
| Dividends per common share |
$ | $ | $ | |||||||||
| |
|
|
|
|
|
|
|
| ||||
| Average outstanding shares: |
||||||||||||
| Basic |
||||||||||||
| Diluted |
||||||||||||
Year Ended December 31 | ||||||||||||
2023 |
2022 |
2021 | ||||||||||
| Net income |
$ | |
$ | |
$ | |
||||||
| Change in net unrealized gain (loss) on available-for-sale |
( |
) | ( |
|||||||||
| Change in net unrealized (loss) gain on cash flow hedge, net of tax |
( |
) | ||||||||||
| Change in defined benefit pension plan, net of tax |
||||||||||||
| |
|
|
|
|
|
|
|
| ||||
| Comprehensive income, net of tax |
$ | $ | $ | |||||||||
| |
|
|
|
|
|
|
|
| ||||
Accumulated |
||||||||||||||||||||||||||||
Common Stock |
Other |
Total |
||||||||||||||||||||||||||
Par |
Retained |
Comprehensive |
Treasury |
Shareholders’ |
||||||||||||||||||||||||
Shares |
Value |
Surplus |
Earnings |
(Loss) Income |
Stock |
Equity |
||||||||||||||||||||||
Balance at January 1, 2021 |
$ | $ | $ | $ | $ | ( |
) | $ | ||||||||||||||||||||
Comprehensive income: |
||||||||||||||||||||||||||||
Net income |
||||||||||||||||||||||||||||
Other comprehensive loss, net of tax |
( |
) | ( |
) | ||||||||||||||||||||||||
Total comprehensive income, net of tax |
||||||||||||||||||||||||||||
Stock based compensation expense |
||||||||||||||||||||||||||||
Acquisition of Community Bankers Trust Corporation ( |
||||||||||||||||||||||||||||
Purchase of treasury stock ( |
( |
) | ( |
) | ||||||||||||||||||||||||
Cash dividends ($ |
( |
) | ( |
) | ||||||||||||||||||||||||
Stock grant forfeiture ( |
( |
) | ||||||||||||||||||||||||||
Net issuance of common stock under stock-based compensation plans ( |
||||||||||||||||||||||||||||
Balance at December 31, 2021 |
( |
) | ( |
) | ||||||||||||||||||||||||
Comprehensive income: |
||||||||||||||||||||||||||||
Net income |
||||||||||||||||||||||||||||
Other comprehensive loss, net of tax |
( |
) | ( |
) | ||||||||||||||||||||||||
Total comprehensive income, net of tax |
||||||||||||||||||||||||||||
Stock based compensation expense |
||||||||||||||||||||||||||||
Stock grant forfeiture ( |
( |
) | ||||||||||||||||||||||||||
Purchase of treasury stock ( |
( |
) | ( |
) | ||||||||||||||||||||||||
Cash dividends ($ |
( |
) | ( |
) | ||||||||||||||||||||||||
Net issuance of common stock under stock-based compensation plans ( |
||||||||||||||||||||||||||||
Balance at December 31, 2022 |
( |
) | ( |
) | ||||||||||||||||||||||||
Comprehensive income: |
||||||||||||||||||||||||||||
Net income |
||||||||||||||||||||||||||||
Other comprehensive income, net of tax |
||||||||||||||||||||||||||||
Total comprehensive income, net of tax |
||||||||||||||||||||||||||||
Stock based compensation expense |
||||||||||||||||||||||||||||
Stock grant forfeiture ( |
( |
) | ||||||||||||||||||||||||||
Purchase of treasury stock ( |
( |
) | ( |
) | ||||||||||||||||||||||||
Cash dividends ($ |
( |
) | ( |
) | ||||||||||||||||||||||||
Net issuance of common stock under stock-based compensation plans ( |
||||||||||||||||||||||||||||
Balance at December 31, 2023 |
$ | $ | $ | $ | ( |
) | $ | ( |
) | $ | ||||||||||||||||||
| (Dollars in thousands) |
Year Ended December 31 |
|||||||||||
2023 |
2022 |
2021 |
||||||||||
| OPERATING ACTIVITIES |
||||||||||||
| Net income |
$ | $ | $ | |||||||||
| Adjustments to reconcile net income to net cash provided by operating activities: |
||||||||||||
| Provision for credit losses |
( |
) | ||||||||||
| Amortization and accretion |
( |
) | ||||||||||
| Loss on sales of bank premises, OREO, leases and equipment |
||||||||||||
| Write-downs on bank premises, OREO, leases and equipment |
||||||||||||
| Depreciation |
||||||||||||
| Loss (gain) on securities |
( |
) | ( |
) | ||||||||
| Loans originated for sale |
( |
) | ( |
) | ( |
) | ||||||
| Proceeds from sales of loans |
||||||||||||
| Gain on sales of loans |
( |
) | ( |
) | ( |
) | ||||||
| Mortgage repurchase loan losses paid, net of recoveries |
( |
) | ( |
) | ( |
) | ||||||
| Stock-based compensation |
||||||||||||
| Excess tax benefits from stock-based compensation arrangements |
||||||||||||
| Deferred income tax (benefit) expense |
( |
) | ||||||||||
| Amortization of tax credit investments |
||||||||||||
| Originations of mortgage servicing rights |
( |
) | ( |
) | ( |
) | ||||||
| Impairment of mortgage servicing rights |
||||||||||||
| Recoveries of impairment on mortgage servicing rights |
( |
) | ( |
) | ||||||||
| Gain on sale of mortgage servicing rights |
( |
) | ||||||||||
| Increase in cash surrender value of bank-owned life insurance policies |
( |
) | ( |
) | ( |
) | ||||||
| Accretion (amortization) of net periodic pension costs |
( |
) | ||||||||||
| Changes in: |
||||||||||||
| Interest receivable |
( |
) | ( |
) | ||||||||
| Other assets |
( |
) | ||||||||||
| Accrued expenses and other liabilities |
( |
) | ||||||||||
| |
|
|
|
|
|
|||||||
| NET CASH PROVIDED BY OPERATING ACTIVITIES |
||||||||||||
| |
|
|
|
|
|
|||||||
| INVESTING ACTIVITIES |
||||||||||||
| Proceeds from maturities and calls of held to maturity securities |
||||||||||||
| Proceeds from sales of securities available for sale |
||||||||||||
| Proceeds from maturities and calls of securities available for sale |
||||||||||||
| Purchases of securities available for sale |
( |
) | ( |
) | ( |
) | ||||||
| Proceeds from sales of equity securities |
||||||||||||
| Purchases of equity securities |
( |
) | ( |
) | ( |
) | ||||||
| Proceeds from sales and redemptions of other investment securities |
||||||||||||
| Purchases of other investment securities |
( |
) | ( |
) | ( |
) | ||||||
| Purchases of bank-owned life insurance policies |
( |
) | ||||||||||
| Redemption of bank-owned life insurance policies |
||||||||||||
| Purchases of bank premises and equipment |
( |
) | ( |
) | ( |
) | ||||||
| Proceeds from sales of bank premises and equipment |
||||||||||||
| Proceeds from sales of mortgage servicing rights |
||||||||||||
| Acquisition of subsidiaries, net of cash paid |
||||||||||||
| Proceeds from sales of OREO properties |
||||||||||||
| Net change in loans and leases |
( |
) | ( |
) | ||||||||
| |
|
|
|
|
|
|||||||
| NET CASH PROVIDED BY (USED IN) INVESTING ACTIVITIES |
( |
) | ||||||||||
| |
|
|
|
|
|
|||||||
| FINANCING ACTIVITIES |
||||||||||||
| Cash dividends paid |
( |
) | ( |
) | ( |
) | ||||||
| Acquisition of treasury stock |
( |
) | ( |
) | ( |
) | ||||||
| Proceeds from exercise of stock options |
||||||||||||
| Repayment of long-term Federal Home Loan Bank borrowings |
( |
) | ( |
) | ( |
) | ||||||
| Proceeds from issuance of long-term Federal Home Loan Bank borrowings |
||||||||||||
| Redemption of subordinated debt |
( |
) | ||||||||||
| Changes in: |
||||||||||||
| Time deposits |
( |
) | ( |
) | ||||||||
| Other deposits |
( |
) | ( |
) | ||||||||
| Federal funds purchased, securities sold under agreements to repurchase and other short-term borrowings |
( |
) | ||||||||||
| |
|
|
|
|
|
|||||||
| NET CASH (USED IN) PROVIDED BY FINANCING ACTIVITIES |
( |
) | ||||||||||
| |
|
|
|
|
|
|||||||
| INCREASE (DECREASE) IN CASH AND CASH EQUIVALENTS |
( |
) | ||||||||||
| CASH AND CASH EQUIVALENTS AT BEGINNING OF YEAR |
||||||||||||
| |
|
|
|
|
|
|||||||
| CASH AND CASH EQUIVALENTS AT END OF YEAR |
$ | $ | $ | |||||||||
| |
|
|
|
|
|
|||||||
(Dollars in thousands) |
Year Ended December 31 |
|||||||||||
2023 |
2022 |
2021 |
||||||||||
Supplemental information |
||||||||||||
Cash paid for: |
||||||||||||
Interest on deposits and borrowed funds |
$ | $ | $ | |||||||||
Income taxes |
||||||||||||
Amounts in the measurement of lease liabilities |
||||||||||||
Noncash investing activities: |
||||||||||||
Transfers of loans held for sale to loans |
||||||||||||
Transfers of loans to OREO |
||||||||||||
Right-of-use |
||||||||||||
Acquisition of subsidiaries and purchase price adjustments: |
||||||||||||
Assets acquired, net of cash |
( |
) | ||||||||||
Liabilities assumed |
||||||||||||
Goodwill |
||||||||||||
· |
Financial assets that are delinquent as of the acquisition date |
· |
Financial assets that have been downgraded since origination |
· |
Financial assets that have been placed on nonaccrual status |
· |
Method: Probability of Default/Loss Given Default (PD/LGD) |
Ø |
Commercial Real Estate Owner-Occupied |
Ø |
Commercial Real Estate Nonowner-Occupied |
Ø |
Commercial Other |
· |
Method: Cohort |
Ø |
Residential Real Estate |
Ø |
Construction & Land Development |
Ø |
Consumer |
Ø |
Bankcard |
| • | Presenting accrued interest receivable balances separately from their underlying instruments within the consolidated statements of financial condition. |
| • | Excluding accrued interest receivable that is included in the amortized cost of financing receivables from related disclosure requirements. |
| • | Continuing our policy to write off accrued interest receivable by reversing interest income in cases where the Company does not reasonably expect to receive payment. |
| • |
Year Ended December 31 |
||||||||||||
(Dollars in thousands, except per share) |
2023 |
2022 |
2021 |
|||||||||
Distributed earnings allocated to common stock |
$ | $ | $ | |||||||||
Undistributed earnings allocated to common stock |
||||||||||||
Net earnings allocated to common shareholders |
$ | $ | $ | |||||||||
Average common shares outstanding |
||||||||||||
Dilutive effect of stock compensation |
||||||||||||
Average diluted shares outstanding |
||||||||||||
Earnings per basic common share |
$ | $ | $ | |||||||||
Earnings per diluted common share |
$ | $ | $ | |||||||||
Level 1 |
- |
Valuation is based on quoted prices in active markets for identical assets and liabilities. | ||
Level 2 |
- |
Valuation is based on observable inputs including quoted prices in active markets for similar assets and liabilities, quoted prices for identical or similar assets and liabilities in less active markets, and model-based valuation techniques for which significant assumptions can be derived primarily from or corroborated by observable data in the market. | ||
Level 3 |
- |
Valuation is based on model-based techniques that use one or more significant inputs or assumptions that are unobservable in the market. | ||
December 31, 2023 |
||||||||||||||||||||
Gross |
Gross |
Allowance |
Estimated |
|||||||||||||||||
(Dollars in thousands) |
Amortized |
Unrealized |
Unrealized |
For Credit |
Fair |
|||||||||||||||
Cost |
Gains |
Losses |
Losses |
Value |
||||||||||||||||
U.S. Treasury securities and obligations of U.S. Government corporations and agencies |
$ | $ | $ | $ | $ | |||||||||||||||
State and political subdivisions |
||||||||||||||||||||
Residential mortgage-backed securities |
||||||||||||||||||||
Agency |
||||||||||||||||||||
Non-agency |
||||||||||||||||||||
Commercial mortgage-backed securities |
||||||||||||||||||||
Agency |
||||||||||||||||||||
Asset-backed securities |
||||||||||||||||||||
Single issue trust preferred securities |
||||||||||||||||||||
Other corporate securities |
||||||||||||||||||||
Total |
$ | |
$ | |
$ | |
$ | |
$ | |
||||||||||
December 31, 2022 |
||||||||||||||||||||
Gross |
Gross |
Allowance |
Estimated |
|||||||||||||||||
(Dollars in thousands) |
Amortized |
Unrealized |
Unrealized |
For Credit |
Fair |
|||||||||||||||
Cost |
Gains |
Losses |
Losses |
Value |
||||||||||||||||
U.S. Treasury securities and obligations of U.S. Government corporations and agencies |
$ |
$ |
$ |
$ |
$ |
|||||||||||||||
State and political subdivisions |
||||||||||||||||||||
Residential mortgage-backed securities |
||||||||||||||||||||
Agency |
||||||||||||||||||||
Non-agency |
||||||||||||||||||||
Commercial mortgage-backed securities |
||||||||||||||||||||
Agency |
||||||||||||||||||||
Asset-backed securities |
||||||||||||||||||||
Single issue trust preferred securities |
||||||||||||||||||||
Other corporate securities |
||||||||||||||||||||
Total |
$ |
$ |
$ |
$ |
$ |
|||||||||||||||
Less than 12 months |
12 months or longer |
Total | ||||||||||||||||||||||
Fair |
Unrealized |
Fair |
Unrealized |
Fair |
Unrealized | |||||||||||||||||||
(Dollars in thousands) |
Value |
Losses |
Value |
Losses |
Value |
Losses | ||||||||||||||||||
December 31, 2023 |
||||||||||||||||||||||||
U.S. Treasury securities and obligations of U.S. Government corporations and agencies |
$ |
$ |
$ |
$ |
$ |
$ |
||||||||||||||||||
State and political subdivisions |
||||||||||||||||||||||||
Residential mortgage-backed securities |
||||||||||||||||||||||||
Agency |
||||||||||||||||||||||||
Non-agency |
||||||||||||||||||||||||
Commercial mortgage-backed securities |
||||||||||||||||||||||||
Agency |
||||||||||||||||||||||||
Asset-backed securities |
||||||||||||||||||||||||
Single issue trust preferred securities |
||||||||||||||||||||||||
Other corporate securities |
||||||||||||||||||||||||
Total |
$ |
$ |
$ |
$ |
$ |
$ |
||||||||||||||||||
Less than 12 months |
12 months or longer |
Total | ||||||||||||||||||||||
Fair |
Unrealized |
Fair |
Unrealized |
Fair |
Unrealized | |||||||||||||||||||
(Dollars in thousands) |
Value |
Losses |
Value |
Losses |
Value |
Losses | ||||||||||||||||||
December 31, 2022 |
||||||||||||||||||||||||
U.S. Treasury securities and obligations of U.S. Government corporations and agencies |
$ |
$ |
$ |
$ |
$ |
$ |
||||||||||||||||||
State and political subdivisions |
||||||||||||||||||||||||
Residential mortgage-backed securities |
||||||||||||||||||||||||
Agency |
||||||||||||||||||||||||
Non-agency |
||||||||||||||||||||||||
Commercial mortgage-backed securities |
||||||||||||||||||||||||
Agency |
||||||||||||||||||||||||
Asset-backed securities |
||||||||||||||||||||||||
Single issue trust preferred securities |
||||||||||||||||||||||||
Other corporate securities |
||||||||||||||||||||||||
Total |
$ |
$ |
$ |
$ |
$ |
$ |
||||||||||||||||||
Year Ended |
||||||||||||
(In thousands) |
2023 |
2022 |
2021 |
|||||||||
Proceeds from maturities, sales and calls |
$ | |
$ | |
$ | |||||||
Gross realized gains |
||||||||||||
Gross realized losses |
||||||||||||
(In thousands) |
Amortized Cost |
Estimated Fair Value |
||||||
Due in one year or less |
$ | $ | ||||||
Due after one year through five years |
||||||||
Due after five years through ten years |
||||||||
Due after ten years |
||||||||
Total |
$ | |
$ | |
||||
Year Ended |
||||||||
(In thousands) |
December 31, 2023 |
December 31, 2022 |
||||||
Net gains recognized during the period on equity securities sold |
$ | $ | ||||||
Unrealized gains recognized during the period on equity securities still held at period end |
||||||||
Unrealized losses recognized during the period on equity securities still held at period end |
( |
) | ( |
) | ||||
Net gains (losses) recognized during the period |
$ | $ | ( |
) | ||||
(In thousands) |
December 31, 2023 |
December 31, 2022 |
||||||
Commercial, financial and agricultural: |
||||||||
Owner-occupied commercial real estate |
$ | $ | ||||||
Nonowner-occupied commercial real estate |
||||||||
Other commercial |
||||||||
Total commercial, financial & agricultural |
||||||||
Residential real estate |
||||||||
Construction & land development |
||||||||
Consumer: |
||||||||
Bankcard |
||||||||
Other consumer |
||||||||
Less: Unearned income |
( |
) | ( |
) | ||||
Loans and leases, net of unearned income |
$ | $ | ||||||
Age Analysis of Past Due Loans and Leases As of December 31, 2023 |
||||||||||||||||||||||||
(In thousands) |
30-89 Days Past Due |
90 Days or more Past Due |
Total Past Due |
Current & Other |
Total Financing Receivables |
90 Days or More Past Due & Accruing |
||||||||||||||||||
Commercial real estate: |
||||||||||||||||||||||||
Owner-occupied |
$ | $ | $ | $ | $ | $ | ||||||||||||||||||
Nonowner-occupied |
||||||||||||||||||||||||
Other commercial |
||||||||||||||||||||||||
Residential real estate |
||||||||||||||||||||||||
Construction & land development |
||||||||||||||||||||||||
Consumer: |
||||||||||||||||||||||||
Bankcard |
||||||||||||||||||||||||
Other consumer |
||||||||||||||||||||||||
Total |
$ | |
$ | |
$ | |
$ | |
$ | |
$ | |
||||||||||||
Age Analysis of Past Due Loans and Leases As of December 31, 2022 |
||||||||||||||||||||||||
(In thousands) |
30-89 Days Past Due |
90 Days or more Past Due |
Total Past Due |
Current & Other |
Total Financing Receivables |
90 Days or More Past Due & Accruing |
||||||||||||||||||
Commercial real estate: |
||||||||||||||||||||||||
Owner-occupied |
$ | $ | $ | $ | $ | $ | ||||||||||||||||||
Nonowner-occupied |
||||||||||||||||||||||||
Other commercial |
||||||||||||||||||||||||
Residential real estate |
||||||||||||||||||||||||
Construction & land development |
||||||||||||||||||||||||
Consumer: |
||||||||||||||||||||||||
Bankcard |
||||||||||||||||||||||||
Other consumer |
||||||||||||||||||||||||
Total |
$ | |
$ | |
$ | |
$ | |
$ | |
$ | |
||||||||||||
At December 31, 2023 |
At December 31, 2022 |
|||||||||||||||
(In thousands) |
Nonaccruals |
With No Related Allowance for Credit Losses |
Nonaccruals |
With No Related Allowance for Credit Losses |
||||||||||||
Commercial Real Estate: |
||||||||||||||||
Owner-occupied |
$ | $ | $ | $ | ||||||||||||
Nonowner-occupied |
||||||||||||||||
Other Commercial |
||||||||||||||||
Residential Real Estate |
||||||||||||||||
Construction |
||||||||||||||||
Consumer: |
||||||||||||||||
Bankcard |
||||||||||||||||
Other consumer |
||||||||||||||||
Total |
$ | $ | $ | $ | ||||||||||||
Amortized Cost Basis of Loan Modifications Made to Borrowers Experiencing Financial Difficulty |
||||||||||||
For the Year Ended December 31, 2023 |
||||||||||||
(Dollars in thousands) |
Term Extension |
Interest Rate Reduction |
% of Total Class of Financing Receivable |
|||||||||
Commercial real estate: |
||||||||||||
Owner-occupied |
$ | $ | % | |||||||||
Nonowner-occupied |
% | |||||||||||
Other commercial |
% | |||||||||||
Residential real estate |
% | |||||||||||
Construction & land development |
% | |||||||||||
Consumer: |
||||||||||||
Bankcard |
% | |||||||||||
Other consumer |
% | |||||||||||
Total |
$ | |
$ | |
|
% | ||||||
Payment Status (Amortized Cost Basis) |
||||||||||||
As of December 31, 2023 |
||||||||||||
(In thousands) |
Current |
30-89 Days Past Due |
90+ Days Past Due |
|||||||||
Commercial real estate: |
||||||||||||
Owner-occupied |
$ | $ | $ | |||||||||
Nonowner-occupied |
||||||||||||
Other commercial |
||||||||||||
Residential real estate |
||||||||||||
Construction & land development |
||||||||||||
Consumer: |
||||||||||||
Bankcard |
||||||||||||
Other consumer |
||||||||||||
Total |
$ | |
$ | |
$ | |
||||||
For the Year Ended December 31, 2023 |
||||||||
Weighted- Average Interest Rate Reduction |
Weighted Average Term Extension (in years) |
|||||||
Commercial Real Estate: |
||||||||
Owner-occupied |
|
% | |
|||||
Nonowner-occupied |
% | |||||||
Other Commercial |
% | |||||||
Residential Real Estate |
% | |||||||
Construction & land development |
% | |||||||
Consumer: |
||||||||
Bankcard |
% | |||||||
Other consumer |
% | |||||||
Total |
|
% | |
|||||
Collateral Dependent Loans and Leases |
||||||||||||||||||||||||
At December 31, 2023 |
||||||||||||||||||||||||
(In thousands) |
Residential Property |
Business Assets |
Land |
Commercial Property |
Other |
Total |
||||||||||||||||||
Commercial real estate: |
||||||||||||||||||||||||
Owner-occupied |
$ | $ | $ | $ | $ | $ | ||||||||||||||||||
Nonowner-occupied |
||||||||||||||||||||||||
Other commercial |
||||||||||||||||||||||||
Residential real estate |
||||||||||||||||||||||||
Construction & land development |
||||||||||||||||||||||||
Consumer: |
||||||||||||||||||||||||
Bankcard |
||||||||||||||||||||||||
Other consumer |
||||||||||||||||||||||||
Total |
$ | |
$ | |
$ | |
$ | |
$ | |
$ | |
||||||||||||
Collateral Dependent Loans and Leases |
||||||||||||||||||||||||
At December 31, 2022 |
||||||||||||||||||||||||
(In thousands) |
Residential Property |
Business Assets |
Land |
Commercial Property |
Other |
Total |
||||||||||||||||||
Commercial real estate: |
||||||||||||||||||||||||
Owner-occupied |
$ | $ | $ | $ | $ | $ | ||||||||||||||||||
Nonowner-occupied |
||||||||||||||||||||||||
Other commercial |
||||||||||||||||||||||||
Residential real estate |
||||||||||||||||||||||||
Construction & land development |
||||||||||||||||||||||||
Consumer: |
||||||||||||||||||||||||
Bankcard |
||||||||||||||||||||||||
Other consumer |
||||||||||||||||||||||||
Total |
$ | |
$ | |
$ | |
$ | |
$ | |
$ | |
||||||||||||
· |
Pass |
· |
Special Mention |
· |
Substandard |
· |
Doubtful |
Commercial Real Estate – Owner-occupied |
||||||||||||||||||||||||||||||||||||
Revolving |
||||||||||||||||||||||||||||||||||||
(In thousands) |
Term Loans Origination Year |
Revolving loans amortized cost |
loans converted to |
|||||||||||||||||||||||||||||||||
As of December 31, 2023 |
2023 |
2022 |
2021 |
2020 |
2019 |
Prior |
basis |
term loans |
Total |
|||||||||||||||||||||||||||
Internal Risk Grade: |
||||||||||||||||||||||||||||||||||||
Pass |
$ | |
$ | $ | $ | $ | $ | $ | $ | $ | ||||||||||||||||||||||||||
Special Mention |
||||||||||||||||||||||||||||||||||||
Substandard |
||||||||||||||||||||||||||||||||||||
Doubtful |
||||||||||||||||||||||||||||||||||||
Total |
$ | $ | $ | $ | $ | $ | $ | $ | $ | |||||||||||||||||||||||||||
Commercial Real Estate – Owner-occupied |
||||||||||||||||||||||||||||||||||||
Revolving loans converted to term loans |
||||||||||||||||||||||||||||||||||||
(In thousands) |
Term Loans Origination Year |
Revolving loans amortized cost basis |
Total |
|||||||||||||||||||||||||||||||||
As of December 31, 2023 |
2023 |
2022 |
2021 |
2020 |
2019 |
Prior |
||||||||||||||||||||||||||||||
Current-period charge-offs |
( |
) | ( |
) | ||||||||||||||||||||||||||||||||
Current-period recoveries |
||||||||||||||||||||||||||||||||||||
Current-period net recoveries (charge-offs) |
$ | |
$ | |
$ | |
$ | |
$ | |
$ | ( |
$ | |
$ | |
$ | ( |
||||||||||||||||||
Revolving loans amortized cost basis |
Revolving loans and leases converted to term loans |
Total |
||||||||||||||||||||||||||||||||||
(In thousands) |
Term Loans Origination Year |
|||||||||||||||||||||||||||||||||||
As of December 31, 2022 |
2022 |
2021 |
2020 |
2019 |
2018 |
Prior |
||||||||||||||||||||||||||||||
Internal Risk Grade: |
||||||||||||||||||||||||||||||||||||
Pass |
$ | |
$ | |
$ | |
$ | $ | $ | |
$ | $ | $ | |||||||||||||||||||||||
Special Mention |
||||||||||||||||||||||||||||||||||||
Substandard |
||||||||||||||||||||||||||||||||||||
Doubtful |
||||||||||||||||||||||||||||||||||||
Total |
$ | $ | $ | $ | $ | $ | $ | |
$ | $ | ||||||||||||||||||||||||||
Current-period charge-offs |
( |
) | ( |
) | ||||||||||||||||||||||||||||||||
Current-period recoveries |
||||||||||||||||||||||||||||||||||||
Current-period net recoveries |
$ | $ | $ | $ | $ | $ | $ | $ | $ | |||||||||||||||||||||||||||
Commercial Real Estate – Nonowner-occupied |
||||||||||||||||||||||||||||||||||||
Revolving |
||||||||||||||||||||||||||||||||||||
(In thousands) |
Term Loans Origination Year |
Revolving loans amortized cost |
loans converted to |
|||||||||||||||||||||||||||||||||
As of December 31, 2023 |
2023 |
2022 |
2021 |
2020 |
2019 |
Prior |
basis |
term loans |
Total |
|||||||||||||||||||||||||||
Internal Risk Grade: |
||||||||||||||||||||||||||||||||||||
Pass |
$ | |
$ | $ | $ | $ | $ | $ | $ | $ | ||||||||||||||||||||||||||
Special Mention |
||||||||||||||||||||||||||||||||||||
Substandard |
||||||||||||||||||||||||||||||||||||
Doubtful |
||||||||||||||||||||||||||||||||||||
Total |
$ | $ | $ | $ | $ | $ | $ | |
$ | $ | ||||||||||||||||||||||||||
Current-period charge-offs |
( |
) | ( |
) | ||||||||||||||||||||||||||||||||
Current-period recoveries |
||||||||||||||||||||||||||||||||||||
Current-period net recoveries |
$ | $ | $ | $ | $ | $ | $ | $ | $ | |||||||||||||||||||||||||||
Revolving |
||||||||||||||||||||||||||||||||||||
(In thousands) |
Term Loans Origination Year |
Revolving loans amortized cost |
loans and leases converted to |
|||||||||||||||||||||||||||||||||
As of December 31, 2022 |
2022 |
2021 |
2020 |
2019 |
2018 |
Prior |
basis |
term loans |
Total |
|||||||||||||||||||||||||||
Internal Risk Grade: |
||||||||||||||||||||||||||||||||||||
Pass |
$ | |
$ | $ | $ | $ | $ | $ | $ | $ | ||||||||||||||||||||||||||
Special Mention |
||||||||||||||||||||||||||||||||||||
Substandard |
||||||||||||||||||||||||||||||||||||
Doubtful |
||||||||||||||||||||||||||||||||||||
Total |
$ | $ | $ | |
$ | $ | $ | $ | |
$ | $ | |||||||||||||||||||||||||
Current-period charge-offs |
||||||||||||||||||||||||||||||||||||
Current-period recoveries |
||||||||||||||||||||||||||||||||||||
Current-period net recoveries |
$ | $ | $ | $ | $ | $ | $ | $ | $ | |||||||||||||||||||||||||||
Other commercial |
||||||||||||||||||||||||||||||||||||
Revolving loans |
Revolving |
|||||||||||||||||||||||||||||||||||
Term Loans and leases Origination Year |
and leases |
loans and leases |
||||||||||||||||||||||||||||||||||
(In thousands) |
amortized cost |
converted to |
||||||||||||||||||||||||||||||||||
As of December 31, 2023 |
2023 |
2022 |
2021 |
2020 |
2019 |
Prior |
basis |
term loans |
Total |
|||||||||||||||||||||||||||
Internal Risk Grade: |
||||||||||||||||||||||||||||||||||||
Pass |
$ | |
$ | |
$ | |
$ | $ | $ | |
$ | $ | $ | |||||||||||||||||||||||
Special Mention |
||||||||||||||||||||||||||||||||||||
Substandard |
||||||||||||||||||||||||||||||||||||
Doubtful |
||||||||||||||||||||||||||||||||||||
Total |
$ | $ | $ | $ | $ | $ | $ | $ | |
$ | ||||||||||||||||||||||||||
Current-period charge-offs |
( |
) | ( |
) | ( |
) | ( |
) | ( |
) | ( |
) | ( |
) | ( |
) | ||||||||||||||||||||
Current-period recoveries |
||||||||||||||||||||||||||||||||||||
Current-period net (charge- offs) recoveries |
$ | ( |
) | $ | ( |
) | $ | ( |
) | $ | $ | ( |
) | $ | $ | ( |
) | $ | ( |
$ | ( |
) | ||||||||||||||
Revolving loans and leases |
||||||||||||||||||||||||||||||||||||
Term Loans and leases Origination Year |
Revolving loans and leases |
|||||||||||||||||||||||||||||||||||
(In thousands) |
amortized cost |
converted to |
||||||||||||||||||||||||||||||||||
As of December 31, 2022 |
2022 |
2021 |
2020 |
2019 |
2018 |
Prior |
basis |
term loans |
Total |
|||||||||||||||||||||||||||
Internal Risk Grade: |
||||||||||||||||||||||||||||||||||||
Pass |
$ | |
$ | $ | $ | $ | $ | $ | $ | $ | ||||||||||||||||||||||||||
Special Mention |
||||||||||||||||||||||||||||||||||||
Substandard |
||||||||||||||||||||||||||||||||||||
Doubtful |
||||||||||||||||||||||||||||||||||||
Total |
$ | $ | $ | $ | $ | $ | $ | $ | $ | |||||||||||||||||||||||||||
Current-period charge-offs |
( |
) | ( |
) | ( |
) | ( |
) | ( |
) | ( |
) | ||||||||||||||||||||||||
Current-period recoveries |
||||||||||||||||||||||||||||||||||||
Current-period net (charge- offs) recoveries |
$ | $ | ( |
) | $ | ( |
) | $ | ( |
) | $ | ( |
) | $ | $ | $ | $ | |||||||||||||||||||
Residential Real Estate |
||||||||||||||||||||||||||||||||||||
Revolving |
||||||||||||||||||||||||||||||||||||
Term Loans Origination Year |
Revolving loans |
loans |
||||||||||||||||||||||||||||||||||
(In thousands) |
amortized cost |
|||||||||||||||||||||||||||||||||||
As of December 31, 2023 |
2023 |
2022 |
2021 |
2020 |
2019 |
Prior |
basis |
term loans |
Total |
|||||||||||||||||||||||||||
Internal Risk Grade: |
||||||||||||||||||||||||||||||||||||
Pass |
$ | |
$ | $ | $ | $ | $ | $ | $ | $ | ||||||||||||||||||||||||||
Special Mention |
||||||||||||||||||||||||||||||||||||
Substandard |
||||||||||||||||||||||||||||||||||||
Doubtful |
||||||||||||||||||||||||||||||||||||
Total |
$ | $ | $ | $ | $ | $ | $ | $ | $ | |||||||||||||||||||||||||||
Current-period charge-offs |
( |
) | ( |
) | ||||||||||||||||||||||||||||||||
Current-period recoveries |
||||||||||||||||||||||||||||||||||||
Current-period net recoveries (charge-offs) |
$ | $ | $ | $ | $ | ( |
) | $ | $ | $ | $ | ( |
) | |||||||||||||||||||||||
Revolving |
||||||||||||||||||||||||||||||||||||
Term Loans Origination Year |
Revolving loans |
loans |
||||||||||||||||||||||||||||||||||
(In thousands) |
amortized cost |
|||||||||||||||||||||||||||||||||||
As of December 31, 2022 |
2022 |
2021 |
2020 |
2019 |
2018 |
Prior |
basis |
term loans |
Total |
|||||||||||||||||||||||||||
Internal Risk Grade: |
||||||||||||||||||||||||||||||||||||
Pass |
$ | |
$ | $ | $ | $ | $ | $ | $ | $ | ||||||||||||||||||||||||||
Special Mention |
||||||||||||||||||||||||||||||||||||
Substandard |
||||||||||||||||||||||||||||||||||||
Doubtful |
||||||||||||||||||||||||||||||||||||
Total |
$ | |
$ | $ | $ | $ | $ | $ | $ | $ | ||||||||||||||||||||||||||
Current-period charge-offs |
( |
) | ( |
) | ( |
) | ( |
) | ||||||||||||||||||||||||||||
Current-period recoveries |
||||||||||||||||||||||||||||||||||||
Current-period net (charge- offs) recoveries |
$ | |
$ | ( |
) | $ | $ | $ | ( |
) | $ | $ | $ | $ | ( |
) | ||||||||||||||||||||
Construction and Land Development |
||||||||||||||||||||||||||||||||||||
Revolving |
||||||||||||||||||||||||||||||||||||
Term Loans Origination Year |
Revolving loans |
loans |
||||||||||||||||||||||||||||||||||
(In thousands) |
amortized cost |
converted to |
||||||||||||||||||||||||||||||||||
As of December 31, 2023 |
2023 |
2022 |
2021 |
2020 |
2019 |
Prior |
basis |
term loans |
Total |
|||||||||||||||||||||||||||
Internal Risk Grade: |
||||||||||||||||||||||||||||||||||||
Pass |
$ | |
$ | $ | $ | $ | $ | $ | $ | $ | ||||||||||||||||||||||||||
Special Mention |
||||||||||||||||||||||||||||||||||||
Substandard |
||||||||||||||||||||||||||||||||||||
Doubtful |
||||||||||||||||||||||||||||||||||||
Total |
$ | $ | $ | $ | $ | $ | $ | $ | $ | |||||||||||||||||||||||||||
Current-period charge-offs |
( |
) | ( |
) | ||||||||||||||||||||||||||||||||
Current-period recoveries |
||||||||||||||||||||||||||||||||||||
Current-period net recoveries |
$ | $ | $ | $ | $ | $ | $ | $ | $ | |||||||||||||||||||||||||||
Revolving loans |
Revolving loans |
|||||||||||||||||||||||||||||||||||
Term Loans Origination Year |
||||||||||||||||||||||||||||||||||||
(In thousands) |
amortized cost |
converted to |
||||||||||||||||||||||||||||||||||
As of December 31, 2022 |
2022 |
2021 |
2020 |
2019 |
2018 |
Prior |
basis |
term loans |
Total |
|||||||||||||||||||||||||||
Internal Risk Grade: |
||||||||||||||||||||||||||||||||||||
Pass |
$ | |
$ | $ | $ | $ | $ | $ | $ | $ | ||||||||||||||||||||||||||
Special Mention |
||||||||||||||||||||||||||||||||||||
Substandard |
||||||||||||||||||||||||||||||||||||
Doubtful |
||||||||||||||||||||||||||||||||||||
Total |
$ | $ | $ | $ | $ | $ | $ | $ | $ | |||||||||||||||||||||||||||
Current-period charge-offs |
( |
) | ( |
) | ||||||||||||||||||||||||||||||||
Current-period recoveries |
||||||||||||||||||||||||||||||||||||
Current-period net recoveries |
$ | $ | $ | $ | $ | $ | $ | $ | $ | |||||||||||||||||||||||||||
Bankcard |
||||||||||||||||||||||||||||||||||||
Revolving |
||||||||||||||||||||||||||||||||||||
Term Loans Origination Year |
Revolving loans |
loans |
||||||||||||||||||||||||||||||||||
(In thousands) |
amortized cost |
converted to |
||||||||||||||||||||||||||||||||||
As of December 31, 2023 |
2023 |
2022 |
2021 |
2020 |
2019 |
Prior |
basis |
term loans |
Total |
|||||||||||||||||||||||||||
Internal Risk Grade: |
||||||||||||||||||||||||||||||||||||
Pass |
||||||||||||||||||||||||||||||||||||
Special Mention |
$ | |
$ | |
$ | |
$ | |
$ | |
$ | |
$ | $ | $ | |
||||||||||||||||||||
Substandard |
||||||||||||||||||||||||||||||||||||
Doubtful |
||||||||||||||||||||||||||||||||||||
Total |
||||||||||||||||||||||||||||||||||||
| $ | $ | $ | $ | $ | $ | $ | $ | $ | ||||||||||||||||||||||||||||
Current-period charge-offs |
( |
) | ( |
) | ||||||||||||||||||||||||||||||||
Current-period recoveries |
||||||||||||||||||||||||||||||||||||
Current-period net charge-offs |
$ | $ | $ | $ | $ | $ | $ | ( |
) | $ | $ | ( |
) | |||||||||||||||||||||||
Revolving |
||||||||||||||||||||||||||||||||||||
Term Loans Origination Year |
Revolving loans |
loans |
||||||||||||||||||||||||||||||||||
(In thousands) |
amortized cost |
converted to |
||||||||||||||||||||||||||||||||||
As of December 31, 2022 |
2022 |
2021 |
2020 |
2019 |
2018 |
Prior |
basis |
term loans |
Total |
|||||||||||||||||||||||||||
Internal Risk Grade: |
||||||||||||||||||||||||||||||||||||
Pass |
$ | |
$ | |
$ | |
$ | |
$ | |
$ | |
$ | $ | $ | |
||||||||||||||||||||
Special Mention |
||||||||||||||||||||||||||||||||||||
Substandard |
||||||||||||||||||||||||||||||||||||
Doubtful |
||||||||||||||||||||||||||||||||||||
Total |
$ | $ | $ | $ | $ | $ | $ | $ | $ | |||||||||||||||||||||||||||
Current-period charge-offs |
( |
) | ( |
) | ||||||||||||||||||||||||||||||||
Current-period recoveries |
||||||||||||||||||||||||||||||||||||
Current-period net charge-offs |
$ | $ | $ | $ | $ | $ | $ | ( |
) | $ | $ | ( |
) | |||||||||||||||||||||||
Other Consumer |
||||||||||||||||||||||||||||||||||||
Revolving |
||||||||||||||||||||||||||||||||||||
(In thousands) |
Term Loans Origination Year |
Revolving loans amortized cost |
loans converted to |
|||||||||||||||||||||||||||||||||
As of December 31, 2023 |
2023 |
2022 |
2021 |
2020 |
2019 |
Prior |
basis |
term loans |
Total |
|||||||||||||||||||||||||||
Internal Risk Grade: |
||||||||||||||||||||||||||||||||||||
Pass |
$ | |
$ | |
$ | $ | $ | $ | $ | $ | $ | |||||||||||||||||||||||||
Special Mention |
||||||||||||||||||||||||||||||||||||
Substandard |
||||||||||||||||||||||||||||||||||||
Doubtful |
||||||||||||||||||||||||||||||||||||
Total |
$ | $ | $ | $ | $ | $ | $ | $ | $ | |||||||||||||||||||||||||||
Current-period charge-offs |
( |
) | ( |
) | ( |
) | ( |
) | ( |
) | ( |
) | ( |
) | ||||||||||||||||||||||
Current-period recoveries |
||||||||||||||||||||||||||||||||||||
Current-period net (charge- offs) recoveries |
$ | ( |
) | $ | ( |
) | $ | ( |
) | $ | ( |
) | $ | ( |
) | $ | $ | $ | $ | ( |
) | |||||||||||||||
Revolving |
||||||||||||||||||||||||||||||||||||
(In thousands) |
Term Loans Origination Year |
Revolving loans amortized cost |
loans converted to |
|||||||||||||||||||||||||||||||||
As of December 31, 2022 |
2022 |
2021 |
2020 |
2019 |
2018 |
Prior |
basis |
term loans |
Total |
|||||||||||||||||||||||||||
Internal Risk Grade: |
||||||||||||||||||||||||||||||||||||
Pass |
$ | |
$ | $ | $ | $ | $ | $ | $ | $ | ||||||||||||||||||||||||||
Special Mention |
||||||||||||||||||||||||||||||||||||
Substandard |
||||||||||||||||||||||||||||||||||||
Doubtful |
||||||||||||||||||||||||||||||||||||
Total |
$ | $ | $ | $ | $ | $ | $ | $ | $ | |||||||||||||||||||||||||||
Current-period charge-offs |
( |
) | ( |
) | ( |
) | ( |
) | ( |
) | ( |
) | ( |
) | ||||||||||||||||||||||
Current-period recoveries |
||||||||||||||||||||||||||||||||||||
Current-period net (charge- offs) recoveries |
$ | ( |
) | $ | ( |
) | $ | ( |
) | $ | ( |
) | $ | ( |
) | $ | $ | $ | $ | ( |
) | |||||||||||||||
Accrued Interest Receivable |
||||||||
(In thousands) |
At December 31, 2023 |
At December 31, 2022 |
||||||
Commercial Real Estate: |
||||||||
Owner-occupied |
$ | $ | ||||||
Nonowner-occupied |
||||||||
Other Commercial |
||||||||
Residential Real Estate |
||||||||
Construction |
||||||||
Consumer: |
||||||||
Bankcard |
||||||||
Other consumer |
||||||||
Total |
$ | $ | ||||||
Accrued Interest Receivables Written Off by Reversing Interest Income |
||||||||
(In thousands) |
Year Ended |
|||||||
2023 |
2022 |
|||||||
Commercial Real Estate: |
||||||||
Owner-occupied |
$ | $ | ||||||
Nonowner-occupied |
||||||||
Other Commercial |
||||||||
Residential Real Estate |
||||||||
Construction |
||||||||
Accrued Interest Receivables Written Off by Reversing Interest Income |
||||||||
(In thousands) |
Year Ended |
|||||||
2023 |
2022 |
|||||||
Consumer: |
||||||||
Bankcard |
||||||||
Other consumer |
||||||||
Total |
$ | $ | ||||||
· |
Current conditions – United considered the impact of inflation, interest rates, the potential impact of the geopolitical situation, the banking regulatory environment and a potential government shutdown when making determinations related to factor adjustments, such as changes in economic and business conditions; collateral values for dependent loans; past due, nonaccrual and adversely classified loans and leases; concentrations of credit and external factors. |
· |
Reasonable and supportable forecasts – The forecast is determined on a portfolio-by-portfolio |
Ø |
The forecast for real GDP shifted slightly in the fourth quarter, from a projection of mid-September 2023 to mid-December with projection of |
Ø |
Greater risk of loss in the office portfolio due to continued hybrid and remote work that may be exacerbated by future economic conditions and in the commercial other and construction portfolios due to weakened economic conditions. |
Ø |
Reversion to historical loss data occurs via a straight-line method during the year following the one-year reasonable and supportable forecast period. |
Allowance for Loan and Lease Losses and Carrying Amount of Loans and Leases For the Year Ended December 31, 2023 |
||||||||||||||||||||||||||||||||
(In thousands) |
Commercial Real Estate |
Other Commercial |
Residential Real Estate |
Construction & Land Development |
Bankcard |
Total |
||||||||||||||||||||||||||
Owner- occupied |
Nonowner- occupied |
Other Consumer |
||||||||||||||||||||||||||||||
Allowance for Loan and Lease Losses: |
||||||||||||||||||||||||||||||||
Beginning balance |
$ | $ | $ | $ | $ | $ | $ | $ | ||||||||||||||||||||||||
Charge-offs |
( |
( |
( |
( |
( |
( |
( |
( |
||||||||||||||||||||||||
Recoveries |
||||||||||||||||||||||||||||||||
Provision |
( |
( |
||||||||||||||||||||||||||||||
Ending balance |
$ | $ | $ | $ | $ | $ | $ | $ | ||||||||||||||||||||||||
Allowance for Loan and Lease Losses and Carrying Amount of Loans and Leases For the Year Ended December 31, 2022 |
||||||||||||||||||||||||||||||||
(In thousands) |
Commercial Real Estate |
Other Commercial |
Residential Real Estate |
Construction & Land Development |
Bankcard |
Total |
||||||||||||||||||||||||||
Owner- occupied |
Nonowner- occupied |
Other Consumer |
||||||||||||||||||||||||||||||
Allowance for Loan and Lease Losses: |
||||||||||||||||||||||||||||||||
Beginning balance |
$ | $ | $ | $ | $ | $ | $ | $ | ||||||||||||||||||||||||
Charge-offs |
( |
( |
( |
( |
( |
( |
( |
|||||||||||||||||||||||||
Recoveries |
||||||||||||||||||||||||||||||||
Provision |
( |
( |
||||||||||||||||||||||||||||||
Ending balance |
$ | $ | $ | $ | $ | $ | $ | $ | ||||||||||||||||||||||||
Year Ended December 31 |
||||||||||||
(In thousands) |
2023 |
2022 |
2021 |
|||||||||
Balance of allowance for loan and lease losses at beginning of period |
$ | $ | $ | |||||||||
Initial allowance for acquired PCD loans |
||||||||||||
Gross charge-offs |
( |
) | ( |
) | ( |
) | ||||||
Recoveries |
||||||||||||
Net charge-offs |
( |
) | ( |
) | ( |
) | ||||||
Provision for loan and lease losses |
( |
) | ||||||||||
Balance of allowance for loan and lease losses at end of period |
$ | $ | $ | |||||||||
Reserve for lending-related commitments |
||||||||||||
Balance of allowance for credit losses at end of period |
$ | $ | $ | |||||||||
December 31 |
||||||||
(In thousands) |
2023 |
2022 |
||||||
Land |
$ | $ | ||||||
Buildings and improvements |
||||||||
Leasehold improvements |
||||||||
Furniture, fixtures and equipment |
||||||||
Less allowance for depreciation and amortization |
( |
) | ( |
) | ||||
Bank premises and equipment |
$ | $ | ||||||
Year Ended |
Year Ended |
|||||||||
(In thousands) |
Classification |
December 31, 2023 |
December 31, 2022 |
|||||||
Operating lease cost |
Net occupancy expense | $ | $ | |||||||
Sublease income |
Net occupancy expense | ( |
) | ( |
) | |||||
Net lease cost |
$ | $ | ||||||||
(In thousands) |
Classification |
December 31, 2023 |
December 31, 2022 |
|||||||
Operating lease right-of-use |
Operating lease right-of-use |
$ | $ | |||||||
Operating lease liabilities |
Operating lease liabilities | $ | $ | |||||||
December 31, 2023 |
||||
Weighted-average remaining lease term: |
||||
Operating leases |
||||
Weighted-average discount rate: |
||||
Operating leases |
% | |||
Year Ended |
||||||||
(In thousands) |
December 31, 2023 |
December 31, 2022 |
||||||
Cash paid for amounts in the measurement of lease liabilities: |
||||||||
Operating cash flows from operating leases |
$ | $ | ||||||
ROU assets obtained in the exchange for lease liabilities |
||||||||
Year |
Amount |
|||
(Dollars in thousands) |
||||
2024 |
$ | |||
2025 |
||||
2026 |
||||
2027 |
||||
2028 |
||||
Thereafter |
||||
Total lease payments |
||||
Less: imputed interest |
( |
) | ||
Total |
$ | |||
December 31, 2023 |
||||||||||||||||||||||||
Community Banking |
Mortgage Banking |
Total |
||||||||||||||||||||||
(In thousands) |
Gross Carrying Amount |
Accumulated Amortization |
Gross Carrying Amount |
Accumulated Amortization |
Gross Carrying Amount |
Accumulated Amortization |
||||||||||||||||||
Amortized intangible assets: |
||||||||||||||||||||||||
Core deposit intangible assets |
$ | ($ | ) | $ | $ | $ | ($ | ) | ||||||||||||||||
Goodwill not subject to amortization |
$ | $ | $ | |||||||||||||||||||||
December 31, 2022 |
||||||||||||||||||||||||
Community Banking |
Mortgage Banking |
Total |
||||||||||||||||||||||
(In thousands) |
Gross Carrying Amount |
Accumulated Amortization |
Gross Carrying Amount |
Accumulated Amortization |
Gross Carrying Amount |
Accumulated Amortization |
||||||||||||||||||
Amortized intangible assets: |
||||||||||||||||||||||||
Core deposit intangible assets |
$ | ($ | ) | $ | $ | $ | ($ | ) | ||||||||||||||||
Non-amortized intangible assets: |
||||||||||||||||||||||||
George Mason trade name |
$ | $ | $ | |||||||||||||||||||||
Crescent trade name |
||||||||||||||||||||||||
Total |
$ | $ | $ | |||||||||||||||||||||
Goodwill not subject to amortization |
$ | $ | $ | |||||||||||||||||||||
Year |
Amount |
|||
(Dollars in thousands) |
||||
2024 |
$ | |||
2025 |
||||
2026 |
||||
2027 |
||||
2028 |
||||
2029 and thereafter |
||||
(In thousands) |
Year Ended December 31, 2023 |
Year Ended December 31, 2022 |
||||||
MSRs beginning balance |
$ | $ | ||||||
Amount sold |
( |
) | ||||||
Amount capitalized |
||||||||
Amount amortized |
( |
) | ( |
) | ||||
MSRs ending balance |
$ | $ | ||||||
MSRs valuation allowance beginning balance |
$ | $ | ( |
) | ||||
Aggregate additions charged and recoveries credited to operations |
||||||||
MSRs impairment |
||||||||
MSRs valuation allowance ending balance |
$ | $ | ||||||
MSRs, net of valuation allowance |
$ | $ | ||||||
December 31 |
||||||||
(In thousands) |
2023 |
2022 |
||||||
| Noninterest-bearing accounts |
$ | $ | ||||||
| Interest-bearing transaction accounts |
||||||||
| Regular savings |
||||||||
| Interest-bearing money market accounts |
||||||||
| Time deposits under $100,000 |
||||||||
| Time deposits over $100,000 |
||||||||
| |
|
|
|
|||||
| Total deposits |
$ | $ | ||||||
| |
|
|
|
|||||
December 31 |
||||||||
(In thousands) |
2023 |
2022 |
||||||
| Federal funds purchased |
$ | $ | ||||||
| Securities sold under agreements to repurchase |
||||||||
| |
|
|
|
|||||
| Total short-term borrowings |
$ | $ | ||||||
| |
|
|
|
|||||
2023 |
2022 |
|||||||||||||||||||||||
(Dollars in thousands) |
Amount |
Weighted- Average Contractual Rate |
Weighted- Average Effective Rate |
Amount |
Weighted- Average Contractual Rate |
Weighted- Average Effective Rate |
||||||||||||||||||
| FHLB advances |
$ | % | % | $ | % | % | ||||||||||||||||||
| (Dollars in thousands) Description |
Issuance Date |
Amount of Capital Securities Issued |
Stated Interest Rate (1) |
Maturity Date | ||||||
| United Statutory Trust III |
$ | |||||||||
| United Statutory Trust IV |
$ | |||||||||
| United Statutory Trust V |
$ | |||||||||
| United Statutory Trust VI |
$ | |||||||||
| Premier Statutory Trust II |
$ | |||||||||
| Premier Statutory Trust III |
$ | |||||||||
| Premier Statutory Trust IV |
$ | |||||||||
| Premier Statutory Trust V |
$ | |||||||||
| Centra Statutory Trust I |
$ | |||||||||
| Centra Statutory Trust II |
$ | |||||||||
| VCBI Capital Trust II |
$ | |||||||||
| VCBI Capital Trust III |
$ | |||||||||
| Cardinal Statutory Trust I |
$ | |||||||||
| UFBC Capital Trust I |
$ | |||||||||
(Dollars in thousands) Description |
Issuance Date |
Amount of Capital Securities Issued |
Stated Interest Rate (1) |
Maturity Date | ||||||
Carolina Financial Capital Trust I |
$ | |||||||||
Carolina Financial Capital Trust II |
$ | |||||||||
Greer Capital Trust I |
$ | |||||||||
Greer Capital Trust II |
$ | |||||||||
First South Preferred Trust I |
$ | |||||||||
BOE Statutory Trust I |
$ | |||||||||
| (1) | The 3-month CME Term SOFR rates have a spread adjustment of 6-month CME Term SOFR rate has a spread adjustment of |
2023 |
2022 |
|||||||||||||||
(Dollars in thousands) |
Amount |
Weighted- Average Rate |
Amount |
Weighted- Average Rate |
||||||||||||
United Statutory Trust III |
$ | % | $ | |
% | |||||||||||
United Statutory Trust IV |
% | % | ||||||||||||||
United Statutory Trust V |
% | % | ||||||||||||||
United Statutory Trust VI |
% | % | ||||||||||||||
Premier Statutory Trust II |
% | % | ||||||||||||||
Premier Statutory Trust III |
% | % | ||||||||||||||
Premier Statutory Trust IV |
% | % | ||||||||||||||
Premier Statutory Trust V |
% | % | ||||||||||||||
Centra Statutory Trust I |
% | % | ||||||||||||||
Centra Statutory Trust II |
% | % | ||||||||||||||
Virginia Commerce Trust II |
% | % | ||||||||||||||
Virginia Commerce Trust III |
% | % | ||||||||||||||
Cardinal Statutory Trust I |
% | % | ||||||||||||||
UFBC Capital Trust I |
% | % | ||||||||||||||
Carolina Financial Capital Trust I |
% | % | ||||||||||||||
Carolina Financial Capital Trust II |
% | % | ||||||||||||||
Greer Capital Trust I |
% | % | ||||||||||||||
Greer Capital Trust II |
% | % | ||||||||||||||
First South Preferred Trust I |
% | % | ||||||||||||||
BOE Statutory Trust I |
% | % | ||||||||||||||
Total |
$ | % | $ | % | ||||||||||||
Year |
Amount |
|||
(Dollars in thousands) |
||||
2024 |
$ | |||
2025 |
||||
2026 |
||||
2027 |
||||
2028 |
||||
2029 and thereafter |
||||
Total |
$ | |
||
Year Ended December 31 |
||||||||||||
(In thousands) |
2023 |
2022 |
2021 |
|||||||||
Legal, consulting & other professional services |
$ | |
$ | |
$ | |
||||||
Franchise & other taxes not on income |
||||||||||||
Expense for reserve on lending-related commitments |
( |
) | ||||||||||
Automated Teller Machine (“ATM”) expenses |
||||||||||||
Year Ended December 31 |
||||||||||||
(In thousands) |
2023 |
2022 |
2021 |
|||||||||
Current expense: |
||||||||||||
Federal |
$ | |
$ | |
$ | |
||||||
State |
||||||||||||
Deferred expense: |
||||||||||||
Federal |
( |
) | ( |
) | ||||||||
State |
( |
) | ( |
) | ||||||||
Total income taxes |
$ | $ | $ | |||||||||
Year Ended December 31 |
||||||||||||||||||||||||
(Dollars in thousands) |
2023 |
2022 |
2021 |
|||||||||||||||||||||
Amount |
% |
Amount |
% |
Amount |
% |
|||||||||||||||||||
Tax on income before taxes at statutory federal rate |
$ | |
% | $ | |
% | $ | |
% | |||||||||||||||
Plus: State income taxes net of federal tax benefits |
||||||||||||||||||||||||
Increase (decrease) resulting from: |
||||||||||||||||||||||||
Tax-exempt interest income |
( |
) | ( |
) | ( |
) | ( |
) | ( |
) | ( |
) | ||||||||||||
Tax credits |
( |
) | ( |
) | ( |
) | ( |
) | ( |
) | ( |
) | ||||||||||||
Other items-net |
||||||||||||||||||||||||
Income taxes |
$ | % | $ | % | $ | % | ||||||||||||||||||
(In thousands) |
2023 |
2022 |
||||||
Deferred tax assets: |
||||||||
Allowance for credit losses |
$ | $ | ||||||
Accrued benefits payable |
||||||||
Other accrued liabilities |
||||||||
Unrealized loss on securities available for sale |
||||||||
Other real estate owned |
||||||||
Lease liabilities under operating leases |
||||||||
Deferred mortgage points |
||||||||
Total deferred tax assets |
||||||||
Deferred tax liabilities: |
||||||||
Premises and equipment |
||||||||
Right-of-use |
||||||||
Pension plan accruals |
||||||||
Derivatives |
||||||||
Purchase accounting intangibles |
||||||||
Other |
||||||||
Total deferred tax liabilities |
||||||||
Net deferred tax assets |
$ | |
$ | |
||||
December 31 |
||||||||
(In thousands) |
2023 |
2022 |
||||||
Unrecognized tax benefits at beginning of year |
$ | |
$ | |
||||
Increase in unrecognized tax benefits as a result of tax positions taken during the current period |
||||||||
Decreases in the unrecognized tax benefits as a result of a lapse of the applicable statute of limitations |
( |
) | ( |
) | ||||
Unrecognized tax benefits at end of year |
$ | $ | ||||||
Year Ended December 31, |
||||||||||||
(Dollars in thousands) |
2023 |
2022 |
2021 |
|||||||||
Service cost |
$ | $ | $ | |||||||||
| ( |
) | ( |
) | ( |
) | |||||||
Recognized net actuarial loss |
||||||||||||
Net periodic pension cost (income) |
$ | $ | ( |
) | $ | |||||||
Weighted-Average Assumptions: |
||||||||||||
Discount rate |
% | % | % | |||||||||
Expected return on assets |
% | % | % | |||||||||
Rate of compensation increase (prior to age 40) |
% | % | % | |||||||||
Rate of compensation increase (ages 40-54) |
% | % | % | |||||||||
Rate of compensation increase (otherwise) |
% | % | % | |||||||||
Year Ended December 31, |
||||||||||||
(In thousands) |
2023 |
2022 |
2021 |
|||||||||
Net actuarial gain |
$ | ( |
) | $ | ( |
) | $ | ( |
) | |||
Amortization of actuarial loss |
( |
) | ( |
) | ( |
) | ||||||
Total recognized in other comprehensive income |
$ | ( |
) | $ | ( |
) | $ | ( |
) | |||
December 31, |
||||||||
(Dollars in thousands) |
2023 |
2022 |
||||||
Change in Projected Benefit Obligation |
||||||||
Projected Benefit Obligation at the Beginning of the Year |
$ | |
$ | |
||||
Service Cost |
||||||||
Interest Cost |
||||||||
Actuarial Loss (Gain) |
( |
) | ||||||
Lump Sum Window Payments /Annuity Purchase Payments |
( |
) | ( |
) | ||||
Benefits Paid |
( |
) | ( |
) | ||||
Projected Benefit Obligation at the End of the Year |
$ | $ | ||||||
Accumulated Benefit Obligation at the End of the Year |
$ | $ | ||||||
December 31, |
||||||||
(Dollars in thousands) |
2023 |
2022 |
||||||
Change in Plan Assets |
||||||||
Fair Value of Plan Assets at the Beginning of the Year |
$ | $ | ||||||
Actual Return on Plan Assets |
( |
) | ||||||
Lump Sum Window Payments /Annuity Purchase Payments |
( |
) | ( |
) | ||||
Benefits Paid |
( |
) | ( |
) | ||||
Fair Value of Plan Assets at End of Year |
$ | $ | ||||||
Net Amount Recognized |
||||||||
Funded Status |
$ | $ | ||||||
Unrecognized Actuarial Net Loss |
||||||||
Net Amount Recognized |
$ | $ | ||||||
Weighted-Average Assumptions at the End of the Year |
||||||||
Discount Rate |
% | % | ||||||
Rate of compensation Increase (prior to age 40) |
% | % | ||||||
Rate of compensation Increase (ages 40-54) |
% | % | ||||||
Rate of compensation Increase (otherwise) |
% | % | ||||||
Plan Assets |
Target Allocation 2024 |
Allowable Allocation Range |
Percentage of Plan Assets at |
|||||||||||||
December 31, 2023 |
December 31, 2022 |
|||||||||||||||
Equity Securities |
% | % | ||||||||||||||
Fixed Income Securities |
% | % | ||||||||||||||
Other |
% | % | ||||||||||||||
Total |
||||||||||||||||
Year |
Amount |
|||
(Dollars in thousands) |
||||
2024 |
$ | |||
2025 |
||||
2026 |
||||
2027 |
||||
2028 |
||||
2029 through 2033 |
||||
Fair Value Measurements at December 31, 2023 Using |
||||||||||||||||
(In thousands) Description |
Balance as of December 31, 2023 |
Quoted Prices in Active Markets for Identical Assets (Level 1) |
Significant Other Observable Inputs (Level 2) |
Significant Unobservable Inputs (Level 3) |
||||||||||||
Cash and Cash equivalents |
$ | $ | $ | $ | ||||||||||||
Fixed Income Debt Securities: |
||||||||||||||||
U.S. Government and agencies |
||||||||||||||||
Mortgage backed securities |
||||||||||||||||
Municipal obligations |
||||||||||||||||
Corporate bonds |
||||||||||||||||
Fixed Income Mutual Funds: |
||||||||||||||||
General |
||||||||||||||||
Equity Securities: |
||||||||||||||||
Common stock |
||||||||||||||||
Equity Mutual Funds: |
||||||||||||||||
Domestic equity large cap |
||||||||||||||||
Domestic equity small cap |
||||||||||||||||
Alternative equity |
||||||||||||||||
International emerging equity |
||||||||||||||||
International equity developed |
||||||||||||||||
Total |
$ | |
$ | |
$ | |
$ | |
||||||||
Fair Value Measurements at December 31, 2022 Using |
||||||||||||||||
(In thousands) Description |
Balance as of December 31, 2022 |
Quoted Prices in Active Markets for Identical Assets (Level 1) |
Significant Other Observable Inputs (Level 2) |
Significant Unobservable Inputs (Level 3) |
||||||||||||
Cash and Cash equivalents |
$ | $ | $ | $ | ||||||||||||
Fixed Income Debt Securities: |
||||||||||||||||
U.S. Government and agencies |
||||||||||||||||
Fixed Income Mutual Funds: |
||||||||||||||||
General |
||||||||||||||||
Equity Securities: |
||||||||||||||||
Common stock |
||||||||||||||||
Equity Mutual Funds: |
||||||||||||||||
Global equity |
||||||||||||||||
Domestic equity large cap |
||||||||||||||||
Domestic equity small cap |
||||||||||||||||
Alternative equity |
||||||||||||||||
International emerging equity |
||||||||||||||||
International equity developed |
||||||||||||||||
Total |
$ | |
$ | |
$ | |
$ | |
||||||||
Year ended December 31, 2023 |
||||||||||||||||
Weighted Average |
||||||||||||||||
(Dollars in thousands, except per share amounts) |
Aggregate Intrinsic |
Remaining Contractual |
Exercise |
|||||||||||||
Shares |
Value |
Term (Yrs.) |
Price |
|||||||||||||
Outstanding at January 1, 2023 |
$ | |||||||||||||||
Exercised |
( |
) | ||||||||||||||
Forfeited or expired |
( |
) | ||||||||||||||
Outstanding at December 31, 2023 |
$ | |
$ | |
||||||||||||
Exercisable at December 31, 2023 |
$ | $ | ||||||||||||||
Shares |
Weighted-Average Grant Date Fair Value Per Share | |||||
Nonvested at January 1, 2023 |
$ | |||||
Vested |
( |
) | | |||
Forfeited or expired |
( |
) | | |||
Nonvested at December 31, 2023 |
$ | |||||
Number of Shares |
Weighted-Average Grant Date Fair Value Per Share | |||||
Outstanding at January 1, 2023 |
$ | |||||
Granted |
| |||||
Vested |
( |
) | | |||
Forfeited |
( |
) | | |||
Outstanding at December 31, 2023 |
$ | |||||
Shares |
Weighted-Average Grant Date Fair Value Per Share | |||||
Nonvested at January 1, 2023 |
$ | |||||
Granted |
| |||||
Vested |
( |
) | | |||
Forfeited or expired |
( |
) | | |||
Nonvested at December 31, 2023 |
$ | |||||
Asset Derivatives |
||||||||||||||||||||||||
December 31, 2023 |
December 31, 2022 |
|||||||||||||||||||||||
(In thousands) |
Balance Sheet Location |
Notional Amount |
Fair Value |
Balance Sheet Location |
Notional Amount |
Fair Value |
||||||||||||||||||
Derivatives designated as hedging instruments |
||||||||||||||||||||||||
Fair Value Hedges: |
||||||||||||||||||||||||
Interest rate swap contracts (hedging commercial loans) |
Other assets | $ | $ | Other assets | $ | $ | ||||||||||||||||||
Total Fair Value Hedges |
$ | $ | $ | $ | |
|||||||||||||||||||
Cash Flow Hedges: |
||||||||||||||||||||||||
Interest rate swap contracts (hedging FHLB borrowings) |
Other assets | $ | |
$ | Other assets | $ | |
$ | ||||||||||||||||
Total Cash Flow Hedges |
$ | $ | $ | $ | ||||||||||||||||||||
Total derivatives designated as hedging instruments |
$ | $ | $ | $ | ||||||||||||||||||||
Derivatives not designated as hedging instruments |
||||||||||||||||||||||||
Forward loan sales commitments |
Other assets | $ | $ | Other assets | $ | $ | ||||||||||||||||||
TBA mortgage-backed securities |
Other assets | Other assets | ||||||||||||||||||||||
Interest rate lock commitments |
Other assets | Other assets | ||||||||||||||||||||||
Total derivatives not designated as hedging instruments |
$ | $ | |
$ | $ | |||||||||||||||||||
Total asset derivatives |
$ | $ | $ | $ | ||||||||||||||||||||
Liability Derivatives |
||||||||||||||||||||||||
December 31, 2023 |
December 31, 2022 |
|||||||||||||||||||||||
(In thousands) |
Balance Sheet Location |
Notional Amount |
Fair Value |
Balance Sheet Location |
Notional Amount |
Fair Value |
||||||||||||||||||
Derivatives not designated as hedging instruments |
||||||||||||||||||||||||
Forward loan sales commitments |
Other liabilities | $ | $ | Other liabilities | $ | $ | ||||||||||||||||||
TBA mortgage-backed securities |
Other liabilities | Other liabilities | ||||||||||||||||||||||
Interest rate lock commitments |
Other liabilities | Other liabilities | ||||||||||||||||||||||
Total derivatives not designated as hedging instruments |
$ | |
$ | |
$ | |
$ | |
||||||||||||||||
Total liability derivatives |
$ | |
$ | |
$ | $ | |
|||||||||||||||||
December 31, 2023 |
||||||||||||||
(In thousands) Derivatives in Fair Value Hedging Relationships |
Location in the Statement of Condition |
Carrying Amount of the Hedged Assets/(Liabilities) |
Cumulative Amount of Fair Value Hedging Adjustment Included in the Carrying Amount of the Hedged Assets/(Liabilities) |
Cumulative Amount of Fair Value Hedging Adjustment Remaining for any Hedged Assets/ (Liabilities) for which Hedge Accounting has been Discontinued |
||||||||||
Interest rate swaps |
Loans, net of unearned income |
$ | |
$ | ( |
$ | |
|||||||
December 31, 2022 |
||||||||||||||
(In thousands) Derivatives in Fair Value Hedging Relationships |
Location in the Statement of Condition |
Carrying Amount of the Hedged Assets/(Liabilities) |
Cumulative Amount of Fair Value Hedging Adjustment Included in the Carrying Amount of the Hedged Assets/(Liabilities) |
Cumulative Amount of Fair Value Hedging Adjustment Remaining for any Hedged Assets/ (Liabilities) for which Hedge Accounting has been Discontinued |
||||||||||
Interest rate swaps |
Loans, net of unearned income |
$ | |
$ | ( |
$ | |
|||||||
Year Ended |
||||||||||||||
(In thousands) |
Income Statement Location |
December 31, 2023 |
December 31, 2022 |
December 31, 2021 |
||||||||||
Derivatives in hedging relationships Cash Flow Hedges: |
||||||||||||||
rate swap contracts |
Interest on long-term borrowings (1) |
$ | |
$ | $ | ( |
||||||||
Fair Value Hedges: |
||||||||||||||
Interest rate swap contracts |
Interest and fees on loans and leases |
$ | $ | ( |
$ | ( |
||||||||
Total derivatives in hedging relationships |
$ | $ | $ | ( |
||||||||||
Derivatives not designated as hedging instruments |
||||||||||||||
Forward loan sales commitments |
Income from Mortgage Banking Activities |
( |
) | ( |
) | ( |
) | |||||||
TBA mortgage-backed securities |
Income from Mortgage Banking Activities |
( |
) | |||||||||||
Interest rate lock commitments |
Income from Mortgage Banking Activities |
( |
) | ( |
) | ( |
) | |||||||
Total derivatives not designated as hedging instruments |
$ | ( |
) | $ | ( |
) | $ | ( |
) | |||||
Total derivatives |
$ | $ | ( |
) | $ | ( |
) | |||||||
| (1) | Decreases or increases in interest expense are expressed as positive or negative amounts, respectively, based on their impact to net income. |
For the Years Ended December 31 |
||||||||||||
(In thousands) |
2023 |
2022 |
2021 |
|||||||||
Net Income |
$ |
$ |
$ |
|||||||||
Available for sale (“AFS”) securities: |
||||||||||||
Change in net unrealized gains (losses) on AFS securities arising during the period |
( |
) | ( |
) | ||||||||
Related income tax effect |
( |
) | ||||||||||
Net reclassification adjustment for losses (gains) included in net income |
( |
) | ( |
) | ||||||||
Related income tax effect |
( |
) | ||||||||||
| ( |
) | ( |
) | |||||||||
Net effect of AFS securities on other comprehensive income |
( |
) |
( |
) | ||||||||
Cash flow hedge derivatives: |
||||||||||||
Unrealized gain on cash flow hedge before reclassification to interest expense |
||||||||||||
Related income tax effect |
( |
) | ( |
) | ( |
) | ||||||
Net reclassification adjustment for (gains) losses included in net income |
( |
) | ( |
) | ||||||||
Related income tax effect |
( |
) | ||||||||||
Net effect of cash flow hedge derivatives on other comprehensive income |
( |
) |
||||||||||
Defined benefit pension plan: |
||||||||||||
Net actuarial gain during the period |
||||||||||||
Related income tax expense |
( |
) | ( |
) | ( |
) | ||||||
Amortization of net actuarial loss recognized in net income |
||||||||||||
Related income tax effect |
( |
) | ( |
) | ( |
) | ||||||
Net effect of change in defined benefit pension plan on other comprehensive income |
||||||||||||
Total change in other comprehensive income, net of tax |
( |
) |
( |
) | ||||||||
Total Comprehensive Income |
$ |
$ |
$ |
|||||||||
Changes in Accumulated Other Comprehensive Income (AOCI) by Component (a) For the Year Ended December 31, 2023 |
||||||||||||||||
(Dollars in thousands) |
Unrealized Gains/ Losses on AFS Securities |
Unrealized Gains/ Losses on Cash Flow Hedges |
Defined Benefit Pension Items |
Total |
||||||||||||
Balance at January 1, 2023 |
$ | ( |
) | $ | $ | ( |
) | $ | ( |
) | ||||||
Other comprehensive income before reclassification |
||||||||||||||||
Amounts reclassified from accumulated other comprehensive income |
( |
) | ( |
) | ||||||||||||
Net current-period other comprehensive income (loss), net of tax |
( |
) | ||||||||||||||
Balance at December 31, 2023 |
$ | ( |
) | $ | $ | ( |
) | $ | ( |
) | ||||||
Reclassifications out of Accumulated Other Comprehensive Income (AOCI) For the Year Ended December 31, 2023 |
||||||||
(In thousands) Details about AOCI Components |
Amount Reclassified from AOCI |
Affected Line Item in the Statement Where Net Income is Presented |
||||||
Available for sale (“AFS”) securities: |
||||||||
Net reclassification adjustment for gains included in net income |
$ | Net investment securities gains | ||||||
| Total before tax | ||||||||
Related income tax effect |
( |
) | Tax expense | |||||
| Net of tax | ||||||||
Cash flow hedge: |
||||||||
Net reclassification adjustment for gains included in net income |
$ | ( |
) | Interest expense | ||||
| ( |
) | Total before tax | ||||||
Related income tax effect |
Tax expense | |||||||
| ( |
) | Net of tax | ||||||
Reclassifications out of Accumulated Other Comprehensive Income (AOCI) For the Year Ended December 31, 2023 |
||||||||
(In thousands) Details about AOCI Components |
Amount Reclassified from AOCI |
Affected Line Item in the Statement Where Net Income is Presented |
||||||
Pension plan: |
||||||||
Recognized net actuarial gain |
(a) | |||||||
Amortization of net actuarial loss |
(b) | |||||||
| Total before tax | ||||||||
Related income tax effect |
( |
) | Tax expense | |||||
| Net of tax | ||||||||
Total reclassifications for the period |
$ | ( |
) | |||||
Condensed Balance Sheets |
||||||||
December 31 |
||||||||
(In thousands) |
2023 |
2022 |
||||||
Assets |
||||||||
Cash and due from banks |
$ | $ | ||||||
Securities available for sale |
||||||||
Securities held to maturity |
||||||||
Equity securities |
||||||||
Other investment securities |
||||||||
Investment in subsidiaries: |
||||||||
Bank subsidiaries |
||||||||
Nonbank subsidiaries |
||||||||
Goodwill |
( |
) | ( |
) | ||||
Other assets |
||||||||
Total Assets |
$ | |
$ | |
||||
Liabilities and Shareholders’ Equity |
||||||||
Subordinated notes |
$ | $ | ||||||
Junior subordinated debentures of subsidiary trusts |
||||||||
Accrued expenses and other liabilities |
||||||||
Shareholders’ equity (including other accumulated comprehensive losses of $ |
||||||||
Total Liabilities and Shareholders’ Equity |
$ | $ | ||||||
Condensed Statements of Income |
||||||||||||
Year Ended December 31 |
||||||||||||
(In thousands) |
2023 |
2022 |
2021 |
|||||||||
Income |
||||||||||||
Dividends from banking subsidiaries |
$ | |
$ | |
$ | |
||||||
Net interest income |
||||||||||||
Management fees: |
||||||||||||
Bank subsidiaries |
||||||||||||
Nonbank subsidiaries |
||||||||||||
Other income |
||||||||||||
Total Income |
||||||||||||
Expenses |
||||||||||||
Operating expenses |
||||||||||||
Income Before Income Taxes and Equity in Undistributed Net Income of Subsidiaries |
||||||||||||
Applicable income tax benefit |
( |
) | ( |
) | ( |
) | ||||||
Income Before Equity in Undistributed Net |
||||||||||||
Income of Subsidiaries |
||||||||||||
Condensed Statements of Income |
||||||||||||
Year Ended December 31 |
||||||||||||
(In thousands) |
2023 |
2022 |
2021 |
|||||||||
Equity in undistributed net income of subsidiaries: |
||||||||||||
Bank subsidiaries |
||||||||||||
Nonbank subsidiaries |
( |
) | ( |
) | ( |
) | ||||||
Net Income |
$ | |
$ | |
$ | |
||||||
Condensed Statements of Cash Flows |
||||||||||||
Year Ended December 31 |
||||||||||||
(In thousands) |
2023 |
2022 |
2021 |
|||||||||
Operating Activities |
||||||||||||
Net income |
$ | $ | $ | |||||||||
Adjustments to reconcile net income to net cash provided by operating activities: |
||||||||||||
Equity in undistributed net income of subsidiaries |
( |
) | ( |
) | ( |
) | ||||||
Amortization of net periodic pension costs |
||||||||||||
Stock-based compensation |
||||||||||||
Excess tax benefits from stock-based compensation arrangements |
||||||||||||
Net change in other assets and liabilities |
( |
) | ( |
) | ||||||||
Net Cash Provided by Operating Activities |
||||||||||||
Investing Activities |
||||||||||||
Net proceeds from (purchases) sales of debt securities |
( |
) | ||||||||||
Net (purchases) proceeds from sales of equity securities |
( |
) | ( |
) | ||||||||
Net cash received in acquisition of subsidiary |
||||||||||||
Increase in investment in subsidiaries |
( |
) | ( |
) | ( |
) | ||||||
Change in other investment securities |
( |
) | ( |
) | ( |
) | ||||||
Net Cash Used in Investing Activities |
( |
) | ( |
) | ( |
) | ||||||
Financing Activities |
||||||||||||
Repayment of subordinated notes |
( |
) | ||||||||||
Cash dividends paid |
( |
) | ( |
) | ( |
) | ||||||
Acquisition of treasury stock |
( |
) | ( |
) | ( |
) | ||||||
Proceeds from exercise of stock options |
||||||||||||
Net Cash Used in Financing Activities |
( |
) | ( |
) | ( |
) | ||||||
(Decrease) Increase in Cash and Cash Equivalents |
( |
) | ( |
) | ||||||||
Cash and Cash Equivalents at Beginning of Year |
||||||||||||
Cash and Cash Equivalents at End of Year |
$ | $ | $ | |||||||||
(Dollars in thousands) |
Actual |
For Capital Adequacy Purposes |
To Be Well- Capitalized |
|||||||||||||||||||||
Amount |
Ratio |
Amount |
Ratio |
Amount |
Ratio |
|||||||||||||||||||
As of December 31, 2023: |
||||||||||||||||||||||||
Total Capital (to Risk- Weighted Assets): |
||||||||||||||||||||||||
United Bankshares |
$ | |
% | $ | |
≥ | % | $ | |
≥ | % | |||||||||||||
United Bank |
% | ≥ | % | ≥ | % | |||||||||||||||||||
Tier I Capital (to Risk- Weighted Assets): |
||||||||||||||||||||||||
United Bankshares |
$ | % | $ | ≥ | % | $ | ≥ | % | ||||||||||||||||
United Bank |
% | ≥ | % | ≥ | % | |||||||||||||||||||
Common Tier I Capital (to Risk Weighted Assets): |
||||||||||||||||||||||||
United Bankshares |
$ | % | $ | ≥ | % | $ | ≥ | % | ||||||||||||||||
United Bank |
% | ≥ | % | ≥ | % | |||||||||||||||||||
Tier I Capital (to Average Assets): |
||||||||||||||||||||||||
United Bankshares |
$ | % | $ | ≥ | % | $ | ≥ | % | ||||||||||||||||
United Bank |
% | ≥ | % | ≥ | % | |||||||||||||||||||
As of December 31, 2022: |
||||||||||||||||||||||||
Total Capital (to Risk- Weighted Assets): |
||||||||||||||||||||||||
United Bankshares |
$ | % | $ | ≥ | % | $ | ≥ | % | ||||||||||||||||
United Bank |
% | ≥ | % | ≥ | % | |||||||||||||||||||
Tier I Capital (to Risk- Weighted Assets): |
||||||||||||||||||||||||
United Bankshares |
$ | % | $ | ≥ | % | $ | ≥ | % | ||||||||||||||||
United Bank |
% | ≥ | % | ≥ | % | |||||||||||||||||||
Common Tier I Capital (to Risk Weighted Assets): |
||||||||||||||||||||||||
United Bankshares |
$ | % | $ | ≥ | % | $ | ≥ | % | ||||||||||||||||
United Bank |
% | ≥ | % | ≥ | % | |||||||||||||||||||
(Dollars in thousands) |
Actual |
For Capital Adequacy Purposes |
To Be Well- Capitalized |
|||||||||||||||||||||
Amount |
Ratio |
Amount |
Ratio |
Amount |
Ratio |
|||||||||||||||||||
Tier I Capital (to Average Assets): |
||||||||||||||||||||||||
United Bankshares |
$ | % | $ | ≥ | % | $ | ≥ | % | ||||||||||||||||
United Bank |
% | ≥ | % | ≥ | % | |||||||||||||||||||
Fair Value at December 31, 2023 Using |
||||||||||||||||
(In thousands) Description |
Balance as of December 31, 2023 |
Quoted Prices in Active Markets for Identical Assets (Level 1) |
Significant Other Observable Inputs (Level 2) |
Significant Unobservable Inputs (Level 3) |
||||||||||||
Assets |
||||||||||||||||
Available for sale debt securities: |
||||||||||||||||
U.S. Treasury securities and obligations of U.S. Government corporations and agencies |
$ | $ | $ | $ | ||||||||||||
State and political subdivisions |
||||||||||||||||
Residential mortgage-backed securities |
||||||||||||||||
Agency |
||||||||||||||||
Non-agency |
||||||||||||||||
Commercial mortgage-backed securities |
||||||||||||||||
Agency |
||||||||||||||||
Asset-backed securities |
||||||||||||||||
Single issue trust preferred securities |
||||||||||||||||
Other corporate securities |
||||||||||||||||
Total available for sale securities |
||||||||||||||||
Equity securities: |
||||||||||||||||
Financial services industry |
||||||||||||||||
Equity mutual funds (1) |
||||||||||||||||
Fixed income mutual funds |
||||||||||||||||
Total equity securities |
||||||||||||||||
Loans held for sale |
||||||||||||||||
Derivative financial assets: |
||||||||||||||||
Interest rate swap contracts |
||||||||||||||||
Forward sales commitments |
||||||||||||||||
Interest rate lock commitments |
||||||||||||||||
Total derivative financial assets |
||||||||||||||||
Liabilities |
||||||||||||||||
Derivative financial liabilities: |
||||||||||||||||
TBA mortgage-backed securities |
||||||||||||||||
Total derivative financial liabilities |
||||||||||||||||
Fair Value at December 31, 2022 Using |
||||||||||||||||
(In thousands) Description |
Balance as of December 31, 2022 |
Quoted Prices in Active Markets for Identical Assets (Level 1) |
Significant Other Observable Inputs (Level 2) |
Significant Unobservable Inputs (Level 3) |
||||||||||||
Assets |
||||||||||||||||
Available for sale debt securities: |
||||||||||||||||
U.S. Treasury securities and obligations of U.S. Government corporations and agencies |
$ | $ | $ | $ | ||||||||||||
State and political subdivisions |
||||||||||||||||
Residential mortgage-backed securities |
||||||||||||||||
Agency |
||||||||||||||||
Non-agency |
||||||||||||||||
Commercial mortgage-backed securities |
||||||||||||||||
Agency |
||||||||||||||||
Asset-backed securities |
||||||||||||||||
Single issue trust preferred securities |
||||||||||||||||
Other corporate securities |
||||||||||||||||
Total available for sale securities |
||||||||||||||||
Equity securities: |
||||||||||||||||
Financial services industry |
||||||||||||||||
Equity mutual funds (1) |
||||||||||||||||
Fixed income mutual funds |
||||||||||||||||
Total equity securities |
||||||||||||||||
Loans held for sale |
||||||||||||||||
: |
||||||||||||||||
Fair Value at December 31, 2022 Using |
||||||||||||||||
(In thousands) Description |
Balance as of December 31, 2022 |
Quoted Prices in Active Markets for Identical Assets (Level 1) |
Significant Other Observable Inputs (Level 2) |
Significant Unobservable Inputs (Level 3) |
||||||||||||
Interest rate swap contracts |
||||||||||||||||
Forward sales commitments |
||||||||||||||||
TBA mortgage-backed securities |
||||||||||||||||
Interest rate lock commitments |
||||||||||||||||
Total derivative financial assets |
||||||||||||||||
Liabilities |
||||||||||||||||
: |
||||||||||||||||
TBA mortgage-backed securities |
||||||||||||||||
Interest rate lock commitments |
||||||||||||||||
Total derivative financial liabilities |
||||||||||||||||
| (1) | The equity mutual funds are within a rabbi trust for the payment of benefits under a deferred compensation plan for certain key officers of United and its subsidiaries. |
Loans held for sale |
||||||||
(In thousands) |
December 31, 2023 |
December 31, 2022 |
||||||
Balance, beginning of period |
$ | $ | ||||||
Originations |
||||||||
Sales |
( |
) | ( |
) | ||||
Transfers to portfolio loans |
( |
) | ||||||
Total gains during the period recognized in earnings |
||||||||
Balance, end of period |
$ | $ | ||||||
The amount of total (losses) gains for the period included in earnings (or changes in net assets) attributable to the change in unrealized gains or losses relating to assets still held at reporting date |
$ | $ | ( |
|||||
Derivative financial assets TBA securities |
||||||||
(In thousands) |
December 31, 2023 |
December 31, 2022 |
||||||
Balance, beginning of period |
$ | |
$ | |
||||
Transfers other |
( |
) | ( |
) | ||||
Balance, end of period |
$ | $ | ||||||
The amount of total gains for the period included in earnings (or changes in net assets) attributable to the change in unrealized gains or losses relating to assets still held at reporting date |
$ | $ | ||||||
Derivative financial assets Forward sales commitments |
||||||||
(In thousands) |
December 31, 2023 |
December 31, 2022 |
||||||
Balance, beginning of period |
$ |
$ |
||||||
Transfers other |
||||||||
Balance, end of period |
$ |
$ |
||||||
The amount of total gains for the period included in earnings (or changes in net assets) attributable to the change in unrealized gains or losses relating to assets still held at reporting date |
$ |
$ |
||||||
Derivative financial assets Interest rate lock commitments |
||||||||
(In thousands) |
December 31, 2023 |
December 31, 2022 |
||||||
Balance, beginning of period |
$ |
$ |
||||||
Transfers other |
( |
) | ||||||
Balance, end of period |
$ |
$ |
||||||
The amount of total gains for the period included in earnings (or changes in net assets) attributable to the change in unrealized gains or losses relating to assets still held at reporting date |
$ |
$ |
||||||
Derivative financial liabilities Forward sales commitments |
||||||||
(In thousands) |
December 31, 2023 |
December 31, 2022 |
||||||
Balance, beginning of period |
$ |
$ |
||||||
Transfers other |
( |
) | ||||||
Balance, end of period |
$ |
$ |
||||||
The amount of total gains for the period included in earnings (or changes in net assets) attributable to the change in unrealized gains or losses relating to assets still held at reporting date |
$ |
$ |
||||||
Derivative financial liabilities TBA securities |
||||||||
(In thousands) |
December 31, 2023 |
December 31, 2022 |
||||||
Balance, beginning of period |
$ |
$ |
||||||
Transfers other |
( |
) | ||||||
Balance, end of period |
$ |
$ |
||||||
The amount of total gains for the period included in earnings (or changes in net assets) attributable to the change in unrealized gains or losses relating to assets still held at reporting date |
$ |
$ |
||||||
Derivative financial liabilities Interest rate lock commitments |
||||||||
(In thousands) |
December 31, 2023 |
December 31, 2022 |
||||||
Balance, beginning of period |
$ |
$ |
||||||
Transfers other |
( |
) |
||||||
Balance, end of period |
$ |
$ |
||||||
The amount of total gains for the period included in earnings (or changes in net assets) attributable to the change in unrealized gains or losses relating to assets still held at reporting date |
$ |
$ |
||||||
(In thousands) Description |
Year Ended December 31, 2023 |
Year Ended December 31, 2022 | ||
Income from mortgage banking activities |
$ |
$ ( |
December 31, 2023 |
December 31, 2022 |
|||||||||||||||||||||||
(In thousands) Description |
Unpaid Principal Balance |
Fair Value |
Fair Value Over/(Under) Unpaid Principal Balance |
Unpaid Principal Balance |
Fair Value |
Fair Value Over/(Under) Unpaid Principal Balance |
||||||||||||||||||
Loans held for sale |
$ | |
$ | |
$ | |
$ | |
$ | |
$ | |
||||||||||||
(In thousands) Description |
Fair Value at December 31, 2023 |
|||||||||||||||||||
Balance as of December 31, 2023 |
Quoted Prices in Active Markets for Identical Assets (Level 1) |
Significant Other Observable Inputs (Level 2) |
Significant Unobservable Inputs (Level 3) |
YTD Gains (Losses) |
||||||||||||||||
Assets |
||||||||||||||||||||
Individually assessed loans |
$ | $ | $ | $ | $ | |||||||||||||||
OREO |
( |
) | ||||||||||||||||||
(In thousands) Description |
Fair Value at December 31, 2022 |
|||||||||||||||||||
Balance as of December 31, 2022 |
Quoted Prices in Active Markets for Identical Assets (Level 1) |
Significant Other Observable Inputs (Level 2) |
Significant Unobservable Inputs (Level 3) |
YTD Gains (Losses) |
||||||||||||||||
Assets |
||||||||||||||||||||
Individually assessed loans |
$ | $ | $ | $ | $ | |||||||||||||||
OREO |
( |
) | ||||||||||||||||||
Fair Value Measurements |
||||||||||||||||||||
(In thousands) |
Carrying Amount |
Fair Value |
Quoted Prices in Active Markets for Identical Assets (Level 1) |
Significant Other Observable Inputs (Level 2) |
Significant Unobservable Inputs (Level 3) |
|||||||||||||||
December 31, 2023 |
||||||||||||||||||||
Cash and cash equivalents |
$ | $ | $ | $ | $ | |||||||||||||||
Securities available for sale |
||||||||||||||||||||
Securities held to maturity |
||||||||||||||||||||
Equity securities |
||||||||||||||||||||
Other securities |
||||||||||||||||||||
Loans held for sale |
||||||||||||||||||||
Net loans |
||||||||||||||||||||
Derivative financial assets, |
||||||||||||||||||||
Mortgage servicing rights |
||||||||||||||||||||
Deposits |
||||||||||||||||||||
Short-term borrowings |
||||||||||||||||||||
Long-term borrowings |
||||||||||||||||||||
Derivative financial liabilities |
||||||||||||||||||||
December 31, 2022 |
||||||||||||||||||||
Cash and cash equivalents |
$ | $ | $ | $ | $ | |||||||||||||||
Securities available for sale |
||||||||||||||||||||
Securities held to maturity |
||||||||||||||||||||
Equity securities |
||||||||||||||||||||
Other securities |
||||||||||||||||||||
Loans held for sale |
||||||||||||||||||||
Net loans |
||||||||||||||||||||
Derivative financial assets, |
||||||||||||||||||||
Mortgage servicing rights |
||||||||||||||||||||
Deposits |
||||||||||||||||||||
Short-term borrowings |
||||||||||||||||||||
Long-term borrowings |
||||||||||||||||||||
Derivative financial liabilities |
||||||||||||||||||||
At and For the Year Ended December 31, 2023 |
||||||||||||||||||||
(In thousands) |
Community Banking |
Mortgage Banking |
Other |
Intersegment Eliminations |
Consolidated |
|||||||||||||||
Net interest income |
$ | $ | $ | ( |
) | $ | $ | |||||||||||||
Provision for credit losses |
||||||||||||||||||||
Other income |
( |
) | ||||||||||||||||||
Other expense |
( |
) | ||||||||||||||||||
Income taxes |
( |
) | ( |
) | ||||||||||||||||
Net income (loss) |
$ | $ | $ | ( |
) | $ | $ | |||||||||||||
Total assets (liabilities) |
$ | $ | $ | $ | ( |
) | $ | |||||||||||||
Average assets (liabilities) |
( |
) | ||||||||||||||||||
At and For the Year Ended December 31, 2022 |
||||||||||||||||||||
(In thousands) |
Community Banking |
Mortgage Banking |
Other |
Intersegment Eliminations |
Consolidated |
|||||||||||||||
Net interest income |
$ | $ | $ | ( |
) | $ | $ | |||||||||||||
Provision for credit losses |
||||||||||||||||||||
Other income |
( |
) | ||||||||||||||||||
Other expense |
( |
) | ||||||||||||||||||
Income taxes |
( |
) | ( |
) | ||||||||||||||||
Net income (loss) |
$ | $ | ( |
) | $ | ( |
) | $ | $ | |||||||||||
Total assets (liabilities) |
$ | $ | $ | $ | ( |
) | $ | |||||||||||||
Average assets (liabilities) |
( |
) | ||||||||||||||||||
At and For the Year Ended December 31, 2021 |
||||||||||||||||||||
(In thousands) |
Community Banking |
Mortgage Banking |
Other |
Intersegment Eliminations |
Consolidated |
|||||||||||||||
Net interest income |
$ | $ | $ | ( |
) | $ | $ | |||||||||||||
Provision for credit losses |
( |
) | ( |
) | ||||||||||||||||
Other income |
( |
) | ||||||||||||||||||
Other expense |
( |
) | ||||||||||||||||||
Income taxes |
( |
) | ||||||||||||||||||
Net income (loss) |
$ | $ | $ | ( |
) | $ | $ | |||||||||||||
Total assets (liabilities) |
$ | $ | $ | $ | ( |
) | $ | |||||||||||||
Average assets (liabilities) |
( |
) | ||||||||||||||||||
(Dollars in thousands, except per share data) |
1st Quarter |
2nd Quarter |
3rd Quarter |
4th Quarter |
||||||||||||
2023 |
||||||||||||||||
Interest income |
$ | $ | $ | $ | ||||||||||||
Interest expense |
||||||||||||||||
Net interest income |
||||||||||||||||
Provision for credit losses |
||||||||||||||||
Mortgage banking income |
||||||||||||||||
Securities (losses) gains, net |
( |
) | ( |
) | ( |
) | ||||||||||
Other noninterest income |
||||||||||||||||
Noninterest expense |
||||||||||||||||
Income taxes |
||||||||||||||||
Net income (1) |
||||||||||||||||
Per share data : |
||||||||||||||||
Average shares outstanding (000s): |
||||||||||||||||
Basic |
||||||||||||||||
Diluted |
||||||||||||||||
(Dollars in thousands, except per share data) |
1st Quarter |
2nd Quarter |
3rd Quarter |
4th Quarter |
||||||||||||
Net income per share: |
||||||||||||||||
Basic |
$ | $ | $ | $ | ||||||||||||
Diluted |
$ | $ | $ | $ | ||||||||||||
Dividends per share |
$ | $ | $ | $ | ||||||||||||
2022 |
||||||||||||||||
Interest income |
$ | $ | $ | $ | ||||||||||||
Interest expense |
||||||||||||||||
Net interest income |
||||||||||||||||
Provision for credit losses |
( |
) | ( |
) | ||||||||||||
Mortgage banking income |
||||||||||||||||
Securities (losses) gains, net |
( |
) | ( |
) | ||||||||||||
Other noninterest income |
||||||||||||||||
Noninterest expense |
||||||||||||||||
Income taxes |
||||||||||||||||
Net income (1) |
||||||||||||||||
Per share data: |
||||||||||||||||
Average shares outstanding (000s): |
||||||||||||||||
Basic |
||||||||||||||||
Diluted |
||||||||||||||||
Net income per share: |
||||||||||||||||
Basic |
$ | $ | $ | $ | ||||||||||||
Diluted |
$ | $ | $ | $ | ||||||||||||
Dividends per share |
$ | $ | $ | $ | ||||||||||||
Item 9. |
CHANGES IN AND DISAGREEMENTS WITH ACCOUNTANTS ON ACCOUNTING AND FINANCIAL DISCLOSURES |
Item 9A. |
CONTROLS AND PROCEDURES |
Item 9B. |
OTHER INFORMATION |
Item 9C. |
DISCLOSURES REGARDING FOREIGN JURISDICTIONS THAT PREVENT INSPECTIONS |
UNITED BANKSHARES, INC.
FORM 10-K, PART III
| Item 10. | DIRECTORS, EXECUTIVE OFFICERS AND CORPORATE GOVERNANCE |
Information regarding directors and executive officers of the registrant including their reporting compliance under Section 16(a) of the Securities Exchange Act of 1934 is incorporated by reference from United’s definitive proxy statement for the 2024 Annual Meeting of Shareholders under the caption “Directors Whose Terms Expire in 2024 and Nominees for Directors” under the heading “PROPOSAL 1: ELECTION OF DIRECTORS”, under the caption “Delinquent Section 16(a) Reports” under the heading “COMMON STOCK OWNERSHIP OF CERTAIN BENEFICIAL OWNERS AND MANAGEMENT” and under the captions “Executive Officers” and “Family Relationships” under the heading “GOVERNANCE OF THE COMPANY.”
United has adopted a code of ethics for its Chief Executive Officer, Chief Financial Officer, Controller and persons performing similar functions of the registrant in accordance with Section 406 of the Sarbanes-Oxley Act of 2002. A copy of the code of ethics is posted on United’s web site at www.ubsi-inc.com.
Information related to the registrant’s audit committee and its financial expert in accordance with Section 407 of the Sarbanes-Oxley Act of 2002 is incorporated by reference from United’s definitive proxy statement for the 2024 Annual Meeting of Shareholders under the captions “The Audit Committee” and the “Audit Committee Financial Expert” under the heading “GOVERNANCE OF THE COMPANY.”
Since the disclosure of the procedures in the definitive proxy statement for the 2024 Annual Meeting of Shareholders, United has not adopted any changes to the procedures by which shareholders may recommend nominees to United’s Board of Directors as set forth in Article II, Section 5 of the Restated Bylaws of United.
| Item 11. | EXECUTIVE COMPENSATION |
Information regarding executive compensation is incorporated by reference from United’s definitive proxy statement for the 2024 Annual Meeting of Shareholders under the heading of “EXECUTIVE COMPENSATION”, under the heading “COMPENSATION DISCUSSION AND ANALYSIS (CD&A)”, and under the heading “REPORT OF THE COMPENSATION COMMITTEE ON EXECUTIVE COMPENSATION.”
| Item 12. | SECURITY OWNERSHIP OF CERTAIN BENEFICIAL OWNERS AND MANAGEMENT AND RELATED STOCKHOLDER MATTERS |
Information regarding security ownership of certain beneficial owners and management and securities authorized under equity compensation plans is incorporated by reference from United’s definitive proxy statement for the 2024 Annual Meeting of Shareholders under the caption “Directors Whose Terms Expire in 2024 and Nominees for Directors” under the heading “PROPOSAL 1: ELECTION OF DIRECTORS” and under the captions “Beneficial Ownership of Directors and Named Executive Officers”, “Principal Shareholders of United” and “Related Shareholder Matters” under the heading “COMMON STOCK OWNERSHIP OF CERTAIN BENEFICIAL OWNERS AND MANAGEMENT.”
| Item 13. | CERTAIN RELATIONSHIPS AND RELATED TRANSACTIONS, AND DIRECTOR INDEPENDENCE |
Information regarding certain relationships and related transactions is incorporated by reference from United’s definitive proxy statement for the 2024 Annual Meeting of Shareholders under the captions of “Related Party Transactions” and “Independence of Directors” under the heading “GOVERNANCE OF THE COMPANY.”
137
| Item 14. | PRINCIPAL ACCOUNTING FEES AND SERVICES |
Information regarding approval of audit and non-audit services by the Audit Committee as well as fees paid to auditors is incorporated by reference from United’s definitive proxy statement for the 2024 Annual Meeting of Shareholders under the captions “Pre-Approval Policies and Procedures” and “Independent Registered Public Accounting Firm Fees Information” under the heading “AUDIT COMMITTEE AND INDEPENDENT REGISTERED PUBLIC ACCOUNTING FIRM.”
138
UNITED BANKSHARES, INC.
FORM 10-K, PART IV
| Item 15. | EXHIBITS, FINANCIAL STATEMENT SCHEDULES |
| (a) | List of Documents Filed as Part of This Report: |
| (1) | Financial Statements |
United’s consolidated financial statements required in response to this Item are incorporated by reference from Item 8 of this Annual Report on Form 10-K.
| (2) | Financial Statement Schedules |
United is not filing separate financial statement schedules because of the absence of conditions under which they are required or because the required information is included in the consolidated financial statements or notes thereto.
| (3) | Exhibits Required by Item 601 |
Listing of Exhibits - See the Index to Exhibits on page 140 of this Form 10-K.
| (b) | Exhibits — The exhibits to this Form 10-K begin on page 144. |
| (c) | Consolidated Financial Statement Schedules — All other schedules for which provision is made in the applicable accounting regulation of the Securities and Exchange Commission are not required under the related instructions or are inapplicable or pertain to items as to which the required disclosures have been made elsewhere in the financial statements and notes thereto, and therefore have been omitted. |
All reports filed electronically by United with the Securities and Exchange Commission (SEC), including the annual report on Form 10-K, quarterly reports on Form 10-Q, and current reports on Form 8-K, as well as any amendments to those reports, are accessible at no cost on United’s web site at www.ubsi-inc.com. These filings are also accessible on the SEC’s web site at www.sec.gov.
139
UNITED BANKSHARES, INC.
FORM 10-K
INDEX TO EXHIBITS
140
141
| Item 16. | FORM 10-K SUMMARY |
None
142
SIGNATURES
Pursuant to the requirements of Section 13 or 15 (d) of the Securities Exchange Act of 1934, the registrant has duly caused this report to be signed on its behalf by the undersigned thereunto duly authorized.
| UNITED BANKSHARES, INC. |
| (Registrant) |
| /s/ Richard M. Adams, Jr. |
| Chief Executive Officer |
Pursuant to the requirements of the Securities Exchange Act of 1934, this report has been signed below by the following persons on behalf of the registrant and in the capacities and on the dates indicated.
| Signatures | Title | Date | ||||
| /s/ Richard M. Adams, Jr. |
Chief Executive Officer Director |
February 29, 2024 | ||||
| /s/ W. Mark Tatterson |
Chief Financial Officer Chief Accounting Officer |
February 29, 2024 | ||||
| /s/ Richard M. Adams |
Executive Chairman Director |
February 29, 2024 | ||||
| /s/ Patrice A. Harris |
Director |
February 29, 2024 | ||||
| /s/ J. Paul McNamara |
Director |
February 29, 2024 | ||||
| /s/ Mark R. Nesselroad |
Director |
February 29, 2024 | ||||
| /s/ Lacy I. Rice, III |
Director |
February 29, 2024 | ||||
| /s/ Gary G. White |
Director |
February 29, 2024 | ||||
| /s/ Diana Lewis Jackson |
Director |
February 29, 2024 | ||||
| /s/ Charles L. Capito, Jr. |
Director |
February 29, 2024 | ||||
| /s/ Mary K. Weddle |
Director |
February 29, 2024 | ||||
| /s/ Peter A. Converse |
Director |
February 29, 2024 | ||||
| /s/ P. Clinton Winter |
Director |
February 29, 2024 | ||||
| /s/ Michael P. Fitzgerald |
Director |
February 29, 2024 | ||||
143