Table of Contents
REGISTRATION STATEMENT PURSUANT TO SECTION 12(b) OR (g) OF THE SECURITIES EXCHANGE ACT OF 1934 |
ANNUAL REPORT PURSUANT TO SECTION 13 OR 15(d) OF THE SECURITIES EXCHANGE ACT OF 1934 |
TRANSITION REPORT PURSUANT TO SECTION 13 OR 15(d) OF THE SECURITIES EXCHANGE ACT OF 1934 |
SHELL COMPANY REPORT PURSUANT TO SECTION 13 OR 15(d) OF THE SECURITIES EXCHANGE ACT OF 1934 |
Title of each class |
Trading Symbol(s) |
Name of each exchange on which registered | ||
| Large Accelerated Filer | ☐ | ☒ | Non-accelerated Filer | ☐ | ||||||
| Emerging growth company | ||||||||||
| † | The term “new or revised financial accounting standard” refers to any update issued by the Financial Accounting Standards Board to its Accounting Standards Codification after April 5, 2012. |
| ☐ | U.S. GAAP |
| ☒ |
| ☐ | Other |
Table of Contents
VINCI PARTNERS INVESTMENTS LTD.
TABLE OF CONTENTS
| Page | ||||
| 1 | ||||
| 5 | ||||
| PART I | ||||
| ITEM 1. IDENTITY OF DIRECTORS, SENIOR MANAGEMENT AND ADVISERS |
7 | |||
| 7 | ||||
| 7 | ||||
| 7 | ||||
| 7 | ||||
| 7 | ||||
| 7 | ||||
| 7 | ||||
| 7 | ||||
| 7 | ||||
| 7 | ||||
| 7 | ||||
| 63 | ||||
| 63 | ||||
| 67 | ||||
| 109 | ||||
| 110 | ||||
| 111 | ||||
| 111 | ||||
| 111 | ||||
| 130 | ||||
| 133 | ||||
| 133 | ||||
| 134 | ||||
| 134 | ||||
| 134 | ||||
| 137 | ||||
| 138 | ||||
| 140 | ||||
| 141 | ||||
| F. Disclosure of a Registrant’s Action to Recover Erroneously Awarded Compensation. |
141 | |||
| 141 | ||||
| 141 | ||||
| 144 | ||||
| 145 | ||||
| 145 | ||||
| 145 | ||||
| 147 | ||||
| 147 | ||||
| 147 | ||||
| 147 | ||||
| 147 | ||||
| 147 | ||||
| 147 | ||||
| 147 | ||||
i
Table of Contents
| 147 | ||||
| 147 | ||||
| 148 | ||||
| 163 | ||||
| 163 | ||||
| 163 | ||||
| 167 | ||||
| 167 | ||||
| 168 | ||||
| 168 | ||||
| 168 | ||||
| ITEM 11. QUANTITATIVE AND QUALITATIVE DISCLOSURES ABOUT MARKET RISK |
168 | |||
| ITEM 12. DESCRIPTION OF SECURITIES OTHER THAN EQUITY SECURITIES |
169 | |||
| 169 | ||||
| 169 | ||||
| 169 | ||||
| 169 | ||||
| PART II | ||||
| 170 | ||||
| ITEM 14. MATERIAL MODIFICATIONS TO THE RIGHTS OF SECURITY HOLDERS AND USE OF PROCEEDS |
170 | |||
| 170 | ||||
| 170 | ||||
| 170 | ||||
| 170 | ||||
| 170 | ||||
| 170 | ||||
| 170 | ||||
| B. Management’s annual report on internal control over financial reporting |
170 | |||
| C. Attestation report of the registered public accounting firm |
171 | |||
| 171 | ||||
| 172 | ||||
| 172 | ||||
| 172 | ||||
| 172 | ||||
| ITEM 16D. Exemptions from the listing standards for audit committees |
173 | |||
| ITEM 16E. Purchases of equity securities by the issuer and affiliated purchasers |
173 | |||
| 174 | ||||
| 175 | ||||
| 175 | ||||
| ITEM 16I. Disclosure regarding foreign jurisdictions that prevent inspections |
175 | |||
| 175 | ||||
| 175 | ||||
| PART III | ||||
| 178 | ||||
| 178 | ||||
| 178 | ||||
| F-1 | ||||
ii
Table of Contents
PRESENTATION OF FINANCIAL AND OTHER INFORMATION
All references to “U.S. dollars,” “dollars” or “$” are to the U.S. dollar. All references to “real,” “reais,” “Brazilian real,” “Brazilian reais,” or “R$” are to the Brazilian real, the official currency of Brazil. All references to “IFRS” are to International Financial Reporting Standards, as issued by the International Accounting Standards Board, or the IASB.
Financial Statements
Vinci Partners Investments Ltd., which we refer to in this annual report as “Vinci Partners,” was incorporated on September 21, 2020 as a Cayman Islands exempted company with limited liability duly registered with the Cayman Islands Registrar of Companies. Vinci Partners was incorporated to become the holding entity of Vinci Partners Investimentos Ltda., which we refer to in this annual report as “Vinci Partners Brazil.” Until the contribution of Vinci Partners Brazil’s quotas to us by Vinci Partners Brazil’s quotaholders prior to the consummation of our initial public offering on February 1, 2021, or our IPO, Vinci Partners had not commenced its operations and had only nominal assets and liabilities and no material contingent liabilities or commitments. Please refer to “Item 4. Information on the Company—C. Organizational Structure” for a description of the operations of our material operating subsidiaries.
We present in this annual report the audited consolidated financial statements of Vinci Partners for the years ended December 31, 2023, 2022 and 2021. The audited consolidated financial statements of Vinci Partners were prepared in accordance with IFRS Accounting Standards, as issued by the IASB.
Vinci Partners maintains their books and records in Brazilian reais, the presentation currency for their financial statements and also the functional currency of our operations in Brazil. Unless otherwise noted, the financial information presented herein as of December 31, 2023 and 2022, and for the years ended December 31, 2023, 2022 and 2021, is stated in Brazilian reais, our reporting currency. The consolidated financial information of Vinci Partners contained in this annual report is derived from Vinci Partners’ audited consolidated financial statements as of December 31, 2023, 2022 and 2021, and for the years ended December 31, 2023, 2022 and 2021, together with the notes thereto. All references herein to “our financial statements,” “our audited consolidated financial information,” and “our audited consolidated financial statements” are to the audited consolidated financial statements of Vinci Partners included elsewhere in this annual report. All references herein to “we,” “us,” “our,” or the “Company” are to Vinci Partners.
This financial information should be read in conjunction with “Item 5. Operating and Financial Review and Prospects” and our audited consolidated financial statements, including the notes thereto, included elsewhere in this annual report.
Our fiscal year ends on December 31. References in this annual report to a fiscal year, such as “fiscal year 2023,” relate to our fiscal year ended December 31 of that calendar year.
Financial Information in U.S. Dollars
Solely for the convenience of the reader, we have translated some of the real amounts included in this annual report from reais into U.S. dollars. You should not construe these translations as representations by us that the amounts actually represent these U.S. dollar amounts or could be converted into U.S. dollars at the rates indicated. Unless otherwise indicated, we have translated real amounts into U.S. dollars using a rate of R$4.8413 to US$1.00, the commercial selling rate for U.S. dollars as of December 31, 2023, as reported by the Brazilian Central Bank (Banco Central do Brasil), or the Brazilian Central Bank.
Special Note Regarding Non-GAAP Financial Measures
This annual report presents our FRE, FRE Margin, PRE, PRE Margin, Distributable Earnings, and Distributable Earnings Margin, which are non-GAAP financial measures, and their reconciliations to the nearest measure as defined by IFRS Accounting Standards, for the convenience of investors.
Table of Contents
We present Fee Related Earnings, or FRE, because we believe this metric is useful to monitor the baseline performance of, and trends in, our business, in a manner that does not include performance fees, investment income and expenses that do not arise from our normal course of operations. FRE is calculated as operating profit, less (a) net revenue from realized performance fees, less (b) net revenue from unrealized performance fees, plus (c) share-based payments plus (d) compensation allocated in relation to performance fees plus (e) non-operational expenses, which are comprised of expenses relating to professional services rendered in connection with acquisitions and our international corporate organization (which expenses were added to the calculation of FRE beginning in the year ended December 31, 2022 to ensure the metric’s usefulness as a tool to assess our ability to generate profits from revenues and expenses arising out of our normal course of operations). FRE Margin is calculated as FRE divided by the sum of net revenue from fund management and net revenue from advisory services.
We present Performance Related Earnings, or PRE, because we believe this measure can provide useful information as a performance measure that we use to assess our ability to generate profits from revenue that relies on outcomes from funds above their respective benchmarks. We calculate PRE as operating profit less (a) net revenue from fund management, less (b) net revenue from advisory services, plus (c) personnel and profit-sharing expenses, plus (d) other general and administrative expenses, less (e) compensation in relation to performance fees. PRE Margin is calculated as PRE divided by net revenue from performance fees.
We present Distributable Earnings as a metric used by our board of directors to assess our performance and capabilities to distribute dividends to our shareholders. Distributable Earnings is calculated as profit for the year, less (a) net revenue from unrealized performance fees, plus (b) income taxes from unrealized performance fees, plus (c) compensation allocated in relation to unrealized performance fees, less (d) unrealized gain from investment income, plus (e) income taxes on unrealized gain from investment income, plus (f) share-based payments, plus (g) income taxes on share-based payments, plus (h) depreciation and amortization, except for depreciation and amortization relating to each segment’s investments, less (i) contingent consideration (earn-out) gain (loss) (after tax) (which expenses were added to the calculation of Distributable Earnings beginning in the year ended December 31, 2022 in light of a new line item in our financial statements, contingent consideration (earn-out) gain (loss), which may become payable in future periods a result of our acquisition of SPS Capital in the year ended December 31, 2022 (see “Item 4. Information on the Company—A. History and Development of the Company—Our History—Acquisition of SPS Capital”)). Distributable Earnings Margin is calculated as Distributable Earnings divided by sum of net revenue from fund management, net revenue from performance fees, net revenue from advisory services and realized gain from investment income.
FRE, FRE Margin, PRE, PRE Margin, Distributable Earnings and Distributable Earnings Margin as described in this annual report are non-GAAP measures that are not a substitute for the IFRS Accounting Standards measures of earnings. Additionally, our calculation of these measures may be different from the calculation used by other companies, including our competitors in the financial services industry, and therefore, our measures may not be comparable to those of other companies.
In addition, this annual report presents our Adjusted Distributable Earnings, Adjusted Distributable Earnings Margin, Adjusted Profit for the year, and Adjusted Profit Margin for the year, which are non-GAAP financial measures, and their reconciliations to the nearest measure as defined by IFRS Accounting Standards, for the convenience of investors. Our Distributable Earnings, Distributable Earnings Margin, profit for the year and profit margin differ for the years ended December 31, 2023 and 2022 differ from our Adjusted Distributable Earnings, Adjusted Distributable Earnings Margin, Adjusted Profit and Adjusted Profit Margin, respectively, as a result of the adjustments described in this annual report.
We present Adjusted Distributable Earnings as a reference point by our board of directors for determining the amount of earnings available to distribute to shareholders as dividends. Adjusted Distributable Earnings is calculated as Distributable Earnings, less non-operational expenses, which are comprised of expenses relating to professional services rendered in connection with acquisitions and our international corporate organization (including income tax related to realized expense). Beginning in the year ended December 31, 2022, management updated the definition of Adjusted Distributable Earnings previously reported in our annual report on Form 20-F in light of certain non-operational expenses relating to professional services rendered in connection with our acquisitions and our international corporate organization, in order to ensure the metric’s usefulness as a tool to assess our ability to generate profits from revenues and expenses arising out of our normal course of operations. Adjusted Distributable Earnings Margin is calculated as Adjusted Distributable Earnings divided by the sum of net revenue from fund management, net revenue from performance fees, and net revenue from advisory services and realized gain from investment income.
2
Table of Contents
We present Adjusted Profit for the year because management evaluates this measure and we believe it can provide useful information to investors and analysts regarding the net results of our business. We calculate Adjusted Profit for the year as profit for the year less (a) non-operational expenses, which are comprised of expenses relating to professional services rendered in connection with acquisitions and our international corporate organization (including income tax related to realized expense), and (b) contingent consideration (earn-out) gain (loss) (after tax). Beginning in the year ended December 31, 2022, management updated the definition of Adjusted Distributable Earnings previously reported in our annual report on Form 20-F in light of (i) certain non-operational expenses relating to professional services rendered in connection with our acquisitions and our international corporate organization, in order to ensure the metric’s usefulness as a tool to assess our ability to generate profits from revenues and expenses arising out of our normal course of operations, and (ii) a new line item in our financial statements, contingent consideration (earn-out) gain (loss), which may become payable in future periods a result of our acquisition of SPS Capital in the year ended December 31, 2022. See “Item 4. Information on the Company—A. History and Development of the Company—Our History—Acquisition of SPS Capital.” Adjusted Profit Margin for the year is calculated as Adjusted Profit for the year divided by the sum of net revenue from fund management and net revenue from advisory services.
Adjusted Distributable Earnings, Adjusted Distributable Earnings Margin, Adjusted Profit, and Adjusted Profit Margin for the year as described in this annual report are non-GAAP measures that are not a substitute for the IFRS Accounting Standards measures of earnings. Additionally, our calculation of these measures may be different from the calculation used by other companies, including our competitors in the financial services industry, and therefore, our measures may not be comparable to those of other companies. See “Item 5. Operating and Financial Review and Prospects—A. Operating Results—Non-GAAP Financial Measures and Reconciliations” for the reconciliation of our non-GAAP financial measures.
Market Share and Other Information
This annual report contains data related to economic conditions in the market in which we operate. The information contained in this annual report concerning economic conditions is based on publicly available information from third-party sources that we believe to be reasonable. Market data and certain industry forecast data used in this annual report were obtained from internal reports and studies, where appropriate, as well as estimates, market research, publicly available information (including information available from the United States Securities and Exchange Commission website) and industry publications. We obtained the information included in this annual report relating to the industry in which we operate, as well as the estimates concerning market shares, through internal research, public information and publications on the industry prepared by official public sources, such as the Brazilian Central Bank or the World Bank, as well as private sources, such as the Brazilian Financial and Capital Markets Association (Associação Brasileira das Entidades dos Mercados Financeiro e de Capitais), or ANBIMA, B3 S.A. – Brasil, Bolsa Balcão, or the B3 , Bloomberg, the National Economic and Social Development Bank (Banco Nacional de Desenvolvimento Econômico e Social), or BNDES, CVM, Inter.B Consultoria Internacional de Negócios, McKinsey & Company, Oliver Wyman, and Reuters, among others.
Industry publications generally state that the information they include has been obtained from sources believed to be reliable, but that the accuracy and completeness of such information is not guaranteed. Although we have no reason to believe any of this information or these reports are inaccurate in any material respect and believe and act as if they are reliable, neither we nor our agents have independently verified it. Governmental publications and other market sources, including those referred to above, generally state that their information was obtained from recognized and reliable sources, but the accuracy and completeness of that information is not guaranteed. In addition, the data that we compile internally, and our estimates have not been verified by an independent source. Except as disclosed in this annual report, none of the publications, reports or other published industry sources referred to in this annual report were commissioned by us or prepared at our request. Except as disclosed in this annual report, we have not sought or obtained the consent of any of these sources to include such market data in this annual report.
3
Table of Contents
Rounding
We have made rounding adjustments to some of the figures included in this annual report. Accordingly, numerical figures shown as totals in some tables may not be an arithmetic aggregation of the figures that preceded them.
4
Table of Contents
CAUTIONARY STATEMENT REGARDING FORWARD-LOOKING STATEMENTS
This annual report contains statements that constitute forward-looking statements. Many of the forward-looking statements contained in this annual report can be identified by the use of forward-looking words such as “anticipate,” “believe,” “could,” “expect,” “should,” “plan,” “intend,” “estimate” and “potential,” among others.
Forward-looking statements appear in a number of places in this annual report and include, but are not limited to, statements regarding our intent, belief or current expectations. Forward-looking statements are based on our management’s beliefs and assumptions and on information currently available to our management. Such statements are subject to risks and uncertainties, and actual results may differ materially from those expressed or implied in the forward-looking statements due to various factors, including, but not limited to, those identified under the section entitled “Item 3. Key Information—D. Risk Factors” in this annual report. These risks and uncertainties include factors relating to:
| • | general economic, financial, political, demographic and business conditions in Brazil, as well as any other countries we may invest and attract investors from in the future and their impact on our business; |
| • | fluctuations in interest, inflation and exchange rates in Brazil and any other countries we may serve in the future; |
| • | competition in the investment advisory and financial services industry; |
| • | our ability to implement our business strategy; |
| • | the investment performance of investment funds managed by our asset managers or by third parties; |
| • | the availability of government authorizations on terms and conditions and within periods acceptable to us; |
| • | our ability to continue attracting and retaining new appropriately skilled employees; |
| • | our capitalization and ability to fund new investments or integrate new acquisitions, including our pending business combination with Compass (see “Item 4. Information on the Company—A. History and Development of the Company—Recent Events—Business Combination with Compass”); |
| • | our ability to adapt to the rapid pace of technological changes in the financial services industry; |
| • | the interests of our controlling shareholder, Gilberto Sayão da Silva, who owns 100% of our outstanding Class B common shares, which represents approximately 75.6% of the voting power of our issued share capital; |
| • | changes in government regulations applicable to the financial services and insurance industries in Brazil and elsewhere; |
| • | our ability to compete and conduct our business in the future; |
| • | the success of operating initiatives, including advertising and promotional efforts and new product, service and concept development by us and our competitors; |
| • | changes in investors’ demands regarding investment products, customer experience related to investments and technological advances, and our ability to innovate to respond to such changes; |
| • | changes in labor, distribution and other operating costs; |
| • | our compliance with, and changes to, government laws, regulations and tax matters that currently apply to us; |
| • | the actual and potential effects of health crises and their potential to have an ongoing adverse impact on global, regional and national economies; |
5
Table of Contents
| • | other factors that may affect our financial condition, liquidity, and results of operations; and |
| • | other risk factors discussed under “Item 3. Key Information—D. Risk Factors.” |
Forward-looking statements speak only as of the date they are made, and we do not undertake any obligation to update them in light of new information or future developments or to release publicly any revisions to these statements in order to reflect later events or circumstances or to reflect the occurrence of unanticipated events.
6
Table of Contents
PART I
ITEM 1. IDENTITY OF DIRECTORS, SENIOR MANAGEMENT AND ADVISERS
| A. | Directors and Senior Management |
Not applicable.
| B. | Advisers |
Not applicable.
| C. | Auditors |
Not applicable.
ITEM 2. OFFER STATISTICS AND EXPECTED TIMETABLE
| A. | Offer Statistics |
Not applicable.
| B. | Method and Expected Timetable |
Not applicable.
ITEM 3. KEY INFORMATION
| A. | [Reserved] |
| B. | Capitalization and Indebtedness |
Not applicable.
| C. | Reasons for the Offer and Use of Proceeds |
Not applicable.
| D. | Risk Factors |
This section is intended to be a summary of more detailed discussions contained elsewhere in this annual report. You should carefully read and consider the following risks, along with the other information included in this annual report. The risks described below are not the only ones we face. Additional risks that we do not presently consider material, or of which we are not currently aware, may also affect us. Our business, results of operations or financial condition could be impacted if any of these risks materialize and, as a result, the market price of our common shares could be affected. The risks described below are organized by risk category and these categories are not presented in order of importance. However, within each category, the risk factors are presented in descending order of importance, as determined by us as of the date of this annual report. We may change our vision about their relative importance at any time, especially if new internal or external events arise.
Summary of Risk Factors
Risks Relating to Our Business and Industry
| • | Adverse market and economic conditions could reduce the value or performance of our funds. |
Our business and the businesses of the companies in which our funds invest are materially affected by financial markets and economic conditions or events throughout the world, such as interest rates, availability of credit, inflation rates, economic uncertainty, changes in laws, trade barriers and trade tension, commodity prices, currency exchange rates and controls and national and international political circumstances. Future market conditions may be less favorable compared to current and historical market conditions and we could suffer a decrease in our performance and management fees, and a decrease in investment income we earn from our proprietary investments.
7
Table of Contents
| • | Fluctuations in interest rates, exchange rates and benchmark indices could have an adverse effect on us. |
Certain of our funding costs and the returns on certain of our investment funds are tied to certain interest rate indices or other benchmark indices, such as the Brazilian long-term interest rates (taxa de juros de longo prazo or taxa de longo prazo), or the TJLP/TLP rates, the Brazilian interbank deposit rate (taxa de depósito interbancário), or the CDI Rate, the Brazilian basic interest rate (taxa SELIC), or the SELIC Rate, certain inflation indices and certain B3 indices. In addition, carrying costs and the returns on certain of our investment funds based in the United States are tied to or denominated in U.S. dollars, exposing us to risks associated with fluctuations in rate of exchange of U.S. dollars for Brazilian reais. We may not be able to adequately manage our exposure to these benchmarks, which could lead to increased funding costs, carrying costs or decreased returns for our funds, with a consequent adverse effect on our business, financial condition and results of operations.
| • | Substantial and increasingly intense competition within our industry may harm our business. |
The financial services market is highly competitive. Many of our competitors may have substantially greater resources than we do. These competitors may be able to offer more attractive fees to our current and prospective clients, especially our competitors that are affiliated with financial institutions. Competition could cause us to reduce the performance and management fees and financial services advisory fees we charge for our services and could also result in a loss of existing clients, and greater difficulty in attracting new clients.
| • | We may not be able to keep pace with rapid developments in our industry. |
The financial services market is characterized by rapid technological change, new product and service introductions, evolving industry standards, changing client needs and the entrance of non-traditional competitors. There can be no assurance that we will have the funds available to maintain the levels of investment required to support our projects, and if we are unable to develop, adapt to or take advantage of technological changes or evolving industry standards, our business, financial condition and results of operations could be materially adversely affected.
| • | We have identified material weaknesses in our internal control over financial reporting. |
In connection with the preparation of our consolidated financial statements for the years ended December 31, 2023 and 2022, we identified a number of material weaknesses in our internal control over financial reporting as of December 31, 2023 and 2022. The material weaknesses identified refer to our insufficient accounting processes necessary to comply with the reporting and compliance requirements of IFRS Accounting Standards and the U.S. Securities and Exchange Commission, or the SEC. We have a remediation plan to improve our internal control over financial reporting, but there is no assurance that our efforts will be effective or prevent any future material weaknesses in our internal control over financial reporting.
Risks Relating to the Compass Transaction
| • | We are subject to risks relating to the pending Compass Transaction. |
The risks arising out of our pending business combination with Compass include the following: our shareholders having reduced ownership and voting interest in and less influence over the combined company; disruptions in business relationships; prohibitions from entering into certain transactions and taking certain actions that might otherwise be beneficial to us until completion of the Compass Transaction; third parties terminating existing relationships with us or Compass; obtaining required approvals and satisfying closing conditions; potential termination of the Compass Transaction; difficulty attracting, motivating and retaining key employees; the incurrence of significant expenses; and the adequacy of our due diligence investigation of Compass.
| • | We are subject to risks relating to the combined company following closing of the Compass Transaction. |
The risks relating to the combined company following our business combination with Compass include the following: our failure to realize the anticipated benefits of the Compass Transaction; the incurrence of significant integration-related costs and realizing the synergies of the combined company; and different factors affecting the market price for our Class A common shares following the completion of the Compass Transaction.
8
Table of Contents
Risks Relating to Brazil and Latin America
| • | The Brazilian federal government has exercised significant influence over the Brazilian economy. |
The Brazilian federal government frequently exercises significant influence over the Brazilian economy and occasionally makes significant changes in policy and regulations. We have no control over and cannot predict what measures or policies the Brazilian government may take in the future. We and the market price of our Class A common shares may be harmed by changes in Brazilian government policies, as well as general economic factors.
| • | Economic uncertainty and political instability in Brazil may harm us. |
Brazil’s political environment has historically influenced, and continues to influence, the performance of the country’s economy. Political crises have affected and continue to affect the confidence of investors and the general public, which have historically resulted in economic deceleration and heightened volatility in the securities offered by companies with significant operations in Brazil. Ongoing political uncertainty could harm the Brazilian economy and, consequently, our business and the value of our investments, and could adversely affect our financial condition, results of operations and the price of our Class A common shares.
Risks Relating to Our Class A Common Shares
| • | The concentration of our ownership and voting power with Gilberto Sayão da Silva limits your ability to influence corporate matters. |
Gilberto Sayão da Silva controls our company through his beneficial ownership of all of our outstanding Class B common shares, representing 75.6% of the combined voting power of our issued share capital. So long as Mr. Sayão da Silva beneficially owns a sufficient number of Class B common shares, even if he beneficially owns significantly less than 50% of our outstanding share capital, he will be able to effectively control our decisions.
| • | As a Cayman Islands exempted company with limited liability, the rights of our shareholders may be different from the rights of shareholders governed by the laws of U.S. jurisdictions. |
Our corporate affairs are governed by our Articles of Association and by the laws of the Cayman Islands. The rights of shareholders and the responsibilities of members of our board of directors may be different from the rights of shareholders and responsibilities of directors in companies governed by the laws of U.S. jurisdictions. In particular directors of a Cayman Islands company owe fiduciary duties to the company and separately a duty of care, diligence and skill to the company, whereas under Delaware corporate law, a director has a fiduciary duty to the corporation and its stockholders.
Certain Risks Relating to Our Business and Industry
Difficult market and economic conditions can adversely affect our business in many ways, including by reducing the value or performance of the investments that we manage or by reducing the ability of our funds to raise or deploy capital, each of which could negatively impact our net income and cash flow and adversely affect our financial prospects and condition.
Our business and the businesses of the companies in which our funds invest are materially affected by financial markets and economic conditions or events throughout the world, such as interest rates, availability of credit, inflation rates, economic and political uncertainty, such as those deriving from the Brazilian government, changes in laws (including laws relating to taxation), trade barriers and trade tension (including between the United States and China), commodity prices, currency exchange rates and controls and national and international political circumstances (including wars, such as the ongoing war between Ukraine and Russia, the ongoing war between Israel and Hamas, terrorist acts or security operations). Future market conditions may be less favorable compared to current and historical market conditions. Adverse conditions in financial markets and the economy can adversely impact our results of operations and financial condition by decreasing our AUM (both directly through a decline in market value or through clients withdrawing investments) and thereby decrease our performance and management fees, as well as by decreasing the investment income we earn from our proprietary investments.
9
Table of Contents
Fluctuations in financial markets and economic conditions are outside our control and may affect the level and volatility of securities prices and liquidity and as a result, the value of our investments and our financial results. In addition, we may not be able to or may choose not to manage our exposure to these conditions and/or events. If not otherwise offset, declines in the equity, commodity and debt in the markets would likely cause us to write down our investments and the investments of our funds. Our profitability may also be materially and adversely affected by our fixed costs and the possibility that we would be unable to scale back other costs within a time frame sufficient to match any decreases in net income relating to a downturn in market and economic conditions.
Unfavorable market and economic conditions may reduce opportunities for our funds to make, exit and realize value from their investments. Challenging market and economic conditions, including those caused by changes in tax laws and other regulatory restrictions, may make it difficult for us to find suitable investments for our funds or secure financing for investments on attractive terms. Such conditions may also result in reduced opportunities for our funds to exit and realize value from their existing investments and lower-than-expected returns on existing investments. Throughout our history, we have exited our portfolio companies through a combination of routes, including selling to strategic buyers, carrying out sponsor to sponsor transactions and through public market exits, including through initial public offerings, or IPOs, and reverse mergers into listed companies. In challenging equity markets, our funds may experience greater difficulty in realizing value from investments. In addition, when financing is not available or becomes too costly, it is difficult for potential buyers to raise sufficient capital to purchase our funds’ investments. Consequently, we may earn lower-than-expected returns on investments, which could cause us to realize diminished or no performance fees, which are typically determined by reference to performance in excess of one or more specified benchmarks.
We generally raise capital for a successor fund following the substantial and successful deployment of capital from the existing fund. In the event of poor performance by existing funds, our ability to raise new funds is impaired. Our fundraising may also be negatively impacted by any change in or rebalancing of fund investors’ asset allocation policies. During periods of unfavorable fundraising conditions, fund investors may negotiate for lower fees, different fee sharing arrangements for transaction or other fees, and other concessions. The outcome of such negotiations could result in our agreement to terms that are materially less favorable to us than for prior funds we have managed. Our current funds, including all our recent private equity funds, have performance hurdles, which require us to generate a specified return on investment prior to our right to receive performance fees. This requirement will likely be in all our future funds, and the hurdle rate could increase for our future funds. In addition, successor funds raised by us when such unfavorable circumstances exist would also likely result in smaller funds than our comparable predecessor funds. Fund investors may also seek to redeploy capital away from certain of our credit or other non-private equity investment vehicles, which permit redemptions on relatively short notice, in order to meet liquidity needs or invest in other asset classes or with other managers. Any of these developments could materially and adversely affect our future revenues, net income, cash flow, financial condition or ability to retain our employees.
In addition, our ability to raise capital could be adversely affected by general conditions in the global economy and in the global financial markets, including as a result of the turmoil caused in the banking sector by current macroeconomic conditions. For example, on March 10, 2023, Silicon Valley Bank was closed by the California Department of Financial Protection and Innovation and the Federal Deposit Insurance Corporation was appointed receiver of Silicon Valley Bank. On March 11, 2023, Signature Bank was similarly closed and placed into receivership. Although we did not hold deposits at these financial institutions, our banking relationships and cash deposits could be adversely affected by the volatility in the U.S. banking system and our capital raising ability may be impacted by any downturn caused in the availability of liquidity caused by disruptions to the U.S. banking system or the banking system globally.
During periods of difficult market or economic conditions or slowdowns (which may occur across one or more industries, sectors or geographies), companies or assets in which we have invested may experience decreased revenues, financial losses, credit rating downgrades, difficulty in obtaining access to financing and increased funding costs. These companies may also have difficulty in expanding their businesses and operations or be unable to meet their debt service obligations or pay other expenses as they become due, including amounts payable to us. Negative financial results in our funds’ portfolio companies may result in lower investment returns for our
10
Table of Contents
investment funds, which could materially and adversely affect our operating results and cash flow. To the extent the operating performance of such portfolio companies (as well as valuation multiples) deteriorate or do not improve, our funds may sell those assets at values that are less than we projected or even at a loss, thereby significantly affecting those funds’ performance and consequently our operating results and cash flow and resulting in lower or no performance fees being paid to us. Adverse conditions may also increase the risk of default with respect to private equity, credit and other investments that we manage or the abandonment or foreclosure of our real asset investments. Even if economic and market conditions do improve broadly, adverse conditions in particular sectors may also cause our performance to suffer. In addition, low interest rates related to monetary stimulus, economic stagnation or deflation may negatively impact expected returns on all types of investments as the demand for relatively higher return assets increases and the supply decreases. As a result, adverse conditions in financial markets as described above, as well as lower level of transaction activities involving our funds’ investments, which can be unpredictable and outside our control, may negatively impact both the frequency and size of fees generated by our business.
Our performance is subject to the risks of the industries and businesses in which the portfolio companies of our investment funds operate.
Our performance directly ties-in to the payment of fund management and performance fees by our investment funds, which, in turn, are subject to a number of risks inherent to their operations and also to the risk of the businesses and industries in which the portfolio companies of such investment funds operate, as well as fees for advisory services, which are subject to transaction closings and realization of IPOs advised by Vinci Partners. Some of these industries are particularly noteworthy for the inherent risks therewith associated, such as infrastructure and real estate. These risks include but are not limited to, those associated with the burdens of ownership of real property, general and local economic conditions, changes in supply of and demand for competing properties in an area (as a result, for instance, of overbuilding), operating income, the financial resources of tenants, changes in building, environmental, zoning and other laws, casualty or condemnation losses, energy and supply shortages, various uninsured or uninsurable risks, natural disasters, changes in government regulations (such as rent control or operational licenses), changes in real property tax rates, changes in income tax rates, changes in interest rates, the reduced availability of mortgage funds which may render the sale or refinancing of properties difficult or impracticable, increased mortgage defaults, increases in borrowing rates, changes to the taxation of business entities and the deductibility of corporate interest expense or other applicable tax exemptions or benefits, negative developments in the economy that depress travel activity, environmental liabilities, contingent liabilities on disposition of assets, acts of god, terrorist attacks, war and other factors that are beyond our control. In addition, the acquisition of direct or indirect interests in undeveloped land or underdeveloped real property, which may often be non-income producing, is subject to the risks normally associated with such assets and development activities, including risks relating to the availability and timely receipt of zoning and other regulatory or environmental approvals and licenses, the cost and timely completion of construction (including risks beyond the control of our fund, such as weather or labor conditions or material shortages) and the availability of both construction and permanent financing on favorable terms. Additionally, the investment in energy, manufacturing, transportation, water and sanitation, and other infrastructure capital-intensive projects, as well as the development and operation of assets associated with real estate and certain other assets, may expose our investment funds, and, consequently, us, to increased environmental liabilities that are inherent in the ownership of such assets, which under the applicable laws may be imposed regardless of fault.
Changes in the debt financing markets may negatively impact the ability of our investment funds’ portfolio companies and strategies pursued with our balance sheet assets to obtain attractive financing for their investments or to refinance existing debt and may increase the cost of such financing or refinancing if it is obtained, which could lead to lower-yielding investments and potentially decrease our net income.
In the event that our portfolio companies regularly utilize the corporate debt markets in order to obtain financing for their operations, to the extent that credit markets render such financing difficult to obtain or more expensive, this may negatively impact the operating performance of those portfolio companies and, therefore, the investment returns on our funds. In addition, to the extent that conditions in the credit markets impair the ability of our portfolio companies to refinance or extend maturities on their outstanding debt, either on favorable terms or at all, the operating performance of those portfolio companies may be negatively impacted, which could impair the value of our investment in those portfolio companies and lead to a decrease in the investment income earned by us. In some cases, the inability of our portfolio companies to refinance or extend maturities may result in the inability of those companies to repay debt at maturity or pay interests when due, and may cause the companies to sell assets, undergo a recapitalization or seek bankruptcy protection, any of which would also likely impair the value of our investment and lead to a decrease in investment income earned by us.
11
Table of Contents
Our failure to comply with investment guidelines set by our clients could result in damage awards against us or a reduction in AUM, either of which would cause our earnings to decline and adversely affect our business and financial condition.
When clients retain us to manage assets on their behalf, they specify certain guidelines regarding investment allocation and strategy that we are required to observe in the management of their portfolios. Our failure to comply with these guidelines and other limitations could result in clients terminating their investment management agreement with us and forcing an early redemption of their investments in our funds, as these investment agreements generally are terminable without cause on 30 days’ notice, and/or permit our clients to force an early redemption of their investment without prior notice or on relatively short notice. Clients could also sue us for breach of contract and seek to recover damages from us. In addition, such guidelines may restrict our ability to pursue certain allocations and strategies on behalf of our clients that we believe are economically desirable, which could similarly result in losses to a client, early redemption of a client’s quota, or termination of the asset management agreement and a corresponding reduction in AUM. Even if we comply with all applicable investment guidelines, a client may be dissatisfied with its investment performance or our services or fees, and may terminate their asset management agreements, redeem their quotas or be unwilling to commit new capital to our specialized funds or separate management accounts. Any of these events could cause our earnings to decline and materially and adversely affect our business, financial condition and results of operations.
Fluctuations in interest rates, exchange rates and certain benchmark indices could impact our funding costs and the value of our funds, and fluctuations in these rates and benchmarks could adversely affect our funding costs and the returns on certain of our funds, which could have a material adverse effect on our funds’ liquidity, results of operations and financial condition.
Certain of our funding costs and the returns on certain of our investment funds are tied to certain interest rate indices or other benchmark indices, such as the TJLP/TLP rates, the CDI Rate, the SELIC Rate, certain inflation indices and certain B3 indices. In addition, carrying costs and the returns on certain of our investment funds based in the United States are tied to or denominated in U.S. dollars, exposing us to risks associated with fluctuations in rate of exchange of U.S. dollars for reais. We have no control over fluctuations in interest rates, market indices or exchange rates and we may not be able to adequately manage our exposure to these benchmarks, which could lead to increased funding costs, carrying costs or decreased returns for our funds, which would have a material adverse effect on our business, financial condition and results of operations. See “—Certain Risks Relating to Brazil—Inflation and certain measures by the Brazilian government to curb inflation have historically harmed the Brazilian economy and Brazilian capital markets, and high levels of inflation in the future would harm our business and the price of our Class A common shares” and “—We are exposed to fluctuations in foreign currency exchange rates and may enter into derivatives transactions to manage our exposure to exchange rate risk.”
We have significant liquidity requirements, and adverse market and economic conditions may adversely affect our sources of liquidity, which could adversely affect our financial condition and results of operations.
We expect that our primary liquidity needs will consist of cash required to:
| • | continue to grow our business lines, including seeding new strategies, funding our capital commitments made to existing and future funds (which, as of December 31, 2023, amounted to R$630.5 million), and otherwise supporting investment vehicles that we sponsor; |
| • | service any contingent liabilities that may give rise to future cash payments; and |
| • | fund cash operating expenses and contingencies, including for litigation matters. |
These liquidity requirements are significant and, in some cases, may require cash outlays over time or involve capital that will remain invested for extended periods of time. In the event that our liquidity requirements were to exceed available liquid assets for the reasons specified above or for any other reasons, there can be no assurance that we will be able to generate sufficient cash flows from realizations of investments to fund them, which could force us to sell assets or seek to raise debt or equity capital on unfavorable terms. For further discussion of our liquidity needs, see “Item 5. Operating and Financial Review and Prospects—Liquidity and Capital Resources.”
12
Table of Contents
Our earnings and cash flow are highly variable due to the nature of our business and we do not intend to provide earnings guidance, each of which may cause the value of interests in our business to be volatile.
Our earnings are highly variable from quarter to quarter due to the volatility of investment returns of most of our funds, other investment vehicles and our balance sheet assets and the transaction and other fees earned from our businesses. We recognize earnings on investments in our funds based on our allocable share of realized and unrealized gains (or losses) reported by such funds and for certain of our recent funds, when a performance hurdle is achieved. During times of market volatility, the fair value of our funds and our balance sheet assets are more variable, and as publicly traded equity securities currently represent a proportion of the assets of many of our funds and balance sheet assets, volatility in the equity markets may have a significant impact on our reported results. A decline in realized or unrealized gains, a failure to achieve a performance hurdle or an increase in realized or unrealized losses, would adversely affect our profit for the period.
Net revenue from fund management, net revenue from performance fees and net revenue from advisory services, which we recognize when contractually earned, can vary due to fluctuations in AUM, the number of investment transactions made by our funds, the number of portfolio companies we manage, the fee provisions contained in our funds and other investment products and transactions by our advisory services. In any particular quarter, fee income may vary significantly due to the variances in size and frequency of management and performance fees, or fees received for our advisory services. We may create new funds or investment products or vary the terms of our funds or investment products (for example our funds now include performance hurdles), which may alter the composition or mix of our income from time to time.
We may also experience fluctuations in our results from quarter to quarter, including our net revenue from services rendered and profit for the period, due to a number of other factors, including changes in the values of our funds’ investments, changes in the amount of distributions or interest earned in respect of investments, changes in the number of completed transactions (such as merger and acquisition, or M&A, transactions and/or initial public offerings, or IPOs) for our financial advisory clients, changes in our operating expenses, the degree to which we encounter competition and general market and economic conditions. Such fluctuations may lead to variability in the value of interests in our business and cause our results for a particular period not to be indicative of our performance in future periods. It may be difficult for us to achieve steady growth in net income and cash flow on a quarterly basis, which could in turn lead to large adverse movements in the value of interests in our business.
We are entitled to receive performance fees when the return on assets under management, over a given period established in each fund’s private memorandum, exceeds certain return benchmarks or other performance benchmarks. The timing and receipt of performance fees from our investment funds are unpredictable and will contribute to the volatility of our cash flows. Performance fee payments from investments depend on our funds’ performance and opportunities for realizing gains, which may be limited. It takes a substantial period of time to identify attractive investment opportunities, to raise all the funds needed to make an investment and then to realize the cash value (or other proceeds) of an investment through a sale, public offering or other exit. To the extent an investment is not profitable, no performance fees will be received from our funds with respect to that investment and, to the extent such investment remains unprofitable, we will only be entitled to a management fee on that investment. Furthermore, certain vehicles and separately managed accounts may not provide for the payment of any performance fees at all. Even if an investment proves to be profitable, it may be several years before any profits can be realized in cash. Performance allocations and incentive fees could be significantly reduced as a result of our inability to maximize the value of investments by an investment fund during the liquidation process or in the event of the triggering of a “clawback” obligation. We cannot predict when, or if, any realization of investments will occur. In addition, if finance providers, such as commercial and investment banks, make it difficult for potential purchasers to secure financing to purchase companies in our investment funds’ portfolio, it may decrease potential realization events and the potential to earn performance fees. A downturn in the equity markets would also make it more difficult to exit investments by selling equity securities. If we were to have a realization event in a particular quarter, the event may have a significant impact on our cash flows during the quarter that may not be replicated in subsequent quarters. A decline in realized or unrealized gains, or an increase in realized or unrealized losses, would adversely affect our investment income, which could further increase the volatility of our quarterly results.
13
Table of Contents
The timing and receipt of performance fees also vary with the life cycle of certain of our funds. Our performance-paying funds that have completed their investment periods and are able to realize mature investments, sometimes referred to as being in a “harvesting period,” are more likely to make larger distributions than our performance-paying funds that are in their fundraising or investment periods that precede the harvesting period. During times when a significant portion of our AUM is attributable to performance-paying funds that are not in their harvesting periods, we may receive substantially lower performance fee distributions.
Our investment management activities may involve investments in relatively high-risk, illiquid assets, and we and our clients may lose some or all of the amounts invested in these activities or fail to realize any profits from these activities for a considerable period of time.
The investments made by our funds may include high-risk, illiquid assets. We have made and expect to continue to make investments alongside our investors, as the general partner, in our existing funds and certain customized separate accounts and in any new private markets funds we may establish in the future. The private markets funds in which we invest capital generally invest in securities that are not publicly traded. Even if such securities are publicly traded, many of these funds may be prohibited by contract or applicable securities laws from selling such securities for a period of time. Such funds will generally not be able to sell these securities publicly unless their sale is registered under applicable securities laws, or unless an exemption from such registration requirements is available. Accordingly, the private markets funds in which we invest our clients’ capital may not be able to sell securities when they desire and therefore may not be able to realize the full value of such securities. The ability of private markets funds to dispose of investments is dependent in part on the public equity and debt markets, to the extent that the ability to dispose of an investment may depend upon the ability to complete an IPO of the portfolio company in which such investment is held or the ability of a prospective buyer of the portfolio company to raise debt financing to fund its purchase. Furthermore, large holdings of publicly traded equity securities can often be disposed of only over a substantial period of time, exposing the investment returns to risks of downward movement in market prices during the disposition period. Contributing capital to these funds is risky, and we may lose some or the entire amount of our specialized funds and our clients’ investments.
The portfolio companies in which private markets funds have invested or may invest will sometimes involve a high degree of business and financial risk. These companies may be in an early stage of development, may not have a proven operating history, may be operating at a loss or have significant variations in operating results, may be engaged in a rapidly changing business with products subject to a substantial risk of obsolescence, may be subject to extensive regulatory oversight, may require substantial additional capital to support their operations, to finance expansion or to maintain their competitive position, may have a high level of leverage, or may otherwise have a weak financial condition.
In addition, these portfolio companies may face intense competition, including competition from companies with greater financial resources, more extensive development, manufacturing, marketing, and other capabilities, and a larger number of qualified managerial and technical personnel. Our portfolio companies may be subject to additional risks, including changes in currency exchange rates, exchange control regulations, risks associated with different types (and lower quality) of available information, expropriation or confiscatory taxation and adverse political developments, which risks may be exacerbated for any portfolio companies that may be organized in jurisdictions outside of Brazil. In addition, during periods of difficult market conditions or slowdowns in a particular investment category, industry or region, portfolio companies may experience decreased revenues, financial losses, difficulty in obtaining access to financing and increased costs. During these periods, these companies may also have difficulty in expanding their businesses and operations and may be unable to pay their expenses as they become due. A general market downturn or a specific market dislocation may result in lower investment returns for the private markets funds or portfolio companies in which our specialized funds and customized separate accounts invest, which consequently would materially and adversely affect investment returns for our specialized funds and customized separate accounts. Furthermore, if the portfolio companies default on their indebtedness, or otherwise seek or are forced to restructure their obligations or declare bankruptcy, we could lose some or all of our investment and also suffer reputational harm.
14
Table of Contents
We may pursue investment opportunities that involve business, regulatory, legal or other complexities.
We may pursue investment opportunities that have unusually complex business, regulatory and/or legal aspects to them. This complexity presents risks, as such transactions can be more difficult, expensive and time-consuming to finance and execute, it can be more difficult to manage or realize value from the assets acquired in such transactions and such transactions sometimes involve a higher level of regulatory scrutiny or a greater risk of contingent liabilities. Any of these risks could materially and adversely affect our business, financial condition and results of operations.
Our funds may face risks relating to undiversified investments.
While we have a policy of maintaining diversification in accordance with fund objectives and, where applicable, mandatory fund allocation rules, there can be no assurance as to the degree of diversification, if any, that will be achieved in any fund investments. Difficult market conditions or slowdowns affecting a particular asset class, geographic region or other category of investment could have a significant adverse impact on a given fund if its investments are concentrated in that area, which would result in lower investment returns. Accordingly, a lack of diversification on the part of a fund could adversely affect its investment performance and, as a result, our business, financial condition and results of operations.
Investments by our funds may in many cases rank junior to investments made by other investors.
In many cases, the companies in which our funds invest have indebtedness or equity securities, or may be permitted to incur indebtedness or to issue equity securities, that rank senior to our clients’ investments in our specialized funds, customized separate accounts or advisory accounts. By their terms, these instruments may provide that their holders are entitled to receive payments of dividends, interest or principal on or before the dates on which payments are to be made in respect of our clients’ investments. Also, in the event of bankruptcy or liquidation of a company in which one or more of our funds hold an investment, holders of securities ranking senior to our clients’ investments would typically be entitled to receive payment in full before distributions could be made in respect of our clients’ investments. After repaying senior security holders, the company may not have any remaining assets to use for repaying amounts owed in respect of our clients’ investments. To the extent that any assets remain, holders of claims that rank equally with our clients’ investments would be entitled to share on an equal and ratable basis in distributions that are made out of those assets. Also, during periods of financial distress or following an insolvency, our ability to influence a company’s affairs and to take actions to protect investments by our funds may be substantially less than that of those holding senior interests, which could adversely affect our business, financial condition and results of operations.
Our funds may be forced to dispose of investments at a disadvantageous time.
Our funds may make investments of which they do not advantageously dispose of prior to the date the applicable fund is dissolved, either by expiration of such fund’s term or otherwise. Although we generally expect that our funds will dispose of investments prior to dissolution or that investments will be suitable for in-kind distribution at dissolution, we may not be able to do so. We have only a limited ability to extend the term of the fund with the consent of fund investors or the advisory board of the fund, as applicable, and therefore, we may be required to sell, distribute or otherwise dispose of investments at a disadvantageous time prior to dissolution. This would result in a lower than expected return on the investments and, perhaps, on the fund itself.
A decline in the pace or size of investment by our funds would reduce the revenues we receive from fees.
The performance fees (including realized and unrealized performance fees) and management fees that we earn are driven in part by the pace at which our funds make investments and the size of those investments. Any decline in that pace or the size of investments would reduce our revenue from transaction and management fees. Likewise, during an attractive selling environment, our funds may capitalize on increased opportunities to exit investments. Any increase in the pace at which our funds exit investments, if not offset by new commitments and investments, would reduce future management fees. Additionally, in certain of our funds that derive management fees only on the basis of invested capital, the pace at which we make investments, the length of time we hold such investment and the timing of disposition will directly impact our revenues. Many factors could cause such a decline in the pace of investment or the transaction and management fees we receive, including:
| • | the inability of our investment professionals to identify attractive investment opportunities; |
| • | competition for such opportunities among other potential acquirers; |
15
Table of Contents
| • | unfavorable market and economic conditions; |
| • | decreased availability of capital on attractive terms; |
| • | our failure to consummate identified investment opportunities because of business, regulatory or legal complexities and adverse developments in the Brazilian or global economy or financial markets; |
| • | default by the investors of our investment funds on their contractual obligation to pay-in capital calls as requested by us or the third-party managers with whom we invest, impairing the ability to deploy capital at the intended rate; |
| • | terms we may agree with or provide to our fund investors or investors in separately managed accounts with respect to fees such as increasing the percentage of transaction or other fees we may share with our fund investors; and |
| • | new regulations, guidance or other actions provided or taken by regulatory authorities. |
Given our focus on achieving investment performance that exceeds the performance of our main competitors, and on maintaining and strengthening investor relations, we may reduce our AUM, restrain its growth, reduce our fees or otherwise alter the terms under which we do business when we deem it in the best interests of our investors—even in circumstances where such actions might be contrary to the near-term interests of holders of our Class A common shares.
From time to time if we decide it is in the best interests of all stakeholders, we may take actions that could reduce the profits we could otherwise realize in the short term. While we believe that our commitment to treating our investors fairly is in the long-term interest of us and our shareholders, we may take actions that could adversely impact our short-term profitability, and there is no guarantee that such actions will benefit us in the long term. The means by which we seek to achieve investment performance that exceeds the performance of our main competitors in each of our strategies could include limiting the AUM in our strategies to an amount that we believe can be invested appropriately in accordance with our investment philosophy and current or anticipated economic and market conditions. Additionally, we may voluntarily reduce management fee rates and terms for certain of our funds or strategies when we deem it appropriate, even when doing so may reduce our short-term revenue. For instance, in order to enhance our relationship with certain fund investors, we have reduced management fees or ceased charging management fees on certain funds in specific instances. In certain investment funds, we have agreed to charge management fees based on invested capital or net asset value as opposed to charging management fees based on committed capital.
We have increasingly undertaken business initiatives to increase the number and type of investment products we offer to retail investors, which could expose us to new and greater levels of risk.
Although retail investors have been part of our historic distribution efforts, we have increasingly undertaken business initiatives to increase the number and type of investment products we offer to high net worth individuals, family offices and other mass affluent investors. In some cases, we seek to distribute our funds to such retail investors indirectly through feeder funds sponsored by brokerage firms, private banks or third party feeder providers, and in other cases directly to the qualified clients of private banks, independent investment advisors and brokers. In other cases, we create investment funds specifically designed for direct investment by retail investors. Our initiatives to access retail investors entail the investment of resources and our objectives may not be fully realized.
Accessing retail investors and selling retail directed products exposes us to new and greater levels of risk, including heightened litigation and regulatory enforcement risks. To the extent we distribute retail products through new channels, including through unaffiliated firms such as digital distribution platforms, we may not be able to effectively monitor or control the manner of their distribution, which could result in litigation against us, including with respect to, among other things, claims that products distributed through such channels are distributed to customers for whom they are unsuitable or distributed in any other inappropriate manner. Although we seek to ensure through due diligence and onboarding procedures that the channels through which retail investors access our investment products conduct themselves responsibly, to the extent that our investment products are being distributed through third parties, we are exposed to reputation damage and possible legal liability to the extent such third parties
16
Table of Contents
improperly sell our products to investors. Similarly, the hiring of employees to oversee independent advisors and brokers presents risks if they fail to follow training, review and supervisory procedures. In addition, the distribution of retail products through new channels whether directly or through market intermediaries could expose us to additional regulatory risk in the form of allegations of improper conduct and/or actions by regulators against us with respect to, among other things, product suitability, conflicts of interest and the adequacy of disclosure to customers to whom our products are distributed through those channels.
Our inability to raise additional or successor funds (or raise successor funds of a size comparable to our predecessor funds) could have a material adverse impact on our business.
Our current private equity funds and certain other funds and investment vehicles have a finite life and a finite amount of commitments from fund investors. Once a fund nears the end of its investment period, our success depends on our ability to raise additional or successor funds in order to keep making investments and, over the long term, earning management fees (although our funds and investment vehicles continue to earn management fees after the expiration of their investment periods, they are generally at a reduced rate). Even if we are successful in raising successor funds, to the extent we are unable to raise successor funds of a size comparable to our predecessor funds or the extent that we are delayed in raising such successor funds, our revenues may decrease as the investment periods of our predecessor funds expire and associated fees decrease. The performance of our funds also impacts our ability to raise capital, and deterioration in the performance of our funds would result in challenges with regard to future fundraising. The evolving preferences of our fund investors may necessitate that alternatives to the traditional investment fund structure, such as separately managed accounts, smaller funds and co-investment vehicles, become a larger part of our business going forward. This could increase our cost of raising capital at the scale we have historically achieved. Furthermore, in order to raise capital for new strategies and products without drawing capital away from our existing products, we will need to seek new sources of capital such as individual investors.
Our ability to raise new funds could also be hampered if the general appeal of private equity and alternative investments were to decline. An investment in a limited partner interest in a private equity fund is less liquid than an exchange-traded instrument and the returns on such investment may be more volatile than returns on an investment in securities for which there is a more active and transparent market. Private equity and alternative investments could fall into disfavor as a result of concerns about liquidity and short-term performance. Institutional investors in private equity funds that have suffered from decreasing returns, liquidity pressure, increased volatility or difficulty maintaining target asset allocations may materially decrease or temporarily suspend making new investments in private equity funds. Such concerns could be exhibited, in particular, by public pension funds, which have historically been among the largest investors in alternative assets. Many public pension funds are significantly underfunded and their funding problems have been, and may in the future be, exacerbated by economic downturns. Concerns with liquidity could cause such public pension funds to reevaluate the appropriateness of alternative investments, and other institutional investors may reduce their overall portfolio allocations to alternative investments. This could result in a smaller overall pool of available capital in our industry. There is no assurance that the amount of commitments investors are making to alternative investment funds will continue at recent levels or that our ability to raise capital from investors will not be hampered.
In addition, the asset allocation rules or regulations or investment policies to which such third-party investors are subject could inhibit or restrict the ability of third-party investors to make investments in our investment funds. Coupled with a lack of distributions from their existing investment portfolios, many of these investors may have been left with disproportionately outsized remaining commitments to, and invested capital in, a number of investment funds, which may significantly limit their ability to make new commitments to third-party managed investment funds such as those advised by us.
Fund investors may also seek to redeploy capital away from certain of our credit or other non-private equity investment vehicles, which permit redemptions on relatively short notice in order for investors to meet liquidity needs or invest in other asset classes. We believe that our ability to avoid excessive redemption levels primarily depends on our funds’ continued satisfactory performance, although redemptions may also be driven by other factors important to our fund investors, including their need for liquidity and compliance with investment mandates, even if our performance is superior. Investors’ liquidity needs tend to be more pronounced during periods of market volatility. Any such redemptions would decrease our AUM and revenues.
17
Table of Contents
The number of funds raising capital varies from year to year, and in years where relatively few funds are raising capital, the growth of our AUM and associated fees may be significantly lower. There is no assurance that the raising of funds for new strategies or successor funds will experience success similar to our existing or predecessor funds in the future.
If we cannot make the necessary investments to keep pace with rapid developments and change in our industry, the use of our services could decline, reducing our revenues.
The financial services market in which we compete is subject to rapid and significant changes. This market is characterized by rapid technological change, new product and service introductions, evolving industry standards, changing client needs and the entrance of non-traditional competitors. In order to remain competitive and maintain and enhance customer experience and the quality of our services, we must continuously invest in projects to develop new products and features. These projects carry risks, such as cost overruns, delays in delivery, performance problems and lack of client adoption. There can be no assurance that we will have the funds available to maintain the levels of investment required to support our projects, and any delay in the delivery of new services or the failure to differentiate our services or to accurately predict and address market demand could render our services less desirable, or even obsolete, to our clients.
In addition, the services we deliver are designed to process highly complex transactions and provide reports and other information concerning those transactions, all at high volumes and processing speeds. Any failure to deliver an effective and secure service, or any performance issue that arises with a new service, could result in significant processing or reporting errors or other losses. As a result of these factors, our development efforts could result in increased costs and/or we could experience a loss in business that could reduce our earnings or could cause a loss of revenue if promised new services are not timely delivered to our clients or do not perform as anticipated. We also rely in part, and may in the future rely in part, on third parties for the development of, and access to, new technologies. Our future success will depend in part on our ability to develop or adapt to technological changes and evolving industry standards. We cannot predict the effects of technological changes on our business. If we are unable to develop, adapt to or take advantage of technological changes or evolving industry standards on a timely and cost-effective basis, our business, financial condition and results of operations could be materially adversely affected.
Furthermore, our competitors may have the ability to devote more financial and operational resources than we can to the development of new technologies and services that provide improved functionality and features to such competitors’ existing service offerings. If successful, their development efforts could render our services less desirable to clients, resulting in the loss of clients or a reduction in the performance and management fees and financial services advisory fees we could generate from our service offerings, which could adversely affect our business, financial condition and results of operations.
The success of our business depends on the identification and availability of suitable investment opportunities for our clients.
Our success largely depends on the identification and availability of suitable investment opportunities for our clients. The availability of investment opportunities will be subject to market conditions and other factors outside of our control and the control of the fund managers with which we invest. Past returns of our funds have benefited from investment opportunities and general market conditions that may not continue or reoccur, including favorable borrowing conditions in the debt markets, and there can be no assurance that our funds, or the underlying funds in which we invest, will be able to avail themselves of comparable opportunities and conditions. There can also be no assurance that the private markets funds we manage will be able to identify sufficient attractive investment opportunities to meet their investment objectives. Further, the due diligence investigations we conduct before investments are made by our funds may not uncover all facts relevant to the suitability of such opportunities. See “—Our due diligence processes for investments may not reveal all relevant facts and potential liabilities, which could result in a material adverse effect on our business and financial condition.”
18
Table of Contents
Substantial and increasingly intense competition within our industry may harm our business.
The financial services market is highly competitive. Our growth will depend on a combination of the continued expansion of the financial services we offer and our ability to increase our market share. Our primary competitors include other alternative investment advisors as well as traditional financial services providers such as affiliates of financial institutions and well-established financial services companies in Brazil and in Latin America. In addition, although we do not compete directly for international capital with U.S. and European alternative asset managers in fundraising, our ability to raise international institutional capital for certain Private Markets strategies could be adversely affected by globally challenging market conditions. We also face competition from non-traditional financial services providers that have significant financial resources and develop different kinds of services.
Many of our competitors may have substantially greater financial, technological, operational and marketing resources than we do. Accordingly, these competitors may be able to offer more attractive fees to our current and prospective clients, especially our competitors that are affiliated with financial institutions. If competition causes us to reduce the performance and management fees and financial services advisory fees we charge for our services, we will need to aggressively control our costs in order to maintain our profit margins and our revenues may be adversely affected. Moreover, we may not be successful in reducing or controlling costs and our margins may be adversely affected. In particular, we may need to reduce the performance and management fees and financial services advisory fees we charge in order to maintain market share, as clients may demand more customized and favorable pricing from us. We may also decide to terminate client relationships which may no longer be profitable to us due to such pricing pressure. Competition could also result in a loss of existing clients, and greater difficulty in attracting new clients. One or more of these factors could have a material adverse effect on our business, financial condition and results of operations. For further information regarding our competition, see “Item 4. Information on the Company—Business Overview—Competition.”
Client attrition could cause our revenues to decline and the degradation of the quality of the products and services we offer, including support services, could adversely impact our ability to attract and retain clients and partners.
We experience client attrition resulting from several factors, including, among others, closures of businesses of our clients, transfers of investments to our competitors and lack of client satisfaction with investment returns and overall customer relationship and investor experience. We cannot predict the level of attrition in the future and our revenues could decline as a result of higher-than-expected attrition, which could have a material adverse effect on our business, financial condition and results of operations. Furthermore, should we not be successful in selling additional solutions or investment opportunities to our clients, we may fail to achieve our desired rate of growth.
Moreover, our clients expect a consistent level of quality on our investment platform. If the reliability, performance or functionality of our products and services is compromised or the quality of those products or services is otherwise degraded, we could lose existing clients and find it harder to attract new clients and partners, which could adversely affect our business, financial condition and results of operations.
Poor performance by our funds may adversely affect our brand and reputation, the performance fees and investment income received by us, and our growth and ability to raise capital for future funds.
In the event that our funds were to perform unsatisfactorily, in particular if this were the case for a larger fund, this may lead to difficulties for Vinci Partners in attracting fund investors and raising capital for new funds in the future. Poor performance by our funds could also result in a reduction in the performance fees expected to be received by us and the amount of performance fees ultimately received by us or could even result in us receiving no performance fees at all. Fund investors in future Vinci Partners funds may negotiate a lower management fee or a lower allocation of performance fees and investment income to us and the economic terms of our future funds may be less favorable to us than those of existing Vinci Partners funds.
The performance of our funds is always measured against the performance of competitors’ funds and public markets performance, and there is subsequently a risk that, even if our funds perform in line with expectations, where our competitors’ funds or public markets perform better by comparison, this may have an adverse effect on Vinci Partners’ ability to retain or attract fund investors and further adversely affect our ability to negotiate management fee rates or other economic terms of our future funds.
The performance of our funds could be adversely affected by a number of factors, for instance if competition for investment opportunities, on which a particular Vinci Partners fund is focused, increases. Competition for investment opportunities is based primarily on the ability to source such investment opportunities, the pricing, terms and structure of a proposed investment and the certainty of execution. Competition for investment opportunities is also influenced by our funds’ historical returns. For example, a Vinci Partners fund may be chosen as the preferred
19
Table of Contents
acquirer because of our history even where competitors are on equal or better footing in terms of pricing at the time of investment; conversely, a Vinci Partners fund may lose out on a potential investment if Vinci Partners was damaged by poor performance, even where a Vinci Partners fund offered better pricing terms than its competitors. Our funds may have been created under different organizational structures with the result that applicable laws and investment limitations might differ from current or future funds. Further, there is a risk that current and future Vinci Partners funds will not benefit from investment opportunities and general market conditions from historical periods. In addition, Vinci Partners funds could also generate lower returns on investments or experience increased risks of investment losses in situations where Vinci Partners offers more aggressive terms for certain investment opportunities when participating in competitive sales processes.
We are subject to risks relating to the dilution of our corporate culture and Brazilian heritage.
We have a strong corporate culture and continuously work to uphold this corporate culture within our organization. Our growth across new product offerings, investment opportunities, asset classes and markets may lead to organizational and cultural challenges. Without the existence of thoughtful strategies aimed at maintaining corporate culture despite rapid growth, there is a risk that our corporate culture will be diluted, and our values will change over time. Our focus on our personnel has further been decisive in retaining employees and maintaining good organizational health.
Dilution of our corporate culture and of our Brazilian heritage may lead to key employees leaving us, a change in our leadership style or additional strain on our ability to successfully integrate new employees, new systems or other resources. If we do not uphold our corporate culture, this may also adversely affect our ability to retain and recruit investment advisory professionals and other key personnel. Our personnel is our most important asset, and a dilution of our corporate culture could have a material adverse effect on our continued development, which could adversely affect our business, financial condition and results of operations.
Changed trends in the Brazilian and in the global savings markets or in the private markets industry may adversely affect us.
We are affected by trends in the market for management of savings assets, which market has grown significantly in recent years. Growth has been primarily driven by investment returns, most notably rising equity market values. However, net inflows have made an increasing contribution towards overall growth in industry-wide AUM in recent years.
From October 2016 to March 2021, the Brazilian basic interest rate, known as the SELIC Rate, fell from a nominal 14.25% per year to as low as 2.00%. This rapid and significant drop in the SELIC Rate initiated a never-before-seen migration of capital flows to alternative asset management products, accelerating the migration of retail and institutional investors in Brazil from fixed-income products to alternative investments, such as ours. However, with the subsequent global economic recovery , and as a result of disruptions in global supply chains, commodity prices (and prices generally) increased significantly in 2022 and 2023, leading to a global increase in inflation, and in Brazil in particular. This led the Brazilian Central Bank to repeatedly raise the SELIC Rate throughout 2021 and 2022 to 13.75% as of December 31, 2022, in an attempt to curb rising inflation. On August 2023, the Brazilian Central Bank started cutting the SELIC rate as a result of a slowdown in inflation, and the SELIC Rate was set to 11.75% as of December 31, 2023. The Focus report, a summary of market expectations collected by the Brazilian Central Bank and released on February 23, 2024, pointed to further SELIC Rate cuts in 2024, with an expectation that it would reach 9.0% by the end of 2024.
In the year ended December 31, 2023, we posted a positive performance despite persistently high interest rates. The aforementioned nominal rates translate into real rates at around 7.5% (one-year nominal rate deflated by market expectations for inflation in the next 12 months). The neutral real interest rate in Brazil is estimated to be approximately 5.0%, which means that the current rate is already at a level poised to reduce inflation in due course. Market expectations compiled by the Brazilian Central Bank’s Focus survey point to interest rates and inflation dropping in the coming years. As the environment of lower SELIC Rates resumes in the future, we expect to continue drawing retail investors to alternative asset classes; we also believe the share of investment from Brazilian institutional investors in listed funds, which is currently low, may increase significantly in the coming years, which could continue to support the potential growth in this asset class.
20
Table of Contents
If, contrary to current market expectations based on the Focus survey, basic interest rates are further increased, this could result in a significant slowdown in our AUM growth and could necessitate a shift by us to investments in other asset classes or change our mix of investments, and we may not be able to generate the same investment returns that we have generated historically, or could experience a loss on in investments in real terms. In addition, if the positive trends in the asset management industry do not continue or if the industry were to be subject to negative trends, this may impede our ability to raise capital for new funds. Furthermore, fund investors’ investment returns can be impacted by overall public share prices and a decrease in share prices may affect our funds’ returns to fund investors.
We believe that the overall macroeconomic environment remains favorable for our business, driving migration toward alternative investments, such as those that we offer. There is a risk, however, that, in the future, fund investors may, for instance due to an overall downturn in the public markets, end up over-allocated to private markets, which in turn could have a negative impact on our ability to raise capital for new funds. This may also lead to increased competition from new entrants and established players, making it more difficult for us to source suitable investment opportunities for our funds. For example, within the private equity sector, competitors include Advent International Ltd., Patria Investments Ltd., Kinea Investimentos Ltda. and Kinea Private Equity Investimentos S.A. (which we refer to together as Kinea). Within the infrastructure sector, competitors include Patria and Perfin Administração de Recursos Ltda. Within the real estate sector, competitors include Kinea, XP Inc., Banco BTG Pactual S.A. and Credit Suisse Hedging-Griffo (through Credit Suisse Hedging-Griffo Wealth Management S.A. and Credit Suisse Hedging-Griffo Corretora de Valores S.A.), which is set to be acquired by Patria Investments Ltd. Within the credit sector our main competitors are the large Brazilian banks, including Itau Unibanco S.A., Banco Bradesco S.A., Banco do Brasil and Banco Santander (Brasil) S.A., and investment platforms tied to other financial institutions, including Kinea, XP Inc. and Banco BTG Pactual S.A. Our Financial Advisory Services compete against those of local and international boutique mergers and acquisitions advisory firms. Alternatively, for a variety of reasons, fund investor sentiment may turn against private markets investing. For example, the returns generated by private markets may decline, and other asset classes or investment opportunities may be perceived to offer superior returns. Certain institutional fund investors are also demonstrating a preference to “in-source” their own investment advisory professionals. Such institutional investors may cease to invest in, or reduce their allocations to, our funds, as well as potentially become competitors of Vinci Partners and our funds, all of which could adversely affect our earning potential.
To meet the demands of fund investors, we have a multi-strategy Private Markets platform including private equity, real estate, infrastructure, credit and special situations, enabling fund investors to simplify their investment manager relationships by investing across multiple investment strategies with the same manager. If fund investor requirements and preferences change, this could adversely affect the level of interest for investing in specific asset classes or investing in our funds. Such changes may impede our ability to raise capital for new funds, which could adversely affect our business, financial condition and results of operations.
We may face damage to our professional reputation and legal liability if our services are not regarded as satisfactory or for other reasons.
As an asset management firm, we depend to a large extent on our relationships with our clients and our reputation for integrity and high-caliber professional services to attract and retain clients. As a result, if a client is not satisfied with our services, such dissatisfaction may be more damaging to our business than to other types of businesses.
In recent years, the volume of claims and amount of damages claimed in litigation and regulatory proceedings against financial advisors has been increasing. Our asset management and advisory activities may subject us to the risk of significant legal liabilities to our clients and third parties, including our clients’ stockholders or beneficiaries, under securities or other laws and regulations for materially false or misleading statements made in connection with securities and other transactions. In our investment management business, we make investment decisions on behalf of our clients that could result in substantial losses. Any such losses also may subject us to the risk of legal and regulatory liabilities or actions alleging negligent misconduct, breach of fiduciary duty or breach of contract. Moreover, litigation risk may also arise from a perception from investors that any investment opportunity identified by us that is appropriate for two or more investment funds in a manner that excludes one or more funds or results in a disproportionate allocation based on factors or criteria that we determine is inconsistent with the fiduciary obligations of our subsidiaries under applicable law, governing fund agreements or Vinci Partners’ own policies.
21
Table of Contents
These risks often may be difficult to assess or quantify and their existence and magnitude often remain unknown for substantial periods of time. We may incur significant legal expenses in defending litigation. In addition, negative publicity and press speculation about us, our investment activities or the private markets in general, whether or not based in truth, or litigation or regulatory action against us or any third-party managers with whom we invest directly or indirectly involving us may tarnish our reputation and harm our ability to attract and retain clients. Substantial legal or regulatory liability could materially and adversely affect our business, financial condition or results of operations or cause significant reputational harm to us, which could seriously harm our business.
Climate change and climate change-related regulation could adversely affect our business.
We and our portfolio companies face risks associated with climate change, including risks related to the impact of climate change and environmental, social and governance matters, or ESG matters, including climate change and ESG legislation and regulation (both domestically and internationally), risks related to climate-related business trends, and risks stemming from the physical impacts of climate change. New climate change-related regulations or interpretations of existing laws may result in enhanced disclosure obligations, which could negatively affect us or our portfolio companies and materially increase our regulatory burden. Increased regulations generally increase our costs, and we could continue to experience higher costs if new laws require us to spend more time, hire additional personnel or buy new technology to comply effectively. At the portfolio company level, there are still individual portfolio companies in these and other sectors that could face transition risk if carbon-related regulations or taxes are implemented. Further, advances in climate science may change society’s understanding of sources and magnitudes of negative effects on climate, which could negatively impact portfolio company financial performance and regulatory jeopardy.
In addition, we face business trend-related climate risks including the increased attention to climate-related legislation and regulation by our fund investors. Certain fund investors have considered ESG factors, including climate risks, in determining whether to invest in our funds. See “—We are subject to increasing scrutiny from certain investors with respect to the ESG impact of investments made by our funds, which may constrain capital deployment opportunities for our funds and adversely impact our ability to raise capital from such investors.” For our portfolio companies, business trends related to climate change may require capital expenditures, product or service redesigns, and changes to operations and supply chains to meet changing customer expectations. While this can create opportunities, not addressing these changed expectations could create business risks for portfolio companies, which could negatively impact the returns in our funds.
Further, significant physical effects of climate change, including extreme weather events such as hurricanes, floods or droughts, can also have an adverse impact on certain of our portfolio companies and investments, especially our real asset investments and portfolio companies that rely on physical factories, plants or stores located in the affected areas. As the effects of climate change increase, we expect the frequency and impact of weather and climate-related events and conditions to increase as well. For example, unseasonal or violent weather events can have a material impact to businesses or properties that focus on tourism or recreational travel. While the geographic distribution of our portfolio inherently limits our physical climate risk, some physical risk is inherent in the companies in our portfolio given the unknown potential for extreme weather that could occur related to climate change.
Moreover, Regulation (EU) 2019/2088 on the EU Sustainable Finance Disclosure Regulation came into force on March 10, 2021 and was further supplemented by Level 2 Regulatory Technical Standards that came into force on 1 January 2023 (together, the “SFDR”). The SFDR imposes disclosure requirements on “financial market participants,” which include alternative investment fund managers, or “AIFMs,” authorized under the Alternative Investment Fund Managers Directive, in respect of “financial products”, which include alternative investment funds, or “AIFs.” In particular, the disclosures obligations under the SFDR consist of entity (e.g., AIFM)-level disclosures and product (e.g., AIF or portfolio)-level disclosures. Such disclosure must be made variously in pre-contractual information to investors, in periodic investor reports and publicly on firms’ websites. Furthermore, the SFDR imposes additional disclosure obligations for: (i) Article 8 products (products that promote environmental or social characteristics, colloquially known as “light green funds”); and (ii) Article 9 products (products that have sustainable investment as their objective, colloquially known as “dark green funds”). Vinci Impact Climate Change fund, or VICC, is a non-EU AIFM, and, as a result, pursuant to the SFDR, we are required to, among other things, prepare entity-level disclosures, and product-level disclosures and periodic reports in respect of its AIFs. Accordingly, the provisions of the SFDR may affect the fundraising process for VICC and for Vinci Impact and Return V fund with European limited partners, and may impose additional operating costs on us, which may be borne by the AIFs.
22
Table of Contents
As of the date of this annual report, we believe that VICC’s AIFs promote environmental and/or social characteristics and, therefore, we intend to comply with the disclosure requirements that are applicable to Article 8 and Article 9 funds under the SFDR. Nonetheless, we may be subject to regulatory action or financial penalties if VICC fails to comply with applicable requirements under the SFDR, such as the suspension of VICC’s activities or the invalidation of its SFDR classification, which would cause VICC to no longer be able to present itself as a sustainable investment. Our failure to adequately or accurately disclose information in relation to the environmental or social characteristics, or any sustainable investment objective, of its AIFs could expose us to litigation or other legal or regulatory actions.
We are subject to increasing scrutiny from certain investors with respect to the ESG impact of investments made by our funds, which may constrain capital deployment opportunities for our funds and adversely impact our ability to raise capital from such investors.
In recent years, certain investors, especially pension funds, have placed increasing importance on the negative impacts of investments made by the private equity and other funds to which they commit capital, including with respect to ESG matters. Certain investors have also demonstrated increased activism with respect to existing investments, including by urging asset managers to take certain actions that could adversely impact the value of an investment, or refrain from taking certain actions that could improve the value of an investment. At times, investors have conditioned future capital commitments on the taking or refraining from taking of such actions. Increased focus and activism related to ESG and similar matters may constrain our capital deployment opportunities, and the demands of certain investors may further limit the types of investments that are available to our funds. In addition, investors may decide to withdraw previously committed capital from our funds (where such withdrawal is permitted) or to not commit capital to future fundraises as a result of their assessment of our approach to and consideration of the social cost of investments made by our funds. To the extent our access to capital from investors, including pension funds, is impaired, we may not be able to maintain or increase the size of our funds or raise enough capital for new funds, which may adversely impact our revenues.
Unauthorized disclosure, destruction or modification of data, through cybersecurity breaches, computer viruses or otherwise, or disruption of our services could expose us to liability and protracted and costly litigation and damage our reputation.
Our business involves the collection, storage, processing and transmission of customers’ personal data, including names, addresses, identification numbers, bank account numbers and trading and investment portfolio data. An increasing number of organizations, including large clients and businesses, other large technology companies, financial institutions and government institutions, have disclosed breaches of their information technology systems, some of which have involved sophisticated and highly targeted attacks, including on portions of their websites, networks or infrastructure, or those of third parties who provide services to them. We could also be subject to breaches of security by hackers. Threats may derive from human error, fraud or malice on the part of employees or third-party service providers, or may result from accidental technological failure. Concerns about security are increased when we transmit information. Electronic transmissions can be subject to attack, interception or loss. Also, computer viruses and malware can be distributed and spread rapidly over the internet and could infiltrate our systems or those of our associated participants, which can impact the confidentiality, integrity and availability of information, and the integrity and availability of our products, services and systems, among other effects. Denial of service or other attacks could be launched against us for a variety of purposes, including interfering with our services or creating a diversion for other malicious activities. These types of actions and attacks could disrupt our delivery of products and services or make them unavailable, which could damage our reputation, force us to incur significant expenses in remediating the resulting impacts, expose us to uninsured liability, subject us to lawsuits, fines or sanctions, distract our management or increase our costs of doing business.
In the scope of our activities, we share information with third parties, commercial partners, third-party service providers and other agents, who collect, process, store and transmit sensitive data, and we may be held responsible for any failure or cybersecurity breaches attributed to these third parties insofar as they relate to the information we share with them. The loss, destruction or unauthorized modification of data by us or such third parties or through systems we provide could result in significant fines, sanctions and proceedings or actions against us by governmental bodies or third parties, which could have a material adverse effect on our business, financial condition and results of operations. Any such proceeding or action, and any related indemnification obligation, could damage our reputation, force us to incur significant expenses in defense of these proceedings, distract our management, increase our costs of doing business or result in the imposition of financial liability.
23
Table of Contents
Our encryption of data and other protective measures may not prevent unauthorized access to or use of sensitive data. A breach of our system or of the system of one of our commercial partners or third-party service providers may subject us to material losses or liability, including fines. A misuse of such data or a cybersecurity breach could harm our reputation and deter clients from using our products and services, thus reducing our revenues. In addition, any such misuse or breach could cause us to incur costs to correct the breaches or failures, expose us to uninsured liability, increase our risk of regulatory scrutiny, subject us to lawsuits, and result in the imposition of material penalties and fines under state and federal laws or regulations.
We cannot assure you that there are written agreements in place with every third party or that such written agreements will prevent the unauthorized use, modification, destruction or disclosure of data or enable us to obtain reimbursement from such third parties in the event we should suffer incidents resulting in unauthorized use, modification, destruction or disclosure of data. Any unauthorized use, modification, destruction or disclosure of data could result in protracted and costly litigation, which could have a material adverse effect on our business, financial condition and results of operations.
Cybersecurity incidents are increasing in frequency and evolving in nature and include, but are not limited to, installation of malicious software, unauthorized access to data and other electronic security breaches that could lead to disruptions in systems, unauthorized release of confidential or otherwise protected information and the corruption of data. Given the unpredictability of the timing, nature and scope of information technology disruptions, there can be no assurance that the procedures and controls we employ will be sufficient to prevent security breaches from occurring and we could be subject to the manipulation or improper use of our systems and networks or financial losses from remedial actions, any of which could have a material adverse effect on our business, financial condition and results of operations.
We are subject to risks related to noncompliance with data protection laws and the new Brazilian General Data Protection Law, which provides for application of sanctions, including financial penalties, in case of noncompliance.
In 2018, the President of Brazil approved Brazilian Law No. 13,709/2018, named the General Personal Data Protection Law (Lei Geral de Proteção de Dados), or the LGPD, which came into force on September 18, 2020, a comprehensive data protection law establishing the general principles and obligations that apply across multiple economic sectors and contractual relationships. The LGPD establishes detailed rules for the collection, use, processing and storage of personal data in all economic sectors, regardless of whether data is collected in a digital or physical environment. Certain aspects of the LGPD will be subject to further regulation to be enacted by the National Data Protection Authority and should result in changes to the LGPD’s approach that are not yet defined as of the date of this annual report.
Moreover, the administrative sanctions provisions of LGPD became enforceable as of August 1, 2021, pursuant to Law No. 14,010/2020. In the event of a violation of the LGPD, we may be subject to (1) legal notices and the required adoption of corrective measures, (2) fines of up to 2% of the our or our economic group’s revenues up to a limit of R$50.0 million per infraction, (3) publication of the infraction following confirmation of its occurrence, (4) the blocking and erasing of personal data involved in the infraction, (5) partial or complete suspension of the infringing processing activities for up to one year and (6) partial or complete prohibition to engage in processing activities. Moreover, we may be liable for property, moral, individual or collective damages caused by us, including by third party providers that process personal data for us, and jointly liable for property, moral, individual or collective damages caused by our subsidiaries, due to non-compliance with the obligations established by the LGPD and certain other sector-specific laws and regulations on data protection still in force. If we are unable to use sufficient measures to protect the personal data we manage and store or to maintain compliance with the LGPD, we may incur material costs which could have an adverse effect in our reputation and results of operations. Moreover, we may be held liable for material, punitive, individual or collective damages to the data subjects due to its processing and treatment and could be held individually or severally responsible for material, punitive, individual or collective damages caused by us, our subsidiaries, service providers that process personal data on our behalf or our affiliates due to non-compliance with the obligations set forth by the LGPD, which may adversely affect our reputation and results and, consequently, the value of our Class A common shares.
24
Table of Contents
In the event of failure or insufficiency in the adoption of measures to protect the personal data that is processed or to maintain compliance with the LGPD, we may incur relevant costs, such as the payment of fines and indemnities, implementation of adjustment measures, and loss of business, as well as such failure or insufficiency having an adverse effect on our reputation and results of operations. As a result, we may be held liable regardless of LGPD sanctions since consumer protection authorities and the Public Prosecutor’s Office have already been active in pursuing data privacy violations even before the LGPD became effective. Accordingly, failures in the protection of the personal data processed by us, or any failure to implement adequate data protection measures in response to applicable legislation, may subject us to high fines, the disclosure of the incident to the market, the payment of indemnities, the elimination of personal data from the database in question and the suspension of access to our databases, prohibition of our activities related to the processing of infringed data in addition to civil sanctions, which may adversely affect our reputation and results.
In addition, the application of administrative sanctions under other laws that deal with privacy and data protection issues may still apply, such as the Consumer Protection Code and the Brazilian Civil Rights Framework for the Internet. These administrative sanctions may be imposed by other public authorities, such as the Public Prosecutors’ Offices, the National Consumer Secretariat and consumer protection agencies. We may also be subject to liability in the civil sphere for violation of these laws. Sanctions imposed against us by these authorities may also adversely affect our reputation and results and, consequently, the value of our Class A common shares.
Our business depends on our well-regarded, reliable brand, and any failure to maintain, protect, and enhance our brand and related brands, including through effective marketing and communications strategies, would harm our business.
We have developed a well-regarded and reliable brand, “Vinci Partners,” that has contributed significantly to the success of our business. Maintaining, protecting, and enhancing our brands is critical to expanding our client base, and our relationships with other third-party partners, as well as increasing engagement with our products and services. This will depend largely on our ability to remain widely known, maintain trust, and continue to provide high-quality and secure products and services. Any negative publicity about our industry or our company, the quality, reliability and performance of our products and services, our risk management processes, changes to our products and services, our ability to effectively manage and resolve client complaints, our privacy and security practices, litigation, regulatory activity, and the experience of clients with our products or services could adversely affect our reputation and the confidence in and use of our products and services. Harm to our brands can arise from many sources, including failure by us or our partners to satisfy expectations of service and quality, inadequate protection of personal information, compliance failures and claims, litigation and other claims, third-party trademark infringement claims, administrative proceedings at the applicable national trademark offices, employee misconduct, and misconduct by our partners, service providers, or other counterparties. If we do not successfully maintain well-regarded and widely known brands, our business could be materially and adversely affected.
We may in the future be the target of incomplete, inaccurate, and misleading or false statements about our company, our business, and our products and services that could damage our brands and materially deter people from adopting our services. Negative publicity about our company or our management, including about our product quality, reliability and performance, changes to our products and services, privacy and security practices, litigation, regulatory enforcement, and other actions, as well as the actions of our clients and other users of our services, even if inaccurate, could cause a loss of confidence in us. Our ability to respond to negative statements about us may be limited by legal prohibitions on permissible public communications by us during our initial public offering process or during future periods.
In addition, we believe that promoting our brands in a cost-effective manner is critical to achieving widespread acceptance of our products and services and to expanding our base of clients. Our brand promotion activities may not generate customer awareness or increase revenue, and even if they do, any increase in revenue may not offset the expenses we incur in building our brands. If we fail to successfully promote and maintain our brands or if we incur excessive expenses in this effort, our business could be materially and adversely affected.
25
Table of Contents
The introduction and promotion of new services, as well as the promotion of existing services, may be partly dependent on our visibility on third-party advertising platforms, such as LinkedIn and Google. Changes in the way these platforms operate or changes in their advertising prices or other terms could make the maintenance and promotion of our products and services and our brands more expensive or more difficult. If we are unable to market and promote our brands on third-party platforms effectively, our ability to acquire new clients would be materially harmed, which could adversely affect our business, financial condition and results of operations.
Large investments made by certain of our funds may involve certain complexities and risks that may not be encountered in the context of small- and medium-sized investments and concentrated positions in any of our funds may expose us to losses.
Where our funds make large investments, these may involve certain complexities and risks that may not be encountered in small- and medium-sized investments. For example, larger transactions may be more difficult to finance or may entail greater challenges in implementing changes in the relevant portfolio company’s management, culture, finances or operations, and may face greater scrutiny by regulators, interest groups and other third parties. Further, in larger transactions, the amount of equity capital required to complete an investment has increased significantly. This has resulted in some larger private equity deals being structured as consortium transactions. Consortium transactions generally entail a reduced level of control over the investment because governance rights must be shared with the other consortium investors. Accordingly, in such deals, our funds may not be able to separately control decisions relating to a consortium investment and the timing and nature of any exit. In addition, large investments could result in concentrated positions in certain of our funds, or certain of our funds may have concentrated positions in the securities of certain issuers or of issuers of a particular industry, country or region, which could expose us to losses in respect of such issuer, industry, country or region. Any of these factors could increase the risk that our funds’ larger investments could be less successful than investments over which the relevant Vinci Partners fund has full control or has a more diversified position. The consequences of an unsuccessful larger investment by a Vinci Partners fund could be more severe given the size of the investment and any such adverse consequences could, in turn, have a material adverse impact on our brand and reputation as well as adversely affect the performance fees and investment income received by us from the relevant fund, which could adversely affect our business, financial condition and results of operations.
We rely on a number of external service providers for certain key market information and data, technology, processing and supporting functions.
We rely on a number of external service providers for certain key market information and data, technology, processing and supporting functions, such as Microsoft, SS&C Eze, Cirion Technologies, Dell and Fortinet, among others. The functions these service providers provide include portfolio management and asset allocation services, compliance management, communication systems, registration systems, data control systems, information security systems, and others which are of critical importance for us in order to provide our services to our clients in a satisfactory manner. These service providers may face technical, operational and security risks of their own, including risks similar to those that we face as described herein. Any significant failures by them, including improper use or disclosure of our confidential customer, employee or company information, could interrupt our business, cause us to incur losses and harm our reputation. Particularly, we rely on certain systems and institutions to allow our portfolio managers to access real-time market information data, such as Bloomberg, Reuters, Broadcast, Quantum and Economática, which are essential for our managers to make their investment decisions and take certain actions (such as making trades). Any failure of such information providers to update or deliver such data in a timely manner could lead to potential losses of our funds, which may in turn affect our business operations and reputation and may cause us to incur losses.
We cannot assure you that the external service providers will be able to continue to provide these services to meet our current needs in an efficient and cost-effective manner, or that they will be able to adequately expand their services to meet our needs in the future. Some external service providers may have assets and infrastructure that are important to the services they provide us that are located in or outside Brazil, and their ability to provide these services is subject to risks from unfavorable political, economic, legal or other developments, such as social or political instability, changes in governmental policies or changes in the applicable laws and regulations of the jurisdictions in which their assets and operations are located.
26
Table of Contents
An interruption in or the cessation of service by any external service provider as a result of system failures, capacity constraints, financial constraints or problems, unanticipated trading market closures or for any other reason and our inability to make alternative arrangements in a smooth and timely manner, if at all, could have a material adverse effect on our business, financial condition and results of operations.
Further, disputes might arise in relation to the agreements that we enter into with our service providers or the performance of the service providers thereunder. To the extent that any service provider disagrees with us on the quality of the products or services to be provided under the terms and conditions of the payment under or other provisions of any such agreement, we may face claims, disputes, litigations or other proceedings initiated by such service provider against us. We may incur substantial expenses and require significant attention of management in defending against these claims, regardless of their merit. We could also face damage to our reputation as a result of such claims, and our business, financial condition, results of operations and prospects could be materially and adversely affected.
We may not be able to ensure the accuracy of the information for third-party funds that we invest in for our clients, and we have no control over the performance of these third-party funds.
We invest our clients’ funds in certain third-party funds. While the information related to these third-party funds has been generally reliable, there can be no assurance that the reliability can be maintained in the future. If these third-party funds or their service providers or agents provide incomplete, misleading, inaccurate or fraudulent information in relation to their funds, we may lose the trust of existing and prospective investors.
Furthermore, as clients invest in these third-party funds through funds managed by us, they may have the impression that we are at least partially responsible for the quality and performance of these funds. Although we have established standards to screen fund providers before we invest in these funds, we have limited control over the performance of these third-party funds. In the event that an investor is dissatisfied with a third-party fund invested in by us, we do not have any means to directly make improvements in response to client complaints. If investors become dissatisfied with these third-party funds, our business, reputation, financial performance and prospects could be adversely affected.
We rely upon our systems and upon third-party data center service providers to host certain aspects of our platform and content, and any systems failure due to factors beyond our control or any disruption to, or interference with, our use of third-party data center services could interrupt our service, increase our costs and impair our ability to deliver our platform, resulting in customer dissatisfaction, damaging our reputation and harming our business.
We utilize data center hosting facilities from a third-party service provider to make certain content available on our platform. Our primary data centers are located in Rio de Janeiro, Brazil. Our operations depend, in part, on our providers’ ability to protect their facilities against damage or interruption from natural disasters, power or telecommunications failures, criminal acts and similar events. The occurrence of natural disasters, acts of terrorism, vandalism or sabotage, a decision to close a facility without adequate notice, or other unanticipated problems at our providers’ facilities could result in lengthy interruptions in the availability of our platform, which would adversely affect our business.
In addition, we depend on the efficient and uninterrupted operation of numerous systems, including our computer systems, software, data centers and telecommunications networks, as well as the systems of third parties. Our systems and operations or those of our third-party providers could be exposed to damage or interruption from, among other things, fire, natural disaster, power loss, telecommunications failure, unauthorized entry and computer viruses. Defects in our systems or those of third parties, errors or delays in the processing of transactions, telecommunications failures or other difficulties could result in:
| • | loss of revenues; |
| • | loss of clients; |
| • | loss of client data; |
27
Table of Contents
| • | loss of licenses, registrations or authorizations with the CVM, ANBIMA and/or any other applicable authority; |
| • | fines imposed by applicable regulatory authorities and other issues relating to noncompliance with applicable asset management services or data protection requirements; |
| • | harm to our business or reputation resulting from negative publicity; |
| • | exposure to fraud losses or other liabilities; |
| • | additional operating and development costs; and/or |
| • | diversion of technical and other resources. |
Valuation methodologies for certain assets in Vinci Partners funds involve subjective judgments and assumptions and the fair value of assets established pursuant to such methodologies could, therefore, be incorrect, which could have an adverse effect on fund performance, accrued performance fees and investment income.
Valuation methodologies for investments held by our funds can involve subjective judgments, and the fair value of assets established pursuant to such methodologies may therefore be incorrect, which could have an adverse effect on fund performance and accrued performance fees.
There are often no readily ascertainable market prices for a portion of the investments of funds that we manage. As of December 31, 2023, investments in non-listed companies comprise 99.1% of investments in portfolio companies for the private equity funds that we manage. Valuations of the investments held by our funds are generally prepared in line with applicable and recognized valuation processes and procedures (including, in respect of private equity investments in accordance with the international private equity and venture capital valuation guidelines) prepared by either our management team or third-party specialist firms. There is a risk that investments held by our funds will not be realized for amounts equal to, or greater than, the amounts at which they are valued, or that the past valuations based on such performance information will not accurately reflect the realization value of such investments. An investment’s actual realization value will depend on, among other factors, future operating results of the relevant investment, the value of the assets and market conditions at the time of disposal, any related transaction costs and the timing and manner of sale, all of which may differ from the assumptions on which previous valuations were determined.
Valuations of unrealized investments held by our funds can affect the amount of performance fees generated by our funds in circumstances where unrealized investments are written off or written down in value. To the extent that a valuation is incorrect, this may result in a recognition of revenue from performance fees, a subsequent reduction of which could ultimately reduce our profitability. Valuation of unrealized investments held by our funds could also affect management fees in the case of a bankruptcy of a portfolio company of a Vinci Partners fund, whereby the investment is considered realized and the invested capital is deducted from the base on which management fee is calculated, which could have an effect on the income from management fees received by Vinci Partners from existing funds.
Changes in values attributed to investments from time to time may result in volatility in the results of operations that our funds and we report from period to period. Also, a situation where asset values turn out to be materially different to those values previously realized could cause fund investors to lose confidence in us, which could in turn result in difficulty in raising capital for additional funds, and as a consequence, could adversely affect our business, financial condition and results of operations.
The historical performance of our investments should not be considered as indicative of the future results of our investments or our operations or any returns expected on an investment in our Class A common shares.
Past performance of our funds is not necessarily indicative of future results or of the performance of our Class A common shares. An investment in our Class A common shares is not an investment in any of our funds. In addition, the historical and potential future returns of funds that we manage are not directly linked to returns on our Class A common shares. Therefore, you should not conclude that continued positive performance of funds will necessarily result in positive returns on an investment in our Class A common shares. However, poor performance of our specialized funds could cause a decline in our revenue, and could therefore have a negative effect on our performance and on returns on an investment in our Class A common shares.
28
Table of Contents
The historical performance of our funds should not be considered indicative of the future performance of these funds or of any future funds we may raise, in part because:
| • | market conditions and investment opportunities during previous periods may have been significantly more favorable for generating positive performance than those we may currently be experiencing or that we may experience in the future; |
| • | the performance of our funds is generally calculated on the basis of net asset value of the funds’ investments, including unrealized gains, which may never be realized; |
| • | our historical returns derive largely from the performance of our earlier funds, whereas future fund returns will depend increasingly on the performance of our newer funds or funds not yet formed; |
| • | our newly established funds may generate lower returns during the period that they initially deploy their capital; |
| • | competition continues to increase for investment opportunities, which may reduce our returns in the future; |
| • | the performance of particular funds also will be affected by risks of the industries and businesses in which they invest; and |
| • | we may create new funds that reflect a different asset mix and new investment strategies, as well as a varied geographic and industry exposure, compared to our historical funds, and any such new funds could have different returns from our previous funds. |
If we lose key personnel, our business, financial condition and results of operations may be adversely affected.
We are dependent upon the ability and experience of a number of key personnel, including our partners and other members of senior management, who have substantial experience with our operations, the financial services industry and the markets in which we offer our products and services. Many of our key personnel have worked for us for a significant amount of time or were recruited by us specifically due to their industry experience. It is possible that the loss of the services of one or a combination of our senior executives or key managers, including our chief executive officer, could have a material adverse effect on our business, financial condition and results of operations.
The ability to attract, recruit, develop and retain qualified employees and continue to strengthen our business is critical to our success and growth. If we are not able to do so, our business and prospects may be materially and adversely affected.
Our business functions at the intersection of rapidly changing technological, social, economic and regulatory developments that require a wide-ranging set of expertise and intellectual capital. In order for us to successfully compete and grow, we must attract, recruit, develop and retain the necessary personnel who can provide the needed expertise across the entire spectrum of our intellectual capital needs. While we have a number of our key personnel who have substantial experience with our operations, we must also develop our personnel to provide succession plans capable of maintaining continuity in the midst of the inevitable unpredictability of human capital. However, the market for qualified personnel is competitive, and we may not succeed in recruiting additional personnel or may fail to effectively replace current personnel who depart with qualified or effective successors. We must continue to hire additional personnel to execute our strategic plans. Our effort to retain and develop personnel may also result in significant additional expenses, which could adversely affect our profitability. We cannot assure you that our qualified employees will continue to be employed by us or that we will be able to attract and retain qualified personnel in the future. Failure to retain or attract key personnel could have a material adverse effect on our business, financial condition and results of operations.
29
Table of Contents
In addition, in order to manage our growth effectively, we must continue to strengthen our existing infrastructure, develop and improve our internal controls, create and improve our reporting systems, and timely address issues as they arise. These efforts may require substantial financial expenditures, commitments of resources, developments of our processes, and other investments and innovations. Furthermore, we encourage employees to quickly develop and launch new features for our products and services. As we grow, we may not be able to execute our strategies as quickly as smaller, more efficient organizations. If we do not successfully manage our growth, our business will suffer.
Implementing our growth strategy, including new investment products and business initiatives, may be unsuccessful.
We may be subject to a number of risks and uncertainties associated with our growth strategy, including the risk that new business initiatives will not contribute towards achieving our objectives or that we will not execute such new initiatives successfully. New initiatives may also be difficult to launch, for instance where we do not have a proven track record within the area of the new initiative, or may not reach the set goals and expectations following launch. Any new products we offer may have different economic structures than our traditional investment funds and may require a different marketing approach. Given our diverse offering of products and services, these initiatives could create conflicts of interests with existing products, increase our costs and expose us to new market risks and legal and regulatory requirements and could expose us to greater reputation and litigation risk. Implementing our growth strategy may also entail significant difficulties and costs, including the logistical and overhead costs of opening and expanding offices, the cost of recruiting, training and retaining a higher number of investment advisory professionals and higher costs arising from exposure to additional jurisdictions (including the laws, rules and regulations thereof) and activities. New initiatives and expanding our business, including to open new offices or develop new product offerings, could also divert significant time and attention of our senior management in the development of such new initiatives to the detriment of our existing business. Furthermore, we may be directly exposed to new business risks or be subjected to enhanced exposure to existing risks if business initiatives are financed with our own capital.
We may be exposed to asset-specific risks, including those relating to the holding of publicly traded securities, such as fluctuating stock prices and additional media scrutiny, which by extension may have an adverse effect on our brand and reputation. In addition, when our funds acquire minority stakes in public companies, or our portfolio companies are listed, these public companies may make decisions with which the relevant Vinci Partners fund disagrees, and the majority stakeholders or the management of the company may take risks or otherwise act in a manner that does not serve our funds’ interests.
Any failure of our new initiatives to meet or exceed expectations could lead to us not reaching profitability within the initiative, not growing in accordance with our growth strategy and not being able to enjoy the benefits that this is expected to lead to, as well preventing us from reaching our growth targets. In order for us to successfully compete and grow, we must attract, recruit, develop and retain the necessary personnel who can provide the needed expertise across the entire spectrum of our intellectual capital needs.
We are subject to various risks associated with the securities industry, any of which could have a materially adverse effect on our business, cash flows and results of operations.
We are subject to uncertainties that are common across the securities industry. These uncertainties include:
| • | the volatility of domestic and international financial, bond and stock markets, and the markets for funds and other asset classes, in particular in the context of the lasting global macroeconomic effects of COVID-19 and the ongoing war between Russia and Ukraine on inflation, the conflicts in the Middle East, interest rates and political turbulence, and new economic directives arising from the Brazilian government; |
| • | extensive governmental regulation; |
| • | litigation; |
| • | intense competition; |
| • | poor performance of investments made by us or by third party investment managers with whom we invest; |
| • | substantial fluctuations in the volume and price level of securities; and |
| • | dependence on the solvency of various third parties. |
30
Table of Contents
As a result, our revenues and earnings may vary significantly from quarter to quarter and from year to year. Sudden sharp declines in market values of securities and the failure of issuers and counterparties to perform their obligations can result in illiquid markets which, in turn, may result in our having difficulty selling securities. In the event of a market downturn, or in the event of increased market volatility, our business could be adversely affected in many ways, potentially for a prolonged period of time.
Our holding company structure makes us dependent on the operations of our subsidiaries.
We are a Cayman Islands exempted company with limited liability. As a holding company, our corporate purpose is to invest, as a partner, quotaholder or shareholder, in other companies, consortia or joint ventures in Brazil, where most of our operations are located, and outside Brazil. Accordingly, our material assets are our direct and indirect equity interests in our subsidiaries, and we are therefore dependent upon the results of operations and, in turn, the payments, dividends and distributions from our subsidiaries for funds to pay our holding company’s operating and other expenses and to pay future cash dividends or distributions, if any, to holders of our Class A common shares, and we may have tax costs in connection with any dividend or distribution. In addition, the payments, dividends and distributions from our subsidiaries to us for funds to pay future cash dividends or distributions, if any, to holders of our Class A common shares, could be restricted under financing arrangements that we or our subsidiaries may enter into in the future and we and such subsidiaries may be required to obtain the approval of lenders to make such payments to us in the event they are in default of their repayment obligations. Furthermore, exchange rate fluctuation will affect the U.S. dollar value of any distributions our subsidiaries make with respect to our equity interests in those subsidiaries. See “—Certain Risks Relating to Brazil—Exchange rate instability may have adverse effects on the Brazilian economy, us and the price of our Class A common shares,” “—Certain Risks Relating to Brazil—Economic uncertainty and political instability in Brazil may harm us and the price of our Class A common shares” and “Item 8.—A. Consolidated Statements and Other Financial Information—Dividends and Dividend Policy.”
We may be subject to credit risks and could be subject to losses that would have a material adverse effect on our financial condition and results of operations.
We may be subject to the risk that our counterparties’ credit worthiness will deteriorate and that they no longer will be able to fulfil their financial obligations towards us. Our credit risks relate primarily to receivables and contract assets, cash held in bank accounts, any derivative instruments outstanding with a positive fair value, and any financial guarantees. If measures taken by us to minimize credit risks are not sufficient, or if one or more counterparties run into financial difficulties, we could be subject to losses, which could have a material adverse effect on our financial condition and results of operations.
The performance of our funds may also be affected by credit risks, which subsequently could adversely affect us. In our funds’ activities, defaults on commitments may have adverse consequences on the investment process. For instance, fund investors may not satisfy their contractual obligation to fund capital calls when requested by the general partner or fund manager of the relevant fund. This may result in shortfalls in capital and may affect the relevant fund’s ability to consummate investments and adversely affect our ability to receive management fees and other income.
Risk management activities may adversely affect the return on our funds’ investments.
When managing our exposure to market risks, we may (on our own behalf or on behalf of our funds) from time to time decide to use forward contracts, options, swaps, caps, collars and floors or pursue other strategies or use other forms of derivative instruments to limit our exposure to changes in the relative values of investments that may result from market developments, including changes in prevailing interest rates, currency exchange rates (as described below in “—We are exposed to fluctuations in foreign currency exchange rates and may enter into derivatives transactions to manage our exposure to exchange rate risk”) and commodity prices. The success of any hedging or other derivative transactions generally will depend on our ability to correctly predict market changes, the degree of correlation between price movements of a derivative instrument, the position being hedged, the creditworthiness of the counterparty and other factors. As a result, while we may enter into a transaction in order to reduce our exposure to market risks, the transaction may result in poorer overall investment performance than if it had not been executed. Such transactions may also limit the opportunity for gain if the value of a hedged position increases.
31
Table of Contents
While such hedging arrangements may reduce certain risks, such arrangements themselves may entail certain other risks. These arrangements may require the posting of cash collateral at a time when a fund has insufficient cash or illiquid assets such that the posting of the cash is either impossible or requires the sale of assets at prices that do not reflect their underlying value. Moreover, these hedging arrangements may generate significant transaction costs, including potential tax costs, which reduce the returns generated by a fund. Finally, regulatory agencies may in the future require certain foreign exchange products to be subject to mandatory clearing, which could increase the cost of entering into currency hedges.
We are exposed to fluctuations in foreign currency exchange rates and may enter into derivatives transactions to manage our exposure to exchange rate risk.
We hold certain funds in non-Brazilian real currencies, and will continue to do so in the future, and our offshore operating subsidiaries generate revenue in non-Brazilian real currencies. Accordingly, our financial results are affected by the translation of these non-real currencies into reais. In addition, to the extent that we need to convert future financing proceeds into Brazilian reais for our operations, any appreciation of the Brazilian real against the relevant foreign currencies would materially reduce the Brazilian real amounts we would receive from the conversion, and any depreciation of the Brazilian real against the relevant foreign currencies could increase the amounts in Brazilian reais that we are require to convert into the relevant foreign currencies in order to service such relevant foreign currency financings. No assurance can be given that fluctuations in foreign exchange rates will not have a significant impact on our business, financial condition, results of operations and prospects. We may also have foreign exchange risk on any of our other assets and liabilities denominated in currencies, or with pricing linked to currencies, other than our functional currency, including certain contract assets. Fluctuations in the Brazilian real versus any of these foreign currencies may have a material adverse effect on our financial position and results of operations including, for example as a result of overall market declines and increased volatility due to the COVID-19 pandemic, changes in the prices of commodities exported by Brazil and sudden changes in the global liquidity conditions caused by interest rate hikes in the main global financial centers, such as the United States and the European Union.
In addition, we may in the future enter into derivatives transactions to manage our exposure to exchange rate risk. Such derivatives transactions would be designed to protect us against increases or decreases in exchange rates, but not both. If we enter into derivatives transactions to protect against, for example, decreases in the value of the Brazilian real and the real instead increases in value, we may incur financial losses. Such losses could materially and adversely affect us.
We have identified material weaknesses in our internal control over financial reporting and, if we fail to remediate such deficiencies (and any other ones) and to maintain effective internal controls over financial reporting, we may be unable to accurately report our results of operations, meet our reporting obligations and/or prevent fraud.
Prior to our IPO, we were a private company with limited accounting personnel and other resources to address our internal control over financial reporting and procedures. As a result of our IPO, we are subject to the Sarbanes-Oxley Act, which requires, among other things, that we establish and maintain effective internal controls over financial reporting and disclosure controls and procedures. Under current SEC rules, we are required to perform system and process evaluation and testing of our internal controls over financial reporting to allow management to assess the effectiveness of our internal controls.
In connection with the preparation of our consolidated financial statements for the years ended December 31, 2023, 2022 and 2021, we identified a number of material weaknesses in our internal control over financial reporting as of December 31, 2023, 2022 and 2021. A material weakness is a deficiency, or combination of control deficiencies, in internal control over financial reporting, such that there is a reasonable possibility that a material misstatement of the annual or interim consolidated financial statements will not be prevented or detected on a timely basis. The material weaknesses identified relate to the processes necessary to comply with the reporting and compliance requirements of IFRS Accounting Standards and the SEC and managing access to our systems, data and end-user computing, or EUC, controls, and computer operations controls, which were not designed or operating
32
Table of Contents
effectively. To address these material weaknesses, in 2021, we hired an external consultant with the experience we deemed necessary to assist us with designing the required processes and controls, addressing any systems and EUC deficiencies. In 2022, the consultant along with the Company, mapped out the processes and designed a risk and control framework relating to internal controls over financial reporting, and suggested action plans for some of our internal controls to be validated by the applicable staff. The consultant’s work was completed in 2023 and has enabled us to focus on control gaps and related action plans. Notwithstanding, as the risk and control framework requires continuous updating, new risks and controls or control gaps that are not mapped in the current assessment may arise.
Additionally, we identified material weaknesses related to training, specifically, training to address financial reporting topics for a public company as of December 31, 2021 and 2020. Beginning in the year ended December 31, 2022 and continuing through 2023, we sought to address these material weaknesses by appointing a firm to train our employees on financial reporting topics for a public company, and the material weakness has since been remedied. Continuous staff training is part of our culture and, consequently, we plan to continue to provide necessary training during the year ended December 31, 2024 to relevant staff members related to this matter to mitigate the risk of uncovering material weaknesses in the future.
In addition, we identified material weaknesses as of December 31, 2020 related to the supervision of financial reporting for a public company, including lack of an audit committee. In 2021, we created our audit committee in connection with our IPO (see “Item 6. Directors, Senior Management and Employees—C. Board Practices—Audit Committee”) and further created an internal controls department, which is leading the remediation process along with the external consultant and is responsible for completing our action plans, monitoring, reviewing and testing controls, and ensuring that new controls are in place for new processes or changes in existing processes. Further, in 2023, we created and implemented our internal audit department, operating under the direct supervision of the audit committee. The internal audit department is leading the effectiveness evaluating procedures over the relevant internal controls related to the financial reporting process and entity governance.
Moreover, we identified control deficiencies as of December 31, 2023, 2022 and 2021, related to controls around the financial reporting closing process, the procedures in existence to maintain formal accounting policies, processes and controls to analyze, account for and disclose complex transactions. Such deficiencies, when considered in the aggregate, would be considered a material weakness. Beginning in the year ended December 31, 2022 and continuing into 2023, we have sought to remedy our control deficiencies through procedures such as updated accounting policies and procedures, and controls regarding the reviewing process and the accuracy of the information required to produce the financial statements. In 2023, formal review and documentation processes were implemented for accounting procedures and controls related to the accuracy of information required to produce the financial statements. In 2024, we also hired an external consultant to support the accounting team in preparing and developing an internal manual for significant accounting policies.
These material weaknesses did not result in a material misstatement to our consolidated financial statements. However, additional testing may reveal other deficiencies in our internal controls that are deemed to be material weaknesses or significant deficiencies and render our internal controls over financial reporting ineffective. We incur additional accounting and auditing expenses and spend significant management time in complying with these requirements. If we are not able to comply with these requirements in a timely manner, or if we or our management identifies material weaknesses or significant deficiencies in our internal controls over financial reporting that are deemed to be material weaknesses, the market price of our Class A common shares may decline and we may be subject to investigations or sanctions by the SEC, the Financial Industry Regulatory Authority, Inc., or FINRA, or other regulatory authorities. Moreover, we cannot assure you that our efforts will be effective or prevent any future material weaknesses in our internal control over financial reporting.
In addition, these obligations also require substantial attention from our senior management and could divert their attention away from the day-to-day management of our business. These cost increases and the diversion of management’s attention could materially and adversely affect our business, financial condition and operation results.
33
Table of Contents
Requirements associated with being a public company in the United States require significant company resources and management attention.
We are subject to certain reporting requirements of the Securities Exchange Act of 1934, or the Exchange Act, and other SEC and Nasdaq rules and regulations. We are also subject to various other regulatory requirements, including the Sarbanes-Oxley Act. These rules and regulations increase our legal, accounting, and financial compliance costs and make some activities more time-consuming and costly. For example, these rules and regulations make it more difficult and more expensive for us to obtain director and officer liability insurance, and we may be required to accept reduced policy limits and coverage or incur substantial costs to maintain the same or similar coverage. New rules and regulations relating to information disclosure, financial reporting and controls and corporate governance, which could be adopted by the SEC, the Nasdaq or other regulatory bodies or exchange entities from time to time, could result in a significant increase in legal, accounting, and other compliance costs and make certain corporate activities more time-consuming and costly, which could materially affect our business, financial condition and results of operations. These rules and regulations may also make it more difficult for us to attract and retain qualified persons to serve on our board of directors or as executive officers.
These obligations also require substantial attention from our senior management and could divert their attention away from the day-to-day management of our business. Given that most of the individuals who constitute our management team have limited experience managing a publicly traded company and complying with the increasingly complex laws pertaining to public companies, initially, these obligations could demand even greater attention. These cost increases and the diversion of management’s attention could materially and adversely affect our business, financial condition and results of operations.
Our business is subject to complex and evolving regulations and oversight related to our provision of financial products and services and to costs and risks associated with other increased or changing laws and regulations affecting our business, including developments in data protection and privacy laws, which could harm our business, financial condition and results of operations.
As a firm mainly focused on asset management in Brazil, our business is subject to Brazilian laws and regulations relating to asset management in Brazil, comprising Federal Law No. 6,385/1976 and related rules and regulations issued by the CVM and ANBIMA, among others. Since the launching of our Vinci Retirement Services segment, or VRS, we have been subjected to the rules and regulations of the Brazilian Superintendency for Private Insurance (Superintendência de Seguros Privados), or the SUSEP. If we are unable to comply with these private insurance regulations in a timely manner, we may be subject to fines or other penalties.
In addition, by engaging in the insurance business, we are subject to a number of regulatory risks, such as (1) changes in solvency and minimum capital regulation, which could result in the need for increased capital to cover new solvency requirements and/or in the divestment of certain classes of assets; (2) changes in product regulation, which could materially alter the way in which our products are created, sold or operated in general; (3) intervention and/or liquidation proceedings by SUSEP in the event of solvency-sensitive scenarios, which could lead to material deviations or interruptions to our ordinary course of business and/or regulatory sanctions upon the Company and its management; and (4) incurrence of fines and other penalties (such as temporary suspension of activities or license cancellation) imposed by SUSEP for perceived breaches of applicable regulation, among others.
The laws, rules, and regulations that govern our business include or may in the future include those relating to consumer financial protection, tax, anti-money laundering and terrorist financing and escheatment (rules relating to unclaimed property). These laws, rules, and regulations are enforced by multiple authorities and governing bodies in Brazil, including the CVM and the SUSEP. In addition, as our business continues to develop and expand, we may become subject to additional rules and regulations, which may limit or change how we conduct our business. In addition, during periods of heightened political and economic uncertainty, the Brazilian federal government could implement additional rules and regulations that could adversely impact our business. See “—Certain Risks Relating to Brazil—The Brazilian federal government has exercised, and continues to exercise, significant influence over the Brazilian economy. This involvement as well as Brazil’s political and economic conditions could harm us and the price of our Class A common shares.”
34
Table of Contents
We are subject to anti-money laundering and terrorist financing laws and regulations in multiple jurisdictions that prohibit, among other things, involvement in transferring the proceeds of criminal or terrorist activities. We could be subject to liability and forced to change our business practices if we were found to be subject to, or in violation of, any laws or regulations impacting our ability to maintain a bank account in the countries where we operate, including the United States, or if existing or new legislation or regulations applicable to banks in the countries where we maintain a bank account, including the United States, were to result in banks in those countries being unwilling or unable to establish and maintain bank accounts for us.
If any person in the Cayman Islands knows or suspects or has reasonable grounds for knowing or suspecting that another person is engaged in criminal conduct or money laundering or is involved with terrorism or terrorist financing and property and the information for that knowledge or suspicion came to their attention in the course of business in the regulated sector, or other trade, profession, business or employment, the person will be required to report such knowledge or suspicion to (i) the Financial Reporting Authority (“FRA”) of the Cayman Islands, pursuant to the Proceeds of Crime Act (Revised) of the Cayman Islands if the disclosure relates to criminal conduct or money laundering, or (ii) a police officer of the rank of constable or higher, or the FRA, pursuant to the Terrorism Act (Revised) of the Cayman Islands, if the disclosure relates to involvement with terrorism or terrorist financing and property. Such a report shall not be treated as a breach of confidence or of any restriction upon the disclosure of information imposed by any enactment or otherwise.
Certain of our subsidiaries are subject to regulation in the United States. If we or any of our subsidiaries obtain additional licenses or registrations in the United States, we could be subject to compliance with additional applicable laws and regulations, including anti-money laundering and terrorist financing laws and regulations, which could adversely affect our business, financial condition, or results of operations.
Although we have a compliance program focused on applicable laws, rules, and regulations (which currently is principally focused on Brazilian law) and are continually investing in this program, we may nonetheless be subject to fines or other penalties in one or more jurisdictions levied by federal, state or local regulators, as well as those levied by foreign regulators. In addition to fines, penalties for failing to comply with applicable rules and regulations could include significant criminal and civil lawsuits, forfeiture of significant assets, or other enforcement actions, including loss of required licenses or approvals in a given jurisdiction. We could also be required to make changes to our business practices or compliance programs as a result of regulatory scrutiny. In addition, any perceived or actual failure to comply with applicable laws, rules, and regulations could have a significant impact on our reputation as a trusted brand and could cause us to lose existing clients, prevent us from obtaining new clients, require us to expend significant funds to remedy problems caused by breaches and to avert further breaches, and expose us to legal risk and potential liability, and we could be (1) required to pay substantial fines and disgorgement of our profits or (2) required to change our business practices. Any disciplinary or punitive action by our regulators or failure to obtain required operating authorizations could seriously harm our business and results of operations.
In addition, the Brazilian regulatory and legal environment exposes us to other compliance and litigation risks that could materially affect our results of operations. These laws and regulations may change, sometimes significantly, as a result of political, economic or social events. Some of the federal, state or local laws and regulations in Brazil that affect us include: those relating to consumer products, product liability or consumer protection; those relating to the manner in which we advertise, market or sell products; labor and employment laws, including wage and hour laws; tax laws or interpretations thereof; bank secrecy laws, data protection and privacy laws and regulations; and securities and exchange laws and regulations. For instance, data protection and privacy laws are developing to take into account the changes in cultural and consumer attitudes towards the protection of personal data (including as a result of the LGPD). There can be no guarantee that we will have sufficient financial and personnel resources to comply with any new regulations or successfully compete in the context of a changing regulatory environment.
We are subject to regulatory activity and antitrust litigation under competition laws.
We are subject to scrutiny from governmental agencies under competition laws in Brazil. Other companies or governmental agencies may allege that our actions violate antitrust or competition laws, or otherwise constitute unfair competition. Contractual agreements with clients or companies, as well as our unilateral business practices, could give rise to regulatory action or antitrust investigations or litigation. Some regulators may perceive our business to have such significant market power that otherwise uncontroversial business practices could be deemed anticompetitive. Any such claims and investigations, even if they are unfounded, may be expensive to defend, involve negative publicity and substantial diversion of management time and effort, and could result in significant judgments against us.
35
Table of Contents
We are subject to anti-corruption, anti-bribery, anti-money laundering and sanctions laws and regulations and failure to comply with such laws and regulations could result in criminal liability, administrative and civil lawsuits, significant fines and penalties, forfeiture of significant assets, as well as reputational harm.
We operate in jurisdictions that have a high risk of corruption and we are subject to anti-corruption, anti-bribery anti-money laundering and sanctions laws and regulations, including the Brazilian Federal Law No. 12,846/2013, or the Clean Company Act, the United States Foreign Corrupt Practices Act of 1977, as amended, or the FCPA, and the Bribery Act 2010 of the United Kingdom, or the Bribery Act. Each of the Clean Company Act, the FCPA and the Bribery Act impose liability against companies who engage in bribery of government officials, either directly or through intermediaries. We have a compliance program that is designed to manage the risks of doing business in light of these new and existing legal and regulatory requirements. Violations of the anti-corruption, anti-bribery, anti-money laundering and sanctions laws and regulations could result in criminal liability, administrative and civil lawsuits, significant fines and penalties, forfeiture of significant assets, as well as reputational harm.
Regulators regularly reexamine their rules and regulatory measures, requirements and procedures, which may lead us to adjust our compliance and anti-money laundering programs, including the procedures we use to verify the identity of our clients and to monitor their transactions and transactions made by our funds. Costs associated with fines or enforcement actions, changes in compliance requirements, or limitations on our ability to grow could harm our business, and any new requirements or changes to existing requirements could impose significant costs, result in delays to planned product improvements, make it more difficult for new customers to join our network and reduce the attractiveness of our products and services. As a result, allegations of improper conduct as well as negative publicity and press speculation about us or our portfolio companies, or the private equity industry in general, whether or not valid, may harm our reputation, which may be more damaging to our business than to other types of businesses.
Misconduct of our employees, consultants or subcontractors could harm us by impairing our ability to attract and retain clients and subjecting us to significant legal liability and reputational harm. Fraud and other deceptive practices or other misconduct at our funds’ portfolio companies could similarly subject us to liability and reputational damage and also harm performance.
Our employees, consultants and subcontractors could engage in misconduct that adversely affects our business. We are subject to a number of obligations and standards arising from our asset management business and our authority over the assets managed by our asset management business. The violation of these obligations and standards by any of our employees, consultants and subcontractors would adversely affect our clients and us. If our employees, consultants and subcontractors were to improperly use or disclose confidential information, we could suffer serious harm to our reputation, financial position and current and future business relationships. Detecting or deterring employee misconduct is not always possible, and the extensive precautions we take to detect and prevent this activity may not be effective in all cases. If one of our employees, consultants and subcontractors were to engage in misconduct or were to be accused of such misconduct, our business and our reputation could be adversely affected.
As just mentioned above, regulatory authorities across various jurisdictions, such as Brazil the United States and the United Kingdom, among others, have increasingly focused on enhancing and enforcing anti-bribery laws, such as the Clean Company Act, FCPA and the Bribery Act. While we have developed and implemented policies and procedures designed to ensure strict compliance by us and our personnel with such laws, such policies and procedures may not be effective in all instances to prevent violations. Any determination that we have violated the Clean Company Act, the FCPA, the U.K. anti-bribery laws or other applicable anti-corruption laws could subject us to, among other things, civil and criminal penalties or material fines, profit disgorgement, injunctions on future conduct, securities litigation and a general loss of investor confidence, any one of which could adversely affect our business prospects, financial position or the market value of our Class A common shares.
36
Table of Contents
In addition, we may also be adversely affected if there is misconduct by personnel of portfolio companies in which our funds invest. For example, financial fraud or other deceptive practices at our funds’ portfolio companies, or failures by personnel at our funds’ portfolio companies to comply with anti-bribery, trade sanctions, anti- harassment or other legal and regulatory requirements, could subject us to, among other things, civil and criminal penalties or material fines, profit disgorgement, injunctions on future conduct and securities litigation, and could also cause significant reputational and business harm to us. Such misconduct may undermine our due diligence efforts with respect to such portfolio companies and could negatively affect the valuations of the investments by our funds in such portfolio companies.
Changes in tax laws, tax incentives, benefits or differing interpretations of tax laws may adversely affect our results of operations.
Changes in tax laws, regulations, related interpretations and tax accounting standards in Brazil, the United States or the Cayman Islands may result in a higher tax rate on our earnings, which may significantly reduce our profits and cash flows from operations. If the taxes applicable to our business increase or any tax benefits are revoked and we cannot alter our cost structure to pass our tax increases on to clients, our financial condition, results of operations and cash flows could be adversely affected. Our activities in Brazil are also subject to a Municipal Tax on Services (Imposto sobre Serviços), or ISS. Any increases in ISS rates could also harm our profitability.
There are a number of proposed bills currently before the Brazilian Congress that aim to implement tax reforms, and the Brazilian federal government has made strong indications that it intends to effect tax reforms and progress certain of these bills in the near future. For example, on December 20, 2023, the Brazilian Congress enacted Constitutional Amendment No. 132/2023. This amendment is intended to pave the way for a significant reform of the Brazilian tax system beginning in 2026 and taking full effect as of 2033. For this reform to take effect, the Brazilian Congress will also need to approve a number of complementary laws to enact the changes to Brazil’s tax system made possible by this constitutional amendment. These changes include the replacement of five taxes currently levied in Brazil: (i) Social Integration Program Contribution (Contribuição ao Programa de Integração Social), or PIS; (ii) the Social Security Financing Contribution (Contribuição para o Financiamento da Seguridade Social), or COFINS; (iii) Tax on Manufactured Products (Imposto sobre Produtos Industrializados), or IPI (all three being federal taxes); (iv) Tax on Distribution of Goods and Services Tax (Imposto sobre Circulação de Mercadorias e Serviços), or ICMS (a state tax); and (v) ISS (a municipal tax). These taxes will be replaced by two value-added taxes: ICMS and ISS will be merged into a Tax on Goods and Services (Imposto Sobre Bens e Serviços), or IBS, to be managed by states and municipalities, and the federal government will be in charge of a Contribution on Goods and Services (Contribuição sobre Bens e Serviços), or CBS, which will merge PIS, COFINS, and IPI. Any such changes could lead to a higher tax burden for us.
In addition to the reform of consumption taxes, the reform of income taxation is under discussion in Brazil. For example, in June 2021, an income tax reform bill presented by the Brazilian federal government (Bill No. 2.337/2021) and ultimately not approved would have subjected dividends to withholding tax at a rate of 15%. In the coming months, the federal government may present new bills aiming to tax dividends and provide other changes to income taxation as well.
Moreover, the recently enacted Law No. 14,754 2023 reformed the taxation in Brazil of income arising from local investment funds and offshore investments. With the approval of the tax reform and subsequent regulation of tax rates and applicable to us and our subsidiaries or portfolio companies, such changes may, directly or indirectly, adversely affect our business and results of operations.
Moreover, some tax rules in Brazil can change without notice (subject only to a general rule applicable to most increases of tax rates or the creation of new tax triggering events which rule states that such increases or events only become effective in the following calendar year and, in some cases, following a minimum transition period of 90 days). We may not always be aware of all such changes that affect our business and we may therefore fail to pay the applicable taxes or otherwise comply with tax regulations, which may result in additional tax assessments and penalties for our company.
At the municipal level, in 2016, the Brazilian government enacted Supplementary Law No. 157, or LC No. 157, which imposed changes regarding the ISS collection applied to the rendering of part of our services. ISS is a municipal tax payable by the service provider. These changes created new obligations, as ISS would be due in the municipality in which the client contracting our services was located rather than in the municipality in which the service provider’s facilities were located. This obligation was enacted in December 2016, but its effectiveness was barred by Direct Unconstitutionality Action No. 5835, or ADI 5835, filed by taxpayers. ADI 5835 challenged the
37
Table of Contents
constitutionality of LC No. 157 before the Brazilian Supreme Court (Supremo Tribunal Federal), or the STF, arguing that the new legislation would adversely affect companies’ activities due to the increase of costs and bureaucracy related to the ISS payment to several municipalities and the compliance with tax reporting obligations connected therewith. The STF granted an injunction to partially suspend the enforcement of article one of LC No. 157.
In response, on September 23, 2020, the Brazilian federal government enacted Supplementary Law No. 175, or LC No. 175, which sought to establish a standard for determining the location where ISS would be collected in connection with the rendering of specific services, including investment fund management. Under LC No. 175, the ISS collection location for fund management services changes from the municipality where the services originate to the municipality where the services are destined to, which means, in our case, the municipality of incorporation or residence of the quotaholders of the investment funds managed by us. However, on June 2, 2023, the STF ruled that both article one of LC No. 157 and, consequently, LC No. 175, were unconstitutional. We understand that there may be further attempts to change the way in which ISS is collected even before the new IBS, which is expected to be collected in the place of destination of the operation, comes into effect. Although ISS on our services is currently taxed in Rio de Janeiro, São Paulo and Recife (the municipalities where we have offices) at rates ranging from 2% to 5%, the applicable rate can be set by each municipality at up to 5%. Any increases in such rates could cause an increase in the ISS payable by us in connection with the services we provide, if we are required to pay ISS in municipalities that charge an ISS rate higher than the 2% rate charged in Rio de Janeiro and São Paulo.
Moreover, tax laws, regulations and treaties are complex and the manner in which they apply to us or to our funds is sometimes open to interpretation and, in some cases, they may be interpreted differently by us and the relevant tax authorities. The application of indirect taxes, such as value-added tax, services tax, business tax and gross receipt tax, to businesses such as ours is complex and continues to evolve. We are required to use significant judgment in order to evaluate applicable tax obligations. In many cases, the ultimate tax determination is uncertain because it is not clear how existing statutes apply to our business. One or more states or municipalities, the federal government or other countries may seek to challenge the taxation or procedures applied to our transactions, which could impose additional reporting, record-keeping or indirect tax collection obligations on businesses like ours or the charge of taxes due, plus charges and penalties. New taxes, social security and labor charges could also require us to incur substantial costs to capture data and collect and remit taxes. If such obligations were imposed, the additional costs associated with tax collection, remittance and audit requirements could have a material adverse effect on our business and financial results.
In addition, to support its fiscal policies, the Brazilian government regularly enacts reforms to tax and other assessment regimes that may affect our funds (including offshore funds) and the investors in such funds. Such reforms include changes in the rate of assessments and, occasionally, enactment of temporary taxes, the proceeds of which are earmarked for designated governmental purposes. The effects of these changes and any other changes that result from enactment of additional tax reforms have not been, and cannot be, quantified. There can be no assurance that any such reforms will not, once implemented, increase the overall tax burden on, and have an adverse effect upon, the operations and business of our private equity funds and their portfolio companies. Furthermore, such changes have in the past produced uncertainty in the financial system and may increase the cost of borrowing. The Brazilian tax authorities’ interpretations with respect to tax events and tax rates, as well as the computation of certain taxes, may change from time to time, including in ways that could materially adversely affect our funds, investors, and our financial condition and results of operations.
Transfer pricing may result in increased tax costs.
The jurisdictions in which we operate have rules on transfer pricing that require intra-group transactions to be conducted on arm’s-length terms. Brazil did not comprehensively adopt the arm’s length terms until December 28, 2022, when Provisional Measure No. 1,152/2022, later converted into Law No. 14,596/2023, was enacted to adapt the Brazilian transfer pricing rules to fully adopt the arm’s length standard. These provisions became effective as of January 2024, except for taxpayers who chose to apply these rules in 2023.
We regularly obtain advice regarding, inter alia, transfer pricing from external tax advisors. Transactions conducted between and among us and our subsidiaries, including, but not limited to, provision of investment advisory and investor relations services and business support services, and management services are made on a commercial basis by application of international guidelines and national regulations. As a consequence of globalization and growing world trade, tax authorities worldwide have increased their focus on transfer pricing with respect to cross border intra group transactions, as part of protecting their respective country’s tax base. In the event the tax authorities in the jurisdictions where we operate consider the pricing not to be on arm’s-length terms and were to succeed with such claims, this could result in an increased tax cost, including tax surcharges and interest.
38
Table of Contents
The costs and effects of pending and future litigation, investigations or similar matters, or adverse facts and developments related thereto, could materially affect our business, financial position and results of operations.
We are, and may be in the future, party to legal, arbitration and administrative investigations, inspections and proceedings arising in the ordinary course of our business or from extraordinary corporate, tax or regulatory events, involving our clients, suppliers, customers, as well as competition, government agencies, tax and environmental authorities, particularly with respect to civil, tax and labor claims, including, but not limited to, aspects of our business, corporate structure, executive compensation and dividend policies in our operational subsidiaries. Indemnity rights that we seek to negotiate in certain transactions may not cover all claims that may be asserted against us, and any claims asserted against us, regardless of merit or eventual outcome, may harm our reputation. Furthermore, there is no guarantee that we will be successful in defending ourselves in pending or future litigation or similar matters under various laws. Should the ultimate judgments or settlements in any pending or future litigation or investigation significantly exceed any amounts we are able to recover under any indemnity arrangements, such judgments or settlements could have a material adverse effect on our business, financial condition and results of operations and the price of our Class A common shares. Further, even if we adequately address issues raised by an inspection conducted by an agency or successfully defend our case in an administrative proceeding or court action, we may have to set aside significant financial and management resources to settle issues raised by such proceedings or to those lawsuits or claims, which could adversely affect our business. See “Item 8. Financial Information—A. Consolidated statements and other financial information—Legal Proceedings.”
We may not be able to successfully manage our intellectual property and may be subject to infringement claims.
We rely on a combination of contractual rights, trademarks and trade secrets to establish and protect our proprietary technology. Third parties may challenge, file actions to nullify, invalidate, circumvent, infringe or misappropriate our intellectual property, including at the administrative or judicial level, or such intellectual property may not be sufficient to permit us to take advantage of current market trends or otherwise to provide competitive advantages, which could result in costly redesign efforts, the discontinuance of certain service offerings or other competitive harm. If the ownership of any of our trademarks or domain names is legally challenged and such challenges result in adverse judicial decisions rendered against us, we may be prohibited from further using our trademarks and domain names. In addition, others, including our competitors, may independently develop similar technology, duplicate our services or design around our intellectual property, and in such cases, we could not assert our intellectual property rights against such parties. Further, our contractual arrangements may not effectively prevent disclosure of our confidential information or provide an adequate remedy in the event of unauthorized disclosure of our confidential information. We may have to litigate to enforce or determine the scope and enforceability of our intellectual property rights, trade secrets and know-how, which is expensive, could cause a diversion of resources and may not prove successful. Also, because of the rapid pace of technological change in our industry, aspects of our business and our services rely on technologies developed or licensed by third parties, and we may not be able to obtain or continue to obtain licenses and technologies from these third parties on reasonable terms or at all. The loss of intellectual property protection, the inability to obtain third-party intellectual property or delay or refusal by relevant regulatory authorities to approve pending intellectual property registration applications could harm our business and ability to compete. With respect to trademarks, loss of rights may result from term expirations, owner abandonment and forfeiture or cancellation proceedings before the Brazilian Patent and Trademark Office (Instituto Nacional da Propriedade Industrial, or the INPI/BPTO). In addition, if we lose rights over registered trademarks, we would not be entitled to use such trademarks on an exclusive basis and, therefore, third parties would be able to use similar or identical trademarks to identify their products or services, which could adversely affect our business.
We may also be subject to costly litigation in the event our services and technology infringe upon or otherwise violate a third party’s proprietary rights. Third parties may have, or may eventually be issued, patents that could be infringed by our services or technology. Any of these third parties could make a claim of infringement against us with respect to our services or technology. We may also be subject to claims by third parties for breach of copyright,
39
Table of Contents
trademark, license usage or other intellectual property rights. Any claim from third parties may result in a limitation on our ability to use the intellectual property subject to these claims or could prevent us from registering our brands as trademarks. Additionally, in recent years, individuals and groups have been purchasing intellectual property assets for the sole purpose of making infringement claims and attempting to extract settlements. Even if we became party to intellectual property related claims that we believe to be without merit, defending against such claims is time-consuming and expensive and could result in the diversion of the time and attention of our management and employees. Claims of intellectual property infringement also might require us to redesign affected services, enter into costly settlement or license agreements, pay costly damage awards, adjust our business practices or operations, change our brands, or face a temporary or permanent injunction prohibiting us from marketing or selling certain services or using certain brands. Even if we have an agreement for indemnification against such costs, the party providing such indemnification may be unwilling or unable to comply with its indemnification obligations. If we cannot or do not license the infringed technology on reasonable terms or substitute similar technology from another source, our revenues and earnings could be adversely impacted.
Any acquisitions, partnerships or joint ventures that we make or enter into could disrupt our business and harm our financial condition.
We evaluate, and expect in the future to evaluate, potential strategic acquisitions of, and partnerships or joint ventures with, complementary businesses, services or technologies. We may not be successful in identifying acquisition, partnership and joint venture targets. In addition, we may not be able to successfully finance or integrate any businesses, services or technologies that we acquire or with which we form a partnership or joint venture—including, but not limited to, our acquisition of SPS Capital in 2022 (see “Item 4. Information on the Company—A. History and Development of the Company—Our History—Acquisition of SPS Capital”), our strategic partnership with Ares Management (see “Item 4. Information on the Company—A. History and Development of the Company—Our History—Ares Investment) and our pending business combination with Compass (see “Item 4. Information on the Company—A. History and Development of the Company—Recent Events—Business Combination with Compass”). For example, we may lose clients as a result of any acquisition, partnership or joint venture. In addition, we may be unable to realize the expected benefits, synergies or developments that we may initially anticipate. Furthermore, the integration of any acquisition, partnership or joint venture may divert management’s time and resources from our core business and disrupt our operations.
Certain acquisitions, partnerships and joint ventures we make may prevent us from competing for certain clients or in certain lines of business and may lead to a loss of clients. In addition, we may spend time and money on projects that do not increase our revenue or profitability. To the extent we finance any acquisition or investment in cash, it would reduce our cash reserves, and to the extent the purchase price is paid with our common shares, it could be dilutive to our shareholders. To the extent we finance any acquisition or investment with the proceeds from the incurrence of debt, this would increase our level of indebtedness and could negatively affect our liquidity, credit rating and restrict our operations. Our competitors may be willing to pay more than us for acquisitions or investments, which may cause us to lose certain opportunities that we would otherwise desire to complete. Moreover, we may face contingent liabilities in connection with our acquisitions and joint ventures, including, among others, (1) judicial and/or administrative proceeding or contingencies relating to the company, asset or business acquired, including civil, regulatory, tax, labor, social security, environmental and intellectual property proceedings or contingencies; and (2) financial, reputational and technical issues, including with respect to accounting practices, financial statement disclosures and internal controls, as well as other regulatory or compliance matters, all of which we may not have identified as part of our due diligence process and that may not be sufficiently indemnifiable under the relevant acquisition or joint venture agreement. We cannot assure you that any acquisition, partnership, investment or joint venture we make will not have a material adverse effect on our business, financial condition and results of operations.
For more information on the risks relating to our business combination with Compass, see “—Certain Risks Relating to the Compass Transaction.”
40
Table of Contents
Our risk management policies and procedures may not be fully effective in mitigating our risk exposure in all market environments or against all types of risks, which could expose us to losses and liability and otherwise harm our business.
We operate in a dynamic industry, and we have experienced significant change in recent years, and the emergence of new risks within the industries in which we operate or may operate in the future. Accordingly, our risk management policies and procedures may not be fully effective in identifying, monitoring and managing our risks. Some of our risk evaluation methods depend upon information provided by others and public information regarding markets, clients or other matters that are otherwise inaccessible by us. In some cases, however, that information may not be accurate, complete or up to date. If our policies and procedures are not fully effective or we are not always successful in capturing all risks to which we and our funds are or may be exposed, we and our funds may suffer harm to our reputation or be subject to litigation or regulatory actions that could have a material adverse effect on our business, financial condition and results of operations.
When our products and services are used in connection with illegitimate transactions we may be exposed to governmental and regulatory sanctions, including outside of Brazil (for example, U.S. anti-money laundering and economic sanctions violations). Our risk management policies, procedures, techniques, and processes may not be sufficient to identify all of the risks to which we and our funds are exposed, to enable us to mitigate the risks we have identified, or to identify additional risks to which we and our funds may become subject in the future. Furthermore, if our risk management policies and processes contain errors or are otherwise ineffective, we and our funds may suffer large financial losses, may be subject to civil and criminal liability, and our business may be materially and adversely affected.
We may not be able to maintain adequate insurance coverage on acceptable terms, or at all, which could have a material adverse effect on our business and financial condition.
We have insurance coverage for, among other things, damages and crimes against property, business trips, and directors’ and officers’ liability for some of our subsidiaries. However, we may experience claims in excess of or not covered by our current insurance policies. For example, given the size of certain of our funds and their investments, the relevant member of Vinci Partners (such as the fund managers or advisors to such funds) could be subject to material legal or regulatory actions, including from dissatisfied fund investors, regulators or other third parties, which may not be covered by our current insurance coverage. Further, damage caused to us could, even if covered by our insurance coverage, result in increased insurance premiums. We may not be able to obtain or maintain liability insurance in the future on acceptable terms, or at all, which could in turn create a need or desire for us to build up an internal contingency reserve to cover risks, thus affecting our financial position, which would adversely affect our business and the trading price of our Class A common shares.
Our due diligence processes for investments may not reveal all relevant facts and potential liabilities, which could result in a material adverse effect on our business and financial condition.
We continuously evaluate and carry out due diligence on a broad range of investment opportunities, some of which lead to investment while some do not. When conducting due diligence review of an investment, reliance may be placed on available resources which often include information provided by the target of the investment and, in some cases, third-party investigations and due diligence reports. Information provided or obtained from third-party sources may be limited and could, in some cases, be inaccurate or misleading. Thus, we cannot be certain that the due diligence investigations carried out with respect to an investment opportunity will reveal or highlight all relevant facts, opportunities or risks, including any ongoing fraud, which might be necessary or helpful in evaluating such an investment opportunity. Accordingly, there is a risk that the success or future performance of an investment might fall short compared to the financial projections used when evaluating such investment, which may affect our fund’s results.
Contingent liabilities could harm fund performance.
We may acquire or cause our funds to acquire companies or effect an investment that is subject to contingent liabilities, which includes our recent acquisition of SPS Capital. See “Item 4. Information on the Company—A. History and Development of the Company—Our History—Acquisition of SPS Capital.” Such contingent liabilities could be unknown to us at the time of acquisition or, if they are known to us, we may not accurately assess or protect against the risks that they present. Acquired contingent liabilities could thus result in unforeseen losses for our funds.
41
Table of Contents
In addition, in connection with the disposition of an investment in a portfolio company, a fund may be required to make representations about the business and financial affairs of such portfolio company typical of those made in connection with the sale of a business. A fund may also be required to indemnify the purchasers of such investment to the extent that any such representations are inaccurate. These arrangements may result in the incurrence of contingent liabilities by a fund, even after the disposition of an investment. Accordingly, the inaccuracy of representations and warranties made by a fund could harm such fund’s performance.
We may not be able to obtain and maintain requisite regulatory approvals and permits, including licenses for our fund operations.
We are required to maintain regulatory approvals and authorizations. There is a risk that we will not have the ability to obtain and retain requisite approvals and permits from relevant governmental authorities and other organizations, and to comply with applicable laws and regulations, or be able to do so without incurring undue costs and delays, which may result in a financial loss for us. A loss of the requisite approvals and/or permits, or the loss of relevant approvals and/or permits for us to operate or market funds within a certain area or generally, may result in the wind-down or liquidation of existing Vinci Partners funds, and could accordingly have a material adverse effect on the size of our AUM and thus also affect management fees that we receive, as well as the ability to receive performance fees and investment income.
We are subject to risks related to conflicts of interest.
Various conflicts of interest may arise with regard to our operations, our funds, our shareholders and our fund investors. Failure to appropriately deal with conflicts of interest as they arise, or the appearance of conflicts of interest, could harm our brand and reputation or result in potential liability for us, and could have a material adverse effect on our operations, financial position and earnings.
Our funds invest in a broad range of asset classes, including in the equity of portfolio companies, debt securities and corporate loans. In certain cases, certain of our funds may invest in different parts of the same company’s capital structure. In those cases, the interests of the different funds may not always be aligned, which could create actual or potential conflicts of interest or give the appearance of such conflicts. For example, one of our private equity funds could have an interest in pursuing an acquisition, divestiture or other transaction that, in that fund’s judgment, could enhance the value of the private equity investment, even though the proposed transaction could subject a Vinci Partners credit fund’s debt investment to additional or increased risks.
To the extent that any potential investment opportunities have been identified by us, including opportunities to co-invest with other investment managers; which fall within the investment mandate of several of our funds, conflicts of interest may arise in relation to the allocation of the investment opportunity and which fund will pursue the potential investment, in particular when such funds are both managed by the same independent fund manager appointed to act as alternative investment fund manager, and their fund management team. Moreover, we may be subject to conflicts of interest arising from co-investment opportunities where investment advisors to our funds or to investment vehicles with which we co-invest may have an incentive to provide potential co-investment opportunities to certain investors in lieu of others and/or in lieu of an allocation to our funds (including, for example, as part of an investor’s overall strategic relationship with us) if such allocations are expected to generate relatively greater fees or performance allocations to us than would arise if such co-investment opportunities were allocated otherwise.
We have in the past invested alongside our investors, and while we have not targeted any specific investments as of the date of this annual report, we expect to make investments alongside our investors in the future. While we follow certain internal guidelines and CVM rules in respect of making such investments, these investments could lead to potential conflicts of interest with our clients. When we invest alongside our investors, we make such investments under the same conditions and according to the same fee structures, paying the same management and performance fees. In respect of public offerings, CVM rules prohibit investments by related persons if there is excess demand greater than one third of the amount of securities being offered, and we must adhere to these rules in connection with public offerings of any of our funds. For open-ended funds distributed by us or by third parties, any investor, including us, can invest or divest at any time, though such investor (including us) must comply with the provisions of the respective funds’ bylaws. In the case of our listed funds, any trade made by us can only be
42
Table of Contents
executed after first obtaining written pre-clearance from our compliance department. While we believe these conditions, measures, and internal protocols adequately address potential conflicts of interests that may arise from investing alongside our clients, there can be no assurance that we will adequately address all potential conflicts of interest, which could have an adverse effect on our customer relationships, thereby adversely affecting our reputation and our business.
Our funds may acquire investments from, or sell investments to, other Vinci Partners funds, and members of the board of the general partner or the fund manager of our funds may be officers or directors of entities which are not part of Vinci Partners and which provide advice or services to, or engage in other transactions with, a Vinci Partners fund or to one or more portfolio companies of a Vinci Partners fund. Such conflicts of interest may not always be properly disclosed. According to our internal policies, our officers, directors, members, managers, and employees are prohibited from holding an interest in a portfolio company of our private funds, unless otherwise authorized by the compliance department and in certain cases where required by law to maintain plurality of partners. However, if our officers, directors, members, managers, employees, or other legal entities or entities of Vinci Partners hold or acquire a direct or indirect interest in a portfolio company of a Vinci Partners fund, this may create a conflict of interest. Such conflicts may result in litigation arising from investor dissatisfaction and may cause fund investors to explore withdrawing or cancelling their commitments to a Vinci Partners fund, or not to invest in new Vinci Partners funds, which could affect the size of the AUM being managed in existing Vinci Partners funds.
Certain policies and procedures implemented to mitigate potential conflicts of interest and address certain regulatory requirements may reduce the synergies across our various businesses.
Because we act in portfolio management, in distribution of our funds, and in advisory services, we may be subject to a number of actual and potential conflicts of interest and subject to greater regulatory oversight and more legal and contractual restrictions than that to which we would otherwise be subject if we had just one line of business. To mitigate these conflicts and address regulatory, legal and contractual requirements across our various businesses, we have implemented certain policies and procedures (for example, information walls) that may reduce the positive synergies that we cultivate across these businesses for purposes of identifying and managing attractive investments. For example, we may come into possession of material non-public information with respect to issuers in which we may be considering making an investment or issuers in which our affiliates may hold an interest. As a consequence of such policies and procedures, we may be precluded from providing such information or other ideas to our other businesses that might be of benefit to them.
Changes to applicable accounting standards, or changes to the interpretations thereof, could have a material adverse effect on Vinci Partners.
Vinci Partners applies IFRS Accounting Standards in the preparation of its financial statements. In preparing our financial statements, we make judgments and accounting estimates that affect the application of our accounting policies and the reported amounts of assets, liabilities, income, including the recognition of performance fees, and expenses. Valuation methodologies for certain assets in our funds can be subject to significant subjectivity and the fair value of assets established pursuant to such methodologies may never be realized, and valuation methodologies for historical Vinci Partners funds may differ to the valuation methodologies used for current or future Vinci Partners funds. Amendments to, and changes to interpretations of, existing accounting standards could have a significant effect on Vinci Partners’ financial condition, and also result in extensive adoption costs.
The ability to comply with applicable accounting standards depends in some instances on determinations of fact and interpretations of complex provisions for which no clear precedent or authority may be available, or where only limited guidance may be available. If we are unable to accurately apply the relevant accounting standards, our financial reporting could be incorrect, and could require a restatement of our financial statements and result in a material adverse effect on our reputation, our business, our financial condition and results of operations, thereby adversely affecting the market price of our Class A common shares.
Potential changes in the insurance brokerage regulatory environment could have a material adverse effect on our business, financial condition, operating results and prospects for expansion.
The activities of our subsidiary Vinci Vida e Previdência S/A, or VVP, is subject to specific Brazilian laws and regulation enacted by the SUSEP and is licensed to operate life insurance and open-ended pension plans in Brazil. Changes in the laws and regulations applicable to the insurance and reinsurance market, and insurance brokers,
43
Table of Contents
could have a material adverse effect on the business of insurance companies. There is no guarantee that the Brazilian government, whether through SUSEP or any other instrumentality/government agency, will not change these laws and regulations, which may prevent or restrict the operations of VVP, adversely affecting our business, financial condition, operating results and prospects.
Actual or potential epidemics, pandemics, outbreaks, or other public health crises may have an adverse impact on our investment portfolio and consequently our business and financial condition.
Our portfolio investments and our business could be materially and adversely affected by the risks (or the public perception of the risks) related to an epidemic, pandemic, outbreak, or other public health crises. Such public health crises may negatively impact the global economy, disrupt supply chains, and create significant volatility in global financial markets. For example, the recent outbreak of COVID-19 pandemic caused the levels of equity and other financial markets to decline sharply and to become volatile, and the resulting market volatility caused a number of planned public stock offerings and merger and acquisition transactions in Brazil to be postponed or cancelled.
Public health crises and government measures taken in response thereto may lead to significant disruptions in our funds’ portfolio companies’ businesses and to long-term disruptions or closures. In addition, significant market fluctuations or macroeconomic conditions driven by any such crises and related developments may result in fluctuations in the fair value component of our assets under management, or AUM, and could result in additional fluctuations in our AUM depending on their severity and extent. For example, one lasting macroeconomic effect of the COVID-19 pandemic was the increase in government expenditures and a sharp reduction in interest rates to minimize the negative economic impact at the time of the crisis. These stimuli led to a global surge in inflation and, as a result, a sharp rise in interest rates in the post-pandemic period. Increased real interest rates have led and may continue to lead to sudden changes in global liquidity conditions causing increased volatility in asset prices around the world and, therefore, adversely affect financial markets in the future.
The ultimate extent of any such epidemics, pandemics, outbreaks or other public health crises on our business, financial condition and results of operations would depend on future developments, which are highly uncertain and cannot be predicted with any certainty. Such developments could therefore have a material adverse effect on our business, financial condition and results of operations, and it may also have the effect of heightening many of the other risks described in this “Risk Factors” section.
Some of our commercial notes may contain restrictive covenants, and any default or failure to comply with such covenants may have a material adverse effect on our cash flows.
The agreement governing our commercial notes contains, and any future loans and financing that we take on may contain, standard restrictive covenants, including financial covenants. This agreement provides for the acceleration of our obligations on the commercial notes upon the occurrence of an event of default as defined under such agreement. In addition, we are required to comply with financial covenants on an annual basis, beginning on December 31, 2022, and non-financial restrictive covenants. Failure to comply with or fulfill any of these restrictions, covenants, financial metrics or financial tests could result in a default under these agreements, which would have a material adverse effect on our cash flows.
Certain Risks Relating to the Compass Transaction
Our and Compass’ business relationships may be subject to disruption due to uncertainty associated with the Compass Transaction.
Parties with which we or Compass do business may experience uncertainty associated with the Compass Transaction, including with respect to current or future business relationships with us, Compass or the combined business. Our and Compass’ business relationships may be subject to disruption as clients and others may attempt to negotiate changes in existing business relationships or consider entering into business relationships with parties other than us, Compass or the combined business. These disruptions could have a material and adverse effect on the businesses, financial condition, results of operations or prospects of the combined business, including a material and adverse effect on our ability to realize the anticipated benefits of the Compass Transaction. The risk and adverse effect of such disruptions could be exacerbated by a delay in the completion or termination of the Compass Transaction.
44
Table of Contents
Until the completion or termination of the Compass Transaction, we and Compass are prohibited from entering into certain transactions and taking certain actions that might otherwise be beneficial to us, Compass and/or our respective shareholders.
From and after the date of the agreements governing the Compass Transaction and prior to completion of the Compass Transaction, such agreements restrict us and Compass from taking specified actions without the consent of the other party and requires that the business of each company and its respective subsidiaries be conducted independently in the ordinary course in all material respects. These restrictions may prevent us or Compass from taking actions that would be beneficial. Adverse effects arising from these restrictions during the pendency of the Compass Transaction could be exacerbated by any delays in consummation or termination of the Compass Transaction.
Third parties may terminate or alter existing contracts or relationships with Compass.
Compass may have contracts with certain business partners that may require Compass to obtain consent from these other parties in connection with the Compass Transaction. If these consents cannot be obtained, the counterparties to these contracts and other third parties with which Compass currently has relationships may have the ability to terminate, reduce the scope of or otherwise materially adversely alter their relationships with Compass in anticipation of the Compass Transaction, or with the combined company following the Compass Transaction. The pursuit of such rights may result in the combined company suffering a loss of potential future revenue or incurring liabilities in connection with a breach of such agreements and losing rights that are material to its business. Any such disruptions could limit the combined company’s ability to achieve the anticipated benefits of the Compass Transaction. The adverse effect of such disruptions could also be exacerbated by a delay in the completion or termination of the Compass Transaction.
Obtaining required approvals and satisfying closing conditions may prevent or delay completion of the Compass Transaction.
The Compass Transaction is subject to a number of conditions to closing as specified in the agreements governing the Compass Transaction, including: (i) all required consents, clearances, authorizations and approvals pursuant to foreign investments and other laws and regulations in certain jurisdictions, as applicable, having been obtained, (ii) no law, order, injunction or decree will be in effect that prevents, makes illegal or prohibits the Compass Transaction, and (iii) the increase in our share capital to effect the issuance of registered shares to Compass shareholders and the required related amendments to our governing documents in connection therewith has been registered with the Cayman Islands registry of companies. Although we and Compass have agreed in such agreements to use our reasonable best efforts, subject to certain limitations, to make certain governmental filings or obtain the required governmental authorizations, as the case may be, no assurance can be given that the required approvals will be obtained or that the required conditions to closing will be satisfied, and, if all required approvals are obtained and the conditions are satisfied, no assurance can be given as to the terms, conditions and timing of the approvals. Any delay in completing the Compass Transaction could cause the combined company not to realize, or to be delayed in realizing, some or all of the benefits that we expect to achieve if the Compass Transaction is successfully completed within its expected time frame.
Failure to complete the Compass Transaction could negatively impact our stock price and our future business and financial results.
Either we or Compass may terminate the agreements governing the Compass Transaction under certain circumstances, including, among other reasons, if the Compass Transaction is not consummated by such time as set forth in the agreements governing the Compass Transaction. If the Compass Transaction is not completed for any reason, our ongoing business may be adversely affected and, without realizing any of the benefits of having completed the Compass Transaction, we could be subject to a number of risks, including the following:
| • | we may experience negative reactions from the financial markets, including negative impacts on our stock price, and from our clients, staff and vendors; |
| • | we will be required to pay certain transaction expenses and other costs relating to the Compass Transaction, whether or not the Compass Transaction is completed; |
45
Table of Contents
| • | the agreements governing the Compass Transaction place certain restrictions on the conduct of our business prior to completion of the Compass Transaction; and |
| • | matters relating to the Compass Transaction (including integration planning) will require substantial commitments of time and resources by our management, which would otherwise have been devoted to day-to-day operations and other opportunities that may have been beneficial to us as an independent company. |
There can be no assurance that the risks described above will not materialize. If any of those risks materialize, they may materially and adversely affect our businesses, financial condition, financial results and stock price.
We and Compass may have difficulty attracting, motivating and retaining executives and other key employees in light of the Compass Transaction.
Uncertainty about the effect of the Compass Transaction on our employees and Compass’ employees may have an adverse effect on each of us and Compass separately and consequently the combined business. This uncertainty may impair our and Compass’ ability to attract, retain and motivate key personnel until the Compass Transaction is completed. Employee retention may be particularly challenging during the pendency of the Compass Transaction, as our employees and Compass’ employees may experience uncertainty about their future roles with the combined business. Furthermore, if our key employees or Compass’ key employees depart or are at risk of departing, including because of issues relating to the uncertainty and difficulty of integration, financial security or a desire not to become team members of the combined business, we may have to incur significant costs in retaining such individuals or in identifying, hiring and retaining replacements for departing employees, and our ability to realize the anticipated benefits of the Compass Transaction may be adversely affected.
We have incurred and will continue to incur significant expenses in connection with the Compass Transaction, regardless of whether the Compass Transaction is completed.
We have incurred and will continue to incur significant expenses related to the Compass Transaction. These expenses include, but are not limited to, fees related to arranging corporate advisory and opinion fees and expenses, legal fees, accounting fees and expenses, certain employee expenses, consulting fees, filing fees, printing expenses and other related fees and expenses. Many of these expenses will be payable by us regardless of whether the Compass Transaction is completed.
If our due diligence investigation of Compass was inadequate or if risks related to Compass’ business materialize, it could have a material adverse effect on our shareholders’ investment.
Even though we conducted a customary due diligence investigation of Compass, we cannot be sure that our diligence surfaced all material issues that may be present inside Compass or its business, or that it would be possible to uncover all material issues through a customary amount of due diligence, or that factors outside of Compass and its business and outside of its control will not arise later. If any such material issues arise or if known risks prove to be more significant than expected, the ongoing business of the combined company and our shareholders’ investment may be materially and adversely impacted.
The outstanding capital stock of Compass is privately held and is not traded in any public market. The lack of a public market makes it difficult to determine the fair market value of Compass. The aggregate consideration for the Compass is set forth in the agreements governing the Compass Transaction as a result of negotiations and because these share amounts are fixed, they will not adjust to factor in any change in the value of Compass before closing. As a result, there is no guarantee that the value of the aggregate consideration in the Compass Transaction will align with the actual value of Compass at closing.
After completion of the Compass Transaction, we may fail to realize the anticipated benefits of the Compass Transaction, which could adversely affect the value of registered shares.
The success of the Compass Transaction will depend, in part, on our ability to realize the anticipated benefits from combining the businesses of Vinci Partners and Compass. Our ability to realize these anticipated benefits, including in terms of revenue growth and product diversification, is subject to certain risks including:
46
Table of Contents
| • | our ability to successfully combine the businesses of Vinci Partners and Compass; |
| • | whether the combined businesses will perform as expected; and |
| • | the assumption of known and unknown liabilities of Compass. |
If we are not able to successfully integrate and combine the businesses of Vinci Partners and Compass within the anticipated time frame, or at all, the anticipated revenue growth, product diversification and other benefits of the Compass Transaction may not be realized fully or at all or may take longer to realize than expected, the combined businesses may not perform as expected, and the value of our Class A common shares may be adversely affected.
It is possible that the integration process could result in the loss of our key staff or Compass’ key staff, the disruption of either or both company’s ongoing businesses, higher than expected integration costs and an overall post-completion integration process that takes longer than originally anticipated. Specifically, issues that must be addressed to realize the anticipated benefits of the Compass Transaction so the combined business performs as expected include, among other things:
| • | identifying and adopting the best practices of the two organizations to position the combined business for future growth; |
| • | integrating the companies’ technologies, systems and services; |
| • | harmonizing the companies’ operating practices, reporting structure, staff development and compensation programs, internal controls and other policies, procedures and processes, including compliance by the acquired operations with IFRS Accounting Standards and the documentation and testing of internal control procedures under Section 404 of the Sarbanes-Oxley Act; |
| • | rebranding operations and addressing possible differences in business backgrounds, corporate cultures and management philosophies; |
| • | consolidating the companies’ corporate, administrative and information technology infrastructure; |
| • | maintaining existing agreements with clients and avoiding delays in entering into new agreements with prospective clients; and |
| • | identifying and eliminating redundant assets and expenses and consolidating locations of us and Compass that are currently in close proximity to each other. |
In addition, at times, the attention of certain members of either or both companies’ management and resources may be focused on completion of the Compass Transaction and the integration of the businesses of the two companies and diverted from day-to-day business operations, which may disrupt each company’s ongoing business and the business of the combined company.
We will incur significant integration-related costs in connection with the Compass Transaction and we may not be able to obtain the synergies of the combined company.
We will incur significant integration-related fees and costs related to formulating and implementing integration plans, including facilities and systems consolidation costs and staff-related costs. We continue to assess the magnitude of these costs, and additional unanticipated costs may be incurred in the Compass Transaction and the integration of Compass into our business. Although we expect that the elimination of duplicative costs, as well as the realization of other synergies and efficiencies related to the integration of the businesses, that may allow us to offset integration-related costs over time, this net benefit may not be achieved in the near term, or at all, and we may incur difficulties and delays in integrating Compass’ business following completion of the Compass Transaction or fully realizing the anticipated cost synergies and other benefits expected from the Compass Transaction.
47
Table of Contents
The market price for our Class A common shares following the completion of the Compass Transaction may be affected by factors different from, or in addition to, those that historically have affected or currently affect the market prices of our Class A common shares.
The results of operations of the combined company will be affected by some factors that are different from those currently or historically affecting our results of operations and those currently or historically affecting the results of operations of Compass. The results of operations of the combined company may also be affected by factors different from those that currently affect or have historically affected either Vinci Partners or Compass.
Certain Risks Relating to Brazil and Latin America
The Brazilian federal government has exercised, and continues to exercise, significant influence over the Brazilian economy. This involvement as well as Brazil’s political and economic conditions could harm us and the price of our Class A common shares.
The Brazilian federal government frequently exercises significant influence over the Brazilian economy and occasionally makes significant changes in policy and regulations. The Brazilian government’s actions to control inflation and other policies and regulations have often involved, among other measures, increases or decreases in interest rates, changes in fiscal policies, wage and price controls, foreign exchange rate controls, blocking access to bank accounts, currency devaluations, capital controls and import and export restrictions. We have no control over and cannot predict what measures or policies the Brazilian government may take in the future. We and the market price of our Class A common shares may be harmed by changes in Brazilian government policies, as well as general economic factors, including, without limitation:
| • | growth or downturn of the Brazilian economy; |
| • | interest rates and monetary policies; |
| • | exchange rates and currency fluctuations; |
| • | inflation; |
| • | liquidity of the domestic capital and lending markets; |
| • | import and export controls; |
| • | exchange controls and restrictions on remittances abroad and payments of dividends; |
| • | modifications to laws and regulations according to political, social and economic interests; |
| • | fiscal policy, monetary policy and changes in tax laws; |
| • | economic, political and social instability, including general strikes and mass demonstrations; |
| • | labor and social security regulations; |
| • | energy and water shortages and rationing; |
| • | commodity prices; |
| • | public health crises; and |
| • | other political, diplomatic, social and economic developments in or affecting Brazil. |
Uncertainty over whether the Brazilian federal government will implement reforms or changes in policy or regulation affecting these or other factors in the future may affect economic performance and contribute to economic uncertainty in Brazil, which may have an adverse effect on our activities and consequently our results of operations, and may also adversely affect the trading price of our Class A common shares. Recent economic and political
48
Table of Contents
instability has led to a negative perception of the Brazilian economy and higher volatility in the Brazilian securities markets, which also may adversely affect us and our Class A common shares. See “—Economic uncertainty and political instability in Brazil may harm us and the price of our Class A common shares” and “Item 5. Operating and Financial Review and Prospects—Significant Factors Affecting Our Results of Operations—Brazilian Macroeconomic Environment.”
Economic uncertainty and political instability in Brazil may harm us and the price of our Class A common shares.
Brazil’s political environment has historically influenced, and continues to influence, the performance of the country’s economy. Political crises have affected and continue to affect the confidence of investors and the general public, which have historically resulted in economic deceleration and heightened volatility in the securities offered by companies with significant operations in Brazil.
The recent economic instability in Brazil has contributed to a decline in market confidence in the Brazilian economy as well as to a deteriorating political environment. In addition, various past and ongoing investigations into allegations of money laundering and corruption being conducted by the Office of the Brazilian Federal Prosecutor, including the largest such investigation, known as “Operação Lava Jato,” have negatively impacted the Brazilian economy and political environment. The potential outcome of these investigations is uncertain, but they have already had an adverse impact on the image and reputation of the implicated companies, and on the general market perception of the Brazilian economy.
A failure by the Brazilian government to implement necessary reforms may result in diminished confidence in the Brazilian government’s budgetary condition and fiscal stance, which could result in downgrades of Brazil’s sovereign foreign credit rating by credit rating agencies, negatively impact Brazil’s economy, lead to further depreciation of the real and an increase in inflation and interest rates, adversely affecting our business, financial condition and results of operations.
Any of the above factors may create additional political uncertainty, which could harm the Brazilian economy and, consequently, our business and the value of our investments, and could adversely affect our financial condition, results of operations and the price of our Class A common shares.
Inflation and certain measures by the Brazilian government to curb inflation have historically harmed the Brazilian economy and Brazilian capital markets, and high levels of inflation in the future would harm our business and the price of our Class A common shares.
In the past, Brazil has experienced extremely high rates of inflation. Inflation and some of the measures taken by the Brazilian government in an attempt to curb inflation have had significant negative effects on the Brazilian economy generally. Inflation, policies adopted to curb inflationary pressures and uncertainties regarding possible future governmental intervention have contributed to economic uncertainty and heightened volatility in the Brazilian capital markets.
According to the National Consumer Price Index (Índice Nacional de Preços ao Consumidor Amplo), or IPCA, which is published by the Brazilian Institute for Geography and Statistics (Instituto Brasileiro de Geografia e Estatística), or IBGE, Brazilian inflation rates were 4.6%, 5.8% and 10.1% for the years ended December 31, 2023, 2022 and 2021, respectively. Brazil may continue to experience high levels of inflation in the future and inflationary pressures may lead to the Brazilian government intervening in the economy and introducing policies that could harm our business and the trading price of our Class A common shares. In the past, the Brazilian government’s interventions included the maintenance of a restrictive monetary policy with high interest rates that restricted credit availability and reduced economic growth, causing volatility in interest rates. For example, the official interest rate in Brazil decreased from 14.25% as of December 31, 2015, to 6.50% as of March 28, 2018 and maintained at that level until December 31, 2018. The COPOM reconfirmed the SELIC Rate of 6.50% in the first half of 2019, but reduced the SELIC Rate to 6.00% on August 1, 2019, and further reduced the rate to 4.50% on December 12, 2019. On February 5, 2020, the COPOM reduced the SELIC Rate to 4.25% and further reduced the rate to 3.75% on March 18, 2020, to 3.00% on June 5, 2020, to 2.25% on June 17, 2020, to 2.00% on August 5, 2020. Then, after the rates were kept stable for four rounds of meetings, the COPOM repeatedly raised the SELIC Rate to 9.25% and 13.75% as of December 31, 2021 and 2022, respectively. Conversely, more lenient government and Brazilian Central Bank policies and interest rate decreases have triggered and may continue to trigger increases in inflation. In
49
Table of Contents
particular, in the third quarter of 2023, the COPOM reversed the increasing SELIC Rate trend by decreasing the SELIC Rate to 13.25% on August 3, 2023, to 12.75% on September 21, 2023, to 12.25% on November 3, 2023 and to 11.75% on December 13, 2023. As of the date of this annual report, the SELIC Rate was set at 10.75%. Consequently, growth volatility and the need for sudden and significant interest rate changes could negatively affect us and affect our indebtedness.
Exchange rate instability may have adverse effects on the Brazilian economy, us and the price of our Class A common shares.
The Brazilian currency has been historically volatile and has been devalued frequently over the past three decades. Throughout this period, the Brazilian government has implemented various economic plans and used various exchange rate policies, including sudden devaluations, periodic mini-devaluations (during which the frequency of adjustments has ranged from daily to monthly), exchange controls, dual exchange rate markets and a floating exchange rate system. Although long-term depreciation of the Brazilian real is generally linked to the rate of inflation in Brazil, depreciation of the real occurring over shorter periods of time has resulted in significant variations in the exchange rate between the real, the U.S. dollar and other currencies. The real/U.S. dollar exchange rate reported by the Brazilian Central Bank was R$5.5805 per US$1.00 on December 31, 2021, which reflected a 7.4% depreciation in the real against the U.S. dollar during the year. The real/U.S. dollar exchange rate reported by the Brazilian Central Bank was R$5.2177 per US$1.00 on December 31, 2022, which reflected a 6.5% appreciation in the real against the U.S. dollar during the year. The real/U.S. dollar exchange rate reported by the Brazilian Central Bank was R$4.8413 per US$1.00 on December 31, 2023, which reflected a 7.4% appreciation in the real against the U.S. dollar during the year. As of March 28, 2024, the real/U.S. dollar exchange rate reported by the Brazilian Central Bank was R$4.9962 per US$1.00. There can be no assurance that the real will not appreciate or depreciate against the U.S. dollar or other currencies in the future.
Further devaluation of the real relative to the U.S. dollar could create inflationary pressures in Brazil and cause the Brazilian government to, among other measures, further increase interest rates. Any depreciation of the real may generally restrict access to the international capital markets. It would also reduce the U.S. dollar value of our results of operations. Restrictive macroeconomic policies could reduce the stability of the Brazilian economy and harm our results of operations and profitability. In addition, domestic and international reactions to restrictive economic policies could have a negative impact on the Brazilian economy. These policies and any reactions to them may harm us by curtailing access to foreign financial markets and prompting further government intervention. A devaluation of the real relative to the U.S. dollar may also, as in the context of the current economic slowdown, decrease consumer spending, increase deflationary pressures and reduce economic growth.
On the other hand, an appreciation of the real relative to the U.S. dollar and other foreign currencies may worsen the Brazilian current accounts. We and certain of our suppliers purchase services from countries outside Brazil, and thus changes in the value of the U.S. dollar compared to other currencies may affect the costs of services that we purchase. Depending on the circumstances, either devaluation or appreciation of the real relative to the U.S. dollar and other foreign currencies could restrict the growth of the Brazilian economy, as well as our business, results of operations and profitability.
Infrastructure and workforce deficiency in Brazil may impact economic growth and have a material adverse effect on us.
Our performance depends on the overall health and growth of the Brazilian economy. Brazilian GDP growth has fluctuated over the past years, with growth of 3.0% in 2013, growth of 0.5% in 2014, contraction of 3.5% in 2015, contraction of 3.3% in 2016, growth of 1.3% in 2017, growth of 1.8% in 2018, growth of 1.4% in 2019, contraction of 4.1% in 2020, growth of 4.6% in 2021, growth of 2.9% in 2022 and growth of 2.5% in 2023. Growth is limited by inadequate infrastructure, including potential energy shortages and deficient transportation, logistics and telecommunication sectors, general strikes, the lack of a qualified labor force, and the lack of private and public investments in these areas, which limit productivity and efficiency. Any of these factors could lead to labor market volatility and generally impact income, purchasing power and consumption levels, which could limit growth and ultimately have a material adverse effect on us.
50
Table of Contents
Developments and the perceptions of risks in other countries, including other emerging markets, the United States and Europe, may harm the Brazilian economy and the price of our Class A common shares.
The market for securities offered by companies with significant operations in Brazil is influenced by economic and market conditions in Brazil and, to varying degrees, market conditions in other Latin American and emerging markets, as well as the United States, Europe and other countries. To the extent the conditions of the global markets or economy deteriorate, the business of companies with significant operations in Brazil may be harmed. The weakness in the global economy has been marked by, among other adverse factors, lower levels of consumer and corporate confidence, decreased business investment and consumer spending, increased unemployment, reduced income and asset values in many areas, reduction of China’s growth rate, currency volatility and limited availability of credit and access to capital. Developments or economic conditions in other emerging market countries have at times significantly affected the availability of credit to companies with significant operations in Brazil and resulted in considerable outflows of funds from Brazil, decreasing the amount of foreign investments in Brazil.
Crises and political instability in other emerging market countries, the United States, Europe or other countries, including increased international trade tensions and protectionist policies, could decrease investor demand for securities offered by companies with significant operations in Brazil, such as our Class A common shares. In June 2016, the United Kingdom had a referendum in which the majority voted to leave the European Union (so-called “Brexit”). The announcement of Brexit caused significant volatility in global stock markets and currency exchange rate fluctuations. The United Kingdom formally withdrew from the European Union on January 31, 2020. On December 24, 2020, the United Kingdom and the European Commission reached an agreement on the terms of its future cooperation with the European Union. On December 31, 2020, the European Union (Future Relationship) Act was enacted in the United Kingdom and the agreement reached with the European Commission came into full force on May 1, 2021, after relevant E.U. institutions ratified the agreement. We have no control over and cannot predict the effect of United Kingdom’s exit from the European Union nor over whether and to which effect any other member state will decide to exit the European Union in the future. These developments, as well as potential crises and forms of political instability arising therefrom or any other as of yet unforeseen development, may harm our business and the price of our Class A common shares.
In addition, it is unclear the degree to which current political divisions in the United States will continue to influence policy action. Fighting inflation, orientation towards fiscal policy, energy and geopolitical strategies are divisive issues that may lead to sudden policy changes. We are also unable to predict the policies that will be adopted by eventual new presidential administrations and the effects of any such policies, if implemented. These political divisions and policies may materially adversely affect the United States and global economies and capital markets, including the Brazilian economy and capital markets, which may, in turn, materially adversely affect the trading price of our Class A common shares.
An escalation of the war in Ukraine or the conflicts in the Middle East may increase global risk aversion and adversely affect us and the price of our Class A common shares.
The ongoing military conflict between Russia and Ukraine has provoked strong reactions from the United States, the United Kingdom, the EU and various other countries around the world, including from the members of the North Atlantic Treaty Organization, or NATO. Following Russia’s invasion of Ukraine beginning on February 24, 2022, the United States, the United Kingdom, the EU and other countries announced broad economic sanctions against Russia, including financial measures such as freezing Russia’s central bank assets, limiting its ability to access its dollar reserves, the United States, the EU and the United Kingdom have also banned people and businesses from dealings with the Russian central bank, its finance ministry and its wealth funds, selected Russian banks will also be removed from Swift messaging system, which enables the smooth transfer of money across borders. Other sanctions by the United Kingdom include major Russian banks from the United Kingdom financial system, stopping them from accessing sterling and clearing payments, preventing major Russian companies and the country from raising finances or borrowing money on the United Kingdom markets, and establishing limits on deposits Russians can make at United Kingdom banks. The United States, the EU and the United Kingdom adopted personal measures, such as sanctions on individuals with close ties to Mr. Putin, and placed visa restrictions on several oligarchs, as well as their family members and close associates, and froze their assets.
51
Table of Contents
While the precise effect of the ongoing armed conflict and these sanctions on the Russian and global economies remains uncertain, should tensions remain at current heightened levels or continue to increase, markets may face continued volatility as well as economic and security consequences including, but not limited to, supply shortages of different kinds, increases in prices of commodities, including piped gas, oil and agricultural goods, among others. Given that Russia and Ukraine are among the largest grain exporters in the world, impacts on financial markets, inflation, interest rates, unemployment and other matters could affect the global economy. Particularly, these effects have resulted and could continue to result in increased inflation in Brazil and in measures by the Brazilian government to contain inflation, such as raising the interest rates, which could materially impact the cost of debt and third-party capital for financing and investing activities across industries. Other potential consequences include, but are not limited to, growth in the number of popular uprisings in the region, increased political discontent, especially in the regions most affected by the conflict or economic sanctions, an increase in cyberterrorism activities and attacks, exodus to regions close to the areas of conflict and an increase in the number of refugees fleeing across Europe, among other unforeseen social and humanitarian effects.
In addition, on October 7, 2023, Hamas launched an attack on Israel targeting Israeli civilians. In response, Israel declared war against Hamas, attacking Hamas targets in Gaza and the region. The war is causing a humanitarian crisis and the escalation of the conflict and any resulting conflicts in the region could lead to higher oil and gas prices, the imposition of sanctions, travel and import/export restrictions, increased inflationary pressures and market volatility, among other potential consequences. In response to the war in Gaza, since mid-November 2023, Houthi rebels in Yemen have targeted and carried out attacks on commercial shipping vessels travelling through the Red Sea which may result in further disruptions in supply chains. It is unclear whether these challenges and uncertainties will be contained or resolved, and what effects they may have on the global political and economic conditions in the long term.
As a company that operates globally, the adverse effects—global or localized—of the ongoing war between Russia and Ukraine, the conflicts in the Middle East and/or economic sanctions and import and/or export controls to be imposed on the Russian government by the United States, the United Kingdom, the EU or others, could have a material adverse effect on our or our portfolio companies’ business, results of operations or financial condition.
Any further downgrading of Brazil’s credit rating could reduce the trading price of our Class A common shares.
We may be harmed by investors’ perceptions of risks related to Brazil’s sovereign debt credit rating. Rating agencies regularly evaluate Brazil and its sovereign credit ratings, which are based on a number of factors including macroeconomic trends, fiscal and budgetary conditions, indebtedness metrics and the perspective of changes in any of these factors.
The rating agencies began to review Brazil’s sovereign credit rating in September 2015. Subsequently, the three major rating agencies downgraded Brazil’s investment-grade status:
| • | In 2015, Standard & Poor’s initially downgraded Brazil’s credit rating from BBB-negative to BB-positive and subsequently downgraded it again from BB-positive to BB, maintaining its negative outlook, citing a worse credit situation since the first downgrade. On January 11, 2018, Standard & Poor’s further downgraded Brazil’s credit rating from BB to BB-negative, and on December 11, 2019, the agency affirmed the rating at BB- and revised the outlook on Brazil to positive. On April 7, 2020, the rating was reaffirmed as BB- with stable outlook, reflecting uncertainties stemming from the coronavirus pandemic, along with how extraordinary government spending will adversely affect the fiscal performance in 2020. On November 30, 2021 and June 15, 2022, Standard & Poor’s further reaffirmed Brazil’s rating at BB- with stable outlook. On June 14, 2023, the agency affirmed the rating at BB- and revised the outlook on Brazil to positive. |
| • | In December 2015, Moody’s placed Brazil’s Baa3’s issue and bond ratings under review for downgrade and subsequently downgraded the issue and bond ratings to below investment grade, at Ba2 with a negative outlook, citing the prospect of a further deterioration in Brazil’s debt indicators, taking into account the low growth environment and the challenging political scenario. On April 9, 2018, Moody’s revised the outlook to stable, reaffirming the Ba2 rating. In September 2020, Moody’s maintained Brazil’s credit rating at Ba2 and with a stable outlook. In May 2020, Moody’s confirmed Brazil’s long-term foreign currency sovereign credit rating at Ba2 maintaining the stable outlook. On May 25, 2021, April 12, 2022 and October 20, 2023, Moody’s further reaffirmed Brazil’s rating at Ba2 with stable outlook. |
52
Table of Contents
| • | Fitch downgraded Brazil’s sovereign credit rating to BB-positive with a negative outlook, citing the rapid expansion of the country’s budget deficit and the worse-than-expected recession. In February 2018, Fitch downgraded Brazil’s sovereign credit rating again to BB-negative, citing, among other reasons, fiscal deficits, the increasing burden of public debt and an inability to implement reforms that would structurally improve Brazil’s public finances. In November 2020, Fitch Ratings affirmed Brazil’s long-term foreign currency sovereign credit rating at BB- with a negative outlook. On December 14, 2021, Fitch further reaffirmed Brazil’s credit rating at BB-negative with a negative outlook. On July 14, 2022, while reaffirming Brazil’s credit rating at BB-negative, Fitch changed its outlook on Brazil’s credit rating to a positive outlook. On July 26, 2023, Fitch upgraded Brazil’s credit rating at BB and changed its outlook on Brazil’s credit rating to a stable outlook. |
Brazil’s sovereign credit rating is currently rated below investment grade by the three main credit rating agencies. Consequently, the prices of securities offered by companies with significant operations in Brazil have been negatively affected. A prolongation or worsening of the current slow growth rates of the Brazilian economy and continued political uncertainty, among other factors, could lead to further ratings downgrades. Any further downgrade of Brazil’s sovereign credit ratings could heighten investors’ perception of risk and, as a result, cause the trading price of our Class A common shares to decline.
Certain Risks Relating to Our Class A Common Shares
Gilberto Sayão da Silva owns 100% of our outstanding Class B common shares, which represent approximately 75.6% of the voting power of our issued share capital, and controls all matters requiring shareholder approval. This concentration of ownership and voting power limits your ability to influence corporate matters.
Gilberto Sayão da Silva controls our company and does not hold any of our Class A common shares, though he beneficially owns 26.9% of our issued and outstanding share capital through his beneficial ownership of all of our outstanding Class B common shares, and consequently, 75.6% of the combined voting power of our issued share capital. Our Class B common shares are entitled to 10 votes per share and our Class A common shares are entitled to one vote per share. Our Class B common shares are convertible into an equivalent number of Class A common shares and generally convert into Class A common shares upon transfer, subject to limited exceptions. As a result, Mr. Sayão da Silva controls the outcome of all decisions at our shareholders’ meetings, and is able to elect a majority of the members of our board of directors. He is also able to direct our actions in areas such as business strategy, financing, distributions, acquisitions and dispositions of assets or businesses. For example, Mr. Sayão da Silva may cause us to make acquisitions that increase the amount of our indebtedness or outstanding Class A common shares, sell revenue-generating assets or inhibit change of control transactions that may benefit other shareholders. The decisions of Mr. Sayão da Silva on these matters may be contrary to your expectations or preferences, and they may take actions that could be contrary to your interests. He is able to prevent any other shareholders from blocking these actions. For further information regarding shareholdings in our company, see “Item 7. Major Shareholders and Related Party Transactions—A. Major Shareholders.” In addition, for so long as Mr. Sayão da Silva beneficially owns more than two-thirds of our issued share capital, he will also have the ability to unilaterally amend our Articles of Association, which may be amended only by special resolution of shareholders (requiring a two-thirds majority vote of those shareholders attending and voting at a quorate meeting).
So long as Mr. Sayão da Silva beneficially owns a sufficient number of Class B common shares, even if he beneficially owns significantly less than 50% of our outstanding share capital, he will be able to effectively control our decisions. However, if our Class B common shares at any time represent less than 10% of the total aggregate number of common shares in the capital of the company outstanding, each Class B common share then outstanding will automatically convert into one Class A common share. For a description of the dual class structure, see “Item 10. Additional Information—B. Memorandum and Articles of Association—Share Capital”
We have granted holders of our Class B common shares preemptive rights to acquire shares that we may sell in the future, which may impair our ability to raise funds.
Under our Articles of Association, each holder of our Class B common shares is entitled to preemptive rights to purchase additional common shares in the event that additional Class A common shares are issued, upon the same economic terms and at the same price, in order to maintain their proportional ownership interests, which represent approximately 26.9% of our issued and outstanding shares. The exercise by holders of our Class B common shares of preemptive rights may impair our ability to raise funds, or adversely affect the terms on which we are able to raise funds, as we may not be able to offer to new investors the quantity of our shares that they may desire to purchase.
53
Table of Contents
Our Articles of Association contain anti-takeover provisions that may discourage a third-party from acquiring us and adversely affect the rights of holders of our Class A common shares.
Our Articles of Association contain certain provisions that could limit the ability of others to acquire our control, including a provision that grants authority to our board of directors to establish and issue from time to time one or more series of preferred shares without action by our shareholders and to determine, with respect to any series of preferred shares, the terms and rights of that series. These provisions could have the effect of depriving our shareholders of the opportunity to sell their shares at a premium over the prevailing market price by discouraging third parties from seeking to obtain our control in a tender offer or similar transactions.
If securities or industry analysts do not publish research, or publish inaccurate or unfavorable research, about our business, the price of our Class A common shares and our trading volume could decline.
The trading market for our Class A common shares depends in part on the research and reports that securities or industry analysts publish about us or our business. If one or more of the analysts who cover us downgrade our Class A common shares or publish inaccurate or unfavorable research about our business, the price of our Class A common shares would likely decline. If one or more of these analysts cease coverage of our company or fail to publish reports on us regularly, demand for our Class A common shares could decrease, which might cause the price of our Class A common shares and trading volume to decline.
Our ability to pay dividends to our shareholders is restricted by applicable laws and regulations and by the ability of our subsidiaries to pay dividends to us.
We cannot guarantee that we will be able to pay dividends to holders of our Class A common shares. Holders of our Class A common shares are only entitled to receive cash dividends to the extent our board of directors declares and pays out of funds of the Company that are legally available for such payments. The declaration, payment and amount of any future dividends will be made at the discretion of our board of directors and will depend upon, among other things, the results of operations, cash flows and financial condition, operating and capital requirements, and other factors as our board of directors considers relevant. In addition, our holding company structure makes us dependent on the operations of our subsidiaries. See “—Certain Risks Relating to Our Business and Industry—Our holding company structure makes us dependent on the operations of our subsidiaries.” There is no assurance that future dividends will be paid, and if dividends are paid, there is no assurance with respect to the amount of any such dividend. See “Item 8. Financial Information—A. Consolidated Statements and Other Financial Information—Dividends and Dividend Policy.”
Our dual class capital structure means our shares will not be included in certain indices. We cannot predict the impact this may have on the trading price of our Class A common shares.
In 2017, FTSE Russell, S&P Dow Jones and MSCI announced changes to their eligibility criteria for inclusion of shares of public companies on certain indices to exclude companies with multiple classes of shares of common stock from being added to such indices. FTSE Russell announced plans to require new constituents of its indices to have at least five percent of their voting rights in the hands of public stockholders, whereas S&P Dow Jones announced that companies with multiple share classes, such as ours, will not be eligible for inclusion in the S&P 500, S&P MidCap 400 and S&P SmallCap 600, which together make up the S&P Composite 1500. MSCI also opened public consultations on their treatment of no-vote and multi-class structures and temporarily barred new multi-class listings from its ACWI Investable Market Index and U.S. Investable Market 2500 Index; however, in October 2018, MSCI announced its decision to include equity securities “with unequal voting structures” in its indices and to launch a new index that specifically includes voting rights in its eligibility criteria. We cannot assure you that other stock indices will not take a similar approach to FTSE Russell, S&P Dow Jones and MSCI in the future. Under the announced policies, our dual class capital structure would make us ineligible for inclusion in any of these indices and, as a result, mutual funds, exchange-traded funds and other investment vehicles that attempt to passively track these indices will not invest in our stock. It continues to be somewhat unclear what effect, if any, these policies will have on the valuations of publicly traded companies excluded from the indices, but in certain situations they may depress these valuations compared to those of other similar companies that are included. Exclusion from indices could make our Class A common shares less attractive to investors and, as a result, the market price of our Class A common shares could be adversely affected.
54
Table of Contents
The dual class structure of our common stock has the effect of concentrating voting control with Gilberto Sayão da Silva as the beneficial owner of the entirety of our Class B common shares; this will limit or preclude your ability to influence corporate matters.
Each Class A common share entitles its holder to one vote per share and each Class B common share entitles its holder to ten votes per share, so long as the total number of the issued and outstanding Class B common shares is at least 10% of the total number of shares outstanding. The beneficial owner of all of our Class B common shares is Gilberto Sayão da Silva. See “Item 7. Major Shareholders and Related Party Transactions—A. Major Shareholders.” Due to the ten-to-one voting ratio between our Class B and Class A common shares, Mr. Sayão da Silva controls a majority of the combined voting power of our common shares and therefore be able to control all matters submitted to our shareholders so long as the total number of the issued and outstanding Class B common shares is at least 10% of the total number of shares outstanding and the total number of the issued.
In addition, our Articles of Association provide that at any time when there are Class A common shares in issue, additional Class B common shares may only be issued pursuant to (1) a share split, subdivision of shares or similar transaction or where a dividend or other distribution is paid by the issue of shares or rights to acquire shares or following capitalization of profits; (2) a merger, consolidation, or other business combination involving the issuance of Class B common shares as full or partial consideration; or (3) an issuance of Class A common shares, whereby a holder of the Class B common shares is entitled to purchase a number of Class B common shares that would allow such holder to maintain its proportional ownership interests in us (following an offer by us to each holder of Class B common shares to issue to such holder, upon the same economic terms and at the same price, such number of Class B common shares as would ensure such holder may maintain a proportional ownership interest in us pursuant to our Articles of Association).
In light of the above provisions relating to the issuance of additional Class B common shares, as well as the ten-to-one voting ratio of our Class B common shares and Class A common shares, the holder of our Class B common shares controls all matters requiring shareholder approval. This concentrated control limits or precludes our shareholders’ ability to influence corporate matters for the foreseeable future. For a description of our dual class structure, see “Item 10. Additional Information—B. Memorandum and Articles of Association—Voting Rights.”
Class A common shares eligible for future sale may cause the market price of our Class A common shares to drop significantly.
The market price of our Class A common shares may decline as a result of sales of a large number of our Class A common shares in the market (including Class A common shares issuable upon conversion of Class B common shares) or the perception that these sales may occur. These sales, or the possibility that these sales may occur, also might make it more difficult for us to sell equity securities in the future at a time and at a price that we deem appropriate. Our shareholders or entities controlled by them or their permitted transferees will be able to sell their shares in the public market from time to time without registering them, subject to certain limitations on the timing, amount and method of those sales imposed by regulations promulgated by the SEC. If any of our shareholders, the affiliated entities controlled by them or their respective permitted transferees were to sell a large number of their shares, including common shares issuable upon conversion of the Series A convertible preferred shares, the market price of our Class A common shares may decline significantly. In addition, the perception in the public markets that sales by them might occur may also adversely affect the market price of our Class A common shares.
Our Series A convertible preferred shares have rights, preferences and privileges that are not held by, and are preferential to, the rights of our common shares, which could adversely affect our liquidity and financial condition, and may result in the interests of the holders of our Series A convertible preferred shares differing from those of our common shareholders.
Our Series A convertible preferred shares ranks senior to our common shares with respect to dividend rights and rights on the distribution of assets on any voluntary or involuntary liquidation, dissolution or winding up of our affairs. The holders of Series A convertible preferred shares have the right to receive a liquidation preference entitling them to be paid out of our assets available for distribution to stockholders before any payment may be made to holders of any other class or series of our share capital, an amount equal to the greater of (a) the sum of the
55
Table of Contents
original liquidation preference plus all accrued but unpaid dividends or (b) the amount that such holder would have been entitled to receive upon our liquidation, dissolution and winding up if all outstanding shares of such series of Series A convertible preferred shares had been converted into common shares immediately prior to such liquidation, dissolution or winding up. In addition, the holders of the Series A convertible preferred shares are entitled to a cumulative dividend at the rate of 8.0% per annum. The holders of the Series A convertible preferred shares are also entitled to participate in dividends declared or paid on our common shares on an as-converted basis. The holders of our Series A convertible preferred shares also have the right, subject to certain exceptions, to require us to repurchase all or any portion of the Series A convertible preferred shares upon certain change of control events at the repurchase price set forth in the applicable certificate of designations.
These dividend and share repurchase obligations could impact our liquidity and reduce the amount of cash flows available for general corporate purposes. Our obligations to the holders of the Series A convertible preferred shares could also limit our ability to obtain additional financing or increase our borrowing costs, which could have an adverse effect on our financial condition. These preferential rights could also result in divergent interests between the holders of shares of Series A convertible preferred shares and holders of our common shares.
The issuance of Series A convertible preferred shares reduces the relative voting power of holders of our common stock, and the conversion and sale of those shares would dilute the ownership of holders of common shares and may adversely affect the market price of our common shares.
As of December 31, 2023, 100,000 Series A convertible preferred shares were outstanding, representing approximately 12.0% of our outstanding common shares, including the Series A convertible preferred shares on an as-converted basis, based on an initial conversion rate of 73.5402 Class A common shares for each Series A convertible preferred share, which represents an initial conversion price of approximately US$13.60 per Class A common share. See “Item 7. Major Shareholders and Related Party Transactions—A. Major Shareholders.” Holders of Series A convertible preferred shares are entitled to a cumulative dividend at the rate of 8.0% per annum. Because holders of our Series A convertible preferred shares are entitled to vote on certain matters described in “—Ares and any other holders of our Series A convertible preferred shares may exercise influence over us,” the issuance of the Series A convertible preferred shares, and the subsequent issuance of additional Series A convertible preferred shares, effectively reduce the relative voting power of the holders of our common shares.
In addition, the conversion of the Series A convertible preferred shares into common shares would dilute the ownership interest of existing holders of our common shares. Furthermore, any sales in the public market of the common shares issuable upon conversion of the Series A convertible preferred shares would increase the number of our common shares available for public trading, and could adversely affect prevailing market prices of our common shares. Sales of a substantial number of our common shares in the public market, or the perception that such sales might occur, could have a material adverse effect on the price of our common shares.
Holders of our Series A convertible preferred shares may exercise influence over us.
As of December 31, 2023, outstanding Series A convertible preferred shares represented approximately 12.0% of our outstanding common shares, including the Series A convertible preferred shares on an as-converted basis, based on an initial conversion rate of 73.5402 Class A common shares for each Series A convertible preferred share, which represents an initial conversion price of approximately US$13.60 per Class A common share. See “Item 7. Major Shareholders and Related Party Transactions—A. Major Shareholders.” The terms of the Series A convertible preferred shares require the approval of a majority of our Series A convertible preferred shares by a separate class vote for us to take the following decisions, among others described in the respective certificate of designations:
| • | amend our organizational documents in a manner that would have an adverse effect on the Series A convertible preferred shares; or |
| • | issue securities that are senior to, or equal in priority with, the Series A convertible preferred shares. |
Circumstances may occur in which the interests of Ares Management Corporation, or Ares, and its affiliates could diverge from, or even conflict with, the interests of our other shareholders. For example, the existence of Ares as a significant shareholder may have the effect of delaying or preventing changes in control or management or limiting the ability of our other shareholders to approve transactions that they may deem to be in our best interests. Ares and its affiliates may seek to cause us to take courses of action that, in their judgment, could enhance its investment in us but which might involve risks to our other shareholders or adversely affect us or our other shareholders.
56
Table of Contents
We are a Cayman Islands exempted company with limited liability. The rights of our shareholders, including with respect to fiduciary duties and corporate opportunities, may be different from the rights of shareholders governed by the laws of U.S. jurisdictions.
We are a Cayman Islands exempted company with limited liability. Our corporate affairs are governed by our Articles of Association and by the laws of the Cayman Islands. The rights of shareholders and the responsibilities of members of our board of directors may be different from the rights of shareholders and responsibilities of directors in companies governed by the laws of U.S. jurisdictions. In particular, as a matter of Cayman Islands law, directors of a Cayman Islands company owe fiduciary duties to the company and separately a duty of care, diligence and skill to the company. Under Cayman Islands law, directors and officers owe the following fiduciary duties: (1) duty to act in good faith in what the director or officer believes to be in the best interests of the company as a whole; (2) duty to exercise powers for the purposes for which those powers were conferred and not for a collateral purpose; (3) directors should not properly fetter the exercise of future discretion; (4) duty to exercise powers fairly as between different sections of shareholders; (5) duty to exercise independent judgment; and (6) duty not to put themselves in a position in which there is a conflict between their duty to the company and their personal interests. Our Articles of Association have varied this last obligation by providing that a director must disclose the nature and extent of his or her interest in any contract or arrangement, and following such disclosure and subject to any separate requirement under applicable law or the listing rules of the Nasdaq, and unless disqualified by the chairman of the relevant meeting, such director may vote in respect of any transaction or arrangement in which he or she is interested and may be counted in the quorum at the meeting. Conversely, under Delaware corporate law, a director has a fiduciary duty to the corporation and its stockholders (made up of two components) and the director’s duties prohibits self-dealing by a director and mandates that the best interests of the company and its shareholders take precedence over any interest possessed by a director, officer or controlling shareholder and not shared by the shareholders generally. See “Item 10. Additional Information—B. Memorandum and Articles of Association—Principal Differences between Cayman Islands and U.S. Corporate Law.”
We may need to raise additional capital in the future by issuing securities or may enter into corporate transactions with an effect similar to a merger, which may dilute your interest in our share capital and affect the trading price of our Class A common shares.
We may need to raise additional funds to grow our business and implement our growth strategy through public or private issuances of common shares or securities convertible into, or exchangeable for, our common shares, which may dilute your interest in our share capital or result in a decrease in the market price of our common shares. In addition, we may also enter into mergers or other similar transactions in the future, which may dilute your interest in our share capital or result in a decrease in the market price of our Class A common shares. Any fundraising through the issuance of shares or securities convertible into or exchangeable for shares, or the participation in corporate transactions with an effect similar to a merger, may dilute your interest in our capital stock or result in a decrease in the market price of our Class A common shares.
As a foreign private issuer and an “emerging growth company” (as defined in the JOBS Act), we have different disclosure and other requirements than U.S. domestic registrants and non-emerging growth companies.
As a foreign private issuer and emerging growth company, we are subject to different disclosure and other requirements than domestic U.S. registrants and non-emerging growth companies. For example, as a foreign private issuer, in the United States, we are not subject to the same disclosure requirements as a domestic U.S. registrant under the Exchange Act, including the requirements to prepare and issue quarterly reports on Form 10-Q or to file current reports on Form 8-K upon the occurrence of specified significant events, the proxy rules applicable to domestic U.S. registrants under Section 14 of the Exchange Act or the insider reporting and short-swing profit rules applicable to domestic U.S. registrants under Section 16 of the Exchange Act. In addition, we rely on exemptions from certain U.S. rules which permit us to follow Cayman Islands legal requirements rather than certain of the requirements that are applicable to U.S. domestic registrants.
We follow Cayman Islands laws and regulations that are applicable to Cayman Islands companies. However, Cayman Islands laws and regulations applicable to Cayman Islands companies do not contain any provisions comparable to the U.S. proxy rules, the U.S. rules relating to the filing of reports on Form 10-Q or 8-K or the U.S. rules relating to liability for insiders who profit from trades made in a short period of time, as referred to above.
57
Table of Contents
Furthermore, foreign private issuers are required to file their annual report on Form 20-F within 120 days after the end of each fiscal year, while U.S. domestic issuers that are accelerated filers are required to file their annual report on Form 10-K within 75 days after the end of each fiscal year. Foreign private issuers are also exempt from Regulation Fair Disclosure, aimed at preventing issuers from making selective disclosures of material information, although we are be subject to Cayman Islands laws and regulations having, in some respects, a similar effect as Regulation Fair Disclosure. As a result of the above, even though we are required to file reports on Form 6-K disclosing the limited information which we have made or are required to make public pursuant to Cayman Islands law, or are required to distribute to shareholders generally, and that is material to us, you may not receive information of the same type or amount that is required to be disclosed to shareholders of a U.S. company.
The Jumpstart our Business Startups Act of 2012, or the JOBS Act, contains provisions that, among other things, relax certain reporting requirements for emerging growth companies. Under this act, as an emerging growth company, we will not be subject to the same disclosure and financial reporting requirements as non-emerging growth companies. For example, as an emerging growth company we are permitted to, and intend to continue to take advantage of certain exemptions from various reporting requirements that are applicable to other public companies that are not emerging growth companies. Also, we will not have to comply with future audit rules promulgated by the U.S. Public Company Accounting Oversight Board, or PCAOB, (unless the SEC determines otherwise) and our auditors will not need to attest to our internal controls under Section 404(b) of the Sarbanes-Oxley Act for up to five years or such earlier time that we are no longer an emerging growth company. We may follow these reporting exemptions until we are no longer an emerging growth company. As a result, our shareholders may not have access to certain information that they deem important. We will remain an emerging growth company until the earlier of (1) the last day of the fiscal year (a) following the fifth anniversary of the completion of our IPO, (b) in which we have total annual revenues of at least US$1.235 billion, or (c) in which we are deemed to be a large accelerated filer, which means the market value of our Class A common shares that is held by non-affiliates exceeds US$700.0 million as of the prior June 30th, and (2) the date on which we have issued more than US$1.0 billion in non-convertible debt during the prior three-year period. Accordingly, the information about us available to you will not be the same as, and may be more limited than, the information available to shareholders of a non-emerging growth company. We could be an “emerging growth company” for up to five years, although circumstances could cause us to lose that status earlier, including if the market value of our Class A common shares held by non-affiliates exceeds US$700.0 million as of any June 30 (the end of our second fiscal quarter) before that time, in which case we would no longer be an “emerging growth company” as of the following December 31 (our fiscal year end). We cannot predict if investors will find our Class A common shares less attractive because we may rely on these exemptions. If some investors find our Class A common shares less attractive as a result, there may be a less active trading market for our Class A common shares and the price of our Class A common shares may be more volatile.
We are a “controlled company” within the meaning of the rules of the Nasdaq corporate governance rules and, as a result, qualify for, and rely on, exemptions from certain corporate governance requirements. Our shareholders do not have the same protections afforded to shareholders of companies that are subject to such requirements.
Gilberto Sayão da Silva beneficially owns 100% of our Class B common shares, representing 75.6% of the voting power of our outstanding share capital. As a result, we are a “controlled company” within the meaning of the corporate governance standards of the Nasdaq corporate governance rules. Under these rules, a company of which more than 50% of the voting power in the election of directors is held by an individual, group or another company is a “controlled company” and may elect not to comply with certain corporate governance requirements. For example, controlled companies, within one year of the date of the listing of their common shares:
| • | are not required to have a board that is composed of a majority of “independent directors,” as defined under the rules of such exchange; |
| • | are not required to have a compensation committee that is composed entirely of independent directors; and |
| • | are not required to have a nominating and corporate governance committee that is composed entirely of independent directors. |
58
Table of Contents
As a “controlled company,” we rely on such exemptions and, as a result, we do not expect a majority of the directors on our board to be independent. In addition, we do not expect that any of the committees of the board to consist entirely of independent directors. Accordingly, our shareholders do not have the same protections afforded to shareholders of companies that are subject to all of the corporate governance requirements of the Nasdaq.
As a foreign private issuer, we are permitted to and we rely on exemptions from certain Nasdaq corporate governance standards applicable to U.S. issuers, including the requirement that a majority of an issuer’s directors consist of independent directors. This may afford less protection to holders of our Class A common shares.
Subject to certain requirements, as a foreign private issuer, we are permitted to follow home country practice in lieu of certain Nasdaq corporate governance rules, which include rules relating to board independence, independent director oversight of executive compensation, nomination of directors and other corporate governance matters, such as the requirement that we obtain shareholder approval prior to an issuance of securities (in certain circumstances) in connection with certain events. To the extent Cayman Islands law does not require us to adopt these corporate governance standards, we are permitted, intend to and follow home country practice in lieu of the above requirements. See “Item 10. Additional Information—B. Memorandum and Articles of Association—Principal Differences between Cayman Islands and U.S. Corporate Law—Corporate Governance.”
We may lose our foreign private issuer status which would then require us to comply with the Exchange Act’s domestic reporting regime and cause us to incur significant legal, accounting and other expenses.
In order to maintain our current status as a foreign private issuer, either (a) more than 50% of our Class A common shares must be either directly or indirectly owned of record by non-residents of the United States or (b)(i) a majority of our executive officers or directors may not be U.S. citizens or residents; (ii) more than 50% of our assets cannot be located in the United States; and (iii) our business must be administered principally outside the United States. If we lose this status, we would be required to comply with the Exchange Act reporting and other requirements applicable to U.S. domestic issuers, which are more detailed and extensive than the requirements for foreign private issuers. We may also be required to make changes in our corporate governance practices in accordance with various SEC and the Nasdaq rules. The regulatory and compliance costs to us under U.S. securities laws if we are required to comply with the reporting requirements applicable to a U.S. domestic issuer may be significantly higher than the costs we will incur as a foreign private issuer.
Our shareholders may face difficulties in protecting their interests because we are a Cayman Islands exempted company.
Our corporate affairs are governed by our Articles of Association, by the Companies Act (Revised) of the Cayman Islands, or the Companies Act, and the common law of the Cayman Islands. The rights of shareholders to take action against our directors, actions by minority shareholders and the fiduciary responsibilities of our directors to us under Cayman Islands law are to a large extent governed by the common law of the Cayman Islands. The common law of the Cayman Islands is derived in part from comparatively limited judicial precedent in the Cayman Islands as well as that from English common law, which has persuasive, but not binding, authority on a court in the Cayman Islands. The rights of our shareholders and the fiduciary responsibilities of our directors under Cayman Islands law are not as clearly established as they would be under statutes or judicial precedent in some jurisdictions in the United States. In particular, the Cayman Islands has a less exhaustive body of securities laws than the United States. In addition, some U.S. states, such as Delaware, have more fulsome and judicially interpreted bodies of corporate law than the Cayman Islands.
While Cayman Islands law allows a dissenting shareholder to express the shareholder’s view that a court sanctioned reorganization of a Cayman Islands company would not provide fair value for the shareholder’s shares, Cayman Islands statutory law does not specifically provide for shareholder appraisal rights in connection with a court sanctioned reorganization (by way of a scheme of arrangement). This may make it more difficult for you to assess the value of any consideration you may receive in a merger or consolidation (by way of a scheme of arrangement) or to require that the acquirer gives you additional consideration if you believe the consideration offered is insufficient. However, Cayman Islands statutory law provides a mechanism for a dissenting shareholder in a merger or consolidation to apply to the Grand Court of the Cayman Islands for a determination of the fair value of the dissenter’s shares if it is not possible for the company and the dissenter to agree on a fair price within the time limits prescribed.
59
Table of Contents
Shareholders of Cayman Islands exempted companies (such as us) have no general rights under Cayman Islands law to inspect corporate records and accounts or to obtain copies of lists of shareholders. Our directors have discretion under our Articles of Association to determine whether or not, and under what conditions, our corporate records may be inspected by our shareholders, but are not obliged to make them available to our shareholders. This may make it more difficult for you to obtain information needed to establish any facts necessary for a shareholder motion or to solicit proxies from other shareholders in connection with a proxy contest.
Subject to limited exceptions, under Cayman Islands law, a minority shareholder may not bring a derivative action against the board of directors. Class actions are not recognized in the Cayman Islands, but groups of shareholders with identical interests may bring representative proceedings, which are similar.
United States civil liabilities and certain judgments obtained against us by our shareholders may not be enforceable.
We are a Cayman Islands exempted company and substantially all of our assets are located outside of the United States. In addition, the majority of our directors and officers are nationals and residents of countries other than the United States. A substantial portion of the assets of these persons is located outside of the United States. As a result, it may be difficult to effect service of process within the United States upon these persons. It may also be difficult to enforce in U.S. courts judgments obtained in U.S. courts based on the civil liability provisions of the U.S. federal securities laws against us and our officers and directors who are not resident in the United States and the substantial majority of whose assets are located outside of the United States.
Further, it is unclear if original actions predicated on civil liabilities based solely upon U.S. federal securities laws are enforceable in courts outside the United States, including in the Cayman Islands and Brazil. Courts of the Cayman Islands may not, in an original action in the Cayman Islands, recognize or enforce judgments of U.S. courts predicated upon the civil liability provisions of the securities laws of the United States or any state of the United States on the grounds that such provisions are penal in nature. Although there is no statutory enforcement in the Cayman Islands of judgments obtained in the United States, courts of the Cayman Islands will recognize and enforce a foreign judgment of a court of competent jurisdiction if such judgment is final, for a liquidated sum, provided it is not in respect of taxes or a fine or penalty, is not inconsistent with a Cayman Islands judgment in respect of the same matters, and was not obtained in a manner which is contrary to the public policy of the Cayman Islands. In addition, a Cayman Islands court may stay proceedings if concurrent proceedings are being brought elsewhere.
Judgments of Brazilian courts to enforce our obligations with respect to our Class A common shares may be payable only in reais.
Most of our assets are located in Brazil. If proceedings are brought in the courts of Brazil seeking to enforce our obligations in respect of our Class A common shares, we may not be required to discharge our obligations in a currency other than the real. Under Brazilian exchange control laws, an obligation in Brazil to pay amounts denominated in a currency other than the real may only be satisfied in Brazilian currency at the exchange rate, typically as determined by the Brazilian Central Bank, in effect on the date the judgment is obtained, and such amounts are then typically adjusted to reflect exchange rate variations and monetary restatements through the effective payment date. The then-prevailing exchange rate may not afford non-Brazilian investors with full compensation for any claim arising out of or related to our obligations under the Class A common shares.
Our Class A common shares may not be a suitable investment for all investors, as investment in our Class A common shares presents risks and the possibility of financial losses.
The investment in our Class A common shares is subject to risks. Investors who wish to invest in our Class A common shares are thus subject to asset losses, including loss of the entire value of their investment, as well as other risks, including those related to our Class A common shares, us, the sector in which we operate, our shareholders and the general macroeconomic environment in Brazil, among other risks.
60
Table of Contents
Each potential investor in our Class A common shares must therefore determine the suitability of that investment in light of its own circumstances. In particular, each potential investor should:
| • | have sufficient knowledge and experience to make a meaningful evaluation of our Class A common shares, the merits and risks of investing in our Class A common shares and the information contained in this annual report; |
| • | have access to, and knowledge of, appropriate analytical tools to evaluate, in the context of its particular financial situation, an investment in our Class A common shares and the impact our Class A common shares will have on its overall investment portfolio; |
| • | have sufficient financial resources and liquidity to bear all of the risks of an investment in our Class A common shares; |
| • | understand thoroughly the terms of our Class A common shares and be familiar with the behavior of any relevant indices and financial markets; and |
| • | be able to evaluate (either alone or with the help of a financial advisor) possible scenarios for economic, interest rate and other factors that may affect its investment and its ability to bear the applicable risks. |
There can be no assurance that we were not a passive foreign investment company, or PFIC, for our 2023 taxable year or that we will not be a PFIC for any future taxable year, which could subject U.S. investors in our Class A common shares to significant adverse U.S. federal income tax consequences.
Under the Internal Revenue Code of 1986, as amended, or the Code, we will be a passive foreign investment company, or PFIC, for any taxable year in which, after the application of certain look-through rules with respect to subsidiaries, either (1) 75% or more of our gross income consists of “passive income;” or (2) 50% or more of the average quarterly value of our assets consists of assets that produce, or are held for the production of, “passive income.” Passive income generally includes dividends, interest, certain non-active rents and royalties, and capital gains. Based on our operations, income, assets and certain estimates and projections, including as to the relative values of our assets, including goodwill, we believe that we were likely not a PFIC for our 2023 taxable year. However, this belief is based in part on our determination of the value of our equity utilizing various criteria, including discounted cash flows, market prices for certain of our assets and a control premium, which differs from the market price of our Class A common shares. For 2022 and prior taxable years, our expectation as to whether or not we were a PFIC was based on the market price of our Class A common shares. Whether we were a PFIC in 2023, and whether we will be a PFIC in any future year is uncertain because, among other things, (i) we hold a substantial amount of investments that generate passive income; (ii) our PFIC status for any taxable year depends on the composition of our income and assets and the value of our assets from time to time (which may be uncertain and potentially volatile); and (iii) the law applicable to determining whether our goodwill is categorized as an asset that produces active or passive income is subject to varying interpretation. To the extent that any growth in our passive income outpaces our active business, our PFIC status could change. Accordingly, there can be no assurance that we were not a PFIC in 2023 or that we will not be a PFIC for any future taxable year. In addition, there can be no assurance that the IRS will agree with our conclusion or our methodology for determining, or our determination, of the value of our goodwill.
If we are a PFIC for any taxable year during which a U.S. investor holds Class A common shares, we generally would continue to be treated as a PFIC with respect to that U.S. investor for all succeeding years during which the U.S. investor holds Class A common shares, even if we ceased to meet the threshold requirements for PFIC status. Such a U.S. investor may be subject to adverse U.S. federal income tax consequences, including (i) the treatment of all or a portion of any gain on disposition as ordinary income; (ii) the application of a deferred interest charge on such gain and the receipt of certain dividends; and (iii) compliance with certain reporting requirements. A “mark-to-market” election may be available that will alter the consequences of PFIC status if our Class A common shares are regularly traded on a qualified exchange. For further discussion, see “Item 10. Additional Information—E. Taxation—Material U.S. Federal Income Tax Considerations for U.S. Holders.”
61
Table of Contents
If we were deemed to be an “investment company” under the Investment Company Act, applicable restrictions could make it impractical for us to continue our business as contemplated and could have a material adverse effect on our business, results of operations and financial condition.
We intend to conduct our operations so that we will not be deemed to be an investment company under the Investment Company Act. Under Section 3(a)(1) of the Investment Company Act, an entity generally will be deemed to be an “investment company” for purposes of the Investment Company Act if: (a) it is or holds itself out as being engaged primarily, or proposes to engage primarily, in the business of investing, reinvesting or trading securities or (b) absent an applicable exemption, it owns or proposes to acquire investment securities (other than U.S. government securities, securities issued by employees’ securities companies and securities issued by qualifying majority owned subsidiaries of such entity) having a value exceeding 40% of the value of its total assets (exclusive of U.S. government securities and cash items) on an unconsolidated basis.
We believe that we are engaged primarily in the business of providing asset management services and not in the business of investing, reinvesting or trading in securities. We also believe that the primary source of income from each of our businesses is properly characterized as income earned in exchange for the provision of services. We hold ourselves out as an asset management firm and do not propose to engage primarily in the business of investing, reinvesting or trading in securities. Accordingly, we do not believe that the Company is what is frequently referred to as an “orthodox” investment company as defined in the Investment Company Act and described in clause (a) in the preceding paragraph. Furthermore, on an unconsolidated basis, at least 60% of the value of the Company’s total assets (exclusive of U.S. government securities and cash items) consists of our interest in Vinci Investments Brazil, our majority owned subsidiary which we believe is a qualifying majority owned subsidiary for purposes of the 40% test described in clause (b) in the preceding paragraph, because Vinci Investments Brazil, on a consolidated basis, is primarily engaged in providing asset management services and is not an investment company by virtue of Rule 3a-1 under the Investment Company Act. Under Rule 3a-1, an entity is generally deemed to be an “investment company” if, absent an applicable exemption, more than 45% of the value of its assets (exclusive of U.S. government securities and cash items) consists of, and more than 45% of its net income after taxes (for the past four fiscal quarters combined) is derived from, securities other than U.S. government securities, securities issued by employees’ securities companies, securities issued by qualifying majority owned subsidiaries of such entity and securities issued by qualifying companies that are controlled primarily by such entity. Vinci Investments Brazil’s assets, consolidated with its wholly-owned subsidiaries (within the meaning of the Investment Company Act), consist primarily of fee receivables for the provision of services, property and equipment, right-of-use leases deferred tax assets, and other assets that we believe would not be considered securities for purposes of the Investment Company Act. Therefore, we believe that, consolidating Vinci Investments Brazil’s wholly-owned subsidiaries (within the meaning of the Investment Company Act), no more than 45% of the value of its assets (exclusive of U.S. government securities and cash items) consists of, and no more than 45% of its net income after taxes (for the past four fiscal quarters combined) is derived from, securities other than U.S. government securities, securities issued by employees’ securities companies, securities issued by qualifying majority owned subsidiaries of Vinci Investments Brazil and securities issued by qualifying companies that are controlled primarily by Vinci Investments Brazil. Accordingly, we believe that Vinci Investments Brazil is not an investment company by virtue of Rule 3a-1 under the Investment Company Act, and therefore is a qualifying majority-owned subsidiary of the Company for purposes of applying the 40% test described in clause (b) in the preceding paragraph to the Company.
In addition, we believe the Company is not an investment company under section 3(b)(1) of the Investment Company Act because it is primarily engaged in a non-investment company business.
However, our subsidiaries have a significant number of investment securities, and we expect to make investments in other investment securities from time to time. We monitor these holdings regularly to confirm our continued compliance with the assets and income test described above. The need to comply with this test may cause us to restrict our business and subsidiaries with respect to the assets in which we can invest and/or the types of securities we may issue, sell investment securities, including on unfavorable terms, acquire assets or businesses that could change the nature of our business or potentially take other actions that may be viewed as adverse to the holders of our Class A common stock, in order to conduct our business in a manner that does not subject us to the registration and other requirements of the Investment Company Act.
62
Table of Contents
If anything were to happen which would cause the Company to be deemed to be an investment company under the Investment Company Act, we may lose our ability to raise money in the U.S. capital markets and from U.S. lenders, and additional restrictions under the Investment Company Act could apply to us, all of which could make it impractical for us to continue our business as currently conducted. This would materially and adversely affect the value of your Class A common shares and our ability to pay dividends in respect of our Class A common shares.
ITEM 4. INFORMATION ON THE COMPANY
| A. | History and Development of the Company |
Our History
The team behind Vinci Partners traces its origins to the early 2000’s, when a group of our current partners began investing in the alternative asset space through our first private equity fund or Fund I. In 2004, that group began building an independent principal investment group dedicated to alternative investment strategies for Banco Pactual, one of the leading investment banks in Brazil at the time. In 2006, UBS purchased Banco Pactual and several investment professionals established an independent alternatives business unit within UBS, called UBS Pactual Gestora de Investimentos Alternativos Ltda. or ALIN. In 2009, following UBS’ divestiture of Banco Pactual, Mr. Sayão together with Mr. Horta and a large majority of the other investment professionals from ALIN founded Vinci Partners.
Based on the data sources cited below, we believe that:
| • | Vinci Partners is a leading asset manager in Brazil—Vinci Partners is a leading independent asset manager in Brazil in terms of AUM and is ranked among the 20 largest asset managers in Brazil (including banks, independent players and non-independent players) among over 970 asset managers, based on data published by ANBIMA as of December 2023, with leading franchises in our Private Markets, Liquid Strategies, and Investment Products and Solutions segments. |
| • | Vinci Partners maintains a robust pipeline of young talent—Our recruitment and selection process ensures that we attract and retain top talent. We screened over 5,206 potential candidates in 2023 to fill over 44 positions, representing approximately 118 applicants per vacancy in 2023. This competitive process ensures that Vinci Partners is attracting the next generation of leaders. |
| • | Vinci Partners is one of the most visible investment brands in Brazil—Vinci Partners is ranked in the top three in media appearances, based on media space (according to data prepared by Danthi Comunicações using information from Topclip). Additionally, we reach a broad audience of over 938,163 individuals through our LinkedIn channels, actively engaging with over 107,990 individuals. |
| • | Our funds have been recognized among leading funds in the industry—We have an established and recognized track record of achieving returns above benchmarks across our business segments. Our funds were awarded by market leader research entities across all our segments in 2023. In our Private Markets segment, our Private Equity and Real Estate strategies received the “Best Investment Funds” award from Leaders League. Our Impact Strategy received the Private Capital Deal of the Year award from the Association for Private Capital Investment in Latin America, or LAVCA, in recognition of our investment in Pro Infusion. In our credit business line, through our structured credit strategy, funds such as “VCE Seleção,” and “VCE Selection advisory” received five stars from the FGV Funds Guide. Within our IP&S segment, “Vinci Valorem” and “Vinci Internacional” were recognized by the Institutional Investor Magazine as Excellent Funds. In our Liquid Strategies segment, our absolute return fund, “Vinci Total Return”, was also recognized by Institutional Investor Magazine as an Excellent Fund. Our Financial Advisory Services segment has also received awards in 2023, such as Excellent M&A Firm from Leaders League, and ranked first among independent financial advisors in Brazil in terms of number of deals closed by Bloomberg between 2017 and 2023. |
Vinci Partners is known for its commitment to social impact—We are dedicated to strengthening social initiatives and promoting responsible investment in Brazil. Since Vinci Partners’ founding, we have continuously improved our environmental, social and governance, or ESG approach, evolving from respecting general guidelines to infusing positive ESG impact into some of our products. As a result, we are one of the few investment managers in Brazil to be a signatory to the Principles for Responsible Investment, or PRI, and have one of the highest ratings of private equity investment managers in Brazil according to PRI
63
Table of Contents
Transparency Reports. We became a signatory of the PRI in 2012. Furthermore, we have also endorsed the Women’s Empowerment Principles, or WEPs, which are a set of principles offering guidance to businesses on how to promote gender equality and women’s empowerment in the workplace, marketplace and community as part of the United Nations Sustainable Development Goals. By endorsing the WEPs, Vinci Partners signals its high-level commitment to promoting gender equality and working collaboratively in a multi-stakeholder environment to foster business practices that empower women. We are one of the few alternative asset managers in Brazil with an active Private Markets impact dedicated strategy, through our Impact and Return, or VIR, platform within our private equity strategy. In addition, Vinci Partners’ headquarters in Rio de Janeiro is self-sufficient from an energy standpoint, through a build-to-suit solar power plant. For more information, see “—Environmental, Social, Governance – ESG.”
The following chart summarizes key milestones in our operational history:
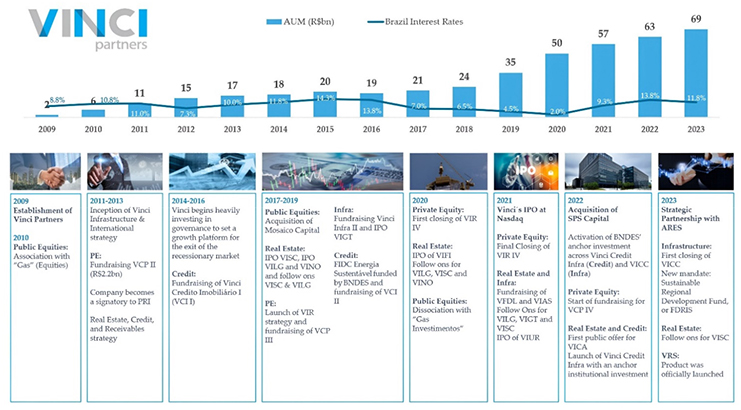
| • | Our recent achievements—Vinci achieved important milestones in 2023. Vinci and Ares, a top-tier global asset manager, announced a strategic partnership and a US$100.0 million investment to accelerate the growth of Vinci Partners’ platform in Latin America and collaborate on distribution, new products and other strategic areas. The use of proceeds is mostly for M&A operations in Latin America and Ares appointed Mr. Peter Ogilvie to Vinci Partners’ board of directors to share best practices. We officially launched VRS to Vinci Partners’ HNWI investor base in a soft opening. We held our first Investor Day at Nasdaq’s headquarters in New York, where our senior management team presented our business plan and growth avenues supporting our R$150 billion AUM target, excluding M&A, by year-end 2028. Our efforts in the fundraising cycle across our Private Market funds have shown significant progress, reaching 55% of our R$15 billion target in the fourth quarter of 2023. VISC, our listed shopping mall REIT, raised R$1.2 billion in a short span during the second half of 2023 through two consecutive offerings, leading to a year-to-date increase of over 70% in AUM. Vinci Partners’ Infrastructure team officially closed the mandate to manage the Brazilian Sustainable Regional Development Fund (Fundo de Desenvolvimento da Infraestrutura Regional Sustentável), which brought us approximately R$1 billion in AUM to develop sustainable projects in Brazil. VICC, our climate transaction fund, now Article 9 compliant, reached 75% of its fundraising target. The fourth vintage in the Private Equity flagship strategy, VCP IV, gained substantial traction with local investors and is officially the vintage with the most local capital since we started the VCP strategy. |
64
Table of Contents
Acquisition of SPS Capital
On August 16, 2022, we completed our previously announced acquisition of SPS Capital Gestão de Recursos Ltda., or SPS Capital, a leading special situations independent asset manager with over R$2.0 billion in assets under management at the time of the acquisition and led by a highly experienced and best-in-class team with extensive experience in the sector.
The acquisition of SPS Capital resulted in a new business strategy, Vinci SPS, under the Private Markets segment, which broadens our product offering and we believe enhances the strength of our platform. The transaction strengthens Vinci Partners’ FRE quality, stability and visibility as a result of recurring and high visibility management fee revenues with long-term lockups. We believe that the new strategy, Vinci SPS, operates in an underpenetrated market, creating substantial future growth opportunities to the platform. We believe the acquisition solidified Vinci Partners’ position as the player of choice for alternative investments in Brazil, with a full suite of sophisticated and complementary business segments.
Ares Investment
On October 10, 2023, we announced that Ares Management Corporation, or Ares, agreed to form a strategic partnership to accelerate the growth of Vinci Partners’ platform in Latin America and to collaborate with the distribution, product development and other business opportunities. In connection with this partnership, an affiliate of Ares would concurrently make a US$100 million investment in newly-issued Series A convertible preferred shares, subject to customary closing conditions. The transaction closed on October 26, 2023. Following closing, Ares appointed Mr. Peter Ogilvie to Vinci Partners’ Board of Directors to share best practices, including related to M&A, as Vinci enters a new growth cycle.
The key terms of the Series A convertible preferred shares, as set forth under the relevant certificate of designations, are: (i) 8.0% per annum cumulative dividend payable quarterly and in Brazilian reais (payable in U.S. dollars in Brazilian reais equivalent); (ii) Ares shall have the right at any time, to convert its Series A convertible preferred shares into approximately 7,354,020 Class A common shares, based on an initial conversion rate of 73.5402 Class A common shares for each Series A convertible preferred share, which represents an initial conversion price of approximately US$13.60 per Class A common share; (iii) Ares shall have the right to redeem any time after the 10th year anniversary; and (iv) we will have the right to force conversion after the second year anniversary if forced conversion trigger conditions are satisfied. For further information, see “Item 5. Operating and Financial Review and Prospects—B. Liquidity and Capital Resources—Series A Convertible Preferred Shares” and notes 14(i) and 16 to our audited consolidated financial statements included elsewhere in this annual report.
As of December 31, 2023, Ares and its affiliates beneficially owned approximately 12.0% of our total issued and outstanding common shares (on an as-converted basis for the Series A convertible preferred shares). See “Item 7. Major Shareholders and Related Party Transactions—A. Major Shareholders.”
Recent Events
Business Combination with Compass
Overview
On March 7, 2024, we had reached an agreement, or the Compass Transaction, for a combination with Compass. Once closed, the Compass Transaction will create a full-service Latin American alternative asset manager with more than US$50.0 billion in AUM (as of December 31, 2023). Founded in 1995, Compass is a leading independent asset manager and investment advisory firm in Latin America, currently present in seven countries in Latin America, the United States and the United Kingdom.
We believe that Compass has developed a leading and differentiated platform in Latin America, with approximately US$37 billion in assets under management and advisory (as of December 31, 2023) which are distributed across two main business lines:
| • | IP&S: as pioneers in providing investment solutions across traditional and global alternative assets, to institutional investors, family offices, intermediaries and HNWI in Latin America, Compass has built a distinguished ecosystem of proprietary relationships over the last 28 years. Compass seeks to provide access to world-class managers and global brokerage services, as well as discretionary global investment solutions and asset allocation to Latin American investors; and |
65
Table of Contents
| • | Asset Management LatAm: Compass has more than 25 years’ experience managing a wide range of funds and investment strategies focused exclusively on Latin America through the following: |
| • | credit, by managing funds and portfolios across the full spectrum of risk, from investment grade to private credit, including Latin America high-yield strategies, and |
| • | public equities, by managing pan-Latin America and country-specific equity funds and mandates for Latin American and global clients. |
Strategic Rationale
We believe that the strategic rationale for the proposed Compass Transaction is as follows:
| • | the Compass Transaction creates a leading platform in Latin America, with more than US$50 billion in assets under management; |
| • | the Compass Transaction is fully aligned with our strategic growth plan to expand our geographic footprint into a true pan-regional platform; |
| • | we will be able to enhance the distribution reach of our investment strategies across Latin America through Compass’ leading platform, and Compass will be able to provide access to world-class managers and offer global and regional solutions to our broad client base in Brazil; |
| • | the mindset and cultural alignment between partners from both companies will catalyze superior execution; and |
| • | the Compass Transaction is immediately accretive to our FRE per share, with short- and medium-term additional accretion from revenue and productivity enhancement synergies to be unlocked with the integration of both platforms. |
Transaction Overview
The Compass Transaction will have a total upfront consideration of 11,783,384 shares of our Class A common shares and a cash consideration of US$31.3 million, in the form of certain of our Class C redeemable common shares. As a result, upon closing, the existing Compass partners are expected to hold approximately 18% of the total share capital of the combined company. In addition, under the agreement, Compass partners are entitled to an earn-out of up to an additional 7.5% stake in the combined entity, subject to the achievement of pre-determined metrics, to be paid in our Class A common shares until 2028.
Upon closing of the Compass Transaction, Manuel Balbontín, partner, founder and Chairman of Compass, and Jaime de la Barra, partner, founder and Vice Chairman of Compass, will join our board of directors. Compass executives and senior management will continue in their current roles and remain fully committed to the combined business, with a long-term plan aligned with the plan that is currently in place for our executive partners.
The Compass Transaction is expected to close in the third quarter of 2024, subject to regulatory approvals and other customary closing conditions. For an overview of the risks to which we are or may become subject to as a result of the Compass Transaction, see “Risk Factors—Risks Relating to the Compass Transaction.”
Corporate Information
Our principal executive offices are located at Av. Bartolomeu Mitre, 336, Leblon, Rio de Janeiro, Brazil, 22431-002. Our telephone number at this address is +55 (21) 2159-6240.
66
Table of Contents
Investors should contact us for any inquiries through the address and telephone number of our principal executive office. Our principal website is https://www.vincipartners.com. The information contained in, or accessible through, our website is not incorporated into this annual report.
Implications of Being an Emerging Growth Company
As a company with less than US$1.235 billion in revenue during our last fiscal year, we qualify as an “emerging growth company” as defined in the JOBS Act. An emerging growth company may take advantage of specified reduced reporting and other burdens that are otherwise applicable generally to public companies. These provisions include:
| • | an exemption from the auditor attestation requirements of Section 404 of the Sarbanes-Oxley Act of 2002, as amended, or the Sarbanes-Oxley Act, in the assessment of our internal control over financial reporting; |
| • | reduced disclosure about our executive compensation arrangements in our periodic reports, proxy statements and registration statements; and |
| • | exemptions from the requirements of holding non-binding advisory votes on executive compensation and golden parachute arrangements. |
We may take advantage of these provisions for up to five years or such earlier time that we are no longer an emerging growth company. We would cease to be an emerging growth company if we have more than US$1.235 billion in annual revenue, have more than US$700 million in market value of our Class A common shares held by non-affiliates or issue more than US$1.0 billion of non-convertible debt over a three-year period. We may choose to take advantage of some but not all of these reduced burdens. Accordingly, the information about us available to you will not be the same as, and may be more limited than, the information available to shareholders of a non-emerging growth company.
In addition, under the JOBS Act, emerging growth companies can delay adopting new or revised accounting standards until such time as those standards apply to private companies. Given that we currently report and expect to continue to report under IFRS Accounting Standards as issued by the IASB, we will not be able to avail ourselves of this extended transition period and, as a result, we will adopt new or revised accounting standards on the relevant dates on which adoption of such standards is required by the IASB.
| B. | Business Overview |
Introduction to Vinci Partners
Vinci Partners is a leading alternative investment platform in Brazil, established in 2009. Our 275 full-time employees as of December 31, 2023 draw from a wide-ranging network of personal and professional relationships with industry-leading executives, business owners, corporate managers, financial and operational advisors, consultants and attorneys to source, fund, and manage investments. Vinci Partners’ business segments include Private Markets, Liquid Strategies, Investment Products and Solutions, Financial Advisory Services and Retirement Services, each managed by dedicated investment teams with an independent investment committee and decision-making process.
Since inception, our AUM has grown from R$1.9 billion in 2009 to R$68.5 billion as of December 31, 2023, representing a 29% compound annual growth rate, or CAGR. Our notable AUM growth has been driven by strong performance, consistent launches of new investment vehicles, and selective strategic transactions, such as our association with Gas Investimentos in 2010, Mosaico Capital in 2017 and SPS Capital in 2022. From 2020 onwards, our official AUM has been calculated on a consolidated basis, accounting for double counting resulting from funds from one segment investing in other segments and excluding double counting from co-managed funds between our segments. For periods preceding 2020, CAGR calculation utilized the AUM figure without double counting.
Our business strategy is comprised of five segments: Private Markets, Liquid Strategies, Investment Products and Solutions, or IP&S, Financial Advisory Services and Retirement Services. As of December 31, 2023, Private Markets accounted for 48% of our AUM, followed by IP&S with 34% and Liquid Strategies with 18%. Long-term products, with formal lock-ups of five years or more, accounted for 54% of our total AUM, and perpetual capital vehicles represented 23% of our long-term AUM.
67
Table of Contents
Our revenue base is broadly diversified within our strategies. For the year ended December 31, 2023, Private Markets accounted for 57% of our net revenue from services rendered, followed by Liquid Strategies with 18%, IP&S with 16%, and Financial Advisory Services with 8%.
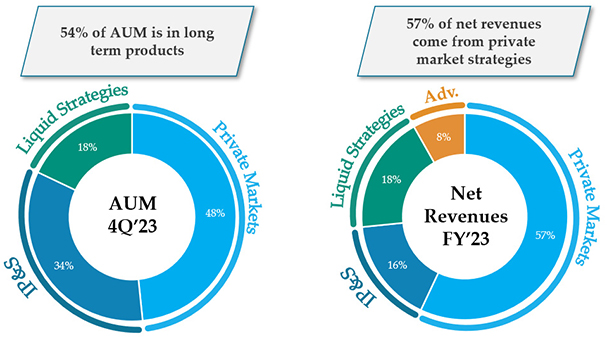
The following table sets forth our AUM on a per-segment basis as of the dates indicated.
| As of December 31, | ||||||||||||
| 2023 | 2022 | 2021 | ||||||||||
| (in R$ million) | ||||||||||||
| Private Markets |
32,956 | 28,685 | 21,991 | |||||||||
| Liquid Strategies |
12,332 | 10,209 | 11,573 | |||||||||
| IP&S |
23,149 | 24,187 | 23,664 | |||||||||
| Retirement Services |
88 | — | — | |||||||||
|
|
|
|
|
|
|
|||||||
| Total |
68,525 | 63,081 | 57,229 | |||||||||
|
|
|
|
|
|
|
|||||||
The following table sets forth our fee related revenues (i.e., our net revenue from fund management and advisory services) on a per-segment basis for the years indicated.
| For the Years Ended December 31, | ||||||||||||
| 2023 | 2022 | 2021 | ||||||||||
| (in R$ million) | ||||||||||||
| Private Markets |
253.4 | 210.1 | 200.1 | |||||||||
| Liquid Strategies |
71.8 | 81.3 | 86.8 | |||||||||
| IP&S |
70.5 | 83.1 | 79.8 | |||||||||
| Retirement Services |
0.2 | — | — | |||||||||
| Financial Advisory |
37.3 | 18.9 | 61.1 | |||||||||
|
|
|
|
|
|
|
|||||||
| Total |
433.2 | 393.4 | 427.8 | |||||||||
|
|
|
|
|
|
|
|||||||
68
Table of Contents
Competitive Strengths
We have established a premier independent franchise with market leadership across our high value-added strategies. We believe that our business model, focused on high-performance and executed by talented multi-disciplinary teams with a focus on value creation, has enabled us to build one of the most complete portfolios of alternative investment strategies and solutions, which combined with the adoption of innovative technologies and increasing integration across our business segments, strongly position us to capitalize on the future expansion and shifts in asset allocation in the Brazilian investment market.
We are a leading independent alternative asset manager in Brazil, with an extensive product offering across several business strategies.
Since our inception, we have worked tirelessly to become a leading independent investment platform in Brazil, in terms of AUM and product offering, that is well positioned to benefit from long-term trends in the Brazilian asset management industry. Starting with only proprietary capital from our partners, we have been able to grow our AUM base at a CAGR of 28.7% since our founding by expanding our product offering within liquid and illiquid strategies.
Vinci Partners is a leading independent asset manager in Brazil in terms of AUM and is ranked among the 20 largest asset managers in Brazil (including banks, independent players and non-independent players) among over 970 asset managers, based on data published by ANBIMA as of December 31, 2023.
Our extensive product offering with ten business strategies presents a strong competitive advantage as limited partners are seeking to consolidate their investments by general partner. With our broad and well-developed platform, we set ourselves apart from competition, being the partner of choice with our one-stop shop model. Aligned with this phenomenon, investors are still extremely under allocated to alternatives in Brazil, allowing Vinci Partners to leverage its competitive platform to capture a substantial share from this growth opportunity.
We have an established and recognized track record of achieving returns above benchmarks across our asset classes, putting us in a position of strength to benefit from shifts in asset allocation in Brazil
We believe we offer our clients best-in-class products in terms of investment performance across asset classes. We have been able to establish an impressive track record, achieving returns in the top quartile across products within both liquid and illiquid strategies.
We have developed expertise and credibility across strategies, with our products having a track record of surpassing the respective benchmarks. We believe that our past success enhances our reputation and market credibility and will be an asset in sourcing future investment opportunities.
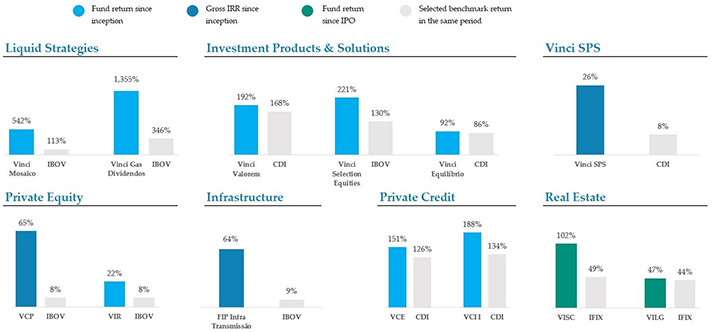
69
Table of Contents
Our AUM focused on long-term capital creates a resilient, management fee-centric and asset-light business model
In the year ended December 31, 2023, our assets under management posted a 9% year-over-year growth, backed by long-term commitments that provided stability in our earnings. As of December 31, 2023, Vinci had R$69 billion in AUM, with 54% being long-term capital, where “commitments are locked up for five years or more. In addition, Vinci Partners had R$9 billion in perpetual or quasi-perpetual capital, mostly coming from our listed REITs business in our Real Estate strategy, a business that we continued to expand and that we believe should continue to be an important driver for growth over the next years.
These factors facilitate a predictable earnings stream, with a significant portion coming from management fees. In the year ended December 31, 2023, 87% of total net revenue from services rendered came from management fees. We expect management fees to continue to be a tailwind for earnings security in the coming years as we continue to add long-term capital into our platform. We are currently undergoing a strong fundraising cycle for our Private Markets products that should have commitments locked up for five years or more.
Our AUM funding base is mostly built upon our proprietary distribution channels, resulting in a sticky investor base.
Vinci Partners has five different distribution channels across its fundraising base, each one with a fully dedicated team. Roughly 90% of Vinci Partners’ AUM is built upon proprietary distribution or perpetual listed vehicles. Our close relationship with our clients is a strong foundation to our business model, enhancing our AUM resilience when facing more challenging environments, and representing a strong driver for growth in favorable environments.
Our proprietary relationships are a competitive strength for Vinci Partners as they secure our AUM, resulting in stability into our earnings, as our proximity with investors mitigates outflows risks. As of December 31, 2023, 54% of our AUM had formal lockups for five or more years. However, our IP&S AUM, in its majority, has no formal lockups and is comprised by institutional and HNWI investors with low churn over the years, due to the long-term oriented business strategy and our close relationship with clients.
In sum, our AUM is secured by our well-developed funding base, mostly based on proprietary capital, which we believe sets us apart from our competitors.
We are one of the pioneers in the adoption of responsible investment and ESG integration in our investment decision process in Brazil and of a strong focus on internal ESG practices companywide.
We have been a PRI signatory since 2012, and according to the PRI data portal, in 2014 there were only 10 active investment manager signatories in Brazil.
We have been consistently developing our ESG approach year after year, with important improvements on a regular basis. For instance, in 2014 we implemented our responsible investment policy in private equity; in 2017, we engaged a specialized consulting company to develop our ESG management system for private markets; and in 2019, we hired another ESG consulting company to develop our ESG model for public markets. In addition, since 2021, we have published our annual ESG Report with internal initiatives, advances, challenges, opportunities, and actions taken by our investees. In all cases, we use international and local best practices to develop our policies, approach and disclosure, such as the IFC Performance Standards, the PRI Principles for Responsible Investments, and standards such as GRI and SASB, among others. We are one of the only alternative asset managers in Brazil with an active private market dedicated strategy through our VIR (Vinci Impact and Return) platform within our private equity strategy. In addition, Vinci Partners’ headquarters in Rio de Janeiro is self-sufficient from an energy standpoint through a build-to-suit solar power plant.
Given the different characteristics and ESG risk profile, our approach is distinct for private markets and public markets. Our ESG approach is integrated in most of our investment processes, which means that we incorporate ESG aspects in our main investment analyses for private markets and for selected mandates in public markets. In addition, we also apply other ESG approaches in some of the funds. For instance, our private equity funds use negative filters and exclusion lists. Our credit fund VES (Vinci Energia Sustentável) is focused on sustainable energy projects (e.g., solar, wind, etc.), and as such, uses an additional filter of sustainability. In our Infrastructure strategy, our climate change fund, VICC, is now Article 9 compliant.
70
Table of Contents
As discussed in “—Environment, Social and Governance – ESG,” we believe that our organization and governance towards ESG are developed and evolve every year. We have multiple programs that cover inclusion, diversity, equality, and best environment practices. With our IPO, we enhanced our consciousness towards ESG practices and adopted an ESG committee—chaired by Sonia Consiglio, a member of our board of directors—which is responsible for Vinci Partners’ ongoing development in this matter. In 2022, we published our first ever ESG report (relating to 2021), which is updated annually in partnership with a specialized consultancy. Each year, in addition to our updates and advancements, our ESG Report incorporates improvements to enhance its alignment with best market practices and the needs of our clients, especially those most engaged in ESG matters.
We believe that our strong investment approach towards ESG over the years in most of our business strategies, as pioneers in the field in Brazil, alongside our focus on internal practices, with an ESG committee chaired by Sonia Consiglio, gives us a strong competitive advantage as investors increasingly become stricter on this subject.
Our strong cash balance is a valuable asset to leverage new products and pursue inorganic operations to enhance growth.
As a result of our IPO in the beginning of 2021, Vinci Partners received net proceeds of US$252.2 million, which became a valuable asset to the company as a means to enhance AUM growth and boost our future FRE earning power.
Since our IPO we leveraged our cash balance to raise new products across Private Markets via seed investments, which played an important role on fundraising, and we will continue to enhance growth through this avenue. In addition to boosting our future FRE, our seed investments in Private Markets funds presents an important upside as these funds divest from its assets. This could play an important role to our earnings as the capital gain will impact our general partner investment income when they are realized. While the capital is not called from closed-end products, our cash balance is invested in Vinci Partners’ open-ended vehicles, which are mostly exposed to fixed income bonds.
Nonetheless, we have been closely monitoring opportunistic M&A transactions to accelerate FRE growth and expand Vinci’s footprint to Latin America. Our partnership with Ares aims to speed up this process, adding US$100.0 million to our balance sheet, and sharing best practices in M&A with Ares to assist Vinci in is expansion.
We believe there is a significant path to growth in Latin America. On March 7, 2024, we announced the entry into an agreement to effect a business combination with Compass, which would create a leading player in Latin America. We believe this transaction would be key to accelerate the M&A agenda in Latin America, with the opportunity to acquire smaller managers that we would not otherwise have access or structure to acquire. The Compass Transaction is expected to close in the third quarter of 2024, subject to regulatory approvals and other customary closing conditions. For more information, see “Recent Events—Business Combination with Compass.”
In Brazil, we are seeing a number of high-quality firms facing headwinds raising capital in a challenging environment over the past two years, and we believe that this should make way for conversations around partnerships that would allow value generation for all parties involved. We believe that our strong cash balance also adds flexibility around deal structuring, as was the case with our acquisition of SPS in 2022.
We have been active in sourcing on the corporate M&A front and are looking into several different opportunities for potential acquisitions, focusing on recurring FRE growth and client-base expansion, which we believe can be an interesting complement to our cash deployment on top of our seed allocation to proprietary private market funds. We believe there is significant room to grow FRE by acquiring smaller private market-oriented managers that are under-scale in this tougher macro environment, especially in perpetual capital products, which can be highly synergistic to our current product offering.
Our strong free cash flow played an important role delivering substantial value to our shareholders through share repurchases. Since the announcement of the first buyback plan in the second quarter of 2021, we repurchased 3.6 million shares. Although these operations were financed by our free cash flow generation, our strong cash balance creates flexibility for the management of our quarterly earnings, allowing us to put this capital to work and add value to our shareholders.
71
Table of Contents
Segment Reporting
Our strategic decisions comprise five distinct business segments: (i) Private Markets (including private equity, real estate, infrastructure, private credit and special situations), (ii) Liquid Strategies (including public equities and hedge funds), (iii) IP&S, (iv) Financial Advisory Services, and (v) Retirement Services.
Our five segments consolidate our ten distinct business strategies: (i) hedge funds; (ii) public equities; (iii) private equity; (iv) financial advisory services; (v) investment products and solutions; (vi) real estate; (vii) infrastructure; (viii) private credit; (ix) special situations; and (x) retirement services.
For more information, see note 22 to our audited consolidated financial statements.
Private Markets
Our Private Markets segment is comprised of five business lines: (1) private equity, (2) real estate, (3) infrastructure (4) private credit and (5) special situations. This segment is mostly made up of closed-end funds with long-term lock-ups and higher targeted returns. Depending on the strategy, these products can range from private equity-style funds, with formal lock-ups ranging from eight to 15 years, to vehicles listed on the B3 with perpetual capital. Our credit strategy also has short- to medium-term funds depending on the sub-strategy.
As of December 31, 2023, Private Markets accounted for R$33 billion in AUM. For the year ended December 31, 2023, the average management fee in this segment was 0.90%, and the management team was composed of 61 full-time employees across our Rio de Janeiro, São Paulo and Recife offices.
Private Markets AUM Breakdown
Private Markets AUM in the fourth quarter 2023 was R$33 billion, with R$15 billion (44%) coming from private equity, followed by real estate with R$7 billion (21%), private credit with R$5 billion (17%), infrastructure with R$4 billion (12%) and special situations with R$2 billion (6%).
Our investor base is highly diversified within the segment. Institutional offshore investors remain the segment’s biggest contributor, accounting for 26% of Private Markets AUM as of December 31, 2023, followed by local institutional investors accounting for 25%, public markets vehicles with 22%, high net worth individuals, or HNWI, with 16%, and allocators and distributors with 11%.
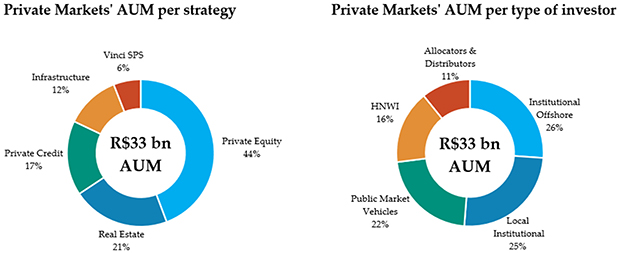
72
Table of Contents
The following table sets forth our Private Markets AUM on a per-strategy basis as of the dates indicated.
| As of December 31, | ||||||||||||
| 2023 | 2022 | 2021 | ||||||||||
| (in R$ million) | ||||||||||||
| Private equity |
14,593 | 13,781 | 11,223 | |||||||||
| Real estate |
7,049 | 5,649 | 5,399 | |||||||||
| Private Credit |
5,406 | 5,056 | 2,948 | |||||||||
| Infrastructure |
3,943 | 2,055 | 2,421 | |||||||||
| Vinci SPS |
1,964 | 2,144 | — | |||||||||
|
|
|
|
|
|
|
|||||||
| Total |
32,956 | 28,685 | 21,991 | |||||||||
|
|
|
|
|
|
|
|||||||
The following table sets forth our Private Markets AUM by type of investor as of the dates indicated.
| As of December 31, | ||||||||||||
| 2023 | 2022 | 2021 | ||||||||||
| (in R$ million) | ||||||||||||
| Institutional offshore |
8,602 | 10,640 | 7,995 | |||||||||
| Local institutional |
8,284 | 6,077 | 4,790 | |||||||||
| Public market vehicles |
7,168 | 5,298 | 5,235 | |||||||||
| HNWI |
5,340 | 4,884 | 2,971 | |||||||||
| Allocators and distributors |
3,562 | 1,786 | 1,001 | |||||||||
|
|
|
|
|
|
|
|||||||
| Total |
32,956 | 28,685 | 21,991 | |||||||||
|
|
|
|
|
|
|
|||||||
Private equity
Our private equity strategy has a sector-agnostic approach focused on growth equity investments in Brazil. Opportunistically, we will also analyze turnaround and greenfield investment opportunities. The main strategic focus of our private equity strategy is value creation by promoting the growth of revenue, productivity and profitability through significant operating and management changes in portfolio companies through our proprietary “Value from the Core” process. We also take into account non-measurable aspects, such as alignment of the potential investment with ESG goals.
The private equity strategy invests through two sub-strategies: Vinci Capital Partners and Vinci Impact and Return.
| • | Vinci Capital Partners: Vinci Capital Partners focuses on control and co-control investments and maintains flexibility around investment structuring, recognizing that we believe it is crucial to source companies with the greatest possible break-out potential in targeted industries. Vinci Capital Partners executes across core growth equity, buyout strategies and minority growth, while opportunistically analyzing turnaround opportunities, providing a broad set of investment alternatives. The third vintage of our VCP strategy, Vinci Capital Partners III, is fully allocated and has already started its divestment phase, while the fourth vintage, Vinci Capital Partners IV, is currently in its fundraising process and announced its first investment in November 2022. |
| • | Vinci Impact and Return: Vinci Impact and Return focuses on minority investments in small-to-medium enterprises with a dual mandate of generating ESG impact as well as market returns. In this strategy we typically make investments between R$50 million to R$150 million in companies ranging from around R$65 million to R$400 million in equity value with an average holding period of 15 to 50 months. We partner with highly experienced entrepreneurs that are aligned with our liquidity expectations and share controlling rights in all investments. In addition, Vinci Impact and Return has developed a proprietary impact methodology, and the strategy has been recognized through awards such as Private Equity ESG Fund of the Year from Environmental Finance. The fourth vintage of the VIR strategy is currently in its investment period and has already completed its first full divestment in less than two years after such investment. |
73
Table of Contents
Private Equity Investment Process
Vinci Partners targets assets or companies with proven cash flow stability and inflation protected revenues with strong organic growth and/or M&A potential. We may also seek to partner with strategic players to develop operating platforms.
Vinci Partners’ team brings together a wide-ranging network of personal and professional relationships across leading industry executives, business owners, corporate managers, financial and operational advisors and consultants, attorneys, and regulatory agencies. This robust network, combined with our proactive, top-down identification of target industries and companies, provides a highly differentiated deal sourcing platform for each of our private markets investment strategies. The team follows a highly disciplined and systematic investment review and decision-making process comprised of multi-staged reviews by our investment committee, which is comprised of several partners, most of whom have worked together since 2001.
The key objectives of our investment review and decision-making process are to: (i) effectively manage the pipeline of investments, (ii) identify key issues early in the investment process and before executing the transaction, (iii) efficiently allocate the deal team, (iv) determine a tailored deal execution and due diligence plan, and (v) provide a forum to solicit the input and views of the entire infrastructure team.
For instance, the graphic below depicts the key steps in the investment review and decision-making process in our private equity practice:

Both of our sub-strategies have a historical long-term performance, with seven vehicles managed by their partners since the early 2000s. Our Vinci Capital Partners strategy has raised over R$9.8 billion in capital commitments throughout to date, including our ongoing fundraising for VCP IV, with a gross IRR of 64.6% in reais and 70.2% in U.S. Dollars through September 30, 2023, and a gross multiple of invested capital, or MOIC, of 2.4x in reais and 2.2x in U.S. dollars. Our VIR strategy has raised close to R$1.3 billion to date, with its latest vintage, VIR IV, being the largest vehicle. The strategy is marked at a 21.7% gross IRR in reais and 27.9% in U.S. dollars through September 30, 2023, and a gross MOIC of 1.4x in reais and 1.5x in U.S. dollars.
| As of September 30, 2023 (1) | ||||||||||||||||||||||||||||||||||||||||||
| Fund |
Segment | Vintage Year |
Committed Capital |
Invested Capital |
Realized or Partially Realized |
Unrealized | Total Value | Gross MOIC | Gross IRR | |||||||||||||||||||||||||||||||||
| (in R$ million) | (in R$) | (in US$) | (in R$) | (in US$) | ||||||||||||||||||||||||||||||||||||||
| Fund 1 |
Private equity | 2004 | 1,415 | 1,206 | 5,065 | 137 | 5,202 | 4.3x | 4.0x | 71.5 | % | 77.2 | % | |||||||||||||||||||||||||||||
| VCP II |
Private equity | 2011 | 2,200 | 2,063 | 1,935 | 2,259 | 4,194 | 2.0x | 1.1x | 10.4 | % | 1.6 | % | |||||||||||||||||||||||||||||
| VCP III (2) |
Private equity | 2018 | 4,000 | 2,316 | 54 | 4,373 | 4,427 | 1.8x | 1.8x | 33.7 | % | 30.5 | % | |||||||||||||||||||||||||||||
| VCP IV |
Private equity | 2022 | 2,205 | — | — | — | — | — | — | — | — | |||||||||||||||||||||||||||||||
|
|
|
|
|
|
|
|
|
|
|
|
|
|
|
|
|
|
|
|||||||||||||||||||||||||
| VCP Strategy (3) |
Private equity | 9,820 | 5,585 | 7,053 | 6,770 | 13,823 | 2.4x | 2.2x | 64.6 | % | 70.2 | % | ||||||||||||||||||||||||||||||
|
|
|
|
|
|
|
|
|
|
|
|
|
|
|
|
|
|
|
|||||||||||||||||||||||||
| NE Empreendedor(4) |
Private equity | 2003 | 36 | 13 | 26 | — | 26 | 2.1x | 2.6x | 22.0 | % | 30.5 | % | |||||||||||||||||||||||||||||
| Nordeste III |
Private equity | 2017 | 240 | 135 | 93 | 144 | 237 | 1.8x | 1.5x | 18.6 | % | 11.9 | % | |||||||||||||||||||||||||||||
| VIR IV |
Private equity | 2020 | 1,000 | 403 | 154 | 379 | 533 | 1.3x | 1.4x | 25.5 | % | 30.7 | % | |||||||||||||||||||||||||||||
|
|
|
|
|
|
|
|
|
|
|
|
|
|
|
|
|
|
|
|||||||||||||||||||||||||
| VIR Strategy |
Private equity | 1,276 | 550 | 272 | 524 | 796 | 1.4x | 1.5x | 21.7 | % | 27.9 | % | ||||||||||||||||||||||||||||||
|
|
|
|
|
|
|
|
|
|
|
|
|
|
|
|
|
|
|
|||||||||||||||||||||||||
| (1) | As of the date of this annual report, the latest track record data available for our private equity funds is dated September 30, 2023. Updated track record data as of December 31, 2023 has not yet been disclosed due to the timeline for the annual audit of our private equity funds, which is still ongoing, only Committed Capital is updated as of December 31, 2023. |
74
Table of Contents
| (2) | Total commitments for VCP III include R$1.3 billion in co-investments. |
| (3) | Track record information is presented on a pro forma basis and in local currency, excluding PIPE investments, a strategy that was discontinued in VCP III. |
| (4) | Performance information for Nordeste Empreendedor, or NE I, comprises only the four (out of seven) investments that were carried out, managed and divested by a team led by Mr. Jose Pano while they were employed by NE I’s manager, or NE I Manager, an entity not affiliated with Vinci Partners. Information herein pertaining to any investments made by NE I manager has not been prepared by NE I Manager and NE I Manager assumes no responsibility for the accuracy or completeness of any such information. |
New Products in Development
Vinci Impact and Return V, or VIR V, is the fifth vintage of our Impact and Return strategy and is expected to be launched in 2024. It will follow the same investment strategy as that executed for VIR IV and we believe that it will generate both a positive ESG impact and attractive returns. The Impact and Return strategy currently focuses on business services, specialized retailing and healthcare. The new vintage is expected to extend sector coverage to agribusiness.
Real estate
Our real estate strategy invests through two sub-strategies:
| • | Listed Perpetual Funds: Our real estate strategy currently manages seven listed perpetual funds, with over 555,000 retail investors. This listed perpetual funds strategy is focused on the acquisition of core, income-generating real estate assets through investments in seven sub-sectors: shopping malls, industrial and logistics, office properties, urban commercial properties, financial instruments, agribusiness and real estate credit. |
| • | Shopping malls: Our main investment vehicle in the shopping malls sector is Vinci Shopping Centers FII, or VISC, which is focused on income generation to its quotaholders through the direct or indirect acquisition of shopping malls in Brazil. VISC has adopted a flexible investment strategy and evaluates investment opportunities in shopping centers in all regions of Brazil with interests that can range as high as up to 100% of an ownership stake, as well as minority interests. On October 3, 2023 and December 22, 2023, we announced that we had closed the ninth and tenth issues for additional quotas of VISC, respectively, adding in total R$1.2 billion in perpetual capital to Vinci’s assets under management. |
| • | Industrial and logistics: Vinci Logística FII, or VILG, is focused on income generation to its quotaholders through the acquisition of industrial properties in Brazil. VILG’s investment strategy seeks direct and indirect exposure to e-commerce to benefit from strong tailwinds and to meet the demand for distribution centers in strategic locations. VILG focuses on strategic locations close to large consumer or industrial centers and resilient to economic cycles, engaging in strategic partnerships with logistics operators or other strategic players to acquire controlling or minority interests in logistics condominiums (also known as business parks). |
| • | Offices: Vinci Offices FII, or VINO, is focused on income generation to its quotaholders through the acquisition of office properties in Brazil. VINO focuses on medium-sized projects (approximately 10,000 square meters in leasable area) in large populous areas that are differentiated with respect to architecture and design. VINO seeks collaborative office space, high-quality tenants with strong credit history and ability to adapt occupied spaces, environmentally friendly design and rental income with strong potential for rental price appreciation. |
75
Table of Contents
| • | Financial Instruments: Our main investment vehicle in the financial instruments sector is Vinci Instrumentos Financeiros, or VIFI, which is a hybrid real estate fund investing in a diversified portfolio of FIIs (tax-efficient investment funds in Brazil specifically designated for real estate investment) and certificates of real estate receivables (certificados de recebíveis imobiliários), or CRIs (securities backed by real estate receivables), with the goal of generating value and consistent income with relatively low risk. |
| • | Urban commercial properties: Vinci Imóveis Urbanos FII, or VIUR, focuses on income generation to its quotaholders through the acquisition of urban commercial properties in Brazil, such as street retail, grocery, healthcare, and educational focused real estate properties. |
| • | Agribusiness: Vinci Crédito Agro Fiagro Imobiliário, or VICA, is a perpetual capital fund-vehicle created in 2022. The fund is co-managed by Vinci Partners’ Credit and Real Estate management teams. VICA will invest in a diversified credit portfolio within the agribusiness sector in Brazil, targeting the main competitive regions and soft commodities such as soy, corn, cotton, coffee, sugar and ethanol as well as agribusiness-related industries and supply chains. VICA focuses on bilateral senior secured credit transactions, which are originated and structured in-house. |
| • | Real Estate Credit: Vinci Credit Securities FII, or VCRI, is a listed REIT dedicated to local mortgage-backed securities, or MBS, and debt-related securities (certificados de recebíveis imobiliários), or “CRI”, and is also co-managed by Vinci Partners’ Real Estate and Credit management teams. VCRI is focused on generating income to its quotaholders mainly through a diversified portfolio of CRIs, and can also invest in REITs with similar investment strategies. |
| • | Opportunistic development: our real estate team has extended experience in the development of real estate properties. Its primary vehicle in this strategy is Vinci Fulwood Desenvolvimento Logístico FII, or VFDL, which is focused on the development of greenfield industrial properties. VFDL is advised by Fulwood, one of the largest players for the development of industrial real estate in Brazil, wherein we are the fund’s development partner. |
Our Real Estate team also manages exclusive mandates, which includes an exclusive mandate REIT for an international institutional investor that co-invests in four shopping malls with VISC, and a fund of funds strategy that invests in listed REITs.
Real Estate Investment Process
The real estate investment process is made up of five key steps:
| • | Origination of Opportunities: Our solid reputation and credibility in the market is an important ally to originate assets, and our team’s relationships with other companies, financial institutions and business players provide investment opportunities. Since inception, our Real Estate strategy executed over R$7.8 billion in transaction volume, with 85% coming from proprietary origination. |
| • | Analysis: Our team conducts extensive investment analysis with the support of several areas within Vinci Partners, such as the economic and credit departments, legal, and our back office. After looking into a project’s viability, the proposal is approved by the investment team and submitted to the investment committee. |
| • | Execution: Our investment team negotiates the terms of the transaction approved in the investment committee and formalizes an offer that is conditioned upon a complete due diligence of the asset. The result of the due diligence is submitted to the investment committee together with the main contractual terms. |
| • | Monitoring: Our experienced team closely monitors the assets, looking for better leasing opportunities and remaining in constant contact with the property managers to ensure the quality of the services. |
76
Table of Contents
| • | Asset Sale: Once we identify favorable market conditions, our team is positioned to execute the sale of the asset. The process needs to be approved by our investment committee, as in the case of an asset acquisition. |
New Products in Development
Vinci Oportunidade Residencial FII: Vinci Residencial is a new opportunistic fund focused on the development of two residential projects located in strategic neighborhoods of Rio de Janeiro, Brazil. The fund will invest through a land swap structure with strategic development partners, and we expect it provide a superior risk-return ratio to its investors.
Vinci Real Estate Opportunities: This opportunity involves investing in a portfolio of rental apartment buildings in New York. The portfolio includes buildings with fewer than 10 units, all categorized under tax classes 2A/2B. The strategy behind this opportunity involves acquiring these buildings for comprehensive renovation of units, common areas, and equipment, followed by repositioning them in the market.
Private Credit
Our private credit investment strategy is focused on customized credit instruments, structures, and solutions to meet the financing needs of both established and growing businesses, while generating interesting credit investment opportunities for our investors. The private credit strategy invests across five core sub-strategies/asset classes:
| • | Infrastructure credit: this sub-strategy consists of two group of funds with similar strategies, but of different vintages, namely Vinci Energia Sustentável, or VES, and Vinci Credit Infra. The funds essentially invest in senior secured debentures, focused on renewable energy, such as wind, solar, and hydro power generation, in line with our strict ESG guidelines. VES is a closed-end fund with a total tenure of 15 years, which was launched in 2018 after Vinci Partners successfully won a competitive bidding process conducted by BNDES, a key limited partner, together with some of the largest Brazilian pension funds. According to its bylaws, the fund shall invest in debentures with a minimum credit rating of single “A” (in local scale) by either Fitch, Moody’s or S&P, with typical project finance collateral packages, including bank letters of credit and/or corporate guarantees until the project’s completion. In 2021, VES was accredited as an “ESG Fund” in accordance with the principles of recognized entities, such as CBI and the Sustainable Finance Regulation of the European Commission. After concluding the portfolio building process and the investment period for VES in 2021, our credit team launched a new infrastructure credit fund: Vinci Credit Infra. In connection with this initiative, Vinci won two competitive bidding processes in 2022, which were run by Banco do Nordeste do Brasil S.A. and BNDES, respectively, and secured R$1.3 billion in capital commitments from these entities. Vinci Credit Infra has a dual-track fund-raising approach: one vehicle was structured to be listed on the B3 as a perpetual capital vehicle, and the second vehicle is a 15-year closed-end fund, with similar terms and conditions as VES, which targets local institutional investors. Both funds aim to invest in infrastructure debentures, focusing on high-grade credit assets in accordance with superior ESG guidelines, which are integrated in our investment process. |
| • | Real estate credit: this sub-strategy focuses on direct lending and capital market transactions, primarily sourced and structured by our credit team, including senior secured loans and mortgage-backed securities with real estate as collateral. Vinci FI RF Imobiliário CP, or VCI, is our first vintage fund within this asset class and is currently returning capital to its investors. Our second vintage fund, Vinci Crédito Imobiliário 2, or VCI 2, is currently in its investment period. The funds in this sub-strategy have 10-year lock-up period and their investor bases are comprised by local institutional investors, such as pension funds and insurance companies. These funds have a multisector approach with respect to the issuers/debtors. Our team has been underwriting private debt transactions to companies and projects in many sectors such as electrical power, retail, healthcare, shopping malls, and commercial properties, among others. Vinci Credit Securities FII, or VCRI, is our first listed REIT dedicated to local MBSs and CRIs, and is co-managed by Vinci Partners’ Credit and Real Estate segments. VCRI is focused on generating income to its quotaholders, mainly through a diversified portfolio of CRIs, and can also invest in REITs with similar investment strategies. |
| • | Multi-strategy/Structured credit: this sub-strategy is comprised of a group of multi-strategy credit funds, with slightly more flexible investment guidelines, which invest in different types of credit assets and instruments, including private debt transactions, corporate debt, infrastructure debentures, MBSs, and securitization transactions where we usually participate in senior and mezzanine tranches. |
77
Table of Contents
| • | Exclusive Mandates: this sub-strategy refers to a rising pool of single-investor mandates where the investment policy is customized and client-driven, based on our credit management team’s investment guidelines and devised strategies. These exclusive credit funds are designed according to each client’s investment policies and needs regarding asset classes, maturity, liquidity, and most importantly risk profile. |
| • | Agribusiness: VICA is a perpetual capital fund created in 2022. The fund is co-managed by Vinci Partners’ Credit and Real Estate. VICA will invest in a diversified credit portfolio within the agribusiness sector in Brazil, targeting the main competitive regions and soft commodities such as soy, corn, cotton, coffee, sugar and ethanol as well as agribusiness-related industries and supply chains. VICA focuses on bilateral senior secured credit transactions, which are originated and structured in-house. |
We have an emphasis on self-originating investment opportunities in credit for our investors, generally in the private credit space, with a collateral package providing the downside protection against credit-related events.
Private Credit Investment Process
Our private credit investment process is made up of four key steps:
| • | Origination: In this first step, we rely on a strong relationship with other local players, synergies within our segments at Vinci Partners, a top-down analysis and an early-stage valuation of the structure and fundamentals of a transaction. |
| • | Analysis: Our team conducts a fundamentals-based, quantitative and qualitative analysis of issuers, counterparties, and shareholders. In this step, we developed our financial model with projections and meet with management to better understand the asset. |
| • | Structuring/Underwriting: In this step, we define the structure of the transaction, the pricing of the asset and the construction of the portfolio based on a risk/return analysis. With this information, our team seeks investment committee approval to acquire the asset. |
| • | Monitoring: We continuously review and monitor our funds’ assets based on the market and liquidity conditions. Our team is constantly looking for opportunities in the secondary market to explore market opportunities and inefficiencies. |
The following chart sets out the total gross return of our main non-listed credit funds since inception.

78
Table of Contents
Infrastructure
Our infrastructure strategy has exposure to tangible assets related to economic infrastructure, through investments in equity, equity-like and/or debt instruments across several sectors, including power generation and transmission, transportation and logistics and water and sewage. Our infrastructure strategy seeks control or control-oriented positions and employs active hands-on management of assets and operations.
Our infrastructure strategy invests across three sub-strategies:
| • | Sector-focused funds: our infrastructure team manages closed-end funds as its flagship strategy, seeking exposure to real assets related to economic infrastructure through investments in (a) the privatization of state-owned companies and concessions that typically provide public services, such as water and sewage services, and (b) new infrastructure projects in renewable power generation and power transmission. The team also manages VIGT, a public market vehicle listed on the B3, which is focused on the acquisition of core infrastructure assets, such as operational and yield-generating power transmission assets and generation assets. |
| • | Climate Change: The strategy aims to invest in assets that actively contribute to the climate agenda. Vinci Climate Change, or VICC, is our first vintage within the strategy. VICC invests in climate infrastructure assets that range from renewable power generation to water assets and to the efficient use of natural resources and reduced emissions from other sources (e.g., energy efficiency solutions in industries and commercial, public and residential sectors). The strategy focuses on the acquisition of control or co-control structures. In addition, to meet financial and environmental impact objectives, all investments made by VICC also seek to increase diversity and inclusion across portfolio companies, especially from a gender perspective, in their leadership and workforce, with the intention of positively impacting the communities in which these companies are actively promoting the adoption of good environmental, social and governance, or ESG, practices. VICC held its first closing in the first quarter of 2023, which was anchored by BNDES and other offshore institutional investors and is currently within its fundraising process. As of the date of this annual report, VICC has already reached 75% of its fundraising target. |
| • | Structured credit: our team also has exposure to fixed assets through debt investments in infrastructure projects across different sectors. |
Infrastructure Investment Process
Our infrastructure investment process is primarily based on proprietary origination, without relying solely on financial advisors. The proprietary origination starts with a top-down and bottom-up analysis, which enables us to be productive in the process and leverage our experience and know-how. In this first step, we take a closer look as to whether the asset is aligned with our strategy. We also look for potential ESG and climate impacts, potential synergies with our portfolio and the profile of the sellers and partners of the business. After this step, we develop our financial models, projections and prepare the investment thesis for investment committee approval.
After the approval of our investment committee, the team executes a thorough investigation of the asset’s governance and investment structure. In this step, the team also prepares a more detailed investment thesis and due diligence budget. With the go-ahead from the investment committee, a non-binding offer is made. Lastly, our team adjusts the financial models with the results from the due diligence and presents it to the investment committee. Once approved by the investment committee, a binding offer is presented. If accepted, our team executes the transaction.
The funds’ investments are periodically monitored by our investment team, with key topics including the evolution of ESG metrics, financial and operational metrics, and the evolution of previous targets. Depending on the vehicle, the climate impact is also periodically monitored.
FIP Infra Transmissão was marked at 59.0% gross IRR in reais and 43.9% gross IRR in U.S. dollars as of December 31, 2023, and a 3.6x gross MOIC in reais and 2.7x gross MOIC in U.S. dollars, which is evidence of the strong track record of our investment team in infrastructure assets.
79
Table of Contents
Our water and sewage strategy, VIAS, was marked at 17.8% gross IRR in reais and 19.4% gross IRR in U.S. dollars as of December 31, 2023, and a 1.2x gross MOIC in reais and 1.2x gross MOIC in U.S. dollars. In 2022, VIAS, in a partnership with Brazilian operator Águas do Brasil, invested in the public concession of CEDAE Block III, which investment has already delivered a meaningful impact as a result of operational improvements in the losses index, water coverage, and commercial efforts. With this transaction, the fund reached 91% capital deployment considering commitments raised since its first close in 2021.
Vinci Transportation and Logistics’ strategy focuses on public concessions of transportation and logistics assets, such as ports and highways. In 2022, we announced our first investment, the acquisition of the project of a container terminal called Maralto, in the state of Paraná, Brazil. Our team believes that in the future this could be an important strategy due to a significant pipeline of investment opportunities in the sector.
| Fund |
Segment | Vintage year |
Committed Capital |
Invested Capital |
Realized or Partially Realized |
Unrealized | Total Value | Gross MOIC | Gross IRR | |||||||||||||||||||||||||||||||||||
| (in R$ million) | (in R$) | (in US$) | (in R$) | (in US$) | ||||||||||||||||||||||||||||||||||||||||
| FIP Transmissão |
Infrastructure | 2017 | 211 | 104 | 261 | 115 | 376 | 3.6x | 2.7x | 59.0 | % | 43.9 | % | |||||||||||||||||||||||||||||||
| VIAS |
Infrastructure | 2021 | 386 | 350 | — | 409 | 409 | 1.2x | 1.2x | 17.8 | % | 19.4 | % | |||||||||||||||||||||||||||||||
| VICC |
Infrastructure | 2023 | 1,500 | — | — | — | — | — | — | — | — | |||||||||||||||||||||||||||||||||
Vinci SPS
In 2022, Vinci Partners concluded its first M&A transaction since the IPO with the acquisition of SPS Capital. This acquisition filled a strategic gap within our Private Markets segment and thereby created our new Vinci SPS strategy. Our Vinci SPS investment strategy has a broad investment mandate within the special situations spectrum, which improves the diversification of our portfolio among asset classes associated with different industries and value drivers. The resulting Vinci SPS strategy invests across five core sub-strategies:
| • | Primary Market Funding: This strategy seeks to provide new money, under different capital instruments and structures, to healthy growing companies or organizations in financial stress/distress. In the latter case, we invest in a well-structured business with an unbalanced capital structure. Funding is structured with downside protection through mechanics such as collateral guarantees that, combined with operating recovery, leads to our targeted returns. |
| • | Secondary Market Funding: Acquisition of assets held by creditors looking to sell, in particular in illiquid assets with different credit profiles. Prices represent a discount to face value that, combined with recovery strategies involving guarantees (judicial and extrajudicial enforcement) and repayment capacity through operating improvement, improve our returns. |
| • | Legal Claims: Acquisition of judicial assets against public and private entities. |
| • | Litigation Finance: Financing of litigation where one party has a viable claim but lack the resources to maintain a typically long and costly judicial dispute. |
| • | Credit Platforms: Scattered operations (retail) scalable through the intense use of technology in their origination and processing workflows. |
80
Table of Contents
Vinci SPS Investment Process
What we believe sets Vinci SPS apart is its robust and well-developed investment process, which ultimately is a direct driver to value creation. The graphic below depicts the six key steps in the investment review and decision-making process in Vinci SPS:

Our Vinci SPS strategy raised over R$1.8 billion in capital commitments as of the date of this report across three vintages, with its latest vintage, SPS III, being the largest vehicle with over R$1 billion in total commitments. The strategy is marked at a gross IRR of 25.7% in reais and 27.6% in U.S. dollars through December 31, 2023, and a gross multiple of invested capital, or MOIC, of 1.4x in reais and 1.5x in U.S. dollars.
| As of December 31, 2023 | ||||||||||||||||||||||||||||||||||||||||||||
| Fund |
Segment | Vintage year |
Committed Capital |
Invested Capital |
Realized or Partially Realized |
Unrealized | Total Value | Gross MOIC | Gross IRR | |||||||||||||||||||||||||||||||||||
| (in R$ million) | (in R$) | (in US$) | (in R$) | (in US$) | ||||||||||||||||||||||||||||||||||||||||
| SPS I |
Vinci SPS | 2018 | 128 | 191 | 207 | 126 | 333 | 1.7x | 1.6x | 26.0 | % | 20.1 | % | |||||||||||||||||||||||||||||||
| SPS II |
Vinci SPS | 2020 | 671 | 1,004 | 759 | 702 | 1,460 | 1.5x | 1.5x | 24.4 | % | 28.0 | % | |||||||||||||||||||||||||||||||
| SPS III |
Vinci SPS | 2021 | 1,070 | 692 | 131 | 739 | 870 | 1.3x | 1.5x | 30.2 | % | 38.6 | % | |||||||||||||||||||||||||||||||
|
|
|
|
|
|
|
|
|
|
|
|
|
|
|
|
|
|
|
|||||||||||||||||||||||||||
| Vinci SPS Strategy |
Vinci SPS | 1,869 | 1,887 | 1,097 | 1,567 | 2,664 | 1.4x | 1.5x | 25.7 | % | 27.6 | % | ||||||||||||||||||||||||||||||||
|
|
|
|
|
|
|
|
|
|
|
|
|
|
|
|
|
|
|
|||||||||||||||||||||||||||
New Products in Development
SPS IV is the fourth vintage for the Special Situations strategy and is expected to be launched in the latter part of the first semester of 2024. SPS IV is the first vintage the team will raise since the acquisition by Vinci Partners. It will follow the same investment strategy as the predecessor fund and we believe there is substantial room to increase the size of the fund, compared to SPS III, due to increased sourcing capabilities and access to new pools of capital, such as international investors.
Liquid Strategies
Our Liquid Strategies segment has two business strategies: public equities and hedge funds. This segment is focused on generating value through operations in public markets, such as by trading bonds, public stocks and derivatives, among other assets. Liquid Strategies is composed by open-end funds with short- to medium-term redemption periods. For the year ended December 31, 2023, the segment reported an average management fee rate of 0.70%, and management teams were composed by 22 full-time employees across our Rio de Janeiro and São Paulo offices.
Liquid Strategies AUM Breakdown
Liquid Strategies accounted for R$12 billion in assets under management as of December 31, 2023, with R$10 billion (77%) coming from public equities and R$3 billion (23%) coming from hedge funds.
Our investor base is heavily weighted towards institutional clients, which represent 90% of total AUM for the segment. Local institutional investors are our main investor class, accounting for 47% of Liquid Strategies AUM. Institutional offshore investors account for 42% of Liquid Strategies AUM, with most coming from our sovereign wealth exclusive mandate in our public equities’ strategy. Each of (i) HNWIs and (ii) Allocators & Distributors accounted for 5% of Liquid Strategies’ AUM as of December 31, 2023.
81
Table of Contents
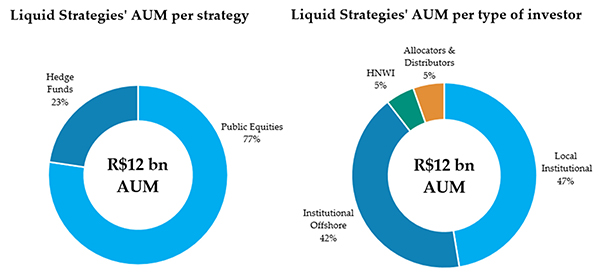
The following table sets forth our Liquid Strategies AUM on a per-strategy basis as of the dates indicated.
| As of December 31, | ||||||||||||
| 2023 | 2022 | 2021 | ||||||||||
| (in R$ million) | ||||||||||||
| Public equities |
9,537 | 7,397 | 8,493 | |||||||||
| Hedge funds |
2,795 | 2,812 | 3,080 | |||||||||
|
|
|
|
|
|
|
|||||||
| Total |
12,332 | 10,209 | 11,573 | |||||||||
|
|
|
|
|
|
|
|||||||
The following table sets forth our Liquid Strategies AUM by type of investor as of the dates indicated.
| As of December 31, | ||||||||||||
| 2023 | 2022 | 2021 | ||||||||||
| (in R$ million) | ||||||||||||
| Institutional offshore |
5,199 | 3,987 | 4,567 | |||||||||
| Local institutional |
5,844 | 4,788 | 5,166 | |||||||||
| HNWI |
619 | 834 | 880 | |||||||||
| Allocators and distributors |
670 | 600 | 960 | |||||||||
|
|
|
|
|
|
|
|||||||
| Total |
12,332 | 10,209 | 11,573 | |||||||||
|
|
|
|
|
|
|
|||||||
Public equities
Vinci Partners has a long track record and deep experience investing in public equities in Brazil. We focus on holding positions in companies for three to five years following deep analysis and review by our various investment committees, taking into consideration our internal controls.
Our public equities strategy invests according to two key sub-strategies:
| • | All Caps: The all-caps sub-strategy focuses on long-term performance through a concentrated portfolio and deep fundamental analysis without any market capitalization constraints. Our all-caps flagship strategy is Vinci Mosaico, which seeks to achieve long-term results above the Brazilian stock market. The team also manages a sovereign wealth exclusive mandate. |
| • | Dividends: The dividends sub-strategy focuses on well-managed companies with a strong presence in their segments that are generating significant cash returns through dividends. Our flagship strategy is Vinci Gas Dividendos, which seeks to achieve long-term returns by investing in companies with a consistent history of dividends’ payment. |
82
Table of Contents
Public Equities Investment Process
Our public equities investment process is robust and consists of four key steps:
| • | The first step consists of an in-depth fundamental analysis (bottom-up), where analysts study the company’s and industry’s characteristics. From there, the financial modeling of the company is performed to determine its intrinsic value, thus arriving at a first conclusion whether now is a good time to invest. During this step, the research team makes its first contact with the company. |
| • | With the first step approved, we move into a stage of greater contact with the company. Corporate structure, legal aspects and other ESG factors could also be analyzed. In addition, research analysts contact other research houses to understand the sell-side. If needed, trips and visits are scheduled for the analyst to better understand the company, as well as to evaluate if the information disclosed is in accordance with reality. |
| • | Next, the analyst presents the investment case to the portfolio manager. If approved by the manager, a small initial position is made. As the team gets more acquainted with the company and the case, the position may increase within the portfolio. |
| • | Finally, we engage in constant monitoring of our investments. Our research team meets with the portfolio manager daily before market opening to discuss daily news, meetings, results/changes in companies and sectors. During these calls, some adjustments to the portfolio may be discussed and implemented. At the beginning of each month, we hold a meeting to analyze the previous month’s performance and revisit the portfolio. Changes to the composition of our portfolio may be proposed and discussed among the team. |
The following chart sets out the total gross return of our public equities funds since inception.

| (1) | The dates of inception for Vinci Mosaico and Vinci Gas Dividendos are July 12, 2010 and September 19, 2005, respectively. |
83
Table of Contents
Hedge funds
Our hedge funds team operates under a multi-manager strategy with several portfolio managers, each pursuing independent strategies. This strategy invests through two key sub-strategies:
| • | Vinci Atlas: Our hedge funds flagship strategy invests across five principal sub-strategies: interest rates, inflation, commodities, currencies, and equities. |
| • | Total Return: The total return strategy focuses on high absolute risk-adjusted returns through fundamental analysis, diversification and use of derivatives. |
Hedge Funds Investment Process
The hedge funds strategy is composed of independent portfolio managers with access to both our macro and equities dedicated research teams, which support these managers in creating a robust analysis of the markets. Each portfolio manager has their own book and uses this support information as a basis to invest.
We have strong overarching risk monitoring practices in order to generate superior Sharpe ratio and alpha for our investors. Our risk team analyzes each portfolio using risk metrics such as stress tests, value at risk, or VaR, stop loss and a deep inspection of fund liquidity. Each strategy has its own VaR and stop loss, with limits set by our CIO and CRO, taking into account the volatility of each strategy. Our CIO also has a book that could be used to reduce or leverage risk.
The following chart sets out the total gross return of our main hedge funds since inception.
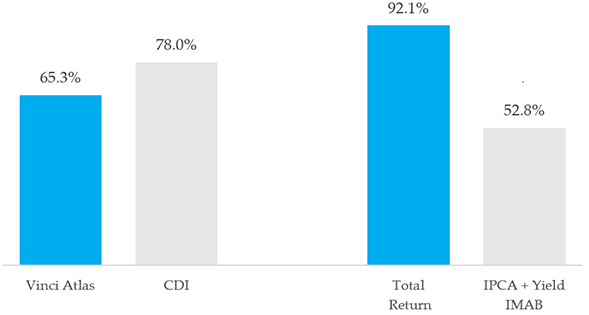
| (1) | The dates of inception for Vinci Atlas and Vinci Total Return are August 8, 2016 and December 27, 2019, respectively. |
IP&S
The IP&S segment seeks to offer tailor-made solutions to investors with a focus on exclusive mandates for institutional investors and HNWIs. For the year ended December 31, 2023, the segment reported an average management fee rate of 0.33%, and the management team was composed of 11 full-time employees across our Rio de Janeiro, São Paulo and New York offices.
Our IP&S segment offers clients access to tailored financial products through an open architecture platform, in addition to in-house asset allocation and risk management. The strategy aims to provide a sophisticated investment strategy with alpha generation according to our clients’ targets. In the execution of these strategies, we take into account risk profile assessment, preparation of investment policies and product selection, among other factors. The strategy is divided in four sub-strategies: (1) separate exclusive mandates, (2) commingled funds, (3) international allocation, and (4) pension plans.
| • | Separate exclusive mandates: We provide investment solutions to institutional investors, such as small to medium-sized foundations, pension funds and financial institutions in Brazil, and HNWIs. Our asset allocation team seeks tailored and distinctive portfolio construction solutions, addressing our clients’ specific portfolio objectives and restraints regarding targeted return, risk tolerance, diversification, asset class and liquidity. |
84
Table of Contents
| • | Commingled funds: Our commingled funds are distributed to multiple clients, from retail to institutional investors, and deploy capital in specific asset classes within defined investment strategies. Our flagship strategies are Vinci Valorem, focusing on fixed income assets, foreign exchange currency and derivatives, and Vinci Selection Equities, which invests in other public equities funds seeking to beat the Ibovespa. Vinci Strategic Partners, or VSP, is IP&S’ first effort in allocation services for alternative investments through a closed-end fund of funds that is focused on institutional and HNWI investors. |
| • | International allocation: We have an offshore allocation service, or international exclusive mandates, managed by a team in our New York office. We provide tailored investment solutions for local institutional investors and HNWIs that are seeking risk diversification by allocating part of their portfolios outside Brazil. |
| • | Pension plans: We manage PGBL and VGBL pension plan funds, distributed to retail clients, which provide tax and succession benefits. Our flagship strategy, Vinci Equilíbrio, seeks investments in specific asset classes, such as fixed income, foreign exchange currency, public equities, derivatives, and other funds. |
IP&S Investment Process
We have a very robust investment process within our IP&S segment, which begins with a thorough analysis of funds and assets to identify the products that best suit our investors. Our team discusses with each client their tolerance to risk, investment horizon, cash flow expectations and preferences to better meet our clients’ needs and expectations.
When we select a manager for a client’s portfolio, we conduct a thorough investigation of the manager’s track record, investment team, risk management and differentiators. We also have weekly macro committees with our economic department to better understand the global and local scenarios and identify potential investments and monthly calls with our risk department, in which our investment solutions teams present investment opportunities that will be analyzed by the team. In this case, the risk department has veto power over those investments.
IP&S AUM Breakdown
IP&S accounted for R$23 billion in AUM as of December 31, 2023, with R$17 billion (72%) coming from separate exclusive mandates, R$3 billion (13%) from pension plans, R$2 billion (9%) from commingled funds, and R$1 billion (6%) from international allocation. Our investor base is heavily weighted towards institutional clients. Local institutional investors are our biggest contributors, accounting for 50% of IP&S’ AUM, followed by HNWI with 35% and allocators and distributors with 15%.
85
Table of Contents
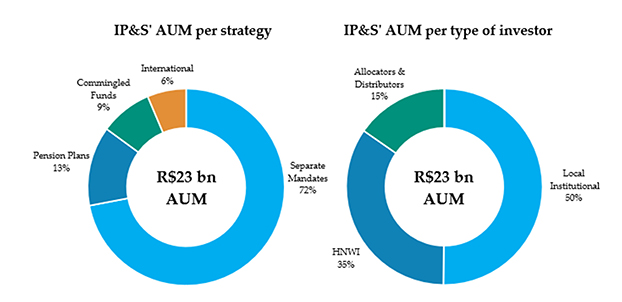
The following table sets forth our IP&S AUM on a per-strategy basis as of the dates indicated.
| As of December 31, | ||||||||||||
| 2023 | 2022 | 2021 | ||||||||||
| (in R$ million) | ||||||||||||
| Separate exclusive mandates |
16,666 | 15,806 | 15,245 | |||||||||
| International allocation |
1,477 | 2,697 | 3,272 | |||||||||
| Commingled funds |
1,982 | 2,234 | 2,961 | |||||||||
| Pension plans |
3,024 | 3,450 | 2,187 | |||||||||
|
|
|
|
|
|
|
|||||||
| Total |
23,149 | 24,187 | 23,664 | |||||||||
|
|
|
|
|
|
|
|||||||
The following table sets forth our IP&S AUM by type of investor as of the dates indicated.
| As of December 31, | ||||||||||||
| 2023 | 2022 | 2021 | ||||||||||
| (in R$ million) | ||||||||||||
| Local institutional |
11,612 | 10,743 | 10,472 | |||||||||
| HNWI |
7,989 | 9,193 | 9,621 | |||||||||
| Allocators and distributors |
3,548 | 4,251 | 3,571 | |||||||||
|
|
|
|
|
|
|
|||||||
| Total |
23,149 | 24,187 | 23,664 | |||||||||
|
|
|
|
|
|
|
|||||||
86
Table of Contents
The following chart sets out the total gross return of our main IP&S commingled and pension funds since inception.

| (1) | The dates of inception for Vinci Valorem, Vinci Selection Equities and Vinci Equilíbrio are August 21, 2012, November 1, 2012 and February 12, 2016, respectively. |
Financial Advisory
Our Financial Advisory Services team provides financial and strategic services to business owners, senior corporate management teams and boards of directors, focusing mostly on pre-IPO and M&A advisory services for Brazilian middle-market companies. We believe our Financial Advisory Services team serves as trusted advisors to clients seeking local and/or product expertise in the Brazilian marketplace.
As an independent boutique, Vinci Partners has the flexibility to engage in transactions that often require complex solutions, long-term relationships, and alignment of interests with clients. The Financial Advisory Services platform provides conflict-free advice with senior focus for value creation and long-term support. The platform focuses on two main sub-strategies:
| • | Mergers and Acquisitions (M&A): advisory in acquisitions, sales, joint ventures and merges, private placements, fundraising, capital and corporate structure analysis and valuation reports; |
| • | Capital Markets: conflict-free advisory for IPO and pre-IPO, block trades, debt restructuring, market/investor communication, debt issuances and special situation transactions. |
Retirement Services
Our Retirement Services strategy was launched early in 2022, and investments were made during the years ended December 31, 2022 and 2023 to develop the product and structure its dedicated team. This resulted in the creation of a fifth reporting segment to enable shareholders to track the evolution of our retirement services strategy AUM, revenues and costs separately from our other already mature asset management segments. See “Item 5. Operating and Financial Review and Prospects—A. Operating Results—Segment Reporting.”
87
Table of Contents
The following table sets forth our Vinci Retirement Services AUM:
| As of December 31, | ||||||||||||
| 2023 | 2022 | 2021 | ||||||||||
| (in R$ million) | ||||||||||||
| Vinci Retirement Services |
88 | — | — | |||||||||
|
|
|
|
|
|
|
|||||||
| Total |
88 | — | — | |||||||||
|
|
|
|
|
|
|
|||||||
VRS will supplement the services provided by our current pension plan funds strategy in IP&S, thereby increasing our interactions with our clients and our ability to fundraise from this pool of capital. The open-ended pension plan industry has a sizable addressable market, with approximately R$1.4 trillion in AUM and double-digit growth over the last years, according to FenaPrevi. While liquid markets have struggled with outflows, the open-ended pension plans industry posted another year of inflows in 2023, according to ANBIMA. We also believe there is a great opportunity to gain share within this market with VRS. Currently, close to 90% of the industry is controlled by traditional Brazilian banks, and recent pension portability numbers indicate a significant flow from traditional banks to independent insurers, according to FenaPrevi and SUSEP. The decentralization of capital from incumbent banks is one of Vinci Partners’ main growth opportunities. We believe there is a lack of independent alternative players offering open-ended pension plans in Brazil given that the market has several barriers of entries caused by expertise and structuring requirements. In particular, SUSEP, the Brazilian regulator, has a number of requirements that only sizeable and consolidated players can address, which we believe places Vinci Partners in a unique position to capture a relevant portion of the industry.
In the latter part of the 2022, Vinci Partners was approved by SUSEP to operate life insurance and open-ended pension plans in Brazil, which officially enabled us to launch our strategy. In VRS, we have developed a tailor-made asset allocation algorithm based on many inputs that include an individual’s retirement goals, risk appetite and objectives. The solution is personalized for the individual’s life cycle and is backed by solid risk tolerance metrics. We have created a user-friendly digital product, supported by the combination of a technological platform and a tech advisor mechanism. Through this innovative initiative, we aim to offer a leading industry service, which we believe will ultimately simplify the most complex processes for pension beneficiaries. As a result of the product’s suitability, which will combine the asset allocation approach with a tailor-made investment portfolio, we believe that individuals will benefit from long-term returns, thereby diminishing the impact of short-term volatility, and increased efficiency, as we will allocate capital through different type of funds depending on market conditions and investor preferences.
Beginning in February 2024, VRS is fully accessible to the public through its dedicated applications and website and prepared to accept allocations from all investors through our newly launched platform, Mio. We expect to fundraise in 2024 across a few fronts:
| • | we will expand our capabilities to raise money with high-net-worth investors; |
| • | we will target corporate plans—the corporate market is a fraction of the individual market, but often it is the first contact that investors have with pension plans. Moreover, during our research, we came across several instances that indicated the user experience for corporate plans is even worse than the overall industry experience because incumbent providers do not invest in this segment at all; and |
| • | we will seek distribution partnerships with financial planners, brokers, finders, platforms and fintechs to enhance our penetration within retail investors. |
Environmental, Social and Corporate Governance – ESG
Vinci Partners is committed to ESG practices throughout the company, ranging from sustainability in our offices and inclusion policies to our investment process through our investment vehicles.
Alignment with our limited partners is our first step for a successful relationship. Our partners are clients, and our clients are partners. We have a strong culture to seed capital in our funds, where partners invest alongside investors in the same conditions and fees. This culture, when complemented by targeted long-term returns, creates a stickier investor base, with limited partners investing with us for a long horizon. Our broadly diversified platform enables us to have knowledge exchange between portfolio managers from different strategies, generating an important competitive advantage, always respecting our compliance rules and Chinese wall policies.
88
Table of Contents
We have a long-term goal of democratizing the alternative market space by focusing on our limited partners’ needs and providing tailored solutions and investment opportunities.
Corporate Governance
We have sought to consistently improve our governance structure, especially after our IPO in 2021. We believe that we follow well-established and recognized practices in the Brazilian and international corporate markets by operating in a partnership model. Moreover, in keeping with our values, we encourage entrepreneurship and ownership without leaving administrative discipline aside. Even before our IPO, when Rogério Werneck was already our independent director, Vinci Partners was focused on its ethics and good corporate governance practices. In 2021, our independent director group was bolstered by the arrival of Ana Marta Veloso, Guilherme Stocco and Sonia Consiglio.
We select our independent directors based on their expertise in topics that we consider strategic for Vinci Partners, on their ability to contribute to internal discussions, on their external reputation and recognition, and on their alignment with our values and culture. To staff our committees, we chose members with the ability to significantly contribute to the relevant matters under discussion and balancing strategic vision and execution capacity, in particular among leaders of these respective areas.
Due to the additional controls that are necessary for a listed company, the responsibilities of our compliance, legal, financial, risk and investor relations departments were also expanded.
Board of Directors
The role of our board of directors is to provide strategic direction and support to Vinci Partners by monitoring business opportunities, innovation, sustainability, and the development of our professionals. As of the date of this report, it is composed of nine directors, four of which are independent, and is chaired by Gilberto Sayão. In 2021, we were granted the Women on Board (WOB) seal, an independent initiative that recognizes and promotes organizations with at least two women on their boards of directors or advisory boards.
Audit Committee
In alignment with the best market practices and meeting regulatory requirements, the Audit Committee is composed of four independent directors and chaired by Ana Marta Veloso. The Audit Committee oversees internal controls and the company’s financial statements, ensuring compliance with corporate governance principles. It is also responsible for receiving and analyzing complaints submitted through the external whistleblower channel implemented in 2021, in line with the Foreign Corrupt Practices Act (FCPA), a U.S. statute on foreign corruption practices.
ESG Committee
Established in May 2021, the ESG Committee recommends, discusses, proposes, and evaluates Vinci Partners sustainability actions. It is composed of nine members and chaired by an independent director, Sonia Consiglio, since August 2021.
We believe that investments that incorporate best ESG practices can bring superior returns to investors, society and to Brazil, and we believe that we have the potential to transform the market and lead by example, based on constructive engagement with investee companies. With an initial focus on risk mitigation, our approach was expanded to consider value generation from integrating best practices to the investment processes, always considering pre-established policies, solid methodologies, and objective criteria. We therefore believe that the ESG Committee can be a catalyst for the ESG agenda and help it permeate all business fronts and middle areas, from the board of directors to every other level inside the Company.
89
Table of Contents
Vinci Partners’ ESG agenda is structured in three pillars:
| • | Business: we seek to promote responsible, sustainable and impact investments, from a holistic perspective and permitting a flexible evaluation of opportunities, with a fundamentalist ESG integration, negative and positive screening, and metrics and ratings during the asset evaluation process, where applicable. |
| • | Fostering (industry and market): we seek to expand formal commitments to the ESG agenda and actively engage in sectoral associations and interest groups to spread knowledge and help strengthen the topic in Brazil. |
| • | Culture & Practices (Walk the Talk): we seek to implement internal actions – such as the promotion of diversity, equity, and inclusion in the teams – that propel the advancement of the culture and practice of ESG topics at Vinci Partners itself. |
Innovation Committee
We believe that innovation has great transformational potential and, through process automation and optimization, can promote important gains to governance, transparency, and compliance. The Innovation Committee goal is to promote creativity and the development of the Company by evaluating what measures will be implemented to expand digital skills, what are the related risks and how can they be minimized. It discusses topics such as big data, artificial intelligence and blockchain by examining how they can be incorporated into the business. The committee is composed of thirteen members and is chaired by an independent director Guilherme Stocco.
In 2023, the Innovation Committee played an important role in supporting the development of our new pension product, with the launch of the MIO Pension app. Through this application, our customers provider information relating to their profile, and the platform suggests the best way to allocate their resources. In addition, working groups were created to optimize processes with the Monday platform, which allow teams to easily manage projects and workflows, ensuring the traceability of information and mitigating the risk of data loss and rework.
Executive Committee
The executive committee is comprised of a group of senior partners, including Alessandro Horta and Gilberto Sayão, that lead the main areas of the company. Its goal is to think of Vinci Partners as a business, learning form global references and identifying opportunities for improvement. It also supports themes related to innovation, communication, people and culture.
Core Executive Committee
Our core executive committee is composed of six representatives, including our chief executive officer and the chairman of our board. This committee is responsible for strategic decisions relating to the Company, such as growth strategies, mergers and acquisitions, partnerships and joint ventures, culture and talent management, governance, new initiatives, e.g., the entry into new business verticals, image and reputation, project management, such as product launches, business effectiveness, productivity, efficiency and post-merger integration.
Diversity, Equity, and Inclusion
We have several programs focused on diversity and inclusion at Vinci Partners, and we constantly seek to improve our performance on that front. Between 2018 to 2023, the number of women in our back-office and front-office areas grew by 43% and 116%, respectively. As of December 31, 2023, 32% of our workforce is comprised of women. In addition, there is no gender pay gap at Vinci Partners.
Vinci for Them (“Vinci por Elas”) Program
Launched on the International Women’s Day in 2021, our Vinci for Them program congregates all of the following gender equity initiatives in the Company. Since its inception, 33 women were hired under the program:
| • | Female Talent Pool: an affirmative action program of female-only recruitment that aims to promote gender equity through the formation of a good base of female professionals. The initiative has led to two women among Vinci Partners’ four independent directors, the receipt of the WOB (Women on Board) seal in 2021, and in Ana Marta Veloso and Sonia Consiglio chairing the Audit and ESG Committees, respectively. |
90
Table of Contents
| • | Additional benefits to parental leave: for women, this program grants the 120 days of maternity leave guaranteed by law. For both men and women, this program grants 30 vacation days after birth (in addition to parental leave), one month of guaranteed work-from-home arrangements, and after the child’s six-month birthday, two guaranteed work-from-home days per week. |
| • | Vinci Mom’s Space: provides private rooms in all offices so that mothers can breastfeed whenever they want with breastfeeding kits and exclusive refrigeration spaces. |
| • | Women’s Health Program: a program that sponsors periodic lectures on women’s health with specialist doctors. |
| • | Leadership support: a CEO statement declaring their support to the Women Empowerment Principles (WEP). |
| • | Coaching Program: a structured development program that invites our employees to a moment of self-reflection, thereby stimulating the development of important skills for career advancement at Vinci Partners. |
| • | Engagement and Development: we are part of the 100 Women in Finance association, which aims to strengthen the global financial sector by empowering women to reach their professional potential at all stages of their careers. Our People Management partner, Patrícia Amorim, not only discussed financial markets but also participated in a panel to evaluate resumes and help create pitches for women entering the job market. Additionally, we are actively involved in the FIN4SHE movement, which promotes women’s presence in the labor market, fostering a more diverse, fair, egalitarian, and attractive environment for women. This movement also serves as one of our recruitment sources. |
| • | Lecture Series: |
| • | “The Challenges and Opportunities of Gender Diversity” lecture was focused on women in the financial market, discussing the challenges and opportunities to support and empower more women at Vinci Partners. |
| • | Throughout 2023, our partner and macroeconomist, José Carlos Carvalho, delivered lectures on market scenarios and perspectives, emphasizing our commitment to market literacy and education, including the following: |
| • | four lectures during breakfast or lunch at Vinci Partners, with a total of 82 participants; |
| • | one lecture during the À Vinci outdoor dinner, with 50 participants; |
| • | one lecture for MBA students at Rice University, with 53 participants; |
| • | three lectures for financial market leagues at two universities, Pontificia Universidade Católica do Rio de Janeiro and Universidade Federal do Rio de Janeiro, for a total of 139 participants. |
| • | We also delivered lectures for our employees, including Saúde Mental (Mental Health) with Pedro Salomão, Pink October with Dr. Eduardo Millen, and Innovation = Competitive Advantage with Guilherme Stocco. |
91
Table of Contents
Internal Environmental Practices
The main impact of our operations on the environment derives from the allocation of resources, which has led us to develop products related to environmental issues, such as Vinci Energia (VIGT), Vinci Energia Sustentável (VES), Vinci Infraestrutura Água e Saneamento (VIAS) and Vinci Climate Change (VICC). Nonetheless we seek to align all our internal activities with best environmental practices, as consistency between speech and practice gives us even more power to demand the best standards from the companies in which we invest. Among the practices, we highlight the following:
| • | Sustainable construction: we received an LEED Silver certification in the headquarters building in Rio de Janeiro, which attests to the good use of water and energy resources; |
| • | Urban mobility: we have had bicycle facilities at our headquarters in Rio de Janeiro since 2015 (including bicycle storage and changing rooms). Additionally, our Vaga do Bem initiative redirects parking fees paid by employees to use parking spaces to social initiatives, such as charitable donations. Moreover, at our São Paulo office, we provide bike racks for our employees; |
| • | Renewable energy: we support the generation of photovoltaic solar power generation in Paraíba do Sul, Rio de Janeiro for our headquarters in Rio de Janeiro in partnership with Axis Renováveis. In the year ended December 31, 2023, 1,091,800 kWh were contracted and consumed in partnership with Axis Renováveis; |
| • | Office initiatives: we carry out the preventive maintenance and replacement of equipment to reduce inadvertent emissions from fire extinguishers and air conditioners, set up motion sensors to reduce energy consumption, implemented protocols for turning off the air conditioning in areas and times of lesser use, and promote waste recycling and other initiatives to reduce the waste generated; |
| • | Neutralization of Greenhouse Gas (GHG) emissions: Vinci Partners is proud to announce that it has been awarded the Friend of the Climate (“Amigo do Clima”) award under the carbon offset program run by WayCarbon, which certifies our GHG offsets. The program uses internationally recognized methodologies to calculate GHG emissions and carbon credit offsets from projects that yield. The initiative seeks to align our activities with the best environmental practices, in line with our ESG agenda, which has been a key driver of our investment and management processes for more than 12 years and is an increasingly significant part of our culture. |
Investment Process in ESG
Private equity
Our private equity Impact and Return strategy was developed to tend to a growing market demand for ESG products combined with our view of the potential positive influence our capital allocation could have over entrepreneurs and their markets’ environment. In our impact strategy, we target minority equity investments in companies with limited access to capital, focusing on scaling the positive results these businesses already generate to customers, society and the environment. The market for impact funds in Brazil is still in development and faces challenges. This investment thesis is better received by entrepreneurs with prior contact with the strategy. Reaching out to smaller entrepreneurs is an important goal for the long-term success of the strategy.
Our fourth vintage of our Impact strategy, VIR IV, raised R$1 billion in capital commitments through a diversified investor base, with the presence of institutional investors. VIR IV’s goal is to invest capital in underdeveloped regions, generating a positive impact to business in these regions. Our investment process comprises several criteria and tools, such as a positive and a negative screening, an eligibility tool, the assessment of impact metrics through a proprietary index and ESG due diligence. The investment strategy is completed with a strong analysis of the business, a detailed report highlighting the impact on the business, and quarterly follow-ups. VIR IV received the award for “Impact Fund of the Year” from Environmental Finance in 2021. In 2023, VIR IV received the Private Capital Deal of the Year award from the Association for Private Capital Investment in Latin America, or LAVCA, in recognition of our investment in Pro Infusion.
Our Vinci Capital Partners strategy, or VCP strategy, has also developed a robust ESG framework. The VCP team created, with the support of a global reference ESG consultancy firm, a general ESG risk assessment framework to support ESG due diligence in new target companies. This framework contains the main environmental and social issues addressed by most sustainability initiatives, inspired by the International Finance Corporation (IFC) Performance Standards, and a preliminary assessment of the material issues per sector that Vinci Partners invests or plans to invest. During the due diligence phase, we partner with specialized firms to confirm the initial materiality map and to investigate if additional material risks are present in the target company.
92
Table of Contents
The team also developed an Environmental and Social Management System, or ESMS, to integrate ESG matters in its internal procedures and when monitoring portfolio companies. This approach enables our funds to mitigate ESG-related risks to companies and seek opportunities of value creation through ESG initiatives. Since 2020, the team publishes an ESG annual report for VCP III to provide updated information on ESMS performance and ESG issues of investee companies during the previous year.
Infrastructure
Our infrastructure strategy is also investing heavily in the ESG agenda. We are developing our VICC fund, in our Climate Change sub-strategy, focusing on investments that actively contribute to the climate agenda ranging from renewable energy generation and water supply to the efficient use of natural resources and reduced emissions from other sources. Our goal is to help to mitigate climate change globally. All investments made by VICC should also seek to increase diversity and inclusion across portfolio companies. Furthermore, VICC is now officially Article 9 compliant under European SFDR, one of the few worldwide to meet the requirement.
The complexity of infrastructure investments demands a robust due diligence regarding operational, financial and ESG aspects. Our funds have a strong governance policy, especially those related to government-controlled assets. Vinci Partners’ Water and Sewage strategy closed its first investment in 2021, the public concession of CEDAE Block III. The water and sewage sector is a key sector for ESG investments in Brazil. The fund also has alignment with ESG guidelines through sustainability metrics.
Real estate
Our listed REITs faced a challenging environment over the last two years and showed resilience due to our strong competitive position in the market and the team’s extensive track record. Robust governance in the funds’ investment and monitoring process was a key factor to navigate a difficult market environment. In 2023, our listed REITs faced a challenging start with limited capital-raising opportunities. However, following the onset of the easing cycle, we began to see new issuances, particularly in the shopping center market, where we successfully raised R$1.2 billion in the fourth quarter of 2023. The continued interest rate cuts signal a positive outlook for this segment.
Several of our invested real estate properties have LEED certifications, which reflect our commitment to green practices in our portfolio.
Private Credit
Our private credit segment also has a group of funds dedicated to finance infrastructure projects and companies, such as Vinci Energia Sustentável, or VES, and Vinci Credit Infra. These funds have a series of ESG guidelines, such as a veto on investments in fossil fuels and compliance with social, labor and environmental rules and regulations. VES was funded by the BNDES and other relevant Brazilian institutional investors and was the first Brazilian fund to receive the ESG “European Standard” label. VES closed its investment period ahead of schedule, which reflects our team’s ability to manage this kind of asset.
Vinci SPS
By means of our Litigation Finance strategy we provide access to justice by funding claimants that are entitled to redress but would not be able to bear the costs involved in bringing such claims. By making legal support accessible to victims of a variety of corporate wrongdoings, especially victims of environmental disasters, we seek to actively pressure companies to increase their standards of care in a variety of subject such as antitrust practices, environmental responsibility and corporate governance.
Liquid Strategies
Our Liquid Strategies segment also has an important role regarding ESG practices. Our investment team developed an ESG-focused questionnaire, which could be used for selected mandates and for the evaluation of potential impacts and could lead to divestment from assets that do not fit the targeted profile. The team also focuses on investments that could lead to significant governance impacts, and partners with other groups in voting at shareholder meetings.
93
Table of Contents
IP&S
When our IP&S team analyzes external managers in which to invest, they may also take into consideration ESG practices. A relevant portion of the business is funded by institutional investors, which require a complete asset monitoring process and a thorough due diligence process.
Fundraising
Vinci Partners’ distribution efforts are organized through four client divisions and one additional distribution channel: (1) local institutional clients, (2) institutional offshore clients, (3) HNWIs, (4) allocators and distributors, and (5) public markets vehicles. We have dedicated teams to reach out, advise and follow-up with each investor profile. Our public market vehicles are listed on the B3, and investors are able to trade quotas of the funds directly therein; for these products, we have an exclusive dedicated investor relations team.
| • | Local Institutional Clients: This client division covers Brazilian pension funds (public and private), insurance companies, and large and mid-size corporations. Local institutional clients represent a significant opportunity since they are historically under-allocated to alternative investments. New clients (less than 2.5 years with assets under management by Vinci Partners) represent 3.3% of the division’s AUM. As of December 31, 2023, the 10% largest institutional clients represented 59.3% of the division’s AUM and the top three products are investment products and solutions (49.0% of clients), public equities (44.8% of clients) and private credit (33.8% of clients). As of December 31, 2023, on average, a client had 3.0 different products distributed across an average of 1.9 different strategies. |
| • | Institutional Offshore. This client division covers offshore pension funds, endowments, sovereign funds, fund of funds, asset managers, family offices, and others. We may hire placement agents in order to advise us in the international fundraising of certain vehicles. In our private equity strategy, our foreign investors are primarily based in the United States (33.9%), Europe (46.5%), Middle East (6.1%), and Asia (3.1%). By investor type, our private equity offshore foreign investors are primarily sovereign wealth funds (38.9%), development finance institutions, or DFIs (14.1%) and public pension funds (11.4%). |
| • | High Net Worth Individuals: This client division covers HNWIs, which we consider to be clients that have the potential to invest at least R$30 million. From January 1, 2020 to December 31, 2023, 99.5% of new money came from existing client relationships, excluding our partners. As of December 31, 2023, the 10% largest HNWI clients represent 86.5% of the division’s AUM and the top three products are investment products and solutions (42.8% of clients), private equity (39.3% of clients) and hedge funds (37.4% of clients). As of December 31, 2023, on average, a HNWI had 4.5 different products distributed across an average of 2.4 different strategies. |
| • | Allocators and Distributors (A&D or fund of funds and distributors): This client division covers banks (private, mass affluent and retail sectors), multi-family offices, or MFOs, and approximately 27 distribution platforms such as XP and BTG Digital. This division is responsible for the distribution of all Vinci Partners products, both liquid and illiquid, including private equity. Banks and platforms account for 50.0% and 25.9% of the AUM of this division as of December 31, 2023, respectively, and the top three products are hedge funds (32.1% of clients), investment products and solutions (30.4% of clients), and public equities (30.4% of clients). As of December 31, 2023, on average, a client had 3.6 different products (i.e. investment funds) distributed across an average of 1.9 different strategies. In recent years, this division has focused on leveraging existing relationships to include new investment products and asset classes. Additionally, it has focused on adding new distribution partners, primarily large banks. |
| • | Capital Markets (public market vehicles): These distribution channels cover public market vehicles of our listed funds (e.g. REITs and infrastructure funds). We do not have an origination and client base team like for others distribution channels, but we have a dedicated investor relations team to access and communicate with the market and the quotaholders of listed funds. |
94
Table of Contents
Currently, our AUM is weighted toward long-term capital, with 54% committed for five years or more. Our platform offers a wide range of products across different strategies, and we are supported by a diverse investor base, with 38% of our AUM coming from local institutional clients as of December 31, 2023, followed by HNWIs and institutional offshore, both with 20%, and the remainder from retail clients and public market vehicles;
We believe we have a very loyal client base. Approximately 90% of our client base comes from proprietary relationships from our client division teams or perpetual listed vehicles. Our proximity to our clients is a strong advantage, creating an open and transparent channel in order to understand their needs and propose solutions in every scenario.
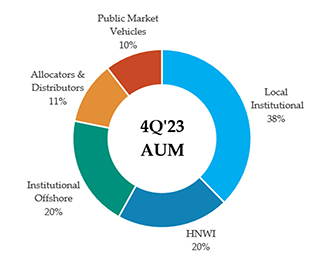
The following table sets forth our AUM by type of investor as of the dates indicated.
| As of December 31, | ||||||||||||
| 2023 | 2022 | 2021 | ||||||||||
| (in R$ million) | ||||||||||||
| Local institutional |
25,829 | 21,608 | 20,428 | |||||||||
| HNWI |
13,947 | 14,911 | 13,472 | |||||||||
| Institutional offshore |
13,800 | 14,634 | 12,772 | |||||||||
| Allocators and distributors |
7,781 | 6,630 | 5,532 | |||||||||
| Public market vehicles |
7,168 | 5,298 | 5,025 | |||||||||
|
|
|
|
|
|
|
|||||||
| Total |
68,525 | 63,081 | 57,229 | |||||||||
|
|
|
|
|
|
|
|||||||
People and Career
At Vinci Partners, we believe that human capital is one of our main strategic differentials. Our culture is to train professionals through initiatives to stimulate self-development through internal and external development programs. The key entry point to work at Vinci Partners is in our support areas, where our people have the opportunity to acquire knowledge about the business’ operations, accumulate experience and improve their professional maturity, in addition to being inserted into the Vinci Partners culture. The other entry point opportunities that arise at Vinci Partners are primarily filled by professionals who are already part of our staff, in keeping with our culture to value our internal human capital. Positions that may not be filled through internal recruitment are filled by expert professionals with proven track records in the target position after a careful external recruitment process.
95
Table of Contents
Training & Development
Our training and development programs, are promoted by our People & Management team and are focused on training our team, leaders and individuals, encouraging self-development, the exchange of expertise among professionals from different areas, the dissemination of culture and integration of personnel.
| • | Inside Vinci (“Por dentro da Vinci”) – This program aims to further integrate our operations team with the business strategies through lectures, which are held periodically by our senior team and which present their professional trajectory, the dynamics and objectives of their strategies and their products. |
| • | Incentive Certifications – The objective of this program is to encourage employees to pursue CFA and CFP certifications and consequently seek development through studies. Vinci Partners reimburses 100% of the tests’ costs for employees who are approved. |
| • | External Courses – These are courses held on demand that aim to develop technical and/or behavioral skills, in addition to network experience and stimulation that cannot be met internally. |
| • | Vinci Training – This structured program takes place periodically throughout the year, is taught by senior people and is open to all areas of the Company. Since its creation, the goal of this program is to increase the framework and technical knowledge of all participants. |
| • | Coaching – This structured development process allows the self-reflection of professionals by stimulating the development of important skills for career ascension within Vinci Partners. For the past three years, this program has been supporting us in accelerating the career of women at Vinci Partners. |
Talent Attraction
Vinci Partners, through the partnership of our People & Management department with our business segments, has been promoting actions with financial leagues and student entities focused on the financial market since 2017, with the objective of contributing to the training of these students and increasingly bringing the Company closer to universities. The initiatives disseminate the culture and strength of the Vinci Partners brand and are a channel of attractiveness of young talent to the company.
| • | Mentoring – Our professionals guide groups of students with an interest in getting to know and specializing in the financial industry. In 2023, we had ten groups of mentors and case studies across our different business strategies. |
| • | Lectures and Sponsorship – We participate in events organized by the universities where our staff share their professional trajectory and the dynamics and objectives of their areas. In 2023, we sponsored the PUC-Rio Finance Week, Meet and Market from USP, UNICAMP Finance Week and gave more than 20 lectures. |
| • | Vinci University Day – A face-to-face event with lectures for the leagues and academic centers of financial markets, which aims to bring the Company closer to universities. In 2023, we organized two editions through our Rio de Janeiro and São Paulo offices, where we received more than 100 students. |
| • | Summer Program – In 2023, we implemented our summer program, which is focused on university students interested in the financial markets. The program has two classes: one for Brazilian students from universities in Rio de Janeiro, São Paulo and other cities, which takes place in January (the Brazilian summer), and one for students from Northern Hemisphere schools (mostly in Europe and in the United States), which takes place in July. |
Compensation and Retention
Vinci Partners seeks to retain talent by paying a competitive total compensation and providing a leading organizational environment, with meritocracy as a focus not only at the individual level, but also at the team level. In addition, in order to retain our leading talents, we encourage an owner’s attitude from our team to sustain their motivation to seek optimal results, in addition to providing the aforementioned trainings. The main mission of the People & Management area is to attract, retain and develop professionals capable of ensuring the sustainable growth of the Company and perpetuity of the business, always aligned with the purpose of Vinci Partners, and disseminate our organizational culture.
96
Table of Contents
We are also constantly concerned with ensuring the continuity of our business and, to do so, we have important compensation tools. Every year, we determine the annual bonus to be received by our personnel through a rigorous, detailed, and meritocratic evaluation of the individual’s performance during the year. This process is a fundamental instrument to identify and reward employees who stood out and are better positioned to become partners.
We also built a seniority categorization model by scale, from junior and operational teams to members of the executive committee. We divided levels beginning at the operational level as the point-of-entry into Vinci Partners (comprised of interns, analysts and associates). The second step includes vice-presidents, principals and managing directors, who are responsible for business development. Finally, the final level of the structure includes partners and members of the executive committee who lead Vinci Partners’ strategy and viability. The transition process between these levels follows a growing scale of development that is assessed during the annual evaluation process.
Since its IPO, Vinci Partners has sought diverse and efficient compensation tools to encourage its most senior members to be engaged and aligned. An important incentive is the possibility of becoming a partner following years of professional excellence and seniority, which has recently been made possible through our long-term incentive plans. This is an annual process and its goal, in addition to retention, is to ensure the continuity of our business. We believe that our retention policy is also an excellent attribute to attract new professionals. Therefore, we understand that our compensation process is robust and aligned with our short-, medium-, and long-term goals.
Risk Management
Vinci Partners seeks to minimize the risks associated with our investment strategy by pursuing the following initiatives:
| • | Financial/Business. Vinci Partners will seek to mitigate refinancing risk by targeting companies with stable and growing cash flows. Vinci Partners will seek to mitigate business risk by targeting companies that have a clear competitive advantage and/or long-term contract or concessions, thus are less vulnerable to the business and economic cycles. We will also focus on companies we believe generally exhibit low dependence on strong economic growth. Before agreeing to any investment, our investment committee must be satisfied that it understands the key risks associated with each investment, and that it has taken, or will take, actions to mitigate those risks. |
| • | Fraud and Corruption. Vinci Partners seeks to undertake a comprehensive anti-fraud and anti-corruption diligence process in connection with all private market transactions. We perform background checks and extensive legal due diligence in every potential deal that our private equity, infrastructure, and real estate funds are involved. Generally, this process is coordinated by the deal team members, with the support of our compliance team and/or external counsel (typically full-service law firms or niche-oriented firms, when required). We monitor the portfolio companies through our specific deal team members, which are required to periodically report updates on the investment (in all aspects, including operational performance, legal issues, and potential irregularities). Additionally, we usually have the right to appoint members to the board of directors and/or management of the portfolio companies—such appointments are another direct channel for this type of reporting. In case of any potential irregularity, the members of the team responsible for the portfolio company shall immediately report such event to the legal and compliance teams who will assess the information and provide guidance on how to proceed. |
| • | Environmental, Social and Governance. Our ESG policies are based on well-known standards and benchmarks, such as: International Finance Corporation Performance Standards; Principles for Responsible Investment; Corporate Sustainability Index from Brazilian Stock Exchange (ISE); Brazilian Institute for Corporate Governance; Dow Jones Sustainability Indexes. These policies are complemented by other policies such as compliance guidelines for Anti Money Laundering, Anti-Corruption, Anti-Terrorist Finance, and our Code of Ethics. In addition, employees are trained annually, and an introductory presentation is made to new employees at each quarter. |
97
Table of Contents
| • | Market and Liquidity Risk. Vinci Partners seeks to mitigate market and liquidity risk by monitoring Liquid Funds on a daily, weekly, or monthly basis accordingly to the profile of each fund. Vinci Partners has policies that drive our risk control activity, and every fund has its own risk limits that are controlled by the risk department and, when applicable, the fund committee. The chief risk officer reports to the chief financial officer and is responsible for solving any breaches to risk limits without the need for the fund manager’s pre-approval. |
Competition
Vinci Partners is a leading alternative asset manager with strong competitive advantages amongst peers. We believe our platform is stronger than our closest competitors and superior in capabilities than what local banks and single-sector focused asset managers can offer. We have several key differentiators which position us as a leading alternative asset manager in the Brazilian market, such as our exposure to long-term capital, our partnership model and a diversified business model with ten different business strategies integrated into a single platform with a comprehensive offering.
We face competition in each of our segments against other sector-focused asset management firms, but when we analyze competition for Vinci Partners as a whole, there is a limited number of players in the Brazilian local market that provide a similar extent of alternative investment opportunities to its investors as we do. Additionally, our proprietary distribution capabilities are a key differentiator from other asset management players that are more dependent on distribution agreements with open platforms and banks.
Infrastructure
We believe that Brazil offers a diverse and deep investment opportunity set, due to the critical need for infrastructure investments, the weak financial position of the central government and higher leverage profile of traditional players. We believe that there is a limited number of active investment managers with the dedicated capital or the experience to invest in Brazilian infrastructure. Vinci Partners believes it is highly differentiated from its competition given the team’s ample transactional expertise (over 30 transactions) particularly, in complex situations, with deep relationships, a flexible investment approach, and sector-specific knowledge. We also face more limited competition from local investment managers in deals averaging from R$100 million to R$300 million.
Private equity
Vinci Partners considers itself a pioneer in Brazilian private equity and we believe we are the only purely Brazilian private equity firm that has always been independent. Since 2004, our flagship Vinci Capital Partners funds have invested R$6.2 billion across 26 investments in Brazil, as of December 31, 2023. Moreover, while many other Brazil-focused funds (such as Warburg and Advent) are affiliated with larger, global managers, Vinci Partners continues to remain independent, with an internally trained team, and whose members have begun and developed their investment careers in Brazil. Given Vinci Partners’ history and presence in Brazil as one of the longest-tenured local private equity firms, Vinci Partners believes it has a distinct competitive advantage against both local and global players. Moreover, for the most part, the strategies employed by these other funds generally do not compete directly with Vinci Partners’ control-oriented, operationally intensive strategy.
Vinci Partners’ sourcing methodology focuses on acquiring businesses or making investments outside of structured auction processes, so in many cases Vinci Partners will not encounter competition during the sourcing phase. Vinci Partners believes that its proprietary sourcing strategy allows us to negotiate more favorable investment terms and downside protections to help generate more attractive returns. Notably, Vinci Partners sourced 17 of the 26 previous investments on an exclusive basis.
The historical limited availability of capital in Brazil for private equity has prevented the development of a significant number of local players, and competition in the current market is derived mainly from investment managers that are able to raise money globally, either through global funds, or Brazil focused funds raised with international limited partners. This creates two positive dynamics for us, first is the limited number of managers chasing investment opportunities in the country, and that equity investment sizes vary substantially and create an additional layer of differentiation between general partners and further reducing competitive pressure.
98
Table of Contents
Private Credit
We believe we are one of the first independent players to offer Brazilian private credit funds focused on the long-term direct lending business. Nevertheless, we currently see some of the asset management platforms (such as Kinea, BTG Pactual, and XP) as being our biggest competitors and the big banks themselves, which either use their balance sheets or offer solutions through their debt capital markets areas for companies to access alternative financing options. As described elsewhere herein, we see a significant opportunity for banking disintermediation in Brazil and for the private credit market to develop.
Most of the allocation of Brazilian pension funds remains concentrated in federal government bonds, which imposes important challenges in overcoming its actuarial goals. We believe that Vinci Partners can offer a range of credit investment strategies, including structured credit transactions and directed lending, that captures more value and can meet this growing demand for return and portfolio diversification for our investors.
Real estate
The real estate strategy of Vinci Partners is the tenth largest manager of listed REITs in Brazil based on ANBIMA data. The largest REIT manager in Brazil is BTG, with R$28.5 billion under management as of December 31, 2023. BTG asset management is controlled by Banco BTG Pactual, one of the largest private banks in Brazil and benefits from the bank´s extensive retail distribution. BTG is followed by Kinea and XP , all of them counting on powerful in-house retail distribution capabilities which enhance their access to capital. It is important to mention that in some of the other players the total AUM figure it is accounted the amount they have under management as the fund administrator of passively managed REITs.
Due to the rapid growth of the REIT industry in recent years, a significant number of new players have come to the market, increasing competition. Notwithstanding, the largest and most established players have a significant competitive advantage competing for capital which was reflected in the market share of these players and the amounts raised by them in 2023. For example, we closed the ninth and tenth issues for additional quotas of VISC, respectively, adding in total R$1.2 billion in AUM. In challenging market environments, as we faced in 2023, we believe that Vinci Partners’ track record and expertise set ourselves apart from competition.
Vinci SPS
We believe that we are among the largest independent players focused on special situations in Brazil. A significant number of new players have come into the market in the past few years, which has increased competition. Nonetheless, we believe that the largest and most established players have a significant advantage competing for capital and sourcing deals, since many of the new entrants operate through club deals, focusing on smaller investment tickets and shorter-term strategies (including immediate flipping). Vinci SPS benefits from a broad and flexible mandate, encompassing five main strategies and allowing for dynamic balancing of portfolio mix according to market swings.
We believe the special situations market in Brazil is vast and may absorb the recent growth without jeopardizing long term performances for tier one players. The asset class allows for differentiation across various aspects such as sub-strategies, ticket, duration, liquidity, governance over assets, capital instrument, geography and primary vs. secondary markets.
Public equities
In Brazil, the biggest competition that the public equities area has is the level of interest rates: Brazilian investors continue to invest very little in variable income instruments and Brazil does not have a long-term investment culture, since interest rates have historically been, and continue to be, high, and even inefficient investing historically generated returns to investors well above inflation.
In the long-term, we estimate that we have between 50 and 60 competing funds. In the dividends mandate, that number is closer to 20. These numbers have been growing over time as new asset managers and public equities firms have been created.
99
Table of Contents
Hedge funds
Competition in the hedge funds market is strong, and several competing firms have a long history and large volumes of assets under management. Brazil has a long history of high interest rates and a well-developed derivatives market, which has been the oldest strategy among Brazilian hedge fund managers.
The fact that we were the first firm based on independent management cells (multi-manager) brought a certain difficulty for investment allocators within clients and potential clients to understand as they were used to the “star manager” model. In recent years, more managers have adopted the multi-manager model, which has become more widely known among investors and allocators. However, we believe that the market will bring more difficulties for managers to generate alpha (both due to the competition and the drop in premiums) and our model is more flexible to adapt to this new paradigm. This is already being observed because the large houses based on this star manager model have had low alpha generation in recent years.
IP&S
Depending on the mandate, the competition varies significantly, as different players offer different strategies that are more or less aligned with our offering within investment products and solutions.
In terms of inflation mandates, we face competition from multi-market fund managers (hedge funds) in the Brazilian industry. We believe that our competitive advantage is our proven track record of investment performance and unique construction of investment products. For example, in the design of the Equilíbrio fund (offered for open pension plans following CMN No. Resolution 4,444), we have an offering aligned with the long-term objective of achieving returns above inflation.
In equity fund-of-funds mandates, we are one of the few investment managers in Brazil to implement the strategy using a structure that allows investors to invest in highly performing managers and have a hedge protection strategy in the same vehicle. We believe this is a significant differentiating factor for institutional investors who do not have the agility to use hedging to protect their portfolios. Our competitors in the fund-of-funds market tend to be financial institutions (which do not offer the same product).
In the Brazilian exclusive asset allocation mandates for families, we generally compete with financial institutions and MFOs. As for pension funds, we compete with financial institutions, but in the current environment we have certain key advantages: recognized ability to invest in alternative classes, carrying out protection operations and greater knowledge of the pension fund industry.
In the international exclusive asset allocation mandates, we compete with Brazilian and international financial institutions and MFOs. However, we believe that we managed to stand out because we invest in more niche managers and bring customers closer to managers while being transparent throughout the process.
In the international fund-of-funds asset allocation mandate for investments outside of Brazil, we currently have limited competition within Brazil because we maintain the strategy of investing in more niche managers, adding to the fund the risk management layer on currency exposure.
Retirement Services
Since 2022, we have been working on the development of our new retirement services segment to seize the extensive opportunity that we believe we encountered in Brazil. The addressable retirement services market is sizeable, with more than R$1.4 trillion in AUM and double-digit growth in recent years, according to FenaPrevi. While liquid markets have struggled with outflows, open-ended pension plans posted another year of inflows, according to ANBIMA.
Looking to our competition, approximately 90% of the retirement services industry is controlled by traditional banks, according to FenaPrevi. This bears a direct relationship with one of Vinci Partners’ growth opportunities: the decentralization of capital from traditional banks. This is seen in recent pension plan portability numbers, as we are seeing a significant number of flows from traditional banks to independent insures, according to SUSEP.
100
Table of Contents
In addition, there is a lack of independent alternative players offering open-ended pension plans. Currently in Brazil, this number is a low single-digit number of relevant players, according to FenaPrevi. We believe that the market has several barriers of entries caused by expertise and structuring requirements. In particular, SUSEP has a number of requirements that only sizeable and consolidated players can address, which we believe places Vinci Partners in a unique position to capture a relevant portion of the industry. With that said, our biggest competitors are traditional banks, which hold close to 90% of the market share in the retirement services market, according to FenaPrevi. The remainder market share is primarily held by XP, Inc., BTG Pactual and Icatu Seguros.
Financial Advisory Services
Our Financial Advisory Services business competes mainly against local and international M&A boutiques.
Regulatory Overview
We are subject to government authorizations and extensive regulation in the jurisdictions in which we operate and conduct our activities.
Regulatory Matters in Brazil
Nine of our subsidiaries, Vinci Capital Gestora de Recursos Ltda., Vinci Equities Gestora de Recursos Ltda., Vinci Soluções de Investimentos Ltda. (former Vinci Gestão de Patrimônio Ltda.), Vinci Gestora de Recursos Ltda., Vinci GGN Gestão de Recursos Ltda., Vinci Infraestrutura Gestora de Recursos Ltda., Vinci Real Estate Gestora de Recursos Ltda., Vinci Asset Allocation Ltda, and SPS Capital Gestão de Recursos Ltda., or the Regulated Entities, carry out operations that are subject to specific Brazilian laws and regulation by the CVM. Furthermore, Vinci Gestora de Recursos Ltda. is a member of ANBIMA and all Regulated Entities are also subject to ANBIMA’s codes and rules. Vinci Capital Gestora de Recursos Ltda. is associated with the Brazilian Private Equity and Venture Capital Association (Associação Brasileira de Private Equity e Venture Capital), or ABVCAP.
The Regulated Entities are licensed to operate in the Brazilian capital markets as asset management companies (administrador de carteiras de valores mobiliários) by the CVM, and subject to the rules and oversight of the CVM, pursuant to Law No. 6,385 of December 7, 1976, or Law No. 6,385/76, and CVM Resolution No. 21 of February 26, 2021, or CVM Resolution No. 21.
The Regulated Entities provide securities portfolio management services, pursuant to CVM Resolution No. 21, and are members of the ANBIMA and the ABVCAP, adhering to the applicable codes of best practices for each of the types of investment funds the portfolio of which they manage in Brazil. The Regulated Entities can perform portfolio management services to all types of investment funds in Brazil and to securities portfolios (carteiras administradas).
Furthermore, the Regulated Entities are duly authorized to act in the distribution of quotas of the investment funds that they manage, pursuant to article 33 of CVM Resolution No. 21, which allows asset management companies to perform distribution activities, however with certain restrictions in relation to an entity fully authorized as a member of the distribution system, such as not being able to distribute securities issued by third parties. To perform such distribution activities, the Regulated Entities must comply with all CVM rules applicable to the members of the distribution system regarding (1) suitability requirements in respect of client investor profiles, (2) registration of clients, payment of redemption amounts, amortizations and/or investment orders to and from the clients’ accounts, (3) money laundering, concealment of assets, rights and values prevention and (4) exchange of information between the distributor and the fiduciary administrator of the relevant fund.
Our subsidiary Vinci Vida e Previdência S/A, or VVP, is subject to specific Brazilian laws and regulation enacted by the SUSEP and is licensed to operate life insurance and open-ended pension plans in Brazil. The applicable laws in Brazil include Complementary Law No. 109/2001, Decree Law No. 73/1966 and certain other rules and regulations issued by the National Private Insurance Council (Conselho Nacional de Seguros Privados), or CNSP, and SUSEP, among others.
101
Table of Contents
Laws and Regulations Applicable to Asset Management and Insurance Activities in Brazil
Law No. 6,385/76, regulates the issuance, offering and distribution of securities (including shares of funds) in the public market, as well as the trading of securities, management and settlement and/or clearance of securities transactions in Brazil. All such activities require prior authorization from the CVM.
The capital markets regulatory framework, in Brazil, is further supplemented by regulation issued by the CMN, the CVM, the SUSEP and the Brazilian Central Bank, and self-regulation policies, such as those issued by securities exchanges and self-regulated entities, that govern their members and participants, (such as, for example, B3 S.A. – Brasil, Bolsa, Balcão, or B3, the ANBIMA and the ABVCAP).
Licensing Requirements
As to our asset management activities in Brazil, the main regulation applicable to our affiliates is CVM Resolution No. 21, which defines professional asset management activities as activities directly or indirectly related to the operation, maintenance, and management of securities portfolios, including the investment of funds in the securities market on behalf of clients.
CVM Resolution No. 21 provides for two categories of asset managers: (1) fiduciary administrators, which are not allowed to trade securities on behalf of clients and/or (2) portfolio managers, which are allowed to manage portfolios on clients’ behalf, including through the trading of securities. All of our affiliates that carry out asset management activities are registered with the CVM as portfolio managers.
To be authorized by the CVM to engage in such an activity, legal entities that operate as asset managers must (1) have a registered office in Brazil; (2) have fiduciary administration or securities portfolio management, as applicable, as a corporate purpose and be duly incorporated and registered with the Legal Entities Taxpayer Registration – CNPJ; (3) have one or more officers duly certified and approved by CVM to take on liability for fiduciary administration or securities portfolio management, as applicable, pursuant to CVM Resolution No. 21; (4) appoint a compliance officer and, in the case of portfolio managers, also a risk management officer; (5) appoint a distribution officer, if the entity distributes shares of investment funds administrated or managed thereby, as applicable; (6) be controlled by reputable shareholders (direct and indirect), who have not been convicted of certain crimes detailed in article 3, VI of CVM Resolution No. 21; who is not unable or suspended from occupying a position in financial institution or other entities authorized to operate by the CVM, the Brazilian Central Bank, SUSEP or PREVIC, and have not been banned from asset management activities by judicial or administrative decisions; (7) put in place and maintain personnel and IT resources appropriate for the size and types of services to be rendered; and (8) execute and provide the applicable forms to the CVM so as to prove its capacity to carry out such activities, pursuant to CVM Resolution No. 21.
In compliance with CVM Resolution No. 21, among other measures, each of our asset management affiliates has one officer duly registered with CVM as asset managers, who are responsible for the portfolio management activities, as well as officers appointed specifically for compliance, risk management and distribution activities. Our affiliates also maintain personnel and IT resources appropriate for their size.
This same regulation requires our affiliates to conduct their activities in good faith, with transparency, diligence, and loyalty with respect to clients, and perform their duties with the aim of achieving clients’ investment objectives. Our affiliates must also maintain a website, with extensive current information, including, but not limited to (1) an updated annual filing form (formulário de referência), (2) a code of ethics, (3) rules, procedures and a description of internal controls in order to comply with CVM Resolution No. 21, (4) a risk management policy, (5) a policy for purchase and sale of securities by managers, employees and the company, and (6) a policy for allocation and division of orders among the securities portfolios.
Under CVM Resolution No. 21, our asset management affiliates are forbidden from (1) making public assurances of profitability levels based on the historical performance of portfolio and market indexes; (2) modifying the basic features of the services they provide without following the prior appropriate procedures under the asset management agreement and regulations; (3) making promises as to future results of the portfolio; (4) contracting or granting loans on behalf of their clients, subject to certain exceptions set out in regulation; (5) providing guarantees or becoming a joint obligor in any other form with respect to the managed assets, except in certain circumstances set forth in the regulation; (6) neglecting, under any circumstances, the rights and intentions of the client; (7) trading securities from the portfolios they manage with the purpose of obtaining brokerage revenues or rebates for themselves or third parties; or (8) subject to certain exceptions set out in the regulation, acting as a counterparty, directly or indirectly, to clients.
102
Table of Contents
In addition, our subsidiary Vinci Soluções de Investimentos Ltda. (former Vinci Gestão de Patrimônio Ltda.), performs wealth management activities. Wealth management activities, in Brazil, encompass services to investors with an individualized approach. While such services are subject to CVM regulation regarding portfolio management, ANBIMA has a set of additional rules applicable to entities that perform wealth management activities governing best practices in dealing with the owner of the managed assets and mitigation of agency risks.
The asset management industry is subject to further regulation, mainly from the CVM, but also from the CMN and other authorities. Specific regulations apply to the various types of funds we manage, according to the class of assets held, the qualification of the investment public target, and how shares are offered, among other things.
Insurance companies such as VVP are required to be licensed by SUSEP in order to operate in any given insurance field and are subject to the local legal and regulatory framework governing their operations, governance, solvency, products, accounting, actuarial standards and other technical aspects of their business.
With respect to solvency, CNSP Resolution No. 432/2021 and SUSEP Circular No. 648/2021 provide for sets forth technical provisions and standards for assets that reduce the need to cover technical provisions, risk capital, adjusted net worth, minimum required capital, smoothing plans, retention limits, accounting standards, criteria for investments, accounting standards, regularization plans, accounting auditing and independent actuarial auditing.
The minimum capital requirement is the total capital that a supervised company must maintain in order to operate and is equivalent to the greater of the base capital and risk capital (segregated in market, credit, underwriting and operational risk capital). Base capital is a fixed amount of R$1.2 million and a variable amount according to the geographical region in which the insurer operates. For insurers classified as an “S3” entity (a type of systemic risk classification) operating in all the geographic regions of Brazil, like Vinci Vida e Previdência S.A., the base capital is R$3.96 million. Risk capital is calculated using highly detailed rules.
With respect to investments, CNSP Resolution No. 432/2021 applies, as a general rule, to both “free” assets (not related to technical provisions and reserves) and assets related to technical provisions and reserves and imposes general prudential rules. CMN Resolution No. 4,993/2022 applies only to assets related to technical provisions and reserves. CMN Resolution No. 4,993/2022 establishes also some general prudential rules and, in particular, allocation limits to fixed income, variable income, real estate, and investments subject to exchange variation, among others.
With respect to governance, CNSP Resolution No. 422/2021 authorizes SUSEP to regulate, among other things, licensing, mandatory statutory or contractual bodies, the payment of capital and transfer of portfolio, and corporate control structure. In addition, SUSEP Circular No. 622/2021 regulates the prevention of money laundering, SUSEP Circular 638/2021 regulates cybersecurity and SUSEP Circular No. 666/2021 regulates sustainability requirements.
With respect to product marketing, the primary rules on personal insurance, which is VVP’s line of operation, and more specifically risk and accumulation products, are CNSP Resolution No. 348/2017, SUSEP Circular No. 564/2017, SUSEP Circular No. 667/2022 and CNSP Resolution No. 439/2022. VVP’s operations are concentrated in accumulation products, which in Brazil are associated with tax benefits.
Internal Compliance Procedures
CVM Resolution No. 21 requires that asset management firms maintain internal compliance procedures.
Moreover, SUSEP rules require all supervised companies to implement and maintain an internal control system and appoint a statutory officer responsible for internal controls. Supervised companies must create a compliance unit responsible exclusively for continuously monitoring and supporting the activities aimed at ensuring compliance. In addition, companies supervised by SUSEP must implement and maintain a risk management structure and have a risk management policy. Such companies must also create a risk management unit, responsible exclusively for continuously monitoring and supporting its risk management, and a risk committee, responsible for assisting its most senior managerial body in the performance of its attributions related to risk management. Finally, insurance
103
Table of Contents
companies must also implement an internal audit unit, which must be exclusively responsible for carrying out audit activities. This unit must be independent and segregated from the other organizational units, including the compliance and risk management units, reporting functionally directly to the maximum management body of the supervised company or indirectly, through the audit committee. External audit is also mandatory and subject to an array of rules.
Main Regulatory Entities
The main regulatory entity with authority to regulate our operations is the CVM. In addition, our asset management affiliates are associated with and subject to the self-regulatory rules issued by the ANBIMA and the ABVCAP. In addition, our life insurance and open-ended pension plans segment is regulated by the SUSEP and the CNSP.
We present below a summary of the main duties and powers of the CVM, ANBIMA and ABVCAP, and the SUSEP.
CVM
The CVM is a federal regulatory authority responsible for implementing the CMN’s policies related to the Brazilian capital market and for regulating, developing, controlling and inspecting the securities market.
The main responsibilities of the CVM are the following:
| • | regulating the Brazilian capital markets, in accordance with Brazilian corporation law and securities law; |
| • | setting rules governing the operation of the securities market, including public offerings; |
| • | defining the types of financial institutions that may carry out activities in the securities market, as well as the kinds of transactions that they may perform and services that they may provide in such market; |
| • | controlling and supervising the Brazilian securities market through, among others: |
| • | the approval, suspension and de-listing of publicly held companies; |
| • | the authorization of brokerage firms to operate in the securities market and public offering of securities; |
| • | the supervision of the activities of publicly held companies, stock exchange markets, commodities and future markets, financial investment funds and variable income funds; |
| • | the requirement of full disclosure of relevant events that affect the market, as well as the publication of annual and quarterly reports by publicly held companies; and |
| • | the imposition of penalties; and |
| • | permanently supervising the activities and services of the securities market, as well as the dissemination of information related to the market and the amounts traded therein, to market participants. |
ANBIMA and ABVCAP
ANBIMA and ABVCAP are private self-regulatory associations of asset managers and other entities, which, among other things, establish rules as well as codes of best practices for entities operating in the Brazilian capital market.
SUSEP and CNSP
SUSEP is a federal agency in Brazil in charge of implementing and conducting policies established by CNSP and the supervision of the insurance, coinsurance, retrocession, capitalization, supplementary pension schemes and brokerage. In turn, the CNSP is made up of one representative of each one of the following bodies: the Brazilian Ministry of Social Security, the Brazilian Central Bank, the Brazilian Ministry of Finance, the Brazilian Ministry of Justice and the CVM, in addition to the superintendent of SUSEP.
104
Table of Contents
The supplementary insurance and pension sectors in Brazil are subject to overlapping regulations. Decree-Law No. 73/as amended, sought to centralize the legislation and inspection activities in the sector by creating the National Private Insurance System (Sistema Nacional de Seguros Privados), or the SNSP, composed of: (1) the CNSP; (2) SUSEP; (3) insurance companies duly authorized to operate in the private insurance market; (4) reinsurance companies; and (5) duly qualified and/or registered insurance brokers. The CNSP is linked to the Ministry of Finance and its main roles include establishing the guidelines and rules for the private insurance policy in Brazil; regulating the incorporation, organization, operations and inspection of insurers, reinsurers, supplementary open pension funds and capitalization companies as well as establishing capital thresholds for such entities; establishing the general characteristics of insurance and reinsurance contracts; establishing general guidelines for insurance, reinsurance, supplementary open pension funds, and capitalization operations; establishing general accounting and statistical rules as well as legal, technical and investment limits for the operations of insurers, reinsurers, supplementary open pension funds and capitalization companies; and regulating insurance and reinsurance broker activities and profession.
SUSEP’s main roles include processing application requests of incorporation, organization and operations, and inspecting insurers, reinsurers, supplementary open pension funds, and capitalization companies; issuing instructions and circular letters in connection with the regulation of insurance, reinsurance, supplementary open pension funds and capitalization operations, in accordance with CNSP guidelines; setting forth the conditions of insurance plans to be used by the insurer market; approving limits for the operations of supervised companies; authorizing the use and release of assets and amounts given in guaranty for technical provisions and discretionary capital; inspecting and implementing the general accounting and statistical rules set forth by CNSP; inspecting the operations of supervised companies; and conducting the liquidation of supervised companies.
Punitive Sanctions
Legal violations under Brazilian securities laws may lead to administrative, civil and criminal liability. Offenders may be prosecuted under all three legal theories separately, before different courts and regulatory authorities, and face different sanctions with respect to the same legal offense.
Law No. 13,506 and CVM Resolution No. 45, dated August 31, 2021 (which replaced CVM Rule No. 607, dated June 18, 2019), regulate administrative sanctioning proceedings as well as the various penalties, consent orders, injunctive measures, fines and administrative settlements that may be imposed by the CVM.
Among other matters, Law No. 13,506:
| • | limits fines imposed by the CVM to the greater of the following amounts: R$50 million, twice the value of the irregular transaction, three times the amount of the improperly obtained economic gain or improperly avoided loss, or twice the damage caused by the irregular conduct. Repeat offenders may be subject to treble the amounts above; |
| • | provides for the suspension, disqualification and prohibition from engaging in certain activities or transactions in the banking or securities market for a period of up to twenty years; |
| • | imposes coercive or precautionary fines of up to R$100,000 per day, subject to a maximum period of thirty days in punitive fines; |
| • | prohibits offending institutions from participating in securities markets; and |
| • | provides the CVM with the authority to ban the accused from contracting with official Brazilian financial institutions and participating in public bidding processes for a period of up to five years; |
Penalties may be aggregated, and are calculated based on the following factors:
| • | gains obtained or attempted to be gained by the offender; |
105
Table of Contents
| • | economic capability to comply; |
| • | severity of the offense; |
| • | actual losses; |
| • | any recurrence of the offense; and |
| • | the offender’s cooperativeness with the investigation. |
Insurance companies are subject to the administrative sanctions set forth in Decree-Law 73/1966 and regulated by CNSP Resolution No. 393/2020. SUSEP Circular No. 645/2021 deals with the supplementary rules on administrative sanctioning proceedings.
CNSP Resolution No. 393/2021 establishes the following sanctions for individuals and legal entities: warnings; fines of up to R$ 20,000,000.00; the suspension of the authorization to carry our activities or a profession; the suspension to operate in classes, group of classes in insurance or reinsurance operations; the suspension to operate in types of capitalization titles; the ineligibility to hold a position or office in the public sector and in state-owned or mixed economy companies and their subsidiaries, complementary pension fund entities, capitalization companies, financial institutions, insurance and reinsurance companies; the disqualification to hold the position of manager of legal entities; the cancellation of the authorization to exercise carry out activities or operations; and the cancellation of the insurance broker registration. In practice, the most frequent sanction is a fine, the amount of which varies according to the circumstances of the offense (e.g. recurrence, seriousness, prior occurrences, attenuating factors, aggravating factors, gains obtained, among others).
In parallel, SUSEP Circular No. 643/2021 deals with consumer complaints, especially the registration of complaints on consumidor.gov.br, the Brazilian federal government’s official website for the resolution of consumer disputes.
Anti-Money Laundering Regulations
Law No. 9,613 of March 3, 1998, as amended by Law No. 12,683 of July 9, 2012, or the AML Law, and Law No. 13,506 of November 13, 2017 (related to administrative procedures and enforcement conducted by the CVM and the Brazilian Central Bank), play a major regulatory role in the oversight of banking and financial activities in Brazil. The AML Law sets forth the rules and the penalties to be imposed upon persons engaging in activities that constitute “laundering” or the concealing of property, cash, or assets, acquired or resulting from any kind of criminal activity. Such regulation further prohibits individuals from using the financial system for the aforementioned illicit acts. The AML Law also created the Council of Control of Financial Activities (Conselho de Controle de Atividades Financeiras) or COAF, which operates under the Ministry of Economy. The purpose of the COAF is to investigate, examine, identify and impose administrative penalties in respect of any suspicious or unlawful activities related to money laundering in Brazil, without prejudice to the authority of other bodies and entities, as well as report suspicious criminal activities to the prosecutors and the police. Article 11 of the AML Law provides that each business must comply with the rules enacted by regulators with authority over it. In the case of asset managers, the CVM is the main regulator and CVM Resolution No. 50, dated August 31, 2021 (which replaced CVM Rule No. 617, dated December 5, 2019), which focus on a risk-based approach and reinforcements of internal compliance, is CVM’s main regulation regarding anti-money laundering and combating the financing of terrorism, or AML/CFT for asset managers. In the case of insurance companies, SUSEP Circular No. 612/2020 is the main rule applicable to our subsidiary VVP.
Pursuant to the AML Law, asset managers and insurance companies, among others, must comply as follows: (1) identify and maintain up-to-date records of their clients, for a period of at least five years, (2) keep up-to-date records of all transactions, for a period of at least five years, in foreign currencies, involving securities, bonds, credit, financial instruments, metals or any asset that if converted into cash exceed the amount set forth by the competent authorities, and which shall be in accordance with the instruction issued by these authorities; (3) adopt anti-money laundering, or AML, internal control policies and procedures that are compatible with the size and operations of the company; (4) monitor whether any client and/or their ultimate beneficial owners are persons under sanction by the United Nations’ Security Council and hastily notified to the Ministry of Justice and Public Safety, COAF and the CVM or the SUSEP in case any attempt to transfer funds to such a person is identified; (5) register
106
Table of Contents
and maintain up-to-date records with the appropriate regulatory agency (i.e., COAF and/or CVM or SUSEP); (6) comply with COAF’s requests and obligations; (7) pay special attention to any transaction or corporate reorganization of clients or ultimate beneficial owners of clients that, in light of the provisions set forth by competent authorities, may indicate suspicion of money laundering or financing of terrorism or where the ultimate beneficial owner cannot be ascertained; (8) report all suspicious transactions (pursuant to CVM Resolution No. 50 and SUSEP Circular No. 612) to COAF within twenty-four hours, while abstaining from notifying their customers of such report; and (9) confirm to the applicable regulatory agency (i.e., COAF and/or CVM or SUSEP) that no transactions have occurred, in the case there are no transactions.
Specifically, CVM Resolution No. 50, establishes, among other obligations, that persons who engage in the custody, issuance, distribution, settlement, trade, intermediation, consultancy or management of bonds or other securities must adopt rules, procedures, and internal controls in accordance with previously and expressly established procedures to confirm the registration information of its clients, keep such information updated and monitor the transactions carried out thereby. These rules aim at preventing the use of the account by third parties and identify the end beneficiaries of transactions. Business relations with politically exposed persons are also to be closely monitored.
Other guidelines and procedures provided for in CVM Resolution No. 50 are listed below:
| • | Risk-Based Approach. Through their internal rules, procedures and controls, the entities subject to CVM Resolution No. 50 should define the scope of analysis in their registration procedures and AML and combating the financing of terrorism, or AML/CFT, in accordance with a group of considerations, such as: (i) scope of activities performed by the regulated entity; (ii) scale; (iii) complexity and diversity of transactions; (iv) client base; among other aspects that can assist in measuring the level of risk inherent to the different existing business models; (v) employees and services providers: the entities shall have policies for continually knowing them (KYE and KYP); and (vi) criteria for politically exposed person (PEP) investors. It is important to note that the risk-based approach comprises of two aspects: the level of risk assigned to clients and that assigned to the entity’s products and services. |
| • | Exchange of information between entities of the same conglomerate. Entities of the same conglomerate which are regulated by CVM should establish information exchange mechanisms in their AML/CFT policy to ensure greater synergy between different areas of internal controls. |
| • | Detailing duties of the officer responsible for AML/CFT and possibility of appointing a single officer for the conglomerate. CVM Resolution No. 50 provides for a detailed description of the duties of the statutory officer responsible for AML/CFT in relation to the establishment of policies, procedures and internal controls of regulated entities, as well as the verification of their effectiveness. In addition, it allows the appointment of a single officer responsible for all entities of the conglomerate. |
| • | Regulation of the obligations arising from Law No. 13,810/2019. The new rule is in alignment with Law No. 13,810/2019, since it adheres to the sanctions imposed by the United Nations Security Council resolutions, as well as to the recommendations of the FATF. |
| • | Definition of steps for KYC procedures. Entities subject to CVM Resolution No. 50 shall adopt KYC procedures which at least include the following four steps: (i) client identification; (ii) onboarding; (iii) due diligence; and (iv) identification of beneficial owners. |
| • | Identification of Ultimate Beneficial Owner(s). CVM Resolution No. 50 provides a definition of ultimate beneficial owner as a “natural person or persons who jointly own, control or have direct or indirect significant influence on a client on behalf of whom a transaction is being conducted or benefits therefrom” and determines that regulated entities adopt procedures to identify ultimate beneficial owners. The same requirement applies to persons who exercise significant influence on the client, thus understood as the situation in which a natural person, whether the controller or not, actually influences decisions or holds more than twenty-five percent (25%) of the share capital of legal entities or the net equity of investment funds and other entities. It is important to note that the rule provides certain exceptions to the obligation on ultimate beneficial owners, such as in the case of publicly listed companies, registered investment funds (provided that they are not exclusive and managed by a CVM-authorized manager) or certain foreign investors. |
107
Table of Contents
| • | Alternative onboarding systems and simplified onboarding process for non-resident investors. The new rule allows the using of alternative onboarding systems, if they meet the applicable rules and regulations, ensuring the protection of client information, as well as the maintenance and traceability of this information. Furthermore, through Annex 11-B to CVM Resolution No. 50, said rule maintains the simplified onboarding tool for NRIs. It is worth mentioning that the simplified onboarding process does not exempt the regulated entity from conducting KYC procedures. Nevertheless, in line with the risk-based approach, the new rule indicates a greater flexibility of deadlines for updating the onboarding information on clients of regulated entities. |
| • | Regulated entities that have no direct relationship with investors. CVM Resolution No. 50 expressly states that entities lacking direct contact with investors must adopt AML/CFT procedures that are compatible with the activities performed; for the purposes of the risk-based approach, the AML/CFT policy and its respective rules, procedures and internal controls of the entities that have a direct relationship with clients can be applied. Also, said entities lacking direct contact with investors should maintain a process for exchanging information with the entities that have direct contact with their clients, apart from other obligations indicated therein. |
SUSEP Circular No. 612 imposes similar internal controls and monitoring requirements upon life insurance and complementary pension companies, in particular: (1) the monitoring of transactions involving politically prominent persons, terrorism and money laundering; (2) the prevention, monitoring and detection of suspicious transactions; (3) the registration of transactions with clients and beneficiaries, third parties and related parties; and (4) the validation of compliance mechanisms by internal auditing. Companies subject to this regulation are also required to appoint one of their Officers as head of compliance and register such individual in accordance with anti-money laundering laws and SUSEP Circular No. 612.
Relationships with other Regulated Entities
The Regulated Entities perform a range of portfolio management services to the funds under our management, as described above. In order to provide such services, the Regulated Entities engage with local representatives and custodians to register and effect foreign investments in Brazil under CMN Instruction 4,373, or the 4,373 Representatives and Custodians. The 4,373 Representatives and Custodians are entities regulated by the CVM and the Brazilian Central Bank, and are subject to the same AML/CFT rules described above, in addition to other rules on custody and representation applicable to non-resident investments in Brazil.
In addition, given that the Regulated Entities are only licensed to perform portfolio management services, we need to engage third-party fiduciary administrator to perform fiduciary administration services to the investment funds managed by the Regulated Entities.
Regulatory Matters in the United States
We are subject to the following laws, regulation and oversight in the United States.
The Advisers Act
Our subsidiary Vinci Partners USA LLC is based in the United States and provides investment advice to the general partners and managers of Vinci Partners funds.
Vinci Partners USA LLC is registered under the U.S. Investment Advisers Act of 1940, as amended, or the Advisers Act, as an investment adviser with the SEC. Investment advisers registered with the SEC are subject to the requirements and regulations of the Advisers Act. Such requirements and regulations include, among other things, fiduciary duties to advisory clients, compliance program obligations, regulatory reporting requirements, disclosure obligations, advertising rules, mandated safeguards for protecting client funds and securities, limitations on agency cross and principal transactions between an adviser and its advisory clients, restrictions on advisory contract assignments, privacy protection regulations, anti-corruption rules relating to investors associated with U.S. state or local governments, and general anti-fraud prohibitions.
108
Table of Contents
Certain investment advisers affiliated with us whose principal places of business are outside of the United States qualify for an exemption from the Advisers Act’s registration requirements, but they file reports with the SEC as “exempt reporting advisers” pursuant to the terms of the registration exemption on which they rely. Provisions of the Advisers Act that apply only to registered investment advisers do not apply to exempt reporting advisers. However, exempt reporting advisers are subject to some of the requirements and regulations of the Advisers Act, including, among other things, fiduciary duties to advisory clients, recordkeeping and regulatory reporting requirements, disclosure obligations, limitations on agency cross and principal transactions between an adviser and its advisory clients, anti-corruption rules relating to investors associated with U.S. state or local governments, and general anti-fraud prohibitions.
Supervision and Sanctions: Investment Advisers
Vinci Partners USA LLC, as a registered investment adviser, is subject to periodic inspections by the SEC. A regular or routine SEC inspection will typically involve, at a minimum, a careful review of the adviser’s books and records and may include interviewing employees. The SEC inspection staff may also conduct more frequent examinations focusing on a limited number of specific issues or conduct an examination “for cause.” In addition, the SEC is authorized under the Advisers Act to require exempt reporting advisers, including those affiliated with us, to maintain records and provide reports, and to examine these advisers’ records.
The SEC may bring civil actions against investment advisers, and seek damages or other relief, either in a U.S. district court or before an administrative law judge. Criminal actions under the Advisers Act are referred to the U.S. Department of Justice. The Advisers Act provides that persons who willfully violate the provisions and rules of the Advisers Act are subject to criminal penalties of up to five years in prison and/or significant monetary penalties. In general, Section 203(e)-(f) of the Advisers Act gives the SEC the authority to discipline an adviser if, among other things, the adviser or certain persons associated with the adviser engaged in certain prohibited acts, generally including securities fraud. The disciplinary actions, orders or sanctions the SEC may impose include significant monetary penalties, disgorgement of gain, cease-and-desist orders, censure, suspension, and revocation of the investment adviser’s registration. The SEC can also bar an individual from being associated with a registered investment adviser for a prescribed period or take other actions designed to prevent violations.
C. Organizational Structure
We are a Cayman Islands exempted company incorporated with limited liability on September 21, 2020.
As of December 31, 2023, we had a total of 53,778,817 common shares issued and outstanding. Of these shares, 39,312,578 were Class A common shares and 14,466,239 were Class B common shares, all such Class B common shares being beneficially owned by Gilberto Sayão da Silva. In addition, we had 100,000 Series A convertible preferred shares of our authorized share capital issued and outstanding and 3,134,771 Class A common shares that were held in treasury. See “Item 7. Major Shareholders and Related Party Transactions—A. Major Shareholders.”
Our group is currently composed of 16 main companies, 14 of which are incorporated in Brazil and two of which are incorporated in other countries. Our material operating subsidiaries are: Vinci Gestora de Recursos Ltda., Vinci Equities Gestora de Recursos Ltda., Vinci Capital Gestora de Recursos Ltda., Vinci Assessoria Financeira Ltda., Vinci Soluções de Investimentos Ltda. (formerly Vinci Gestão de Patrimônio Ltda.), Vinci Real Estate Gestora de Recursos Ltda., Vinci Infraestrutura Gestora de Recursos Ltda., Vinci GGN Gestão de Recursos Ltda., Vinci Asset Allocation, and SPS Capital Gestão de Recursos Ltda.
109
Table of Contents
The following chart shows our simplified corporate structure:
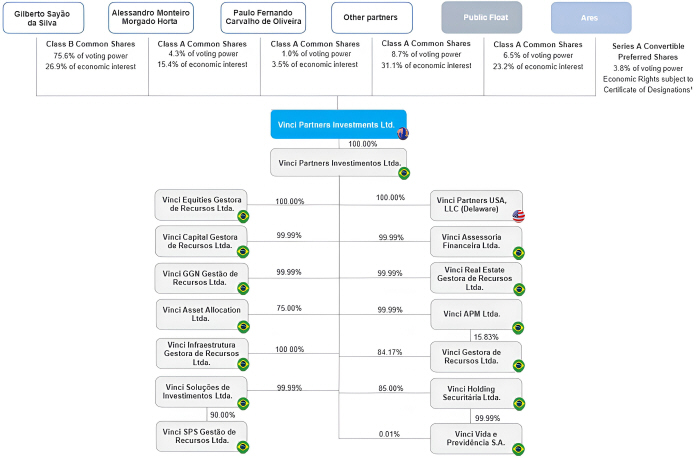
| (1) | For more information, see “Item 4. Information on the Company—A. History and Development of the Company—Our History—Ares Investment.” |
D. Property, Plant and Equipment
Intellectual Property
We rely on a combination of trademark, domain names and trade secret laws, as well as employee and third-party non-disclosure, confidentiality, and other types of contractual arrangements to establish, maintain and enforce our intellectual property rights, including with respect to our proprietary rights related to our products and services. In addition, we license technology from third parties.
As of December 31, 2023, we owned 21 Brazil-issued patents or copyrights.
In Brazil, title to a trademark is only acquired once a valid registration is issued by the BPTO. The holder of a valid trademark registration has the right to its exclusive use throughout Brazil for an initial term of 10 years, renewable for additional and successive 10-year terms. During the registration process, the applicant requesting the trademark registration has only an expectation of the exclusive right to use the trademark to identify its products or services. We own a number of trademarks including “Vinci Partners,” “Vinci Partners Investments,” and other valuable trademarks and designs covering various brands, products, programs and services, including “Vinci” and “Value from the Core.” We also own a number of domain names registered in Brazil, “vincishopping.com.br,” “vilg11.com.br,” “vincienergia.com.br,” “vincioffices.com.br,” “vincionline.com.br,” “vinciplataforma.com.br,” “vino11.com.br,” “visc11.com.br,” and abroad such as “vincipartners.com ,” “vifi11.com,” “vilg11.com,” “vincifii.com,” “vincilogistica.com,” “vincioffices.com,” “visc11.com,” “vincionline.com,” and “vino11.com,” which all are currently in use.
110
Table of Contents
Properties
Our corporate headquarters are located in Rio de Janeiro and our principal executive offices, which include the majority of our product development, sales, marketing, and business operations, are located in both Rio de Janeiro and São Paulo. Our principal executive offices consist of approximately 31,194 square feet of space in Rio de Janeiro and 14,838 square feet of space in São Paulo under leases that expire on August 5, 2025 and August 5, 2030 (for Rio de Janeiro) and on April 3, 2026 (for São Paulo). We also have offices in other locations, including in Recife and Ribeirão Preto in Brazil and in New York City in the United States, and believe our facilities are sufficient for our current needs.
As of December 31, 2023, we had a services agreement with a data center service provider for the provision of data services to us from its data centers in the city of Rio de Janeiro, Brazil. We believe that our facilities are suitable and adequate for our business as presently conducted; however, we periodically review our facility requirements and may acquire new space to meet the needs of our business or consolidate and dispose of facilities that are no longer required.
| ITEM 4A. | UNRESOLVED STAFF COMMENTS |
Not applicable.
| ITEM 5. | OPERATING AND FINANCIAL REVIEW AND PROSPECTS |
The following discussion of our financial condition and results of operations should be read in conjunction with our audited consolidated financial statements as of and for the years ended December 31, 2023, 2022 and 2021 and the notes thereto, included elsewhere in this annual report, as well as the information presented under “Presentation of Financial and Other Information.”
The following discussion contains forward-looking statements that involve risks and uncertainties. Our actual results and the timing of events may differ materially from those expressed or implied in such forward-looking statements as a result of various factors, including those set forth in “Cautionary Statement Regarding Forward-Looking Statements” and “Item 3. Key Information—D. Risk Factors.”
A. Operating Results
Overview
Vinci Partners is a leading alternative investment platform in Brazil, established in 2009. Our 275 full-time employees as of December 31, 2023 draw from a wide-ranging network of personal and professional relationships with industry-leading executives, business owners, corporate managers, financial and operational advisors, consultants and attorneys to source, fund, and manage investments. Vinci Partners’ business segments include Private Markets strategies (including private equity, real estate, private credit, infrastructure, special situations funds), Liquid Strategies (including public equities and hedge funds), Investment Products and Solutions, or IP&S, Retirement Services, each managed by dedicated investment teams with an independent investment committee and decision-making process. We also have a Financial Advisory Services business, focusing mostly on pre-IPO and M&A advisory services for Brazilian middle-market companies (those with annual gross revenue between R$100 million and R$600 million).
We have established a premier independent investment franchise with market leadership across each of our high value-added segments that we believe provide us with strong competitive advantages. We believe that our business model, focused on high-performance and executed by talented multi-disciplinary teams with a focus on value creation, has enabled us to build one of the most complete portfolios of alternative investment strategies and solutions, which combined with the adoption of innovative technologies and increasing integration across our business strategies, strongly positions us to capitalize on the future expansion and shifts in asset allocation in the Brazilian investments market.
111
Table of Contents
Segment Reporting
Our strategic decisions comprise five distinct business segments: (i) Private Markets (including private equity, real estate, infrastructure, private credit and special situations), (ii) Liquid Strategies (including public equities and hedge funds), (iii) IP&S, (iv) Financial Advisory Services, and (v) Retirement Services, following the launch of our retirement services strategy in the year ended December 31, 2022.
Our five segments consolidate our ten distinct business strategies: (i) hedge funds; (ii) public equities; (iii) private equity; (iv) financial advisory services; (v) investment products and solutions; (vi) real estate; (vii) infrastructure; (viii) private credit; (ix) special situations; and (x) retirement services.
For more information, see note 22 to our audited consolidated financial statements.
Key Business Metrics
The following table sets forth our AUM and fee-earning AUM, or FEAUM, as of the dates indicated. These supplemental business metrics are presented to assist investors to better understand our business and how it operates.
| AUM | FEAUM (1) | |||||||||||||||||||||||||||||||
| Private Markets |
Liquid Strategies |
IP&S | Total | Private Markets |
Liquid Strategies |
IP&S | Total | |||||||||||||||||||||||||
| (in R$ billions) | ||||||||||||||||||||||||||||||||
| As of December 31, 2022 |
28.7 | 10.2 | 24.2 | 63.1 | 25.3 | 10.1 | 24.1 | 59.4 | ||||||||||||||||||||||||
| Capital subscription (capital return) |
2.6 | — | 0.1 | 2.7 | 2.6 | — | 0.1 | 2.6 | ||||||||||||||||||||||||
| Net inflow (outflow) |
0.1 | (0.2 | ) | (2.8 | ) | (2.9 | ) | 0.1 | (0.3 | ) | (2.8 | ) | (2.9 | ) | ||||||||||||||||||
| Appreciation (depreciation) |
1.6 | 2.3 | 1.7 | 5.6 | 1.7 | 2.3 | 1.7 | 5.8 | ||||||||||||||||||||||||
| As of December 31, 2023 |
33.0 | 12.3 | 23.1 | 68.5 | 29.7 | 12.1 | 23.1 | 64.9 | ||||||||||||||||||||||||
| (1) | FEAUM is measured as AUM excluding vehicles that are not expected to charge management or performance fees. |
Our AUM increased from R$63.1 billion as of December 31, 2022 to R$68.5 billion as of December 31, 2023, an 8.6% increase compared to the previous year.
Overall AUM growth in 2023 was driven by R$4.2 billion of new capital subscriptions in Private Market funds alongside R$5.6 billion of overall AUM appreciation. This growth in AUM was partially offset by a net outflow of R$2.8 billion in our IP&S segment.
Growth in our AUM is affected by several internal and external factors, including our fundraising efforts, returns on our own funds, macroeconomic factors, and the investing environment.
The following tables set forth our additional key business metrics as of and for the periods indicated. These supplemental business metrics are presented to assist investors to better understand our business and how it operates.
| For the Year Ended December 31, |
||||||||
| 2023 | 2022 | |||||||
| (in R$ thousands, except as otherwise noted) |
||||||||
| Gross revenue from services rendered |
486,987 | 435,947 | ||||||
| Net revenue from services rendered |
454,420 | 408,095 | ||||||
| FRE(1) |
208,433 | 191,570 | ||||||
| FRE Margin (%)(1) |
48.1 | % | 48.7 | % | ||||
| PRE(1) |
10,614 | 8,046 | ||||||
| PRE Margin(%)(1) |
49.9 | % | 55.1 | % | ||||
| Distributable Earnings(1) |
244,205 | 242,323 | ||||||
| Distributable Earnings Margin(%)(1) |
43.7 | % | 46.7 | % | ||||
112
Table of Contents
| For the Year Ended December 31, |
||||||||
| 2023 | 2022 | |||||||
| (in R$ thousands, except as otherwise noted) |
||||||||
| Profit for the year |
219,459 | 219,401 | ||||||
| Net profit margin for the year (%) |
48.3 | % | 53.8 | % | ||||
| Adjusted Distributable Earnings(1) |
245,836 | 247,747 | ||||||
| Adjusted Distributable Earnings Margin(%)(1) |
44.0 | % | 47.8 | % | ||||
| Adjusted Profit for the year(1) |
231,566 | 215,604 | ||||||
| Adjusted Profit Margin for the year(1) |
51.0 | % | 52.8 | % | ||||
| (1) | FRE, FRE Margin, PRE, PRE Margin, Distributable Earnings, Distributable Earnings Margin, Adjusted Distributable Earnings, Adjusted Distributable Earnings Margin, Adjusted Profit for the year and Adjusted Profit Margin for the year are non-GAAP financial measures that we present for the convenience of investors. See “—Non-GAAP Financial Measures and Reconciliations” for a reconciliation of these measures to their nearest IFRS Accounting Standards measure and “Presentation of Financial and Other Information—Special Note Regarding Non-GAAP Financial Measures” for further information on why our management chooses to use these non-GAAP financial measures, and on the limits of using these non-GAAP financial measures. |
Our net revenue from services rendered is composed of (1) net revenue from fund management; (2) net revenue from realized performance fees; (3) net revenue from unrealized performance fees; and (4) net revenue from advisory services. Net revenue from fund management remains the main component of our net revenues, amounting to 86.6% of total net revenue from services rendered for the year ended December 31, 2023.
Net revenue from services rendered for the year ended December 31, 2023 amounted to R$454.4 million, an increase of R$46.3 million, or 11.4%, from the year ended December 31, 2022. This was driven primarily by an increase of R$21.9 million in net revenue from fund management as a result of strong fundraising in Private Markets Funds, and of R$17.8 million in net revenue from advisory services, which resulted from stronger deal activity and advisory fees in 2023 as compared to 2022.
Our Adjusted Distributable Earnings for the year ended December 31, 2023 was R$245.8 million, a decrease of R$1.9 million, or 0.8%, compared to our Adjusted Distributable Earnings of R$247.7 million for the year ended December 31, 2022. Our Adjusted Distributable Earnings Margin for the year ended December 31, 2023 was 44.0%, a decrease of 3.8 percentage points compared to our Adjusted Distributable Earnings Margin of 47.8% for the year ended December 31, 2022.
Adjusted Profit for the year ended December 31, 2023 was R$231.6 million, an increase of R$16.0 million, or 7.4%, compared to our Adjusted Profit of R$215.6 million for the year ended December 31, 2022.
Non-GAAP Financial Measures and Reconciliations
This annual report presents our FRE, FRE Margin, PRE, PRE Margin, Distributable Earnings, Distributable Earnings Margin, Adjusted Distributable Earnings, Adjusted Distributable Earnings Margin, Adjusted Profit for the year and Adjusted Profit Margin for the year (each as explained in the footnotes to the table below), which are non-GAAP financial measures, and their reconciliations to the nearest measure as defined by IFRS Accounting Standards, for the convenience of investors. A non-GAAP financial measure is generally defined as a numerical measure of historical or future financial performance, financial position, or cash flow that purports to measure financial performance but excludes or includes amounts that would not be so adjusted in the most comparable GAAP measure. For further information on why our management chooses to use these non-GAAP financial measures, and on the limits of using these non-GAAP financial measures, please see “Presentation of Financial and Other Information—Special Note Regarding Non-GAAP Financial Measures.”
113
Table of Contents
| For the Years Ended December 31, | ||||||||||||||||
| 2023 | 2023 | 2022 | 2021 | |||||||||||||
| (US$)(1) | (R$) | |||||||||||||||
| (in thousands) | ||||||||||||||||
| Operating profit |
41,757 | 202,156 | 178,746 | 242,460 | ||||||||||||
| (-) Net revenue from realized performance fees |
(4,605 | ) | (22,296 | ) | (18,218 | ) | (45,348 | ) | ||||||||
| (-) Net revenue from unrealized performance fees |
215 | 1,042 | 3,618 | 7,715 | ||||||||||||
| (+) Share-based payments |
3,092 | 14,967 | 14,276 | 3,670 | ||||||||||||
| (+) Compensation allocated in relation to performance fees |
2,198 | 10,640 | 6,554 | 14,001 | ||||||||||||
| (+) Non-operational expenses |
397 | 1,924 | 6,594 | — | ||||||||||||
| FRE(2) |
43,053 | 208,433 | 191,570 | 222,498 | ||||||||||||
| FRE Margin(2) |
48.1 | % | 48.1 | % | 48.7 | % | 52.0 | % | ||||||||
| Operating profit |
41,757 | 202,156 | 178,746 | 242,460 | ||||||||||||
| (-) Net revenue from fund management |
(81,252 | ) | (393,367 | ) | (371,501 | ) | (361,070 | ) | ||||||||
| (-) Net revenue from advisory services |
(8,221 | ) | (39,799 | ) | (21,994 | ) | (66,755 | ) | ||||||||
| (+) Personnel and profit-sharing |
37,277 | 180,467 | 157,813 | 157,697 | ||||||||||||
| (+) Other general and administrative expenses |
14,830 | 71,797 | 71,536 | 65,301 | ||||||||||||
| (-) Compensation allocated in relation to performance fees |
(2,198 | ) | (10,640 | ) | (6,554 | ) | (14,001 | ) | ||||||||
| PRE(3) |
2,192 | 10,614 | 8,046 | 23,632 | ||||||||||||
| PRE Margin(3) |
49.9 | % | 49.9 | % | 55.1 | % | 62.8 | % | ||||||||
| Profit for the year |
45,331 | 219,459 | 219,401 | 208,615 | ||||||||||||
| (-) Net revenue from unrealized performance fees |
215 | 1,042 | 3,618 | 7,715 | ||||||||||||
| (+) Income tax from unrealized performance fees |
(25 | ) | (120 | ) | (417 | ) | (890 | ) | ||||||||
| (+) Compensation allocated in relation to unrealized performance fees |
(76 | ) | (369 | ) | (1,278 | ) | (2,733 | ) | ||||||||
| (-) Unrealized gain from investment income |
(1,406 | ) | (6,808 | ) | 12,955 | 14,598 | ||||||||||
| (+) Income taxes on unrealized gain from investment income |
36 | 175 | (369 | ) | (2,658 | ) | ||||||||||
| (+) Share-based payments |
2,809 | 13,601 | 12,648 | 3,670 | ||||||||||||
| (-) Income taxes on share-based payments |
(116 | ) | (561 | ) | — | — | ||||||||||
| (-) Depreciation and amortization |
1,510 | 7,310 | 4,986 | 3,917 | ||||||||||||
| (-) Contingent consideration (earn-out) gain (loss) (after tax) |
2,164 | 10,476 | (9,221 | ) | — | |||||||||||
| Distributable Earnings(4) |
50,442 | 244,205 | 242,323 | 232,234 | ||||||||||||
| Distributable Earnings Margin(4) |
43.7 | % | 43.7 | % | 46.7 | % | 45.0 | % | ||||||||
| Distributable Earnings(4) |
50,442 | 244,205 | 242,323 | 232,234 | ||||||||||||
| (+) Non-operational expenses (including income tax related to realized expense) |
337 | 1,631 | 5,425 | — | ||||||||||||
| Adjusted Distributable Earnings(5) |
50,779 | 245,836 | 247,748 | 232,234 | ||||||||||||
| Adjusted Distributable Earnings Margin(5) |
44.0 | % | 44.0 | % | 47.8 | % | 45.0 | % | ||||||||
| Profit for the year |
45,331 | 219,459 | 219,401 | 208,615 | ||||||||||||
| (+) Non-operational expenses (including income tax related to realized expense) |
337 | 1,631 | 5,425 | — | ||||||||||||
| (-) Contingent consideration (earn-out) gain (loss) (after tax) |
2,164 | 10,476 | (9,221 | ) | — | |||||||||||
| Adjusted Profit for the year(6) |
47,831 | 231,566 | 215,605 | 208,615 | ||||||||||||
| Adjusted Profit Margin for the year(6) |
51.0 | % | 51.0 | % | 52.8 | % | 44.8 | % | ||||||||
| (1) | For convenience purposes only, amounts in reais as of December 31, 2023 have been translated to U.S. dollars using an exchange rate of R$4.8413 to US$1.00, the commercial selling rate for U.S. dollars as of December 31, 2023, as reported by the Brazilian Central Bank. These translations should not be considered representations that any such amounts have been, could have been or could be converted at that or any other exchange rate. See “—Exchange Rates” for further information about recent fluctuations in exchange rates. |
114
Table of Contents
| (2) | Fee Related Earnings, or FRE, is a metric to monitor the baseline performance of, and trends in, our business, in a manner that does not include performance fees or investment income. We calculate FRE as operating profit, less (a) net revenue from realized performance fees, less (b) net revenue from unrealized performance fees, plus (c) share-based payments plus (d) compensation allocated in relation to performance fees plus (e) non-operational expenses, which are comprised of expenses relating to professional services rendered in connection with acquisitions and our international corporate organization. FRE Margin is calculated as FRE divided by the sum of net revenue from fund management and net revenue from advisory services. |
| (3) | Performance Related Earnings, or PRE, is a performance measure that we use to assess our ability to generate profits from revenue that relies on outcomes from funds above their respective benchmarks. We calculate PRE as operating profit, less (a) net revenue from fund management, less (b) net revenue from advisory services, plus (c) personnel and profit-sharing expenses, plus (d) other general and administrative expenses, less (e) compensation allocated in relation to performance fees. PRE Margin is calculated as PRE divided by net revenue from performance fees. |
| (4) | Distributable Earnings is used as a reference point by our board of directors for determining the amount of earnings available to distribute to shareholders as dividends. Distributable Earnings is calculated as profit for the year, less (a) net revenue from unrealized performance fees, plus (b) income taxes from unrealized performance fees, plus (c) compensation allocated in relation to unrealized performance fees, less (d) unrealized gain from investment income, plus (e) income taxes on unrealized gain from investment income, plus (f) share-based payments, plus (g) income taxes on share-based payments, plus (h) depreciation and amortization, except for depreciation and amortization relating to each segment’s investments, less (i) contingent consideration (earn-out) gain (loss) (after tax). Distributable Earnings Margin is calculated as Distributable Earnings divided by the sum of net revenue from fund management, net revenue from performance fees, net revenue from advisory services and realized gain from investment income. |
| (5) | Adjusted Distributable Earnings is calculated as Distributable Earnings, less non-operational expenses, which are comprised of expenses relating to professional services rendered in connection with acquisitions and our international corporate organization (including income tax related to realized expense). Adjusted Distributable Earnings Margin is calculated as Adjusted Distributable Earnings divided by the sum of net revenue from fund management, net revenue from performance fees, and net revenue from advisory services and realized gain from investment income. |
| (6) | We calculate Adjusted Profit for the year as profit for the year less (a) non-operational expenses, which are comprised of expenses relating to professional services rendered in connection with acquisitions and our international corporate organization (including income tax related to realized expense), and (b) contingent consideration (earn-out) gain (loss) (after tax). Adjusted Profit Margin for the year is calculated as Adjusted Profit for the year divided by the sum of net revenue from fund management, net revenue from performance fees, and net revenue from advisory services. |
Significant Factors Affecting Our Results of Operations
We believe that our results of operations and financial performance are driven by the following factors:
Returns on Investments
As an asset management firm, we rely on the return of our investment funds and a successful investment track record to influence investors to invest in our products, which directly impacts our fund flows and new fund raises. Moreover, our portfolio must be attractive to investors and potential investors when they are considering their range of available alternative investment opportunities.
We believe that the following factors have driven and are expected to continue to drive our future performance and ability to realize a favorable return on investments:
| • | Our ability to obtain superior risk-adjusted returns in the long term to meet our clients’ objectives. We must provide differentiated investment strategies for our clients reflecting: (1) a long-term vision to preserve investor capital and provide optimal risk-adjusted returns; (2) an established investment decision-making framework in each of our strategies; (3) operational and cost optimization initiatives (mainly in in our private equity strategy) to help businesses execute their growth strategies; (4) efficient capital allocation; and (5) product enhancement through innovation and outside the box solutions. |
115
Table of Contents
| • | Maintenance of an experienced and qualified management team and success in recruiting and developing qualified staff to execute on our investment strategies with effective oversight from investment committees. |
| • | Optimization of our business platform with deep integration across functions, including front-office, sales, macroeconomic and proprietary research departments, support departments, products, partners, and specialists. |
| • | A robust framework and capability to deliver best practices in governance and culture across all of our strategies and portfolio companies and for all our stakeholders. |
| • | Access to a broad base of investors and limited partners, including, but not limited to, local and foreign institutional investors, government and sovereign wealth funds, high net worth individuals and retail investors, with a range of investment horizons, risk tolerances and return expectations. |
| • | Strong relationships with contacts across industries and the financial market that provide several channels to generate investment opportunities, including through M&A transactions, IPOs, new financing, and partnerships. |
With consolidated investment processes across all of our strategies, we expect to continue to deliver innovative solutions and favorable performance over time to our investors, strengthening our track record as the preferred alternative asset management partner for their capital.
Ability to Deploy Capital and Source Investment Opportunities
Our ability to raise capital for new funds and generate revenue through our products relies on our capacity to allocate capital and source attractive opportunities across our investment strategies, which is impacted by several factors including:
| • | The ability of our teams to bring together a wide-ranging network of personal and professional relationships across leading industry executives, business owners, corporate managers, financial and operational advisors and consultants and attorneys in order to facilitate these investment opportunities; |
| • | Our ability to source top-down and bottom-up approaches for both long-term and short-term investing strategies. For example, our private equity strategy follows a proactive, top-down/bottom-up approach, in which we combine identification of target industries and sectors with identification of companies that fit our hands-on, active investment strategy. This process results in a highly differentiated deal sourcing platform. In our public equities strategy, we focus on holding positions in companies for three to five years following deep analysis and review by our various investment committees, taking into consideration our internal controls; |
| • | For our customized mandates, our ability to create tailor-made investment management services through our investment products and solutions strategy in order to meet our clients’ expectations regarding returns, investment terms, volatility and risk; |
| • | Our ability to launch innovative investment products in Brazil, such as Listed Infrastructure Mutual Funds (Fundos de Investimento em Participações em Infraestrutura) and Brazilian REITs (Fundo de Investimento Imobiliário), which has reinforced our brand in the listed funds market; |
| • | Our ability to maintain our broad network of collaborators to identify opportunities in different sectors and regions in Brazil as part of our long-term investment products; |
| • | Our ability to maintain strong relationships with market makers and advisory firms that can help generate opportunities and improve our product pipeline; |
116
Table of Contents
| • | Our capacity to maintain a presence across various regions in Brazil where other investment firms do not usually devote meaningful attention, which we believe allows us to identify previously unnoticed investment opportunities with improved risk-return profiles, including, but not limited to middle-market opportunities (by which we mean opportunities with companies with annual gross revenue between R$100 million and R$600 million); |
| • | Our ability to maintain a strong reputation among investment management firms, as a preferred partner in structuring competitive processes, arranging credit financing, contributing as shareholders in publicly listed companies and acting as experienced financial advisors; |
| • | Our ability to cross-sell our products to our clients and use their connections to identify “off-market” opportunities (that is, investment opportunities that we identify internally and are not known by other investment firms); and |
| • | Our ability to maintain discipline within our investment mandates, with a robust approach to valuation, transaction and operation size, and holding period, as applicable to each of our investment strategies. |
Even though the above-listed factors may vary depending on strategy, our ability to deploy capital and seek investment opportunities has proven consistent. Our products have passed through international crises, national economic recessions, and political instability; even in the face of these challenges, we have been able to offer differentiated investment opportunities resulting in favorable returns for our investors. We expect to replicate this model, extending our successful track record into the future.
Brazilian Macroeconomic Environment
Our business is impacted by overall market activity and, in particular, market flows, trading prices and trading volume. While our business is impacted by the overall activity of the market and certain market volatility, this impact is mitigated by (1) the fact that our long-term funds (which comprise 54% of our AUM as of December 31, 2023) are close-ended funds with lock-up periods of up to 15 years or even perpetual in the case of our listed real estate products and quasi-perpetual in the case of our infrastructure products, (2) most of our customers are qualified investors (as defined under CVM rules), institutional clients or investors outside of Brazil that allocate a portion of their capital in emerging markets.
Most of the assets we manage are allocated in Brazil. As a result, our revenues and profitability are subject to political and economic developments and the effect that these factors have on the assets to which we are exposed. Factors such as the availability of credit, disposable income, employment rates and GDP growth in Brazil can directly and indirectly impact the performance of our funds and our results of operations. Our results of operations are also affected by levels of interest rates, the expansion or contraction of the capital markets, trading volumes and market inflows in Brazil, each of which impacts the number and overall volume of capital markets transactions and available overall liquidity. For more information, see “Item 3. Key Information—D. Risk Factors—Certain Risks Relating to Brazil—Economic uncertainty and political instability in Brazil may harm us and the price of our Class A common shares.”
Brazil is the largest economy in Latin America, as measured by GDP. The following table shows data for real GDP, inflation and interest rates in Brazil and the U.S. dollar/real exchange rate at the dates and for the periods indicated.
117
Table of Contents
| For the Year Ended December 31, |
||||||||||||
| 2023 | 2022 | 2021 | ||||||||||
| (in percentages, except as otherwise indicated) |
||||||||||||
| Real growth (contraction) in GDP(1) |
2.9 | 3.0 | 4.8 | |||||||||
| Inflation (IGP-M)(2) |
(3.2 | ) | 5.5 | 17.8 | ||||||||
| Inflation (IPCA)(3) |
4.6 | 5.8 | 10.1 | |||||||||
| Long-term interest rates—TJLP/TLP (average)(4) |
5.7 | 5.5 | 3.5 | |||||||||
| CDI Rate (average)(5) |
13.2 | 12.4 | 4.4 | |||||||||
| Period-end exchange rate / R$ per US$1.00 |
4.86 | 5.22 | 5.58 | |||||||||
| Average exchange rate / R$ per US$1.00(6) |
4.99 | 5.16 | 5.40 | |||||||||
| Appreciation (depreciation) of the real vs. US$ in the period(7) |
6.8 | 6.5 | (7.4 | ) | ||||||||
Sources: FGV, IBGE, IPEA, Brazilian Central Bank, BNDES and Bloomberg.
| (1) | Average of the last four quarters compared to the previous four quarters. Most recent GDP data available as of December 31, 2023. |
| (2) | Inflation (IGP-M) is the general market price index measured by the FGV. |
| (3) | Inflation (IPCA) is a broad consumer price index measured by the IBGE. |
| (4) | TJLP/TLP is the Brazilian long-term interest rate (average of monthly rates for the period). |
| (5) | The CDI Rate is an average of interbank overnight rates in Brazil (daily average for the period). |
| (6) | Average of the exchange rate on each business day of the year. |
| (7) | Comparing the U.S. dollar closing selling exchange rate as reported by the Central Bank at the end of the period’s last day with the day immediately prior to the first day of the period discussed. |
The Brazilian basic interest rate, known as the SELIC Rate, fell from a nominal 14.25% per year to as low as 2.0% until March 2021. As a result of general global economic recovery, and disruptions in global supply chains and the rise of commodity prices there was a global increase in inflation, and in Brazil in particular. This led the Brazilian Central Bank to repeatedly raise the SELIC Rate to 13.75% as of December 31, 2022, in an attempt to curb inflation, which, as measured by the IPCA, came in at 4.62% for the year ended December 31, 2023. The market estimates the SELIC Rate at 9% as of December 31, 2024, according to the Brazilian Central Bank’s February 23, 2024 Focus report. With current real interest rates floating at approximately 6.8% (one-year nominal rate discounting expected future inflation), flows into alternative assets are poised to gain strength when monetary policy moves back to neutral in the future. The following chart shows the historical and expected evolution of the SELIC Rate for the periods indicated.
118
Table of Contents
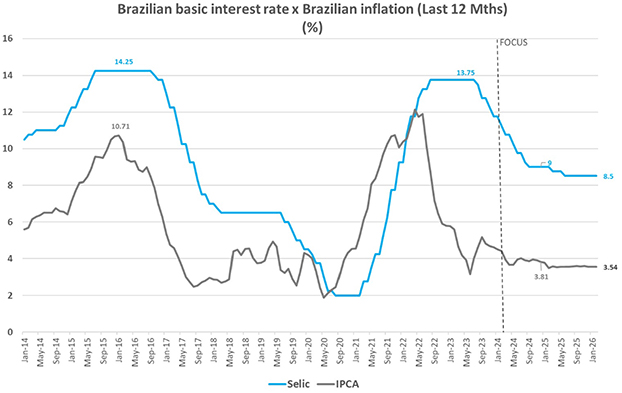
Source: IBGE, Brazilian Central Bank’s Focus report as of February 23, 2024.
Inflation has a direct effect on our contracts with certain suppliers, such as telecommunications operators, whose costs are indexed to the IPCA, and data processors, whose labor costs are adjusted according to inflation. While inflation may cause our suppliers to increase their prices, we are generally able to offset this effect as higher inflation typically results in higher interest rates, increasing our spreads on certain transactions.
Our financial performance is also tied to fluctuations in interest rates, such as the CDI Rate, because such fluctuations affect the value of the net interest margins we earn on financial investments we allocate customer funds to on an overnight basis, compounding our AUM base as well as the potential mix of products clients are willing to invest in.
Growth of Our AUM
Our AUM equals the sum of: (1) the fair market value of all funds and management accounts managed by Vinci Partners, across Private Equity, Real Estate, Infrastructure, Vinci SPS, Credit, IP&S, Public Equities, Hedge Funds and Retirement Services; (2) the capital that we are entitled to call from investors in funds pursuant to the terms of their capital commitments to those funds; and (3) the fair market value of co-investments arranged by us that were made or could be made by limited partners of our corporate private equity funds and portfolio companies of such funds.
We generate most of our revenues from management fees and performance fees on funds managed across our investment strategies. Historical fund-raising activities have been impacted by both internal and external factors.
We are seeing the stabilization of interest rates at a healthy level in the medium term, which reassures our ability to raise capital and continue to grow our AUM. Despite the recent environment of higher nominal interest rates, our platform has not experienced material redemptions due to a stickier investor base with long-term proprietary relationships across all our segments. Close relationship with our clients is an important asset in tougher macroeconomic scenarios.
119
Table of Contents
Moreover, although facing a challenging environment in Brazil over the past two years, we were able to grow AUM, from R$57 billion as of December 31, 2021 to R$69 billion as of December 31, 2023, which increase was mostly backed by growth in our Private Markets segment. In particular, we have been experiencing more traction from local investors with respect to Private Markets’ products, as seen by successful capital raises in Private Equity, Infrastructure and Credit. We believe Private Markets’ products will continue to push AUM growth going forward, with new vintages coming to market in several strategies, such as Special Situations and Impact and Return, and new commitments from strategies that are undergoing fundraising, such as VCP, VICC and Vinci Credit Infra.
In parallel, we believe that we will experience a better market environment in Brazil going forward, with nominal rates in single digits number by the end of 2024 and real interest rates converging to a more sustainable level. This scenario should benefit directly our public listed REITs, in our Real Estate and Credit strategies. In late 2023, we raised more than R$1.2 billion for VISC11 alone. With favorable market conditions, we could see more contributions across different strategies in our REITs. Lastly, we believe that a better market environment will also be constructive for IP&S and Public Equities in both inflows and portfolio appreciation. However, these segments usually take more time to respond to lower interest rates.
Moreover, we believe that our new segment, Vinci Retirement Services, will increase Vinci Partners’ exposure to the growing open-ended pension plan industry—an industry with more than R$1.4 trillion in AUM and double-digit growth over the last years, according to FenaPrevi. We began fundraising efforts early in 2023 and as the business evolves in the coming years, we expect increasing capital flows within this segment given the growing demand for solutions that combine long-term returns with asset allocation and cost efficiency.
Our internal efforts to increase AUM include (1) raising new capital and (2) through capital gains. Our ability to raise new capital depends on historical and expected performance of our investment products, our ability to distribute returns to investors, and the ability of our client relations and capital raising teams to support fund management teams in maintaining strong relationships with current limited partners and building relationships with new limited partners.
We expect AUM growth trends to remain favorable in the short and medium terms, with the enhancement of our products, historical returns from our funds, the strengthening of our relationships with our current and new investors, and opportunistic environment for inorganic growth—including through our recently announced business combination with Compass. The Compass Transaction is expected to close in the third quarter of 2024, subject to regulatory approvals and other customary closing conditions. For more information, see “Recent Events—Business Combination with Compass.”
Ability to Negotiate Management Fee Rates and Fund Terms
The level of management fees and performance fees carried by our funds directly impacts our revenues. The main factors that impact our effective management fees and performance fees are:
| • | Negotiations with investors. As our brand and investment strategies continue to mature, and performance of our products continues to reward clients with strong risk-adjusted returns, we expect that our ability to negotiate fees and fund terms with local and offshore investors will improve. |
| • | The level of fees we are able to charge in comparison to industry peers. Our local funds in Brazil generally present the same management and performance fees, terms, and conditions of similar industry peers, as applicable to each strategy. |
| • | The level of performance fees we are able to negotiate. To generate performance fees, returns must surpass each fund’s specified benchmark, which varies according to the respective strategy. We believe these hurdles are beneficial for both our limited partners and for Vinci Partners, as it supports strong alignment of interests. |
| • | Potential discounts on fees. In certain instances, we use third-party channels to distribute our products, such as placement agents, digital platforms, multifamily offices, and fund allocators, among others. We always negotiate discounts on fees on a case-by-case basis and expect that strengthening our brand will improve our bargaining power with these intermediaries. As we expand the number of our distribution channels and competition increases among distributors, we expect to be able to negotiate further decreases in third-party fees. |
120
Table of Contents
Management fees and performance fees do not apply to our Financial Advisory Services business, where our business model is mainly based on the payment of success fees upon conclusion of M&A or IPO transactions for our clients.
Ability to Attract, Retain and Develop Talent
We believe that talented and experienced people have been and will continue to be critical for our success. Our ability to attract, retain, and develop qualified and committed employees has been supported by several factors including:
| • | A well-designed selection process with five phases of interviews and tests on average, in which the candidate is exposed to its potential future managers, senior employees and partners. We believe that a structured recruitment program is important to select the most talented candidates, best aligned with our corporate culture. |
| • | A highly competitive selection process. In 2023, we received over 5,200 resumes from candidates applying for a position with Vinci Partners. Of those candidates, our HR team selected and interviewed over 260 candidates for 44 positions, which represents an average of six candidates interviewed per slot and 118 applications per slot. |
| • | A meritocratic environmental which motivates our junior associates and senior employees to develop their careers within our organization. As consequence, a significant number of our investment professionals currently serving in important decision-making roles have been internally sourced and trained. |
| • | A fair, meritocratic, and established process for selecting new members of our partnership. |
| • | Competitive annual bonuses (equivalent to 61% of total compensation for non-partner employees, on average, for the year ended December 31, 2023) that reflect on our employees’ contribution to our results in the relevant year. We provide comprehensive feedback annually as part of the determination of each employee’s variable compensation. |
| • | Our target annual total compensation is above market average among Brazilian financial institutions and asset management firms for key employees and top performers. For entry-level employees, we believe that our value proposition is very attractive (based on the number of applications we receive for our limited number of positions available). As such, we are not competing for new employees based on salary, which keeps our overall compensation for entry-level positions at market rates. |
| • | We carry out annual modular training through our senior specialist employees in an effort to develop our back-office collaborators and motivate them to assume front-office roles. We have named this project “Vinci University.” |
We have implemented certain long-term incentive plans for eligible employees, and expect that this will further enhance our ability to retain talent and promote our meritocratic culture. In May 2021 and February 2023, we approved Stock Option Plans for eligible employees, and, in 2022, our board also approved the Restricted Shares Plan for eligible employees, which enhance our ability to retain talent and promote our meritocratic culture. See “Item 6. Directors, Senior Management and Employees—B. Compensation.”
Going forward, we believe that as our brand continues to strengthen and as we continue to deliver on our track record of strong risk-adjusted returns, we will continue to attract and retain qualified talent across all of our strategies. We also expect to create new incentive policies and develop opportunities to preserve our culture and retain talent within our organization.
Growth through Commercial Initiatives
We have been investing in all of our commercial divisions with internal teams specifically focused in: (1) institutional investors in Brazil; (2) institutional investors outside Brazil; (3) high net worth individuals; and (4) distribution through open-end platforms of large banks, digital platforms, independent financial advisors, or IFAs, and multifamily offices. We believe that having a sector-specific team for each type of investor improves our relationships and produces more tailored solutions.
121
Table of Contents
Our commercial officers are defined as “relationship owners.” They are close to clients, know and understand their needs, and provide them with access to our entire product portfolio, bringing clients the best our platform has to offer.
In recent years, we have increased our footprint on digital platforms. We are currently present on 27 digital platforms that distribute our products to retail investors. We view digital channels as a significant opportunity for growth, as retail investors utilize mainly digital platforms to access alternative products, such as public equities, real estate, infrastructure, private credit, hedge funds, and open-end pension products.
We have been strengthening our relationship with IFAs, including through (1) the commitment of our portfolio managers, whose products are available on platforms, to participate in visits to IFA offices; (2) ramping up our scheduled visits to the offices of some of the main IFAs; (3) investing in events aimed at this audience by, for example, holding Vinci Days in São Paulo and Rio de Janeiro; and (4) strengthening our presence at IFA events.
Implementation of Our Marketing Strategy
Our marketing strategy reinforces recognition of and confidence associated with our brand. We will continue to build and maintain brand awareness, while generating demand for our products and services through a variety of marketing campaigns.
We have improved our marketing efforts to increase fundraising throughout our commercial areas. Our main initiatives include: (1) monthly podcasts; (2) mail marketing; (3) online interviews between our portfolio managers and social media investment influencers; and (4) recurring posts about our products and investments on our social media pages.
We believe that strengthening our brand awareness by educating clients about our history and creating awareness of our strong returns can increase the success of our fundraising efforts and consequently our AUM.
Given the nature of our business model, our investments in marketing and advertising campaigns do not result in returns in the same period in which they are made but rather over subsequent periods.
In 2021, we launched a new branding project targeting domestic investors to raise brand awareness. This project resulted in our first marketing campaign, built upon the pillar “reputation is the best investment.” The campaign was launched in all major media outlets and boosted our brand’s recognition. Our ultimate goal is to place ourselves as a leading alternative asset management brand in Brazil, increasing retail investors’ appetite for our products. Our distributions teams will work closely with investors to make the most of the campaign.
Our Ability to Compete Effectively
While we have a differentiated business model and a broad range of alternative investment products and services in Brazil, we compete with other investment managers in each specific strategy to attract new clients, increase returns on clients’ investments, win mandates in corporate advisory transactions and introduce innovative financial products. Our ability to compete is influenced by key factors such as:
| • | the historical performance of our products and asset classes; |
| • | our ability to improve our platform and launch new products and services; |
| • | the ability to deliver competitive returns to investors; |
| • | the transaction costs we incur in providing our services; |
| • | our ability to hire and retain talent; and |
| • | our ability to maintain the security of our platform and solutions. |
122
Table of Contents
See “Item 4. Information on the Company—B. Business Overview—Competition” for more detail on our competitors.
Foreign Exchange Rates
We manage funds that charge management and performance fees in U.S. dollars. Some of these funds are also invested in U.S. dollar assets through our investment products and solutions strategy; however, most of the capital raised by these funds is invested in Brazil through our private equity funds.
In these funds, although return hurdles and fees are in U.S. dollars, the capital is invested in companies that generate most of their cash flow in Brazilian reais, which presents a structural currency mismatch. This mismatch could affect our ability to generate carry in our U.S. dollar-based funds, given that extremely volatile exchange rate fluctuations can impair fund returns in U.S. dollars. Our private equity team has designed strategies to mitigate our exposure to the exchange rate risk associated with this structure.
As of December 31, 2023, approximately R$14.3 billion of our AUM, or 20.9%, was related to funds that are raised in U.S. dollars but invested in Brazilian reais.
Taxes and Potential Changes in Tax Laws and Interpretations
We conduct our business, including transactions within the group, in accordance with our interpretation and understanding of applicable tax laws and treaties or other regulations, and the requirements of the tax authorities in applicable jurisdictions. There can be no assurance that our interpretation of applicable laws, regulations, case laws or practices have been, or will continue to be correct, or that such laws, regulations, case laws or practices will not be amended, possibly with retroactive effect. Potential amendments of applicable tax laws and treaties or other regulations, and the requirements of relevant tax authorities may impact our profits and cash flows.
Description of Management Fees
Generally, we charge management fees as a flat percentage of the AUM of the respective fund. However, for the listed real estate funds that we manage, the percentage charged as a management fee may be reduced due to increases in the amount of AUM of the respective fund.
For certain of our funds in our Private Markets strategies, including our flagship Vinci Capital Partners or VCP funds, and during the investment periods of such funds, management fees are charged against committed capital for both U.S. dollar-denominated and real-denominated funds. Once the investment period ends, the U.S. dollar-denominated funds charge management fees against invested capital, while the real-denominated funds charge management fees against net asset value. This distinction between U.S. dollar-denominated funds and real-denominated funds applies only to management fees. Performance fees are calculated on the basis as described.
Description of Performance Fees
Brazilian and U.S. regulations applicable to us and the performance fees that we can charge, set forth certain requirements for the performance fee structures of funds managed by us, as described below.
| • | Performance fees must be tied to a verifiable index as a benchmark, published by an independent source, and compatible with the investment policy of the relevant fund. |
| • | Performance fees are generally not payable in respect of a percentage of the index inferior to 100.0%. |
| • | Other than for private asset funds, performance fees cannot be charged for a period of less than six months, such that performance is measured every six months in accordance with the by-laws of the respective fund, and performance fees are charged based on the accrued performance in such six-month period, after which the measurement window is reset. |
| • | The performance fees shall be calculated based on net asset value and may consider any distribution for shareholders in the calculation. |
123
Table of Contents
| • | At the date of calculation of the performance fee, we compare the net asset value per quota against either (1) the net asset value per quota as of the date that the performance fee was last charged or (2) the net asset value as of the fund inception date, and in either case the net asset value per quota may be required to be updated by the corresponding benchmark. |
| • | In accordance with applicable Brazilian laws and regulations, the general rule is that if the net asset value per quota at the time of the performance fee calculation is lower than the net asset value at the time when the last performance fee was charged or at the subscription date, no performance fee can be charged. However, for foreign, qualified and professional investors (as classified under CVM rules), performance fees may still be charged if the fund outcome for the relevant period was higher than the corresponding benchmark. |
As a multi-asset-class asset management firm, we manage a number of funds with different performance fee structures that can be classified in three main categories: (1) liquid funds, (2) closed-ended funds focused on value generation, and (3) closed-ended funds focused on income generation.
For liquid funds such as equity funds, credit funds and hedge funds, we charge performance fees every six months based on the performance of the fund above the relevant benchmark. For hedge funds and credit funds, performance fees are generally benchmarked to the CDI Rate, and for inflation-indexed funds, performance fees are generally indexed to the Índice Nacional de Preços ao Consumidor Amplo, or IPCA, plus a fixed real interest rate or a market index such as Índice de Mercado Anbima Subíndice B, or IMA-B. For equity funds, the benchmark varies according to the strategy. For our “long only” and “long-biased” strategies, our performance fees are tied to the IBOVESPA index, for the dividend strategies, performance fees are tied to the IDIV index, and for our small cap funds we use the SMLL index (Índice Small Cap) published by the B3.
For the closed-ended funds focused on value generation, both Brazilian funds (those denominated in real) and foreign funds (those denominated in U.S. dollars) pay performance fees to Vinci Partners. The waterfall and catch-up mechanisms are similar, except that: (1) U.S. dollar-denominated funds have a preferred return of 8% and pay performance against nominal capital contributions; and (2) real-denominated funds have a preferred return of IPCA plus between 6% and 8%, and pay performance against real capital contributions (capital contributions are adjusted by IPCA).
For the closed-ended funds focused on income such as real estate funds, we charge a performance fee every six months over the excess return between the amount distributed to investors and the benchmark of the relevant fund, which can vary according to the fund strategy.
Description of Principal Line Items
Net Revenue from Services Rendered
Net revenue from services rendered is composed of: (1) net revenue from fund management; (2) net revenue from realized performance fees; (3) net revenue from unrealized performance fees; and (4) net revenue from advisory services, in each case net of taxes and contributions comprised of COFINS, PIS and ISS. See note 17 to our audited consolidated financial statements for more details.
Personnel and Profit-Sharing
Personnel and profit-sharing expenses are composed of the total compensation (including salary and profit sharing) paid to our employees.
Other General and Administrative Expenses
Other general and administrative expenses are made up of third-party expenses, depreciation and amortization, travel and representations, marketing expenses, administrative fees, non-operating taxes, third-party consultants’ fees, such as legal and accounting, and office consumables. See note 18 to our audited consolidated financial statements.
124
Table of Contents
Investment Income
Investment income is income from proprietary investments made by us in our own investment products and income generated through investments made with our cash and cash equivalents. See note 19 to our audited consolidated financial statements.
Other Financial Income
Other financial income includes sublease agreements and foreign currency fluctuations. See note 19 to our audited consolidated financial statements.
Finance Costs
Finance costs include lease agreements, interest expenses on loans and financing, bank fees, investment losses, tax fines, interest on taxes and expense from foreign currency fluctuations. See note 19 to our audited consolidated financial statements.
Income Taxes
Income taxes are comprised of taxes on our corporate income tax and social contribution taxes. Some subsidiaries are taxed on an actual taxable profit regime, while others are taxed based on deemed profit. See note 20 to our audited consolidated financial statements.
Results of Operations of Vinci Partners
Consolidated Results of Operations for the Year Ended December 31, 2023, compared to the Year Ended December 31, 2022
| For the Year Ended December 31, |
Variation (%) |
|||||||||||
| 2023 | 2022 | |||||||||||
| (in R$ thousands, except for percentages) | ||||||||||||
| Gross revenue from services rendered |
486,987 | 435,947 | 11.7 | % | ||||||||
|
|
|
|
|
|
|
|||||||
| Net revenue from services rendered |
454,420 | 408,095 | 11.4 | % | ||||||||
| General and administrative expenses |
(252,264 | ) | (229,349 | ) | 10.0 | % | ||||||
|
|
|
|
|
|
|
|||||||
| Operating profit |
202,156 | 178,746 | 13.1 | % | ||||||||
| Investment income and financial revenue through amortized cost |
115,045 | 94,728 | 21.4 | % | ||||||||
| Other financial income |
6,764 | 17,405 | (61.1 | )% | ||||||||
| Finance costs |
(54,580 | ) | (19,065 | ) | 186.3 | % | ||||||
|
|
|
|
|
|
|
|||||||
| Profit before income taxes |
269,385 | 271,814 | (0.9 | )% | ||||||||
| Income taxes |
(49,926 | ) | (52,413 | ) | (4.7 | )% | ||||||
|
|
|
|
|
|
|
|||||||
| Profit for the year |
219,459 | 219,401 | 0.0 | % | ||||||||
|
|
|
|
|
|
|
|||||||
| Net profit margin for the year (%) |
48.3 | % | 53.8 | % | (10.2 | )% | ||||||
Net Revenue from Services Rendered
Net revenue from services rendered for the year ended December 31, 2023 totaled R$454.4 million, a 11.4% increase from R$408.1 million for the year ended December 31, 2022. This R$46.3 million increase was attributable to:
| • | a R$21.9 million, or 5.9%, increase in net revenue from fund management, due primarily to: |
| • | a R$43.9 million, or 21.2%, increase in net revenue from fund management related to (i) our Private Markets segment, which was driven by strong fundraising during 2023 in Private Equity, Infrastructure and Real Estate, combined with catch-up fees for VCP IV and VICC, and (ii) the contribution of a full year of results from our Vinci SPS business, which we acquired in August 2022; and |
125
Table of Contents
| • | a R$12.7 million, or 15.2%, decrease in net revenue from fund management related to our IP&S segment, which was driven by a shift in the AUM mix within the segment, which has experienced redemptions especially within our pension funds strategy, which carries higher fees; and |
| • | a R$9.5 million, or 11.7%, decrease in net revenue from fund management in our Liquid Strategies segment, which was driven by a combination of outflow and depreciation effects in funds with higher fees; |
| • | an increase of R$17.8 million, or 81.0%, in net revenue from advisory services, as a result of stronger deal activity resulting in higher advisory fees in 2023 as compared with 2022; |
| • | a R$6.7 million, or 45.6%, increase in net revenue from performance fees, which was primarily driven by greater revenues from the performance of liquid funds in Liquid Strategies in 2023 as compared to 2022. |
General and Administrative Expenses
The following table sets forth our general and administrative expenses for the years ended December 31, 2023 and 2022:
| For the Year Ended December 31, |
||||||||||||
| 2023 | 2022 | Variation (%) | ||||||||||
| (R$ thousands, except for percentages) | ||||||||||||
| Personnel and profit-sharing |
(165,500 | ) | (143,537 | ) | 15.3 | % | ||||||
| Third-party expense |
(33,318 | ) | (38,836 | ) | -14.2 | % | ||||||
| Right of use depreciation |
(9,686 | ) | (10,800 | ) | -10.3 | % | ||||||
| Depreciation and amortization |
(10,094 | ) | (4,986 | ) | 102.4 | % | ||||||
| Travel and representations |
(3,928 | ) | (4,535 | ) | -13.4 | % | ||||||
| Condominium and other operating expenses |
(14,771 | ) | (12,379 | ) | 19.3 | % | ||||||
|
|
|
|
|
|
|
|||||||
| Personnel and other general and administrative expenses |
(237,297 | ) | (215,073 | ) | 10.3 | % | ||||||
|
|
|
|
|
|
|
|||||||
| Share-based plans |
(14,967 | ) | (14,276 | ) | 4.8 | % | ||||||
|
|
|
|
|
|
|
|||||||
| General and administrative expenses |
(252,264 | ) | (229,349 | ) | 10.0 | % | ||||||
|
|
|
|
|
|
|
|||||||
General and administrative expenses totaled R$252.3 million for the year ended December 31, 2023, a R$23.0 million, or a 10.0% increase, from R$229.3 million for the year ended December 31, 2022.
Personnel and other general and administrative expenses, which are exclusive of share-based plans, totaled R$237.3 million for the year ended December 31, 2023, a R$22.2 million, or 10.3% increase, from R$215.1 million for the year ended December 31, 2022, which was primarily due to an increase of R$14.8 million in profit-sharing as a result of an increase in net revenue of advisory and performance and by R$12.3 million in additional expenses arising from personnel expenses and depreciation and amortization expenses, which in turn, was offset by R$ 5.5 million in third-party expenses, as below:
| • | personnel expenses that totaled R$70.9 million for the year ended December 31, 2023, a R$7.2 million, or 11.3%, increase as compared to the year ended December 31, 2022, which was primarily due to personnel expenses arising from the inflation in the period; |
| • | depreciation and amortization expenses amounting to R$10.1 million for the year ended December 31, 2023, a R$5.1 million, or 102.4%, increase as compared to the year ended December 31, 2022, which was primarily due to the amortization of management contracts as a result of SPS Capital acquisition, the amortization of investments in our Retirement services segment, and the amortization of placement agent costs related to fundraising from investors; and |
126
Table of Contents
| • | third-party expenses amounting to R$33.3 million for the year ended December 31, 2023, a R$5.5 million, or 14.2%, decrease as compared to the year ended December 31, 2022, which was primarily due to non-operational costs, such as marketing, consulting and legal counsel in connection with M&A expenses incurred in 2022. |
Share-based plans totaled R$15.0 million for the year ended December 31, 2023, a R$0.7 million, or 4.8%, increase, from R$14.3 million for the year ended December 31, 2022. See “Item 6. Directors, Senior Management and Employees—B. Compensation—Long-Term Incentive Plans” for information on our long-term incentive plans.
Operating Profit
As a result of the foregoing, operating profit totaled R$202.2 million for the year ended December 31, 2023, an increase of R$23.4 million, or 13.1%, from R$178.7 million for the year ended December 31, 2022.
Finance Profit (Loss), Net
Finance profit, net amounted to R$67.2 million for the year ended December 31, 2023, a decrease of R$25.9 million from a profit of R$93.1 million for the year ended December 31, 2022, driven primarily by:
| • | a net negative impact of R$15.9 million (compared to R$14.0 million in 2022) in the fair value of contingent consideration variations we undertook in connection with the acquisition of SPS Capital, subject to the achievement of certain fundraising and incremental management fee revenue targets. For more information, see note 14(iv) to our audited consolidated financial statements; and |
| • | an increase of 17.9 million, or 307.5%, in interest expense on loans and financing, which include interest payments due on our commercial notes, the consideration payable in connection with the SPS acquisition, and interest expenses due on our Series A convertible preferred shares. |
This decrease was partially offset by an increase of R$20.3 million, or 21.4%, in investment income and financial income revenue through amortized cost, driven mostly by the appreciation of our financial investments in mutual funds, fixed income investments and investments in U.S. treasury bills.
Income Taxes
Income taxes expenses totaled R$49.9 million for the year ended December 31, 2023, with an effective tax rate of 19%, a decrease of R$2.5 million, or 4.7%, compared to R$52.4 million for the year ended December 31, 2022, with an effective tax rate of 19%. This decrease was primarily attributable to a decrease in taxable income for the period.
Profit for the Year
As a result of the foregoing, profit totaled R$219.5 million for the year ended December 31, 2023, an increase of R$0.1 million from R$219.4 million in the same period of the last year.
Segment Results of Operations for the Year Ended December 31, 2023, compared to the Year Ended December 31, 2022
| For the Year Ended December 31, 2023 | ||||||||||||||||||||||||||||
| Private Markets |
Liquid Strategies |
IP&S | Financial Advisory |
Vinci Retirement Services |
Corporate Center |
Total | ||||||||||||||||||||||
| (R$ thousands) | ||||||||||||||||||||||||||||
| Gross revenue from services rendered |
274,221 | 89,265 | 82,583 | 40,744 | 174 | — | 486,987 | |||||||||||||||||||||
|
|
|
|
|
|
|
|
|
|
|
|
|
|
|
|||||||||||||||
| Fund Advisory fee |
2,700 | — | 36 | 40,744 | — | — | 43,480 | |||||||||||||||||||||
| Fund Management fee |
266,245 | 76,711 | 77,749 | — | 174 | — | 420,879 | |||||||||||||||||||||
| Fund Performance fee |
5,276 | 12,554 | 4,798 | — | — | — | 22,628 | |||||||||||||||||||||
| Taxes and contributions |
(15,808 | ) | (5,480 | ) | (7,822 | ) | (3,448 | ) | (9 | ) | — | (32,567 | ) | |||||||||||||||
| Net revenue from services rendered |
258,413 | 83,785 | 74,761 | 37,296 | 165 | — | 454,420 | |||||||||||||||||||||
|
|
|
|
|
|
|
|
|
|
|
|
|
|
|
|||||||||||||||
| Fund Advisory fee |
2,471 | — | 32 | 37,296 | — | — | 39,799 | |||||||||||||||||||||
| Fund Management fee |
250,960 | 71,780 | 70,462 | — | 165 | — | 393,367 | |||||||||||||||||||||
| Fund Performance fee |
4,982 | 12,005 | 4,267 | — | — | — | 21,254 | |||||||||||||||||||||
| (-) General and administrative expenses (1) |
(49,652 | ) | (24,474 | ) | (20,161 | ) | (9,700 | ) | (9,256 | ) | (139,022 | ) | (252,264 | ) | ||||||||||||||
|
|
|
|
|
|
|
|
|
|
|
|
|
|
|
|||||||||||||||
| Operating profit (loss) |
208,762 | 59,312 | 54,600 | 27,596 | (9,091 | ) | (139,022 | ) | 202,156 | |||||||||||||||||||
|
|
|
|
|
|
|
|
|
|
|
|
|
|
|
|||||||||||||||
127
Table of Contents
| For the Year Ended December 31, 2022 | ||||||||||||||||||||||||||||
| Private Markets |
Liquid Strategies |
IP&S | Financial Advisory |
Vinci Retirement Services |
Corporate Center |
Total | ||||||||||||||||||||||
| (R$ thousands) | ||||||||||||||||||||||||||||
| Gross revenue from services rendered |
225,391 | 94,995 | 94,862 | 20,699 | — | — | 435,947 | |||||||||||||||||||||
|
|
|
|
|
|
|
|
|
|
|
|
|
|
|
|||||||||||||||
| Fund Advisory fee |
3,341 | — | 32 | 20,699 | — | — | 24,072 | |||||||||||||||||||||
| Fund Management fee |
218,393 | 86,838 | 91,301 | — | — | — | 396,532 | |||||||||||||||||||||
| Fund Performance fee |
3,659 | 8,158 | 3,526 | — | — | — | 15,343 | |||||||||||||||||||||
| Taxes and contributions |
(11,816 | ) | (5,684 | ) | (8,561 | ) | (1,791 | ) | — | — | (27,852 | ) | ||||||||||||||||
| Net revenue from services rendered |
213,577 | 89,312 | 86,298 | 18,908 | — | — | 408,095 | |||||||||||||||||||||
|
|
|
|
|
|
|
|
|
|
|
|
|
|
|
|||||||||||||||
| Fund Advisory fee |
3,057 | — | 28 | 18,908 | — | — | 21,993 | |||||||||||||||||||||
| Fund Management fee |
207,060 | 81,326 | 83,114 | — | — | — | 371,500 | |||||||||||||||||||||
| Fund Performance fee |
3,460 | 7,986 | 3,156 | — | — | — | 14,601 | |||||||||||||||||||||
| (-) General and administrative expenses (1) |
(42,069 | ) | (24,916 | ) | (19,361 | ) | (5,021 | ) | (5,733 | ) | (132,249 | ) | (229,349 | ) | ||||||||||||||
|
|
|
|
|
|
|
|
|
|
|
|
|
|
|
|||||||||||||||
| Operating profit (loss) |
171,508 | 64,396 | 66,937 | 13,887 | (5,733 | ) | (132,249 | ) | 178,746 | |||||||||||||||||||
|
|
|
|
|
|
|
|
|
|
|
|
|
|
|
|||||||||||||||
| (1) | General and administrative expenses include share-based payments. For further information on our segment results, see note 22 to the audited consolidated financial statements included elsewhere in this annual report. |
Private Markets
Net Revenue from Services Rendered
Net revenue from services rendered in our Private Markets segment for the year ended December 31, 2023 was R$258.4 million, an increase of R$44.8 million, or 21.0%, from R$213.6 million for the year ended December 31, 2022, which was primarily due to:
| • | an increase of R$43.9 million in net revenue from fund management, which was primarily driven by strong fundraising in the segment during 2023 combined with catch-up fees for our Private Equity fund, VCP IV, and Infrastructure fund, VICC, by the additional capital subscriptions of funds by our Real Estate and Credit teams, and by the full year of SPS Capital in 2023; and |
| • | an increase of R$0.9 million in net revenue from advisory services and net revenue from performance fees. |
General and Administrative Expenses
General and administrative expenses in our Private Markets segment for the year ended December 31, 2023 was R$49.7 million, an increase of R$7.6 million, or 18.0%, from R$42.1 million for the year ended December 31, 2022. This increase was primarily driven by: (1) an increase of R$6.0 million in profit sharing as a result of an increase in management fees; (2) an increase of R$2.7 million in personnel expenses as a result of employee expenses with SPS Capital during the year. This increase was offset by a decrease of R$2.6 million in third-party expenses resulting from service provider expenses, such as accounting and advisory fees, which were incurred in 2022 and ceased to exist in 2023.
128
Table of Contents
Operating Profit
As a result of the foregoing, operating profit in our Private Markets segment for the year ended December 31, 2023 was R$208.8 million, an increase of R$37.3 million, or 21.7%, from R$171.5 million for the year ended December 31, 2022.
Liquid Strategies
Net revenue from services rendered
Net revenue from services rendered in our Liquid Strategies segment for the year ended December 31, 2023 was R$83.8 million, a decrease of R$5.5 million, or 6.2%, from R$89.3 million for the year ended December 31, 2022, mainly due to a decrease of R$9.5 million in net revenue from fund management caused by a combination of market volatility and funds outflow.
General and administrative expenses
General and administrative expenses in our Liquid Strategies segment for the year ended December 31, 2023 was R$24.5 million, a decrease of R$0.4 million, or 1.8%, from R$24.9 million for the year ended December 31, 2022. This decrease was primarily driven by a decrease of R$0.6 million in other operating expenses.
Operating profit
As a result of the foregoing, operating profit in our Liquid Strategies segment for the year ended December 31, 2023 was R$59.3 million, a decrease of R$5.1 million, or 7.9%, from R$64.4 million for the year ended December 31, 2022.
IP&S
Net Revenue from Services Rendered
Net revenue from services rendered in our IP&S segment for the year ended December 31, 2023 was R$74.8 million, a decrease of R$11.5 million, or 13.4%, from R$86.3 million for the year ended December 31, 2022. This decrease was driven primarily by a decrease of R$12.7 million, or 15.2%, in our net revenue from fund management within the segment, which has experienced redemptions, especially within our pension funds strategy which carries higher fees. By contrast, our separate mandates strategy, which carries lower fees, has been gaining relevance, contributing to the decrease in the average management fee rate. This decrease was partially offset by an increase of R$1.1 million in performance fees.
General and Administrative Expenses
General and administrative expenses in our IP&S segment for the year ended December 31, 2023 was R$20.2 million, an increase of R$0.8 million, or 4.1%, from R$19.4 million for the year ended December 31, 2022. This increase was primarily driven by an increase of R$0.7 million in third-party expenses, such as training services to employees.
Operating Profit
As a result of the foregoing, operating profit in our IP&S segment for the year ended December 31, 2023 was R$54.6 million, a decrease of R$12.3 million, or 18.4%, from R$66.9 million for the year ended December 31, 2022.
Financial Advisory Services
Net Revenue from Services Rendered
Net revenue from services rendered in our Financial Advisory Services segment for the year ended December 31, 2023 was R$37.3 million, an increase of R$18.4 million, or 97.2%, from R$18.9 million for the year ended December 31, 2022, which was primarily driven by stronger deal activity in 2023 as compared to 2022.
129
Table of Contents
General and Administrative Expenses
General and administrative expenses in our Financial Advisory Services segment for the year ended December 31, 2023 was R$9.7 million, an increase of R$4.7 million, or 93.2%, from R$5.0 million for the year ended December 31, 2022, which was driven primarily by an increase of R$3.9 million in profit sharing as a result of an increase in net revenue from services rendered.
Operating Profit
As a result of the foregoing, operating profit in our Financial Advisory Services segment for the year ended December 31, 2023 was R$27.6 million, an increase of R$13.7 million, or 98.7%, from R$13.9 million for the year ended December 31, 2022.
Retirement Services
Net Revenue from Services Rendered
Our Retirement Services segment was launched in 2023 to increase Vinci´s exposure to the growing pension plan industry. As of December 31, 2022, this segment was not yet operational, and in the year ended December 31, 2023, we had net revenue from services rendered in this segment in the amount of R$0.2 million, as it began to contribute to AUM figures and management fee revenues.
General and Administrative Expenses
General and administrative expenses in our retirement services segment for the year ended December 31, 2023 was R$9.3 million, an increase of R$3.6 million, or 61.5%, from R$5.7 million for the year ended December 31, 2022, which was driven primarily by an increase of R$1.2 million in depreciation and amortization as a result of the beginning of amortizations in the investments that were made in the segment.
Operating Loss
As a result of the foregoing, operating loss in our retirement services segment for the year ended December 31, 2023 was R$9.1 million, an increase of R$3.4 million, or 58.6%, from R$5.7 million for the year ended December 31, 2022.
Consolidated Results of Operations for the Year Ended December 31, 2022, compared to the Year Ended December 31, 2021
For a discussion of our results of operations for the year ended December 31, 2022 compared to the year ended December 31, 2021, please see “Item 5. Operating and Financial Review and Prospects—A. Operating Results—Results of Operations for the Year Ended December 31, 2022, compared to the Year Ended December 31, 2021” of our annual report on Form 20-F for the year ended December 31, 2022.
B. Liquidity and Capital Resources
Cash Flows
As of December 31, 2023, we had R$660.3 million in cash and cash equivalents. We believe that our current available cash and cash equivalents and the cash flows from our operating activities will be sufficient to meet our working capital requirements and capital expenditures in the ordinary course of business for coming 12 months.
The following table shows the generation and use of cash for the periods indicated:
| For the Year Ended December 31, | ||||||||||||
| 2023 | 2022 | 2021 | ||||||||||
| (R$ thousands) | ||||||||||||
| Cash Flow Data |
||||||||||||
| Net cash inflow from operating activities |
214,179 | 117,900 | 288,692 | |||||||||
| Net cash (outflow) from investing activities |
138,031 | 131,838 | (1,319,972 | ) | ||||||||
| Net cash (outflow) from financing activities |
175,020 | (215,507 | ) | 1,048,024 | ||||||||
130
Table of Contents
Our cash and cash equivalents include cash on hand, bank deposits, interbank certificate deposits with banks and other highly liquid securities purchased under agreements to resell with original maturities of three months or less, which have an immaterial risk of change in value. For more information, see note 5(d) to our audited consolidated financial statements included elsewhere in this annual report.
Net Cash Inflow From Operating Activities
Our net cash inflow from operating activities was R$214.2 million in the year ended December 31, 2023, an increase of R$96.3 million, or 81.7%, from net cash inflow from operating activities of R$117.9 million in the year ended December 31, 2022. Net cash inflow for the year ended December 31, 2023 increased primarily due to: (1) an increase of R$82.7 million in contributions to our retirement plan as a result of the start of Retirement Services operations in 2023; and (2) an increase of R$23.4 million in operating profit, primarily due to an increase in management and advisory fees.
Net Cash (Outflow) From Investing Activities
Our net cash from investing activities was R$138.0 million in the year ended December 31, 2023, an increase of R$6.2 million, or 4.7%, from R$131.8 million in the year ended December 31, 2022. This increase primarily resulted from the payment of R$80.0 million for the acquisition of SPS Capital in the year ended December 31, 2022, partially offset by (1) the decrease in the sales of financial instruments of R$43.0 million (net of purchases); and (2) the increase in the purchases of property and equipment and additions to intangible assets of R$30.3 million.
Net Cash (Outflow) From Financing Activities
Our net cash from financing activities were R$175.0 million in the year ended December 31, 2023, a variation of R$390.5 million from net outflow from financing activities of R$215.5 million in the year ended December 31, 2022. The variation primarily resulted from an increase of R$471.8 million due to the issuance of convertible preferred shares, as partially offset by the issuance of commercial notes amounting to R$79.0 million in 2022, net of transactions costs.
To view our cash flow for the year ended December 31, 2022 compared to the year ended December 31, 2021, please see “Item 5. Operating and Financial Review and Prospects—B. Liquidity and Capital Resources—Cash Flows” of our annual report on Form 20-F for the year ended December 31, 2022.
Indebtedness
As of December 31, 2023, we had debt liabilities amounting to R$689.9 million. The following is a breakdown of our material indebtedness as of the date of this annual report:
| • | Lease liabilities: lease liabilities were initially measured at the present value of the remaining lease payments, discounted using the lessee’s incremental borrowing rate. As of December 31, 2023, we leased three offices with a remaining payment of R$72.8 million (discounted) under leases expiring from one to seven years. |
| • | Loans and obligations: as of December 31, 2023, our loans and obligations amounted to R$617.1 million. These comprised R$431.3 million in Series A convertible preferred shares, R$73.2 million in commercial notes, R$48.2 million in consideration payable and R$64.4 million in contingent consideration. For more information, see notes 14(i), 14(ii), 14(iii) and 14(iv) to our audited consolidated financial statements. |
131
Table of Contents
The following is a breakdown of our remaining lease liabilities and loans and financing as of December 31, 2023:
| Total | Less than one year |
1-3 years | 3-5 years | More than five years |
||||||||||||||||
| Lease liabilities |
72.8 | 24.4 | 28.2 | 12.3 | 7.9 | |||||||||||||||
|
|
|
|
|
|
|
|
|
|
|
|||||||||||
| Loans and obligations |
617.1 | 76.7 | 35.1 | 82.1 | 423.2 | |||||||||||||||
|
|
|
|
|
|
|
|
|
|
|
|||||||||||
| Total |
689.9 | 101.1 | 63.3 | 94.4 | 431.1 | |||||||||||||||
|
|
|
|
|
|
|
|
|
|
|
|||||||||||
Commercial Notes
On August 15, 2022, our subsidiary Vinci Soluções de Investimentos Ltda. issued 80,000 commercial notes in the total principal amount of R$80.0 million (par value R$1,000 per commercial note). The notes have a five-year tenor and mature on August 15, 2027. The notes accrue interest at the CDI rate plus 2.15% per annum and are to be amortized on a semi-annual basis, beginning on February 15, 2023. As of December 31, 2023, the outstanding balance of these notes amounted to R$73.2 million.
The agreement governing our commercial notes contains standard restrictive covenants, including financial covenants. This agreement provides for the acceleration of our obligations on the commercial notes upon the occurrence of an event of default as defined under such agreement. In addition, we are required to comply with financial covenants on an annual basis, beginning on December 31, 2022, and non-financial restrictive covenants. As of December 31, 2023, we were in compliance with the covenants set forth in our notes.
Series A Convertible Preferred Shares
On October 26, 2023, the Company issued and sold 100,000 shares of convertible preferred shares designated as Series A convertible preferred shares, with a par value of U.S.$0.00005 per share of the Company for US$100.0 million. The Series A convertible preferred shares is a class of equity security that ranks senior to the common shares with respect to dividend rights or rights upon liquidation.
Each Series A convertible preferred share is entitled to a cash dividend of 8.0% per annum and is convertible, at the holder’s discretion, into the Company’s Class A common shares at an initial conversion price of US$13.60. The Company may require the conversion of any or all of the Series A convertible preferred shares at any time on or after the second-year anniversary of the original issuance date if certain conditions set forth in the certificate of designation are met (if for 20 out of 30 consecutive trading days prior, our stock price is equal to or above 150% of the conversion rate). The Company may also redeem any or all of the Series A convertible preferred shares for cash upon certain conditions set forth in the certificate of designation. On or after the ten-year anniversary of the original issuance date, the holders of the Series A convertible preferred shares shall have the right to redeem all of the outstanding Series A convertible preferred shares for cash, subject to certain conditions set forth in the certificate of designation. Upon the occurrence of a change of control, the holders will have the right to redeem their Series A convertible preferred shares for cash at a price set forth in the certificate of designation. The Series A convertible preferred shares will be entitled to the same voting rights as the common shares only when converted into common shares.
Under the terms of IAS 32, our Series A convertible preferred shares was evaluated by our management, which classified as a compound instrument, having both a liability and an equity component from our perspective. Based on this evaluation, the component parts were accounted for and presented separately according to their substance. The split was made at issuance and not revised for subsequent changes in market interest rates, share prices, or other event that changes the likelihood that the conversion option will be exercised.
For further information on our loans and financing, see note 14 to the audited consolidated financial statements, included elsewhere in this annual report.
132
Table of Contents
Capital Expenditures
In the years ended December 31, 2023, 2022 and 2021, we incurred capital expenditures of R$36.7 million, R$6.5 million and R$3.1 million, respectively. The total capital expenditures as a percentage of net revenue from services rendered was 8.1% in the year ended December 31, 2023, 1.6% in 2022 and 0.7% in 2021, respectively. These capital expenditures mainly include expenditures related to (i) agreements with investment placement agents relating to funds raised from investors in funds managed by us and (ii) investments in systems and applications which are being developed to support our Retirement Services applications .
We expect to maintain our capital expenditures to support the growth of our business and operations. We expect to meet our capital expenditure needs for the foreseeable future from our operating cash flow, our existing cash and cash equivalents, with the net proceeds of our IPO and with the proceeds from the issuance of our Series A convertible preferred shares. Our future capital requirements will depend on several factors, including our growth rate, the expansion of our research and development efforts, employee headcount, marketing and sales activities, the introduction of new features to our existing products and the continued market acceptance of our products.
C. Research and Development, Patents and Licenses, Etc.
See “Item 4. Information on the Company—D. Property, plant and equipment—Intellectual Property.”
D. Trend Information
Our Market
Brazil is a large and attractive market for financial services. The country has the 7th largest population and the 12th largest economy in the world with 215 million people and a GDP of US$1.9 trillion as of 2022, according to the World Bank. In 2021, Brazil posted a strong recovery with a GDP growth of 4.6%, and has rolled back all monetary and fiscal stimuli introduced in response to the COVID-19 pandemic. The GDP further expanded in 2022 by 2.9% and 2.5% in 2023. Going forward, we believe the path continues to be for constructive macroeconomic environment, supported by a reduction in the rate of inflation, the normalization of interest rates in real terms and a recovery in consumer and business confidence indicators, which are important to improve the planning horizon of families and companies and increase the medium-term outlook for economic growth. Having rolled back all COVID-19-related fiscal and monetary stimuli in 2023, 2022 and 2021, we believe the combination of economic growth and a stabilization of interest rates will create increasingly favorable tailwinds for the asset management industry in the coming years.
Key market challenges—Brazilian market ripe for disruption
The Brazilian asset management industry has been highly inefficient for decades due to high interest rates, which limit the incentives for product development by incumbents and lead to a high concentration of investments in the banking sector, which still represents the majority of institutional and retail investments in Brazil. We believe this has created several important market challenges that create opportunities for disruption: (1) highly concentrated market; (2) bureaucratic, asset-heavy infrastructures; (3) narrow selection of financial products; (4) promotion of inefficient financial products; (5) high-costs and spreads; and (6) poor customer service.
Key market trends
We believe our market will benefit from several trends that will help provide attractive tailwinds including: (1) increasing demand for financial products; (2) disintermediation of incumbent banks; (3) increasing demand for financial education and information; and (4) favorable and highly aligned regulatory initiatives.
Addressable market opportunities
We believe that we will benefit from these key market trends and the favorable macroeconomic environment in Brazil, and that these trends and market environment have positioned us to continue to penetrate, grow and expand our large addressable market opportunity in the country. Given our leadership, scale, brand, and competitive advantages, we believe we will benefit from and continue to be a catalyst for:
Continued Shift of AUM towards Alternative Investments—Even with the short-term rise in interest rates, we believe the long-term fundamentals remain strong. Local investors are currently under-allocated to alternative investments in Brazil. Local investors have very little exposure to our Private Markets segment products compared to investor allocation in developed markets, such as Europe and United States. This presents a key opportunity, as we face sparse competition in this segment in Brazil with a considerable addressable market. We will continue to focus on our core capabilities and expertise across high value-added strategies to take advantage of shifts in asset allocation.
133
Table of Contents
Continued Shift of AUM from banks to Independent Investment firms—Our product offerings and our close relationship with our limited partners set us apart in the competition for fundraising opportunities coming from the shift of investments from traditional banks to independent investment firms.
Increasing Investment Pipeline and Reinvestment Requirements—Under a renewed growth and political outlook, we expect a significant surge in the investment pipeline to return to the market in coming years, especially in infrastructure. Currently, we expect both state-owned banks and traditional conglomerates to be more constrained to deploy capital due to balance sheet restrictions; thereby creating additional demand for capital to be covered by the broader private markets and less traditional sources of capital.
E. Critical Accounting Estimates
See notes 2 and 3 to our audited consolidated financial statements for a description of our critical estimates and accounting judgments and significant accounting policies.
ITEM 6. DIRECTORS, SENIOR MANAGEMENT AND EMPLOYEES
A. Directors and Senior Management
We are managed by our board of directors and by our senior management, pursuant to our Articles of Association and the Companies Act.
Board of Directors
As of the date of this annual report, our board of directors is composed of nine members. Each director holds office for the term, if any, fixed by the shareholders’ resolution that appointed such director, or, if no term is fixed on the appointment of the director, until the earlier of his or her removal or resignation of office as a director in accordance with the Articles of Association. Directors appointed by the board of directors hold office until the next annual general meeting. Our directors do not have a retirement age requirement under our Articles of Association.
The following table presents the names, ages and position of the current members of our board of directors.
| Name |
Age |
Position | ||
| Gilberto Sayão da Silva | 53 | Chairman | ||
| Alessandro Monteiro Morgado Horta | 53 | Director | ||
| Paulo Fernando Carvalho de Oliveira | 53 | Director | ||
| Lywal Salles Filho | 77 | Director | ||
| Rogério Ladeira Furquim Werneck | 75 | Director | ||
| Ana Marta Horta Veloso | 55 | Director | ||
| Guilherme Stocco Filho | 49 | Director | ||
| Sonia Consiglio | 56 | Director | ||
| Peter Ogilvie | 41 | Director |
The following is a brief summary of the business experience of our directors. Unless otherwise indicated, the current business address for our directors is Av. Bartolomeu Mitre, 336, Leblon, Rio de Janeiro, Brazil, 22431-002.
Mr. Gilberto Sayão da Silva is one of our founding partners and the Chairman of our board of directors. He was previously a partner at Banco Pactual and oversaw the areas of investments, corporate finance and hedge funds. From 2006 to 2009, he was the principal executive for UBS Pactual Alternative Investment Management. From 1998 to 2009, he was part of the executive committees of Banco Pactual and UBS Pactual. He studied Electrical Engineering at the Pontifical Catholic University of Rio de Janeiro, or PUC-Rio.
134
Table of Contents
Mr. Alessandro Monteiro Morgado Horta is one of our founding partners and serves as our CEO and a member of our board of directors. He previously served as vice-president for Banco UBS Pactual and as an executive for UBS Pactual Alternative Investment Management from 2006 to 2009. At Banco Pactual, he served as managing partner, chief operating officer and also led the Long-Term Investments division from 2001 to 2006. He was also a partner of Banco Icatu from 1998 to 2001. He holds a degree in Electrical Engineering from PUC-Rio.
Mr. Paulo Fernando Carvalho de Oliveira is one of our founding partners and serves as a member of our board of directors. He served as an executive for UBS Pactual Alternative Investment Management from 2006 to 2009. He was also a member of the executive committee of Banco Pactual, where he began his career in the Management Information division. In 1997, he joined the Foreign Exchange division, and was made a partner at the bank in 1998. He holds a degree in Mechanical Engineering from PUC-Rio.
Mr. Lywal Salles Filho is a member of our board of directors. He has sat on the board of several companies and trade associations, such as ANBIMA. He was chairman and CEO of UBS AG in Brazil from 2010 to 2013. Previously, at Banco Itaú Unibanco S.A., Mr. Salles Filho was a senior managing director, leading the bank’s private banking operations globally and sitting as chairman on the boards of directors of Banco Itaú International and Itaú Securities in the United States, and of Banco Itaú Suisse in Zurich, Switzerland. Prior to joining Itaú, Mr. Salles Filho served in several senior roles at Citibank N.A., including as CEO of the Latin American Affluent Clients segment. He also spent 15 years with The Chase Manhattan Bank as business head in the United States, Hong Kong, Brazil and Chile. He holds a master’s of science degree in Management from Syracuse University, and a bachelor’s degree in Economics, as well as a certificate of postgraduate studies in Economics Engineering, from the Universidade Federal do Rio de Janeiro.
Mr. Rogério Ladeira Furquim Werneck holds a PhD in Economics from Harvard and is a professor at PUC-Rio. He has served as a member of our board of directors since 2017. After earning a BA in Economics from Universidade Federal de Minas Gerais, he went to graduate school at Fundação Getúlio Vargas, in Rio, where he later taught from 1975 to 1977. He has been, since 1977, one of the key faculty members of PUC-Rio’s prestigious Department of Economics, having served as its Director for three long terms: 1980-85, 2002-09 and, more recently, 2016-21. He is a biweekly columnist for two of the most important Brazilian newspapers, O Estado de São Paulo and O Globo.
Ms. Ana Marta Horta Veloso holds a degree in Economics from UFMG (Universidade Federal de Minas Gerais) and a master’s degree in Economics from UFRJ (Universidade Federal do Rio de Janeiro). She is a board member of Pontal Energy (since September 2023), Profarma S.A. (since May 2022), Oceânica Engenharia S.A. (since September 2022) and Enauta Participações S.A. (since July 2023). She is the president of the audit committee at Oceânica Engenharia S.A. and the president of the ESG committee of Enauta Participações S.A., where she is also a member of the compensation committee. She has extensive experience both in the financial and electricity sectors, having been the chief executive officer and investor relations officer of Light S.A. between 2015 and 2017 and again from 2019 to October 2020. She also held the position of officer of Equatorial Energia between 2008 and 2015 and represented Equatorial in the board of directors of its invested companies, such as Cemar, Celpa and Gera Maranhão. In 2018, she served as a consultant for GP Investments and for Credit Suisse Energy Infrastructure Partners. Additionally, she was a board member and a member of the Audit Committee and Compensation Committee at Enel/Eletropaulo from 2018 to 2019, a board member and a member of several committees at Light from 2006 to 2010, a board member at Light from 2015 to 2017 and at Equatorial Energia from 2006 to 2008. She also was a representative of BNDES on the boards of directors of Acesita, Klabin, Vale, Valepar, and Globo Cabo (Net/Claro). She worked at BNDES between 1992 and 2005 and at Banco Pactual between 2000 and 2001, when she was on leave from BNDES, and later in Pactual again, between 2006 and 2008.
Mr. Guilherme Stocco Filho has more than 20 years of experience in building up digital businesses and leading corporate transformations. He is responsible for carrying out successful projects in digital banking (Banco Original); startup investments (Domo Invest), mobile and e-commerce (Buscapé), internet platforms (Microsoft), and advertising (Te Respondo). Currently, he is member of the boards of directors of TOTVS and Falconi Consultoria. He is also the co-founder of Futurum Capital. He is a frequent presenter on market trends and innovation, and has spoken at more than 120 events in Brazil, Latin America, Canada, the United States, Denmark, and the United Kingdom. He holds a degree in Business Administration from Fundação Armando Alvares Penteado – FAAP (1997) and also presents lectures on innovation at INSPER MBA in São Paulo, Brazil.
135
Table of Contents
Ms. Sonia Consiglio is a sustainability specialist and one of our board members. She is vice-chair of the Advisory Council for the Disclosure Insight Action (CDP) Latin America, a role held by her since January 2020, and member of the Advisory Council of Brazil Foundation since March 2023. Previously, she served as a director at B3 between 2009 and 2019, having assumed the role of president of the Deliberative Council of the Corporate Sustainability Index (ISE), and as vice-chair and chair of Rede Brasil for UN Global Compact between 2017 and 2019. She also served as director of HR and internal communications and superintendent for BankBoston between 1998 and 2006, as a superintendent of sustainability and institutional communications at Banco Itaú between 2007 and 2009, and as director of social responsibility at Febraban between 2006 and 2009. Ms. Consiglio is a well-acknowledged ESG and corporate communications expert in the financial services industry, having been recognized in 2016 by the United Nations Global Compact as a Sustainable Development Goals (SDG) pioneer, among only ten people in the world. Ms. Consiglio holds a degree in journalism from Faculdade de Comunicação Cásper Líbero (1987).
Mr. Peter Ogilvie is a partner and head of the Ares corporate strategy group. Additionally, he serves as the executive vice president for Ares Acquisition Corporation II, a special purpose acquisition company sponsored by Ares. Mr. Ogilvie has led the Areas corporate strategy group’s efforts on numerous landmark transactions, and is also a board member for LightPoint Financial Technology and Ares Australia Management. Prior to joining Ares in 2007, Mr. Ogilvie worked in the Leveraged Finance and Restructuring Group at Credit Suisse. Mr. Ogilvie holds a B.A. from Yale University in Economics.
Executive Officers
Our executive officers are responsible for the management and representation of our company. We have a strong centralized management team led by Alessandro Monteiro Morgado Horta (our chief executive officer and a member of our board of directors), with broad experience in the financial services industry.
The following table lists the names, ages and position of our current executive officers:
| Name |
Age |
Position | ||
| Alessandro Monteiro Morgado Horta | 53 | Chief Executive Officer | ||
| Bruno Augusto Sacchi Zaremba | 49 | Chairman of Private Equity and Investor Relations | ||
| Sergio Passos Ribeiro | 51 | Chief Operating Officer and Chief Financial Officer |
The following is a brief summary of the business experience of our executive officers who are not also members of our board of directors. Unless otherwise indicated, the current business address for our executive officers is Av. Bartolomeu Mitre, 336, Leblon, Rio de Janeiro, Brazil, 22431-002.
Bruno Augusto Sacchi Zaremba is the chairman of our private equity group and head of our Investor Relations. He is a member of the Board of Directors of LAVCA, as well as of several Vinci Partners portfolio companies, such as Austral, CBO, Domino’s Pizza, Grupo CURA and Vero Internet. Mr. Zaremba is also a member of the Board of Directors of Instituto Órizon, a nonprofit organization founded by Vinci Partners and three other alternative asset managers that works with the concept of venture philanthropy as applied to education- and Brazil-facing non-governmental organizations. Mr. Zaremba started his career in 1996 at Banco Pactual, where he worked as a sell side equity research analyst, leading research for banks, beverages, retail, food and tobacco. After becoming partner of Banco Pactual in 2001, he was assigned to lead the bank’s proprietary equity and debt investments in the U.S. Between 2006 and 2009, he worked in UBS Pactual Alternative Investments Management, with a focus in private equity. He joined Vinci Partners in 2009 as a partner, where he has been fully involved with our private equity strategy since the commencement of our operations. Mr. Zaremba holds a bachelor’s degree in Economics from PUC-Rio, is a Chartered Financial Analyst, or CFA, and completed the OPM 50 program at the Harvard Business School.
Sergio Passos Ribeiro heads our Operational, Financial and IT departments as our Chief Operating Officer and Chief Financial Officer. Between 2006 and 2009, he was responsible for accounting at Banco Pactual. He joined Banco Pactual in 1998 and was initially responsible for tax planning. Prior to his time at Banco Pactual, he was a financial consultant for PricewaterhouseCoopers. He holds a degree in Business Administration and Accounting from Universidade Santa Úrsula, an MBA in Finance from Ibmec RJ, and an Executive MBA from the COPPEAD Graduate School of Business of UFRJ.
136
Table of Contents
Directors’ and Officers’ Insurance
We currently have no civil liability insurance coverage for acts carried out by our directors and executive officers in the course of their duties.
Share Ownership
The shares and any outstanding beneficially owned by our directors and officers and/or entities affiliated with these individuals are disclosed in the section entitled “Item 7. Major Shareholders and Related Party Transactions—A. Major Shareholders.”
Our Relationship with our Directors, Executive Officer and Members of Senior Management
There are no family relationships between any of our directors, executive officers and members of our senior management.
| B. | Compensation |
Under Cayman Islands law, we are not required to disclose compensation paid to our senior management on an individual basis and we have not otherwise publicly disclosed this information elsewhere.
For the years ended December 31, 2023 and 2022, the aggregate compensation expense for our key management personnel (including our executive officers and directors) for services in all capacities was R$16.7 million and R$16.8 million, respectively, which includes both benefits paid in kind and compensation. See note 21(a) to our audited consolidated financial statements included elsewhere in this annual report. We have not historically provided any pension, retirement or similar benefits to our directors or executive officers as part of their compensation and consequently we have not accrued any amounts for pension, retirement and similar benefits for our directors and executive officers.
Employment Agreements
None of our executive officers have entered into employment agreements with the Company. We have entered into director services agreements with Mr. Lywal Salles Filho and with our independent directors, and such agreements do not provide for any benefits upon termination of their employment with the Company.
Long-Term Incentive Plans
Stock Option Plans
We have implemented stock option long-term incentive plans for eligible employees (each, a Stock Option Plan). The Stock Option Plans govern the issuance of equity incentive awards with respect to our Class A common shares. In the first issuance of stock options under our first Stock Option Plans, which was approved by our board of directors in May 2021, we issued stock options to certain eligible employees representing 2.775% of our common shares outstanding. Such options have an exercise price per share equal to US$18.00 (which was the price per share of our Class A common shares sold in our initial public offering), will vest ratably over a period of three years from February 1, 2021. Participants have the right to exercise their vested options for one year as of February 1, 2024. As of December 31, 2023, we had granted stock options outstanding with respect to 1,482,753 Class A common shares under this plan.
In February 2023, our board of directors approved a second Stock Option Plan, which aims to grant up to 1,150,000 options, each entitling the beneficiary to purchase one Class A common share. Such options have an exercise price per share equal to US$9.96; provided that, unless otherwise provided for in an option agreement, this exercise price will be reduced by the amount per share distributed to our shareholders from the date of the grant of the option, whether as dividends, interest on capital, redemption, capital reduction or others. Options will become eligible to be exercised in May 2026. As of December 31, 2023, we had granted stock options outstanding with respect to 1,116,884 Class A common shares under this plan.
137
Table of Contents
In January 2024, our board of directors approved a third Stock Option Plan (as amended in March 2024), which aims to grant up to 1,413,650 options, each entitling the beneficiary to purchase one Class A common share. Such options have an exercise price per share equal to US$11.04; provided that, unless otherwise provided for in an option agreement, this exercise price will be reduced by the amount per share distributed to our shareholders from the date of the grant of the option, whether as dividends, interest on capital, redemption, capital reduction or others. Options will become eligible to be exercised in January 2027.
Our board of directors may adjust the number of Class A common shares available for issuance under the Stock Option Plans from time to time in its discretion. Equity incentive awards may be granted to our employees, non-employee directors, officers, as well as holders of equity compensation awards granted by a company that may be acquired by us in the future. We consider our employees are our main asset and we believe that enhancing our ability to motivate and reward eligible employees will have positive impact on our operations and leverage returns for our shareholders.
Restricted Shares Plan
We have implemented a Restricted Shares Plan for eligible employees, which was approved by our board of directors on April 4, 2022. The Restricted Shares Plan governs the issuance of equity incentive awards, or RSUs, with respect to our Class A common shares. We expect that the Restricted Shares Plan will not exceed 1.65% of our common shares at any given time. We expect to issue shares to certain eligible employees at no cost. Such shares will vest ratably over a period from one to six years. As of December 31, 2023, we had granted 781,881 Class A RSUs and there were 688,779 RSUs outstanding under this plan.
If a participant is dismissed by us with cause or voluntarily terminates his or her employment or service relationship with us, the participant will forfeit any right to the unvested shares. If the participant is dismissed by us without cause, the participant shall maintain the right to any outstanding RSU granted in connection with the plan. However, the participant shall only receive shares resulting from such vested RSUs in the original terms provided for in the applicable agreement. In case of the participant’s death or permanent disability, the participant (or his or her heirs) will be entitled to receive all the granted shares, whether or not vested, which will be delivered within 60 days from the applicable event.
Awards of restricted shares are to be settled in shares. The RSUs may not be pledged, assigned or transferred to third parties. The Restricted Shares Plan provides that we may withhold a portion of the restricted shares units to comply with all taxes applicable to the delivery of the restricted shares units to the beneficiary.
| C. | Board Practices |
Committees of the Board of Directors
Our board of directors has three standing committees: the audit committee, the ESG committee, and the innovation committee. As allowed by the laws of the Cayman Islands, we do not have a nomination and corporate governance committee or remuneration committee nor do we have any current intention to establish either.
Audit Committee
The members of our audit committee are Rogério Ladeira Furquim Werneck, Ana Marta Horta Veloso, Guilherme Stocco Filho and Sonia Consiglio, who assist our board of directors in overseeing our accounting and financial reporting processes and the audits of our financial statements. In addition, the audit committee will be directly responsible for the appointment, compensation, retention, and oversight of the work of our independent registered public accounting firm. Ana Marta Horta Veloso serves as chairperson of the committee. The audit committee consists exclusively of members of our board of directors who are financially literate. Ana Marta Horta Veloso is considered an “audit committee financial expert” as defined by the SEC. Our board of directors has determined that Rogério Ladeira Furquim Werneck, Ana Marta Horta Veloso, Guilherme Stocco Filho and Sonia Consiglio satisfy the “independence” requirements set forth in Rule 10A-3 under the Exchange Act.
The audit committee is governed by a charter that complies with Nasdaq rules. The audit committee is responsible for, among other things:
| • | the appointment, compensation, retention and oversight of any auditor or accounting firm engaged for the purpose of preparing or issuing an audit report or performing other audit, review or attest services; |
138
Table of Contents
| • | pre-approving the audit services and non-audit services to be provided by our independent auditor before the auditor is engaged to render such services; |
| • | reviewing and discussing with the independent auditor its responsibilities under generally accepted auditing standards, the planned scope and timing of the independent auditor’s annual audit plan(s) and significant findings from the audit; |
| • | obtaining and reviewing a report from the independent auditor describing all relationships between the independent auditor and the Company consistent with the applicable PCAOB requirements regarding the independent auditor’s communications with the audit committee concerning independence; |
| • | confirming and evaluating the rotation of the audit partners on the audit engagement team as required by law; |
| • | reviewing with management, in separate meetings whenever the Audit Committee deems appropriate, any analyses or other written communications prepared by the Management and/or the independent auditor setting forth significant financial reporting issues and judgments made in connection with the preparation of the financial statements, including analyses of the effects of alternative IFRS Accounting Standards methods on the financial statements; and other critical accounting policies and practices of the Company; |
| • | reviewing, in conjunction with the Chief Executive Officer and Chief Financial Officer of the Company, the Company’s disclosure controls and procedures and internal control over financial reporting; |
| • | establishing procedures for the receipt, retention and treatment of complaints received by the Company regarding accounting, internal accounting controls or auditing matters, and the confidential, anonymous submission by employees of the Company of concerns regarding questionable accounting or auditing matters; and |
| • | approving or ratifying any related person transaction (as defined in our related person transaction policy) in accordance with our related person transaction policy. |
The audit committee will meet as often as it determines is appropriate to carry out its responsibilities, but in any event will meet at least four times per year.
ESG Committee
The members of the ESG committee are Sonia Consiglio, who is the chairperson, Gilberto Sayão da Silva, Alessandro Monteiro Morgado Horta, Roberto Leuzinger, Patricia Amorim, Julya Wellisch, José Luis Pano, Ana Vitoria Bevilaqua, and Tomas Jatobá. The ESG committee was established to advise our board of directors on sustainability-related practices based upon three main pillars:
| • | Businesses: promoting responsible investments from a business perspective to map and understand material risks as well as opportunities; |
| • | Promotion (industry and market): expand formal commitments to an ESG agenda and actively participate in sectoral associations and interest groups to disseminate knowledge and help strengthen the theme in Brazil; and |
| • | Culture & Practices: strengthen our ESG culture across all areas of the firm, develop our private social investment policy to maximize our philanthropic efforts, and introduce and support relevant ESG agendas (e.g., climate change; carbon footprint; diversity and inclusion). |
Innovation Committee
The members of the innovation committee are Guilherme Stocco Filho, who is the chairperson, Gilberto Sayão da Silva, Alessandro Monteiro Morgado Horta, Lywal Salles Filho, Sergio Passos Ribeiro, Roberto Leuzinger, Ronaldo Buruchovitch, Fernando Lovisotto, Gabriel Felzenszwalb, José Carlos Carvalho, Vinicius Albernaz, Luiz Otavio Laydner and Alexandre Machado.
139
Table of Contents
The innovation committee seeks to foster the creativity and development of Vinci Partners by evaluating which measures should be taken to expand our digital skills, and evaluating cyber risks and measures to minimize them. The innovation committee discusses topics such as big data, artificial intelligence and blockchain, examining how they can be incorporated into Vinci Partners’ business. On a more pragmatic approach, the committee has two main agendas: (i) leveraging big data to support investment decisions and capital allocation, and (ii) use AI/machine learning to improve our distribution efficiency. We believe innovation has a great transformational potential, and, through the automation and optimization of processes, promotes important gains for governance, transparency, and compliance.
Board Diversity
The following matrix outlines the gender identity and the demographic background of the members of our board of directors in accordance with the Nasdaq rules to which we are subject:
| Board Diversity Matrix (as of December 31, 2023) | ||||||||
| Country of Principal Executive Offices: | Brazil | |||||||
| Foreign Private Issuer: | Yes (the Cayman Islands) | |||||||
| Disclosure Prohibited under Home Country Law: | No | |||||||
| Total Number of Directors: | 9 | |||||||
| Female | Male | Non-Binary | Did Not Disclose Gender | |||||
| Part I: Gender Identity | ||||||||
| Directors: | 2 | 7 | — | — | ||||
| Part II: Demographic Background | ||||||||
| Underrepresented Individual in Home Country Jurisdiction: | — | |||||||
| LGBTQ+: | — | |||||||
| Did not Disclose Demographic Background: | — | |||||||
| D. | Employees |
As of December 31, 2023, 2022 and 2021, we had 275, 283 and 244 full-time employees, respectively. As of December 31, 2023, all our employees were based in our offices in São Paulo, Rio de Janeiro, Recife, Ribeirão Preto and New York City.
The table below breaks down our full-time personnel by function as of December 31, 2023:
| Function |
Number of Employees |
% of Total | ||||||
| Investment Professionals – Private Markets |
61 | 22.0 | % | |||||
| Investment Professionals – Public Markets |
24 | 12.0 | % | |||||
| Financial Advisory Professionals |
10 | 4.0 | % | |||||
| Sales and Distribution |
27 | 10.0 | % | |||||
| Research & Market Risk |
18 | 7.0 | % | |||||
| Legal and Compliance |
9 | 3.0 | % | |||||
| Technology |
17 | 6.0 | % | |||||
| General and Administrative |
99 | 36.0 | % | |||||
|
|
|
|
|
|||||
| Total |
275 | 100.0 | % | |||||
|
|
|
|
|
|||||
140
Table of Contents
Our employees in Brazil are affiliated with the union of capital markets employees for the geographic area in which they work.
| E. | Share Ownership |
The shares and any outstanding beneficially owned by our directors and officers and/or entities affiliated with these individuals are disclosed in the section entitled “Item 7. Major Shareholders and Related Party Transactions—A. Major Shareholders.”
See “Item 6. Directors, Senior Management and Employees—B. Compensation—Long-Term Incentive Plans” for information on our long-term incentive plans.
| F. | Disclosure of a Registrant’s Action to Recover Erroneously Awarded Compensation. |
Not applicable.
ITEM 7. MAJOR SHAREHOLDERS AND RELATED PARTY TRANSACTIONS
| A. | Major Shareholders |
The following table and accompanying footnotes present information relating to the beneficial ownership of our Class A common shares and Class B common shares and our Series A convertible preferred share as of December 31, 2023.
The number of common shares beneficially owned by each entity, person, executive officer or director is determined in accordance with the rules of the SEC, and the information is not necessarily indicative of beneficial ownership for any other purpose. Under such rules, beneficial ownership includes any shares over which the individual has sole or shared voting power or investment power as well as any shares that the individual has the right to acquire within 60 days through the exercise of any option, warrant or other right.
Except as otherwise indicated, and subject to applicable community property laws, we believe that each shareholder identified in the table below possesses sole voting and investment power over all the Class A common shares or Class B common shares shown as beneficially owned by the shareholder in the table.
Unless otherwise indicated below, the address for each beneficial owner is c/o Vinci Partners, Av. Bartolomeu Mitre, 336, Leblon, Rio de Janeiro, Brazil, 22431-002.
141
Table of Contents
| Shares Beneficially Owned | % of Total Voting Power(1) |
|||||||||||||||||||||||||||
| Common Shares | Preferred Shares | |||||||||||||||||||||||||||
| Shareholders |
Class A | Class B | Series A | |||||||||||||||||||||||||
| Shares | % | Shares | % | Shares | % | |||||||||||||||||||||||
| 5% Shareholders |
||||||||||||||||||||||||||||
| Gilberto Sayão da Silva (2) |
— | — | 14,466,239 | 100.0 | — | — | 75.6 | |||||||||||||||||||||
| Alessandro Monteiro Morgado Horta |
8,266,422 | 21.0 | — | — | — | — | 4.3 | |||||||||||||||||||||
| Ares Management LLC(3) |
7,354,020 | 15.8 | — | — | 100,000 | 100.0 | 3.8 | |||||||||||||||||||||
| Samlyn Capital, LLC(4) |
2,629,571 | 6.7 | — | — | — | — | 1.4 | |||||||||||||||||||||
| Adage Capital Partners, L.P.(5) |
2,011,610 | 5.1 | — | — | — | — | 1.1 | |||||||||||||||||||||
| SPX Gestão de Recursos Ltda.(6) |
— | — | — | — | ||||||||||||||||||||||||
| Executive Officers and Directors |
||||||||||||||||||||||||||||
| Gilberto Sayão da Silva (2) |
— | — | 14,466,239 | 100.0 | — | — | 75.6 | |||||||||||||||||||||
| Alessandro Monteiro Morgado Horta |
8,266,422 | 21.0 | — | — | — | — | 4.3 | |||||||||||||||||||||
| Paulo Fernando Carvalho de Oliveira |
1,859,944 | 4.7 | — | — | — | — | 1.0 | |||||||||||||||||||||
| Lywal Salles Filho |
206,661 | 0.5 | — | — | — | — | 0.1 | |||||||||||||||||||||
| Guilherme Stocco Filho |
— | — | — | — | — | — | — | |||||||||||||||||||||
| Ana Marta Horta Veloso |
— | — | — | — | — | — | — | |||||||||||||||||||||
| Rogério Ladeira Furquim Werneck |
— | — | — | — | — | — | — | |||||||||||||||||||||
| Bruno Augusto Sacchi Zaremba |
1,446,624 | 3.7 | — | — | — | — | — | |||||||||||||||||||||
| Sergio Passos Ribeiro |
1,115,967 | 3.2 | — | — | — | — | 0.8 | |||||||||||||||||||||
| Sonia Consiglio |
— | — | — | — | — | — | 0.6 | |||||||||||||||||||||
| Peter Ogilvie |
— | — | — | — | — | — | — | |||||||||||||||||||||
| All directors and executive officers as a group (11 persons) |
12,895,618 | 32.8 | 14,466,239 | 100.0 | — | — | 82.3 | |||||||||||||||||||||
| Others (7) |
13,948,485 | 35.5 | — | — | — | — | 7.3 | |||||||||||||||||||||
| Public float |
12,468,475 | 31.7 | — | — | — | — | 6.5 | |||||||||||||||||||||
| Total (8) |
39,312,578 | 100.0 | 14,466,239 | 100.0 | 100,000 | 100.0 | 100.0 | |||||||||||||||||||||
| (1) | Percentage of total voting power represents voting power with respect to all of our outstanding Class A common shares and Class B common shares, as a single class. A holder of our Class B common shares is entitled to 10 votes per share, whereas holders of our Class A common shares are entitled to one vote per share. Pursuant to the certificate of designations, a holder of our Series A convertible preferred shares is entitled to have the right to receive notice of, attend and/or vote at a general meeting, on an as-converted basis, with holders of our Class A common shares on all matters submitted to a vote of the holders of our Class A common shares, except where a separate class vote of common shareholders is required by the Companies Act. In addition, the terms of our Series A convertible preferred shares require the approval of a majority of our Series A convertible preferred shares voting as a separate class for us to take the following decisions, |
142
Table of Contents
| among others described in the certificate of designations: (1) amend our organizational documents in a manner that would have an adverse effect on the Series A convertible preferred shares; and (2) issue securities that are senior to, or equal in priority with, the Series A convertible preferred shares. For more information about the voting rights of our Class A common shares, Class B common shares and Series A convertible preferred shares, see “Item 10. Additional Information—B. Memorandum and Articles of Association—Voting Rights.” |
| (2) | Includes all of our Class B common shares. The holders of our Class A common shares and Class B common shares have identical rights, except that (1) a holder of Class B common shares is entitled to 10 votes per share, whereas holders of our Class A common shares are entitled to one vote per share; (2) Class B common shares have certain conversion rights; and (3) a holder of Class B common shares is entitled to maintain a proportional ownership interest by purchasing additional Class B common shares in the event that additional Class A common shares are issued. For more information see “Item 10. Additional Information—B. Memorandum and Articles of Association—Preemptive or Similar Rights.” |
| (3) | Based on a statement on Schedule 13D jointly filed on November 6, 2023 by Ares Investments Holdings LLC, Ares Holdings L.P., Ares HoldCo LLC, Ares Management Corporation, Ares Voting LLC, Ares Partners HoldCo LLC and Ares Management GP LLC, the date of the last available Schedule 13D filed by such persons with the SEC. Such persons’ business address is 2000 Avenue of the Stars, 12th Floor, Los Angeles, California 90067. Our Series A convertible preferred shares will be convertible at the option of the holders of such shares at any time after the closing of the issuance into Class A common shares at an initial conversion rate of 73.5402 Class A common shares for each Series A convertible preferred share, subject to adjustment as provided in the certificate of designations of such Series A convertible preferred shares, which represents an initial conversion price of approximately US$13.60 per Class A common share. For further information, see “Item 5. Operating and Financial Review and Prospects—B. Liquidity and Capital Resources—Series A Convertible Preferred Shares” and note 14(i) to our audited consolidated financial statements included elsewhere in this annual report. |
| (4) | Based on a statement on Schedule 13G jointly filed on February 14, 2024 by Samlyn Capital, LLC, Samlyn, LP and Robert Pohly, the date of the last available Schedule 13G filed by such persons with the SEC. Such persons’ business address is 500 Park Avenue, 2nd Floor, New York, New York 10022. |
| (5) | Based on a statement on Schedule 13G jointly filed on February 7, 2024 by Adage Capital Partners, L.P., Adage Capital Partners GP, L.L.C., Adage Capital Management, L.P, Robert Atchinson and Phillip Gross, the date of the last available Schedule 13G filed by such persons with the SEC. Such persons’ business address is 200 Clarendon Street, 52nd Floor, Boston, Massachusetts 02116. |
| (6) | On February 8, 2024, SPX Gestão de Recursos Ltda. filed a statement on Schedule 13G stating that as of January 5, 2024, it held 2,487,422 Class A common shares, which would represent 6.3% of the total number of outstanding Class A common shares and 1.3% of total voting power as of December 31, 2023. Such statement is the last available Schedule 13G filed by such person with the SEC, and no previous Schedule 13G had been filed by such person with the SEC; accordingly, we are unable to asset such person’s beneficial ownership of our shares as of December 31, 2023. Such person’s business address is Rua Humaita, 275, 5th floor, Rio de Janeiro, Rio de Janeiro 22261-005, Brazil. |
| (7) | Includes all shareholders of Vinci Partners Brazil prior to our IPO that are not directors or executive officers of Vinci Partners. |
| (8) | Does not include (i) 3,134,771 Class A common shares held in treasury., and (ii) the 7,354,020 Class A common shares beneficially owned by Ares, which would result from the conversion of its Series A convertible preferred shares as described in footnote (3) above. |
143
Table of Contents
Existing Shareholders’ Agreements
Liquidity Restrictions on Pre-IPO Quotaholders
The quotaholders of Vinci Partners Brazil prior to the Contribution agreed to certain liquidity restrictions in respect of the Class A common shares and Class B common shares that they received in exchange for the Contribution, or Liquidity Restrictions. These Liquidity Restrictions consist primarily of volume limitations on their ability to sell their common shares, with a restriction on any sales of common shares through the second anniversary of the date of the IPO, with a portion of such holders’ common shares available for sale beginning on the second anniversary of the date of the IPO, with full liquidity rights to the common shares upon the fifth anniversary of the date of the IPO, provided, however, that in no event shall aggregate sales by all such holders of their common shares during any six-month period exceed 5% of our outstanding share capital during such six-month period.
Voting Agreement
Pursuant to the securities purchase agreement governing the Ares investment, we agreed to appoint a representative of Ares Investments Holdings LLC, or AIH, designated by AIH, to serve as a director on our board of directors, and a representative of AIH to serve as a board observer. On October 26, 2023, we and Gilberto Sayão da Silva entered into a voting agreement pursuant to which Mr. Sayão agreed to vote in favor of the nomination and appointment of the Ares board member. Ares is an express third-party beneficiary of the representations, warranties and covenants of such voting agreement and is entitled to enforce the terms thereof, including any rights or remedies hereunder, as if Ares was an original party thereto.
| B. | Related Party Transactions |
Related Person Transaction Policy
Our related person transaction policy states that any related person transaction must be approved or ratified by our audit committee, board of directors or a designated committee thereof. In determining whether to approve or ratify a transaction with a related person, our audit committee, board of directors or the designated committee will consider all relevant facts and circumstances, including, without limitation, the commercial reasonableness of the terms, of the transaction the benefit and perceived benefit, or lack thereof, to us, opportunity costs of alternate transaction, the materiality and character of the related person’s direct or indirect interest and the actual or apparent conflict of interest of the related person. Our audit committee, board of directors or the designated committee will not approve or ratify a related person transaction unless it has determined that, upon consideration of all relevant information, such transaction is in, or not inconsistent with, our best interests and the best interests of our shareholders.
Indemnification Agreements
We have entered into indemnification agreements with our directors and executive officers. The indemnification agreements will, and our Articles of Association do, require us to indemnify our directors and executive officers to the fullest extent permitted by law.
Receivables from Related Parties
We paid refundable expenses for non-operational related companies. As of December 31, 2023 and 2022, we had receivables from these companies in the amount of R$4.0 thousand and R$0.3 million, respectively.
Employees Loans
We advanced payments to our employees, in which the amount is rated at the CDI Rate, in the amount of R$5.5 million as of December 31, 2023, compared to R$6.4 million as of December 31, 2022.
144
Table of Contents
Receivables from Employees
We sold part of our treasury shares to employees. The amount will be received from January 31, 2025, in annual installments until January 31, 2029 and as restated by an inflation index. These receivables amounted to R$18.8 million as of December 31, 2023.
| C. | Interests of Experts and Counsel |
Not applicable.
ITEM 8. FINANCIAL INFORMATION
| A. | Consolidated Statements and Other Financial Information |
Financial Statements
See “Item 18. Financial Statements,” which contains our audited financial statements prepared in accordance with IFRS Accounting Standards.
Dividends and Dividend Policy
We intend to pay quarterly cash dividends on our common shares initially at an amount equal to at least 75% of our Distributable Earnings, or 100% of profit of the period, the lower of the two.
We can repurchase shares to reach the 75% of Distributable Earnings distribution if 100% of profit of the period is not enough to support a full cash distribution.
We do not have a legal obligation to pay a quarterly dividend or dividends at any specified rate or at all. Any declaration of dividends will be at the discretion of our board of directors and will depend on our financial condition, earnings, cash needs, regulatory constraints, capital requirements (including requirements of our subsidiaries and the ability of our subsidiaries to pay dividends to us) and any other factors that our board of directors deems relevant in making such a determination. Therefore, there can be no assurance that we will pay any dividends to holders of our common shares, or as to the amount of any such dividends.
In 2023, 2022 and 2021, we paid dividends totaling R$190.1 million, R$211.3 million and R$256.0 million, respectively. In 2023, we declared dividends per share related to earnings through the period ended September 30, 2023 in the amount of US$8.7 million for the first quarter of 2023, US$10.8 million for the second quarter of 2023 and US$9.1 million for the third quarter of 2023, totaling US$28.6 million, or R$141.5 million, which was entirely paid as of December 31, 2023. During the first quarter of 2024, we declared dividends per share in the amount of US$10.8 million for the fourth quarter of 2023, or R$53.3 million, which was entirely paid on March 7, 2024. See also “Item 5. Operating and Financial Review and Prospects—Factors Affecting the Comparability of Our Results of Operations” regarding our historical practice for distributing dividends to our partners.
In the year ended December 31, 2023, holders of the Series A convertible preferred shares received dividends in cash amounting to US$1.4 million (R$ 7.0 million), which were paid on January 1, 2024.
Certain Cayman Islands and Brazilian Legal Requirements Related to Dividends
Under the Companies Act and our Articles of Association, a Cayman Islands company may pay a dividend out of either its profit or share premium account, but a dividend may not be paid if this would result in the company being unable to pay its debts as they fall due in the ordinary course of business. According to our Articles of Association, dividends can be declared and paid out of funds lawfully available to us, which include the share premium account. Dividends, if any, would be paid in proportion to the number of common shares a shareholder holds. For further information, see “Item 10. Additional Information—E. Taxation—Cayman Islands Tax Considerations.”
Additionally, please refer to “Item 3. Key Information—D. Risk Factors—Certain Risks Relating to Our Business and Industry—Our holding company structure makes us dependent on the operations of our subsidiaries.”
145
Table of Contents
Our ability to pay dividends is directly related to positive and distributable net results from our subsidiaries. We depend on dividend distributions by our subsidiaries, and we may be adversely affected if the performance of our subsidiaries is not positive. If, for any legal reasons due to new laws or bilateral agreements between countries, they are unable to pay dividends to Cayman Islands companies, or if a Cayman Islands company becomes incapable of receiving them, we may not be able to make any dividend payments in the future.
Legal Proceedings
From time to time, we are involved in disputes that arise in the ordinary course of our business. Any claims against us, whether meritorious or not, can be time consuming, result in costly litigation, require significant management time and result in the diversion of significant operational resources.
We are subject to a number of judicial and administrative proceedings in the Brazilian court systems, including civil, labor and tax law and social security claims and other proceedings, which we believe are common and incidental to business operations in Brazil in general. We recognize provisions for legal proceedings in our financial statements, in accordance with accounting rules, when we are advised by independent outside counsel that (1) it is probable that an outflow of resources will be required to settle the obligation; and (2) a reliable estimate can be made of the amount of the obligation. The assessment of the likelihood of loss includes analysis by outside counsel of available evidence, the hierarchy of laws, available case law, recent court rulings and their relevance in the legal system. Our provisions for probable losses arising from these matters are estimated and periodically adjusted by management. In making these adjustments our management relies on the opinions of our external legal advisors.
As of December 31, 2023, we have not recorded any provisions in our audited consolidated financial statements as we are not aware of any legal proceedings for which we believe a loss is probable in accordance with accounting rules. However, legal proceedings are inherently unpredictable and subject to significant uncertainties. If one or more cases were to result in a judgment against us in any reporting period for amounts that exceeded our management’s expectations, the impact on our results of operations or financial condition for that reporting period could be material. See “Item 3. Key Information—D. Risk Factors—Certain Risks Relating to Our Business and Industry—The costs and effects of pending and future litigation, investigations or similar matters, or adverse facts and developments related thereto, could materially affect our business, financial position and results of operations.”
For further information, see note 23 to our audited consolidated financial statements.
Civil Matters
The civil claims to which we are a party generally relate to consumer claims, including those related to portfolio management. We believe these proceedings are unlikely to have a material adverse impact, individually, or in the aggregate, on our results of operations or financial condition.
As of December 31, 2023, we were not aware of any legal proceedings of a civil nature for which we believe a loss is probable in accordance with applicable accounting rules.
Labor Matters
The labor claims to which we are a party are typically filed by former employees or third-party employees seeking our joint and/or subsidiary liability for the acts of our suppliers, portfolio companies, and service providers, and generally relate to alleged unpaid labor benefits. We believe these proceedings are unlikely to have a material adverse impact, individually or in the aggregate, on our results of operations or financial condition.
As of December 31, 2023, we were party to seven labor-related judicial and administrative proceedings though we have not recorded any provisions in our audited consolidated financial statements as we are not aware of any legal proceedings for labor-related matters for which we believe a loss is probable in accordance with accounting rules. Out of those seven proceedings, we were party to three labor lawsuits totaling R$0.8 million, where the likelihood of loss has been assessed by our management as possible based on the opinion of our external legal advisors and for which we have not recorded a provision.
146
Table of Contents
Tax and Social Security Matters
As of December 31, 2023, we were party to three administrative proceedings and judicial tax and social security proceedings, which amounted to a total of R$22.1 million, where the likelihood of loss has been assessed by our management as possible based on the opinion of our external legal advisors and for which we have not recorded a provision. The main proceeding was filed in 2018 to charge debts related to IRPJ/CSLL/PIS/COFINS for the 2013 fiscal year, and amounted to a R$18.2 million payment, which already corresponds to the principal amount plus the fines and interest as of December 31, 2023. The other proceedings relate to social security contributions on profit sharing payments to employees made in 2011 and ISS taxes levied on services rendered to investment funds located abroad. We believe these proceedings are unlikely to have a material adverse impact, individually or in the aggregate, on our results of operations or financial condition.
We have not recorded any provisions in our audited consolidated financial statements as we are not aware of any legal proceedings related to tax and social security matters for which we believe a loss is probable in accordance with accounting rules.
| B. | Significant Changes |
Except as disclosed elsewhere in this annual report, we have not experienced any significant change since the date of our audited consolidated financial statements included in this annual report.
ITEM 9. THE OFFER AND LISTING
| A. | Offering and Listing Details |
In January 2021, we completed our IPO. Our common shares have been listed on the Nasdaq Global Select Market since January, 2021 under the symbol “VINP.”
| B. | Plan of Distribution |
Not applicable.
| C. | Markets |
For a description of our publicly traded common shares, see “—A. Offering and listing details.”
| D. | Selling Shareholders |
Not applicable.
| E. | Dilution |
Not applicable.
| F. | Expenses of the Issue |
Not applicable.
ITEM 10. ADDITIONAL INFORMATION
| A. | Share Capital |
Not applicable.
147
Table of Contents
| B. | Memorandum and Articles of Association |
General
Vinci Partners Investments Ltd. was incorporated on September 21, 2020, as a Cayman Islands exempted company with limited liability duly registered with the Cayman Islands Registrar of Companies. Our corporate purposes are unrestricted and we have the authority to carry out any object not prohibited by any law as provided by Section 7(4) of the Companies Act.
Our affairs are governed principally by: (1) Articles of Association; (2) the Companies Act; and (3) the common law of the Cayman Islands. As provided in our Articles of Association, subject to Cayman Islands law, we have full capacity to carry on or undertake any business or activity, do any act or enter into any transaction, and we have, for such purposes, full rights, powers and privileges. Our registered office is c/o Harneys Fiduciary (Cayman) Limited, P.O. Box 10240, Grand Cayman, KY1-1002, Cayman Islands.
Our Articles of Association authorize the issuance of up to 500,000,000 Class A common shares, 250,000,000 Class B common shares (which may be converted into Class A common shares in the manner contemplated in our Articles of Association) and 250,000,000 shares of such class or classes (howsoever designated) and having the rights as our board of directors may determine from time to time in accordance with Article 4 of our Articles of Association. As of December 31, 2023, we had 39,312,578 Class A common shares and 14,466,239 Class B common shares of our authorized share capital issued and outstanding. In addition, we had 100,000 Series A convertible preferred shares of our authorized share capital issued and outstanding.
Our Class A common shares have been approved for listing on the Nasdaq under the symbol “VINP.”
The following is a summary of the material provisions of our authorized share capital and our Articles of Association.
Share Capital
The Articles of Association authorize two classes of common shares: Class A common shares, which are entitled to one vote per share and Class B common shares, which are entitled to 10 votes per share and to maintain a proportional ownership interest in the event that additional Class A common shares are issued. A holder of Class B common shares may convert Class B common shares at any time into Class A common shares on a share-for-share basis. The rights of the two classes of common shares are otherwise identical, except as described below. See “—Anti-Takeover Provisions in our Articles of Association—Two Classes of Common Shares.”
At the date of this annual report, our total authorized share capital is US$50,000, divided into 1,000,000,000 shares par value US$0.00005 each, of which:
| • | 500,000,000 shares are designated as Class A common shares; |
| • | 250,000,000 shares are designated as Class B common shares (which may be converted into Class A common shares in the manner contemplated in our Articles of Association); |
| • | 249,900,000 shares are as yet undesignated and shall have the rights as our board of directors may determine from time to time in accordance with Article 4 of our Articles of Association; and |
| • | 100,000 shares that are designed as Series A convertible preferred shares (having previously constituted shares that were undesignated by class and having been so designated by our board of directors in accordance with Article 4 of our Articles of Association). |
As of December 31, 2023, we had a total issued share capital of US$2,845.68, divided into 53,778,817 common shares. Those common shares were divided into 39,312,578 Class A common shares and 14,466,239 Class B common shares. In addition, we had 100,000 Series A convertible preferred shares of our authorized share capital issued and outstanding.
148
Table of Contents
Treasury Stock
As of December 31, 2023, Vinci Partners had 3,134,771 Class A common shares in treasury.
Issuance of Shares
Except as expressly provided in Vinci Partners’ Articles of Association, Vinci Partners’ board of directors has general and unconditional authority to allot, grant options over, offer or otherwise deal with or dispose of any unissued shares in the company’s capital without the approval of our shareholders (whether forming part of the original or any increased share capital), either at a premium or at par, with or without preferred, deferred or other special rights or restrictions, whether in regard to dividend, voting, return of capital or otherwise and to such persons, on such terms and conditions, and at such times as the directors may decide, but so that no share shall be issued at a discount to par, except in accordance with the provisions of the Companies Act. In accordance with its Articles of Association, Vinci Partners shall not issue bearer shares.
Vinci Partners’ Articles of Association provide that at any time that there are Class A common shares in issue, additional Class B common shares may only be issued pursuant to (1) a share split, subdivision of shares or similar transaction or where a dividend or other distribution is paid by the issue of shares or rights to acquire shares or following capitalization of profits; (2) a statutory amalgamation, merger, consolidation, arrangement or other business combination involving the issuance of Class B common shares as full or partial consideration; or (3) an issuance of Class A common shares, whereby a holder of the Class B common shares is entitled to purchase a number of Class B common shares that would allow such holder to maintain its proportional ownership interests in Vinci Partners (following an offer by Vinci Partners to each holder of Class B common shares to issue to such holder, upon the same economic terms and at the same price, such number of Class B common shares as would ensure such holder may maintain a proportional ownership interest in Vinci Partners pursuant to Vinci Partners’ Articles of Association). In light of: (a) the above provisions; (b) the fact that future transfers by holders of Class B common shares will generally result in those shares converting to Class A common shares, subject to limited exceptions as provided in the Articles of Association; and (c) the ten-to-one voting ratio between our Class B common shares and Class A common shares, the holder of our Class B common shares will continue to maintain control of all matters requiring shareholder approval. This concentration of ownership and voting power will limit or preclude your ability to influence corporate matters for the foreseeable future. For more information see “—Preemptive or Similar Rights.”
Vinci Partners’ Articles of Association also provide that the issuance of non-voting common shares requires the affirmative vote of a majority of the of then-outstanding Class A common shares.
Fiscal Year
Vinci Partners’ fiscal year begins on January 1 of each year and ends on December 31 of the same year.
Voting Rights
The holders of the Class A common shares and Class B common shares have identical rights, except that (1) a holder of Class B common shares is entitled to 10 votes per share, whereas holders of Class A common shares are entitled to one vote per share; (2) Class B common shares have certain conversion rights; and (3) a holder of Class B common shares is entitled to maintain a proportional ownership interest in the event that additional Class A common shares are issued. For more information see “—Preemptive or Similar Rights” and “—Conversion.” The holders of Class A common shares and Class B common shares vote together as a single class on all matters (including the election of directors) submitted to a vote of shareholders, except as provided below and as otherwise required by law.
Vinci Partners’ Articles of Association provide as follows regarding the respective rights of holders of Class A common shares and Class B common shares:
| (1) | Class consents from the holders of Class A common shares and Class B common shares, as applicable, shall be required for any variation to the rights attached to their respective class of shares; however, the Directors may treat the two classes of shares as forming one class if they consider that both such classes would be affected in the same way by the proposal; |
149
Table of Contents
| (2) | the rights conferred on holders of Class A common shares shall not be deemed to be varied by the creation or issue of further Class B common shares and vice versa; and |
| (3) | the rights attaching to the Class A common shares and the Class B common shares shall not be deemed to be varied by the creation or issue of shares with preferred or other rights, including, without limitation, shares with enhanced or weighted voting rights. |
As set forth in the Articles of Association, the holders of Class A common shares and Class B common shares, respectively, do not have the right to vote separately if the number of authorized shares of such class is increased or decreased. Rather, the number of authorized Class A common shares and Class B common shares may be increased or decreased (but not below the number of shares of such class then outstanding) by the affirmative vote of the holders of a majority of the voting power of the issued and outstanding Class A common shares and Class B common shares, voting together in a general meeting.
Holders of our Series A Preferred Shares will not have the right to receive notice of, attend and/or vote at a general meeting of the Company except those described in the Articles of Association, in the certificate of designations or as otherwise from time to time specifically required by the Companies Act. Notwithstanding the foregoing, our Series A Preferred Shares shall be entitled to have the right to receive notice of, attend and/or vote at a general meeting, on an as-converted basis, with holders of our Class A Common Shares on all matters submitted to a vote of the holders of Class A Common Shares, except where a separate class vote of the common shareholders is required by the Companies Act. In addition, so long as any Series A Preferred Shares are outstanding, in addition to any other vote or consent of shareholders required by law or by the Articles of Association, the affirmative vote or consent of the holders of at least a majority of the issued and outstanding Series A Preferred Shares, voting as a single class, given in person or by proxy, either in writing without a meeting or by vote at a separate general meeting of the holders of the Series A Preferred Shares called for the purpose, shall be necessary for effecting or validating certain actions set forth in the certificate of designations, whether or not such approval is required pursuant to the Companies Act, including (1) to amend our organizational documents in a manner that would have an adverse effect on the Series A convertible preferred shares; and (2) to issue securities that are senior to, or equal in priority with, the Series A convertible preferred shares
Preemptive or Similar Rights
The Class A common shares and Class B common shares are not entitled to preemptive rights upon transfer and are not subject to conversion (except as described below under “—Conversion”), redemption or sinking fund provisions.
The Class B common shares are entitled to maintain a proportional ownership interest in the event that additional Class A common shares are issued. As such, except for certain exceptions, if Vinci Partners issues Class A common shares, it must first make an offer to the holders of Class B common shares to issue to such holder on the same economic terms such number of Class B common shares as would ensure such holder may maintain a proportional ownership interest in Vinci Partners. This right to maintain a proportional ownership interest may be waived by holders of Class B common shares.
Conversion
The outstanding Class B common shares are convertible at any time as follows: (1) at the option of the holder, a Class B common share may be converted at any time into one Class A common share or (2) upon the election of the holders of a majority of the then outstanding Class B common shares, all outstanding Class B common shares may be converted into a like number of Class A common shares. In addition, each Class B common share will convert automatically into one Class A common share upon (1) any transfer, whether or not for value, except for certain transfers described in the Articles of Association, including transfers to partnerships, corporations and other entities controlled by Mr. Sayão da Silva and (2) the death or permanent disability of Mr. Sayão da Silva. Furthermore, each Class B common share will convert automatically into one Class A common share and no Class B common shares will be issued thereafter if, at any time, the total number of the issued and outstanding Class B common shares is less than 10% of the total aggregate number of common shares outstanding.
150
Table of Contents
No class of Vinci Partners’ common shares may be subdivided or combined unless the other class of common shares is concurrently subdivided or combined in the same proportion and in the same manner.
Equal Status
Except as expressly provided in Vinci Partners’ Articles of Association, Class A common shares and Class B common shares have the same rights and privileges and rank equally, share ratably and are identical in all respects as to all matters. In the event of any merger, consolidation, scheme, arrangement or other business combination requiring the approval of our shareholders entitled to vote thereon (whether or not Vinci Partners is the surviving entity), the holders of Class A common shares shall have the right to receive, or the right to elect to receive, the same form of consideration as the holders of Class B common shares, and the holders of Class A common shares shall have the right to receive, or the right to elect to receive, at least the same amount of consideration on a per share basis as the holders of Class B common shares. In the event of any (1) tender or exchange offer to acquire any Class A common shares or Class B common shares by any third party pursuant to an agreement to which Vinci Partners is a party, or (2) tender or exchange offer by Vinci Partners to acquire any Class A common shares or Class B common shares, the holders of Class A common shares shall have the right to receive, or the right to elect to receive, the same form of consideration as the holders of Class B common shares, and the holders of Class A common shares shall have the right to receive, or the right to elect to receive, at least the same amount of consideration on a per share basis as the holders of Class B common shares.
Record Dates
For the purpose of determining shareholders entitled to notice of, or to vote at, any general meeting of shareholders or any adjournment thereof, or shareholders entitled to receive dividend or other distribution payments, or in order to make a determination of shareholders for any other purpose, Vinci Partners’ board of directors may set a record date which shall not exceed forty (40) clear days prior to the date where the determination will be made.
General Meetings of Shareholders
As a condition of admission to a shareholders’ meeting, a shareholder must be duly registered as a shareholder of Vinci Partners at the applicable record date for that meeting and, in order to vote, all calls or installments then payable by such shareholder to Vinci Partners in respect of the shares that such shareholder holds must have been paid.
Subject to any special rights or restrictions as to voting then attached to any shares, at any general meeting every shareholder who is present in person or by proxy (or, in the case of a shareholder being a corporation, by its duly authorized representative not being himself or herself a shareholder entitled to vote) shall have one vote per Class A common share and 10 votes per Class B common share.
As a Cayman Islands exempted company, Vinci Partners is not obliged by the Companies Act to call annual general meetings; however, the Articles of Association provide that in each year the company will hold an annual general meeting of shareholders, at a time determined by the board of directors. For the annual general meeting of shareholders, the agenda will include, among other things, the presentation of the annual accounts and the report of the directors. In addition, the agenda for an annual general meeting of shareholders will only include such items as have been included therein by the board of directors.
Also, Vinci Partners may, but is not required to (unless required by the laws of the Cayman Islands), hold other extraordinary general meetings during the year. General meetings of shareholders are generally expected to take place in Rio de Janeiro, Brazil, but may be held elsewhere if the directors so decide.
The Companies Act provides shareholders a limited right to request a general meeting, and does not provide shareholders with any right to put any proposal before a general meeting in default of a company’s Articles of Association. However, these rights may be provided in a company’s Articles of Association. Vinci Partners’ Articles of Association provide that upon the requisition of one or more shareholders representing not less than one-third of the voting rights entitled to vote at general meetings, the board will convene an extraordinary general meeting and put the resolutions so requisitioned to a vote at such meeting. The Articles of Association provide no other right to put any proposals before annual general meetings or extraordinary general meetings.
151
Table of Contents
Subject to regulatory requirements, the annual general meeting and any extraordinary general meetings must be called by not less than ten (10) clear days’ notice prior to the relevant shareholders meeting and convened by a notice discussed below. Alternatively, upon the prior consent of all holders entitled to receive notice, with regards to the annual general meeting, and the holders of 95% in par value of the shares entitled to attend and vote at an extraordinary general meeting, that meeting may be convened by a shorter notice and in a manner deemed appropriate by those holders.
Vinci Partners will give notice of each general meeting of shareholders by publication on its website and in any other manner that it may be required to follow in order to comply with Cayman Islands law, Nasdaq and SEC requirements. The holders of registered shares may be given notice of a shareholders’ meeting by means of letters sent to the addresses of those shareholders as registered in our shareholders’ register, or, subject to certain statutory requirements, by electronic means.
Holders whose shares are registered in the name of DTC or its nominee, which we expect will be the case for all holders of Class A common shares, will not be a shareholder or member of the company and must rely on the procedures of DTC regarding notice of shareholders’ meetings and the exercise of rights of a holder of the Class A common shares.
A quorum for a general meeting consists of any one or more persons holding or representing by proxy not less than one-third of the aggregate voting power of all shares in issue and entitled to vote upon the business to be transacted.
A resolution put to a vote at a general meeting shall be decided on a poll. An ordinary resolution to be passed by the shareholders at a general meeting requires the affirmative vote of a simple majority of the votes cast by, or on behalf of, the shareholders entitled to vote, present in person or by proxy and voting at the meeting. A special resolution requires the affirmative vote on a poll of no less than two-thirds of the votes cast by the shareholders entitled to vote who are present in person or by proxy at a general meeting. Both ordinary resolutions and special resolutions may also be passed by a unanimous written resolution signed by all the shareholders of our Company, as permitted by the Companies Act and our Articles of Association.
Pursuant to Vinci Partners’ Articles of Association, general meetings of shareholders are to be chaired by the chairman of our board of directors or in his absence the vice-chairman of the board of directors. If the chairman or vice-chairman of our board of directors is absent, the directors present at the meeting shall appoint one of them to be chairman of the general meeting. If neither the chairman nor another director is present at the general meeting within 15 minutes after the time appointed for holding the meeting, the shareholders present in person or by proxy and entitled to vote may elect any one of the shareholders to be chairman. The order of business at each meeting shall be determined by the chairman of the meeting, and he or she shall have the right and authority to prescribe such rules, regulations and procedures and to do all such acts and things as are necessary or desirable for the proper conduct of the meeting, including, without limitation, the establishment of procedures for the maintenance of order and safety, limitations on the time allotted to questions or comments on the affairs of the Company, restrictions on entry to such meeting after the time prescribed for the commencement thereof, and the opening and closing of the polls.
Liquidation Rights
If Vinci Partners is voluntarily wound up, the liquidator, after taking into account and giving effect to the rights of preferred and secured creditors and to any agreement between Vinci Partners and any creditors that the claims of such creditors shall be subordinated or otherwise deferred to the claims of any other creditors and to any contractual rights of set-off or netting of claims between Vinci Partners and any person or persons (including without limitation any bilateral or any multi-lateral set-off or netting arrangements between the company and any person or persons) and subject to any agreement between Vinci Partners and any person or persons to waive or limit the same, shall apply Vinci Partners’ property in satisfaction of its liabilities pari passu and subject thereto shall distribute the property amongst the shareholders according to their rights and interests in Vinci Partners.
152
Table of Contents
Changes to Capital
Pursuant to the Articles of Association, Vinci Partners may from time to time by ordinary resolution:
| • | increase its share capital by such sum, to be divided into shares of such amount, as the resolution shall prescribe; |
| • | consolidate and divide all or any of its share capital into shares of a larger amount than its existing shares; |
| • | convert all or any of its paid-up shares into stock and reconvert that stock into paid up shares of any denomination; |
| • | subdivide its existing shares or any of them into shares of a smaller amount; provided that in the subdivision the proportion between the amount paid and the amount, if any, unpaid on each reduced share shall be the same as it was in the case of the share from which the reduced share is derived; or |
| • | cancel any shares which, at the date of the passing of the resolution, have not been taken or agreed to be taken by any person and diminish the amount of its share capital by the amount of the shares so cancelled. |
Vinci Partners’ shareholders may by special resolution, subject to confirmation by the Grand Court of the Cayman Islands on an application by the Company for an order confirming such reduction, reduce its share capital or any capital redemption reserve in any manner permitted by law.
In addition, subject to the provisions of the Companies Act and our Articles of Association, Vinci Partners may:
| • | issue shares on terms that they are to be redeemed or are liable to be redeemed; |
| • | purchase its own shares (including any redeemable shares); and |
| • | make a payment in respect of the redemption or purchase of its own shares in any manner authorized by the Companies Act, including out of its own capital. |
Transfer of Shares
Subject to any applicable restrictions set forth in the Articles of Association, any shareholder of Vinci Partners may transfer all or any of his or her common shares by an instrument of transfer in the usual or common form or in the form prescribed by the Nasdaq or any other form approved by the Company’s board of directors.
Our Class A common shares are traded on the Nasdaq in book-entry form and may be transferred in accordance with Vinci Partners’ Articles of Association and Nasdaq’s rules and regulations.
However, Vinci Partners’ board of directors may, in its absolute discretion, decline to register any transfer of any common share which is either not fully paid up to a person of whom it does not approve or is issued under any share incentive scheme for employees which contains a transfer restriction that is still applicable to such common share. The board of directors may also decline to register any transfer of any common share unless:
| • | a fee of such maximum sum as the Nasdaq may determine to be payable or such lesser sum as the board of directors may from time to time require is paid to Vinci Partners in respect thereof; |
| • | the instrument of transfer is lodged with Vinci Partners, accompanied by the certificate (if any) for the common shares to which it relates and such other evidence as our board of directors may reasonably require to show the right of the transferor to make the transfer; |
| • | the instrument of transfer is in respect of only one class of shares; |
| • | the instrument of transfer is properly stamped, if required; |
| • | the common shares transferred are free of any lien in favor of Vinci Partners; and |
153
Table of Contents
| • | in the case of a transfer to joint holders, the transfer is not to more than four joint holders. |
If the directors refuse to register a transfer, they are required, within two months after the date on which the instrument of transfer was lodged, to send to the transferee notice of such refusal.
Share Repurchase
The Companies Act and the Articles of Association permit Vinci Partners to purchase its own shares, subject to certain restrictions. The board of directors may only exercise this power on behalf of Vinci Partners, subject to the Companies Act, the Articles of Association and to any applicable requirements imposed from time to time by the SEC, the Nasdaq, or by any recognized stock exchange on which our securities are listed.
Dividends and Capitalization of Profits
We intend to pay quarterly cash dividends on our common shares initially at an amount equal to at least 75% of our Distributable Earnings, or 100% of profit of the period, the lower of the two. We can repurchase shares to reach the 75% of Distributable Earnings distribution if 100% of profit of the period are not enough to support a full cash distribution. Subject to the Companies Act, our board of directors may, from time to time, declare dividends (including interim dividends) to be paid to shareholders but no dividend shall be declared in excess of the amount recommended by the board of directors. Dividends may be declared and paid out of funds lawfully available to Vinci Partners. We do not have a legal obligation to pay a quarterly dividend or dividends at any specified rate or at all. Any declaration of dividends will be at the discretion of our board of directors and will depend on our financial condition, earnings, cash needs, regulatory constraints, capital requirements (including requirements of our subsidiaries and the ability of our subsidiaries to pay dividends to us) and any other factors that our board of directors deems relevant in making such a determination. Therefore, there can be no assurance that we will pay any dividends to holders of our common shares, or as to the amount of any such dividends. Except as otherwise provided by the rights attached to shares and the Articles of Association of Vinci Partners, all dividends shall be paid in proportion to the number of Class A common shares or Class B common shares a shareholder holds at the date the dividend is declared (or such other date as may be set as a record date); but, (1) if any share is issued on terms providing that it shall rank for dividend as from a particular date, that share shall rank for dividend accordingly; and (2) where we have shares in issue which are not fully paid up (as to par value), we may pay dividends in proportion to the amounts paid up on each share.
The holders of Class A common shares and Class B common shares shall be entitled to share equally in any dividends that may be declared in respect of Vinci Partners’ common shares from time to time. In the event that a dividend is paid in the form of Class A common shares or Class B common shares, or rights to acquire Class A common shares or Class B common shares, (1) the holders of Class A common shares shall receive Class A common shares, or rights to acquire Class A common shares, as the case may be and (2) the holders of Class B common shares shall receive Class B common shares, or rights to acquire Class B common shares, as the case may be.
Appointment, Disqualification and Removal of Directors
Vinci Partners is managed by its board of directors. The Articles of Association provide that, unless otherwise determined by a special resolution of shareholders, the board of directors will be composed of four to eleven directors, with the number being determined by a majority of the directors then in office. There are no provisions relating to retirement of directors upon reaching any age limit. The Articles of Association also provide that, while Vinci Partners’ shares are admitted to trading on the Nasdaq, the board of directors must always comply with the residency and citizenship requirements of the U.S. securities laws applicable to foreign private issuers.
The Articles of Association provide that directors shall be elected by an ordinary resolution of our shareholders, which requires the affirmative vote of a simple majority of the votes cast on the resolution by the shareholders entitled to vote who are present, in person or by proxy, at the meeting. Each director shall be appointed and elected for such term as the resolution appointing him or her may determine or until his or her death, resignation or removal.
154
Table of Contents
Our directors are Gilberto Sayão da Silva, Alessandro Monteiro Morgado Horta, Paulo Fernando Carvalho de Oliveira, Lywal Salles Filho, Rogério Ladeira Furquim Werneck, Ana Marta Horta Veloso, Guilherme Stocco Filho, Sonia Consiglio and Peter Ogilvie. Rogério Ladeira Furquim Werneck, Ana Marta Horta Veloso, Guilherme Stocco Filho and Sonia Consiglio are “independent” as that term is defined under the applicable rules and regulations of the SEC and the listing standards of the Nasdaq.
Any vacancies on the board of directors that arise other than upon the removal of a director by resolution passed at a general meeting can be filled by the remaining directors (notwithstanding that they may constitute less than a quorum). Any such appointment shall be as an interim director to fill such vacancy until the next annual general meeting of shareholders.
Additions to the existing board (within the limits set pursuant to the Articles of Association) may be made by ordinary resolution of the shareholders.
Grounds for Removing a Director
A director may be removed with or without cause by ordinary resolution. The notice of general meeting must contain a statement of the intention to remove the director and must be served on the director not less than ten calendar days before the meeting. The director is entitled to attend the meeting and be heard on the motion for his removal.
The office of a director will be vacated automatically if he or she (1) becomes prohibited by law from being a director; (2) becomes bankrupt or makes an arrangement or composition with his creditors; (3) dies or is in the opinion of all his co-directors, incapable by reason of mental disorder of discharging his duties as director; (4) resigns his office by notice to us; or (5) has for more than six months been absent without permission of the directors from meetings of the board of directors held during that period, and the remaining directors resolve that his or her office be vacated.
Proceedings of the Board of Directors
The Articles of Association provide that Vinci Partners’ business is to be managed and conducted by the board of directors. The quorum necessary for the board meeting shall be a simple majority of the directors then in office (subject to there being a minimum of two directors present) and business at any meeting shall be decided by a majority of votes. In the case of an equality of votes, the chairman shall have a casting vote.
Subject to the provisions of the Articles of Association, the board of directors may regulate its proceedings as they determine is appropriate. Board meetings shall be held at least once every calendar quarter and shall take place either in São Paulo, Brazil or at such other place as the directors may determine.
Subject to the provisions of the Articles of Association, any directions given by ordinary resolution of the shareholders and the listing rules of the Nasdaq, the board of directors may from time to time at its discretion exercise all powers of Vinci Partners, including, subject to the Companies Act, the power to issue debentures, bonds and other securities of the company, whether outright or as collateral security for any debt, liability or obligation of our company or of any third party.
Inspection of Books and Records
Holders of Vinci Partners shares will have no general right under Cayman Islands law to inspect or obtain copies of the list of shareholders or corporate records of the Company. However, the board of directors may determine from time to time whether and to what extent Vinci Partners’ accounting records and books shall be open to inspection by shareholders who are not members of the board of directors. Notwithstanding the above, the Articles of Association provide shareholders with the right to receive annual financial statements. Such right to receive annual financial statements may be satisfied by publishing the same on the company’s website or filing such annual reports as we are required to file with the SEC.
Register of Shareholders
Our Class A common shares are held through DTC, and DTC or Cede & Co., as nominee for DTC, are recorded in the shareholders’ register as the holder of our Class A common shares.
155
Table of Contents
Under Cayman Islands law, Vinci Partners must keep a register of shareholders that includes:
| • | the names and addresses of the shareholders, a statement of the shares held by each member, and of the amount paid or agreed to be considered as paid, on the shares of each member; |
| • | the date on which the name of any person was entered on the register as a member; and |
| • | the date on which any person ceased to be a member. |
Under Cayman Islands law, the register of shareholders of Vinci Partners is prima facie evidence of the matters set out therein (i.e., the register of shareholders will raise a presumption of fact on the matters referred to above unless rebutted) and a shareholder registered in the register of shareholders is deemed as a matter of Cayman Islands law to have prima facie legal title to the shares as set against his or her name in the register of shareholders.
If the name of any person is incorrectly entered in or omitted from the register of shareholders, or if there is any default or unnecessary delay in entering on the register the fact of any person having ceased to be a shareholder of Vinci Partners, the person or member aggrieved (or any shareholder of Vinci Partners, or Vinci Partners itself) may apply to the Cayman Islands Grand Court for an order that the register be rectified, and the Court may either refuse such application or it may, if satisfied of the justice of the case, make an order for the rectification of the register.
Exempted Company
Vinci Partners is an exempted company with limited liability under the Companies Act. The Companies Act distinguishes between ordinary resident companies and exempted companies. Any company that is registered in the Cayman Islands but conducts business mainly outside of the Cayman Islands may apply to be registered as an exempted company. The requirements for an exempted company are essentially the same as for an ordinary company except for the exemptions and privileges listed below:
| • | an exempted company does not have to file an annual return of its shareholders with the Registrar of Companies; |
| • | an exempted company’s register of shareholders is not open to inspection; |
| • | an exempted company does not have to hold an annual general meeting; |
| • | an exempted company may obtain an undertaking against the imposition of any future taxation (such undertakings are usually given for 20 years in the first instance); |
| • | an exempted company may register by way of continuation in another jurisdiction and be deregistered in the Cayman Islands; |
| • | an exempted company may register as a limited duration company; and |
| • | an exempted company may register as a segregated portfolio company. |
“Limited liability” means that the liability of each shareholder is limited to the amount unpaid by the shareholder on the shares of the company (except in exceptional circumstances, such as involving fraud, the establishment of an agency relationship or an illegal or improper purpose or other circumstances in which a court may be prepared to pierce or lift the corporate veil).
We are subject to reporting and other informational requirements of the Exchange Act, as applicable to foreign private issuers. Except as otherwise disclosed in this annual report, we currently comply and intend to continue to comply with the Nasdaq rules in lieu of following home country practice.
156
Table of Contents
Anti-Takeover Provisions in our Articles of Association
Some provisions of the Articles of Association may discourage, delay or prevent a change in control of Vinci Partners or management that shareholders may consider favorable. In particular, the capital structure of Vinci Partners concentrates ownership of voting rights in the hands of Mr. Sayão da Silva. These provisions, which are summarized below, are expected to discourage coercive takeover practices and inadequate takeover bids. These provisions are also designed to encourage persons seeking to acquire control of Vinci Partners to first negotiate with the board of directors. However, these provisions could also have the effect of discouraging others from attempting hostile takeovers and, as a consequence, they may also inhibit temporary fluctuations in the market price of the Class A common shares that often result from actual or rumored hostile takeover attempts. These provisions may also have the effect of preventing changes in the management of Vinci Partners. It is possible that these provisions could make it more difficult to accomplish transactions that shareholders may otherwise deem to be in their best interests.
Two Classes of Common Shares
The Class B common shares of Vinci Partners are entitled to 10 votes per share, while the Class A common shares are entitled to one vote per share. Since Gilberto Sayão da Silva owns of all of the Class B common shares, Mr. Sayão da Silva currently has the ability to elect a majority of the directors and to determine the outcome of most matters submitted for a vote of shareholders. This concentrated voting control could discourage others from initiating any potential merger, takeover, or other change of control transaction that other shareholders may view as beneficial.
So long as Mr. Sayão da Silva has the ability to determine the outcome of most matters submitted to a vote of shareholders as well as the overall management and direction of Vinci Partners, third parties may be deterred in their willingness to make an unsolicited merger, takeover, or other change of control proposal, or to engage in a proxy contest for the election of directors. As a result, the fact that Vinci Partners has two classes of common shares may have the effect of depriving you as a holder of Class A common shares of an opportunity to sell your Class A common shares at a premium over prevailing market prices and make it more difficult to replace the directors and management of Vinci Partners. See “Item 3. Key Information—D. Risk Factors—Certain Risks Relating to Our Class A Common Shares and the Offering—Gilberto Sayão da Silva owns 100% of our outstanding Class B common shares, which represent approximately 75.6% of the voting power of our issued share capital, and controls all matters requiring shareholder approval. This concentration of ownership and voting power limits your ability to influence corporate matters.”
Preferred Shares
Vinci Partners’ board of directors is given wide powers to issue one or more classes or series of shares with preferred rights. Such preferences may include, for example, dividend rights, conversion rights, redemption privileges, enhanced voting powers and liquidation preferences.
Despite the anti-takeover provisions described above, under Cayman Islands law, Vinci Partners’ board of directors may only exercise the rights and powers granted to them under the Articles of Association, for what they believe in good faith to be in the best interests of the Company.
Protection of Non-Controlling Shareholders
The Grand Court of the Cayman Islands may, on the application of shareholders holding not less than one fifth of the shares of Vinci Partners in issue, appoint an inspector to examine the Company’s affairs and report thereon in a manner as the Grand Court shall direct.
Subject to the provisions of the Companies Act, any shareholder may petition the Grand Court of the Cayman Islands which may make a winding up order, if the court is of the opinion that this winding up is just and equitable.
Notwithstanding the U.S. securities laws and regulations that are applicable to Vinci Partners, general corporate claims against Vinci Partners by its shareholders must, as a general rule, be based on the general laws of contract or tort applicable in the Cayman Islands or their individual rights as shareholders as established by Vinci Partners’ Articles of Association.
157
Table of Contents
The Cayman Islands courts ordinarily would be expected to follow English case law precedents, which permit a minority shareholder to commence a representative action against Vinci Partners, or derivative actions in Vinci Partners’ name, to challenge (1) an act which is ultra vires or illegal; (2) an act which constitutes a fraud against the minority and the wrongdoers themselves control Vinci Partners; and (3) an irregularity in the passing of a resolution that requires a qualified (or special) majority.
Registration Rights and Restricted Shares
Although no shareholders of Vinci Partners have formal registration rights, they or entities controlled by them or their permitted transferees will, subject to the Liquidity Restrictions described in “Item 7. Major Shareholders and Related Party Transactions—A. Major Shareholders—Existing Shareholders’ Agreements—Liquidity Restrictions on Pre-IPO Quotaholders,” be able to sell their shares in the public market from time to time without registering them, subject to certain limitations on the timing, amount and method of those sales imposed by regulations promulgated by the SEC.
Principal Differences between Cayman Islands and U.S. Corporate Law The Companies Act was modelled originally after similar laws in England and Wales but does not follow subsequent statutory enactments in England and Wales. In addition, the Companies Act differs from laws applicable to U.S. corporations and their shareholders. Set forth below is a summary of the significant differences between the provisions of the Companies Act applicable to Vinci Partners and the laws applicable to companies incorporated in the United States and their shareholders.
Mergers and Similar Arrangements
The Companies Act permits mergers and consolidations between Cayman Islands companies and between Cayman Islands companies and non-Cayman Islands companies.
For these purposes, (a) “merger” means the merging of two or more constituent companies and the vesting of their undertaking, property and liabilities in one of such companies as the surviving company and (b) a “consolidation” means the combination of two or more constituent companies into a consolidated company and the vesting of the undertaking, property and liabilities of such companies in the consolidated company. In order to effect such a merger or consolidation, the directors of each constituent company must approve a written plan of merger or consolidation, which must then be authorized by (a) a special resolution of the shareholders of each constituent company; and (b) such other authorization, if any, as may be specified in such constituent company’s articles of association. The plan must be approved by the directors of each constituent company and filed with the Registrar of Companies together with a declaration that: (1) the solvency of the consolidated or surviving company; (2) the merger or consolidation is bona fide and not intended to defraud unsecured creditors of the constituent companies; (3) no petition or other similar proceeding has been filed and remains outstanding and no order or resolution to wind up the company in any jurisdiction; (4) no receiver, trustee, administrator or similar person has been appointed in any jurisdiction and is acting in respect of the constituent company, its affairs or property; (5) no scheme, order, compromise or similar arrangement has been entered into or made in any jurisdiction with creditors; (6) a list of the assets and liabilities of each constituent company; (7) the non-surviving constituent company has retired from any fiduciary office held or will do so; (8) the constituent company has complied with any requirements under the regulatory laws, where relevant; and (9) an undertaking that a copy of the certificate of merger or consolidation will be given to the members and creditors of each constituent company and published in the Cayman Islands Gazette.
Dissenting shareholders have the right to be paid the fair value of their shares (which, if not agreed between the parties, may be determined by the Cayman Islands court) if they follow the required procedures, subject to certain exceptions. Court approval is not required for a merger or consolidation which is effected in compliance with these statutory procedures.
In addition, there are statutory provisions that facilitate the reconstruction and amalgamation of companies; provided that the arrangement in question is approved by a majority in number of each class of shareholders and creditors with whom the arrangement is to be made, and who must in addition represent three-fourths in value of each such class of shareholders or creditors, as the case may be, that are present and voting either in person or by proxy at a meeting, or meetings convened for that purpose. The convening of the meetings and subsequently the arrangement must be sanctioned by the Grand Court of the Cayman Islands. While a dissenting shareholder would have the right to express to the court the view that the transaction should not be approved, the court can be expected to approve the arrangement if it satisfies itself that:
158
Table of Contents
| • | Vinci Partners is not proposing to act illegally or ultra vires and the statutory provisions as to majority vote have been complied with; |
| • | the shareholders have been fairly represented at the meeting in question; |
| • | the arrangement is such that may be reasonably approved by an intelligent and honest man of that class acting in respect of his interest; and |
| • | the arrangement is not one that would more properly be sanctioned under some other provision of the Companies Act or that would amount to a “fraud on the minority.” |
When a takeover offer is made and accepted by holders of 90.0% in value of the shares affected within four months, the offeror may, within a two-month period, require the holders of the remaining shares to transfer such shares on the terms of the offer. An objection may be made to the Grand Court of the Cayman Islands but is unlikely to succeed unless there is evidence of fraud, bad faith or collusion.
If the arrangement and reconstruction are thus approved, any dissenting shareholders would have no rights comparable to appraisal rights, which might otherwise ordinarily be available to dissenting shareholders of U.S. corporations and allow such dissenting shareholders to receive payment in cash for the judicially determined value of their shares.
Shareholders’ Suits
Class actions are not recognized in the Cayman Islands, but groups of shareholders with identical interests may bring representative proceedings, which are similar. However, a class action suit could nonetheless be brought in a U.S. court pursuant to an alleged violation of U.S. securities laws and regulations.
In principle, Vinci Partners itself would normally be the proper plaintiff and as a general rule, whilst a derivative action may be initiated by a minority shareholder on behalf of Vinci Partners in a Cayman Islands court, such shareholder will not be able to continue those proceedings without the permission of a Grand Court judge, who will only allow the action to continue if the shareholder can demonstrate that Vinci Partners has a good case against the Defendant, and that it is proper for the shareholder to continue the action rather than the Company’s board of directors. Examples of circumstances in which derivative actions would be permitted to continue are where:
| • | a company is acting or proposing to act illegally or beyond the scope of its authority; |
| • | the act complained of, although not beyond the scope of its authority, could be effected duly if authorized by more than a simple majority vote that has not been obtained; and |
| • | those who control the company are perpetrating a “fraud on the minority.” |
Corporate Governance
Cayman Islands law restricts transactions between a company and its directors unless there are provisions in the Articles of Association which provide a mechanism to alleviate possible conflicts of interest. Additionally, Cayman Islands law imposes on directors’ duties of care and skill and fiduciary duties to the companies which they serve. Under Vinci Partners’ Articles of Association, a director must disclose the nature and extent of his interest in any contract or arrangement, and following such disclosure and subject to any separate requirement under applicable law or the listing rules of the Nasdaq, and unless disqualified by the chairman of the relevant meeting, the interested director may vote in respect of any transaction or arrangement in which he or she is interested. The interested director shall be counted in the quorum at such meeting and the resolution may be passed by a majority of the directors present at the meeting.
Subject to the foregoing and our Articles of Association, our directors may exercise all the powers of Vinci Partners to vote compensation to themselves or any member of their body in the absence of an independent quorum. Our Articles of Association provide that, in the event a compensation committee is established, it shall be made up of such number of independent directors as is required from time to time by the Nasdaq rules (or as otherwise may be required by law).
159
Table of Contents
As a foreign private issuer, we are permitted to follow home country practice in lieu of certain Nasdaq corporate governance rules, subject to certain requirements. We currently rely, and will continue to rely, on the foreign private issuer exemption with respect to the following rules:
| • | Nasdaq Rule 5605(b), which requires that independent directors comprise a majority of a company’s board of directors. As allowed by the laws of the Cayman Islands, independent directors do not comprise a majority of our board of directors. |
| • | Nasdaq Rule 5605(e)(1), which requires that a company have a nominations committee comprised solely of “independent directors” as defined by Nasdaq. As allowed by the laws of the Cayman Islands, we do not have a nominations committee nor do we have any current intention to establish one. |
| • | Nasdaq Rule 5605(d) & (e), which require that compensation for our executive officers and selection of our director nominees be determined by a majority of independent directors. As allowed by the laws of the Cayman Islands, we do not have a nomination and corporate governance committee or remuneration committee nor do we have any current intention to establish either. |
| • | Nasdaq Rule 5635, which requires that a listed issuer obtain shareholder approval prior to an issuance of securities in connection with: (i) the acquisition of the stock or assets of another company; (ii) equity-based compensation of officers, directors, employees or consultants; (iii) a change of control; and (iv) transactions other than public offerings. Pursuant to the laws of the Cayman Islands and our Articles of Association, we are not required to obtain any such approval. |
Borrowing Powers
Vinci Partners’ directors may exercise all the powers of Vinci Partners to borrow money and to mortgage or charge its undertaking, property and assets (present and future) and uncalled capital or any part thereof and to issue debentures, debenture stock, mortgages, bonds and other such securities whether outright or as security for any debt, liability or obligation of Vinci Partners or of any third party. Such powers may be varied by a special resolution of shareholders (requiring a two-thirds majority vote of those shareholders attending and voting at a quorate meeting).
Indemnification of Directors and Executive Officers and Limitation of Liability
The Companies Act does not limit the extent to which a company’s articles of association may provide for indemnification of directors and officers, except to the extent that it may be held by the Cayman Islands courts to be contrary to public policy, such as to provide indemnification against civil fraud or the consequences of committing a crime. Vinci Partners’ Articles of Association provide that we shall indemnify and hold harmless our directors and officers against all actions, proceedings, costs, charges, expenses, losses, damages, liabilities, judgments, fines, settlements and other amounts incurred or sustained by such directors or officers, other than by reason of such person’s dishonesty, willful default or fraud, in or about the conduct of our company’s business or affairs (including as a result of any mistake of judgment) or in the execution or discharge of his duties, powers, authorities or discretions, including without prejudice to the generality of the foregoing, any costs, expenses, losses or liabilities incurred by such director or officer in defending (whether successfully or otherwise) any civil, criminal or other proceedings concerning Vinci Partners or our affairs in any court whether in the Cayman Islands or elsewhere. This standard of conduct is generally the same as permitted under the Delaware General Corporation Law for a Delaware corporation.
Insofar as indemnification for liabilities arising under the Securities Act may be permitted to Vinci Partners’ directors, officers or persons controlling the Company under the foregoing provisions, we have been informed that, in the opinion of the SEC, this indemnification is against public policy as expressed in the Securities Act and is therefore unenforceable.
160
Table of Contents
Directors’ Fiduciary Duties
As a matter of Cayman Islands law, a director of a Cayman Islands company is in the position of a fiduciary with respect to the company. Accordingly, directors owe fiduciary duties to their companies to act bona fide in what they consider to be the best interests of the company, to exercise their powers for the purposes for which they are conferred and not to place themselves in a position where there is a conflict between their personal interests and their duty to the company. Accordingly, a director owes a company a duty not to make a profit based on his or her position as director (unless the company permits him or her to do so) and a duty not to put himself or herself in a position where the interests of the company conflict with his or her personal interest or his or her duty to a third party. However, this obligation may be varied by the company’s articles of association, which may permit a director to vote on a matter in which he has a personal interest provided that he has disclosed that nature of his interest to the board of directors. Vinci Partners’ Articles of Association provides that a director must disclose the nature and extent of his or her interest in any contract or arrangement, and following such disclosure and subject to any separate requirement under applicable law or the listing rules of the Nasdaq, and unless disqualified by the chairman of the relevant meeting, such director may vote in respect of any transaction or arrangement in which he or she is interested and may be counted in the quorum at the meeting.
A director of a Cayman Islands company also owes to the company duties to exercise independent judgment in carrying out his functions and to exercise reasonable skill, care and diligence, which has both objective and subjective elements. Recent Cayman Islands case law confirmed that directors must exercise the care, skill and diligence that would be exercised by a reasonably diligent person having the general knowledge, skill and experience reasonably to be expected of a person acting as a director. Additionally, a director must exercise the knowledge, skill and experience which he or she actually possesses.
A general notice may be given to the board of directors to the effect that (1) the director is a member or officer of a specified company or firm and is to be regarded as interested in any contract or arrangement which may after the date of the notice be made with that company or firm; or (2) he or she is to be regarded as interested in any contract or arrangement which may after the date of the notice to the board of directors be made with a specified person who is connected with him or her, which will be deemed sufficient declaration of interest. This notice shall specify the nature of the interest in question. Following the disclosure being made pursuant to Vinci Partners’ Articles of Association and subject to any separate requirement under applicable law or the listing rules of the Nasdaq, and unless disqualified by the chairman of the relevant meeting, a director may vote in respect of any transaction or arrangement in which he or she is interested and may be counted in the quorum at the meeting.
In comparison, under Delaware corporate law, a director of a Delaware corporation has a fiduciary duty to the corporation and its shareholders. This duty has two components: the duty of care and the duty of loyalty. The duty of care requires that a director act in good faith, with the care that an ordinarily prudent person would exercise under similar circumstances. Under this duty, a director must inform himself or herself of, and disclose to shareholders, all material information reasonably available regarding a significant transaction. The duty of loyalty requires that a director act in a manner he or she reasonably believes to be in the best interests of the company. He or she must not use his or her corporate position for personal gain or advantage. This duty prohibits self-dealing by a director and mandates that the best interest of the corporation and its shareholders take precedence over any interest possessed by a director, officer or controlling shareholder and not shared by the shareholders generally. In general, actions of a director are presumed to have been made on an informed basis, in good faith and in the honest belief that the action taken was in the best interests of the company. However, this presumption may be rebutted by evidence of a breach of one of the fiduciary duties. Should such evidence be presented concerning a transaction by a director, a director must prove the procedural fairness of the transaction, and that the transaction was of fair value to the company.
Shareholder Proposals
Under the Delaware General Corporation Law, a shareholder has the right to put any proposal before the annual meeting of shareholders, provided it complies with the notice provisions in the governing documents. The Delaware General Corporation Law does not provide shareholders an express right to put any proposal before the annual meeting of shareholders, but Delaware corporations generally afford shareholders an opportunity to make proposals and nominations provided that they comply with the notice provisions in the certificate of incorporation or bylaws. A special meeting may be called by the board of directors or any other person authorized to do so in the governing documents, but shareholders may be precluded from calling special meetings.
161
Table of Contents
The Companies Act provides shareholders with only limited rights to requisition a general meeting, and does not provide shareholders with any right to put any proposal before a general meeting. However, these rights may be provided in a company’s articles of association. Vinci Partners’ Articles of Association provide that upon the requisition of one or more shareholders representing not less than one-third of the voting rights entitled to vote at general meetings, the board will convene an extraordinary general meeting and put the resolutions so requisitioned to a vote at such meeting. The Articles of Association provide no other right to put any proposals before annual general meetings or extraordinary general meetings.
Cumulative Voting
Under the Delaware General Corporation Law, cumulative voting for elections of directors is not permitted unless the corporation’s certificate of incorporation specifically provides for it. Cumulative voting potentially facilitates the representation of minority shareholders on a board of directors since it permits the minority shareholder to cast all the votes to which the shareholder is entitled on a single director, which increases the shareholder’s voting power with respect to electing such director. As permitted under Cayman Islands law, Vinci Partners’ Articles of Association do not provide for cumulative voting. As a result, the shareholders of Vinci Partners are not afforded any less protections or rights on this issue than shareholders of a Delaware corporation.
Removal of Directors
The office of a director shall be vacated automatically if, among other things, he or she (1) becomes prohibited by law from being a director; (2) becomes bankrupt or makes an arrangement or composition with his creditors; (3) dies or is, in the opinion of all his co-directors, incapable by reason of mental disorder of discharging his duties as director; (4) resigns his office by notice to us; or (5) has for more than six months been absent without permission of the directors from meetings of the board of directors held during that period, and the remaining directors resolve that his/her office be vacated.
Transaction with Interested Shareholders
The Delaware General Corporation Law provides that unless the corporation has specifically elected not to be governed by this statute, it is prohibited from engaging in certain business combinations with an “interested shareholder” for three years following the date that this person becomes an interested shareholder. An interested shareholder generally is a person or a group who or which owns or owned 15% or more of the target’s outstanding voting shares or who or which is an affiliate or associate of the corporation and owned 15% or more of the corporation’s outstanding voting shares within the past three years. This has the effect of limiting the ability of a potential acquirer to make a two-tiered bid for the target in which all shareholders would not be treated equally. The statute does not apply if, among other things, prior to the date on which the shareholder becomes an interested shareholder, the board of directors approves either the business combination or the transaction which resulted in the person becoming an interested shareholder. This encourages any potential acquirer of a Delaware corporation to negotiate the terms of any acquisition transaction with the target’s board of directors.
Cayman Islands law has no comparable statute. As a result, Vinci Partners cannot avail itself of the types of protections afforded by the Delaware business combination statute. However, although Cayman Islands law does not regulate transactions between a company and its significant shareholders, it does provide that the board of directors owe duties to ensure that these transactions are entered into bona fide in the best interests of the company and for a proper corporate purpose and, as noted above, a transaction may be subject to challenge if it has the effect of constituting a fraud on the minority shareholders.
Dissolution; Winding Up
Under the Delaware General Corporation Law, unless the board of directors approves the proposal to dissolve, dissolution must be approved by shareholders holding 100% of the total voting power of the corporation. If the dissolution is initiated by the board of directors it may be approved by a simple majority of the corporation’s outstanding shares. Delaware law allows a Delaware corporation to include in its certificate of incorporation a supermajority voting requirement in connection with dissolutions initiated by the board. Under Cayman Islands law, a company may be wound up by either an order of the courts of the Cayman Islands or by a special resolution of its members or, if the company resolves by ordinary resolution that it be wound up because it is unable to pay its debts as they fall due. The court has authority to order winding up in a number of specified circumstances including where it is, in the opinion of the court, just and equitable to do so.
162
Table of Contents
Under the Companies Act, Vinci Partners may be dissolved, liquidated or wound up by a special resolution of shareholders (requiring a two-thirds majority vote of those shareholders attending and voting at a quorate meeting). Vinci Partners’ Articles of Association also give its board of directors authority to petition the Cayman Islands Court to wind up Vinci Partners.
Variation of Rights of Shares
Under the Delaware General Corporation Law, a corporation may vary the rights of a class of shares with the approval of a majority of the outstanding shares of that class, unless the certificate of incorporation provides otherwise. Under Vinci Partners’ Articles of Association, if the share capital is divided into more than one class of shares, the rights attached to any class may only be varied with the written consent of the holders of two-thirds of the shares of that class or the sanction of a special resolution passed at a separate meeting of the holders of the shares of that class.
Also, except with respect to share capital (as described above), alterations to Vinci Partners’ Articles of Association may only be made by special resolution of shareholders (requiring a two-thirds majority vote of those shareholders attending and voting at a quorate meeting).
Amendment of Governing Documents
Under the Delaware General Corporation Law, a corporation’s certificate of incorporation may be amended only if adopted and declared advisable by the board of directors and approved by a majority of the outstanding shares entitled to vote, and the bylaws may be amended with the approval of a majority of the outstanding shares entitled to vote and may, if so provided in the certificate of incorporation, also be amended by the board of directors. Under Cayman Islands law, Vinci Partners’ Articles of Association generally (and save for certain amendments to share capital described in this section) may only be amended by special resolution of shareholders (requiring a two-thirds majority vote of those shareholders attending and voting at a quorate meeting).
Rights of Non-Resident or Foreign Shareholders
There are no limitations imposed by Vinci Partners’ Articles of Association on the rights of non-resident or foreign shareholders to hold or exercise voting rights on Vinci Partners’ shares. In addition, there are no provisions in the Articles of Association governing the ownership threshold above which shareholder ownership must be disclosed.
| C. | Material Contracts |
See “Item 7. Major Shareholders and Related Party Transactions—B. Related Party Transactions.” Except as otherwise disclosed in this annual report on Form 20-F (including the Exhibits), we are not currently, and have not been in the last two years, party to any material contract, other than contracts entered into in the ordinary course of business.
| D. | Exchange Controls |
The Cayman Islands currently has no exchange control restrictions.
| E. | Taxation |
The following summary contains a description of certain Cayman Islands and U.S. federal income tax consequences of the ownership and disposition of our Class A common shares. It does not purport to be a comprehensive description of all the tax considerations that may be relevant to a decision to hold the Class A common shares, is not applicable to all categories of investors, some of which may be subject to special rules, and does not address all of the Cayman Islands and U.S. federal income tax considerations applicable to any particular holder. The summary is based upon the tax laws of the Cayman Islands and regulations thereunder and upon the tax laws of the United States and regulations thereunder as of the date hereof, which are subject to change.
163
Table of Contents
Holders of our Class A common shares should consult their own tax advisors about the particular Cayman Islands and U.S. federal, state, local and other tax consequences to them of the ownership and disposition of our Class A common shares.
Cayman Islands Tax Considerations
The Cayman Islands laws currently levy no taxes on individuals or corporations based upon profits, income, gains or appreciation and there is no taxation in the nature of inheritance tax or estate duty or withholding tax applicable to us or to any holder of Class A common shares. There are no other taxes likely to be material to us levied by the government of the Cayman Islands except for stamp duties which may be applicable on instruments executed in or after execution brought within the jurisdiction of the Cayman Islands. No stamp duty is payable in the Cayman Islands on transfers of shares of Cayman Islands companies except those which hold interests in land in the Cayman Islands. The Cayman Islands is not party to any double tax treaties which are applicable to any payments made by or to our company. There are no exchange control regulations or currency restrictions in the Cayman Islands.
As a Cayman Islands exempted company with limited liability, we are entitled, upon application, to receive an undertaking as to tax concessions pursuant to Section 6 of the Tax Concessions Act (Revised) of the Cayman Islands. This undertaking would provide that, for a period of 20 years from the date of issue of the undertaking, no law thereafter enacted in the Cayman Islands imposing any taxes to be levied on profits, income, gains or appreciation will apply to us or our operations.
Payments of dividends and capital in respect of our Class A common shares will not be subject to taxation in the Cayman Islands and no withholding will be required on the payment of a dividend or capital to any holder of our Class A common shares, nor will gains derived from the disposal of our Class A common shares be subject to Cayman Islands income or corporation tax.
There is no income tax treaty or convention currently in effect between the United States and the Cayman Islands.
Material U.S. Federal Income Tax Considerations for U.S. Holders
The following is a description of the material U.S. federal income tax considerations to U.S. Holders (as defined below) of owning and disposing of Class A common shares, but it does not purport to be a comprehensive description of all tax considerations that may be relevant to a particular investor’s decision to hold our Class A common shares. This discussion applies only to a U.S. Holder that holds our Class A common shares as capital assets for U.S. federal income tax purposes. In addition, it does not describe all of the tax considerations that may be relevant in light of a U.S. Holder’s particular circumstances, including alternative minimum tax considerations, the potential application of the provisions of the Code known as the Medicare contribution tax and tax considerations applicable to U.S. Holders subject to special rules, such as:
| • | certain financial institutions; |
| • | dealers or traders in securities who use a mark-to-market method of tax accounting; |
| • | persons holding Class A common shares as part of a straddle, wash sale, hedging transaction, conversion transaction or integrated transaction or entering into a constructive sale with respect to Class A common shares; |
| • | persons whose functional currency for U.S. federal income tax purposes is not the U.S. dollar; |
| • | persons that are subject to the “applicable financial statement” rules under Section 451(b) of the Code; |
| • | entities or arrangements classified as partnerships for U.S. federal income tax purposes; |
| • | tax-exempt entities, including an “individual retirement account” or “Roth IRA”; |
164
Table of Contents
| • | persons that own or are deemed to own ten percent or more of our stock (by vote or value); |
| • | persons who acquired our Class A common shares pursuant to the exercise of an employee stock option or otherwise as compensation; or |
| • | persons owning shares in connection with a trade or business conducted outside of the United States. |
If an entity or arrangement that is classified as a partnership for U.S. federal income tax purposes holds our Class A common shares, the U.S. federal income tax treatment of a partner will generally depend on the status of the partner and the activities of the partnership. Partnerships holding Class A common shares and partners in such partnerships should consult their tax advisors as to the particular U.S. federal income tax considerations of owning and disposing of the Class A common shares. This discussion is based on the Code, administrative pronouncements, judicial decisions, and final, temporary and proposed Treasury regulations, all as of the date hereof, any of which is subject to change, possibly with retroactive effect.
A U.S. Holder is a beneficial owner of Class A common shares that is for U.S. federal income tax purposes:
| • | a citizen or individual resident of the United States; |
| • | a corporation, or other entity taxable as a corporation, created or organized in or under the laws of the United States, any state therein or the District of Columbia; or |
| • | an estate or trust the income of which is subject to U.S. federal income taxation regardless of its source. |
U.S. Holders should consult their tax advisors concerning the U.S. federal, state, local and foreign tax consequences of owning and disposing of our Class A common shares in their particular circumstances.
Except where otherwise indicated, this discussion assumes that we are not, and will not become, a PFIC, as described below.
Taxation of Distributions
Any distributions paid on our Class A common shares, other than certain pro rata distributions of our Class A common shares, will be treated as dividends for U.S. federal income tax purposes to the extent paid out of our current or accumulated earnings and profits (as determined under U.S. federal income tax principles). Because we do not maintain calculations of our earnings and profits under U.S. federal income tax principles, it is expected that distributions generally will be reported to U.S. Holders as dividends. Subject to applicable limitations, dividends paid to certain non-corporate U.S. Holders will be “qualified dividend income” and therefore may be taxable at rates applicable to long-term capital gains, provided the Class A common shares on which the dividends are paid are readily tradable on an established securities market in the United States. In order to qualify for qualified dividend income treatment, U.S. Holders must meet certain holding period requirements, and we must not be classified as a PFIC in the year in which the dividend is paid or the prior year. U.S. Holders should consult their tax advisors regarding the availability of the reduced tax rate on dividends in their particular circumstances. The Nasdaq, on which our Class A common shares are listed, is an established securities market in the United States, and we expect that our Class A common shares should qualify as readily tradable, although there can be no assurances in this regard. The amount of any dividend generally will be treated as foreign-source dividend income to U.S. Holders and will not be eligible for the dividends-received deduction generally available to U.S. corporations under the Code. Dividends will be included in a U.S. Holder’s income on the date of receipt.
Sale or Other Disposition of Class A Common Shares
For U.S. federal income tax purposes, gain or loss realized on the sale or other disposition of Class A common shares will be capital gain or loss, and will be long-term capital gain or loss if a U.S. Holder has held the Class A common shares for more than one year. Long-term capital gains of individuals and other non-corporate U.S. Holders are eligible for reduced rates of taxation. The amount of the gain or loss will equal the difference between a U.S. Holder’s tax basis in the Class A common shares disposed of and the amount realized on the disposition. This gain or loss generally will be U.S.-source gain or loss for foreign tax credit purposes. The deductibility of capital losses is subject to various limitations.
165
Table of Contents
Passive Foreign Investment Company Rules
Under the Code, we will be a PFIC for any taxable year in which either (i) 75% or more of our gross income consists of “passive income,” or (ii) 50% or more of the average quarterly value of our assets consists of assets that produce, or are held for the production of, “passive income.” For purposes of the above calculations, we will be treated as if we hold our proportionate share of the assets, and receive directly our proportionate share of the income, of any other corporation in which we directly or indirectly own at least 25%, by value, of the shares of such corporation. Passive income generally includes dividends, interest, certain non-active rents and royalties, and capital gains. As an investment platform, we generate active income primarily from our management services. Based on our operations, income, assets and certain estimates and projections, including as to the relative values of our assets, including goodwill, we believe that we were likely not a PFIC for our 2023 taxable year. However, this belief is based in part on our determination of the value of our equity utilizing various criteria, including discounted cash flows, market prices for certain of our assets and a control premium, which differs from the market price of our Class A common shares. For 2022 and prior taxable years, our expectation as to whether or not we were a PFIC was based on the market price of our Class A common shares. Whether we were a PFIC in 2023, and whether we will be a PFIC in any future year, is uncertain because, among other things, (i) we hold a substantial amount of investments that generate passive income; (ii) our PFIC status for any taxable year depends on the composition of our income and assets and the value of our assets from time to time (which may be uncertain and potentially volatile); and (iii) the law applicable to determining whether our goodwill is categorized as an asset that produces active or passive income is subject to varying interpretation. To the extent that any growth in our passive income outpaces our active business, our PFIC status could change. Accordingly, there can be no assurance that we were not a PFIC in 2023 or that we will not be a PFIC for any future taxable year. In addition, there can be no assurance that the IRS will agree with our conclusion or our methodology for determining, or our determination of, the value of our goodwill. If we are a PFIC for any year during which a U.S. Holder holds Class A common shares, we would generally continue to be treated as a PFIC with respect to such holder for all succeeding years during which such holder holds Class A common shares, even if we ceased to meet the threshold requirements for PFIC status.
If we were a PFIC for any taxable year and any of our subsidiaries or other companies in which we owned or were treated as owning equity interests were also a PFIC (any such entity, a “Lower-tier PFIC”), a U.S. Holder would be deemed to own a proportionate amount (by value) of the shares of each Lower-tier PFIC and would be subject to U.S. federal income tax according to the rules described in the subsequent paragraph on (i) certain distributions to us by a Lower-tier PFIC; and (ii) our disposition of shares of Lower-tier PFICs, in each case as if such holder held such shares directly, even though such holder may not have received the proceeds of those distributions or dispositions.
If we were a PFIC for any taxable year during which a U.S. Holder held any of our Class A common shares, absent making certain elections (as described below), such holder would generally be subject to adverse tax consequences. Generally, gain recognized upon a disposition (including, under certain circumstances, a pledge) of Class A common shares would be allocated ratably over a U.S. Holder’s holding period for the Class A common shares. The amounts allocated to the taxable year of disposition and to years before we became a PFIC would be taxed as ordinary income. The amount allocated to each other taxable year would be subject to tax at the highest rate in effect for that taxable year for individuals or corporations, as applicable, and an interest charge would be imposed on the tax on such amount. Further, to the extent that any distribution received on a U.S. Holder’s Class A common shares exceeds 125% of the average of the annual distributions on those shares during the preceding three years or such holder’s holding period, whichever was shorter, that distribution would be subject to taxation in the same manner as gain, described immediately above.
Alternatively, if we were a PFIC and if the Class A common shares were “regularly traded” on a “qualified exchange,” a U.S. Holder would be eligible to make a mark-to-market election that would result in tax treatment different from the general tax treatment for PFICs described above. The Nasdaq, on which our Class A common shares are listed, is a qualified exchange for this purpose. Once made, the election cannot be revoked without the consent of the IRS unless the shares cease to be marketable.
166
Table of Contents
If a U.S. Holder makes the mark-to-market election, such holder generally will recognize as ordinary income any excess of the fair market value of such holder’s Class A common shares at the end of each taxable year over their adjusted tax basis, and will recognize an ordinary loss in respect of any excess of the adjusted tax basis of the Class A common shares over their fair market value at the end of the taxable year (but only to the extent of the net amount of income previously included as a result of the mark-to-market election). If a U.S. Holder makes the election, such holder’s tax basis in their Class A common shares will be adjusted to reflect these income or loss amounts. Any gain recognized on the sale or other disposition of Class A common shares in a year when we are a PFIC will be treated as ordinary income and any loss will be treated as an ordinary loss (but only to the extent of the net amount of income previously included as a result of the mark-to-market election). This election will not apply to any of our non-U.S. subsidiaries. Accordingly, a U.S. Holder may continue to be subject to tax under the PFIC excess distribution regime with respect to any Lower-tier PFICs notwithstanding a mark-to-market election for the Class A common shares. We do not intend to prepare or provide the information necessary for a U.S. Holder to make a qualified electing fund election.
In addition, the preferential dividend rates discussed above with respect to dividends paid to certain non-corporate U.S. Holders would not apply if we were a PFIC for the taxable year in which we paid a dividend or the prior taxable year.
If a U.S. Holder owns Class A common shares during any year in which we are a PFIC, such holder must generally file annual reports containing such information as the U.S. Treasury may require on IRS Form 8621 (or any successor form) with respect to us, generally with such holder’s federal income tax return for that year. A failure to file this form (or any successor form) as required may toll the running of the statute of limitations in respect of each taxable year for which such form is required to be filed. As a result, the taxable years with respect to which a U.S. Holder fails to file the form may remain open to assessment by the IRS indefinitely, until the form is filed.
U.S. Holders should consult their tax advisors regarding whether we are a PFIC and the potential application of the PFIC rules.
Information Reporting and Backup Withholding
Payments of dividends and sales proceeds that are made within the United States or through certain U.S.-related financial intermediaries generally are subject to information reporting, and may be subject to backup withholding, unless a U.S. Holder (i) is a corporation or other exempt recipient; or (ii) in the case of backup withholding, provides a correct taxpayer identification number and certifies that such holder is not subject to backup withholding.
Backup withholding is not an additional tax. The amount of any backup withholding from a payment to a U.S. Holder will be allowed as a refund or credit against such holder’s U.S. federal income tax liability and may entitle such holder to a refund, provided that the required information is timely furnished to the IRS. U.S. Holders should consult their tax advisors regarding the application of the U.S. information reporting and backup withholding rules.
Information with Respect to Foreign Financial Assets
Certain U.S. Holders who are individuals (and certain entities) may be required to report information on their U.S. federal income tax returns relating to an interest in our Class A common shares, subject to certain exceptions (including an exception for Class A common shares held in accounts maintained by certain U.S. financial institutions). U.S. Holders should consult their tax advisors regarding the effect, if any, of this requirement on their ownership and disposition of the Class A common shares.
| F. | Dividends and Paying Agents |
Not applicable.
| G. | Statement by Experts |
Not applicable.
167
Table of Contents
| H. | Documents on Display |
We are subject to the informational requirements of the Exchange Act. Accordingly, we are required to file reports and other information with the SEC, including annual reports on Form 20-F and reports on Form 6-K. You may inspect and copy reports and other information filed with the SEC at the Public Reference Room at 100 F Street, N.E., Washington, D.C. 20549. Information on the operation of the Public Reference Room may be obtained by calling the SEC at 1-800-SEC-0330. In addition, the SEC maintains an internet website that contains reports and other information about issuers, like us, that file electronically with the SEC. The address of that website is https://www.sec.gov.
| I. | Subsidiary Information |
Not applicable.
| J. | Annual Report to Security Holders |
Not applicable.
ITEM 11. QUANTITATIVE AND QUALITATIVE DISCLOSURES ABOUT MARKET RISK
We are exposed to market risks in the ordinary course of our business, including the effects of interest rate changes. Information relating to quantitative and qualitative disclosures about these market risks is described below.
Market Risk
Market risk is the risk that the fair value or future cash flows of a financial instrument will fluctuate because of changes in market prices. Market risk comprises three main types of risk: foreign exchange variation, interest rates and share prices. The aim of market risk management is to control exposure to market risks, within acceptable parameters, while optimizing returns. Market risk management for operations is carried out through policies, control procedures and prior identification of risks in new products and activities, with the purpose to maintain market risk exposure at levels considered acceptable by us and to meet our business strategy.
| (i) | Currency Risk |
We are subject to foreign currency risk in connection with our international operations, exclusively in respect of the U.S. dollar. Foreign exchange risk arises from future commercial transactions and recognized assets and liabilities denominated in a currency that is not our functional currency. See note 4.1(b)(i) to our audited consolidated financial statements for a summary of the foreign assets and liabilities to which we are exposed.
| (ii) | Interest Rate Risk |
Our profit or loss is sensitive to higher or lower interest income from cash and cash equivalents and mutual funds as a result of changes in interest rates. See note 4.1(d) to our audited consolidated financial statements for a summary of our sensitivity to changes in interest rates.
The following are the risk rates that we are exposed to: (1) the SELIC Rate;; (2) the IPCA, the Brazilian national consumer price index (Índice Nacional de Preços ao Consumidor Amplo); (3) US interest rate.
| (iii) | Price Risk |
Price risk is the risk arising from price changes in investment fund portfolios and shares listed on the stock exchange held in our portfolio, which may affect profit or loss. Price risk is mitigated by our management through the diversification of our portfolio and/or through the use of derivatives contracts, such as options or futures. We believe we adopt conservative price risk limits in our risk budget.
The majority of our financial investments that are exposed to significant price risk are the Brazilian real estate investments trust (REITs), private equity investments, and Brazilian stock prices. See note 4.1(d) to our audited consolidated financial statements for a sensitivity analysis of the price risk for assets held by us.
168
Table of Contents
Liquidity Risk
Liquidity risk relates to maintaining sufficient cash and securities through an adequate amount of committed credit facilities to meet obligations when due and to close out market positions. We have a liquidity risk management policy, which aims to ensure a minimum level of liquidity considered adequate by our management. This policy establishes actions to be taken in the event of liquidity contingencies, which are designed to reframe cash within required minimum liquidity limits.
See note 4.1(c) of our audited consolidated financial statements for a summary of our net debt as of December 31, 2023, 2022 and 2021.
Credit Risk
Credit risk is the risk of suffering financial losses related to noncompliance by any of our clients and market counterparties with financial obligations and concessions granted in the renegotiation of financial arrangements and recovery costs, among others.
Credit risk includes, among other risks: (1) noncompliance by counterparties with obligations related to the settlement of transactions in financial assets, including derivative financial instruments; (2) losses related to noncompliance with financial obligations by borrowers located abroad, as a result of the actions taken by the government of the country in which they reside; (3) cash disbursements to honor credit commitments or other transactions of a similar nature; and (4) losses associated with noncompliance by intermediaries or borrower with financial obligations pursuant to financing agreements.
ITEM 12. DESCRIPTION OF SECURITIES OTHER THAN EQUITY SECURITIES
| A. | Debt Securities |
Not applicable.
| B. | Warrants and Rights |
Not applicable.
| C. | Other Securities |
Not applicable.
| D. | American Depositary Shares |
Not applicable.
169
Table of Contents
PART II
ITEM 13. DEFAULTS, DIVIDEND ARREARAGES AND DELINQUENCIES
Defaults
No matters to report.
Arrears and delinquencies
No matters to report.
ITEM 14. MATERIAL MODIFICATIONS TO THE RIGHTS OF SECURITY HOLDERS AND USE OF PROCEEDS
| A. | Material modifications to instruments |
Not applicable.
| B. | Material modifications to rights |
Not applicable.
| C. | Withdrawal or substitution of assets |
Not applicable.
| D. | Change in trustees or paying agents |
Not applicable.
| E. | Use of proceeds |
Not applicable.
ITEM 15. CONTROLS AND PROCEDURES
| A. | Disclosure controls and procedures |
We have evaluated, with the participation of our chief executive officer and chief financial officer, the effectiveness of our disclosure controls and procedures as of December 31, 2023. There are inherent limitations to the effectiveness of any system of disclosure controls and procedures, including the possibility of human error and the circumvention or overriding of the controls and procedures. Accordingly, even effective disclosure controls and procedures can only provide reasonable assurance of achieving their control objectives. Based upon our evaluation, our chief executive officer and chief financial officer concluded that our disclosure controls and procedures were not effective as of December 31, 2023, due to the material weaknesses discussed in “Item 3. Key Information—D. Risk factors—We have identified material weaknesses in our internal control over financial reporting and, if we fail to remediate such deficiencies (and any other ones) and to maintain effective internal controls over financial reporting, we may be unable to accurately report our results of operations, meet our reporting obligations and/or prevent fraud.”
| B. | Management’s annual report on internal control over financial reporting |
Management is responsible for establishing and maintaining adequate internal control over financial reporting (as defined in Rules 13a-15(f) and 15d-15(f) of the Exchange Act). Our internal control system was designed to provide reasonable assurance as to the integrity and reliability of the published financial statements. All internal control systems, no matter how well designed, may have inherent limitations and can provide reasonable assurance that the objectives of the control system are met.
170
Table of Contents
Our internal control over financial reporting includes those policies and procedures that:
| • | Pertain to the maintenance of records that, in reasonable detail, accurately and fairly reflect the transactions and dispositions of our assets; |
| • | Provide reasonable assurance that transactions are recorded as necessary to permit preparation of consolidated financial statements in accordance with generally accepted accounting principles, and that our receipts and expenditures are being made only in accordance with authorizations of management and directors; and |
| • | Provide reasonable assurance regarding prevention or timely detection of unauthorized acquisition, use, or disposition of our assets that could have a material effect on the consolidated financial statements. |
Management evaluated the effectiveness of internal control over financial reporting under the supervision of our chief executive officer and chief financial officer or CFO as of December 31, 2023 based on the criteria set out in the Committee of Sponsoring Organizations of the Treadway Commission framework, or the COSO framework, and concluded that, as of December 31, 2023, our internal controls were not effective due to the material weaknesses discussed above.
| C. | Attestation report of the registered public accounting firm |
This annual report does not include an attestation report of our registered public accounting firm because, as an “emerging growth company,” as defined under the JOBS Act, we are exempt from this requirement.
| D. | Changes in internal control over financial reporting |
In connection with the preparation of our consolidated financial statements for the years ended December 31, 2023, 2022 and 2021, we identified a number of material weaknesses in our internal control over financial reporting as of December 31, 2023, 2022 and 2021. The material weaknesses identified relate to the processes necessary to comply with the reporting and compliance requirements of IFRS Accounting Standards and the SEC and managing access to our systems, data and end-user computing, or EUC, controls, and computer operations controls, which were not designed or operating effectively. To address these material weaknesses, in 2021, we hired an external consultant with the experience we deemed necessary to assist us with designing the required processes and controls, addressing any systems and EUC deficiencies. In 2022, the consultant along with the Company, mapped out the processes and designed a risk and control framework relating to internal controls over financial reporting, and suggested action plans for some of our internal controls to be validated by the applicable staff. The consultant’s work was completed in 2023 and has enabled us to focus on control gaps and related action plans. Notwithstanding, as the risk and control framework requires continuous updating, new risks and controls or control gaps that are not mapped in the current assessment may arise.
Additionally, we identified material weaknesses related to training, specifically, training to address financial reporting topics for a public company as of December 31, 2021 and 2020. Beginning in the year ended December 31, 2022 and continuing through 2023, we sought to address these material weaknesses by appointing a firm to train our employees on financial reporting topics for a public company, and the material weakness has since been remedied. Continuous staff training is part of our culture and, consequently, we plan to continue to provide necessary training during the year ended December 31, 2024 to relevant staff members related to this matter to mitigate the risk of uncovering material weaknesses in the future.
In addition, we identified material weaknesses as of December 31, 2020 related to the supervision of financial reporting for a public company, including lack of an audit committee. In 2021, we created our audit committee in connection with our IPO (see “Item 6. Directors, Senior Management and Employees—C. Board Practices—Audit Committee”) and further created an internal controls department, which is leading the remediation process along with the external consultant and is responsible for completing our action plans, monitoring, reviewing and testing controls, and ensuring that new controls are in place for new processes or changes in existing processes. Further, in 2023, we created and implemented our internal audit department, operating under the direct supervision of the audit committee. The internal audit department is leading the effectiveness evaluating procedures over the relevant internal controls related to the financial reporting process and entity governance.
171
Table of Contents
Moreover, we identified control deficiencies as of December 31, 2023, 2022 and 2021, related to controls around the financial reporting closing process, the procedures in existence to maintain formal accounting policies, processes and controls to analyze, account for and disclose complex transactions. Such deficiencies, when considered in the aggregate, would be considered a material weakness. Beginning in the year ended December 31, 2022 and continuing into 2023, we have sought to remedy our control deficiencies through procedures such as updated accounting policies and procedures, and controls regarding the reviewing process and the accuracy of the information required to produce the financial statements. In 2023, formal review and documentation processes were implemented for accounting procedures and controls related to the accuracy of information required to produce the financial statements. In 2024, we also hired an external consultant to support the accounting team in preparing and developing an internal manual for significant accounting policies.
For more information, see “See “Item 3. Key Information—D. Risk Factors—Certain Risks Relating to Our Business and Industry—We have identified material weaknesses in our internal control over financial reporting and, if we fail to remediate such deficiencies (and any other ones) and to maintain effective internal controls over financial reporting, we may be unable to accurately report our results of operations, meet our reporting obligations and/or prevent fraud.”
ITEM 16. RESERVED
ITEM 16A. Audit committee financial expert
The audit committee, which consists of Rogério Ladeira Furquim Werneck, Ana Marta Horta Veloso, Guilherme Stocco Filho and Sonia Consiglio, assists our board of directors in overseeing our accounting and financial reporting processes and the audits of our financial statements.
ITEM 16B. Code of ethics
We have adopted a code of ethics applicable to the board of directors and all employees, which covers a broad range of matters including the handling of conflicts of interest, compliance issues and other corporate policies such as equal opportunity and non-discrimination standards. In addition, we have also adopted a statement of trading policies that governs the trading in our securities by our directors, officers and certain other covered persons. Since its effective date, we have not waived compliance with our code of ethics or statement of trading policies.
ITEM 16C. Principal accountant fees and services
The following table sets forth the fees billed to us by our independent registered public accounting firm during the years ended December 31, 2023 and 2022. Our independent registered public accounting firm was PricewaterhouseCoopers Auditores Independentes Ltda. for the years ended December 31, 2023 and 2022. The appointment of PricewaterhouseCoopers Auditores Independentes Ltda., as independent registered public accounting firm, was the result of a tender process completed in 2020 in connection with our initial public offering, and such ongoing appointment was approved by our audit committee for each of the years ended December 31, 2021, 2022 and 2023.
| For the Year Ended December 31, | ||||||||
| 2023 | 2022 | |||||||
| (in R$ thousands) | ||||||||
| Audit fees |
1,229 | 1,319 | ||||||
| Audit-related fees |
122 | 83 | ||||||
| Tax fees |
— | — | ||||||
| All other fees |
364 | — | ||||||
|
|
|
|
|
|||||
| Total |
1,715 | 1,402 | ||||||
|
|
|
|
|
|||||
172
Table of Contents
Audit fees
Audit fees are fees billed for professional services rendered by the principal accountant for the audit of the registrant’s annual combined financial statements or services that are normally provided by the accountant in connection with statutory and regulatory filings or engagements for those fiscal years. It includes the audit of our financial statements, interim reviews and other services that generally only the independent accountant reasonably can provide, such as comfort letters, statutory audits, consents and assistance with and review of documents filed with the SEC.
Audit-related fees
Audit-related fees are fees billed for assurance and related services that are reasonably related to the performance of the audit or review of our financial statements and not reported under the previous category. These services would include, among others: accounting consultations and audits in connection with acquisitions, internal control reviews, attest services that are not required by statue or regulation and consultation concerning financial accounting and reporting standards.
Tax fees
In 2023, there were no tax fees billed for professional services for tax compliance, tax advice and tax planning.
All other fees
All other fees relate to fees in connection with due diligence services rendered in connection with the Compass Transaction. For more information, see “Item 4. Information on the Company—A. History and Development of the Company—Recent Events—Business Combination with Compass.”
Audit committee pre-approval policies and procedures
In accordance with the requirements of the U.S. Sarbanes-Oxley Act of 2002 and rules issued by the SEC, in connection with the establishment of our audit committee (which was undertaken as a result of our IPO, we introduced a procedure for the review and preapproval of any services performed by PricewaterhouseCoopers Auditores Independentes Ltda., including audit services, audit-related services, tax services and other services. The procedure requires that all proposed engagements of PricewaterhouseCoopers Auditores Independentes Ltda. for audit and permitted non-audit services are submitted to the audit committee for approval prior to the beginning of any such services.
ITEM 16D. Exemptions from the listing standards for audit committees
See “Item 6. Directors, Senior Management and Employees—C. Board practices—Foreign Private Issuer Status.”
ITEM 16E. Purchases of equity securities by the issuer and affiliated purchasers
On June 15, 2022, our board of directors approved a share buyback plan and a share repurchase plan to buy back up to R$60.0 million of our outstanding Class A common shares across both plans. These plans were approved to replace our previous plans, which expired on May 31, 2022. The plans commenced immediately and did not have a specified expiration date, other than when the R$60.0 million buyback limit was reached. We financed purchases with existing cash balances derived from our Distributable Earnings, which did not have a material impact on capital levels. Under the share buyback plan, buybacks were made from time-to-time in open market and negotiated purchases in compliance with Rule 10b-18 under the Exchange Act. The specific prices, numbers of shares and timing of purchase transactions were determined by us from time to time in our sole discretion. Under the share repurchase plan, repurchases were carried out by J.P. Morgan Securities LLC, as agent of the Company, from time-to-time in open market and negotiated purchases, and in compliance with Rule 10b5-1(c)(1)(i)(B) under the Exchange Act. In either case, buybacks were subject to market conditions, available liquidity, cash flow, applicable legal requirements and other factors.
On February 10, 2023, our board of directors approved a share buyback plan and a share repurchase plan to buy back up to R$60.0 million of its outstanding Class A common shares across both plans. These plans were approved to replace the plans approved on June 15, 2023, which were set to expire on the date that the R$60.0 million buyback limit set thereunder is reached. The new buyback and repurchase plans commenced on the expiration date of the legacy plans, and did not have specified expiration dates, other than when the R$60.0 million buyback limit
173
Table of Contents
was reached. We financed purchases with existing cash balances derived from our Distributable Earnings, which did not have a material impact on capital levels. Under the share buyback plan, buybacks were made from time-to-time in open market and negotiated purchases in compliance with Rule 10b-18 under the Exchange Act. The specific prices, numbers of shares and timing of purchase transactions were determined by us from time to time in our sole discretion. Under the share repurchase plan, repurchases were carried out by a broker, as agent of the Company, from time-to-time in open market and negotiated purchases, and in compliance with Rule 10b5-1(c)(1)(i)(B) under the Exchange Act. In either case, buybacks were subject to market conditions, available liquidity, cash flow, applicable legal requirements and other factors.
Set forth below, in tabular format, is disclosure on the repurchase of Vinci Partners Class A common shares for the year ended December 31, 2023.
| Period |
Total Number of Shares Purchased |
Average Price Paid per Share |
Total Number of Shares Purchased as Part of Publicly Announced Plans or Programs |
Maximum Number (or Approximate Real Value) of Shares that May Yet Be Purchased under the Plans or Programs |
||||||||||||
| January 1 to January 31, 2023 |
105,623 | R$ | 47.80 | 105,623 | 24,973,612 | |||||||||||
| February 1 to February 28, 2023 |
111,771 | R$ | 53.22 | 111,771 | 79,024,862 | |||||||||||
| March 1 to March 31, 2023 |
149,642 | R$ | 46.72 | 149,642 | 72,034,071 | |||||||||||
| April 1 to April 30, 2023 |
74,953 | R$ | 42.56 | 74,953 | 68,843,966 | |||||||||||
| May 1 to May 31, 2023 |
181,488 | R$ | 41.74 | 181,488 | 61,268,175 | |||||||||||
| June 1 to June 30, 2023 |
301,908 | R$ | 44.05 | 301,908 | 47,969,719 | |||||||||||
| July 1 to July 31, 2023 |
223,612 | R$ | 48.09 | 223,612 | 37,215,773 | |||||||||||
| August 1 to August 31, 2023 |
311,664 | R$ | 48.96 | 311,664 | 21,956,531 | |||||||||||
| September 1 to September 30, 2023 |
170,242 | R$ | 52.25 | 170,242 | 13,061,934 | |||||||||||
| October 1 to October 31, 2023 |
93,249 | R$ | 53.53 | 93,249 | 8,070,589 | |||||||||||
| November 1 to November 30, 2023 |
— | — | — | 8,070,589 | ||||||||||||
| December 1 to December 31, 2023 |
— | — | — | 8,070,589 | ||||||||||||
| Total |
3,557,004 | R$ | 47.53 | 3,557,004 | 8,070,589 | |||||||||||
On February 7, 2024, our board of directors approved a share buyback plan to buy back up to R$60.0 million of our outstanding Class A common shares, which shall be executed through open market transactions or privately negotiated purchases. The plan is approved to replace the share buyback and repurchase plans approved by our board of directors on February 14, 2023, which expired on the date that the R$60.0 million buyback limit set thereunder was reached. The new plan will not have a specified expiration date (other than when the R$60.0 million buyback limit is reached). We expect to finance purchases with existing cash balances derived from our Distributable Earnings, which is not expected to have a material impact on capital levels. Under the plan, buybacks may be made from time-to-time through open market transactions or privately negotiated purchases in compliance with SEC Rule 10b-18 and Rule 10b5-1. The specific prices, numbers of shares and timing of purchase transactions will be determined by the Company from time to time in its sole discretion. Under the plan, repurchases will be carried out through a broker acting as an agent of the Company, from time-to-time in open market and negotiated purchases, and in compliance with SEC Rule 10b5-1. In either case, buybacks are subject to market conditions, available liquidity, cash flow, applicable legal requirements and other factors. The plan does not obligate the Company or any agent to acquire any particular amount of Class A common shares, and may be suspended or discontinued at any time.
ITEM 16F. Change in registrant’s certifying accountant
Not applicable.
174
Table of Contents
ITEM 16G. Corporate governance
Foreign Private Issuer Status
Nasdaq listing rules include certain accommodations in the corporate governance requirements that allow foreign private issuers, such as us, to follow “home country” corporate governance practices in lieu of the otherwise applicable corporate governance standards of the Nasdaq. The application of such exceptions requires that we disclose each Nasdaq corporate governance standard that we do not follow and describe the Cayman Islands corporate governance practices we do follow in lieu of the relevant Nasdaq corporate governance standard. We currently follow Cayman Islands corporate governance practices in lieu of the corporate governance requirements of the Nasdaq in respect of the following:
| • | Nasdaq Rule 5605(b), which requires that independent directors comprise a majority of a company’s board of directors. As allowed by the laws of the Cayman Islands, independent directors do not comprise a majority of our board of directors. |
| • | Nasdaq Rule 5605(e)(1), which requires that a company have a nominations committee comprised solely of “independent directors” as defined by Nasdaq. As allowed by the laws of the Cayman Islands, we do not have a nominations committee nor do we have any current intention to establish one. |
| • | Nasdaq Rule 5605(d) & (e), which require that compensation for our executive officers and selection of our director nominees be determined by a majority of independent directors. As allowed by the laws of the Cayman Islands, we do not have a nomination and corporate governance committee or remuneration committee nor do we have any current intention to establish either. |
| • | Nasdaq Rule 5635, which requires that a listed issuer obtain shareholder approval prior to an issuance of securities in connection with: (i) the acquisition of the stock or assets of another company; (ii) equity-based compensation of officers, directors, employees or consultants; (iii) a change of control; and (iv) transactions other than public offerings. Pursuant to the laws of the Cayman Islands and our Articles of Association, we are not required to obtain any such approval. |
Cayman Islands law does not impose a requirement that the board consist of a majority of independent directors or that such independent directors meet regularly without other members present. Nor does Cayman Islands law impose specific requirements on the establishment of a compensation committee or nominating committee or nominating process.
ITEM 16H. Mine safety disclosure
Not applicable.
ITEM 16I. Disclosure regarding foreign jurisdictions that prevent inspections
Not applicable.
ITEM 16J. Insider trading policies
Not applicable.
ITEM 16K. Cybersecurity
Our cybersecurity risk management program is designed to leverage the security risks within senior management, based on industry best practices, and to provide a framework for handling cybersecurity threats and incidents, including threats and incidents associated with the use of our infrastructure, services and applications supported/developed internally and by third-party service providers.
Cybersecurity Framework
Our cybersecurity framework covers detection, prevention, mitigation, countermeasures, monitoring, alerting, and reporting solutions. We use several solutions that work in layers to provide the necessary security for the business and mitigate the risks. We work with a third-party security partner, or more specifically a Managed Security Services Provider, or MSSP, in several activities within the framework. This framework includes but it is not limited to:
175
Table of Contents
| • | Security and incident response policies: every employee must agree and sign our policies, which are all available on our intranet; |
| • | Staff information security training: annual staff information security training, which is part of our mandatory refresh program and is managed by our cybersecurity team; |
| • | Vulnerability management: monthly “scans” are performed on our IT infrastructure, which are provided by our MSSP; |
| • | Compliance management: the creation of security and control baseline based on the CIS benchmark for our IT infrastructure, and which is provided by our MSSP; |
| • | Patch management: the periodic installation of security updates on our IT environment; |
| • | Penetration tests: annual penetration tests are performed on applications and Internet perimeter, and we use third parties to perform this activity; |
| • | Brand monitoring: this service provides security against potential frauds using the “Vinci Partners” brand and is provided by our MSSP; |
| • | Phishing tests: annual phishing tests for all employees, the results of which are discussed in our security training materials; |
| • | Security operations center: a full-time (24x7x365) security operations center that monitors our IT infrastructure through our MSSP; |
| • | Technical solutions: these include perimeter defense (e.g., firewalls and web application firewalls), endpoint protection, anti-spam and anti-phishing tools, malicious e-mails detection and blocking, internet access control and filtering, and multifactor authentication for all employees; |
| • | Weekly cybersecurity meetings: our cybersecurity team have weekly meetings to discuss any applicable risks and their respective action plans; and |
| • | Business continuity management: a daily process used to replicate and copy relevant business applications from our main production services and send it to a disaster recovery site, which is tested on an annual basis. |
Management Roles
Our board of directors has overall oversight responsibility for our risk management and our cybersecurity risk management program, and such oversight is supported by our cybersecurity committee. Our cybersecurity committee is composed of our IT and compliance managers, including our chief technology officer, or CTO, our chief information security officer, or CISO, our chief financial officer, our chief legal and compliance officer and our chief risk officer CRO. This committee is responsible for ensuring that management has processes in place designed to identify and evaluate cybersecurity risks to which the company is exposed and implement processes and programs to manage cybersecurity risks and mitigate cybersecurity incidents.
Management, in turn, is responsible for identifying, considering and assessing material cybersecurity risks on an ongoing basis, establishing processes to ensure that such potential cybersecurity risk exposures are monitored, putting in place appropriate mitigation measures and maintaining cybersecurity programs. Once a cybersecurity threat is identified from the given framework, it is discussed within the cybersecurity team to evaluate its respective risk. The team also engages a third-party to assist evaluating the risk from a technical perspective monthly and on demand. Threats and risks are discussed weekly by the cybersecurity team, monthly with our chief financial officer and quarterly with the cybersecurity committee’s meetings,or on demand, as needed. Security incidents are reported to our cybersecurity committee, in alignment with the company’s incident response policy.
Our cybersecurity programs are under the direction of our CTO, who receives reports from our cybersecurity team and monitors the prevention, detection, mitigation, and remediation of cybersecurity incidents. The CISO is responsible for establishing strategies and actions that ensure that the technologies used by Vinci and information assets are adequately protected. Our CISO is an experienced information systems security professional and information security manager with many years of experience. Management, including the CISO, regularly update our cybersecurity committee on our cybersecurity programs, material cybersecurity risks and mitigation strategies and provide cybersecurity reports quarterly that cover, among other topics, third-party assessments of the company’s cybersecurity programs, developments in cybersecurity and updates to the company’s cybersecurity programs and mitigation strategies.
176
Table of Contents
Cybersecurity Incidents and Threats
In 2023, we did not identify any cybersecurity threats that have materially affected or are reasonably likely to materially affect our business strategy, results of operations, or financial condition. However, despite our efforts, we cannot eliminate all risks from cybersecurity threats, or provide assurances that we have not experienced an undetected cybersecurity incident. For more information about these risks, please see “Risk Factors—Risks Relating to Our Business and Industry—Unauthorized disclosure, destruction or modification of data, through cybersecurity breaches, computer viruses or otherwise, or disruption of our services could expose us to liability and protracted and costly litigation and damage our reputation” in this annual report.
177
Table of Contents
PART III
ITEM 17. FINANCIAL STATEMENTS
We have responded to Item 18 in lieu of this item.
ITEM 18. FINANCIAL STATEMENTS
Financial Statements are filed as part of this annual report, see pages F-1 to F-61 to this annual report.
ITEM 19. EXHIBITS
The following documents are filed as part of this annual report:
178
Table of Contents
| * | Filed herewith. |
| ** | Previously filed. |
179
Table of Contents
SIGNATURES
The registrant hereby certifies that it meets all of the requirements for filing on Form 20-F and that it has duly caused and authorized the undersigned to sign this annual report on its behalf.
April 18, 2024
| Vinci Partners Investments Ltd. | ||
| By: | /s/ Alessandro Monteiro Morgado Horta | |
| Name: Alessandro Monteiro Morgado Horta | ||
| Title: Chief Executive Officer | ||
| By: | /s/ Sergio Passos Ribeiro | |
| Name: Sergio Passos Ribeiro | ||
| Title: Chief Operating Officer and Chief Financial Officer |
180
Table of Contents
| Audited Consolidated Financial Statements |
Page |
|||
| F-2 | ||||
F-3 |
||||
F-5 |
||||
F-6 |
||||
F-7 |
||||
F-8 |
||||
F-9 |
||||
| , February 7, 2024 |
| /s/ |
| Auditores Independentes Ltda. |
Assets |
Note |
12/31/2023 |
12/31/2022 |
|||||||||
| Current assets |
||||||||||||
| Cash and cash equivalents |
5(c) | |||||||||||
| |
|
|
|
|||||||||
| Cash and bank deposits |
5(c) | |||||||||||
| Financial instruments at fair value through profit or loss |
5(c) | |||||||||||
| Financial instruments at amortized cost |
5(c) | |||||||||||
| Financial instruments at fair value through profit or loss |
5(d) | |||||||||||
| Accounts receivable |
5(a) | |||||||||||
| Sub-leases receivable |
10 | |||||||||||
| Taxes recoverable |
||||||||||||
| Other assets |
6 | |||||||||||
| |
|
|
|
|||||||||
| Total current assets |
||||||||||||
| |
|
|
|
|||||||||
| Non-current assets |
||||||||||||
| Financial instruments at fair value through profit or loss |
5(c) | |||||||||||
| Accounts receivable |
5(a) | |||||||||||
| Sub-leases receivable |
10 | |||||||||||
| Taxes recoverable |
||||||||||||
| Deferred taxes |
20 | |||||||||||
| Other assets |
6 | |||||||||||
| |
|
|
|
|||||||||
| |
|
|
|
|||||||||
| Property and equipment |
8 | |||||||||||
| Right of use – Leases |
10 | |||||||||||
| Intangible assets |
9 | |||||||||||
| |
|
|
|
|||||||||
| Total non-current assets |
||||||||||||
| |
|
|
|
|||||||||
| Total assets |
||||||||||||
| |
|
|
|
|||||||||
Liabilities and equity |
Note |
12/31/2023 |
12/31/2022 |
|||||||||
| Current liabilities |
||||||||||||
| Trade payables |
||||||||||||
| Leases |
10 and 5(e) | |||||||||||
| Accounts payable |
11 | |||||||||||
| Labor and social security obligations |
12 | |||||||||||
| Loans and obligations |
14 | |||||||||||
| Taxes and contributions payable |
13 | |||||||||||
| |
|
|
|
|||||||||
| Total current liabilities |
||||||||||||
| |
|
|
|
|||||||||
| Non-current liabilities |
||||||||||||
| Leases |
10 and 5(e) | |||||||||||
| Labor and social security obligations |
12 | |||||||||||
| Loans and obligations |
14 | |||||||||||
| Deferred taxes |
20 | |||||||||||
| Retirement plans liabilities |
15 | |||||||||||
| |
|
|
|
|||||||||
| Total non-current liabilities |
||||||||||||
| |
|
|
|
|||||||||
| Total liabilities |
||||||||||||
| |
|
|
|
|||||||||
| Equity |
16 | |||||||||||
| Share capital |
||||||||||||
| Additional paid-in capital |
||||||||||||
| Treasury shares |
16(f) | ( |
) | ( |
) | |||||||
| Retained earnings |
||||||||||||
| Other reserves |
||||||||||||
| |
|
|
|
|||||||||
| |
|
|
|
|||||||||
| Non-controlling interests in the equity of subsidiaries |
7(b) | |||||||||||
| |
|
|
|
|||||||||
| Total equity |
||||||||||||
| |
|
|
|
|||||||||
| Total liabilities and equity |
||||||||||||
| |
|
|
|
|||||||||
Statements of Income |
Note |
2023 |
2022 |
2021 |
||||||||||
| Net revenue from services rendered |
17 | |||||||||||||
| General and administrative expenses |
18 | ( |
) | ( |
) | ( |
) | |||||||
| |
|
|
|
|
|
|||||||||
| Operating profit |
||||||||||||||
| |
|
|
|
|
|
|||||||||
| Finance income |
19 | |||||||||||||
| Finance expenses |
19 | ( |
) | ( |
) | ( |
) | |||||||
| |
|
|
|
|
|
|||||||||
| Finance profit, net |
||||||||||||||
| |
|
|
|
|
|
|||||||||
| Profit before income taxes |
||||||||||||||
| |
|
|
|
|
|
|||||||||
| Income taxes |
20 | ( |
) | ( |
) | ( |
) | |||||||
| |
|
|
|
|
|
|||||||||
| Profit for the year |
||||||||||||||
| |
|
|
|
|
|
|||||||||
| Attributable to the shareholders of the parent company |
||||||||||||||
| Attributable to non-controlling interests |
( |
) | ( |
) | ||||||||||
| Basic earnings per share/quota in Brazilian Reais |
16 (g) | |||||||||||||
| Diluted earnings per share/quota in Brazilian Reais |
16 (g) | |||||||||||||
2023 |
2022 |
2021 |
||||||||||
| Profit for the year |
||||||||||||
| |
|
|
|
|
|
|||||||
| Other comprehensive income |
||||||||||||
| Items that may be reclassified to profit or loss: |
||||||||||||
| Foreign exchange variance of investees |
||||||||||||
| Vinci Capital Partners GP Limited |
( |
) | ||||||||||
| Vinci USA LLC |
( |
) | ( |
) | ||||||||
| Vinci Capital Partners F III GP Limited |
( |
) | ( |
) | ||||||||
| GGN GP LLC |
( |
) | ( |
) | ||||||||
| VICC Infra GP LLC |
( |
) | ||||||||||
| Vinci Capital Partners IV GP LLC |
( |
) | ( |
) | ||||||||
| Total comprehensive income for the year |
||||||||||||
| |
|
|
|
|
|
|||||||
| Attributable to: |
||||||||||||
| Shareholders of the parent company |
||||||||||||
| Non-controlling interests |
( |
) | ( |
) | ||||||||
| |
|
|
|
|
|
|||||||
| |
|
|
|
|
|
|||||||
Share capital |
Additional Paid-in capital |
Retained earnings |
Other reserves |
Treasury shares |
Total |
Non-controlling interests |
Total equity |
|||||||||||||||||||||||||
| At December 31, 2020 |
||||||||||||||||||||||||||||||||
| |
|
|
|
|
|
|
|
|
|
|
|
|
|
|
|
|||||||||||||||||
| Profit for the year |
||||||||||||||||||||||||||||||||
| Other comprehensive income: |
||||||||||||||||||||||||||||||||
| Foreign exchange variation of investee located abroad |
( |
) | ||||||||||||||||||||||||||||||
| Corporate Reorganization |
( |
) | ||||||||||||||||||||||||||||||
| Proceeds from the issuance of shares |
||||||||||||||||||||||||||||||||
| Transactions costs from proceeds from the issuance of shares |
( |
) | ( |
) | ( |
) | ||||||||||||||||||||||||||
| Share based payments |
||||||||||||||||||||||||||||||||
| Treasury quotas bought |
( |
) | ( |
) | ( |
) | ||||||||||||||||||||||||||
| Treasury quotas canceled |
||||||||||||||||||||||||||||||||
| Allocation of profit: |
||||||||||||||||||||||||||||||||
| Dividends |
( |
) | ( |
) | ( |
) | ||||||||||||||||||||||||||
| At December 31, 2021 |
( |
) | ||||||||||||||||||||||||||||||
| |
|
|
|
|
|
|
|
|
|
|
|
|
|
|
|
|||||||||||||||||
| Profit for the year |
( |
) | ||||||||||||||||||||||||||||||
| Other comprehensive income: |
||||||||||||||||||||||||||||||||
| Foreign exchange variation of investee located abroad |
( |
) | ( |
) | ( |
) | ( |
) | ||||||||||||||||||||||||
| Proceeds from the issuance of shares, net from capital returned |
||||||||||||||||||||||||||||||||
| Share based payments |
||||||||||||||||||||||||||||||||
| Treasury quotas bought |
( |
) | ( |
) | ( |
) | ||||||||||||||||||||||||||
| Allocation of profit: |
||||||||||||||||||||||||||||||||
| Dividends |
( |
) | ( |
) | ( |
) | ||||||||||||||||||||||||||
| |
|
|
|
|
|
|||||||||||||||||||||||||||
| At December 31, 2022 |
( |
) | ||||||||||||||||||||||||||||||
| |
|
|
|
|
|
|
|
|
|
|
|
|
|
|
|
|||||||||||||||||
| Profit for the year |
— | — | — | ( |
) | |||||||||||||||||||||||||||
| Other comprehensive income: |
||||||||||||||||||||||||||||||||
| Foreign exchange variation of investee located abroad |
— | — | ( |
) | — | ( |
) | ( |
) | |||||||||||||||||||||||
| Fair value option of convertible preferred shares |
— | — | — | — | — | |||||||||||||||||||||||||||
| Transactions costs from the issuance of preferred shares |
— | ( |
) | — | — | — | ( |
) | — | ( |
) | |||||||||||||||||||||
| Share based payments |
— | ( |
) | — | — | |||||||||||||||||||||||||||
| Treasury shares bought, net of shares sold |
— | ( |
) | — | — | ( |
) | ( |
) | — | ( |
) | ||||||||||||||||||||
| Allocation of profit: |
||||||||||||||||||||||||||||||||
| Dividends |
— | ( |
) | — | — | ( |
) | — | ( |
) | ||||||||||||||||||||||
| At December 31, 2023 |
( |
) | ||||||||||||||||||||||||||||||
| |
|
|
|
|
|
|
|
|
|
|
|
|
|
|
|
|||||||||||||||||
Notes |
2023 |
2022 |
2021 |
|||||||||||
Cash flows from operating activities |
||||||||||||||
Profit before taxation |
||||||||||||||
Adjustments to reconcile net income to cash flows from operations: |
||||||||||||||
Depreciation and amortization |
18 | |||||||||||||
Investment income of financial instruments at fair value through profit or loss |
( |
) | ( |
) | ( |
) | ||||||||
Net foreign exchange on liabilities at amortized cost |
14(i) | ( |
) | |||||||||||
Interest expense on loans and obligations |
19 | |||||||||||||
Gain/loss on remeasurement of contingent consideration |
19 | ( |
) | |||||||||||
Allowance for expected credit loss |
18 | ( |
) | |||||||||||
Share based payments |
18 | |||||||||||||
Financial result on lease agreements |
19 | |||||||||||||
Changes in assets and liabilities |
||||||||||||||
Accounts receivables |
( |
) | ( |
) | ||||||||||
Taxes recoverable |
( |
) | ( |
) | ||||||||||
Other assets |
( |
) | ( |
) | ||||||||||
Trade payables |
( |
) | ||||||||||||
Accounts payable |
( |
) | ( |
) | ||||||||||
Labor and social security obligations |
( |
) | ||||||||||||
Taxes and contributions payable |
( |
) | ( |
) | ||||||||||
Contribution for retirements plans |
||||||||||||||
( |
) |
|||||||||||||
Cash generated from operations |
||||||||||||||
Income tax paid |
( |
) | ( |
) | ( |
) | ||||||||
Net cash inflow from operating activities |
||||||||||||||
Cash flows from investing activities |
||||||||||||||
Payment for acquisition of subsidiary |
7 | ( |
) | |||||||||||
Cash and cash equivalent increased from business combination |
7 | |||||||||||||
Purchases of property and equipment and additions to intangible assets |
( |
) | ( |
) | ( |
) | ||||||||
Acquisition of non-controlling quotas |
||||||||||||||
Purchase of financial instruments at fair value through profit or loss |
( |
) | ( |
) | ( |
) | ||||||||
Sales of financial instruments at fair value through profit or loss |
||||||||||||||
Net cash (outflow) from investing activities |
( |
) | ||||||||||||
Cash flows from financing activities |
||||||||||||||
Proceeds from the issuance of shares/quotas |
16(a) | |||||||||||||
Capital increase (decrease) of non-controlling interests in the equity of subsidiaries |
||||||||||||||
Interest payments of loans and obligations |
14(ii) | ( |
) | |||||||||||
Principal payments of loans and obligations |
14(ii) | ( |
) | |||||||||||
Transactions costs paid |
16(d) | ( |
) | |||||||||||
Treasury shares acquisition paid, net of treasury shares sold |
16(f) | ( |
) | ( |
) | ( |
) | |||||||
Lease payments, net of sublease received |
( |
) | ( |
) | ( |
) | ||||||||
Loans and obligations acquisitions |
||||||||||||||
Issuance of convertible preferred shares |
16(d) | |||||||||||||
Dividends paid |
16(e) | ( |
) | ( |
) | ( |
) | |||||||
Net cash (outflow) from financing activities |
( |
) |
||||||||||||
Net increase in cash and cash equivalents |
||||||||||||||
Cash and cash equivalents at the beginning of the year |
5(c) | |||||||||||||
Foreign exchange variation of cash and cash equivalents in subsidiary |
( |
) | ( |
) | ||||||||||
Cash and cash equivalents at the end of the year |
5(c) | |||||||||||||
1 |
Operations |
2 |
Summary of significant accounting policies |
2.1 |
Basis of preparation and presentation |
(a) |
Consolidated financial statements |
Interest - % |
||||||||
12/31/2023 |
12/31/2022 |
|||||||
| Subsidiaries |
||||||||
| Vinci Partners Investimentos Ltda. |
||||||||
| Vinci Assessoria financeira Ltda. (1) |
||||||||
| Vinci Equities Gestora de Recursos Ltda. (1) |
||||||||
| Vinci Gestora de Recursos Ltda. (1) |
||||||||
| Vinci Capital Gestora de Recursos Ltda. (1) |
||||||||
| Vinci Soluções de Investimentos Ltda. |
||||||||
| Vinci Real Estate Gestora de Recursos Ltda. (1) |
||||||||
| Vinci Capital Partners GP Limited. |
||||||||
| Vinci Partners USA LLC |
||||||||
| Vinci GGN Gestão de Recursos Ltda. (1) |
||||||||
| Vinci Infraestrutura Gestora de Recursos Ltda. |
||||||||
| Vinci Capital Partners GP III Limited. |
||||||||
| GGN GP LLC |
||||||||
| Amalfi Empreendimentos e Participações S.A. |
||||||||
| Vinci APM Ltda. (1) |
||||||||
| Vinci Monalisa FIM Crédito Privado IE (2) |
||||||||
| Vinci Asset Allocation Ltda. |
||||||||
| VICC Infra GP LLC |
||||||||
| Vinci Capital Partners IV GP LLC |
||||||||
| Vinci Holding Securitária Ltda. |
||||||||
| Vinci Vida e Previdência S.A. (3) |
||||||||
| SPS Capital Gestão de Recursos Ltda. (4) |
||||||||
| VICC Infra GP (Lux), S.A.R.L. |
| (1) | Minority interest represents less than |
| (2) | Under the terms of IFRS 10, the Entity does not consolidate its investment in Vinci Monalisa FIM Crédito Privado IE and measures at fair value through profit or loss in accordance with IFRS 9. |
| (3) | Vinci has an indirect interest at Vinci Vida e Previdência of |
| (4) | On 16 August 2022, Vinci Soluções de Investimentos Ltda. acquired |
2.2 |
Segment reporting |
2.3 |
Foreign currency translation |
| • | assets and liabilities for each balance sheet presented are translated at the closing rate at the date of that balance sheet; |
| • | income and expenses for each statement of profit or loss and statement of comprehensive income are translated at average exchange rates (unless this is not a reasonable approximation of the cumulative effect of the rates prevailing on the transaction dates, in which case income and expenses are translated at the dates of the transactions), and |
| • | all resulting exchange differences are recognized in other comprehensive income. |
2.4 |
Cash and cash equivalents |
2.5 |
Financial assets |
| • | those to be measured subsequently at fair value (either through OCI or through profit or loss), and |
| • | those to be measured at amortized cost. |
2.6 |
Accounts receivables |
2.7 |
Intangible assets |
| • | It is technically feasible to complete the software product so that it will be available for use. |
| • | Management intends to complete the software product and use or sell it. |
| • | There is an ability to use or sell the software product. |
| • | It can be demonstrated how the software product will generate probable future economic benefits. |
| • | Adequate technical, financial and other resources to complete the development and to use or sell the software product are available. |
| • | The expenditure attributable to the software product during its development can be reliably measured. |
2.8 |
Property and equipment |
2.9 |
Leases |
| • | If there are significant penalties to terminate (or not extend), the Group is typically reasonably certain to extend (or not terminate). |
| • | If any leasehold improvements are expected to have a significant remaining value, the Group is typically reasonably certain to extend (or not terminate). |
| • | Otherwise, the Group considers other factors including historical lease durations and the costs and business disruption required to replace the leased asset. |
2.10 |
Accounts payables |
2.11 |
Provisions |
2.12 |
Profit-sharing and bonus plans |
2.13 |
Income taxes |
2.14 |
Capital |
| • | the profit attributable to owners of the Entity; |
| • | by the weighted average number of shares outstanding during the financial year, adjusted for bonus elements in shares issued during the year and excluding treasury shares. |
| • | the after-income tax effect of interest and other financing costs associated with dilutive potential ordinary shares, and; |
| • | the weighted average number of additional ordinary shares that would have been outstanding assuming the conversion of all dilutive potential ordinary shares. |
2.15 |
Revenue recognition |
(a) |
Management fees |
(b) |
Performance fees |
| • | Performance fee must be assessed based on a verifiable index, the benchmark, obtained from an independent source, and compatible with the corresponding fund investment policy. |
| • | Performance fee may not be calculated at a percentage lower than 100.0% of the index. |
| • | The performance fee cannot be charged in a period less than 6 months (except for private asset funds). |
| • | The performance fee shall be calculated based on net asset value, including management fees and all other expenses and may consider any distribution for shareholders in the calculation. |
(c) |
Financial advisory services |
2.16 |
Business Combinations |
2.17 |
Loans and obligations |
3 |
Accounting estimates and judgments |
| • | Allowance of expected credit losses of accounts receivable. |
| • | Provision for profit sharing. |
| • | Consolidation of subsidiaries. |
| • | Fair value measurement of financial assets. |
| • | Provision for contingent liabilities. |
| • | Impairment for goodwill and other intangible assets. |
| • | Fair value measurement of contingent consideration. |
| • | Fair value of share-based payments. |
| • | Financial evaluation of compound instruments. |
4 |
Financial risk management |
4.1 |
Financial risk factors |
(a) |
Credit risk |
| • | Accounts receivable. |
| • | Debt investments carried at amortized cost. |
(b) |
Market risk |
Balance sheet |
12/31/2023 |
12/31/2022 |
||||||
| Cash and cash equivalents |
||||||||
| Financial instruments at fair value through profit or loss |
||||||||
| Accounts receivable |
||||||||
| Other receivables |
||||||||
| |
|
|
|
|||||
| Current assets |
||||||||
| Other receivables |
( |
) | ||||||
| Leases, property and equipment |
||||||||
| |
|
|
|
|||||
| Non-current assets |
||||||||
| Trade payables |
||||||||
| Loans and obligations |
||||||||
| Labor and social security obligations |
||||||||
| |
|
|
|
|||||
| Current liabilities |
||||||||
| Payables to related parties |
||||||||
| Other payables |
||||||||
| Loans and obligations |
||||||||
| Lease |
||||||||
| |
|
|
|
|||||
| Non-current liabilities |
||||||||
| |
|
|
|
|||||
| Net Equity |
||||||||
| |
|
|
|
|||||
Net foreign exchange result |
12/31/2023 |
12/31/2022 |
12/31/2021 |
|||||||||
| Financial revenue |
||||||||||||
| Financial expense |
( |
) | ( |
) | ( |
) | ||||||
| |
|
|
|
|
|
|||||||
| Net foreign exchange result, net |
( |
) |
( |
) |
( |
) | ||||||
| |
|
|
|
|
|
|||||||
(c) |
Liquidity risk |
12/31/2023 |
12/31/2022 |
|||||||
| Cash and cash equivalents |
||||||||
| Financial instruments at fair value through profit or loss (i) |
||||||||
| Trade payables |
( |
) | ( |
) | ||||
| Labor and social security obligations |
( |
) | ( |
) | ||||
| Accounts payable |
( |
) | ( |
) | ||||
| Lease liabilities |
( |
) | ( |
) | ||||
| Convertible preferred shares |
( |
) | ||||||
| Commercial notes |
( |
) | ( |
) | ||||
| Consideration payable |
( |
) | ( |
) | ||||
| Contingent consideration |
( |
) | ( |
) | ||||
| Retirement plans liabilities |
( |
) | ||||||
| |
|
|
|
|||||
| Net debt |
||||||||
| (i) | Comprised of liquid and illiquid investments. Liquid investments are current assets that are traded in an active market. Illiquid investments are comprised of assets that trade infrequently. |
Financial liabilities |
Other assets |
|||||||||||||||||||||||
Payables |
Loans and obligations |
Retirement plans |
Lease liabilities |
Cash and cash equivalents |
Financial instruments at fair value through profit or loss |
|||||||||||||||||||
| Net debt as at |
||||||||||||||||||||||||
| December 31, 2021 |
( |
) |
— |
— |
( |
) |
||||||||||||||||||
| |
|
|
|
|
|
|
|
|
|
|
|
|||||||||||||
| Cash flow and dividends provision |
— | — | ( |
) | ||||||||||||||||||||
| Fair value adjustment |
— | — | — | — | ||||||||||||||||||||
| Addition and finance expenses accrual |
— | ( |
) | — | ( |
) | — | — | ||||||||||||||||
| Foreign exchange adjustments |
— | — | — | — | — | |||||||||||||||||||
| Other changes (i) |
— | — | — | — | — | |||||||||||||||||||
| |
|
|
|
|
|
|
|
|
|
|
|
|||||||||||||
| December 31, 2022 |
( |
) |
( |
) |
— |
( |
) |
|||||||||||||||||
| |
|
|
|
|
|
|
|
|
|
|
|
|||||||||||||
| Cash flow and dividends provision |
( |
) | ( |
) | ( |
) | ||||||||||||||||||
| Fair value adjustment |
— | ( |
) | ( |
) | ( |
) | |||||||||||||||||
| Addition and finance expenses accrual |
— | ( |
) | — | — | — | ||||||||||||||||||
| Foreign exchange adjustments |
— | — | — | — | ||||||||||||||||||||
| Other changes (i) |
— | — | ( |
) | — | — | ||||||||||||||||||
| |
|
|
|
|
|
|
|
|
|
|
|
|||||||||||||
| December 31, 2023 |
( |
) |
( |
) |
( |
) |
( |
) |
||||||||||||||||
| (i) | Other changes include non-cash movements, including Cumulative Translation Adjustments (“CTA”) which are being presented as in other comprehensive income statements. |
Contractual maturities of financial liabilities at December 31, 2023 |
Less than 1 year |
Between 1 and 3 years |
Over 3 years |
Total |
Carrying amount |
|||||||||||||||
| Trade payables |
( |
) | — | — |
( |
) |
( |
) | ||||||||||||
| Labor and social security obligations |
( |
) | ( |
) | ( |
) | ( |
) |
( |
) | ||||||||||
| Lease liabilities |
( |
) | ( |
) | ( |
) | ( |
) |
( |
) | ||||||||||
| Accounts payable |
( |
) | — | — | ( |
) |
( |
) | ||||||||||||
| Loans and financing |
( |
) | ( |
) | ( |
) | ( |
) |
( |
) | ||||||||||
| |
|
|
|
|
|
|
|
|
|
|||||||||||
| Total |
( |
) |
( |
) |
( |
) |
( |
) |
( |
) | ||||||||||
| |
|
|
|
|
|
|
|
|
|
|||||||||||
| Contractual maturities of financial liabilities at December 31, 2022 |
Less than 1 year |
Between 1 and 3 years |
Over 3 years |
Total |
Carrying amount |
|||||||||||||||
| Trade payables |
( |
) | — | — |
( |
) |
( |
) | ||||||||||||
| Labor and social security obligations |
( |
) | ( |
) | — |
( |
) |
( |
) | |||||||||||
| Lease liabilities |
( |
) | ( |
) | ( |
) | ( |
) |
( |
) | ||||||||||
| Accounts payable |
( |
) | — |
( |
) |
( |
) | |||||||||||||
| Loans and financing |
( |
) | ( |
) | ( |
) | ( |
) |
( |
) | ||||||||||
| |
|
|
|
|
|
|
|
|
|
|||||||||||
| Total |
( |
) |
( |
) |
( |
) |
( |
) |
( |
) | ||||||||||
| |
|
|
|
|
|
|
|
|
|
|||||||||||
Contractual maturities of |
Total |
Carrying amount |
||||||||||||||||||
financial liabilities |
Rio de Janeiro |
São Paulo |
NY Office |
contractual |
non-current |
|||||||||||||||
| At 31 December 2023 |
Office (BM336) |
Office | (3rd Avenue) | cash flows | liabilities | |||||||||||||||
| 2025 |
( |
) | ( |
) | — | ( |
) | ( |
) | |||||||||||
| 2026 |
( |
) | ( |
) | — | ( |
) | ( |
) | |||||||||||
| 2027 |
( |
) | — | — | ( |
) | ( |
) | ||||||||||||
| 2028 |
( |
) | — | — | ( |
) | ( |
) | ||||||||||||
| 2029 |
( |
) | — | — | ( |
) | ( |
) | ||||||||||||
| 2030 |
( |
) | — | — | ( |
) | ( |
) | ||||||||||||
| |
|
|
|
|
|
|
|
|
|
|||||||||||
| Total |
( |
) |
( |
) |
( |
) |
( |
) | ||||||||||||
Contractual maturities of |
Total |
Carrying amount |
||||||||||||||||||
financial liabilities |
Rio de Janeiro |
São Paulo |
NY Office |
contractual |
non-current |
|||||||||||||||
| At 31 December 2022 |
Office (BM336) |
Office | (3rd Avenue) | cash flows | liabilities | |||||||||||||||
| 2024 |
( |
) | ( |
) | ( |
) | ( |
) | ( |
) | ||||||||||
| 2025 |
( |
) | ( |
) | — | ( |
) | ( |
) | |||||||||||
| 2026 |
( |
) | ( |
) | — | ( |
) | ( |
) | |||||||||||
| 2027 |
( |
) | — | — | ( |
) | ( |
) | ||||||||||||
| 2028 |
( |
) | — | — | ( |
) | ( |
) | ||||||||||||
| 2029 |
( |
) | — | — | ( |
) | ( |
) | ||||||||||||
| 2030 |
( |
) | — | — | ( |
) | ( |
) | ||||||||||||
| |
|
|
|
|
|
|
|
|
|
|||||||||||
| Total |
( |
) |
( |
) |
( |
) |
( |
) |
( |
) | ||||||||||
(d) |
Sensitivity analysis |
| • | |
| • | |
Financial Impact (**) | ||||||||
| Risk Factor |
Variation in |
Stress Scenario (*) |
12/31/2023 |
12/31/2022 | ||||
| Current inflation |
||||||||
| Exchange traded real estate funds |
( |
( | ||||||
| Brazilian stock prices |
( |
( | ||||||
| Fixed-rate offshore rates |
( |
( | ||||||
| Foreign exchange rate |
( |
|||||||
| Domestic base overnight rate |
( |
( | ||||||
5 |
Financial instruments |
| • | an overview of all financial instruments held by the Group |
| • | specific information about each type of financial instrument |
| • | accounting policies |
| • | information about determining the fair value of the instruments, including judgements and estimation uncertainty involved. |
| • | those measured at fair value or through profit or loss, and |
| • | those measured at amortized cost. |
Financial assets |
Section |
12/31/2023 |
12/31/2022 |
|||||||||
| Accounts receivable |
(a | ) | ||||||||||
| Other financial assets at amortized cost |
(b | ) | ||||||||||
| Cash and cash equivalents |
(c | ) | ||||||||||
| Financial assets at fair value through profit or loss (FVPL) |
(d | ) | ||||||||||
| |
|
|
|
|||||||||
Financial liabilities |
||||||||||||
| Liabilities at amortized cost |
(e | ) | ||||||||||
| Lease liabilities |
(e | ) | ||||||||||
| Loans and financing |
(e | ) | ||||||||||
| |
|
|
|
|||||||||
| a) | Accounts receivable |
Current assets |
12/31/2023 |
12/31/2022 |
||||||
| Accounts receivable from contracts with customers |
||||||||
| Loss allowance |
( |
) | ( |
) | ||||
Non-current assets |
||||||||
| Accounts receivable from contracts with customers |
||||||||
| |
|
|
|
|||||
12/31/2023 |
12/31/2022 |
|||||||
| Opening loss allowance on January 1 |
( |
) | ( |
) | ||||
| Decrease in accounts receivable allowance recognized in profit or loss |
||||||||
| |
|
|
|
|||||
| Closing loss allowance on December 31 |
( |
) | ( |
) | ||||
| b) | Other financial assets at amortized cost |
12/31/2023 |
12/31/2022 |
|||||||
| Employees loans (Note 6 (i)) |
||||||||
| c) | Cash and cash equivalents |
12/31/2023 |
12/31/2022 |
|||||||
| Cash and bank deposits |
||||||||
| Financial instruments at fair value through profit or loss (i) |
||||||||
| Financial instruments at amortized cost (ii) |
||||||||
| |
|
|
|
|||||
| d) | Financial assets at fair value through profit or loss |
| • | Mutual funds; |
| • | Private markets funds. |
12/31/2023 |
12/31/2022 |
|||||||
| Current assets |
||||||||
| |
|
|
|
|||||
| Mutual funds |
||||||||
| Non-current assets |
||||||||
| |
|
|
|
|||||
| Private markets funds |
||||||||
Mutual funds |
12/31/2023 |
12/31/2022 |
||||||
| Vinci Monalisa FIM Crédito Privado IE (2) |
||||||||
| Vinci Multiestratégia FIM |
||||||||
| Vinci International Master Portfolio SPC - Reflation SP |
||||||||
| Vinci Institucional FI RF Referenciado DI |
||||||||
| Vinci Reservas Técnicas FI RF DI |
||||||||
| Retirement services investment funds (1) |
||||||||
| FI Vinci Renda Fixa CP |
||||||||
| |
|
|
|
|||||
Private markets |
12/31/2023 |
12/31/2022 |
||||||
| Vinci Capital Partners III Feeder FIP Multiestratégia |
||||||||
| Nordeste III FIP Multiestratégia |
||||||||
| |
|
|
|
|||||
| Total Private markets funds |
||||||||
| |
|
|
|
|||||
Net Asset Value |
12/31/2023 |
12/31/2022 |
||||||
| |
|
|
|
|||||
| Real estate funds |
||||||||
| Mutual funds |
||||||||
| Private equity funds |
||||||||
| Other assets/liabilities |
||||||||
Mutual Funds’ classification |
12/31/2023 |
12/31/2022 |
||||||
| Interest and foreign exchange (a) |
% | % | ||||||
| Unrestricted investments (b) |
% | |||||||
| Foreign investments (c) |
% | % | ||||||
| Macro (d) |
% | % | ||||||
| Specific strategy (e) |
% | % | ||||||
| |
|
|
|
|||||
| % | % | |||||||
| |
|
|
|
|||||
| (a) | Funds that seek long-term returns via investments in fixed-income assets, admitting strategies that imply interest risk, price index risk and foreign currency risk. |
| (b) | Funds without commitment to concentration in any specific strategy. |
| (c) | Funds that invest in financial assets abroad in a portion greater than |
| (d) | Funds that operate in various asset classes (fixed income, variable income, foreign exchange, etc.), with investment strategies based on medium and long-term macroeconomic scenarios. |
| (e) | Funds that adopt an investment strategy that involves specific risks, such as commodities, futures of index, etc. |
Real Estate funds |
12/31/2023 |
12/31/2022 |
||||||
| Vinci Credit Securities FII (i) |
||||||||
| Vinci Imóveis Urbanos FII (ii) |
||||||||
| Vinci Offices FII (iii) |
||||||||
| Vinci Fulwood DL FII (iv) |
||||||||
| Other real estate funds (v) |
||||||||
| |
|
|
|
|||||
Private markets funds |
12/31/2023 |
12/31/2022 |
||||||
| Vinci Impacto Ret IV FIP Multiestratégia |
||||||||
| Vinci Infra Coinvestimento I FIP - Infraestrutura (i) |
||||||||
| Vinci Infra Água e Saneamento Strategy FIP - Infraestrutura |
||||||||
| Vinci Crédito Infra Institucional Fundo Incentivado - Infraestrutura |
||||||||
| Other funds |
||||||||
| |
|
|
|
|||||
| Total private markets funds |
||||||||
| |
|
|
|
|||||
12/31/2023 |
12/31/2022 |
12/31/2021 |
||||||||||
| Fair value gains on investments at FVPL recognized in finance income |
||||||||||||
| e) | Financial liabilities |
Current |
12/31/2023 |
12/31/2022 |
||||||
| |
|
|
|
|||||
| Trade payables |
||||||||
| Labor and social security obligations (Note 12) |
||||||||
| Loans and obligations (Note 14) |
||||||||
| Lease liabilities |
||||||||
| Accounts payable (Note 11) |
||||||||
| Non-current |
||||||||
| |
|
|
|
|||||
| Lease liabilities |
||||||||
| Labor and social security obligations (Note 12) |
||||||||
| Loans and obligations (Note 14) |
||||||||
| |
|
|
|
|||||
(a) |
Fair value hierarchy |
On December 31, 2023 |
||||||||||||||||
Recurring fair value measurements |
Level 1 |
Level 2 |
Level 3 |
Total |
||||||||||||
| Financial Assets |
||||||||||||||||
| Certificate of deposits |
— | — | ||||||||||||||
| Mutual funds |
— | — | ||||||||||||||
| Private equity funds |
— | — | ||||||||||||||
| |
|
|
|
|
|
|
|
|||||||||
| Total Financial Assets |
— |
|||||||||||||||
On December 31, 2022 |
||||||||||||||||
Recurring fair value measurements |
Level 1 |
Level 2 |
Level 3 |
Total |
||||||||||||
| Financial Assets |
||||||||||||||||
| Certificate of deposits |
— | — | ||||||||||||||
| Mutual funds |
— | — | ||||||||||||||
| Private equity funds |
— | — | ||||||||||||||
| |
|
|
|
|
|
|
|
|||||||||
| Total Financial Assets |
— |
|||||||||||||||
(b) |
Valuation techniques used to determine fair values |
| • | the use of quoted market prices |
| • | for level 3 financial instruments – discounted cash flow analysis. |
(c) |
Fair value measurements using significant unobservable inputs (level 3) |
Fair Value |
||||
| Opening balance January 1, 2022 |
||||
| Capital deployment |
||||
| Sales and distributions (a) |
( |
) | ||
| Gain recognized in finance income |
||||
| |
|
|||
| Closing balance December 31, 2022 |
||||
| Capital deployment |
||||
| Sales and distributions |
( |
) | ||
| Gain recognized in finance income |
||||
| |
|
|||
| Closing balance December 31, 2023 |
||||
| (a) | In 2022, Vinci Infra Transmissão FIP – Infraestrutura was transferred to Vinci Monalisa. |
6 |
Other assets |
12/31/2023 |
12/31/2022 |
|||||||
| Employees loans (i) |
||||||||
| Sundry advances |
||||||||
| Advances to projects in progress (ii) |
||||||||
| Other prepayments |
||||||||
| Related parties’ receivables (iii) |
||||||||
| Guarantee deposits (iv) |
||||||||
| Receivables from employees (v) |
||||||||
| Sublease receivables |
||||||||
| Others |
||||||||
| |
|
|
|
|||||
| |
|
|
|
|||||
| Current |
||||||||
| Non-current |
||||||||
| |
|
|
|
|||||
| |
|
|
|
|||||
| (i) | Refers to amounts receivable from employees. |
| (ii) | Refers to costs incurred by projects related to funds administered by Vinci, that are initially paid by the Group and subsequently reimbursed. |
| (iii) | Refers to an intercompany transaction. See Note 21 (b) for more details. |
| (iv) | Refers to the security deposit of a lease. |
| (v) | Refers to an intercompany transaction. See Note 21 (d) for more details. |
7 |
Investments |
| (a) | Business Combination |
| (i) | Summary of acquisition |
| Cash paid |
||||
| Consideration payable – Note 14 (iii) |
||||
| Contingent consideration (Earn-out) – Note 14 (iv) |
||||
| |
|
|||
| Total purchase consideration |
||||
| |
|
| Cash and cash equivalents |
||||
| Accounts receivable |
||||
| Taxes recoverable |
||||
| Other assets |
||||
| Property and equipment |
||||
| Trade payables |
( |
) | ||
| Labor and social security obligations |
( |
) | ||
| Taxes and contributions payable |
( |
) | ||
| Management contracts (*) |
||||
| |
|
|||
| Net identifiable assets acquired |
||||
| Goodwill |
||||
| Net assets acquired |
||||
| |
|
| (b) | Non-controlling interests (NC I) |
Vinci Asset Allocation |
Vinci Holding Securitária |
Total |
||||||||||||||||||||||
12/31/2023 |
12/31/2022 |
12/31/2023 |
12/31/2022 |
12/31/2023 |
12/31/2022 |
|||||||||||||||||||
| Summarized Balance Sheet |
||||||||||||||||||||||||
| Current assets |
— | |||||||||||||||||||||||
| Current liabilities |
( |
) | ( |
) | ( |
) | ( |
) | ( |
) | ( |
) | ||||||||||||
| |
|
|
|
|
|
|
|
|
|
|
|
|||||||||||||
| Current net assets |
( |
) | ( |
) | ||||||||||||||||||||
| Non-current assets |
||||||||||||||||||||||||
| Non-current liabilities |
( |
) | ( |
) | ( |
) | ( |
) | ( |
) | ( |
) | ||||||||||||
| |
|
|
|
|
|
|
|
|
|
|
|
|||||||||||||
| Non-current net assets |
( |
) | ( |
) | ( |
) | ( |
) | ||||||||||||||||
| Net assets |
( |
) | ( |
) | ||||||||||||||||||||
| |
|
|
|
|
|
|
|
|
|
|
|
|||||||||||||
| Accumulated NCI |
( |
) | ( |
) | ||||||||||||||||||||
| |
|
|
|
|
|
|
|
|
|
|
|
|||||||||||||
| Summarized statement |
Vinci Asset Allocation |
Vinci Holding Securitária |
Vinci Int’l Real Estate |
Total |
||||||||||||||||||||||||
| of comprehensive income |
12/31/2023 |
12/31/2022 |
12/31/2023 |
12/31/2022 |
12/31/2022 |
12/31/2023 |
12/31/2022 |
|||||||||||||||||||||
| Revenue |
— | — | ||||||||||||||||||||||||||
| Profit for the period |
( |
) | ( |
) | ( |
) | — | ( |
) | |||||||||||||||||||
| Total comprehensive income |
( |
) | ( |
) | ( |
) | — | ( |
) | |||||||||||||||||||
| |
|
|
|
|
|
|
|
|
|
|
|
|
|
|||||||||||||||
| Profit/(loss) allocated to NCI |
( |
) |
( |
) |
( |
) |
— |
( |
) |
( |
) | |||||||||||||||||
| |
|
|
|
|
|
|
|
|
|
|
|
|
|
|||||||||||||||
8 |
Property and equipment |
12/31/2023 |
||||||||||||||||||||||||
Furniture and fittings stuffs |
Improvements in properties of third parties |
Computers and peripherals - improvements |
Equipment and tools |
Work of arts and others |
Total |
|||||||||||||||||||
| Cost |
||||||||||||||||||||||||
| At January 1, 2023 |
||||||||||||||||||||||||
| Acquisitions, net of disposals |
( |
) | ||||||||||||||||||||||
| Foreign Exchange variations of property and equipment abroad |
( |
) | ( |
) | ( |
) | ||||||||||||||||||
| |
|
|
|
|
|
|
|
|
|
|
|
|||||||||||||
| At December 31, 2023 |
||||||||||||||||||||||||
| |
|
|
|
|
|
|
|
|
|
|
|
|||||||||||||
| Accumulated depreciation At January 1, 2023 |
( |
) | ( |
) | ( |
) | ( |
) | ( |
) | ||||||||||||||
| Depreciation |
( |
) | ( |
) | ( |
) | ( |
) | ( |
) | ||||||||||||||
| Foreign Exchange variations of property and equipment abroad |
||||||||||||||||||||||||
| |
|
|
|
|
|
|
|
|
|
|
|
|||||||||||||
| At December 31, 2023 |
( |
) | ( |
) | ( |
) | ( |
) | ( |
) | ||||||||||||||
| |
|
|
|
|
|
|
|
|
|
|
|
|||||||||||||
| Net book value |
||||||||||||||||||||||||
| At January 1, 2023 |
||||||||||||||||||||||||
| |
|
|
|
|
|
|
|
|
|
|
|
|||||||||||||
| At December 31, 2023 |
||||||||||||||||||||||||
| |
|
|
|
|
|
|
|
|
|
|
|
|||||||||||||
| Annual depreciation rate - % |
From |
|||||||||||||||||||||||
12/31/2022 |
||||||||||||||||||||||||
Furniture and fittings stuffs |
Improvements in properties of third parties |
Computers and peripherals - improvements |
Equipment and tools |
Work of arts and others |
Total |
|||||||||||||||||||
| Cost |
||||||||||||||||||||||||
| At January 1, 2022 |
||||||||||||||||||||||||
| Aquisitions |
||||||||||||||||||||||||
| Assets recognized as a result of SPS acquisition |
||||||||||||||||||||||||
| Foreign Exchange variations of property and equipment abroad |
( |
) | ( |
) | ( |
) | ||||||||||||||||||
| |
|
|
|
|
|
|
|
|
|
|
|
|||||||||||||
| At December 31, 2022 |
||||||||||||||||||||||||
| |
|
|
|
|
|
|
|
|
|
|
|
|||||||||||||
| Accumulated depreciation At January 1, 2022 |
( |
) | ( |
) | ( |
) | ( |
) | ( |
) | ||||||||||||||
| Depreciation |
( |
) | ( |
) | ( |
) | ( |
) | ( |
) | ||||||||||||||
| Foreign Exchange variations of property and equipment abroad |
||||||||||||||||||||||||
| |
|
|
|
|
|
|
|
|
|
|
|
|||||||||||||
| At December 31, 2022 |
( |
) | ( |
) | ( |
) | ( |
) | ( |
) | ||||||||||||||
| |
|
|
|
|
|
|
|
|
|
|
|
|||||||||||||
| Net book value |
||||||||||||||||||||||||
| At January 1, 2022 |
||||||||||||||||||||||||
| |
|
|
|
|
|
|
|
|
|
|
|
|||||||||||||
| At December 31, 2022 |
||||||||||||||||||||||||
| |
|
|
|
|
|
|
|
|
|
|
|
|||||||||||||
| Annual depreciation rate - % |
From |
|||||||||||||||||||||||
9 |
Intangible assets |
12/31/2023 |
||||||||||||||||||||
Software development |
Placement Agent (a) |
Goodwill (b) |
Management Contracts (c) |
Total |
||||||||||||||||
| Cost |
||||||||||||||||||||
| At January 1, 2023 |
||||||||||||||||||||
| Additions |
||||||||||||||||||||
| Foreign exchange variation of intangible assets abroad |
( |
) | ( |
) | ( |
) | ||||||||||||||
| |
|
|
|
|
|
|
|
|
|
|||||||||||
| At December 31, 2023 |
||||||||||||||||||||
| |
|
|
|
|
|
|
|
|
|
|||||||||||
| Accumulated amortization |
||||||||||||||||||||
| At January 1, 2023 |
( |
) | ( |
) | ( |
) | ( |
) | ||||||||||||
| Amortization |
( |
) | ( |
) | ( |
) | ( |
) | ||||||||||||
| Foreign exchange variation of intangible assets abroad |
||||||||||||||||||||
| |
|
|
|
|
|
|
|
|
|
|||||||||||
| At December 31, 2023 |
( |
) | ( |
) | ( |
) | ( |
) | ||||||||||||
| |
|
|
|
|
|
|
|
|
|
|||||||||||
| At January 1, 2023 |
||||||||||||||||||||
| |
|
|
|
|
|
|
|
|
|
|||||||||||
| At December 31, 2023 |
||||||||||||||||||||
| |
|
|
|
|
|
|
|
|
|
|||||||||||
| Amortization rate (per year) - % |
% | (a | ) | (b | ) | (c | ) | |||||||||||||
| Annual inflation rate – Brazil |
% | |||
| Discount Rate |
% |
12/31/2022 |
||||||||||||||||||||
Software development |
Placement Agent (a) |
Goodwill (b) |
Management Contracts (c) |
Total |
||||||||||||||||
| Cost |
||||||||||||||||||||
| At January 1, 2022 |
||||||||||||||||||||
| Additions |
||||||||||||||||||||
| Assets recognized as a result of SPS acquisition |
||||||||||||||||||||
| Foreign exchange variation of intangible assets abroad |
( |
) | ( |
) | ||||||||||||||||
| |
|
|
|
|
|
|
|
|
|
|||||||||||
| At December 31, 2022 |
||||||||||||||||||||
| |
|
|
|
|
|
|
|
|
|
|||||||||||
| Accumulated amortization |
||||||||||||||||||||
| At January 1, 2022 |
( |
) | ( |
) | ||||||||||||||||
| Annual amortization |
( |
) | ( |
) | ( |
) | ( |
) | ||||||||||||
| Foreign exchange variation of intangible assets abroad |
||||||||||||||||||||
| |
|
|
|
|
|
|
|
|
|
|||||||||||
| At December 31, 2022 |
( |
) | ( |
) | ( |
) | ( |
) | ||||||||||||
| |
|
|
|
|
|
|
|
|
|
|||||||||||
| At January 1, 2022 |
||||||||||||||||||||
| |
|
|
|
|
|
|
|
|
|
|||||||||||
| At December 30, 2022 |
||||||||||||||||||||
| |
|
|
|
|
|
|
|
|
|
|||||||||||
| Amortization rate (per year) - % |
% | (a | ) | (b | ) | (c | ) | |||||||||||||
10 |
Leases |
| (i) | Amount recognized in the balance sheet |
12/31/2023 |
12/31/2022 |
|||||||
| Sub-lease receivable |
||||||||
| Rio de Janeiro Office - BM 336 |
||||||||
| |
|
|
|
|||||
| Total |
||||||||
| |
|
|
|
|||||
| Current |
||||||||
| Non-current |
||||||||
| |
|
|
|
|||||
| Total |
||||||||
| |
|
|
|
|||||
| Right of use assets |
||||||||
| Rio de Janeiro Office - BM 336 |
||||||||
| São Paulo Office – JRA |
||||||||
| NY Office - Third Avenue |
||||||||
| |
|
|
|
|||||
| Total |
||||||||
| |
|
|
|
|||||
| Lease liabilities |
||||||||
| Rio de Janeiro Office - BM 336 |
( |
) | ( |
) | ||||
| São Paulo Office – JRA |
( |
) | ( |
) | ||||
| NY Office - Third Avenue |
( |
) | ( |
) | ||||
| |
|
|
|
|||||
| Total |
( |
) |
( |
) | ||||
| |
|
|
|
|||||
| Current |
( |
) | ( |
) | ||||
| Non-current |
( |
) | ( |
) | ||||
| |
|
|
|
|||||
| Total |
( |
) |
( |
) | ||||
| |
|
|
|
|||||
| (ii) | Amount recorded in the statement of profit or loss |
| 2023 | 2022 | 2021 | ||||||||||
| Right of use assets depreciation |
( |
) | ( |
) | ( |
) | ||||||
| Financial expense |
( |
) | ( |
) | ( |
) | ||||||
| |
|
|
|
|
|
|||||||
( |
) |
( |
) |
( |
) | |||||||
| |
|
|
|
|
|
|||||||
| (i) | The Group’s leasing activities and how these are accounted for. |
| • | fixed payments (including in-substance fixed payments), less any lease incentives receivable |
| • | variable lease payment that are based on an index or a rate, initially measured using the index or rate as at the commencement date |
| • | amounts expected to be payable by the group under residual value guarantees |
| • | the exercise price of a purchase option if the group is reasonably certain to exercise that option, and |
| • | payments of penalties for terminating the lease, if the lease term reflects the group exercising that option. |
| • | if possible, uses recent third-party financing received by the individual lessee as a starting point, adjusted to reflect changes in financing conditions since third party financing was received |
| • | uses a build-up approach that starts with a risk-free interest rate adjusted for credit risk for leases, which does not have recent third party financing, and |
| • | make adjustments specific to the lease, e.g. term, country, currency and security. |
| • | the amount of the initial measurement of lease liability |
| • | any lease payments made at or before the commencement date less any lease incentives received |
| • | any initial direct costs, and |
| • | restoration costs. |
| (ii) | Extension and termination options |
11 |
Accounts payable |
12/31/2023 |
12/31/2022 |
|||||||
| Dividends payable |
||||||||
| Treasury shares acquisition |
||||||||
| Lease payable – prior month expense |
||||||||
| Other payables |
||||||||
| |
|
|
|
|||||
| |
|
|
|
|||||
12 |
Labor and social security obligations |
12/31/2023 |
12/31/2022 |
|||||||
| Profit sharing |
||||||||
| Labor provisions |
||||||||
| |
|
|
|
|||||
| |
|
|
|
|||||
| Current |
||||||||
| Non-current |
||||||||
| |
|
|
|
|||||
13 |
Taxes and contributions payable |
12/31/2023 |
12/31/2022 |
|||||||
| Income tax |
||||||||
| Social contribution |
||||||||
| Social Contribution on revenues (COFINS) |
||||||||
| Social Integration Program (PIS) |
||||||||
| Service tax (ISS) on billing |
||||||||
| Withholding Income Tax (IRRF) deducted from third parties |
||||||||
| Others |
||||||||
| |
|
|
|
|||||
| |
|
|
|
|||||
14 |
Loans and obligations |
12/31/2023 |
12/31/2022 |
|||||||
| Convertible Preferred Shares (i) |
||||||||
| Commercial Notes (ii) |
||||||||
| Consideration payable (iii) |
||||||||
| Contingent consideration (iv) |
||||||||
| |
|
|
|
|||||
| |
|
|
|
|||||
| Current |
||||||||
| Non-current |
||||||||
| |
|
|
|
|||||
(i) |
Convertible Preferred Shares |
| Fair value of the convertible preferred shares, net of transaction costs |
||||
| Net foreign exchange loss/(gain) |
( |
) | ||
| Interest expense |
||||
| |
|
|||
| Closing balance December 31, 2023 |
||||
| Current |
||||
| Non-current |
(ii) |
Commercial notes |
| Face value of the notes issued |
||||
| (-) Transaction costs |
( |
) | ||
| Interest expense |
||||
| |
|
|||
| Closing balance December 31, 2022 |
||||
| Interest expense |
||||
| Interest paid |
( |
) | ||
| Principal paid |
( |
) | ||
| |
|
|||
| Closing balance December 31, 2023 |
||||
| Current |
||||
| Non-current |
(iii) |
Consideration payable |
(iv) |
Contingent consideration |
15 |
Retirement plans liabilities |
16 |
Equity |
(a) |
Capital |
| Shareholders |
12/31/2022 Quantity |
Subscribed |
Transferred |
Repurchased |
12/31/2023 Quantity |
|||||||||||||||
| Gilberto Sayão da Silva (Class B Common shares) |
— | — | — | |||||||||||||||||
| Alessandro Monteiro Morgado Horta (Class A common shares) |
— | — | — | |||||||||||||||||
| Public Float (Class A common shares) |
— | ( |
) | |||||||||||||||||
| Other Shareholders (Class A common shares) |
— | ( |
) | — | ||||||||||||||||
| Treasury shares (Class A common shares) |
— | ( |
) | |||||||||||||||||
| |
|
|
|
|
|
|
|
|
|
|||||||||||
| Total |
— |
— |
— |
|||||||||||||||||
| Series A Convertible preferred shares (*) |
— | — | — | |||||||||||||||||
| |
|
|
|
|
|
|
|
|
|
|||||||||||
| Total |
— |
— |
— |
|||||||||||||||||
| |
|
|
|
|
|
|
|
|
|
|||||||||||
(b) |
Transactions costs |
(c) |
Retained earnings |
(d) |
Other reserves |
| (i) | Exchange variation on investees |
| (ii) | Share-based payments |
(e) |
Dividends |
(f) |
Treasury shares |
| • | The program is permitted to commence on October 1, 2021 and does not have a specified expiration date. |
| • | Buybacks shall be made in compliance with Rule 10b5-1(c)(1) under the Exchange Act; |
| • | The Repurchase Program respects the total amount of up to R$ |
(g) |
Basic and diluted earnings per share |
| a) Basic earning per share |
2023 |
2022 |
2021 |
|||||||||
| From continuing operations attributable to the ordinary equity holders of the Entity |
||||||||||||
| |
|
|
|
|
|
|||||||
| Total basic earning per share attributable to the ordinary equity holders of the Entity |
||||||||||||
| b) Diluted earning per share |
2023 |
2022 |
2021 |
|||||||||
| From continuing operations attributable to the ordinary equity holders of the Entity |
||||||||||||
| |
|
|
|
|
|
|||||||
| Total basic earning per share attributable to the ordinary equity holders of the Entity |
||||||||||||
c) Reconciliations of earnings used in calculating earnings per share |
||||||||||||
| Basic earnings per share: |
2023 |
2022 |
2021 |
|||||||||
| Profit attributable to the ordinary equity holders of the Entity used in calculating basic earnings per share: |
||||||||||||
| From continuing operations |
||||||||||||
| |
|
|
|
|
|
|||||||
| Diluted earnings per share |
2023 |
2022 |
2021 |
|||||||||
| Profit from continuing operations attributable to the ordinary equity holders of the Entity |
||||||||||||
| Used in calculating basic earnings per share |
||||||||||||
| |
|
|
|
|
|
|||||||
| Used in calculating diluted earnings per share |
||||||||||||
| d) Weighted average number of share used as the denominator |
2023 |
2022 |
2021 |
|||||||||
| Weighted average number of ordinary share/quotas used as the denominator in calculating basic earnings per share: |
||||||||||||
| Adjustments for calculation of diluted earnings per share: |
||||||||||||
| |
|
|
|
|
|
|||||||
| Weighted average number of ordinary shares/quotas and potential ordinary shares used as the denominator in calculating diluted earnings per share |
17 |
Revenue from services rendered |
2023 |
2022 |
2021 |
||||||||||
| Gross revenue from fund management |
||||||||||||
| Gross revenue from performance fees |
||||||||||||
| Gross revenue from financial advisory services |
||||||||||||
| |
|
|
|
|
|
|||||||
| Gross revenue from services rendered |
||||||||||||
| |
|
|
|
|
|
|||||||
| In Brazil |
||||||||||||
| Abroad |
||||||||||||
| Taxes and contributions |
||||||||||||
| COFINS |
( |
) | ( |
) | ( |
) | ||||||
| PIS |
( |
) | ( |
) | ( |
) | ||||||
| ISS |
( |
) | ( |
) | ( |
) | ||||||
| |
|
|
|
|
|
|||||||
| Net revenue from services rendered |
||||||||||||
| |
|
|
|
|
|
|||||||
| Net revenue from fund management |
||||||||||||
| Net revenue from performance fees |
||||||||||||
| Net revenue from advisory services |
||||||||||||
18 |
General and administrative expenses |
2023 |
2022 |
2021 |
||||||||||
| Personnel and profit-sharing (a) |
( |
) | ( |
) | ( |
) | ||||||
| Share Based Plans (b) |
( |
) | ( |
) | ( |
) | ||||||
| Profit sharing (a) |
( |
) | ( |
) | ( |
) | ||||||
| |
|
|
|
|
|
|||||||
( |
) |
( |
) |
( |
) | |||||||
| Third party expense (c) |
( |
) | ( |
) | ( |
) | ||||||
| Right of use depreciation (d) |
( |
) | ( |
) | ( |
) | ||||||
| Depreciation and amortization (e) |
( |
) | ( |
) | ( |
) | ||||||
| Travel and representations |
( |
) | ( |
) | ( |
) | ||||||
| Condominium expenses |
( |
) | ( |
) | ( |
) | ||||||
| Other operating expenses (f) |
( |
) | ( |
) | ( |
) | ||||||
| |
|
|
|
|
|
|||||||
( |
) |
( |
) |
( |
) | |||||||
(a) |
Personnel and profit-sharing |
(b) |
Share-based payments |
(c) |
Third party expense |
(d) |
Right of use depreciation |
(e) |
Depreciation and amortization |
(f) |
Other operating expenses |
19 |
Finance profit/(loss) |
2023 |
2022 |
2021 |
||||||||||
| Investment income (i) |
||||||||||||
| Financial revenue through amortized cost |
||||||||||||
| Foreign currency variation income |
||||||||||||
| Financial revenue on sublease agreements |
||||||||||||
| Contingent consideration variation (iii) |
||||||||||||
| Other finance income |
||||||||||||
| |
|
|
|
|
|
|||||||
| Finance income |
||||||||||||
| |
|
|
|
|
|
|||||||
| Financial expense on lease agreements |
( |
) | ( |
) | ( |
) | ||||||
| Interest expense on loans and financing (ii) |
( |
) | ( |
) | ||||||||
| Bank fees |
( |
) | ( |
) | ( |
) | ||||||
| Interest and arrears |
( |
) | ( |
) | ||||||||
| Investment losses (i) |
( |
) | ( |
) | ||||||||
| Fines on taxes |
( |
) | ( |
) | ( |
) | ||||||
| Foreign currency variation on liabilities at amortized cost |
( |
) | ( |
) | ( |
) | ||||||
| Interest on taxes |
( |
) | ( |
) | ||||||||
| Contingent consideration variation (iii) |
( |
) | ||||||||||
| Other financial expenses |
( |
) | ( |
) | ||||||||
| |
|
|
|
|
|
|||||||
| Finance costs |
( |
) | ( |
) | ( |
) | ||||||
| |
|
|
|
|
|
|||||||
| Finance profit/(loss), net |
||||||||||||
| |
|
|
|
|
|
|||||||
| (i) | Investment income and losses comprises the fair value changes on the financial instruments at fair value through profit or loss. Segregated investment income result is demonstrated below. |
2023 |
2022 |
2021 |
||||||||||
| Mutual funds and fixed income investments (a) |
||||||||||||
| Private equity funds |
||||||||||||
| |
|
|
|
|
|
|||||||
| Mutual funds |
( |
) | ||||||||||
| Private equity funds |
( |
) | ( |
) | ||||||||
| |
|
|
|
|
|
|||||||
( |
) |
( |
) |
|||||||||
| (a) | Vinci Monalisa corresponds to the most part of the Group’s investment income. |
| (ii) | Interest expense on loans and financing comprises the financial result on the Commercial notes, the consideration payable related to SPS acquisition and interest expense on the convertible preferred shares. Please see note 14 for more detail. |
| (iii) | Variation on contingent consideration comprises the financial result of the fair value evaluation. Please see note 14 (iii) for more detail. |
20 |
Income tax and social contribution |
2023 |
2022 |
2021 |
||||||||||
| Current income tax |
( |
) | ( |
) | ( |
) | ||||||
| Current social contribution |
( |
) | ( |
) | ( |
) | ||||||
| |
|
|
|
|
|
|||||||
| ( |
) | ( |
) | ( |
) | |||||||
| |
|
|
|
|
|
|||||||
| Deferred income tax |
||||||||||||
| Deferred social contribution |
||||||||||||
| |
|
|
|
|
|
|||||||
| |
|
|
|
|
|
|||||||
Deferred |
tax balances |
12/31/2023 |
12/31/2022 |
|||||||
| Deferred tax assets |
||||||||
| Tax losses |
||||||||
| Leases |
||||||||
| RSU |
||||||||
| Interest expense on obligation for acquisition |
||||||||
| Amortization on management Contracts |
||||||||
| Contingent consideration |
||||||||
| |
|
|
|
|||||
| Total |
||||||||
| |
|
|
|
|||||
| Deferred tax liabilities |
||||||||
| Financial revenue |
( |
) |
( |
) | ||||
| Estimated revenue |
( |
) |
( |
) | ||||
| Leases |
( |
) |
( |
) | ||||
| Contingent consideration |
( |
) | ||||||
| |
|
|
|
|||||
| Total Income Tax |
( |
) |
( |
) | ||||
| |
|
|
|
| Estimated revenue |
( |
) | ( |
) | ||||
| |
|
|
|
|||||
| Total (Taxes and contribution) |
( |
) |
( |
) | ||||
| |
|
|
|
|||||
| Total deferred tax liabilities |
( |
) |
( |
) | ||||
| |
|
|
|
Movements |
Tax losses |
Leases |
RSU |
Other (*) |
Total |
|||||||||||||||
| Deferred tax assets |
||||||||||||||||||||
| As at December 31, 2021 |
||||||||||||||||||||
| to profit and loss |
( |
) |
||||||||||||||||||
| |
|
|
|
|
|
|
|
|
|
|||||||||||
| As at December 31, 2022 |
||||||||||||||||||||
| |
|
|
|
|
|
|
|
|
|
|||||||||||
| to profit and loss |
( |
) |
||||||||||||||||||
| |
|
|
|
|
|
|
|
|
|
|||||||||||
| As at December 31, 2023 |
||||||||||||||||||||
| |
|
|
|
|
|
|
|
|
|
|||||||||||
Movements |
Financial Revenue |
Estimated Revenue |
Leases |
Contingent consideration |
Total |
|||||||||||||||
| Deferred tax liabilities |
||||||||||||||||||||
| As at December 31, 2021 |
( |
) |
( |
) |
( |
) | ||||||||||||||
| to profit and loss |
( |
) |
( |
) |
( |
) | ||||||||||||||
| |
|
|
|
|
|
|
|
|
|
|||||||||||
| As at December 31, 2022 |
( |
) |
( |
) |
( |
) |
( |
) |
( |
) | ||||||||||
| |
|
|
|
|
|
|
|
|
|
|||||||||||
| to profit and loss |
( |
) |
( |
) |
||||||||||||||||
| |
|
|
|
|
|
|
|
|
|
|||||||||||
| As at December 31, 2023 |
( |
) |
( |
) |
( |
) |
( |
) | ||||||||||||
| |
|
|
|
|
|
|
|
|
|
|||||||||||
(a) |
Tax effective rate |
2023 |
2022 |
2021 |
||||||||||
| Profit (loss) before income taxes |
||||||||||||
| Combined statutory income taxes rate - % |
% | % | % | |||||||||
| |
|
|
|
|
|
|||||||
| Income tax benefit (expense) at statutory rates |
( |
) |
( |
) |
( |
) | ||||||
| Reconciliation adjustments: |
||||||||||||
| Expenses not deductible |
( |
) | ( |
) | ( |
) | ||||||
| Tax benefits |
||||||||||||
| Share based payments |
( |
) | ( |
) | ( |
) | ||||||
| Unrecognized tax loss credits |
( |
) | ||||||||||
| Effect of presumed profit of subsidiaries (i) and offshore subsidiaries |
||||||||||||
| Other additions (exclusions), net |
||||||||||||
| Income taxes expenses |
( |
) |
( |
) |
( |
) | ||||||
| Current |
( |
) | ( |
) | ( |
) | ||||||
| Deferred |
||||||||||||
| Effective rate |
% | % | % | |||||||||
| (i) | Brazilian tax law establishes that companies that generate gross revenues of up to R$ resu med profit income tax regime. The Entity’s subsidiaries adopted this tax regime and the effect of the presumed profit of subsidiaries represents the difference between the taxation based on this method and the amount that would be due based on the statutory rate applied to the taxable profit of the subsidiaries. |
21 |
Related parties |
(a) |
Key management remuneration |
(b) |
Receivables from related parties |
12/31/2023 |
12/31/2022 |
|||||||
| Vinci Infra Investimentos V2I S.A. |
||||||||
| Cagliari Participações S.A. |
||||||||
| Accadia Participações AS |
||||||||
| Norcia Participações SA |
||||||||
| Laguna Participações S.A. |
||||||||
| VFDL 4 Empreendimentos Imobiliários LTDA |
||||||||
| Vias Participações I S.A. |
||||||||
| Verona Participações Societarias S.A. |
||||||||
| |
|
|
|
|||||
| |
|
|
|
|||||
(c) |
Employees loans |
(d) |
Receivables from employees |
22 |
Segment reporting |
Private |
Market Strategies |
(i) |
Private Equity |
(ii) |
Real Estate |
(iii) |
Infrastructure |
(iv) |
Credit |
(v) |
Special situations (SPS) |
Liquid |
Strategies |
(i) |
Hedge Funds |
(ii) |
Public equities |
Investment |
products and solutions |
Financial |
advisory services |
Vinci |
retirement services |
2023 |
||||||||||||||||||||||||||||
Private Market Strategies |
Liquid Strategies |
Investment Products and solutions |
Financial Advisory |
Vinci Retirement Services |
Corporate Center |
Total |
||||||||||||||||||||||
| In Brazil |
||||||||||||||||||||||||||||
| Abroad |
||||||||||||||||||||||||||||
| |
|
|
|
|
|
|
|
|
|
|
|
|
|
|||||||||||||||
| Gross revenue from services rendered |
||||||||||||||||||||||||||||
| |
|
|
|
|
|
|
|
|
|
|
|
|
|
|||||||||||||||
| Fund Advisory fee |
||||||||||||||||||||||||||||
| Fund Management fee |
||||||||||||||||||||||||||||
| Fund Performance fee |
||||||||||||||||||||||||||||
| Taxes and contributions |
( |
) | ( |
) | ( |
) | ( |
) | ( |
) | ( |
) | ||||||||||||||||
| |
|
|
|
|
|
|
|
|
|
|
|
|
|
|||||||||||||||
| Net revenue from services rendered |
||||||||||||||||||||||||||||
| (-) General and administrative expenses |
( |
) | ( |
) | ( |
) | ( |
) | ( |
) | ( |
) | ( |
) | ||||||||||||||
| Share-based payments |
( |
) | ( |
) | ( |
) | ( |
) | ||||||||||||||||||||
| |
|
|
|
|
|
|
|
|
|
|
|
|
|
|||||||||||||||
| Operating profit |
( |
) |
( |
) |
||||||||||||||||||||||||
| Finance income |
||||||||||||||||||||||||||||
| Finance cost |
( |
) | ||||||||||||||||||||||||||
| Finance result, net |
||||||||||||||||||||||||||||
| |
|
|||||||||||||||||||||||||||
| Profit before income taxes |
||||||||||||||||||||||||||||
| Income taxes |
( |
) | ||||||||||||||||||||||||||
| Profit for the period |
||||||||||||||||||||||||||||
2022 |
||||||||||||||||||||||||||||
Private Market Strategies |
Liquid Strategies |
Investment Products and solutions |
Financial Advisory |
Vinci Retirement Services |
Corporate Center |
Total |
||||||||||||||||||||||
| In Brazil |
||||||||||||||||||||||||||||
| Abroad |
||||||||||||||||||||||||||||
| |
|
|
|
|
|
|
|
|
|
|
|
|
|
|||||||||||||||
| Gross revenue from services rendered |
||||||||||||||||||||||||||||
| |
|
|
|
|
|
|
|
|
|
|
|
|
|
|||||||||||||||
| Fund Advisory fee |
||||||||||||||||||||||||||||
| Fund Management fee |
||||||||||||||||||||||||||||
| Fund Performance fee |
||||||||||||||||||||||||||||
| Taxes and contributions |
( |
) | ( |
) | ( |
) | ( |
) | ( |
) | ||||||||||||||||||
| |
|
|
|
|
|
|
|
|
|
|
|
|
|
|||||||||||||||
| Net revenue from services rendered |
||||||||||||||||||||||||||||
| (-) General and administrative expenses |
( |
) | ( |
) | ( |
) | ( |
) | ( |
) | ( |
) | ( |
) | ||||||||||||||
| Share-based payments |
( |
) | ( |
) | ( |
) | ( |
) | ( |
) | ||||||||||||||||||
| |
|
|
|
|
|
|
|
|
|
|
|
|
|
|||||||||||||||
| Operating profit |
( |
) |
( |
) |
||||||||||||||||||||||||
| Finance income |
||||||||||||||||||||||||||||
| Finance cost |
( |
) | ||||||||||||||||||||||||||
| Finance result, net |
||||||||||||||||||||||||||||
| |
|
|||||||||||||||||||||||||||
| Profit before income taxes |
||||||||||||||||||||||||||||
| Income taxes |
( |
) | ||||||||||||||||||||||||||
| Profit for the period |
||||||||||||||||||||||||||||
2021 |
||||||||||||||||||||||||
Private Market Strategies |
Liquid Strategies |
Investment Products and solutions |
Financial Advisory |
Corporate Center |
Total |
|||||||||||||||||||
| In Brazil |
||||||||||||||||||||||||
| Abroad |
||||||||||||||||||||||||
| |
|
|
|
|
|
|
|
|
|
|
|
|||||||||||||
| Gross revenue from services rendered |
||||||||||||||||||||||||
| |
|
|
|
|
|
|
|
|
|
|
|
|||||||||||||
| Fund Advisory fee |
||||||||||||||||||||||||
| Fund Management fee |
||||||||||||||||||||||||
| Fund Performance fee |
||||||||||||||||||||||||
| Taxes and contributions |
( |
) | ( |
) | ( |
) | ( |
) | ( |
) | ||||||||||||||
| |
|
|
|
|
|
|
|
|
|
|
|
|||||||||||||
| Net revenue from services rendered |
||||||||||||||||||||||||
| (-) General and administrative expenses |
( |
) | ( |
) | ( |
) | ( |
) | ( |
) | ( |
) | ||||||||||||
| |
|
|
|
|
|
|
|
|
|
|
|
|||||||||||||
| Operating profit |
( |
) |
||||||||||||||||||||||
| Finance income |
||||||||||||||||||||||||
| Finance cost |
( |
) | ||||||||||||||||||||||
| Finance result, net |
||||||||||||||||||||||||
| |
|
|||||||||||||||||||||||
| Profit before income taxes |
||||||||||||||||||||||||
| Income taxes |
( |
) | ||||||||||||||||||||||
| Profit for the year |
||||||||||||||||||||||||
23 |
Legal Claims |
12/31/2023 |
12/31/2022 |
|||||||
| Tax |
||||||||
| Labor |
||||||||
| |
|
|
|
|||||
| Total |
||||||||
| |
|
|
|
|||||
24 |
Share-based payments |
| # Tranche |
Period in months when options will become potentially suitable for exercise (“Grace Period”) |
Limit per tranche |
||||||||||
| (percentage of the number of options granted) |
(quantity of the number of options granted) |
|||||||||||
| 1st tranche |
% | |||||||||||
| 2nd tranche |
% | |||||||||||
| 3rd tranche |
% | |||||||||||
| a) | Restricted Shares Units Plan |
| b) | Fair value of shares granted. |
| • | Market value of the shares at the granted date. |
| • | Estimative of dividend yield and the US interest rate for the years comprised from the granted date until the vesting dates. |
| c) | Outstanding shares granted and valuation inputs |
2023 |
2022 |
|||||||
| RSU outstanding on January 1 st |
||||||||
| |
|
|
|
|||||
| Granted |
||||||||
| Forfeited |
( |
) | ||||||
| Vested |
( |
) | ||||||
| |
|
|
|
|||||
| RSU outstanding on December 31 |
||||||||
| |
|
|
|
|||||
| d) | As of December 31, 2023, total compensation expense of the plans was R$ |
25 |
Subsequent Events |