UNITED STATES
SECURITIES AND EXCHANGE COMMISSION
Washington, D.C. 20549
FORM 10-K
| ANNUAL REPORT UNDER SECTION 13 OR 15(d) OF THE SECURITIES EXCHANGE ACT OF 1934 | |||||
For the fiscal year ended December 31 , 2023
OR
| TRANSITION REPORT UNDER SECTION 13 OR 15(d) OF SECURITIES EXCHANGE ACT OF 1934 | |||||
Commission File Number 001-36505
(Exact Name of Registrant As Specified in Its Charter)
| (State or Other Jurisdiction of Incorporation or Organization) | (I.R.S. Employer Identification Number) | |||||||||||||||||||
| (Address of principal executive offices) | (Zip code) | |||||||||||||||||||
(Registrant's telephone number, including area code): (432 ) 221-7400
Securities registered pursuant to Section 12(b) of the Securities Exchange Act of 1934:
| Title of each class | Trading Symbol(s) | Name of each exchange on which registered | |||||||||||||||
| (NASDAQ Global Select Market) | |||||||||||||||||
| Securities registered pursuant to section 12(g) of the Act: | |||||||||||||||||
| None. | |||||||||||||||||
Indicate by check mark if the registrant is a well-known seasoned issuer, as defined in Rule 405 of the Securities Act. Yes ☒ No ☐
Indicate by check mark if the registrant is not required to file reports pursuant to Section 13 or Section 15(d) of the Act. Yes ☐ No ☒
Indicate by check mark whether the registrant (1) has filed all reports required to be filed by Section 13 or 15(d) of the Securities Exchange Act of 1934 during the preceding 12 months (or for such shorter period that the registrant was required to file such reports), and (2) has been subject to such filing requirements for the past 90 days. Yes ☒ No ☐
Indicate by check mark whether the registrant has submitted electronically every Interactive Data File required to be submitted pursuant to Rule 405 of Regulation S-T (§ 232.405 of this chapter) during the preceding 12 months (or for such shorter period that the registrant was required to submit such files). Yes ☒ No ☐
Indicate by check mark whether the registrant is a large accelerated filer, an accelerated filer, a non-accelerated filer, a smaller reporting company, or an emerging growth company. See the definitions of “large accelerated filer,” “accelerated filer,” “smaller reporting company” and “emerging growth company” in Rule 12b-2 of the Exchange Act:
| ☒ | Accelerated Filer | ☐ | ||||||||||||||||||
| Non-Accelerated Filer | ☐ | Smaller Reporting Company | ||||||||||||||||||
| Emerging Growth Company | ||||||||||||||||||||
If an emerging growth company, indicate by check mark if the registrant has elected not to use the extended transition period for complying with any new or revised financial accounting standards provided pursuant to Section 13(a) of the Exchange Act. ☐
Indicate by check mark whether the registrant has filed a report on and attestation to its management’s assessment of the effectiveness of its internal control over financial reporting under Section 404(b) of the Sarbanes-Oxley Act (15 U.S.C. 7262(b)) by the registered public accounting firm that prepared or issued its audit report. ☒
If securities are registered pursuant to Section 12(b) of the Act, indicate by check mark whether the financial statements of the registrant included in the filing reflect the correction of an error to previously issued financial statements ☐
Indicate by check mark whether any of those error corrections are restatements that required a recovery analysis of incentive-based compensation received by any of the registrant’s executive officers during the relevant recovery period pursuant to §240.10D-1(b) ☐
Indicate by check mark whether the registrant is a shell company (as defined in Rule 12b-2 of the Exchange Act). Yes ☐ No ☒
Aggregate market value of the voting and non-voting common equity held by non-affiliates of registrant as of June 30, 2023 was approximately $1.9 billion.
As of February 16, 2024, 86,144,273 shares of Class A Common Stock and 90,709,946 shares of Class B Common Stock of the registrant were outstanding.
DOCUMENTS INCORPORATED BY REFERENCE
Portions of Viper Energy, Inc.’s Proxy Statement for the 2024 Annual Meeting of Stockholders are incorporated by reference in Items 10, 11, 12, 13 and 14 of Part III of this Form 10-K.
VIPER ENERGY, INC.
FORM 10-K
FOR THE YEAR ENDED DECEMBER 31, 2023
TABLE OF CONTENTS
| Page | |||||
i
GLOSSARY OF OIL AND NATURAL GAS TERMS
The following is a glossary of certain oil and natural gas industry terms used in this Annual Report on Form 10-K (the “Annual Report” or this “report”):
| Argus WTI Midland | Grade of oil that serves as a benchmark price for oil at Midland, Texas. | ||||
| Basin | A large depression on the earth’s surface in which sediments accumulate. | ||||
| Bbl or barrel | One stock tank barrel, or 42 U.S. gallons liquid volume, used in this report in reference to crude oil or other liquid hydrocarbons. | ||||
| BO | One barrel of oil. | ||||
| BO/d | BO per day. | ||||
| BOE | One barrel of oil equivalent, with six thousand cubic feet of natural gas being equivalent to one barrel of oil. | ||||
| BOE/d | Barrels of oil equivalent per day. | ||||
| British Thermal Unit or Btu | The quantity of heat required to raise the temperature of one pound of water by one degree Fahrenheit. | ||||
| Completion | The process of treating a drilled well followed by the installation of permanent equipment for the production of natural gas or oil, or in the case of a dry hole, the reporting of abandonment to the appropriate agency. | ||||
| Condensate | Liquid hydrocarbons associated with the production that is primarily natural gas. | ||||
| Deterministic method | The method of estimating reserves or resources under which a single value for each parameter (from the geoscience, engineering or economic data) in the reserves calculation is used in the reserves estimation procedure. | ||||
| Developed acreage | Acreage allocated or assignable to productive wells. | ||||
| Development costs | Capital costs incurred in the acquisition, exploitation and exploration of proved oil and natural gas reserves. | ||||
| Development well | A well drilled within the proved area of a natural gas or oil reservoir to the depth of a stratigraphic horizon known to be productive. | ||||
| Differential | An adjustment to the price of oil or natural gas from an established spot market price to reflect differences in the quality and/or location of oil or natural gas. | ||||
Dry hole | A well found to be incapable of producing hydrocarbons in sufficient quantities such that proceeds from the sale of such production exceed production expenses and taxes. | ||||
| Exploitation | A development or other project which may target proven or unproven reserves (such as probable or possible reserves), but which generally has a lower risk than that associated with exploration projects. | ||||
| Field | An area consisting of either a single reservoir or multiple reservoirs, all grouped on or related to the same individual geological structural feature and/or stratigraphic condition. | ||||
Finding costs | Capital costs incurred in the acquisition of proved oil and natural gas reserves divided by proved reserve additions and revisions to proved reserves. | ||||
| Fracturing | The process of creating and preserving a fracture or system of fractures in a reservoir rock typically by injecting a fluid under pressure through a wellbore and into the targeted formation. | ||||
| Gross acres or gross wells | The total acres or wells, as the case may be, in which a working interest is owned. | ||||
Henry Hub | Natural gas gathering point that serves as a benchmark price for natural gas futures on the NYMEX. | ||||
| Horizontal drilling | A drilling technique used in certain formations where a well is drilled vertically to a certain depth and then drilled at a right angle with a specified interval. | ||||
| Horizontal wells | Wells drilled directionally horizontal to allow for development of structures not reachable through traditional vertical drilling mechanisms. | ||||
| MBbls | Thousand barrels of crude oil or other liquid hydrocarbons. | ||||
MBO | One thousand barrels of crude oil. | ||||
MBO/d | One thousand barrels of crude oil per day. | ||||
| MBOE | One thousand barrels of crude oil equivalent, determined using a ratio of six Mcf of natural gas to one Bbl of crude oil, condensate or natural gas liquids. | ||||
MBOE/d | One thousand BOE per day. | ||||
| Mcf | One thousand cubic feet of natural gas. | ||||
| Mineral interests | The interests in ownership of the resource and mineral rights, giving an owner the right to profit from the extracted resources. | ||||
| MMBtu | One million British Thermal Units. | ||||
| MMcf | Million cubic feet of natural gas. | ||||
ii
| Net royalty acres | Net mineral acres multiplied by the average lease royalty interest and other burdens. | ||||
| Oil and natural gas properties | Tracts of land consisting of properties to be developed for oil and natural gas resource extraction. | ||||
| Operator | The individual or company responsible for the exploration and/or production of an oil or natural gas well or lease. | ||||
| Plugging and abandonment | Refers to the sealing off of fluids in the strata penetrated by a well so that the fluids from one stratum will not escape into another or to the surface. Regulations of all states require plugging of abandoned wells. | ||||
| PUD | Proved undeveloped. | ||||
| Productive well | A well that is found to be capable of producing hydrocarbons in sufficient quantities such that proceeds from the sale of the production exceed production expenses and taxes. | ||||
| Prospect | A specific geographic area which, based on supporting geological, geophysical or other data and also preliminary economic analysis using reasonably anticipated prices and costs, is deemed to have potential for the discovery of commercial hydrocarbons. | ||||
| Proved developed reserves | Reserves that can be expected to be recovered through existing wells with existing equipment and operating methods. | ||||
| Proved reserves | The estimated quantities of oil, natural gas and natural gas liquids which geological and engineering data demonstrate with reasonable certainty to be commercially recoverable in future years from known reservoirs under existing economic and operating conditions. | ||||
| Proved undeveloped reserves | Proved reserves that are expected to be recovered from new wells on undrilled acreage or from existing wells where a relatively major expenditure is required for recompletion. | ||||
| Recompletion | The process of re-entering an existing wellbore that is either producing or not producing and completing new reservoirs in an attempt to establish or increase existing production. | ||||
| Reserves | Reserves are estimated remaining quantities of oil and natural gas and related substances anticipated to be economically producible, as of a given date, by application of development projects to known accumulations. In addition, there must exist, or there must be a reasonable expectation that there will exist, the legal right to produce or a revenue interest in the production, installed means of delivering oil and natural gas or related substances to the market and all permits and financing required to implement the project. Reserves should not be assigned to adjacent reservoirs isolated by major, potentially sealing, faults until those reservoirs are penetrated and evaluated as economically producible. Reserves should not be assigned to areas that are clearly separated from a known accumulation by a non-productive reservoir (i.e., absence of reservoir, structurally low reservoir or negative test results). Such areas may contain prospective resources (i.e., potentially recoverable resources from undiscovered accumulations). | ||||
| Reservoir | A porous and permeable underground formation containing a natural accumulation of producible natural gas and/or crude oil that is confined by impermeable rock or water barriers and is separate from other reservoirs. | ||||
| Resource play | A set of discovered or prospective oil and/or natural gas accumulations sharing similar geologic, geographic and temporal properties, such as source rock, reservoir structure, timing, trapping mechanism and hydrocarbon type. | ||||
| Royalty interest | An interest that gives an owner the right to receive a portion of the resources or revenues without having to carry any costs of development, which may be subject to expiration. | ||||
| Spacing | The distance between wells producing from the same reservoir. Spacing is often expressed in terms of acres (e.g., 40-acre spacing) and is often established by regulatory agencies. | ||||
| Spud | Commencement of actual drilling operations. | ||||
| Standardized measure | The present value of estimated future net revenue to be generated from the production of proved reserves, determined in accordance with the rules and regulations of the SEC (using prices and costs in effect as of the date of estimation), less future development, production and income tax expenses, and discounted at 10% per annum to reflect the timing of future net revenue. | ||||
| Tight formation | A formation with low permeability that produces natural gas with very low flow rates for long periods of time. | ||||
| Undeveloped acreage | Lease acreage on which wells have not been drilled or completed to a point that would permit the production of economic quantities of oil and natural gas regardless of whether such acreage contains proved reserves. | ||||
| Waha Hub | Natural gas gathering point that serves as a benchmark price for natural gas at western Teas and New Mexico. | ||||
| Wellbore | The hole drilled by the bit that is equipped for oil or natural gas production on a completed well. | ||||
| Working interest | An operating interest that gives the owner the right to drill, produce and conduct operating activities on the property and receive a share of production and requires the owner to pay a share of the costs of drilling and production operations. | ||||
WTI | West Texas Intermediate, a light sweet blend of oil produced from fields in western Texas and is a grade of oil that serves as a benchmark for oil on the NYMEX. | ||||
| WTI Cushing | Grade of oil that serves as a benchmark price for oil at Cushing, Oklahoma. | ||||
iii
GLOSSARY OF CERTAIN OTHER TERMS
The following is a glossary of certain other terms used in this report:
| Adjusted EBITDA | Consolidated Adjusted EBITDA, a non-GAAP measure, generally equals net income (loss) attributable to Viper Energy, Inc. plus net income (loss) attributable to non-controlling interest before interest expense, net, non-cash share-based compensation expense, depletion expense, non-cash (gain) loss on derivative instruments, other non-cash operating expenses, other non-recurring expenses and provision for (benefit from) income taxes, which measure is used by management to more effectively evaluate the operating performance and determine dividend amounts for purposes of the dividend policy. | ||||
| ASU | Accounting Standards Update. | ||||
| Delaware Act | Delaware Revised Uniform Limited Partnership Act. | ||||
Diamondback E&P LLC | A subsidiary of Diamondback Energy, Inc. | ||||
| EPA | U.S. Environmental Protection Agency. | ||||
| Exchange Act | The Securities Exchange Act of 1934, as amended. | ||||
| FERC | Federal Energy Regulatory Commission. | ||||
| GAAP | Accounting principles generally accepted in the United States. | ||||
| General Partner | Viper Energy Partners GP LLC, a Delaware limited liability company; the general partner of the Partnership and a wholly owned subsidiary of Diamondback prior to the conversion of the Partnership into a Delaware corporation. | ||||
Notes | The outstanding senior notes of Viper Energy, Inc. issued under indentures where Viper Energy Partners LLC, is the sole guarantor, consisting of the 5.375% Senior Notes due 2027 and the 7.375% Senior Notes due 2031. | ||||
| LTIP | Viper Energy, Inc. Long Term Incentive Plan, as amended and restated to date. | ||||
Nasdaq | The Nasdaq Global Select Market. | ||||
NYMEX | New York Mercantile Exchange. | ||||
| OPEC | Organization of the Petroleum Exporting Countries. | ||||
| Operating Company | Viper Energy Partners LLC, a Delaware limited liability company and a consolidated subsidiary of Viper Energy, Inc. | ||||
| Partnership | Viper Energy Partners LP, the predecessor of the Company, which converted into the Company in the Conversion. | ||||
| Partnership agreement | The second amended and restated agreement of limited partnership of the Partnership, dated as of May 9, 2018, as amended as of May 10, 2018 and further amended on November 2, 2023. | ||||
| Ryder Scott | Ryder Scott Company, L.P. | ||||
S&P 500 | Standard and Poor’s 500 index. | ||||
| SEC | Securities and Exchange Commission. | ||||
SEC Prices | Unweighted arithmetic average oil and natural gas prices as of the first day of the month for the most recent 12 months as of the balance sheet date. | ||||
| Securities Act | The Securities Act of 1933, as amended. | ||||
| SOFR | The secured overnight financing rate. | ||||
XOP | Standard and Poor’s Oil and Gas Exploration and Production industry index. | ||||
iv
CAUTIONARY STATEMENT REGARDING FORWARD-LOOKING STATEMENTS
This Annual Report on Form 10-K contains “forward-looking statements” within the meaning of Section 27A of the Securities Act and Section 21E of the Exchange Act, which involve risks, uncertainties, and assumptions. All statements, other than statements of historical fact, including statements regarding our: future performance; business strategy; future operations; estimates and projections of operating income, losses, costs and expenses, returns, cash flow, and financial position; production levels on properties in which we have mineral and royalty interests, developmental activity by other operators; reserve estimates and our ability to replace or increase reserves; anticipated benefits of strategic transactions (including acquisitions and divestitures); and plans and objectives of management (including Diamondback’s plans for developing our acreage and our cash dividend policy and repurchases of our common shares and/or senior notes) are forward-looking statements. When used in this report, the words “aim,” “anticipate,” “believe,” “continue,” “could,” “estimate,” “expect,” “forecast,” “future,” “guidance,” “intend,” “may,” “model,” “outlook,” “plan,” “positioned,” “potential,” “predict,” “project,” “seek,” “should,” “target,” “will,” “would,” and similar expressions (including the negative of such terms) as they relate to us are intended to identify forward-looking statements, although not all forward-looking statements contain such identifying words. Although we believe that the expectations and assumptions reflected in our forward-looking statements are reasonable as and when made, they involve risks and uncertainties that are difficult to predict and, in many cases, beyond our control. Accordingly, forward-looking statements are not guarantees of our future performance and the actual outcomes could differ materially from what we expressed in our forward-looking statements.
Factors that could cause the outcomes to differ materially include (but are not limited to) the following:
•changes in supply and demand levels for oil, natural gas, and natural gas liquids, and the resulting impact on the price for those commodities;
•the impact of public health crises, including epidemic or pandemic diseases, and any related company or government policies or actions;
•actions taken by the members of OPEC and Russia affecting the production and pricing of oil, as well as other domestic and global political, economic, or diplomatic developments;
•changes in general economic, business or industry conditions, including changes in foreign currency exchange rates, interest rates, inflation rates, instability in the financial sector, and concerns over a potential economic downturn or recession;
•regional supply and demand factors, including delays, curtailment delays or interruptions of production on our mineral and royalty acreage, or governmental orders, rules or regulations that impose production limits on such acreage;
•federal and state legislative and regulatory initiatives relating to hydraulic fracturing, including the effect of existing and future laws and governmental regulations;
•physical and transition risks relating to climate change;
•restrictions on the use of water, including limits on the use of produced water by our operators and a moratorium on new produced water well permits recently imposed by the Texas Railroad Commission in an effort to control induced seismicity in the Permian Basin;
•significant declines in prices for oil, natural gas, or natural gas liquids, which could require recognition of significant impairment charges;
•changes in U.S. energy, environmental, monetary and trade policies;
•conditions in the capital, financial and credit markets, including the availability and pricing of capital for drilling and development by our operators and environmental and social responsibility projects undertaken by Diamondback and our other operators;
•changes in availability or cost of rigs, equipment, raw materials, supplies and oilfield services impacting our operators;
•changes in safety, health, environmental, tax, and other regulations or requirements impacting us or our operators (including those addressing air emissions, water management, or the impact of global climate change);
•security threats, including cybersecurity threats and disruptions to our business from breaches of Diamondback’s information technology systems, or from breaches of information technology systems of our operators or third parties with whom we transact business;
•lack of, or disruption in, access to adequate and reliable transportation, processing, storage, and other facilities impacting our operators;
v
•severe weather conditions;
•acts of war or terrorist acts and the governmental or military response thereto;
•changes in the financial strength of counterparties to the credit facility and hedging contracts of our operating subsidiary;
•changes in our credit rating; and
•other risks and factors disclosed in this report.
In light of these factors, the events anticipated by our forward-looking statements may not occur at the time anticipated or at all. Moreover, new risks emerge from time to time. We cannot predict all risks, nor can we assess the impact of all factors on our business or the extent to which any factor, or combination of factors, may cause actual results to differ materially from those anticipated by any forward-looking statements we may make. Accordingly, you should not place undue reliance on any forward-looking statements made in this report. All forward-looking statements speak only as of the date of this report or, if earlier, as of the date they were made. We do not intend to, and disclaim any obligation to, update or revise any forward-looking statements unless required by applicable law.
vi
PART I
On November 13, 2023, Viper Energy Partners LP (the “Partnership”) converted from a Delaware limited partnership to a Delaware corporation (the “Conversion”) named “Viper Energy, Inc.” References in this Annual Report to “Viper,” “the Company,” “our company,” “we,” “our,” “us” or like terms refer to (i) Viper Energy, Inc. and collectively with its subsidiary Viper Energy Partners LLC, as the context requires, following the Conversion and (ii) Viper Energy Partners LP individually and collectively with its subsidiary, Viper Energy Partners LLC, as the context requires, prior to the Conversion. References in this Annual Report to (i) the “Operating Company” or “OpCo” refers to Viper Energy Partners LLC and (ii) “Diamondback” refers collectively to Diamondback Energy, Inc. and its subsidiaries other than the Company. References in this Annual Report to shares or per share amounts prior to the Conversion refer to common units and Class B units or per unit amounts. Unless otherwise noted, all references to shares or per share amounts following the Conversion refer to shares or per share amounts of Class A Common Stock and Class B Common Stock. All references to dividends prior to the Conversion refer to distributions. See Note 1—Organization and Basis of Presentation in Item 8. Financial Statements and Supplementary Data of this report for additional discussion of the Conversion.
ITEMS 1 and 2. BUSINESS AND PROPERTIES
Overview
We are a publicly traded Delaware corporation focused on owning and acquiring mineral and royalty interests in oil and natural gas properties primarily in the Permian Basin. Because the Partnership was already treated as a corporation for U.S. federal income tax purposes pre-Conversion, the Conversion did not affect our status as a corporation for U.S. federal income tax purposes or materially impact the U.S. federal income tax treatment of our common equity holders.
Our primary business objective is to provide an attractive return to our stockholders by focusing on business results, generating robust free cash flow, reducing debt and protecting our balance sheet, while maintaining what we believe is a best-in-class cost structure. Our assets consist of mineral and royalty interests in oil and natural gas properties primarily in the Permian Basin in West Texas, substantially all of which are leased to working interest owners who bear the costs of operation and development.
We are currently focused primarily on oil and natural gas properties primarily in the Permian Basin, which is one of the oldest and most prolific producing basins in North America. The Permian Basin, which consists of approximately 75,000 square miles centered around Midland, Texas, has been a significant source of oil production since the 1920s. The Permian Basin is known to have a number of zones of oil and natural gas bearing rock throughout.
Significant 2023 Acquisitions
GRP Acquisition
On November 1, 2023, we acquired certain mineral and royalty interests from Royalty Asset Holdings, LP, Royalty Asset Holdings II, LP and Saxum Asset Holdings, LP, affiliates of Warwick Capital Partners and GRP Energy Capital (collectively, “GRP”), pursuant to a definitive purchase and sale agreement for approximately 9.02 million common shares and $759.6 million in cash, including transaction costs and subject to customary post-closing adjustments (the “GRP Acquisition”). The mineral and royalty interests acquired in the GRP Acquisition represent approximately 4,600 net royalty acres in the Permian Basin, plus approximately 2,700 additional net royalty acres in other major basins.
Drop Down Transaction
On March 8, 2023, we completed the acquisition of certain mineral and royalty interests from subsidiaries of Diamondback for approximately $74.5 million in cash, including customary closing adjustments for net title benefits (the ‘‘Drop Down’’). The mineral and royalty interests acquired in the Drop Down represent approximately 660 net royalty acres in Ward County in the Southern Delaware Basin, 100% of which are operated by Diamondback, and have an average net royalty interest of approximately 7.2% and current production of approximately 300 BO/d.
1
Other Acquisitions
During the year ended December 31, 2023, we acquired, in individually insignificant transactions from unrelated third-party sellers, mineral and royalty interests representing 286 net royalty acres in the Permian Basin for an aggregate purchase price of approximately $70.4 million, subject to customary post-closing adjustments.
Our Properties
As of December 31, 2023, our assets consisted of mineral interests and royalty interests underlying 1,197,638 gross acres and 34,217 net royalty acres primarily in the Permian Basin. Diamondback is the operator of approximately 49% of our net royalty acreage. As of December 31, 2023, there were 14,893 gross productive wells on this acreage, 2,756 of which were operated by Diamondback. Net production during the fourth quarter of 2023 was approximately 43,783 BOE/d and net production for the year ended December 31, 2023 averaged 39,244 BOE/d. For the years ended December 31, 2023, 2022 and 2021, royalty income generated from these mineral and royalty interests was $717.1 million, $838.0 million and $501.5 million, respectively.
At December 31, 2023, our estimated proved oil and natural gas reserves totaled 179,249 MBOE based on reserve estimates prepared by our internal reservoir engineers and audited by Ryder Scott, an independent petroleum engineering firm. As of December 31, 2023, approximately 80% of our proved reserves were classified as proved developed producing reserves. Proved undeveloped, or PUD, reserves included in this estimate were from 529 gross horizontal well locations. As of December 31, 2023, our proved reserves were approximately 50% oil, 25% natural gas liquids and 25% natural gas.
Our Relationship with Diamondback
As of December 31, 2023, Diamondback owned 7,946,507 shares of our Class A Common Stock and beneficially owned all of our 90,709,946 shares of outstanding Class B Common Stock, collectively, representing approximately 56% of our total shares outstanding. We believe Diamondback’s significant ownership in us may motivate it to offer additional mineral and other interests in oil and natural gas properties to us in the future, although Diamondback has no obligation to do so and may elect to dispose of mineral and other interests in such properties without offering us the opportunities to acquire them.
We believe Diamondback views our company as part of its business strategy and that Diamondback may be incentivized to pursue acquisitions jointly with us in the future. However, Diamondback will regularly evaluate acquisitions and may elect to acquire properties without offering us the opportunity to participate in such transactions. Moreover, Diamondback may not be successful in identifying potential acquisitions. Diamondback is free to act in a manner that is beneficial to its interests without regard to ours, which may include electing not to present us with acquisition or disposition opportunities.
In addition, neither we nor our Operating Company have any employees. Diamondback provides management, operating and administrative services to us under the services and secondment agreement, including the services of the executive officers and other employees, in substantially the same manner as Diamondback provided to the General Partner pre-Conversion. Please read Item 7. Management’s Discussion and Analysis—Financial Condition and Results of Operations and the consolidated financial statements and related notes in Item 8. Financial Statements and Supplementary Data of this report.
Business Strategies
Our primary business objective is to generate the highest value proposition for our stockholders through a focus on increasing long-term per share growth and returns by generating robust free cash flow, reducing debt and protecting our balance sheet. We intend to accomplish this objective by executing the following strategies:
•Capitalize on the development of the properties underlying our mineral interests to grow our cash flow. We expect the production from our mineral interests will increase as Diamondback and our other operators continue to drill, complete and develop our acreage. We expect to capitalize on this development, which requires no capital expenditure funding from us, and believe the anticipated increase in our aggregate royalty payment receipts will enable us to grow our cash flows.
•Leverage our relationship with Diamondback to participate with it in acquisitions of mineral or other interests in producing properties from third parties and to increase the size and scope of our potential third party acquisition targets. We have in the past and intend to continue to make opportunistic acquisitions of mineral and other interests that have substantial oil-weighted resource potential and organic growth potential. Through our relationships with Diamondback and its affiliates, we have access to their significant pool of management talent and industry
2
relationships, which we believe provide us with a competitive advantage in pursuing potential third party acquisition opportunities. For example, we and Diamondback may pursue an acquisition where Diamondback acquires working and revenue interests in properties and we acquire mineral or royalty interests in such properties either in the same or subsequent transactions, similar to Diamondback’s acquisition of certain assets from Guidon Operating LLC and our acquisition of certain mineral and royalty interests from Swallowtail Royalties LLC and Swallowtail Royalties II LLC in October 2021, which we refer to in this report as the Swallowtail Acquisition.
•Seek to acquire from Diamondback, from time to time, mineral or other interests in producing oil and natural gas properties that meet our acquisition criteria. Since our formation, we have acquired, and may have additional opportunities from time to time in the future to acquire, mineral or other interests in producing oil and natural gas properties directly from Diamondback. We believe Diamondback may be incentivized to sell properties to us, as doing so may enhance Diamondback’s economic returns by monetizing long-lived producing properties while potentially retaining a portion of the resulting cash flow through dividends on Diamondback’s controlling interests in us. However, neither Diamondback nor any of its affiliates are contractually obligated to offer or sell any interests in properties to us.
•High-grade our asset base. We intend to continue to high-grade our asset base and selectively divest non-core minerals with limited optionality when the amount negotiated exceeds our projected total value and then redeploy proceeds into our core areas of focus.
•Maintain a conservative capital structure to allow financial flexibility. Since our formation, we have maintained a conservative capital structure that has allowed us to opportunistically purchase accretive mineral and other interests. We are committed to maintaining a conservative leverage profile, and will continue to seek to opportunistically fund accretive acquisitions. In addition to returning capital to our stockholders through base and variable dividends in accordance with our dividend policy and share repurchases under our stock repurchase program, we intend to continue to repay debt using free cash flow to ensure our ability to successfully operate in challenging business and commodity price environments.
•Hedge to manage commodity price risk and to protect our balance sheet and cash flow. We use a combination of derivative instruments to economically hedge exposure to changes in commodity prices and maintain financial and balance sheet flexibility.
Competitive Strengths
We believe the following competitive strengths will allow us to successfully execute our business strategies and achieve our primary business objective:
•Oil rich resource base in one of North America’s leading resource plays. As of December 31, 2023, 302 horizontal drilling rigs were operating in the Permian Basin, representing 49% of the total U.S. onshore horizontal rig activity. The majority of our current properties are well positioned in the core of both the Midland and Delaware Basins in the Permian Basin. Production on our properties for the year ended December 31, 2023 and our estimated net proved reserves are heavily oil-weighted.
•Sustainable, high margin business unburdened by capital expenses with minimal operating expenses. Our mineral and royalty interests provide us cash flows without the requirement to fund drilling and completion costs or lease operating expenses. Our operating costs consist of certain royalty taxes, gathering, processing, marketing and transportation costs and general and administrative expenses, providing us with a low cost structure and high operating margins that generate increasing free cash flow growth in a stable or rising price environment as the underlying production associated with our royalty interests continues to grow.
•Experienced and proven management team. The members of our executive team have significant industry experience, most of which has been focused on resource play development primarily in the Permian Basin. This team has a proven track record of executing on multi-rig development drilling programs and extensive experience primarily in the Permian Basin. In addition, our executive team has significant experience with property acquisition. We expect to benefit from the industry relationships of the management team. We believe the experience of our management team is essential for the execution of our business strategy.
•Favorable and stable operating environment. We primarily focus our growth primarily in the Permian Basin, one of the oldest, most prolific hydrocarbon basins in the United States, with a long and well-established production history
3
and developed infrastructure. We believe that the geological and regulatory environment is more stable and predictable, and that we are faced with fewer operational risks in the Permian Basin as compared to emerging hydrocarbon basins. We believe that the impact of the proven application of new technology, combined with the substantial geological information available about the Permian Basin, also reduces the risk of development and exploration activities on our mineral and royalty acreage as compared to emerging hydrocarbon basins.
Oil and Natural Gas Data
Proved Reserves
Evaluation and Review of Reserves
The estimated reserves as of December 31, 2023 and 2022 are based on reserve estimates prepared by our internal reservoir engineers and audited by Ryder Scott, an independent petroleum engineering firm. The estimated reserves as of December 31, 2021 were prepared by Ryder Scott. The internal and external technical persons responsible for preparing or auditing our proved reserve estimates meet the requirements with regards to qualifications, independence, objectivity and confidentiality set forth in the Standards Pertaining to the Estimating and Auditing of Oil and Gas Reserves Information promulgated by the Society of Petroleum Engineers. Ryder Scott is a third party engineering firm and does not own an interest in any of our properties and is not employed by us on a contingent basis. The purpose of Ryder Scott’s audits was to provide additional assurance on the reasonableness of internally prepared reserve estimates for 2023 and 2022. The proved reserve audits performed by Ryder Scott for 2023 and 2022 covered 100% of our total proved reserves for each respective year. A copy of the summary audit report prepared by Ryder Scott is included as Exhibit 99.1 to this Annual Report.
Under SEC rules, proved reserves are those quantities of oil and natural gas, which, by analysis of geoscience and engineering data, can be estimated with reasonable certainty to be economically producible–from a given date forward, from known reservoirs and under existing economic conditions, operating methods and government regulations–prior to the time at which contracts providing the right to operate expire, unless evidence indicates that renewal is reasonably certain, regardless of whether deterministic or probabilistic methods are used for the estimation. If deterministic methods are used, the SEC has defined reasonable certainty for proved reserves as a “high degree of confidence that the quantities will be recovered.” All of our proved reserves as of December 31, 2023 were estimated using a deterministic method.
The estimation of reserves involves two distinct determinations. The first determination results in the estimation of the quantities of recoverable oil and natural gas and the second determination results in the estimation of the uncertainty associated with those estimated quantities in accordance with the definitions established under SEC rules. The process of estimating the quantities of recoverable oil and natural gas reserves relies on the use of certain generally accepted analytical procedures. These analytical procedures fall into three broad categories or methods: (i) performance-based methods, (ii) volumetric-based methods and (iii) analogy. These methods may be used singularly or in combination by the reserve evaluator in the process of estimating the quantities of reserves. In general, our proved producing reserves attributable to producing wells were estimated by performance methods. These performance methods include, but may not be limited to, decline curve analysis, which utilized extrapolations of available historical production and pressure data. In certain cases where there was inadequate historical performance data to establish a definitive trend and where the use of production performance data as a basis for the estimates was considered to be inappropriate, the proved producing reserves were estimated by analogy, or a combination of performance and analogy methods. The analogy method was used where there were inadequate historical performance data to establish a definitive trend and where the use of production performance data as a basis for the reserve estimates was considered to be inappropriate. All proved developed non-producing and undeveloped reserves were estimated by the analogy method.
To estimate economically recoverable proved reserves and related future net cash flows, we considered many factors and assumptions, including the use of reservoir parameters derived from geological, geophysical and engineering data which cannot be measured directly, economic criteria based on current costs and the SEC pricing requirements and forecasts of future production rates. To establish reasonable certainty with respect to our estimated proved reserves, the technologies and economic data used in the estimation of our proved reserves included production and well test data, downhole completion information, geologic data, electrical logs, radioactivity logs, core analyses, available seismic data and historical well cost and operating expense data.
The process of estimating oil, natural gas and natural gas liquids reserves is complex and requires significant judgment, as discussed in Item 1A. Risk Factors and Item 7. Management Discussion and Analysis—Critical Accounting Estimates of this report. As a result, our petroleum engineers and geoscience professionals have an internal controls process to ensure the integrity, accuracy and timeliness of the data used to calculate proved reserves relating to our assets primarily in the Permian Basin. Our internal technical staff met with our independent reserve auditors periodically during their audit of the
4
period covered by the reserve report to discuss the assumptions and methods used in our proved reserve estimation process. As part of the audit process, we provide historical information to the independent reserve auditors for our properties such as ownership interest, oil and gas production, well test data, commodity prices and operating and development costs. Diamondback’s Executive Vice President and Chief Engineer is primarily responsible for overseeing the preparation of all of our reserve estimates and overseeing communications with our independent reserve auditor. Diamondback’s Executive Vice President and Chief Engineer is a petroleum engineer with over 20 years of reservoir and operations experience and our geoscience staff has an average of approximately 15 years of industry experience per person. Our technical staff uses historical information for our properties such as ownership interest, oil and natural gas production, well test data, commodity prices and operating and development costs used to estimate economic lives of our properties. Ryder Scott performed an independent analysis during its audit of our estimated reserves for 2023 and any differences were reviewed with Diamondback’s Executive Vice President and Chief Engineer. For 2023, our reserve auditor’s estimates of our proved reserves did not differ materially from our estimates by more than the established audit tolerance guidelines of ten percent.
The internal control procedures utilized in the preparation of our proved reserve estimates are intended to ensure reliability of reserve estimations, and include, but are not limited to the following:
•review and verification of historical production data, which is based on actual production as reported by our operators;
•preparation of reserve estimates by the primary reserve engineers or under their direct supervision;
•review by the primary reserve engineers of all of our reported proved reserves at the close of each quarter, including the review of all significant reserve changes and all new proved undeveloped reserves additions;
•review of historical realized commodity prices and differentials from index prices compared to the differentials used in the reserves database;
•direct reporting responsibilities by Diamondback’s Executive Vice President and Chief Engineer to our Chief Executive Officer and by the current primary reserve engineer to our President;
•prior to finalizing the reserve report, a review of our preliminary proved reserve estimates by Diamondback’s President and Chief Financial Officer, Diamondback’s Executive Vice President and Chief Operating Officer, Diamondback’s Executive Vice President and Chief Engineer and our primary reserves engineers takes place on an annual basis;
•review of our proved reserve estimates by our Audit Committee with our executive team and Ryder Scott on an annual basis;
•verification of property ownership by our land department; and
•no employee’s compensation is tied to the amount of reserves booked.
For estimates and further discussion of our proved developed and proved undeveloped reserves, see Note 14—Supplemental Information on Oil and Natural Gas Operations in Item 8. Financial Statements and Supplementary Data of this report.
Oil and Natural Gas Production Prices and Production Costs
Production and Price History
Our properties are located primarily in the Midland and Delaware Basins of the Permian Basin in Texas. At December 31, 2023, 2022 and 2021, the Midland Basin and the Delaware Basin each contained 15% or more of our total proved reserves.
5
The following table sets forth information regarding our share of our operators’ net production of oil, natural gas and natural gas liquids for these fields along with our share of our operators’ net production from fields containing less than 15% of our total proved reserves:
| Midland | Delaware | Other(2)(3) | Total | ||||||||||||||||||||
| Production Data: | |||||||||||||||||||||||
| Year Ended December 31, 2023 | |||||||||||||||||||||||
| Oil (MBbls) | 5,789 | 2,210 | 29 | 8,028 | |||||||||||||||||||
| Natural gas (MMcf) | 13,088 | 5,984 | 58 | 19,130 | |||||||||||||||||||
| Natural gas liquids (MBbl) | 2,323 | 782 | 3 | 3,108 | |||||||||||||||||||
Combined volumes (MBOE)(1) | 10,293 | 3,989 | 42 | 14,324 | |||||||||||||||||||
| Year Ended December 31, 2022 | |||||||||||||||||||||||
| Oil (MBbls) | 5,219 | 1,765 | 113 | 7,097 | |||||||||||||||||||
| Natural gas (MMcf) | 10,648 | 4,864 | 356 | 15,868 | |||||||||||||||||||
| Natural gas liquids (MBbl) | 1,859 | 617 | 64 | 2,540 | |||||||||||||||||||
Combined volumes (MBOE)(1) | 8,853 | 3,193 | 236 | 12,282 | |||||||||||||||||||
| Year Ended December 31, 2021 | |||||||||||||||||||||||
| Oil (MBbls) | 4,220 | 1,730 | 118 | 6,068 | |||||||||||||||||||
| Natural gas (MMcf) | 8,756 | 4,570 | 346 | 13,672 | |||||||||||||||||||
| Natural gas liquids (MBbl) | 1,351 | 490 | 72 | 1,913 | |||||||||||||||||||
Combined volumes (MBOE)(1) | 7,030 | 2,982 | 248 | 10,260 | |||||||||||||||||||
(1)Bbl equivalents are calculated using a conversion rate of six Mcf per one Bbl.
(2)Production data includes the Eagle Ford Shale through October 1, 2022, the effective date on which the properties were divested.
(3)Production data includes the Eagle Ford Shale, Appalachia, Barnett, Denver-Julesburg, Mid-Con and Williston beginning November 1, 2023, the effective date on which the properties were acquired.
The following table sets forth certain price and cost information for each of the periods indicated:
| Year Ended December 31, | |||||||||||||||||
| 2023 | 2022 | 2021 | |||||||||||||||
| Average Prices: | |||||||||||||||||
| Oil (per Bbl) | $ | 77.13 | $ | 94.02 | $ | 65.51 | |||||||||||
| Natural gas (per Mcf) | $ | 1.62 | $ | 5.24 | $ | 3.60 | |||||||||||
| Natural gas liquids (per Bbl) | $ | 21.55 | $ | 34.47 | $ | 28.66 | |||||||||||
| Combined (per BOE) | $ | 50.06 | $ | 68.23 | $ | 48.88 | |||||||||||
Oil, hedged ($/Bbl)(1) | $ | 76.05 | $ | 92.85 | $ | 50.25 | |||||||||||
Natural gas, hedged ($/Mcf)(1) | $ | 1.37 | $ | 4.20 | $ | 3.60 | |||||||||||
Natural gas liquids ($/Bbl)(1) | $ | 21.55 | $ | 34.47 | $ | 28.66 | |||||||||||
Combined price, hedged ($/BOE)(1) | $ | 49.13 | $ | 66.21 | $ | 39.86 | |||||||||||
(1) Hedged prices reflect the effect of our commodity derivative transactions on our average sales prices. Our calculation of such effects include realized gains and losses on cash settlements for matured commodity derivatives, which we do not designate for hedge accounting.
6
Productive Wells
As of December 31, 2023, we owned an average 2.5% net revenue interest in 14,893 gross productive wells, including an average 2.6% net revenue interest in 14,093 gross oil productive wells and an average 1.3% net revenue interest in 800 gross natural gas productive wells. As of December 31, 2023, we had 11 gross wells with an average 4.8% net revenue interest in process of being drilled by Diamondback. The expected timing of our wells is based primarily on permitting by third party operators or Diamondback’s current expected completion schedule. Productive wells consist of producing wells capable of production, including natural gas awaiting pipeline connections to commence deliveries and oil wells awaiting connection to production facilities. Gross wells are the total number of producing wells in which we have an interest.
Acreage
The following table sets forth information as of December 31, 2023 relating to the gross and net royalty acreage of our mineral interests:
| Basin | Gross Royalty Acreage | Net Royalty Acreage | |||||||||
| Delaware | 458,370 | 13,630 | |||||||||
| Midland | 496,240 | 17,865 | |||||||||
| Other | 243,028 | 2,722 | |||||||||
| Total acreage | 1,197,638 | 34,217 | |||||||||
Our net interest in production from our mineral interests is based on lease royalty terms which vary from property to property. Our interest in the majority of these properties is perpetual in nature, however an insignificant portion of our net royalty acreage consists of overriding royalty interests which may be subject to expiration. Net royalty acres are defined as net mineral acres multiplied by the average lease royalty interest and other burdens.
Title to Properties
Prior to the drilling of an oil or natural gas well, it is the normal practice in our industry for the person or company acting as the operator of the well to obtain a preliminary title review to ensure there are no obvious defects in title to the well. Frequently, as a result of such examinations, certain curative work must be done to correct defects in the marketability of the title, and such curative work entails expense. Our operators’ failure to cure any title defects may delay or prevent us from utilizing the associated mineral interest, which may adversely impact our ability in the future to increase production and reserves. Additionally, undeveloped acreage has greater risk of title defects than developed acreage. If there are any title defects or defects in the assignment of leasehold rights in properties in which we hold an interest, our business and cash available for dividends may be adversely affected.
Competition
The oil and natural gas industry is intensely competitive, and we compete with other companies that may have greater resources. Many of these companies explore for and produce oil and natural gas, carry on midstream and refining operations and market petroleum and other products on a regional, national or worldwide basis. These companies may be able to pay more for productive oil and natural gas properties, mineral interests and exploratory prospects or to define, evaluate, bid for and purchase a greater number of properties and prospects than our financial or human resources permit. In addition, these companies may have a greater ability to continue exploration activities during periods of low oil and natural gas market prices than operators of our mineral and royalty acreage. Our larger or more integrated competitors may be able to absorb the burden of existing, and any changes to, federal, state and local laws and regulations more easily than we can, which would adversely affect our competitive position.
Our ability to acquire additional mineral, royalty, overriding royalty, net profits and similar interests in the future will be dependent upon our ability to evaluate and select suitable properties and to consummate transactions in a highly competitive environment. In addition, because we have fewer financial and human resources than many companies in our industry, we may be at a disadvantage in bidding for these and other oil and natural gas properties. Further, oil and natural gas compete with other forms of energy available to customers, primarily based on price. Changes in the availability or price of oil and natural gas or other forms of energy, as well as business conditions, conservation, legislation, regulations and the ability to convert to alternate fuels and other forms of energy may affect the demand for oil and natural gas.
7
Seasonal Nature of Business
Generally, demand for oil increases during the summer months and decreases during the winter months while natural gas decreases during the summer months and increases during the winter months. Certain natural gas users utilize natural gas storage facilities and purchase some of their anticipated winter requirements during the summer, which can lessen seasonal demand fluctuations. Seasonal weather conditions such as the severe winter storms in the Permian Basin in early 2021, and lease stipulations, can limit drilling and producing activities and other oil and natural gas operations in a portion of our operating areas. These seasonal anomalies can pose challenges for our operators in meeting well drilling objectives and can increase competition for equipment, supplies and personnel during the spring and summer months, which could lead to shortages and increase costs or delay operations.
Regulation
The following disclosure describes regulation more directly associated with operators of oil and natural gas properties, including our current operators, and other owners of working interests in oil and natural gas properties. To the extent we elect in the future to engage in the exploration, development and production of oil and natural gas properties, we would be directly subject to the same regulations described below. For purposes of this section, where applicable, references to “we,” “us,” and “our” refer to Viper Energy, Inc., to the extent the company were to acquire working interests in the future as well as to any operators of our properties, including our current operators.
Oil and natural gas operations are subject to various types of legislation, regulation and other legal requirements enacted by governmental authorities. This legislation and regulation affecting the oil and natural gas industry is under constant review for amendment or expansion. Some of these requirements carry substantial penalties for failure to comply. The regulatory burden on the oil and natural gas industry increases the cost of doing business.
Environmental Matters. Oil and natural gas exploration, development and production operations are subject to stringent laws and regulations governing the discharge of materials into the environment or otherwise relating to environmental protection. Numerous federal, state and local governmental agencies, such as the EPA, issue regulations that often require difficult and costly compliance measures that carry substantial administrative, civil and criminal penalties and may result in injunctive obligations for non-compliance. These laws and regulations may require the acquisition of a permit before drilling commences, restrict the types, quantities and concentrations of various substances that can be released into the environment in connection with drilling and production activities, limit or prohibit construction or drilling activities on certain lands lying within wilderness, wetlands, ecologically or seismically sensitive areas, and other protected areas, require action to prevent or remediate pollution from current or former operations, such as plugging abandoned wells or closing pits, result in the suspension or revocation of necessary permits, licenses and authorizations, require that additional pollution controls be installed and impose substantial liabilities for pollution resulting from operations.
Liability under such laws and regulations is often strict (i.e., no showing of “fault” is required) and can be joint and several. Moreover, it is not uncommon for neighboring landowners and other third parties to file claims for personal injury and property damage allegedly caused by the release of hazardous substances, hydrocarbons or other waste products into the environment. Changes in environmental laws and regulations occur frequently, and any changes that result in more stringent and costly pollution control or waste handling, storage, transport, disposal or cleanup requirements could materially and adversely affect our business and prospects.
Waste Handling. The Resource Conservation and Recovery Act, or the RCRA, as amended, and comparable state statutes and regulations promulgated thereunder, affect oil and natural gas exploration, development and production activities by imposing requirements regarding the generation, transportation, treatment, storage, disposal and cleanup of hazardous and non-hazardous wastes. With federal approval, the individual states administer some or all of the provisions of the RCRA, sometimes in conjunction with their own, more stringent requirements. Although most wastes associated with the exploration, development and production of crude oil and natural gas are exempt from regulation as hazardous wastes under the RCRA, such wastes may constitute “solid wastes” that are subject to the less stringent non-hazardous waste requirements. Moreover, the EPA or state or local governments may adopt more stringent requirements for the handling of non-hazardous wastes or categorize some non-hazardous wastes as hazardous for future regulation. Indeed, legislation has been proposed from time to time in the U.S. Congress to re-categorize certain oil and natural gas exploration, development and production wastes as “hazardous wastes.” Also, in December 2016, the EPA agreed in a consent decree to review its regulation of oil and natural gas waste. However, in April 2019, the EPA concluded that revisions to the federal regulations for the management of oil and natural gas waste are not necessary at this time. Any changes in such laws and regulations could have a material adverse effect on our capital expenditures and operating expenses.
8
Administrative, civil and criminal penalties can be imposed for failure to comply with waste handling requirements. Any legislative or regulatory reclassification of oil and natural gas exploration and production wastes could increase our costs to manage and dispose of such wastes.
Remediation of Hazardous Substances. The Comprehensive Environmental Response, Compensation and Liability Act, as amended, which we refer to as CERCLA or the “Superfund” law, and analogous state laws, generally impose liability, without regard to fault or legality of the original conduct, on classes of persons who are considered to be responsible for the release of a “hazardous substance” into the environment. These persons include the current owner or operator of a contaminated facility, a former owner or operator of the facility at the time of contamination, and those persons that disposed or arranged for the disposal of the hazardous substance at the facility. Under CERCLA and comparable state statutes, persons deemed “responsible parties” are subject to strict liability that, in some circumstances, may be joint and several for the costs of removing or remediating previously disposed wastes (including wastes disposed of or released by prior owners or operators) or property contamination (including groundwater contamination), for damages to natural resources and for the costs of certain health studies. In addition, it is not uncommon for neighboring landowners and other third parties to file claims for personal injury and property damage allegedly caused by the hazardous substances released into the environment. In the course of our operations, we use materials that, if released, would be subject to CERCLA and comparable state statutes. Therefore, governmental agencies or third parties may seek to hold us responsible under CERCLA and comparable state statutes for all or part of the costs to clean up sites at which such “hazardous substances” have been released.
Water Discharges. The Federal Water Pollution Control Act of 1972, as amended, also known as the “Clean Water Act,” or the CWA, the Safe Drinking Water Act, the Oil Pollution Act, or the OPA, and analogous state laws and regulations promulgated thereunder impose restrictions and strict controls regarding the unauthorized discharge of pollutants, including produced waters and other gas and oil wastes, into navigable waters of the United States, as well as state waters. The discharge of pollutants into regulated waters is prohibited, except in accordance with the terms of a permit issued by the EPA or the state. Spill prevention, control and countermeasure plan requirements under federal law require appropriate containment berms and similar structures to help prevent the contamination of navigable waters in the event of a petroleum hydrocarbon tank spill, rupture or leak. The CWA and regulations implemented thereunder also prohibit the discharge of dredge and fill material into regulated waters, including jurisdictional wetlands, unless authorized by an appropriately issued permit.
The scope of waters regulated under the CWA has fluctuated in recent years. On June 29, 2015, the EPA and the U.S. Army Corps of Engineers, or the Corps, jointly promulgated final rules expanding the scope of waters protected under the CWA. However, on October 22, 2019, the agencies published a final rule to repeal the 2015 rules, and then, on April 21, 2020, the EPA and the Corps published a final rule replacing the 2015 rule, and significantly reducing the waters subject to federal regulation under the CWA. On August 30, 2021, a federal court struck down the replacement rule and, on January 18, 2023, the EPA and the Corps published a final rule that would restore water protections that were in place prior to 2015. However, on May 25, 2023, the Supreme Court issued an opinion substantially narrowing the scope of “waters of the United States” protected by the CWA. On September 8, 2023, the EPA and the Corps published a final rule conforming their regulations to the decision. These recent actions have provided some clarity. However, to the extent the EPA and the Corps broadly interpret their jurisdiction and expand the range of properties subject to the CWA’s jurisdiction, we or third-party operators could face increased costs and delays with respect to obtaining permits for dredge and fill activities in wetland areas.
The EPA has also adopted regulations requiring certain oil and natural gas exploration and production facilities to obtain individual permits or coverage under general permits for storm water discharges. In addition, on June 28, 2016, the EPA published a final rule prohibiting the discharge of wastewater from onshore unconventional oil and natural gas extraction facilities to publicly owned wastewater treatment plants, which regulations are discussed in more detail below under the caption “—Regulation of Hydraulic Fracturing.” Costs may be associated with the treatment of wastewater or developing and implementing storm water pollution prevention plans, as well as for monitoring and sampling the storm water runoff from certain of our facilities. Some states also maintain groundwater protection programs that require permits for discharges or operations that may impact groundwater conditions.
The OPA is the primary federal law for oil spill liability. The OPA contains numerous requirements relating to the prevention of and response to petroleum releases into waters of the United States, including the requirement that operators of offshore facilities and certain onshore facilities near or crossing waterways must develop and maintain facility response contingency plans and maintain certain significant levels of financial assurance to cover potential environmental cleanup and restoration costs. The OPA subjects owners of facilities to strict liability that, in some circumstances, may be joint and several for all containment and cleanup costs and certain other damages arising from a release, including, but not limited to, the costs of responding to a release of oil to surface waters.
9
Non-compliance with the CWA or the OPA may result in substantial administrative, civil and criminal penalties, as well as injunctive obligations.
Air Emissions. The federal Clean Air Act, or the CAA, as amended, and comparable state laws and regulations, regulate emissions of various air pollutants through the issuance of permits and the imposition of other requirements. The EPA has developed, and continues to develop, stringent regulations governing emissions of air pollutants at specified sources. New facilities may be required to obtain permits before work can begin, and existing facilities may be required to obtain additional permits and incur capital costs in order to remain in compliance. For example, on August 16, 2012, the EPA published final regulations under the federal CAA that establish new emission controls for oil and natural gas production and processing operations, which are discussed in more detail below in “—Regulation of Hydraulic Fracturing.” Also, on May 12, 2016, the EPA issued a final rule regarding the criteria for aggregating multiple small surface sites into a single source for air-quality permitting purposes applicable to the oil and natural gas industry. This rule could cause small facilities, on an aggregate basis, to be deemed a major source, thereby triggering more stringent air permitting processes and requirements. Additionally, on April 17, 2023, the EPA agreed in a consent decree to issue a proposed rule by December 10, 2024 that either revises its emission standards for hazardous air pollutants from oil and natural gas production activities or determines that no revision is necessary. These laws and regulations may increase the costs of compliance for some facilities we own or operate, and federal and state regulatory agencies can impose administrative, civil and criminal penalties for non-compliance with air permits or other requirements of the federal CAA and associated state laws and regulations. Obtaining or renewing permits has the potential to delay the development of oil and natural gas projects.
Climate Change. In recent years, federal, state and local governments have taken steps to reduce emissions of greenhouse gases. For example, the Infrastructure Investment and Jobs Act of 2021 and the Inflation Reduction Act of 2022, or the IRA, include billions of dollars in incentives for the development of renewable energy, clean hydrogen, clean fuels, electric vehicles, investments in advanced biofuels and supporting infrastructure and carbon capture and sequestration. Also, the EPA has proposed ambitious rules to reduce harmful air pollutant emissions, including greenhouse gases, from light-, medium-, and heavy-duty vehicles beginning in model year 2027. These incentives and regulations could accelerate the transition of the economy away from the use of fossil fuels toward lower- or zero-carbon emissions alternatives, which could decrease demand for, and in turn the prices of, the oil and natural gas that we produce and sell and adversely impact our business. In addition, the IRA imposes the first ever federal fee on the emission of greenhouse gases through a methane emissions charge. The IRA amends the CAA to impose a fee on the emission of methane that exceeds an applicable waste emissions threshold from sources required to report their greenhouse gas emissions to the EPA, including those sources in offshore and onshore petroleum and natural gas production and gathering and boosting source categories. The methane emissions charge would start in calendar year 2024 at $900 per ton of methane, increase to $1,200 in 2025 and be set at $1,500 for 2026 and each year after. Calculation of the fee is based on certain thresholds established in the IRA. On January 12, 2024, the EPA announced a proposed rule to implement the methane emissions charge. The methane emissions charge could increase our operating costs, which could adversely impact our business, financial condition and cash flows.
The EPA has also finalized a series of greenhouse gas monitoring, reporting and emissions control rules for the oil and natural gas industry, and almost one-half of the states have taken measures to reduce emissions of greenhouse gases primarily through the development of greenhouse gas emission inventories and/or regional greenhouse gas cap-and-trade programs. In addition, states have imposed increasingly stringent requirements related to the venting or flaring of gas during oil and natural gas operations. For example, on November 4, 2020, the Texas Railroad Commission adopted new guidance on when flaring is permissible, requiring operators to submit more specific information to justify the need to flare or vent gas.
At the international level, in December 2015, the United States participated in the 21st Conference of the Parties of the United Nations Framework Convention on Climate Change in Paris, France. The resulting Paris Agreement calls for the parties to undertake “ambitious efforts” to limit the average global temperature, and to conserve and enhance sinks and reservoirs of greenhouse gases. The Agreement went into effect on November 4, 2016. On April 21, 2021, the United States announced that it was setting an economy-wide target of reducing its greenhouse gas emissions by 50-52 percent below 2005 levels in 2030. In November 2021, in connection with the 26th Conference of the Parties in Glasgow, Scotland, the United States and other world leaders made further commitments to reduce greenhouse gas emissions, including reducing global methane emissions by at least 30% by 2030 from 2020 levels. More than 150 countries have now signed on to this pledge. Most recently, at the 28th Conference of the Parties in the United Arab Emirates, world leaders agreed to transition away from fossil fuels in a just, orderly and equitable manner and to triple renewables and double energy efficiency globally by 2030. Furthermore, many state and local leaders have stated their intent to intensify efforts to support the international climate commitments.
10
Restrictions on emissions of methane or carbon dioxide that may be imposed could adversely impact the demand for, price of, and value of our products and reserves. As our operations also emit greenhouse gases directly, current and future laws or regulations limiting such emissions could increase our own costs. At this time, it is not possible to accurately estimate how potential future laws or regulations addressing greenhouse gas emissions would impact our business.
Regulation of Hydraulic Fracturing. Hydraulic fracturing is an important common practice that is used to stimulate production of hydrocarbons from tight formations, including shales. The process, which involves the injection of water, sand and chemicals under pressure into formations to fracture the surrounding rock and stimulate production, is typically regulated by state oil and natural gas commissions. However, legislation has been proposed in recent sessions of the U.S. Congress to amend the Safe Drinking Water Act to repeal the exemption for hydraulic fracturing from the definition of “underground injection,” to require federal permitting and regulatory control of hydraulic fracturing, and to require disclosure of the chemical constituents of the fluids used in the fracturing process. Furthermore, several federal agencies have asserted regulatory authority over certain aspects of the process. For example, the EPA has taken the position that hydraulic fracturing with fluids containing diesel fuel is subject to regulation under the Underground Injection Control program, specifically as “Class II” Underground Injection Control wells under the Safe Drinking Water Act.
On June 28, 2016, the EPA published a final rule prohibiting the discharge of wastewater from onshore unconventional oil and natural gas extraction facilities to publicly owned wastewater treatment plants. The EPA is also conducting a study of private wastewater treatment facilities (also known as centralized waste treatment, or CWT, facilities) accepting oil and natural gas extraction wastewater. The EPA is collecting data and information related to the extent to which CWT facilities accept such wastewater, available treatment technologies (and their associated costs), discharge characteristics, financial characteristics of CWT facilities, and the environmental impacts of discharges from CWT facilities.
On August 16, 2012, the EPA published final regulations under the federal CAA that establish new air emission controls for oil and natural gas production and natural gas processing operations. Specifically, the EPA’s rule package includes New Source Performance standards to address emissions of sulfur dioxide and volatile organic compounds and a separate set of emission standards to address hazardous air pollutants frequently associated with oil and natural gas production and processing activities. The final rules seek to achieve a 95% reduction in volatile organic compounds emitted by requiring the use of reduced emission completions or “green completions” on all hydraulically-fractured wells constructed or refractured after January 1, 2015. The rules also establish specific new requirements regarding emissions from compressors, controllers, dehydrators, storage tanks and other production equipment. The EPA received numerous requests for reconsideration of these rules from both industry and the environmental community, and court challenges to the rules were also filed. In response, the EPA has issued, and will likely continue to issue, revised rules responsive to some of the requests for reconsideration. In particular, on May 12, 2016, the EPA amended its regulations to impose new standards for methane and volatile organic compounds emissions for certain new, modified, and reconstructed equipment, processes, and activities across the oil and natural gas sector. However, on August 13, 2020, in response to an executive order by former President Trump to review and revise unduly burdensome regulations, the EPA amended the 2012 and 2016 New Source Performance standards to ease regulatory burdens, including rescinding standards applicable to transmission or storage segments and eliminating methane requirements altogether. On June 30, 2021, President Biden signed into law a joint resolution of the U.S. Congress disapproving the 2020 amendments (with the exception of some technical changes) thereby reinstating the 2012 and 2016 New Source Performance standards. The EPA expects owners and operators of regulated sources to take “immediate steps” to comply with these standards. Additionally, on December 2, 2023, the EPA announced a final rule that would expand and strengthen emission reduction requirements for both new and existing sources in the oil and natural gas industry by requiring increased monitoring of fugitive emissions, imposing new requirements for pneumatic controllers and tank batteries, and prohibiting venting of natural gas in certain situations. These new standards, to the extent implemented, as well as any future laws and their implementing regulations, may require us to obtain pre-approval for the expansion or modification of existing facilities or the construction of new facilities expected to produce air emissions, impose stringent air permit requirements, or mandate the use of specific equipment or technologies to control emissions. We cannot predict the final regulatory requirements or the cost to comply with such requirements with any certainty.
Furthermore, there are certain governmental reviews either underway or being proposed that focus on environmental aspects of hydraulic fracturing practices. On December 13, 2016, the EPA released a study examining the potential for hydraulic fracturing activities to impact drinking water resources, finding that, under some circumstances, the use of water in hydraulic fracturing activities can impact drinking water resources. Also, on February 6, 2015, the EPA released a report with findings and recommendations related to public concern about induced seismic activity from disposal wells. The report recommends strategies for managing and minimizing the potential for significant injection-induced seismic events. Other governmental agencies, including the U.S. Department of Energy and the Department of the Interior have evaluated or are evaluating various other aspects of hydraulic fracturing. These ongoing or proposed studies could spur initiatives to further
11
regulate hydraulic fracturing, and could ultimately make it more difficult or costly for us to perform fracturing and increase our costs of compliance and doing business.
Several states, including Texas, and local jurisdictions, have adopted, or are considering adopting, regulations that could restrict or prohibit hydraulic fracturing in certain circumstances, impose more stringent operating standards and/or require the disclosure of the composition of hydraulic fracturing fluids. The Texas Legislature adopted legislation, effective September 1, 2011, requiring oil and natural gas operators to publicly disclose the chemicals used in the hydraulic fracturing process. The Texas Railroad Commission adopted rules and regulations implementing this legislation that apply to all wells for which the Texas Railroad Commission issues an initial drilling permit after February 1, 2012. The law requires that the well operator disclose the list of chemical ingredients subject to the requirements of Federal Occupational Safety and Health Act for disclosure on an internet website and also file the list of chemicals with the Texas Railroad Commission with the well completion report. The total volume of water used to hydraulically fracture a well must also be disclosed to the public and filed with the Texas Railroad Commission. Also, in May 2013, the Texas Railroad Commission adopted rules governing well casing, cementing and other standards for ensuring that hydraulic fracturing operations do not contaminate nearby water resources. The rules took effect in January 2014. Additionally, on October 28, 2014, the Texas Railroad Commission adopted disposal well rule amendments designed, among other things, to require applicants for new disposal wells that will receive non-hazardous produced water and hydraulic fracturing flowback fluid to conduct seismic activity searches utilizing the U.S. Geological Survey. The searches are intended to determine the potential for earthquakes within a circular area of 100 square miles around a proposed new disposal well. The disposal well rule amendments, which became effective on November 17, 2014, also clarify the Texas Railroad Commission’s authority to modify, suspend or terminate a disposal well permit if scientific data indicates a disposal well is likely to contribute to seismic activity. The Texas Railroad Commission has used this authority to deny permits and temporarily suspend operations for waste disposal wells. For example, in September 2021, the Texas Railroad Commission curtailed the amount of water companies were permitted to inject into some wells near Midland and Odessa in the Permian Basin, and has subsequently suspended some permits there and expanded the restrictions to other areas. In addition, the Texas Railroad Commission has imposed monitoring and reporting requirements for any new disposal well permitted in the Permian Basin. These restrictions on the disposal of produced water, a moratorium on new produced water wells, and additional monitoring and reporting requirements could result in increased operating costs, forcing our operators or their vendors to truck produced water, recycle it or pump it through the pipeline network or other means, all of which could be costly. Our operators or their vendors may also limit disposal well volumes, disposal rates and pressures or locations, or require them to shut down or curtail the injection of produced water into disposal wells. These factors may make drilling activity in the affected parts of the Permian Basin less economical and adversely impact our business.
There has been increasing public controversy regarding hydraulic fracturing with regard to the use of fracturing fluids, induced seismic activity, impacts on drinking water supplies, use of water and the potential for impacts to surface water, groundwater and the environment generally. A number of lawsuits and enforcement actions have been initiated across the country implicating hydraulic fracturing practices. If new laws or regulations that significantly restrict hydraulic fracturing are adopted, such laws could make it more difficult or costly for us to perform fracturing to stimulate production from tight formations as well as make it easier for third parties opposing the hydraulic fracturing process to initiate legal proceedings based on allegations that specific chemicals used in the fracturing process could adversely affect groundwater. In addition, if hydraulic fracturing is further regulated at the federal or state level, our fracturing activities could become subject to additional permitting and financial assurance requirements, more stringent construction specifications, increased monitoring, reporting and recordkeeping obligations, plugging and abandonment requirements and also to permitting delays and potential increases in costs. Such changes could cause us to incur substantial compliance costs, and compliance or the consequences of any failure to comply by us could have a material adverse effect on our financial condition and results of operations. At this time, it is not possible to estimate the impact on our business of newly enacted or potential federal, state or local laws governing hydraulic fracturing.
Other Regulation of the Oil and Natural Gas Industry. The oil and natural gas industry is extensively regulated by numerous federal, state and local authorities. Legislation affecting the oil and natural gas industry is under constant review for amendment or expansion, frequently increasing the regulatory burden. Also, numerous departments and agencies, both federal and state, are authorized by statute to issue rules and regulations that are binding on the oil and natural gas industry and its individual members, some of which carry substantial penalties for failure to comply. Although the regulatory burden on the oil and natural gas industry increases the cost of doing business, these burdens generally do not affect us any differently or to any greater or lesser extent than they affect other companies in the industry with similar types, quantities and locations of production. The availability, terms and cost of transportation significantly affect sales of oil and natural gas. The interstate transportation and sale for resale of oil and natural gas is subject to federal regulation, including regulation of the terms, conditions and rates for interstate transportation, storage and various other matters, primarily by FERC. Federal and state regulations govern the price and terms for access to oil and natural gas pipeline transportation. FERC’s regulations for interstate oil and natural gas transmission in some circumstances may also affect the intrastate transportation of oil and natural gas.
12
Although oil and natural gas prices are currently unregulated, the U.S. Congress historically has been active in the area of oil and natural gas regulation. We cannot predict whether new legislation to regulate oil and natural gas might be proposed, what proposals, if any, might actually be enacted by the U.S. Congress or the various state legislatures, and what effect, if any, the proposals might have on our operations. Sales of condensate and oil and natural gas liquids are not currently regulated and are made at market prices.
Drilling and Production. The operations of our operators are subject to various types of regulation at the federal, state and local level. These types of regulation include requiring permits for the drilling of wells, drilling bonds and reports concerning operations. The state, and some counties and municipalities, in which we operate also regulate one or more of the following; the location of wells; the method of drilling and casing wells; the timing of construction or drilling activities, including seasonal wildlife closures; the rates of production or “allowables”; the surface use and restoration of properties upon which wells are drilled; the plugging and abandoning of wells; and notice to, and consultation with, surface owners and other third parties.
State laws regulate the size and shape of drilling and spacing units or proration units governing the pooling of oil and natural gas properties. Some states allow forced pooling or integration of tracts to facilitate exploration while other states rely on voluntary pooling of lands and leases. In some instances, forced pooling or unitization may be implemented by third parties and may reduce our interest in the unitized properties. In addition, state conservation laws establish maximum rates of production from oil and natural gas wells, generally prohibit the venting or flaring of natural gas and impose requirements regarding the ratability of production. These laws and regulations may limit the amount of oil and natural gas that our operators can produce from our wells or limit the number of wells or the locations at which we can drill. Moreover, each state generally imposes a production or severance tax with respect to the production and sale of oil, natural gas and natural gas liquids within its jurisdiction. States do not regulate wellhead prices or engage in other similar direct regulation, but we cannot assure our stockholders that they will not do so in the future. The effect of such future regulations may be to limit the amounts of oil and natural gas that may be produced from our wells, negatively affect the economics of production from these wells or to limit the number of locations we can drill.
Federal, state and local regulations provide detailed requirements for the plugging and abandonment of wells, closure or decommissioning of production facilities and pipelines and for site restoration in areas. Although the Corps does not require bonds or other financial assurances, some state agencies and municipalities do have such requirements.
Natural Gas Sales. Historically, federal legislation and regulatory controls have affected the price and marketing of natural gas. FERC has jurisdiction over the transportation and sale for resale of natural gas in interstate commerce by natural gas companies under the Natural Gas Act of 1938 and the Natural Gas Policy Act of 1978. Since 1978, various federal laws have been enacted which have resulted in the complete removal of all price and non-price controls for sales of domestic natural gas sold in “first sales.” Under the Energy Policy Act of 2005, FERC has substantial enforcement authority to prohibit the manipulation of natural gas markets and enforce its rules and orders, including the ability to assess substantial civil penalties.
Oil Sales and Transportation. Sales of crude oil, condensate and natural gas liquids are not currently regulated and are made at negotiated prices. Nevertheless, the U.S. Congress could reenact price controls in the future.
Crude oil sales are affected by the availability, terms and cost of transportation. The transportation of oil in common carrier pipelines is also subject to rate regulation. FERC regulates interstate oil pipeline transportation rates under the Interstate Commerce Act, and intrastate oil pipeline transportation rates are subject to regulation by state regulatory commissions. The basis for intrastate oil pipeline regulation, and the degree of regulatory oversight and scrutiny given to intrastate oil pipeline rates, varies from state to state. Insofar as effective interstate and intrastate rates are equally applicable to all comparable shippers, we believe that the regulation of oil transportation rates will not affect our operations in any materially different way than such regulation will affect the operations of our competitors.
Further, interstate and intrastate common carrier oil pipelines must provide service on a non-discriminatory basis. Under this open access standard, common carriers must offer service to all shippers requesting service on the same terms and under the same rates. When oil pipelines operate at full capacity, access is governed by prorationing provisions set forth in the pipelines’ published tariffs. Accordingly, we believe that access to oil pipeline transportation services generally will be available to our operators to the same extent as to our or their competitors.
State Regulation. Texas regulates the drilling for, and the production, gathering and sale of, oil and natural gas, including imposing severance taxes and requirements for obtaining drilling permits. Texas currently imposes a 4.6% severance tax on oil production and a 7.5% severance tax on natural gas production. States also regulate the method of developing new fields, the spacing and operation of wells and the prevention of waste of oil and natural gas resources. States may regulate rates
13
of production and may establish maximum daily production allowables from oil and natural gas wells based on market demand or resource conservation, or both. States do not regulate wellhead prices or engage in other similar direct economic regulation, but we cannot assure you that they will not do so in the future. The effect of these regulations may be to limit the amount of oil and natural gas that may be produced from our wells and to limit the number of wells or locations our operators can drill.
The petroleum industry is also subject to compliance with various other federal, state and local regulations and laws. Some of those laws relate to resource conservation and equal employment opportunity. We do not believe that compliance with these laws will have a material adverse effect on us.
Employees
We do not have any employees. As of the effective time of the Conversion, the business and affairs of the Company are overseen by our board of directors, rather than the General Partner, which oversaw the business and affairs of the Partnership, our predecessor, as its general partner. Further, post-Conversion, Diamondback continues to provide personnel and general and administrative services to the Company, including the services of the executive officers and other employees, pursuant to the services and secondment agreement in substantially the same manner as Diamondback previously provided to the General Partner. Please see Item 7. Management’s Discussion and Analysis—Financial Condition and Results of Operations and the consolidated financial statements and related notes in Item 8. Financial Statements and Supplementary Data of this report. All of the individuals that conduct our business, including our executive officers, are employed by Diamondback.
Facilities
Our principal executive offices are located in Midland, Texas and are owned by Diamondback. We believe that these facilities are adequate for our current operations.
Availability of Company Reports
Our annual reports on Form 10-K, quarterly reports on Form 10-Q, current reports on Form 8-K and all amendments to those reports are available free of charge on the Investor Relations page of our website at www.viperenergy.com as soon as reasonably practicable after such material is electronically filed with, or furnished to, the SEC. Information contained on, or connected to, our website is not incorporated by reference into this Annual Report and should not be considered part of this or any other report that we file with or furnish to the SEC. Reports filed or furnished with the SEC are also made available on its website at www.sec.gov.
14
ITEM 1A. RISK FACTORS
The nature of our business activities subjects us to certain hazards and risks. The following is a summary of some of the material risks relating to our business activities. Other risks are also described in Items 1 and 2. Business and Properties, Item 7. Management’s Discussion and Analysis—Financial Condition and Results of Operations and Item 7A. Quantitative and Qualitative Disclosures About Market Risk of this report. These risks are not the only risks we face. We could also face additional risks and uncertainties not currently known to us or that we currently deem to be immaterial. If any of these risks actually occurs, it could materially harm our business, financial condition or results of operations and the trading price of our shares could decline.
Risks Related to Our Business
In prior periods, our business was adversely affected by the COVID-19 pandemic and volatility in the oil and natural gas markets, compounded by the global effects of the war in Ukraine and the Israel-Hamas War. We could continue to experience such adverse effects in future periods.
During 2023, 2022, and 2021 NYMEX WTI has ranged from $47.62 to $123.70 per Bbl, and the NYMEX Henry Hub price of natural gas has ranged from $1.99 to $9.68 per MMBtu, with seven-year highs reached in 2022. The war in Ukraine, the Israel-Hamas War, the COVID-19 pandemic, rising interest rates, global supply chain disruptions, concerns about a potential economic downturn or recession, recent measures to combat persistent inflation, and actions taken by OPEC and its non-OPEC allies, collectively OPEC+, continued to contribute to economic and pricing volatility during 2023.
Diamondback and certain of our other operators increased production on our acreage during 2023, but continued to exercise capital discipline by using the majority of their excess cash flow for debt repayment and/or return to their stockholders rather than expanding their drilling programs. We cannot reasonably predict whether production levels will remain at current levels or the impact the full extent of the events above may have on our industry and our business.
Based on the current commodity pricing environment and industry conditions, we did not record any impairments in 2023. However, if commodity prices fall below current levels, we may be required to record impairments in future periods and such impairments could be material. Further, if commodity prices decrease, our production, proved reserves and cash flows will be adversely impacted. Lower oil and natural gas prices may also result in a reduction in the borrowing base under the Operating Company’s revolving credit facility, which may be determined at the discretion of our lenders.
Other significant factors that are likely to continue to affect commodity prices in future periods include, but are not limited to, the effect of U.S. energy, monetary and trade policies, U.S. and global economic conditions, U.S. and global political and economic developments, including the Biden Administration’s energy and environmental policies, all of which are beyond our control. Our business may be also adversely impacted by any future government rule, regulation or order that may impose production limits, as well as pipeline capacity and storage constraints, in the Permian Basin where we have mineral and royalty interests. We cannot predict the ultimate impact of these factors on our business, financial condition and cash available for dividends to our stockholders.
We cannot predict the impact of the ongoing war in Ukraine or the Israel-Hamas War on the global economy, energy markets, geopolitical stability and our business.
Our mineral and royalty acreage is located primarily in the Permian Basin in West Texas. However, the broader consequences of the war in Ukraine and the Israel-Hamas War, may increase volatility in the price of and demand for oil and natural gas, increase exposure to cyberattacks, cause disruptions in global supply chains, increase foreign currency fluctuations, cause constraints or disruption in the capital markets, limit sources of liquidity and adversely impact global macroeconomic conditions. We cannot predict the extent of the conflicts’ effect on our business, results of operations, the global economy or energy markets.
Our commodity price derivatives could result in financial losses, may fail to protect us from declines in commodity prices, prevent us from fully benefiting from commodity price increases and may expose us to other risks, including counterparty credit risk.
We use fixed price swap contracts, fixed price basis swap contracts and costless collar contracts with corresponding put and call options to reduce price volatility associated with certain of our royalty income. Our derivative contracts are based upon reported settlement prices on commodity exchanges, with crude oil derivative settlements based on NYMEX WTI pricing
15
(Cushing and Midland-Cushing) and with natural gas derivative settlements based on the NYMEX Henry Hub and Waha Hub pricing. By using derivative instruments to economically hedge exposure to changes in commodity prices, we expose ourselves to credit risk and market risk. At settlement, market prices for commodities may exceed the contract prices in our commodity price derivatives agreements, resulting in our need to make significant cash payments to our counterparties. Further, by using commodity derivative instruments, we expose ourselves to credit risk if we are in a positive position at contract settlement and the counterparty fails to perform under the terms of the derivative contract. Our counterparties have been determined to have an acceptable credit risk; therefore, we do not require collateral from our counterparties. By using derivative instruments, we may be prevented from fully realizing the benefits of increases in the prices of oil, natural gas liquids and natural gas above the price levels of the commodity price derivatives used to manage price risk.
For additional information regarding our use of commodity price derivatives and our outstanding derivative contracts as of December 31, 2023, see Note 10—Derivatives in Item 8. Financial Statements and Supplementary Data, Item 7. Management’s Discussion and Analysis—Financial Condition and Results of Operations and Item 7A. Quantitative and Qualitative Disclosures About Market Risk—Commodity Price Risk of this report.
The IRA and other risks relating to climate change could accelerate the transition to a low carbon economy and could impose new costs on our operations that may have a material and adverse effect on us.
Governmental and regulatory bodies, investors, consumers, industry and other stakeholders have been increasingly focused on climate change matters in recent years. This focus, together with changes in consumer and industrial/commercial behavior, preferences and attitudes with respect to the generation and consumption of energy, the use of hydrocarbons, and the use of products manufactured with, or powered by, hydrocarbons, may result in; (i) the enactment of climate change-related regulations, policies and initiatives by governments, investors, and other companies, including alternative energy or “zero carbon” requirements and fuel or energy conservation measures, (ii) technological advances with respect to the generation, transmission, storage and consumption of energy (including advances in wind, solar and hydrogen power, as well as battery technology), (iii) increased availability of, and increased demand from consumers and industry for, energy sources other than oil and natural gas (including wind, solar, nuclear, and geothermal sources as well as electric vehicles), and (iv) development of, and increased demand from consumers and industry for, lower-emission products and services (including electric vehicles and renewable residential and commercial power supplies) as well as more efficient products and services.
Any of these developments may reduce the demand for products manufactured with (or powered by) hydrocarbons and the demand for, and in turn the prices of, the oil and natural gas that we produce and sell, which would likely have a material adverse impact on us. The enactment of climate change-related regulations, policies and initiatives may also result in increases in our compliance costs and other operating costs and have other adverse effects, such as a greater potential for governmental investigations or litigation.
In recent years, federal, state and local governments have taken steps to reduce emissions of greenhouse gases. For example, the Infrastructure Investment and Jobs Act and the IRA include billions of dollars in incentives for the development of renewable energy, clean hydrogen, clean fuels, electric vehicles, investments in advanced biofuels and supporting infrastructure and carbon capture and sequestration. Also, the EPA has proposed ambitious rules to reduce harmful air pollutant emissions, including greenhouse gases, from light-, medium-, and heavy-duty vehicles beginning in model year 2027. These incentives and regulations could accelerate the transition of the economy away from the use of fossil fuels towards lower- or zero-carbon emissions alternatives, which could decrease demand for, and in turn the prices of, the oil and natural gas that we produce and sell and adversely impact our business. Additionally, the IRA imposes the first ever federal fee on greenhouse gas emissions through a methane emissions charge, which could increase our operating costs and thereby adversely impact our business, financial condition and cash flows.
In addition to potentially reducing (i) demand for our oil and natural gas and (ii) the availability of oilfield services and midstream and downstream customers, any of these developments may also create reputational risks associated with the exploration for, and production of, hydrocarbons, which may adversely affect the availability and cost to us of capital. For example, a number of prominent investors have publicly announced their intention to no longer invest in the oil and gas sector in response to concerns related to climate change, and other financial institutions and investors may decide to do likewise in the future. If financial institutions and other investors refuse to invest in or provide capital to the oil and gas sector in the future because of these reputational risks, that could result in capital being unavailable to us, or only at a significantly increased cost.
For further discussion regarding the risks to us of climate change-related regulations, policies and initiatives, see Item 1 and 2. Business and Properties—Regulation—Climate Change of this report.
16
Continuing political and social concerns relating to climate change and other environmental, social and governance factors may result in significant litigation and related expenses.
Increasing attention to global climate change has resulted in increased investor attention and an increased risk of public and private litigation, which could increase our costs or otherwise adversely affect us. For example, stockholder activism has recently been increasing in our industry, and stockholders may attempt to effect changes to our business or governance to deal with climate change-related issues, whether by stockholder proposals, public campaigns, proxy solicitations or otherwise, which may result in significant management distraction and potentially significant expense.
Also, investor and regulatory focus on environmental, social and governance (“ESG”) matters continues to increase. For example, in addition to climate change, there is increasing attention on topics such as diversity and inclusion, human rights, and human and natural capital in companies’ own operations as well as their supply chains. In addition, perspectives on the efficacy of ESG considerations continue to evolve, and we cannot currently predict how regulators’, investors’ and other stakeholders’ views on ESG matters may affect the regulatory and investment landscape and affect our business, financial condition, and results of operations. If we do not, or are perceived to not, adapt or comply with investor or stakeholder expectations and standards on ESG matters, we may suffer from reputational damage and our business, financial condition and results of operations could be materially and adversely affected.
In March 2022, the SEC proposed new rules relating to the disclosure of a range of climate-related risks and other information. To the extent this rule is finalized as proposed, we and/or our customers could incur increased costs related to the assessment and disclosure of climate-related information. Enhanced climate disclosure requirements could also accelerate any trend by certain stakeholders and capital providers to restrict or seek more stringent conditions with respect to their financing of certain carbon intensive sectors.
Additionally, cities, counties, and other governmental entities in several states in the U.S. have filed lawsuits against energy companies seeking damages allegedly associated with climate change. Similar lawsuits may be filed in other jurisdictions. If any such lawsuits were to be filed against us, we could incur substantial legal defense costs and, if any such litigation were adversely determined, we could incur substantial damages. Any of these climate change-related litigation risks could result in unexpected costs, negative sentiments about our company, disruptions to our business, and increases to our operating expenses, which in turn could have an adverse effect on our business, financial condition and cash flow.
Conservation measures and technological advances could reduce demand for oil and natural gas.
Fuel conservation measures, alternative fuel requirements, increasing consumer demand for alternatives to oil and natural gas, technological advances in fuel economy and energy generation devices could reduce demand for oil and natural gas. The impact of the changing demand for oil and natural gas services and products may have a material adverse effect on our business, financial condition, results of operations and cash available to return to our stockholders.
Increased costs of capital could adversely affect our business
Our business could be harmed by factors such as the availability, terms and cost of capital, increases in interest rates or a reduction in our credit rating. Changes in any one or more of these factors could cause our cost of doing business to increase, limit our access to capital, limit our ability to pursue acquisition opportunities, reduce our cash flows available and place us at a competitive disadvantage. Continuing disruptions and volatility in the global financial markets may lead to an increase in interest rates or a contraction in credit availability impacting our ability to finance our activities. A significant reduction in the availability of credit could materially and adversely affect our ability to achieve our business strategy and cash flows.
We may not have sufficient available cash to pay any quarterly dividend on our common stock, our cash available for dividends may vary significantly from quarter to quarter and our board of directors may in the future modify or revoke our cash dividend policy at any time at its discretion. Our dividend policy could limit our ability to grow and make acquisitions.
We may not have sufficient cash available to pay base or variable dividends to our common stockholders each quarter. Furthermore, our cash dividend policy does not require us to pay dividends on a quarterly basis or otherwise. The amount of cash we have to distribute each quarter principally depends upon the amount of royalty income we generate, which is dependent upon the volumes of production sold and the prices that our operators realize from the sale of such production. In addition, the actual amount of cash we will have to distribute each quarter under our cash dividend policy will be reduced by payments in respect of income taxes, debt service and other contractual obligations and fixed charges, increases in reserves for future operating or capital needs that the board of directors may determine is appropriate, lease bonus income, distribution equivalent rights payments and preferred dividends, if any, and any common share repurchases. The board of directors may further modify
17
or revoke our dividend policy at any time in the future at its discretion. During 2022, the board of directors approved a dividend policy, effective beginning with the Company’s dividend payable for the third quarter of 2022, consisting of a base and variable dividend, that takes into account capital returned to stockholders via our common stock repurchase program. For information regarding our dividend policy and the recent modifications, see Item 5. Market for Registrant’s Common Equity, Related Stockholder Matters and Issuer Purchases of Equity Securities—Cash Dividend Policy and Item 7. Management’s Discussion and Analysis—Financial Condition and Results of Operations of this report. As a result, quarterly dividends paid to our stockholders may vary significantly from quarter to quarter and may be zero.
As a result of our cash dividend policy, we will have limited cash available to reinvest in our business or to fund acquisitions, and we will rely primarily upon external financing sources, including commercial bank borrowings and the issuance of debt and equity securities, to fund our acquisitions and growth capital expenditures. As such, to the extent we are unable to finance growth externally, our dividend policy will significantly impair our ability to grow.
To the extent we issue additional shares in connection with any acquisitions or growth capital expenditures or as in-kind dividends, the payment of dividends on those additional shares may increase the risk that we will be unable to maintain or increase our per share dividend level.
We depend on a small number of operators for a substantial portion of the development and production on the properties underlying our mineral interests. A reduction in the expected number of wells to be drilled on our acreage by these operators or the failure of an operator to adequately and efficiently develop and operate our acreage could have an adverse effect on our expected growth and our results of operations.
The failure of our operators to adequately or efficiently perform operations or an operator’s failure to act in ways that are in our best interests could reduce production and revenues. Any development and production activities on our properties are subject to our operators’ reasonable discretion. The level, success and timing of drilling and development activities on our properties, and whether the operators elect to drill any additional wells on our acreage, depends on a number of factors that will be largely outside of our control, including: commodity prices; the timing and amount of capital expenditures by our operators, which could be significantly more than anticipated; the ability of our operators to access capital; the availability, high cost or shortages of rigs and other suitable drilling equipment, raw materials, supplies and oilfield services; the availability of production and transportation infrastructure and qualified operating personnel; regulatory restrictions; the operators’ expertise, operating efficiency and financial resources; approval of other participants in drilling wells; the operators’ expected return on investment in wells drilled on our acreage as compared to opportunities in other areas; the selection of technology; the selection of counterparties for the sale of production; and the rate of production of the reserves.
The operators may elect not to undertake development activities, or may undertake such activities in an unanticipated fashion, which may result in significant fluctuations in our royalty income and cash available for dividends to our stockholders. If reductions in production by the operators are implemented on our properties and sustained, our revenues may also be substantially affected. Additionally, if an operator were to experience financial difficulty, the operator might not be able to pay its royalty payments or continue its operations, which could have a material adverse impact on us.
The development of our proved undeveloped reserves may take longer and may require higher levels of capital expenditures by operators than we currently anticipate.
Approximately 20% of our total estimated proved reserves as of December 31, 2023 were proved undeveloped reserves and may not be ultimately developed or produced. Recovery of proved undeveloped reserves requires significant capital expenditures and successful drilling operations by the operators on our mineral and royalty acreage. The reserve data included in the reserve reports of our independent petroleum engineers assume that substantial capital expenditures are required to develop such reserves. We cannot be certain that the estimated costs of the development of these reserves are accurate, that development will occur as scheduled or that the results of such development will be as estimated. Delays in the development of our reserves, increases in costs to drill, complete and develop such reserves, or further decreases in commodity prices will reduce the future net revenues of our estimated proved undeveloped reserves and may result in some projects becoming uneconomical. In addition, delays in the development of reserves could force us to reclassify certain of our proved reserves as unproved reserves.
We may not be able to terminate our leases if any of our operators declare bankruptcy, and we may experience delays and be unable to replace operators that do not make royalty payments.
A failure on the part of the operators to make royalty payments gives us the right to terminate the lease, repossess the property and enforce payment obligations under the lease. If we repossessed any of our properties, we would seek a
18
replacement operator. However, we might not be able to find a replacement operator and, if we did, we might not be able to enter into a new lease on favorable terms within a reasonable period of time. In addition, the outgoing operator could be subject to bankruptcy proceedings that could prevent the execution of a new lease or the assignment of the existing lease to another operator. In addition, if we enter into a new lease, the replacement operator may not achieve the same levels of production or sell oil or natural gas at the same price as the operator it replaced.
The producing properties in which we have mineral and royalty interests are primarily concentrated in the Permian Basin of West Texas, making us vulnerable to risks (including weather-related risks) associated with a single geographic area. In addition, a large amount of our proved reserves is attributable to a small number of producing horizons within this area.
The producing properties in which we have mineral and royalty interests are currently geographically primarily concentrated in the Permian Basin of West Texas. As a result of this concentration, we may be disproportionately exposed to the impact of regional supply and demand factors, delays or interruptions of production from wells in this area caused by governmental regulation, processing or transportation capacity constraints faced by our operators or their customers, availability of equipment, facilities, personnel or services market limitations or interruption of the processing or transportation of crude oil, natural gas or natural gas liquids on our mineral and royalty acreage, and extreme weather conditions, such as the severe winter storms in the Permian Basin in February 2021, and their adverse impact on production volumes, availability of electrical power, road accessibility and transportation facilities on our mineral and royalty acreage.
Extreme regional weather events may occur that can affect our operators’ suppliers or customers, which could adversely affect us. For example, a significant hurricane or similar weather event could damage refining and other oil and natural gas-related facilities on the Gulf Coast of Texas and Louisiana, which (if significant enough) could limit the availability of gathering and transportation facilities across Texas and could then cause production in the Permian Basin (potentially including production on our mineral and royalty acreage) to be curtailed or shut in or (in the case of natural gas) flared. Climate changes may also increase the frequency and severity of significant weather events over time. Further, any increase in flaring of natural gas production on our mineral and royalty acreage due to weather-related events, or otherwise, could expose us to reputational risks and adversely impact our or our operators’ contractual and other business relationships. Any of the above-referenced events could have a material adverse effect on us. Likewise, a weather event like the severe winter storms in the Permian Basin in February 2021 could reduce the availability of electrical power, road accessibility, and transportation facilities, which could have an adverse impact on production volumes on our mineral and royalty acreage (and therefore on our financial condition and results of operations).
In addition, the effect of fluctuations on supply and demand may become more pronounced within specific geographic oil and natural gas producing areas such as the Permian Basin, which may cause these conditions to occur with greater frequency or magnify the effects of these conditions. Due to the concentrated nature of our mineral and royalty acreage, we could experience any of these conditions at the same time, resulting in a relatively greater impact on us than they might have on other companies that have a more diversified portfolio of assets. Such delays or interruptions could have a material adverse effect on our business, financial condition and cash flow.
In addition to the geographic concentration of our mineral and royalty acreage, as of December 31, 2023, most of our proved reserves are concentrated in the Wolfberry resource play in the Midland Basin. This concentration of assets within a small number of producing horizons exposes us to additional risks, such as changes in field-wide rules and regulations that could cause our operators to permanently or temporarily shut-in all of wells on our mineral and royalty acreage.
Our future success depends on the development or acquisition of additional reserves, and our failure to successfully identify, complete and integrate acquisitions of properties or businesses could slow our growth and adversely affect our results of operations and cash available for dividends.
Our future success depends upon the development or acquisition of additional oil and natural gas reserves that are economically recoverable, as our proved reserves will generally decline as reserves are depleted. To increase reserves and production, we would need to undertake replacement activities or use third party operators to undertake development, exploration and other replacement activities, requiring substantial capital expenditures. Neither we nor our third party operators may have sufficient resources to acquire additional reserves or to undertake exploration, development, production or other replacement activities. Such activities by our third party operators may not result in significant additional reserves and efforts to drill productive wells at low finding costs may be unsuccessful. In addition, we do not expect to retain cash from our operations for replacement capital expenditures. Furthermore, although our revenues and cash available for dividends may increase if prevailing oil and natural gas prices increase significantly, finding costs for additional reserves could also increase.
19
There is intense competition for acquisition opportunities in our industry. The successful acquisition of producing properties requires an assessment of several factors, including; recoverable reserves, future oil and natural gas prices and their applicable differentials, operating costs and potential environmental and other liabilities. The accuracy of these assessments is inherently uncertain and we may not be able to identify attractive acquisition opportunities. In connection with these assessments, we perform a review of the subject properties that we believe to be generally consistent with industry practices. Our review will not reveal all existing or potential problems including title defects, which, if material, can render an interest worthless or environmental issues, nor will it permit us to become sufficiently familiar with the properties to assess fully their deficiencies and capabilities. Inspections may not always be performed on every well, and environmental problems, such as groundwater contamination, are not necessarily observable even when an inspection is undertaken, which can adversely affect our results of operations, financial condition and cash available for dividends. Even when problems are identified, the seller may be unwilling or unable to provide effective contractual protection against all or part of the problems. Even if we do identify attractive acquisition opportunities, we may not be able to complete the acquisition or do so on commercially acceptable terms. Unless our operators further develop our existing properties, we will depend on acquisitions to grow our reserves, production and cash flow.
Competition for acquisitions may increase the cost of, or cause us to refrain from, completing acquisitions. Our ability to complete acquisitions is dependent upon, among other things, our ability to obtain debt and equity financing and, in some cases, regulatory approvals. Further, these acquisitions may be in geographic regions in which we do not currently hold properties. If we enter into new geographic markets, we may be subject to additional and unfamiliar legal and regulatory requirements and other unforeseen difficulties. Compliance with regulatory requirements may impose substantial additional obligations on us and our management, cause us to expend additional time and resources in compliance activities and increase our exposure to penalties or fines for non-compliance with such additional legal requirements. Further, the success of any completed acquisition will depend on our ability to effectively integrate the acquired business into our existing operations, the process of which may involve unforeseen difficulties and may require a disproportionate amount of our managerial and financial resources. In addition, possible future acquisitions may be larger and for purchase prices significantly higher than those paid for earlier acquisitions. Any of the unfavorable circumstances mentioned above could have a material adverse effect on our financial condition, results of operations and cash available for dividends. The inability to effectively manage the integration of acquisitions could reduce our focus on subsequent acquisitions and current operations, which, in turn, could negatively impact our growth, results of operations and cash available for dividends.
Project areas on our properties, which are in various stages of development, may not yield oil or natural gas in commercially viable quantities.
Project areas on our properties are in various stages of development, ranging from project areas with current drilling or production activity to project areas that have limited drilling or production history. If the wells in the process of being completed are on our property and do not produce sufficient revenues or if dry holes are drilled, our financial condition, results of operations and cash available for dividends may be materially affected.
Our estimated reserves are based on many assumptions that may turn out to be inaccurate. Any material inaccuracies in these reserve estimates or underlying assumptions will materially affect the quantities and present value of our reserves.
Oil and natural gas reserve engineering is not an exact science and requires subjective estimates of underground accumulations of oil and natural gas and assumptions concerning future oil and natural gas prices, production levels, ultimate recoveries and operating and development costs, if any. As a result, estimated quantities of proved reserves, projections of future production rates and the timing of development expenditures may be incorrect. Over time, we may make material changes to reserve estimates taking into account the results of actual drilling, testing and production. Also, certain assumptions regarding future oil and natural gas prices, production levels and operating and development costs, if any, may prove incorrect. Any significant variance from these assumptions to actual figures could greatly affect our estimates of reserves, the economically recoverable quantities of oil and natural gas attributable to any particular group of properties, the classifications of reserves based on risk of recovery and estimates of future net cash flows. A substantial portion of our reserve estimates are made without the benefit of a lengthy production history, which are less reliable than estimates based on a lengthy production history. Numerous changes over time to the assumptions on which our reserve estimates are based, as described above, often result in the actual quantities of oil and natural gas that we ultimately recover being different from our reserve estimates. Reserve estimates do not include any value for probable or possible reserves that may exist, nor do they include any value for unproved undeveloped acreage.
20
We are dependent on electrical power, internet and telecommunication infrastructure and information and computer systems. If any of these systems are compromised or unavailable, our business could be adversely affected.
We are dependent on electric power, internet and telecommunication infrastructure and Diamondback’s information systems and computer based programs. If any of such infrastructure, systems or programs were to fail or become unavailable or compromised, or create erroneous information in our hardware or software network infrastructure, our ability to safely and effectively conduct our business will be limited and any such consequence could have a material adverse effect on our business.
We are subject to cybersecurity risks. A cyber incident could occur and result in information theft, data corruption, operational disruption and/or financial loss.
We rely extensively on Diamondback’s information technology systems, including internally developed software, data hosting platforms, real-time data acquisition systems, third-party software, cloud services and other internally or externally hosted hardware and software platforms, to (i) estimate our oil and natural gas reserves, (ii) process and record financial and operating data, and (iii) communicate with our management and board of directors, as well as, our vendors, suppliers and other third parties. Further, our reliance on technology has increased due to the increased use of personal devices, remote communications and work-from-home or hybrid work practices.
Risks from cybersecurity threats have not materially affected, and are not currently anticipated to materially affect, our company, including our business strategy, results of operations and financial condition. However, our systems and networks (which are provided by Diamondback), and those of its vendors, service providers and other third party providers, may become the target of cybersecurity attacks, including, without limitation, denial-of-service attacks; malicious software; data privacy breaches by insiders or others with authorized access; cyber or phishing-attacks; ransomware; attempts to gain unauthorized access to our data and Diamondback’s systems; and other electronic security breaches. If any of these security breaches were to occur, we could suffer disruptions to our operations, normal business functions and other aspects of our business.
Diamondback provides personnel and general and administrative services to us, including personnel and infrastructure that underlie our cybersecurity risk management program. In connection therewith, Diamondback has implemented and invested in, and will continue to implement and invest in, controls, procedures and protections (including internal and external personnel) that are designed to protect its systems; identify and remediate, on a regular basis, vulnerabilities in its systems and related infrastructure and monitor and mitigate the risk of data loss and other cybersecurity threats. Diamondback has also engaged third-party consultants to conduct penetration testing and risk assessments. Diamondback’s cybersecurity governance program is informed by the National Institute of Standards and Technology (“NIST”) Cybersecurity Framework and measured by the Maturity and Risk Assessment Ratings associated with the NIST Cybersecurity Framework and the Capability Maturity Model Integration. Such measures, however, cannot entirely eliminate cybersecurity threats and may prove to be ineffective. As cyber incidents continue to evolve, Diamondback may be required to expend additional resources (for which we may be partially responsible) to continue to modify or enhance protective measures or to investigate and remediate any vulnerability to cyber incidents. Diamondback maintains specialized insurance for possible liability resulting from a cyberattack on its assets, however, we cannot assure you that the insurance coverage will be adequate to cover claims that may arise, or that Diamondback will be able to maintain adequate insurance at rates we consider reasonable. A loss not fully covered by insurance could have a material adverse effect on our business, financial condition and cash flows.
Risks Related to Our Indebtedness
Implementing our capital programs may, under certain circumstances, require an increase in our total leverage through additional debt issuances. In addition, a significant reduction in availability under the revolving credit facility and the inability to otherwise obtain financing for our capital programs could require us to curtail our capital expenditures.
As a result of our cash dividend policy, we have limited cash available to reinvest in our business or to fund acquisitions and have historically relied on availability under the Operating Company’s revolving credit facility to fund a portion of our capital expenditures and for other purposes. We expect that we will continue to fund a portion of our capital expenditures and other needs with borrowings under the revolving credit facility and from the proceeds of debt and equity offerings. In the past, we have created availability under the revolving credit facility by repaying outstanding borrowings with the proceeds from equity and debt offerings. We cannot assure you that we will choose to or be able to access the capital markets to repay any such future borrowings. If the availability under the revolving credit facility were reduced, and we were otherwise unable to secure other sources of financing, we may be required to curtail our capital expenditures, which could result in an inability to complete acquisitions or finance the capital expenditures necessary to replace our reserves.
21
Restrictive covenants in the Operating Company’s revolving credit facility, the indentures governing the Notes and future debt instruments may limit our ability to respond to changes in market conditions or pursue business opportunities.
The Operating Company’s revolving credit facility and the indentures governing the Notes outstanding contain, and the terms of any future indebtedness may contain, restrictive covenants that limit our and the Operating Company’s ability to, among other things: incur or guarantee additional indebtedness; make certain investments; create additional liens; sell or transfer assets; lease property as a lessee; issue redeemable or preferred equity; voluntarily redeem or prepay debt (including the Notes); merge or consolidate with another entity; pay or declare dividends; designate certain of our subsidiaries as unrestricted subsidiaries; create unrestricted subsidiaries; engage in transactions with affiliates; enter into gas imbalances, take-or-pay and similar agreements; and enter into certain swap agreements.
We may be prevented from taking advantage of business opportunities that arise because of the limitations imposed on us and the Operating Company by the restrictive covenants contained in the revolving credit facility and the indentures that govern the Notes. In addition, the revolving credit facility requires us to maintain certain financial ratios and tests. The requirement that we comply with these provisions may materially adversely affect our ability to react to changes in market conditions, take advantage of business opportunities we believe to be desirable, obtain future financing, fund needed capital expenditures or withstand a continuing or future downturn in our business.
Our and the Operating Company’s future ability to comply with these restrictions and covenants is uncertain and will be affected by the levels of cash flow from our operations and other events or circumstances beyond our control. If market or other economic conditions deteriorate, our ability to comply with these covenants may be impaired. A breach of any of these restrictive covenants could result in default under the revolving credit facility. If a default occurs, the lenders under the revolving credit facility may elect to declare all borrowings outstanding, together with accrued interest and other fees, to be immediately due and payable, which would result in an event of default under the indenture governing the Notes. The lenders will also have the right in these circumstances to terminate any commitments they have to provide further borrowings. If we and the Operating Company are unable to repay outstanding borrowings when due, the lenders under the revolving credit facility will also have the right to proceed against the collateral granted to them to secure the indebtedness. If the indebtedness under the revolving credit facility and the Notes were to be accelerated, we cannot assure you that our assets would be sufficient to repay in full that indebtedness.
Any significant reduction in the borrowing base under the Operating Company’s revolving credit facility as a result of the periodic borrowing base redeterminations, or otherwise, may negatively impact our ability to fund our operations, and we may not have sufficient funds to repay borrowings under the revolving credit facility if required as a result of a borrowing base redetermination.
A decline in commodity prices could result in a redetermination that lowers the borrowing base. Any significant reduction in the borrowing base as a result of such borrowing base redeterminations or otherwise may negatively impact our liquidity and our ability to fund our operations and, as a result, may have a material adverse effect on our financial position, results of operation and cash flow. Further, if the outstanding borrowings under the revolving credit facility were to exceed the borrowing base as a result of any such redetermination, we and the Operating Company would be required to repay the excess. We may not have sufficient funds to make such repayments. If we do not have sufficient funds and we are otherwise unable to negotiate renewals of the borrowings or arrange new financing, we may have to sell significant assets. Any such sale could have a material adverse effect on our business and financial results.
Servicing our indebtedness requires a significant amount of cash, and we may not have sufficient cash flow from our business to pay our substantial indebtedness.
Our ability to make scheduled payments of the principal, to pay interest on or to refinance our indebtedness depends on our future performance, which is subject to economic, financial, competitive and other factors beyond our control. We are dependent on cash flow generated by the Operating Company to repay the Notes. The Operating Company’s business may not generate cash flow from operations in the future sufficient to service our debt and make necessary capital expenditures. If the Operating Company is unable to generate such cash flow, we may be required to adopt one or more alternatives, such as reducing or delaying capital expenditures, selling assets, restructuring debt or obtaining additional capital on terms that may be onerous or highly dilutive. However, we cannot assure you that undertaking alternative financing plans, if necessary, would allow us to meet our debt obligations. In the absence of such cash flows, we could have substantial liquidity problems and might be required to sell material assets to attempt to meet our debt service and other obligations. The Operating Company’s revolving credit facility and the indenture governing the Notes outstanding restrict our ability to use the proceeds from asset sales. We may not be able to consummate those asset sales to raise capital or sell assets at prices that we believe are fair, and proceeds that we do receive may not be adequate to meet any debt service obligations then due. Our ability to refinance our
22
indebtedness will depend on the capital markets and our financial condition at the time. We may not be able to engage in any of these activities or engage in these activities on desirable terms, which could result in a default on our debt obligations and have an adverse effect on our financial condition.
If we experience liquidity concerns, we could face a downgrade in our debt ratings which could restrict our access to, and negatively impact the terms of, current or future financings or trade credit.
Our ability to obtain financings and trade credit and the terms of any financings or trade credit is, in part, dependent on the credit ratings assigned to our debt by independent credit rating agencies. We cannot provide assurance that any of our current ratings will remain in effect for any given period of time or that a rating will not be lowered or withdrawn entirely by a rating agency if, in its judgment, circumstances so warrant. Factors that may impact our credit ratings include debt levels, planned asset purchases or sales and near-term and long-term production growth opportunities, liquidity, asset quality, cost structure, product mix and commodity pricing levels. A ratings downgrade could adversely impact our ability to access financings or trade credit and increase our or the Operating Company’s borrowing costs.
The borrowings under the Operating Company’s revolving credit facility expose us to interest rate risk.
Our earnings are exposed to interest rate risk associated with borrowings under the Operating Company’s revolving credit facility. The terms of the Operating Company’s revolving credit facility provide for interest on borrowings at a floating rate equal to an alternative base rate that, since November 2022 has been tied to SOFR. SOFR tends to fluctuate based on multiple factors, including general short-term interest rates, rates set by the U.S. Federal Reserve, and other central banks and general economic conditions. We have not hedged our interest rate exposure with respect to our floating rate debt. The Operating Company’s weighted average interest rate on borrowings under its revolving credit facility was 7.41% during the year ended December 31, 2023. If interest rates increase, so will our interest costs, which may have a material adverse effect on our results of operations and financial condition.
Risks Inherent in an Investment in Us
Diamondback controls us and its interests may conflict with ours or yours in the future.
Diamondback beneficially owns approximately 56% of the voting power of our capital stock. For so long as Diamondback continues to have voting power over a significant percentage of our capital stock, even if such amount is less than 50%, it will still be able to significantly influence the composition of our board of directors and the approval of actions requiring stockholder approval. Although the holders of our common stock are entitled to vote on all matters on which stockholders of a corporation are generally entitled to vote on under the Delaware General Corporation Law (the “DGCL”), including the election of our board of directors, pursuant to our certificate of incorporation, for so long as Diamondback and any of its subsidiaries collectively beneficially own at least 25% of our outstanding common stock (i) Diamondback has the right to designate up to three persons to serve as members of our board of directors and (ii) our board of directors may not appoint any person other than a Diamondback seconded employee as an executive officer of our company unless such appointment is approved, in advance, by either (x) Diamondback (which approval may not be unreasonably withheld or conditioned) or (y) the affirmative vote of the holders of at least 80% of the voting power of our capital stock. Currently, there are two Diamondback designees to our board of directors—Travis Stice and Kaes Van’t Hof. Further, in connection with the Conversion, we entered into a services and secondment agreement with Diamondback E&P LLC and OpCo, pursuant to which Diamondback continues to provide personnel and general and administrative services to us and OpCo, including the services of the executive officers and other employees, in substantially the same manner as Diamondback provided to us before the Conversion. Accordingly, Diamondback will have significant influence with respect to our board of directors, management, business plans and policies, including the appointment and removal of our officers. In particular, for so long as Diamondback continues to beneficially own a significant percentage of our capital stock, it will be able to cause or prevent a change of control of our company or a change in the composition of our board of directors and could preclude any unsolicited acquisition of our company. The concentration of ownership could deprive you of an opportunity to receive a premium for your shares of common stock as part of a sale of our company and ultimately might affect the market price of our common stock.
We do not have any employees, and we rely solely on the employees of Diamondback to manage our business. The management team of Diamondback, which includes the individuals who manage us, also perform similar services for Diamondback and certain of its affiliates, and thus are not solely focused on our business.
We do not have any employees and we rely solely on Diamondback to operate our assets and perform other management, administrative and operating services for us under the terms and conditions of the services and secondment
23
agreement discussed above. Because Diamondback provides services to us that are similar to those it performs for itself and its affiliates, it may not have sufficient human, technical and other resources to provide those services at a level that it would be able to provide to us if it were solely focused on our business and operations. Diamondback may make internal decisions on how to allocate its available resources and expertise that may not always be in our best interest compared to Diamondback’s interests. There is no requirement that Diamondback favor us over itself or others in providing its services. If Diamondback does not devote sufficient attention to the management and operation of our business or otherwise breaches the provisions of the services and secondment agreement, our financial results may suffer and our ability to pay dividends to our stockholders may be reduced. Many key responsibilities within our business have been assigned to a small number of individuals. The loss of their services could adversely affect our business. In particular, the loss of the services of one or more members of the executive team could disrupt our business. Further, we do not maintain “key person” life insurance policies on any of our executive team or other key personnel. As a result, we are not insured against any losses resulting from the death of these key individuals.
State and local income and other tax reimbursements due to Diamondback for our share of state and local and other taxes borne by Diamondback will reduce cash available for dividends to our common stockholders.
We have entered into a tax sharing agreement with Diamondback pursuant to which we are required to reimburse Diamondback for our share of state and local income and other taxes borne by Diamondback as a result of our results being included in a combined or consolidated tax return filed by Diamondback. The reimbursement of our share of state and local income and other taxes borne by Diamondback will reduce the amount of cash available for dividends from us to our common stockholders.
The market price of our shares of Class A Common Shares could be adversely affected by sales of substantial amounts of our Class A common stock in the public or private markets.
Sales by holders of a substantial number of our Class A Common Stock in the public markets, or the perception that such sales might occur, could have a material adverse effect on the price of our Class A Common Stock or could impair our ability to obtain capital through an offering of equity securities. In addition, we have provided registration rights to Diamondback. Pursuant to these registration rights, we have registered, under the Securities Act, all of the Class A Common Stock owned by Diamondback for resale (including Class A common stock issuable in respect of the Class B Common Stock under the related exchange agreement).
U.S. tax legislation may adversely affect our business, results of operations, financial condition and cash flow.
From time to time, legislation has been proposed that, if enacted into law, would make significant changes to U.S. federal and state income tax laws affecting the oil and natural gas industry, including (i) eliminating the immediate deduction for intangible drilling and development costs, (ii) the repeal of the percentage depletion allowance for oil and natural gas properties; and (iii) an extension of the amortization period for certain geological and geophysical expenditures. No accurate prediction can be made as to whether any such legislative changes will be proposed or enacted in the future or, if enacted, what the specific provisions or the effective date of any such legislation would be. These proposed changes in the U.S. tax law, if adopted, or other similar changes that would impose additional tax on our activities or reduce or eliminate deductions currently available with respect to natural gas and oil exploration, development or similar activities, could adversely affect our business, results of operations, financial condition and cash flow.
On August 16, 2022, President Biden signed into law the IRA, which, among other changes, imposes a 15% corporate alternative minimum tax (“CAMT”) on the “adjusted financial statement income” of certain large corporations (generally, corporations reporting at least $1 billion average adjusted pre-tax net income on their consolidated financial statements) as well as an excise tax of 1% on the fair market value of certain public company stock repurchases for tax years beginning after December 31, 2022. If we are or become subject to the CAMT including as a result of our affiliation with Diamondback, our cash tax obligations for U.S. federal income taxes could be significantly accelerated. To the extent the 1% excise tax applies to our repurchases of shares under our common stock repurchase program, the number of shares we repurchase and our cash flow may be affected.
The U.S. Treasury Department, the Internal Revenue Service and other standard-setting bodies are expected to issue guidance on how the CAMT, stock buyback excise tax and other provisions of the IRA will be applied or otherwise administered that may differ from our interpretations. We continue to evaluate the IRA and its effect on our financial results and operating cash flow.
24
Because we are a “controlled company” as defined in the Nasdaq listing standards, you may not have protection of certain corporate governance requirements which otherwise are required by Nasdaq’s rules.
Under Nasdaq’s rules, a controlled company is a company of which more than 50% of the voting power for the election of directors is held by an individual, group or another company. We are a controlled company because Diamondback and its wholly owned subsidiary Diamondback E&P LLC together hold more than 50% of our voting power. For so long as we remain a controlled company, we are not required to comply with certain corporate governance requirements, and are permitted to elect to rely, and may rely, on certain exemptions from certain corporate governance requirements, including our board of directors is not required to be comprised of a majority of independent directors; our board of directors is not subject to the compensation committee requirement, and we are not subject to the requirements that director nominees be selected either by the independent directors or a nomination committee comprised solely of independent directors.
We have not taken advantage of the exemption to have a majority of independent directors. However, we initially intend to rely upon the exemption to having a compensation committee and the exemption to director nominees being selected by independent directors. As a result, to the extent that we take advantage of these exemptions, you will not have the same protections afforded to stockholders of companies that are subject to all of the Nasdaq corporate governance requirements. Although we do not currently intend to take advantage of the controlled company exemptions, except as set forth above, we cannot assure you that, in the future, we will not seek to take advantage of these exemptions. If we cease to be a “controlled company” in the future, we will be required to comply with the Nasdaq listing standards, which may require development of certain other governance-related policies and practices. These and any other actions necessary to achieve compliance with such rules may increase our legal and administrative costs, will make some activities more difficult, time-consuming and costly and may also place additional strain on our resources.
The provision of our certificate of incorporation requiring exclusive venue in the Court of Chancery in the State of Delaware for certain types of lawsuits may have the effect of discouraging lawsuits against us and our directors, officers and stockholders.
Our certificate of incorporation requires, to the fullest extent permitted by law, that any claim, demand, action, suit or proceeding, whether civil, criminal, administrative or investigative, and whether formal or informal, and including appeals, arising out of or relating in any way to our certificate of incorporation or any of our stock may only be brought in the Court of Chancery of the State of Delaware or, if such court does not have subject matter jurisdiction thereof, any other court in the State of Delaware with subject matter jurisdiction. This provision may have the effect of discouraging lawsuits against us and our directors, officers and stockholders.
Our certificate of incorporation does not limit the ability of Diamondback and certain of its directors, principals, officers, employees and their respective affiliates to compete with us.
Our certificate of incorporation provides that none of Diamondback, any of its directors, principals, officers, employees or respective affiliates will have any duty to refrain from engaging, directly or indirectly, in the same business activities or similar business activities or lines of business in which we operate. In the ordinary course of their business activities, these persons may engage in activities where their interests conflict with our interests or those of our other stockholders.
These persons also may pursue acquisition opportunities that may be complementary to our business, and, as a result, those acquisition opportunities may not be available to the Company. In addition, these persons may have an interest in our pursuing acquisitions, divestitures and other transactions that, in their judgment, could enhance their investment, even though such transactions might involve risks to our common stockholders.
Anti-takeover provisions in our organizational documents and Delaware law might discourage or delay acquisition attempts for us that you might consider favorable.
Our certificate of incorporation and bylaws contain provisions that may make the merger or acquisition of our company more difficult without the approval of our board of directors. Among other things, these provisions would allow us to authorize the issuance of shares of one or more series of preferred stock, including in connection with a stockholder rights plan, financing transactions or otherwise, the terms of which series may be established and the shares of which may be issued without stockholder approval, and which may include super voting, special approval, dividend, or other rights or preferences superior to the rights of the holders of common stock; prohibit stockholder action by written consent unless such action is consented to by the board of directors; provide for certain limitations on convening special stockholder meetings; provide (i) that the board of directors is expressly authorized to make, alter, or repeal our bylaws and (ii) that our stockholders may only amend our bylaws
25
with the approval of at least a majority of all of the outstanding shares of our capital stock entitled to vote; and establish advance notice requirements for nominations for elections to our board or for proposing matters that can be acted upon by stockholders at stockholder meetings.
Further, as a Delaware corporation, we are also subject to provisions of Delaware law which may impede or discourage a takeover attempt that our stockholders may find beneficial. These anti-takeover provisions and other provisions under Delaware law could discourage, delay or prevent a transaction involving a change in control of our company, including actions that our stockholders may deem advantageous, or could negatively affect the trading price of our common stock. These provisions could also discourage proxy contests and make it more difficult for you and other stockholders to elect directors of your choosing and to cause us to take other corporate actions you desire.
We may fail to realize the anticipated benefits of the Conversion or those benefits may take longer to realize than expected or not offset the costs of the Conversion, which could have a material and adverse impact on the trading price of our securities.
We believe that the Conversion will, among other things, improve our trading liquidity, provide our stockholders with enhanced corporate governance rights, expand our investor base and drive greater value for our stockholders over time. However, the level of investor interest in our Class A Common Stock may not meet our expectations. For example, benchmark stock indices may change their eligibility requirements in a manner that is adverse to us or otherwise determine not to include our Class A Common Stock. Moreover, even if we succeed in having our shares of Class A Common Stock included in key stock indices, this may not result in the increased demand for our stock that we anticipate. Consequently, we may fail to realize the anticipated benefits of the Conversion or those benefits may take longer to realize than we expect. Moreover, there can be no assurance that the anticipated benefits of the Conversion will offset its costs. Our failure to achieve the anticipated benefits of the Conversion at all or in a timely manner, or a failure of any benefits realized to offset its costs, could have a material and adverse impact on the trading price of our securities.
Our ability to pay base and variable dividends to the holders of our Class A Common Stock or make share repurchases under our repurchase program may be limited by requirements under our certificate of incorporation, our holding company structure, applicable provisions of Delaware law and contractual restrictions or obligations.
Our current dividend policy is consistent with our pre-Conversion distribution policy. That is, we intend to pay a base dividend, as well as a variable dividend that takes into account capital returned to stockholders via our stock repurchase program. Under our certificate of incorporation, we are required to pay a quarterly preferred dividend in respect of our Class B Common Stock in the aggregate amount of $20,000 per quarter, which is consistent with the pre-Conversion preferred distribution requirement by the Partnership. Other than the preferred dividend requirement, we are not required to pay dividends to our stockholders on a quarterly or other basis, and declaration of any other dividends in the future will be solely in the discretion of our board of directors, which may change our dividend policy at any time. Our ability to pay cash dividends to holders of our Class A Common Stock depends on a number of factors, including among other things, general economic and business conditions, our strategic plans and prospects, our businesses and investment opportunities, our financial condition and operating results, capital requirements and other anticipated cash needs, contractual restrictions and obligations, legal, tax and regulatory restrictions and other factors.
Additionally, as a holding company, our ability to pay dividends or repurchase shares of our Class A common stock is subject to the ability of our operating subsidiary OpCo and any future subsidiaries to provide cash to us. Viper Energy, Inc. has no material assets other than its membership interest in OpCo, which holds all of the mineral and royalty interests and other assets consolidated on our balance sheet.
Under the DGCL we may only pay dividends to our stockholders out of (i) our surplus, as defined and computed under the provisions of the DGCL or (ii) our net profits for the fiscal year in which the dividend is declared and/or the preceding fiscal year. If we do not have sufficient surplus or net profits, we will be prohibited by law from paying any such dividend. In addition, the terms of the OpCo’s revolving credit facility include, and any other debt instruments or financing arrangements may from time to time include covenants or other restrictions that could constrain our ability to pay dividends, make other distributions or repurchase shares of our Class A Common Stock. Our certificate of incorporation contains provisions authorizing us to issue series of preferred stock that may have designations, preferences, rights, powers and duties that are different from, and may be senior to, those applicable to our Class A Common Stock.
For additional information regarding stockholders’ equity and our repurchase program, see Note 7—Stockholders' Equity in Item 8. Financial Statements and Supplementary Data of this report.
26
ITEM 1B. UNRESOLVED STAFF COMMENTS
None.
ITEM 1C. CYBERSECURITY
Cybersecurity Risk Management Strategy
Diamondback provides us with personnel and general and administrative services pursuant to the services and secondment agreement, including the personnel and infrastructure that underlie our cybersecurity risk management program. In connection therewith, Diamondback has implemented and invested in, and will continue to implement and invest in, controls, procedures and protections (including internal and external personnel) that are designed to protect Diamondback’s systems, identify and remediate on a regular basis vulnerabilities in Diamondback’s systems and related infrastructure and monitor and mitigate the risk of data loss and other cybersecurity threats. Diamondback has also engaged third-party consultants to conduct penetration testing and risk assessments. Diamondback’s cybersecurity program is informed by the National Institute of Standards and Technology (“NIST”) Cybersecurity Framework and measured by the Maturity and Risk Assessment Ratings associated with the NIST Cybersecurity Framework and the Capability Maturity Model Integration.
Diamondback’s cybersecurity risk management program is integrated into its overall enterprise risk management program, and shares common methodologies, reporting channels and governance processes that apply across the enterprise risk management program to other legal, compliance, strategic, operational, and financial risk areas that apply to us.
Diamondback’s cybersecurity risk management program, which it provides to us under the services and secondment agreement, includes:
•risk assessments designed to help identify material cybersecurity risks to critical systems, information, products, services, and the broader enterprise IT environment;
•a security team principally responsible for managing (i) cybersecurity risk assessment processes, (ii) security controls, and (iii) its response to cybersecurity incidents;
•the use of external service providers, where appropriate, to assess, test, train or otherwise assist with aspects of its security controls;
•security tools deployed in the IT environment for protection against and monitoring for suspicious activity;
•cybersecurity awareness training of its employees, including incident response personnel and senior management, including those who provide these services for us;
•cybersecurity tabletop exercises for members of its cybersecurity incident response team and legal department;
•a cybersecurity incident response plan that includes procedures for responding to cybersecurity incidents; and
•a third-party risk management process for service providers, suppliers, and vendors.
Cybersecurity Governance
Diamondback’s cybersecurity governance program is led by its Vice President and Chief Information Officer, with support from the internal information technology department. Diamondback’s Vice President and Chief Information Officer has over 20 years of technological leadership experience in the oil and gas industry, providing oversight of all information technology disciplines, including cybersecurity, networking, infrastructure, applications, and data management and protection. Diamondback’s Vice President and Chief Information Officer and his team, which consists of individuals who hold designations as Certified Information Systems Security Professional (CISSP), Certified Information Systems Auditor (CISA), CompTIASecurity+, and Department of Defense (DoD)-Cybersecurity General, are responsible for leading enterprise-wide cybersecurity strategy, policy, standards, architecture and processes. In addition, Diamondback’s cybersecurity incident response team is responsible for responding to cybersecurity incidents in accordance with its Computer Security Incident Response Plan. Progress and developments in Diamondback’s cybersecurity governance program are communicated to members of its and our executive team. The audit committee of the board of directors receives quarterly updates on the status of Diamondback’s cybersecurity governance program, including as related to new or developing initiatives and any security incidents that may occur, to the extent relevant to our program. Board members receive presentations on cybersecurity topics from Diamondback’s Vice President and Chief Information Officer as part of the board’s continuing education on topics that impact public companies. Further, Diamondback’s code of business conduct and ethics expects all employees to safeguard the electronic communications systems and related technologies of Diamondback and its subsidiaries, including us, from theft, fraud, unauthorized access, alteration or other damage and requires them to report any cyberattacks or incidents, improper access or theft to Diamondback’s Chief Legal and Administrative Officer and Vice President and Chief Information Officer. Diamondback’s cybersecurity governance program also includes processes to assess cybersecurity risks related to third-party vendors and suppliers.
27
Risks from cybersecurity threats have not materially affected, and are not currently anticipated to materially affect, our Company, including our business strategy, results of operations or financial condition. See, however, Item 1A. Risk Factors of this report for additional information regarding cybersecurity risks we face and their potential impact on our business strategy, results of operations and financial condition.
ITEM 3. LEGAL PROCEEDINGS
Due to the nature of our business, we are, from time to time, involved in routine litigation or subject to disputes or claims related to our business activities. In the opinion of our management, none of the pending litigation, disputes or claims against us, if decided adversely, will have a material adverse effect on our financial condition, cash flows or results of operations. See Note 12—Commitments and Contingencies in Item 8. Financial Statements and Supplementary Data of this report.
ITEM 4. MINE SAFETY DISCLOSURES
Not applicable.
28
PART II
ITEM 5. MARKET FOR REGISTRANT’S COMMON EQUITY, RELATED STOCKHOLDER MATTERS AND ISSUER PURCHASES OF EQUITY SECURITIES
Listing and Holders of Record
Our common shares are listed on the Nasdaq Global Select Market under the symbol “VNOM.” There were eight holders of record of our common stock on February 16, 2024.
Cash Dividend Policy
Our current dividend policy is consistent with the Partnership’s pre-Conversion distribution policy. That is, we intend to pay a base dividend, as well as a variable dividend that takes into account capital returned to stockholders via our stock repurchase program. We currently intend to pay quarterly variable dividends of at least 75% of our available cash less the base dividend declared and the amount paid in stock repurchases as part of our buyback program for the applicable quarter. Our board of directors also approved excluding the $28.7 million one-time share repurchase from GRP that occurred in November 2023 from the calculation of cash available for distribution for the fourth quarter of 2023.
Our available cash and the available cash of the Operating Company for each quarter is determined by our board of directors following the end of such quarter. We expect that our available cash will generally equal the Adjusted EBITDA (as defined below) attributable to us for the applicable quarter, less cash needed for income taxes payable, debt service, contractual obligations, fixed charges and reserves for future operating or capital needs that our board of directors deems necessary or appropriate, lease bonus income (net of applicable taxes), distribution equivalent rights payments and preferred distributions.
The percentage of cash available for distribution by the Operating Company to us pursuant to the distribution policy may change quarterly to enable the Operating Company to retain cash flow to help strengthen our balance sheet while also expanding the return of capital program through our stock repurchase program.
We are required to pay a quarterly preferred dividend in respect of our Class B Common Stock in the aggregate amount of $20,000 per quarter, which is consistent with the Partnership’s pre-Conversion preferred distribution requirement. Other than that preferred dividend requirement, we are not required to pay dividends to our stockholders on a quarterly or other basis, and declaration of any other dividends in the future will be solely in the discretion of our board of directors.
Adjusted EBITDA is a supplemental non-GAAP financial measure that is used by management and external users of our financial statements, such as industry analysts, investors, lenders and rating agencies. We define Adjusted EBITDA as net income (loss) attributable to us plus net income (loss) attributable to non-controlling interest (“net income (loss)”) before interest expense, net, non-cash share-based compensation expense, depletion, non-cash (gain) loss on derivative instruments, (gain) loss on extinguishment of debt, if any, other non-cash operating expenses, other non-recurring expenses and provision for (benefit from) income taxes.
29
Repurchases of Equity Securities
Our common share repurchase activity for the three months ended December 31, 2023 was as follows:
| Period | Total Number of Shares Purchased | Average Price Paid Per Share(1)(3) | Total Number of Shares Purchased as Part of Publicly Announced Plan | Approximate Dollar Value of Shares that May Yet Be Purchased Under the Plan(2)(3) | ||||||||||||||||||||||
| (In thousands, except share amounts) | ||||||||||||||||||||||||||
| October 1, 2023 - October 31, 2023 | — | $ | — | — | $ | 462,861 | ||||||||||||||||||||
| November 1, 2023 - November 30, 2023 | 1,000,000 | $ | 28.70 | 1,000,000 | $ | 434,161 | ||||||||||||||||||||
| December 1, 2023 - December 31, 2023 | — | $ | — | — | $ | 434,161 | ||||||||||||||||||||
| Total | 1,000,000 | $ | 28.70 | 1,000,000 | ||||||||||||||||||||||
(1)The average price paid per common share includes any commissions paid to repurchase a common share.
(2)On July 26, 2022, the board of directors increased the authorization under our then-in-effect repurchase program from $250.0 million to $750.0 million. This repurchase program remains subject to market conditions, applicable legal requirements, contractual obligations and other factors and may be suspended from time to time, modified, extended or discontinued by the board of directors at any time.
(3)The Inflation Reduction Act of 2022, which was enacted into law on August 16, 2022, imposed a nondeductible 1% excise tax on the net value of certain stock repurchases made after December 31, 2022. All dollar amounts presented exclude such excise tax, as applicable.
Stock Performance Graph
The following performance graph includes a comparison of our cumulative total stockholder return over a five-year period with the cumulative total returns of the Standard & Poor’s 500 Stock Index, or the S&P 500 Index, and the SPDR S&P Oil & Gas Exploration and Production ETF, or XOP Index. The graph assumes an investment of $100 on December 31, 2018, and that all dividends were reinvested.
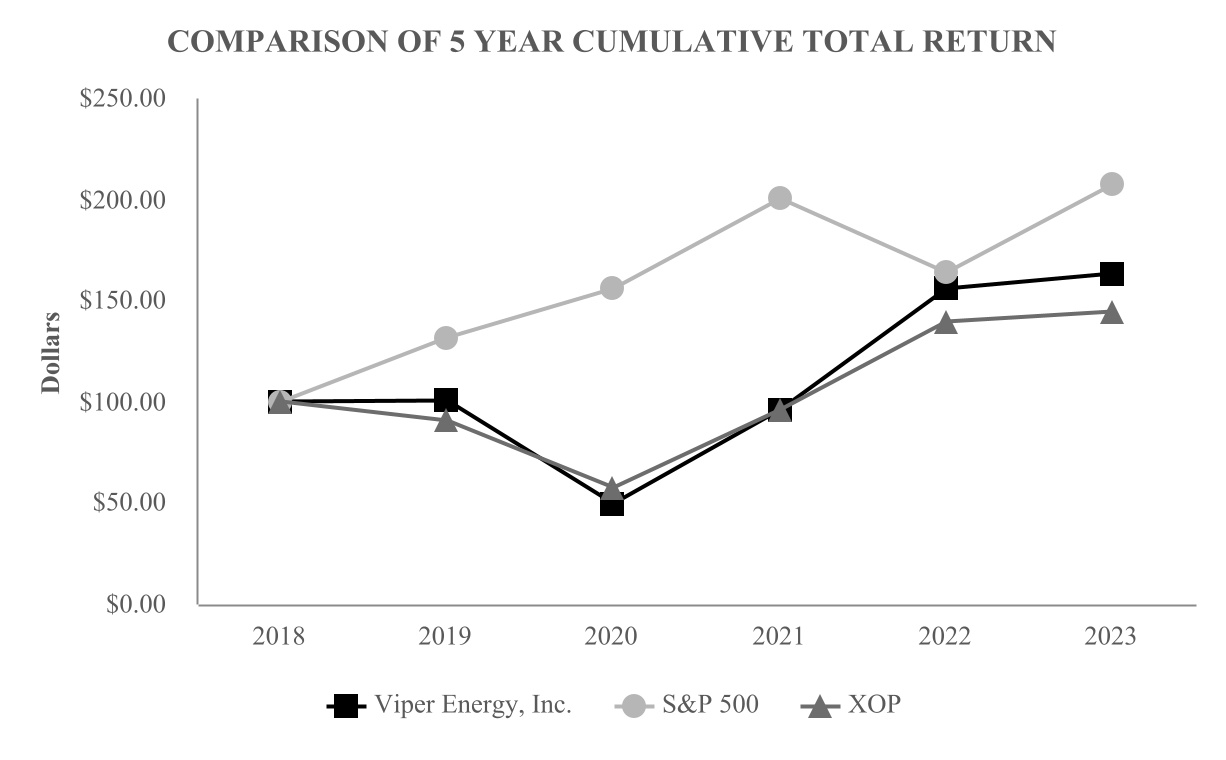
30
As of December 31, | |||||||||||||||||||||||||||||||||||
| Calculated Values | 2018 | 2019 | 2020 | 2021 | 2022 | 2023 | |||||||||||||||||||||||||||||
| Viper Energy, Inc. | $100.00 | $100.64 | $49.59 | $96.25 | $155.73 | $163.16 | |||||||||||||||||||||||||||||
| S&P 500 | $100.00 | $131.47 | $155.65 | $200.29 | $163.98 | $207.04 | |||||||||||||||||||||||||||||
| XOP | $100.00 | $90.56 | $57.67 | $96.18 | $139.78 | $144.74 | |||||||||||||||||||||||||||||
Recent Sales of Unregistered Securities
None.
ITEM 6. [RESERVED]
31
ITEM 7. MANAGEMENT’S DISCUSSION AND ANALYSIS OF FINANCIAL CONDITION AND RESULTS OF OPERATIONS
The following discussion and analysis should be read in conjunction with our consolidated financial statements and notes thereto presented in Item 8. Financial Statements and Supplementary Data of this report. The following discussion contains “forward-looking statements” that reflect our future plans, estimates, beliefs, and expected performance. Actual results and the timing of events may differ materially from those contained in these forward-looking statements due to a number of factors discussed further in Item 1A. Risk Factors and Cautionary Statement Regarding Forward-Looking Statements of this report.
Overview
We are a publicly traded Delaware corporation focused on owning and acquiring mineral and royalty interests in oil and natural gas properties primarily in the Permian Basin. We operate in one reportable segment.
The following discussion includes a comparison of our results of operations, including changes in our operating income, and liquidity and capital resources for fiscal year 2023 and fiscal year 2022. A discussion of changes in our results of operations from fiscal year 2022 compared to fiscal year 2021 has been omitted from this report, but may be found in Item 7. Management’s Discussion and Analysis of Financial Condition and Results of Operations of our Annual Report on Form 10-K for the fiscal year ended December 31, 2022, filed with the SEC on February 23, 2023, and is incorporated by reference in this report from such prior Annual Report on Form 10-K.
2023 Transactions and Recent Developments
Conversion into Corporation
On November 13, 2023, we converted from a Delaware limited partnership to a Delaware corporation. See Note 1—Organization and Basis of Presentation in Item 8. Financial Statements and Supplementary Data of this report for additional discussion of the Conversion.
Issuance of 2031 Notes
On October 19, 2023, we issued $400.0 million in aggregate principal amount of our 7.375% Senior Notes maturing on November 1, 2031. We received net proceeds of approximately $394.0 million after deducting the initial purchasers’ discount and transaction costs from the 2031 Notes. See Note 6—Debt in Item 8. Financial Statements and Supplementary Data of this report for further detail.
Acquisitions Update
GRP Acquisition
On November 1, 2023, we acquired certain mineral and royalty interests in the GRP Acquisition for approximately 9.02 million common units and $759.6 million in cash, including transaction costs and subject to customary post-closing adjustments. The mineral and royalty interests acquired in the GRP Acquisition represent approximately 4,600 net royalty acres in the Permian Basin, plus approximately 2,700 additional net royalty acres in other major basins. The cash consideration for this transaction was funded through a combination of cash on hand and held in escrow, borrowings under the Operating Company’s revolving credit facility, the proceeds from the 2031 Notes and $200.0 million of proceeds from the issuance of common units to Diamondback under a common unit purchase agreement.
Drop Down Transaction
On March 8, 2023, we acquired certain mineral and royalty interests from subsidiaries of Diamondback for approximately $74.5 million in cash, including customary closing adjustments. We funded the Drop Down through a combination of cash on hand and borrowings under the Operating Company’s revolving credit facility. The Drop Down was accounted for as a transaction between entities under common control.
32
Other Acquisitions
During the year ended December 31, 2023, we acquired, in individually insignificant transactions from unrelated third-party sellers, mineral and royalty interests representing 286 net royalty acres in the Permian Basin for an aggregate net purchase price of approximately $70.4 million, including customary closing adjustments. We funded these acquisitions with cash on hand and borrowings under the Operating Company’s revolving credit facility.
At December 31, 2023, our footprint of mineral and royalty interests totaled approximately 34,217 net royalty acres, approximately 49% of which are operated by Diamondback.
See Note 4—Acquisitions and Divestitures in Item 8. Financial Statements and Supplementary Data of this report for further information.
Commodity Prices and Certain Other Market Considerations
Prices for oil, natural gas and natural gas liquids are determined primarily by prevailing market conditions. Regional and worldwide economic activity, including any economic downturn or recession that has occurred or may occur in the future, extreme weather conditions and other substantially variable factors influence market conditions for these products. These factors are beyond our control and are difficult to predict. During 2023, 2022 and 2021, NYMEX WTI prices averaged $77.60, $94.33 and $68.11 per Bbl, respectively, and NYMEX Henry Hub prices averaged $2.66, $6.54 and 3.71 per MMBtu, respectively. The war in Ukraine, the Israel-Hamas War, rising interest rates, global supply chain disruptions, concerns about a potential economic downturn or recession, measures to combat persistent inflation and instability in the financial sector have contributed to recent economic and pricing volatility and may continue to impact pricing throughout 2024. Additionally, OPEC and its non-OPEC allies, known collectively as OPEC+, continues to meet regularly to evaluate the state of global oil supply, demand and inventory levels.
Due to improved commodity prices and industry conditions and based on the results of the quarterly ceiling tests, we were not required to record an impairment on our proved oil and natural gas interests during the year ended December 31, 2023. If commodity prices fall below current levels, we may be required to record impairments in future periods and such impairments could be material. Further, if commodity prices decrease, our production, proved reserves and cash flows may be adversely impacted. Our business may also be adversely impacted by any pipeline capacity and storage constraints.
Cash Distribution Update
In July 2023, the board of directors approved an increase to our annual base distribution to $1.08 per common unit beginning with the distribution payable for the second quarter of 2023. Additionally, our board of directors has approved excluding the $28.7 million one-time share repurchase from GRP that occurred in November 2023 from the calculation of cash available for distribution for the fourth quarter of 2023.
33
2024 Guidance
The following table presents our current estimates of certain financial and operating results for the full year, as well as production and cash tax guidance for the first quarter of 2024:
2024 Guidance | |||||
Q1 2024 net production - MBo/d | 25.00 - 25.50 | ||||
Q1 2024 net production - MBoe/d | 44.75 - 45.50 | ||||
Full year 2024 net production - MBo/d | 25.50 - 27.50 | ||||
Full year 2024 net production - MBoe/d | 45.50 - 49.00 | ||||
| Share costs ($/boe) | |||||
| Depletion | $11.00 - $11.50 | ||||
Cash general and administrative expenses | $0.80 - $1.00 | ||||
Non-cash share-based compensation | $0.10 - $0.15 | ||||
Interest expense | $4.00 - $4.50 | ||||
Production and ad valorem taxes (% of revenue) | ~7% | ||||
Cash tax rate (% of pre-tax income attributable to Viper Energy, Inc. | 20% - 22% | ||||
Q1 2024 cash taxes ($ - million)(1) | $10.0 - $15.0 | ||||
(1)Attributable to Viper Energy, Inc.
34
Production and Operational Update
As of December 31, 2023, there were 75 rigs operating on our mineral and royalty acreage, 12 of which are operated by Diamondback. For the year ended December 31, 2023, average oil production increased 13% compared to the previous year. While the first quarter of 2024 is expected to be the weakest of the year due primarily to the timing of large pads, we continue to see strong activity levels across our acreage position and expect significant growth to occur throughout 2024. This continued production growth, along with what we believe is a best-in-class cost structure, should enable us to continue to return a substantial amount of capital to our stockholders, primarily through our base-plus-variable dividend.
The following table summarizes our gross well information as of December 31, 2023 unless otherwise specified:
| Diamondback Operated | Third Party Operated | Total | |||||||||||||||
Horizontal wells turned to production (fourth quarter 2023)(1): | |||||||||||||||||
| Gross wells | 48 | 198 | 246 | ||||||||||||||
| Net 100% royalty interest wells | 2.1 | 0.9 | 3.0 | ||||||||||||||
| Average percent net royalty interest | 4.4 | % | 0.5 | % | 1.2 | % | |||||||||||
Horizontal wells turned to production (year ended December 31, 2023)(2): | |||||||||||||||||
| Gross wells | 232 | 750 | 982 | ||||||||||||||
| Net 100% royalty interest wells | 13.6 | 7.3 | 20.9 | ||||||||||||||
| Average percent net royalty interest | 5.9 | % | 1.0 | % | 2.1 | % | |||||||||||
| Horizontal producing well count: | |||||||||||||||||
| Gross wells | 1,844 | 9,433 | 11,277 | ||||||||||||||
| Net 100% royalty interest wells | 127.7 | 107.5 | 235.2 | ||||||||||||||
| Average percent net royalty interest | 6.9 | % | 1.1 | % | 2.1 | % | |||||||||||
Horizontal active development well count(3): | |||||||||||||||||
| Gross wells | 114 | 673 | 787 | ||||||||||||||
| Net 100% royalty interest wells | 5.2 | 8.2 | 13.4 | ||||||||||||||
| Average percent net royalty interest | 4.6 | % | 1.2 | % | 1.7 | % | |||||||||||
Line of sight wells(4): | |||||||||||||||||
| Gross wells | 171 | 591 | 762 | ||||||||||||||
| Net 100% royalty interest wells | 10.8 | 9.2 | 20.0 | ||||||||||||||
| Average percent net royalty interest | 6.3 | % | 1.6 | % | 2.6 | % | |||||||||||
(1) Average lateral length of 10,688 feet.
(2) Average lateral length of 10,869 feet.
(3) The total 787 gross wells currently in the process of active development are those wells that have been spud and are expected to be turned to production within approximately the next six to eight months.
(4) The total 762 line-of-sight wells are those that are not currently in the process of active development, but for which Viper has reason to believe that they will be turned to production within approximately the next 15 to 18 months. The expected timing of these line-of-sight wells is based primarily on permitting by third party operators or Diamondback’s current expected completion schedule. Existing permits or active development of our net royalty acreage does not ensure that those wells will be turned to production given the volatility in oil prices.
35
Results of Operations
The following table summarizes our income and expenses for the periods indicated:
| Year Ended December 31, | |||||||||||
| 2023 | 2022 | ||||||||||
| (In thousands) | |||||||||||
| Operating income: | |||||||||||
| Oil income | $ | 619,181 | $ | 667,281 | |||||||
| Natural gas income | 30,953 | 83,149 | |||||||||
| Natural gas liquids income | 66,976 | 87,546 | |||||||||
| Royalty income | 717,110 | 837,976 | |||||||||
| Lease bonus income—related party | 107,823 | 23,367 | |||||||||
| Lease bonus income | 1,855 | 4,424 | |||||||||
| Other operating income | 909 | 700 | |||||||||
| Total operating income | 827,697 | 866,467 | |||||||||
| Costs and expenses: | |||||||||||
| Production and ad valorem taxes | 50,401 | 56,372 | |||||||||
| Depletion | 146,118 | 121,071 | |||||||||
| General and administrative expenses | 10,603 | 8,542 | |||||||||
| Other operating expense | 356 | — | |||||||||
| Total costs and expenses | 207,478 | 185,985 | |||||||||
| Income (loss) from operations | 620,219 | 680,482 | |||||||||
| Other income (expense): | |||||||||||
| Interest expense, net | (48,907) | (40,409) | |||||||||
| Gain (loss) on derivative instruments, net | (25,793) | (18,138) | |||||||||
| Other income, net | 1,774 | 416 | |||||||||
| Total other expense, net | (72,926) | (58,131) | |||||||||
| Income (loss) before income taxes | 547,293 | 622,351 | |||||||||
| Provision for (benefit from) income taxes | 45,952 | (32,653) | |||||||||
| Net income (loss) | 501,341 | 655,004 | |||||||||
| Net income (loss) attributable to non-controlling interest | 301,253 | 503,331 | |||||||||
| Net income (loss) attributable to Viper Energy, Inc. | $ | 200,088 | $ | 151,673 | |||||||
36
The following table summarizes our production data, average sales prices and average costs for the periods indicated:
| Year Ended December 31, | |||||||||||
| 2023 | 2022 | ||||||||||
| Production data: | |||||||||||
| Oil (MBbls) | 8,028 | 7,097 | |||||||||
| Natural gas (MMcf) | 19,130 | 15,868 | |||||||||
| Natural gas liquids (MBbls) | 3,108 | 2,540 | |||||||||
Combined volumes (MBOE)(1) | 14,324 | 12,282 | |||||||||
| Average daily oil volumes (BO/d) | 21,995 | 19,444 | |||||||||
| Average daily combined volumes (BOE/d) | 39,244 | 33,649 | |||||||||
| Average sales prices: | |||||||||||
| Oil ($/Bbl) | $ | 77.13 | $ | 94.02 | |||||||
| Natural gas ($/Mcf) | $ | 1.62 | $ | 5.24 | |||||||
| Natural gas liquids ($/Bbl) | $ | 21.55 | $ | 34.47 | |||||||
Combined ($/BOE)(2) | $ | 50.06 | $ | 68.23 | |||||||
Oil, hedged ($/Bbl)(3) | $ | 76.05 | $ | 92.85 | |||||||
Natural gas, hedged ($/Mcf)(3) | $ | 1.37 | $ | 4.20 | |||||||
Natural gas liquids ($/Bbl)(3) | $ | 21.55 | $ | 34.47 | |||||||
Combined price, hedged ($/BOE)(3) | $ | 49.13 | $ | 66.21 | |||||||
| Average costs ($/BOE): | |||||||||||
| Production and ad valorem taxes | $ | 3.52 | $ | 4.59 | |||||||
General and administrative - cash component(4) | 0.65 | 0.59 | |||||||||
| Total operating expense - cash | $ | 4.17 | $ | 5.18 | |||||||
| General and administrative - non-cash stock compensation expense | $ | 0.09 | $ | 0.11 | |||||||
| Interest expense, net | $ | 3.41 | $ | 3.29 | |||||||
| Depletion | $ | 10.20 | $ | 9.86 | |||||||
(1)Bbl equivalents are calculated using a conversion rate of six Mcf per one Bbl.
(2)Realized price net of all deducts for gathering, transportation and processing.
(3)Hedged prices reflect the impact of cash settlements on our matured commodity derivative transactions on our average sales prices.
(4)Excludes non-cash stock compensation for the respective periods presented.
Comparison of the Years Ended December 31, 2023 and 2022
Royalty Income. Our royalty income is a function of oil, natural gas and natural gas liquids production volumes sold and average prices received for those volumes.
Royalty income decreased $120.9 million during the year ended December 31, 2023 compared to 2022. Changes in average pricing during 2023 contributed to approximately $245.1 million of the total decrease due primarily to lower average oil, natural gas and natural gas liquids prices received for our production in 2023. The decrease attributable to lower pricing was partially offset by $124.2 million in additional royalty income due to a 17% increase in production volumes during the year ended December 31, 2023 compared to the same period in 2022. Of this production growth, 4.1% is related to the GRP Acquisition with the remainder coming from new well development in areas where Viper has a higher royalty interest between periods.
37
Lease Bonus Income—Related Party. Lease bonus income from Diamondback increased $84.5 million during the year ended December 31, 2023 due primarily to one lease of $95.8 million in our Spanish Trail prospect in Midland County, Texas, nine other new leases in Martin, Midland, Pecos and Wheeler Counties; Texas, and two lease extensions in Martin County, Texas, compared to seven new leases in Martin and Midland Counties, Texas, in the same period in 2022.
Production and Ad Valorem Taxes. The following table presents production and ad valorem taxes for the years ended December 31, 2023 and 2022:
| Three Months Ended December 31, | |||||||||||||||||||||||||||||||||||
| 2023 | 2022 | ||||||||||||||||||||||||||||||||||
| Amount (In thousands) | Per BOE | Percentage of Royalty Income | Amount (In thousands) | Per BOE | Percentage of Royalty Income | ||||||||||||||||||||||||||||||
| Production taxes | $ | 35,976 | $ | 2.51 | 5.0 | % | $ | 42,857 | $ | 3.49 | 5.1 | % | |||||||||||||||||||||||
| Ad valorem taxes | 14,425 | 1.01 | 2.0 | 13,515 | 1.10 | 1.6 | |||||||||||||||||||||||||||||
| Total production and ad valorem taxes | $ | 50,401 | $ | 3.52 | 7.0 | % | $ | 56,372 | $ | 4.59 | 6.7 | % | |||||||||||||||||||||||
In general, production taxes are directly related to production revenues and are based upon current year commodity prices. Production taxes as a percentage of royalty income for the year ended December 31, 2023 remained consistent with 2022. Ad valorem taxes are based, among other factors, on property values driven by prior year commodity prices. The slight increase in ad valorem taxes as a percentage of royalty income is primarily due to higher valuations assigned to our oil and natural gas interests period over period driven by higher average commodity prices in 2022.
Depletion. The $25.0 million increase in depletion expense for the year ended December 31, 2023, compared to the same period in 2022, consisted of (i) a $20.1 million increase from the 17% growth in production volumes, and (ii) a higher depletion rate of $10.20 per BOE for the year ended December 31, 2023 compared to $9.86 per BOE for the year ended December 31, 2022, due primarily to higher-cost leasehold being developed and moved into the depletable base.
Net Interest Expense. The $8.5 million increase in interest expense for the year ended December 31, 2023, compared to the same period in 2022 consisted primarily of (i) $5.1 million in additional expense on the Operating Company’s revolving credit facility due to an increase in the weighted average interest rate and higher average borrowings outstanding during 2023 compared to 2022, (ii) $4.8 million in additional expense incurred for our 2031 Notes which were issued in October 2023, and (iii) a partial offset of $1.3 million due to a decrease in amortization of debt issuance costs as a result of extending the Operating Company’s revolving credit facility maturity date in both 2022 and 2023 and increasing the timeframe over which the costs are being amortized.
Derivative Instruments. The following table shows the net gain (loss) on derivative instruments and the net cash receipts (payments) on derivatives for the periods presented:
| Year Ended December 31, | |||||||||||
| 2023 | 2022 | ||||||||||
| (In thousands) | |||||||||||
| Gain (loss) on derivative instruments | $ | (25,793) | $ | (18,138) | |||||||
Net cash receipts (payments) on derivatives(1) | $ | (13,319) | $ | (31,319) | |||||||
(1)The year ended December 31, 2022, includes cash paid on commodity contracts terminated prior to their contractual maturity of $6.6 million.
We recorded losses on our derivative instruments for the years ended December 31, 2023 and 2022 primarily due to market prices being higher than the strike prices on our derivative contracts. See Note 10—Derivatives in Item 8. Financial Statements and Supplementary Data of this report for additional discussion of our open contracts at December 31, 2023.
38
Provision for (Benefit from) Income Taxes. We recorded income tax expense of $46.0 million and benefit of $32.7 million for the years ended December 31, 2023 and 2022, respectively. The change in our income tax provision was primarily due to the impact of reductions to the valuation allowance on our deferred tax assets during the fourth quarter of 2023 and the third quarter of 2022. The total income tax provision for the year ended December 31, 2023 differed from amounts computed by applying the federal statutory tax rate to pre-tax income for the period primarily due to net income attributable to the non-controlling interest and the impact of maintaining a partial valuation allowance on our deferred tax assets. See Note 9—Income Taxes in Item 8. Financial Statements and Supplementary Data of this report for further details.
Net Income (Loss) Attributable to Non-controlling Interest. The $202.1 million decrease in net income attributable to non-controlling interest for the year ended December 31, 2023 compared to the same period in 2022 is primarily due to the expiration of the special income allocation at December 31, 2022.
Liquidity and Capital Resources
Overview of Sources and Uses of Cash
As we pursue our business and financial strategy, we regularly consider which capital resources, including cash flow and equity and debt financings, are available to meet our future financial obligations and liquidity requirements. Our future ability to grow proved reserves will be highly dependent on the capital resources available to us. Our primary sources of liquidity have been cash flows from operations, proceeds from sales of non-core assets, equity and debt offerings and borrowings under the Operating Company’s revolving credit facility. Our primary uses of cash have been dividends to our stockholders, repayments of debt, capital expenditures for the acquisition of our mineral interests and royalty interests in oil and natural gas properties and repurchases of our common shares. At December 31, 2023, we had approximately $612.9 million of liquidity consisting of $25.9 million in cash and cash equivalents and $587.0 million available under the Operating Company’s revolving credit facility. See further discussion of changes in our sources of cash in “—Capital Resources” below.
Our working capital requirements are supported by our cash and cash equivalents and the Operating Company’s revolving credit facility. We may draw on the Operating Company’s revolving credit facility to meet short-term cash requirements, or issue debt or equity securities as part of our longer-term liquidity and capital management program. Because of the alternatives available to us as discussed above, we believe that our short-term and long-term liquidity are adequate to fund not only our current operations, but also our near-term and long-term funding requirements including our acquisitions of mineral and royalty interests, dividends, debt service obligations and repayment of debt maturities, common share and senior note repurchases and any amounts that may ultimately be paid in connection with contingencies.
In order to mitigate volatility in oil and natural gas prices, we have entered into commodity derivative contracts as discussed further in Item 7A. Quantitative and Qualitative Disclosures About Market Risk—Commodity Price Risk of this report.
Continued prolonged volatility in the capital, financial and/or credit markets due to the war in Ukraine, the Israel-Hamas War, depressed commodity markets and/or adverse macroeconomic conditions, including persistent inflation, rising interest rates, global supply chain disruptions and increasing concerns over a potential economic downturn or recession, may limit our access to, or increase our cost of, capital or make capital unavailable on terms acceptable to us or at all. Although we expect that our sources of funding will be adequate to fund our short-term and long-term liquidity requirements, we cannot assure you that the needed capital will be available on acceptable terms or at all.
Cash Flows
The following table presents our cash flows for the period indicated:
| Year Ended December 31, | |||||||||||
| 2023 | 2022 | ||||||||||
| (In thousands) | |||||||||||
Cash flow data: | |||||||||||
| Net cash provided by (used in) operating activities | $ | 638,192 | $ | 699,796 | |||||||
| Net cash provided by (used in) investing activities | (908,365) | 47,571 | |||||||||
| Net cash provided by (used in) financing activities | 277,863 | (768,636) | |||||||||
| Net increase (decrease) in cash and cash equivalents | $ | 7,690 | $ | (21,269) | |||||||
39
Operating Activities
Our operating cash flow is sensitive to many variables, the most significant of which are the volatility of prices for oil and natural gas and the volume of oil and natural gas sold by our producers. The decrease in net cash provided by operating activities during the year ended December 31, 2023 compared to the same period in 2022 was primarily driven by lower royalty income in 2023, an increase in cash paid for income taxes and an increase in cash paid for interest expense. These reductions in cash flow were partially offset by an increase in lease bonus income from related parties and a decrease in cash paid for derivative settlements. See “—Results of Operations” above for further discussion of significant changes in our income and expenses.
Investing Activities
Net cash used in investing activities during the year ended December 31, 2023 primarily related to acquisitions of oil and natural gas interests from third parties, which includes $759.6 million in cash paid for the GRP Acquisition, and $74.5 million in cash paid for the acquisition of other oil and natural gas interests in the Drop Down.
Net cash provided by investing activities during the year ended December 31, 2022 was primarily related to proceeds from divestitures of oil and natural gas interests including our Eagle Ford properties, partially offset by expenditures for acquisitions of oil and natural gas interests.
Financing Activities
Net cash provided by financing activities during the year ended December 31, 2023 primarily resulted from (i) net proceeds from the 2031 Notes of $394.0 million, (ii) proceeds from the equity offering to Diamondback of $200.0 million, and (iii) net borrowings of $111.0 million under the Operating Company’s revolving credit facility. These cash inflows were partially offset by dividends paid to stockholders of $324.8 million and $95.2 million of common share repurchases as we continue to return capital to our stockholders.
Net cash used in financing activities during the year ended December 31, 2022, was primarily related to dividends of $416.9 million to our stockholders and $150.6 million of repurchases of our common shares. Additionally, we reduced our debt profile by repaying a net $152.0 million of outstanding borrowings under the Operating Company’s revolving credit facility, and repurchasing $49.0 million of our Notes.
Capital Resources
The Operating Company’s Revolving Credit Facility
On September 22, 2023, the Operating Company entered into an eleventh and separately a twelfth amendment to the existing credit facility, which among other things, (i) extended the maturity date from June 2, 2025, to September 22, 2028, (ii) maintained the maximum credit amount of $2.0 billion, (iii) increased the borrowing base from $1.0 billion to $1.3 billion upon consummation of the GRP Acquisition, (iv) increased the aggregate elected commitment amount from $750.0 million to $850.0 million, and (v) waived the automatic reduction of the borrowing base that would otherwise occur upon the consummation of the 2031 Notes.
The Operating Company had $263.0 million in outstanding borrowings and $587.0 million of availability on its revolving credit facility at December 31, 2023.
Issuance of 2031 Notes
On October 19, 2023, we issued $400.0 million in aggregate principal amount of our 7.375% Senior Notes maturing on November 1, 2031.
As of December 31, 2023, the Operating Company was in compliance, and expects to be in compliance, with all financial maintenance covenants under its credit facility. See Note 6—Debt in Item 8. Financial Statements and Supplementary Data of this report for additional discussion of our outstanding debt at December 31, 2023.
40
Capital Requirements
Senior Notes
At December 31, 2023, we have total principal payments due on our outstanding Notes of $430.4 million in 2027 and $400.0 million thereafter. Additionally, we have a remaining aggregate interest expense obligation of $328.5 million on the Notes with $52.6 million due in 2024, an aggregate of $105.3 million due for years 2025 to 2026, an aggregate of $82.1 million due for years 2027 to 2028, and $88.5 million due thereafter. The Notes are not subject to any mandatory redemption or sinking fund requirements. See Note 6—Debt in Item 8. Financial Statements and Supplementary Data of this report for further information on the Notes.
Repurchases of Securities
Under our current common stock repurchase program, the board of directors has authorized us to acquire up to $750.0 million of our common stock, excluding excise tax. As of December 31, 2023, $434.2 million remains available for use to repurchase shares under this repurchase program, excluding excise tax. See Note 7—Stockholders' Equity in Item 8. Financial Statements and Supplementary Data of this report for further discussion of the stock repurchase program.
We may also from time to time opportunistically repurchase some of the outstanding Notes in open market purchases or in privately negotiated transactions.
Cash Dividends
We paid a total of $324.8 million and $416.9 million in distributions or dividends, as applicable, on our common shares and participating securities under the LTIP, and with respect to the Operating Company’s units during 2023 and 2022, respectively.
The dividend for the fourth quarter of 2023 is $0.56 per share of Class A Common Stock and $0.69 per Operating Company unit, and in each case is payable on March 12, 2024 to eligible holders of record at the close of business on March 5, 2024. The dividend on our Class A Common Stock consists of a base quarterly dividend of $0.27 per share and a variable quarterly dividend of $0.29 per share. See Note 7—Stockholders' Equity in Item 8. Financial Statements and Supplementary Data of this report for further discussion of our dividends. We expect to continue paying quarterly cash dividends in respect of our common shares. Future base and variable dividends are not required and are at the discretion of the board of directors, who may change the dividend policies at any time.
Critical Accounting Estimates
The discussion and analysis of our financial condition and results of operations are based upon our consolidated financial statements, which have been prepared in accordance with GAAP.
Certain amounts included in or affecting our consolidated financial statements and related disclosures must be estimated by our management, requiring certain assumptions to be made with respect to values or conditions that cannot be known with certainty at the time the consolidated financial statements are prepared. These estimates and assumptions affect the amounts we report for assets and liabilities and our disclosure of contingent assets and liabilities at the date of the consolidated financial statements. Accounting estimates are considered to be critical if (i) the nature of the estimates and assumptions is material due to the levels of subjectivity and judgment necessary to account for highly uncertain matters or the susceptibility of such matters to change, and (ii) the impact of the estimates and assumptions on financial condition or operating performance is material. We evaluate these estimates on an ongoing basis, using historical experience, consultation with experts and other methods we consider reasonable in the particular circumstances. Any effects on our business, financial position or results of operations resulting from revisions to these estimates are recorded in the period in which the facts that give rise to the revision become known.
We consider the following to be our most critical accounting estimates and have reviewed these critical accounting estimates with the Audit Committee of our Board of Directors.
41
Royalty Income and Revenue Recognition
We record revenue in the month production is delivered to the purchaser. However, settlement statements for certain oil, natural gas and natural gas liquids sales from third party operators other than Diamondback may not be received for 30 to 90 days after the date production is delivered. To the extent actual volumes and prices of oil and natural gas sales are unavailable for a given reporting period because of timing or information not received from third parties, the royalties related to expected sales volumes and prices for those properties are estimated and recorded based upon the Company’s interest. Where available, historical actual data is used to calculate volume estimates for wells operated by third parties. If historical actual data is not available for these wells, engineering estimates are used to calculate expected volumes. As such, estimated volumes utilized in period end royalty income accruals are subject to revision as additional actual data becomes available and such revisions may have a material impact on our results of operations and our royalty income receivables. Pricing estimates are based upon actual prices realized in an area by adjusting the market price for the average basis differential from market on a basin-by-basin basis. We record the differences between our estimates and the actual amounts received for royalties from third parties in the month that payment is received from the producer. We have existing internal controls for our royalty income estimation process and related accruals, but actual third party royalty income in future periods could differ materially from estimated amounts. At December 31, 2023, our accrual for third party royalty income was approximately $85.6 million. Actual revenues received during 2023 for prior years’ production from third parties were approximately $11.9 million, or 18%, higher than the amount accrued at December 31, 2022.
Oil and Natural Gas Accounting and Reserves
We account for oil and natural gas producing activities using the full cost method of accounting, which is dependent on the estimation of proved reserves to determine the rate at which we record depletion on our oil and natural gas properties and whether the value of our evaluated oil and natural gas properties is permanently impaired based on the quarterly full cost ceiling impairment test. Further, we utilize estimated proved reserves to assign fair value to acquired mineral and royalty interests. As such, we consider the estimation of proved reserves to be a critical accounting estimate.
Oil and natural gas reserve engineering is a subjective process of estimating underground accumulations of oil and natural gas that cannot be precisely measured and the accuracy of any reserve estimate is a function of the quality of available data and of engineering and geological interpretation and judgment. Proved oil and natural gas reserve estimates and their associated future net cash flows were prepared by our internal reservoir engineers and audited by Ryder Scott, independent petroleum engineers, as of December 31, 2023 and 2022 and prepared by Ryder Scott as of December 31, 2021. The process of estimating oil and natural gas reserves is complex, requiring significant decisions in the evaluation of available geological, geophysical, engineering and economic data. Significant inputs included in the calculation of future net cash flows include anticipated production of proved reserves and other relevant data. The data for a given property may also change substantially over time as a result of numerous factors, including additional development activity, evolving production history and a continual reassessment of the viability of production under changing economic conditions. As a result, material revisions to existing reserve estimates occur from time to time, and reserve estimates are often different from the quantities of oil and natural gas that are ultimately recovered. Although every reasonable effort is made to ensure that reserve estimates reported represent the most accurate assessments possible, the subjective decisions and variances in available data for various properties increase the likelihood of significant changes in these estimates. If such changes are material, they could significantly affect future depletion of capitalized costs and result in impairment of assets that may be material. Revisions of previous quantity estimates accounted for approximately 1% of the change in the total standardized measure of our reserves from December 31, 2022 to December 31, 2023, and were primarily related to positive performance revisions. No impairments were recorded on our proved oil and natural gas properties during the years ended December 31, 2023, 2022 and 2021. Based on the historical 12-month average trailing SEC prices for oil and natural gas throughout 2023 and into 2024, we are not currently projecting a full cost ceiling impairment in the first quarter of 2024. Any future impairment could be material to our consolidated financial statements.
Additionally, costs associated with unevaluated properties are excluded from the full cost pool until we have made a determination as to the existence of proved reserves. We assess all items classified as unevaluated property (on an individual basis or as a group if properties are individually insignificant) at least annually for possible impairment. This assessment is subjective and includes consideration of the following factors, among others: (i) monitoring information available from third party operators of our acreage for future drilling plans, (ii) the success of operators drilling on our acreage, (iii) the assignment of proved reserves, and (iv) current market prices for mineral acreage within our primary basins. At December 31, 2023, our unevaluated properties totaled $1.8 billion. We did not record any impairment on our unevaluated properties during the year ended December 31, 2023, but any such future impairment could be material to our consolidated financial statements.
42
Acquisitions of Mineral and Royalty Interests
Acquisitions of mineral royalty interests are accounted for as asset acquisitions, whereby the purchase price and associated transaction costs are capitalized and allocated to the acquired mineral and royalty interests. The allocation is determined based on whether the interests acquired relate to proved or unproved oil and natural gas properties, utilizing the estimated fair value of proved reserves as of the date of acquisition. The valuation of proved reserves is based on a projection of future cash flows using objective future pricing assumptions and a discount rate consistent with our estimated cost of capital at the time of the acquisition. The remaining capitalized acquisition costs are allocated to the unproved properties acquired.
Derivative Instruments
In order to reduce uncertainty around commodity prices received for our oil and natural gas operators’ production, we enter into commodity price derivative contracts from time to time. We exercise significant judgment in determining the types of instruments to be used, the level of production volumes to include in our commodity derivative contracts, the prices at which we enter into commodity derivative contracts and the counterparties’ creditworthiness.
We have not designated our derivative instruments as hedges for accounting purposes and, as a result, mark our derivative instruments to fair value and recognize the cash and non-cash change in fair value on derivative instruments for each period in the consolidated statements of operations. We are also required to recognize our derivative instruments on the consolidated balance sheets as assets or liabilities at fair value with such amounts classified as current or long-term based on their anticipated settlement dates. The accounting for the changes in fair value of a derivative depends on the intended use of the derivative and resulting designation and is generally determined using established index prices and other sources which are based upon, among other things, futures prices and time to maturity. These fair values are recorded by netting asset and liability positions, including any deferred premiums, that are with the same counterparty and are subject to contractual terms which provide for net settlement. Changes in the fair values of our commodity derivative instruments have a significant impact on our net income because we follow mark-to-market accounting and recognize all gains and losses on such instruments in earnings in the period in which they occur.
See Item 7A. Quantitative and Qualitative Disclosures About Market Risk—Commodity Price Risk of this report for additional sensitivity analysis of our open derivative positions at December 31, 2023.
Income Taxes
The amount of income taxes we record requires interpretations of complex rules and regulations of federal, state, and provincial tax jurisdictions. We use the asset and liability method of accounting for income taxes, under which deferred tax assets and liabilities are recognized for the future tax consequences of (i) temporary differences between the financial statement carrying amounts and the tax bases of existing assets and liabilities and (ii) operating loss and tax credit carryforwards. Deferred income tax assets and liabilities are based on enacted tax rates applicable to the future period when those temporary differences are expected to be recovered or settled. The effect of a change in tax rates on deferred tax assets and liabilities is recognized in income in the period the rate change is enacted. A valuation allowance is provided for deferred tax assets when it is more likely than not the deferred tax assets will not be realized after considering all positive and negative evidence available concerning the realizability of our deferred tax assets. Positive evidence may include forecasts of future taxable income, assessment of future business assumptions and any applicable tax planning strategies available to the Company. Negative evidence may include losses in recent years, if any, or the projection of losses in future periods. Estimating future taxable income requires numerous judgments and assumptions, including projections of future operating conditions which may be impacted by volatile future prices for our oil, natural gas and natural gas production, the expected timing and quantity of future production volumes, and the impact of our commodity derivative instruments on our income. These assumptions are discussed further in the critical accounting estimates titled “— Royalty Income and Revenue Recognition” and “— Oil and Natural Gas Accounting and Reserves.” Due to the impact these various assumptions and estimates can have on our estimates of taxable income, an estimate of the sensitivity to changes is not practicable.
In 2023, management’s assessment of all available evidence, both positive and negative, supporting realizability of the Company’s deferred tax assets as required by applicable accounting standards, resulted in recognition of a deferred income tax benefit of $7.0 million for an increase in the portion of the Company’s deferred tax assets considered more likely than not to be realized. The positive evidence assessed included recent cumulative income due in part to higher commodity prices and an expectation of future taxable income based upon recent actual and forecasted production volumes and prices. The Company retained a partial valuation allowance on its deferred tax assets due primarily to potential future volatility in commodity prices and an inherent lack of visibility to certain underlying operator activity for more than relatively short periods of time, which
43
could impact the likelihood of future realizability. As of December 31, 2023, the Company had a deferred tax asset of $170.2 million offset by an allowance of $113.5 million.
The accruals for deferred tax assets and liabilities are often based on assumptions that are subject to a significant amount of judgment by management. These assumptions and judgments are reviewed and adjusted as facts and circumstances change. Material changes to our income tax accruals may occur in the future based on the progress of ongoing audits, changes in legislation or resolution of pending matters.
Recent Accounting Pronouncements
See Note 2—Summary of Significant Accounting Policies in Item 8. Financial Statements and Supplementary Data of this report for discussion of recent accounting pronouncements and a full listing of our significant accounting policies.
Off-Balance Sheet Arrangements
We currently have no off-balance sheet arrangements.
ITEM 7A. QUANTITATIVE AND QUALITATIVE DISCLOSURES ABOUT MARKET RISK
We are exposed to market risk, including the effects of adverse changes in commodity prices and interest rates as described below. The primary objective of the following information is to provide quantitative and qualitative information about our potential exposure to market risks. The term “market risk” refers to the risk of loss arising from adverse changes in oil and natural gas prices and interest rates. The disclosures are not meant to be precise indicators of expected future losses, but rather indicators of reasonably possible losses.
Commodity Price Risk
Our major market risk exposure is in the pricing applicable to the oil and natural gas production of our operators. Realized prices are driven primarily by the prevailing worldwide price for crude oil and prices for natural gas in the United States. Both crude oil and natural gas realized prices are also impacted by the quality of the product, supply and demand balances in local physical markets and the availability of transportation to demand centers. Pricing for oil and natural gas production has been historically volatile and unpredictable and the prices that our operators receive for production depend on many factors outside of our or their control, such as the war in Ukraine, the Israel-Hamas War, rising interest rates, global supply chain disruptions, a potential economic downturn or recession and actions taken by OPEC members and other exporting nations. We cannot predict events that may lead to future price volatility and the near term energy outlook remains subject to heightened levels of uncertainty.
We historically have used fixed price swap contracts, fixed price basis swap contracts and costless collars with corresponding put and call options to reduce price volatility associated with certain of our royalty income as discussed in Note 10—Derivatives in Item 8. Financial Statements and Supplementary Data of this report.
At December 31, 2023, we had a net liability derivative position related to our commodity price derivative contracts of $2.7 million. Utilizing actual derivative contractual volumes under our contracts as of December 31, 2023, a 10% increase in forward curves associated with the underlying commodity would have decreased the net liability position by $0.9 million to $1.8 million, while a 10% decrease in forward curves associated with the underlying commodity would have increased the net liability derivative position by $0.9 million to $3.6 million. However, any cash derivative gain or loss would be substantially offset by a decrease or increase, respectively, in the actual sales value of production covered by the derivative instrument.
Credit Risk
We are subject to risk resulting from the concentration of royalty income in producing oil and natural gas properties and receivables with a limited number of several significant purchasers. For the year ended December 31, 2023, two purchasers accounted for more than 10% of our income. For the years ended December 31, 2022 and 2021, two and three purchasers each accounted for more than 10% of our income, respectively. See Note 2—Summary of Significant Accounting Policies in Item 8. Financial Statements and Supplementary Data of this report for further details. We do not require collateral and the failure or inability of our significant purchasers to meet their obligations to us due to their liquidity issues, bankruptcy, insolvency or liquidation may adversely affect our financial results. Volatility in the commodity pricing environment and macroeconomic conditions may enhance our purchaser credit risk.
44
Interest Rate Risk
We are subject to market risk exposure related to changes in interest rates on our indebtedness under the Operating Company’s revolving credit facility. The terms of the credit facility currently provide for interest on borrowings at a floating rate equal to (i) term SOFR plus 0.10% (“Adjusted Term SOFR”), or (ii) an alternate base rate (which is equal to the greatest of the prime rate, the Federal Funds effective rate plus 0.50%, and 1-month Adjusted Term SOFR plus 1.00%), in each case plus the applicable margin. The applicable margin ranges from 1.00% to 2.00% per annum in the case of the alternative base rate and from 2.00% to 3.00% per annum in the case of Adjusted Term SOFR, in each case depending on the amount of the loans outstanding in relation to the commitment, which is calculated using the least of the maximum credit amount, the aggregate elected commitment amount and the borrowing base. We are obligated to pay a quarterly commitment fee ranging from 0.375% to 0.500% per year on the unused portion of the commitment. As of December 31, 2023, we had $263.0 million in outstanding borrowings. During the year ended December 31, 2023, the weighted average interest rate was 7.41%.
ITEM 8. FINANCIAL STATEMENTS AND SUPPLEMENTARY DATA
| (a) | Documents included in this report: | |||||||
| 1. Financial Statements | ||||||||
| 2. Financial Statement Schedules | ||||||||
| Financial statement schedules have been omitted because they are either not required, not applicable or the information required to be presented is included in the Company’s consolidated financial statements and related notes. | ||||||||
45
REPORT OF INDEPENDENT REGISTERED PUBLIC ACCOUNTING FIRM
Board of Directors and Stockholders
Viper Energy, Inc.
Opinion on the financial statements
We have audited the accompanying consolidated balance sheets of Viper Energy, Inc. (a Delaware corporation) and subsidiaries (the “Company”) as of December 31, 2023 and 2022, the related consolidated statements of operations, stockholders’ equity, and cash flows for each of the three years in the period ended December 31, 2023, and the related notes (collectively referred to as the “financial statements”). In our opinion, the financial statements present fairly, in all material respects, the financial position of the Company as of December 31, 2023 and 2022, and the results of its operations and its cash flows for each of the three years in the period ended December 31, 2023, in conformity with accounting principles generally accepted in the United States of America.
We also have audited, in accordance with the standards of the Public Company Accounting Oversight Board (United States) (“PCAOB”), the Company’s internal control over financial reporting as of December 31, 2023, based on criteria established in the 2013 Internal Control—Integrated Framework issued by the Committee of Sponsoring Organizations of the Treadway Commission (“COSO”), and our report dated February 22, 2024 expressed an unqualified opinion.
Basis for opinion
These financial statements are the responsibility of the Company’s management. Our responsibility is to express an opinion on the Company’s financial statements based on our audits. We are a public accounting firm registered with the PCAOB and are required to be independent with respect to the Company in accordance with the U.S. federal securities laws and the applicable rules and regulations of the Securities and Exchange Commission and the PCAOB.
We conducted our audits in accordance with the standards of the PCAOB. Those standards require that we plan and perform the audit to obtain reasonable assurance about whether the financial statements are free of material misstatement, whether due to error or fraud. Our audits included performing procedures to assess the risks of material misstatement of the financial statements, whether due to error or fraud, and performing procedures that respond to those risks. Such procedures included examining, on a test basis, evidence regarding the amounts and disclosures in the financial statements. Our audits also included evaluating the accounting principles used and significant estimates made by management, as well as evaluating the overall presentation of the financial statements. We believe that our audits provide a reasonable basis for our opinion.
Critical audit matters
The critical audit matter communicated below is a matter arising from the current period audit of the financial statements that was communicated or required to be communicated to the audit committee and that: (1) relates to accounts or disclosures that are material to the financial statements and (2) involved our especially challenging, subjective, or complex judgments. The communication of critical audit matters does not alter in any way our opinion on the financial statements, taken as a whole, and we are not, by communicating the critical audit matter below, providing a separate opinion on the critical audit matter or on the accounts or disclosures to which it relates.
Estimation of proved reserves as it relates to the calculation and recognition of depletion expense and the valuation of acquired reserves in connection with the acquisition of GRP’s mineral and royalty interests
As described further in Note 2 to the financial statements, the Company accounts for its oil and gas properties using the full cost method of accounting, which requires management to make estimates of proved reserve volumes and future revenues to record depletion expense. Additionally, as described in Note 4 to the financial statements, the Company acquired significant mineral and royalty interests during the year through the GRP Acquisition. To estimate the volume of proved reserves and future revenues, management makes significant estimates and assumptions, including forecasting the timing and volumetric amounts of production and corresponding decline rate of producing properties associated with the operator’s development plan. We identified the estimation of proved reserves of oil and natural gas interests, including acquired proved reserves in the GRP acquisition, due to its impact on depletion expense and acquisition accounting, as a critical audit matter.
The principal considerations for our determination that the estimation of proved reserves is a critical audit matter are that changes in certain inputs and assumptions, which require a high degree of subjectivity, necessary to estimate the volume and future revenues of the Company’s proved reserves could have a significant impact on the measurement of depletion expense and the fair value of proved oil and natural gas interests. In turn, auditing those inputs and assumptions required subjective and complex auditor judgment.
46
Our audit procedures related to the estimation of proved reserves included the following, among others.
•We tested the design and operating effectiveness of key controls relating to management’s estimation of proved reserves for the purpose of estimating depletion expense and management’s estimation of the fair value of the acquired oil and natural gas interests in the GRP Acquisition.
•We evaluated the level of knowledge, skill, and ability of the Company’s reservoir engineering specialists and independent petroleum engineering specialists, made inquiries of those reservoir engineers regarding the process followed and judgments made to estimate the Company’s proved reserve volumes, and read the year-end report audited by the independent petroleum engineering specialists.
•Identified inputs and assumptions that were significant to the period end determination of proved reserve volumes and tested management’s process of determining the significant inputs and assumptions, as follows:
◦Compared the estimated pricing and pricing differentials used in the reserve report to actual realized prices related to revenue transactions recorded in the current year;
◦Vouched, on a sample basis, the net revenue interests used in the reserve report to underlying land and division order records;
◦Assessed forecasted production estimates by (i) comparing prior year forecasted production amounts to current year actual results and (ii) comparing forecasted production amounts in the current year reserve report to the actual historical production amounts in the current year, in total and for a sample of individual wells;
◦Obtained evidence supporting the development of proved undeveloped properties reflected in the reserve report and compared future development plans to historical conversion rates to evaluate the likelihood of development related to the proved undeveloped properties; and
◦Applied analytical procedures on inputs to the reserve report by comparing to historical actual results and to the prior year reserve report
•Identified inputs and assumptions that were significant to the estimated fair value of the acquired oil and natural gas interests in the GRP Acquisition and tested management’s process of determining the significant inputs and assumptions, as follows:
◦Evaluated the appropriateness of fair value pricing, including pricing differentials, used in the fair value reserve report of proved reserves by comparing the pricing forecast to published product pricing as of the acquisition closing date and pricing differentials to actual historical realized pricing;
◦Evaluated the appropriateness of the discount rate used in the fair value reserve report of proved reserves by comparing to an independent expectation;
◦Compared, on a sample basis, the net revenue interests used in the fair value reserve report of proved reserves to the purchase and sale agreement;
◦Tested the accuracy of forecasted production estimates in the fair value reserve report by comparing forecasted production amounts to the actual historical production amounts for a sample of individual wells;
◦Applied analytical procedures on the fair value reserve report’s forecasted production by comparing to the year-end reserve report’s forecasted production of the acquired proved properties; and
47
◦Compared the unproved acreage value allocated, on a per acre basis, to other recent acquisitions in the same or similar locations.
/s/ GRANT THORNTON LLP
We have served as the Company’s auditor since 2013.
February 22, 2024
48
| December 31, | |||||||||||
| 2023 | 2022 | ||||||||||
(In thousands, except share amounts) | |||||||||||
| Assets | |||||||||||
| Current assets: | |||||||||||
| Cash and cash equivalents | $ | $ | |||||||||
| Royalty income receivable (net of allowance for credit losses) | |||||||||||
| Royalty income receivable—related party | |||||||||||
| Income tax receivable | |||||||||||
| Derivative instruments | |||||||||||
| Prepaid expenses and other current assets | |||||||||||
| Total current assets | |||||||||||
| Property: | |||||||||||
Oil and natural gas interests, full cost method of accounting ($ | |||||||||||
| Land | |||||||||||
| Accumulated depletion and impairment | ( | ( | |||||||||
| Property, net | |||||||||||
| Derivative instruments | |||||||||||
| Deferred income taxes (net of allowances) | |||||||||||
| Other assets | |||||||||||
| Total assets | $ | $ | |||||||||
| Liabilities and Stockholders’ Equity | |||||||||||
| Current liabilities: | |||||||||||
| Accounts payable | $ | $ | |||||||||
| Accounts payable—related party | |||||||||||
| Accrued liabilities | |||||||||||
| Derivative instruments | |||||||||||
| Income taxes payable | |||||||||||
| Total current liabilities | |||||||||||
| Long-term debt, net | |||||||||||
| Derivative instruments | |||||||||||
| Total liabilities | |||||||||||
Commitments and contingencies (Note 12) | |||||||||||
| Stockholders’ equity: | |||||||||||
| General Partner | |||||||||||
Common units ( | |||||||||||
Class B units ( | |||||||||||
Class A Common Stock, | |||||||||||
Class B Common Stock, | |||||||||||
| Additional paid-in capital | |||||||||||
| Retained earnings (accumulated deficit) | ( | ||||||||||
| Total Viper Energy, Inc. stockholders’ equity | |||||||||||
| Non-controlling interest | |||||||||||
| Total equity | |||||||||||
| Total liabilities and stockholders’ equity | $ | $ | |||||||||
See accompanying notes to consolidated financial statements.
49
| Year Ended December 31, | |||||||||||||||||
| 2023 | 2022 | 2021 | |||||||||||||||
(In thousands, except per share amounts) | |||||||||||||||||
| Operating income: | |||||||||||||||||
| $ | $ | $ | |||||||||||||||
| Lease bonus income—related party | |||||||||||||||||
| Lease bonus income | |||||||||||||||||
| Other operating income | |||||||||||||||||
| Total operating income | |||||||||||||||||
| Costs and expenses: | |||||||||||||||||
| Production and ad valorem taxes | |||||||||||||||||
| Depletion | |||||||||||||||||
| General and administrative expenses | |||||||||||||||||
| Other operating expense | |||||||||||||||||
| Total costs and expenses | |||||||||||||||||
| Income (loss) from operations | |||||||||||||||||
| Other income (expense): | |||||||||||||||||
| Interest expense, net | ( | ( | ( | ||||||||||||||
| Gain (loss) on derivative instruments, net | ( | ( | ( | ||||||||||||||
| Other income, net | |||||||||||||||||
| Total other expense, net | ( | ( | ( | ||||||||||||||
| Income (loss) before income taxes | |||||||||||||||||
| Provision for (benefit from) income taxes | ( | ||||||||||||||||
| Net income (loss) | |||||||||||||||||
| Net income (loss) attributable to non-controlling interest | |||||||||||||||||
| Net income (loss) attributable to Viper Energy, Inc. | $ | $ | $ | ||||||||||||||
| Net income (loss) attributable to common shares: | |||||||||||||||||
| Basic | $ | $ | $ | ||||||||||||||
| Diluted | $ | $ | $ | ||||||||||||||
| Weighted average number of common shares outstanding: | |||||||||||||||||
| Basic | |||||||||||||||||
| Diluted | |||||||||||||||||
See accompanying notes to consolidated financial statements.
50
| Limited Partners | General Partner | Non-Controlling Interest | |||||||||||||||||||||||||||||||||||||||
| Common | Class B | Amount | Amount | ||||||||||||||||||||||||||||||||||||||
Units | Amount | Units | Amount | Total | |||||||||||||||||||||||||||||||||||||
| (In thousands) | |||||||||||||||||||||||||||||||||||||||||
| Balance at December 31, 2020 | $ | $ | $ | $ | $ | ||||||||||||||||||||||||||||||||||||
| Unit-based compensation | — | — | — | — | — | ||||||||||||||||||||||||||||||||||||
| Common units issued for acquisition | — | — | — | — | |||||||||||||||||||||||||||||||||||||
| Vesting of restricted stock units | — | — | — | — | — | — | |||||||||||||||||||||||||||||||||||
| Distribution equivalent rights payments | — | ( | — | — | — | — | ( | ||||||||||||||||||||||||||||||||||
| Distributions to public | — | ( | — | — | — | — | ( | ||||||||||||||||||||||||||||||||||
| Distributions to Diamondback | — | ( | — | ( | — | ( | ( | ||||||||||||||||||||||||||||||||||
| Distributions to General Partner | — | — | — | — | ( | — | ( | ||||||||||||||||||||||||||||||||||
| Change in ownership of consolidated subsidiaries, net | — | ( | — | — | — | ||||||||||||||||||||||||||||||||||||
| Cash paid for tax withholding on vested common units | — | ( | — | — | — | — | ( | ||||||||||||||||||||||||||||||||||
| Repurchased units as part of unit buyback | ( | ( | — | — | — | — | ( | ||||||||||||||||||||||||||||||||||
| Net income (loss) | — | — | — | — | |||||||||||||||||||||||||||||||||||||
| Balance at December 31, 2021 | |||||||||||||||||||||||||||||||||||||||||
| Unit-based compensation | — | — | — | — | — | ||||||||||||||||||||||||||||||||||||
| Vesting of restricted stock units | — | — | — | — | — | — | |||||||||||||||||||||||||||||||||||
| Distribution equivalent rights payments | — | ( | — | — | — | — | ( | ||||||||||||||||||||||||||||||||||
| Distributions to public | — | ( | — | — | — | — | ( | ||||||||||||||||||||||||||||||||||
| Distributions to Diamondback | — | ( | — | ( | — | ( | ( | ||||||||||||||||||||||||||||||||||
| Distributions to General Partner | — | — | — | — | ( | — | ( | ||||||||||||||||||||||||||||||||||
| Change in ownership of consolidated subsidiaries, net | — | — | — | — | ( | ||||||||||||||||||||||||||||||||||||
| Repurchased units as part of unit buyback | ( | ( | — | — | — | — | ( | ||||||||||||||||||||||||||||||||||
| Net income (loss) | — | — | — | — | |||||||||||||||||||||||||||||||||||||
| Balance at December 31, 2022 | $ | $ | $ | $ | $ | ||||||||||||||||||||||||||||||||||||
See accompanying notes to consolidated financial statements.
51
Viper Energy Partners LP
Consolidated Statement of Stockholders’ Equity - (Continued)
| General | Additional Paid-in Capital | Retained Earnings (Accumulated Deficit) | Non-Controlling Interest | ||||||||||||||||||||||||||||||||||||||||||||||||||||||||||||||
Limited Partners | Partner | Common Stock(1) | |||||||||||||||||||||||||||||||||||||||||||||||||||||||||||||||
| Common Units | Amount | Class B Units | Amount | Amount | Class A Shares | Class B Shares | |||||||||||||||||||||||||||||||||||||||||||||||||||||||||||
| Total | |||||||||||||||||||||||||||||||||||||||||||||||||||||||||||||||||
(In thousands) | |||||||||||||||||||||||||||||||||||||||||||||||||||||||||||||||||
| Balance at December 31, 2022 | $ | $ | $ | $ | $ | $ | $ | ||||||||||||||||||||||||||||||||||||||||||||||||||||||||||
| Conversion of Viper Energy Partnership Units to Viper Energy Inc. Common Shares | ( | ( | ( | ( | — | — | — | ||||||||||||||||||||||||||||||||||||||||||||||||||||||||||
| Liquidation of General Partner | — | — | — | — | ( | — | — | ( | — | — | ( | ||||||||||||||||||||||||||||||||||||||||||||||||||||||
| Common shares/units issued for acquisition | — | — | — | — | — | — | — | — | |||||||||||||||||||||||||||||||||||||||||||||||||||||||||
| Common shares/units issued to related party | — | — | — | — | — | — | — | — | |||||||||||||||||||||||||||||||||||||||||||||||||||||||||
| Equity-based compensation | — | — | — | — | — | — | — | — | |||||||||||||||||||||||||||||||||||||||||||||||||||||||||
| Vesting of restricted stock shares/units | — | — | — | — | — | — | — | — | — | — | |||||||||||||||||||||||||||||||||||||||||||||||||||||||
| Distribution equivalent rights payments | — | ( | — | — | — | — | — | — | ( | — | ( | ||||||||||||||||||||||||||||||||||||||||||||||||||||||
| Dividends/distributions to shareholders | — | ( | — | — | — | — | — | — | ( | — | ( | ||||||||||||||||||||||||||||||||||||||||||||||||||||||
| Dividends/distributions to Diamondback | — | ( | — | ( | — | — | — | ( | ( | ( | ( | ||||||||||||||||||||||||||||||||||||||||||||||||||||||
| Distributions to General Partner | — | — | — | — | ( | — | — | — | — | — | ( | ||||||||||||||||||||||||||||||||||||||||||||||||||||||
| Change in ownership of consolidated subsidiaries, net | — | — | — | — | — | — | ( | — | |||||||||||||||||||||||||||||||||||||||||||||||||||||||||
| Repurchases as part of share/unit buyback | ( | ( | — | — | — | ( | — | ( | — | — | ( | ||||||||||||||||||||||||||||||||||||||||||||||||||||||
| Net income (loss) | — | — | — | — | — | — | — | ||||||||||||||||||||||||||||||||||||||||||||||||||||||||||
| Balance at December 31, 2023 | $ | $ | $ | $ | $ | ( | $ | $ | |||||||||||||||||||||||||||||||||||||||||||||||||||||||||
(1)The par values of the outstanding shares of Class A Common Stock and Class B Common Stock each round to zero at December 31, 2023 .
See accompanying notes to consolidated financial statements.
52
| Year Ended December 31, | |||||||||||||||||
| 2023 | 2022 | 2021 | |||||||||||||||
| (In thousands) | |||||||||||||||||
| Cash flows from operating activities: | |||||||||||||||||
| Net income (loss) | $ | $ | $ | ||||||||||||||
| Adjustments to reconcile net income (loss) to net cash provided by operating activities: | |||||||||||||||||
| Provision for (benefit from) deferred income taxes | ( | ( | |||||||||||||||
| Depletion | |||||||||||||||||
| (Gain) loss on derivative instruments, net | |||||||||||||||||
| Net cash receipts (payments) on derivatives | ( | ( | ( | ||||||||||||||
| Other | |||||||||||||||||
| Changes in operating assets and liabilities: | |||||||||||||||||
| Royalty income receivable | ( | ( | ( | ||||||||||||||
| Royalty income receivable—related party | ( | ( | |||||||||||||||
| Accounts payable and accrued liabilities | |||||||||||||||||
| Accounts payable—related party | |||||||||||||||||
| Income taxes payable | |||||||||||||||||
| Other | ( | ( | ( | ||||||||||||||
| Net cash provided by (used in) operating activities | |||||||||||||||||
| Cash flows from investing activities: | |||||||||||||||||
| Acquisitions of oil and natural gas interests—related party | ( | ||||||||||||||||
| Acquisitions of oil and natural gas interests | ( | ( | ( | ||||||||||||||
| Proceeds from sale of oil and natural gas interests | ( | ||||||||||||||||
| Net cash provided by (used in) investing activities | ( | ( | |||||||||||||||
| Cash flows from financing activities: | |||||||||||||||||
| Proceeds from borrowings under credit facility | |||||||||||||||||
| Repayment on credit facility | ( | ( | ( | ||||||||||||||
| Proceeds from senior notes | |||||||||||||||||
| Repayment of senior notes | ( | ||||||||||||||||
| Proceeds from public offering to Diamondback | |||||||||||||||||
| Repurchased shares/units under buyback program | ( | ( | ( | ||||||||||||||
| Dividends/distributions to shareholders | ( | ( | ( | ||||||||||||||
| Dividends/distributions to Diamondback | ( | ( | ( | ||||||||||||||
| Other | ( | ( | ( | ||||||||||||||
| Net cash provided by (used in) financing activities | ( | ( | |||||||||||||||
| Net increase (decrease) in cash and cash equivalents | ( | ||||||||||||||||
| Cash, cash equivalents and restricted cash at beginning of period | |||||||||||||||||
| Cash, cash equivalents and restricted cash at end of period | $ | $ | $ | ||||||||||||||
| Supplemental disclosure of cash flow information: | |||||||||||||||||
| Interest paid | $ | ( | $ | ( | $ | ( | |||||||||||
| Cash (paid) received for income taxes | $ | ( | $ | ( | $ | ( | |||||||||||
| Supplemental disclosure of non—cash transactions: | |||||||||||||||||
| Common shares/units issued for acquisition | $ | ( | $ | $ | ( | ||||||||||||
See accompanying notes to consolidated financial statements.
53
1. ORGANIZATION AND BASIS OF PRESENTATION
Conversion into Corporation
Effective November 13, 2023 (the “Effective Time”), Viper Energy Partners LP (the “Partnership”) converted from a publicly traded Delaware limited partnership to a Delaware corporation pursuant to a plan of conversion (the “Conversion”) and changed names from Viper Energy Partners LP to Viper Energy, Inc. Additionally, the certificate of incorporation and the bylaws of Viper Energy, Inc. became effective. This annual report includes the results for the Partnership prior to the Conversion and Viper Energy, Inc. (the “Company”) following the Conversion. References to the “Company” refer to (i) Viper Energy, Inc. and its consolidated subsidiaries following the Conversion and (ii) the Partnership and its consolidated subsidiaries prior to the Conversion. References to shares or per share amounts prior to the Conversion refer to units or per unit amounts. Unless otherwise noted, all references to shares or per share amounts following the Conversion refer to shares or per share amounts of Common Stock, as defined in the paragraph below. References to dividends prior to the Conversion refer to distributions. There are no tax impacts resulting from the Conversion as Viper Energy Partners LP was treated as a corporation for tax purposes.
At the Effective Time, each common unit representing limited partnership interest in the Partnership issued and outstanding immediately prior to the Effective Time was converted, on a unit-for-unit basis, into one issued and outstanding, fully paid and nonassessable share of Class A Common Stock, $0.000001 par value per share (“Class A Common Stock”), of the Company, (ii) each Class B unit representing limited partnership interest in the Partnership issued and outstanding immediately prior to the Effective Time was converted, on a unit-for-unit basis, into one issued and outstanding, fully paid and nonassessable share of Class B Common Stock, $0.000001 par value per share, of the Company (“Class B Common Stock” and, together with Class A Common Stock, “Common Stock”), and (iii) the general partner interest issued and outstanding immediately prior to the Effective Time (100 % owned by the General Partner) was cancelled and was no longer outstanding. At the Effective Time, as a result of the Conversion, holders of common units became holders of Class A Common Stock and holders of Class B units became holders of Class B Common Stock. Similar to Class B units before the Conversion, each share of Class B Common Stock is exchangeable, at the discretion of the holders of Class B Common Stock, together with one unit of the Operating Company, into one share of Class A Common Stock post-Conversion. Holders of Class B Common Stock have the same preferred dividend and liquidation preference rights as those provided to holders of Class B units under the Partnership Agreement. At the Effective Time, Diamondback Energy, Inc. (“Diamondback”) and its wholly owned subsidiary Diamondback E&P LLC were the only holders of the Class B Common Stock and collectively owned approximately 56 % of the outstanding shares of Common Stock. As a result, the Company is a “controlled company” within the meaning of the corporate governance standards of Nasdaq and, as a result, will qualify for certain exemptions from the corporate governance rules of Nasdaq.
After the Conversion, former limited partners owned the same percentage of the Company’s outstanding shares as they previously owned of the Partnership’s outstanding equity interests.
At the Effective Time, the certificate of incorporation and bylaws of the Company generally provided stockholders of the Company with substantially the same or greater rights and substantially the same or lesser obligations, as those that limited partners had in the Partnership Agreement. Previously, limited partners were not generally entitled to vote with respect to governance of the Partnership, except for those few matters set forth in the Partnership Agreement. Following the Conversion, except as otherwise expressly provided in the Certificate of Incorporation, the holders of Common Stock are entitled to vote on all matters on which stockholders of a corporation are generally entitled to vote on under the Delaware General Corporation Law, including the election of the board of directors of the Company.
As of the Effective Time, the business and affairs of the Company are overseen by a board of directors, rather than the General Partner, which previously oversaw the business and affairs of the Partnership as its general partner. The directors and executive officers of the General Partner immediately prior to the Effective Time became the directors and executive officers of the Company at the Effective Time. In addition, the audit committee of the board of directors of the General Partner, and the membership thereof, immediately prior to the Effective Time, were replicated at the Company at the Effective time. Further, post-Conversion, Diamondback continues to provide personnel and general and administrative services to the Company, including the services of the executive officers and other employees, pursuant to the services and secondment agreement in substantially the same manner as Diamondback previously provided to the General Partner. In addition, for so long as Diamondback and any of its subsidiaries collectively beneficially own at least 25 % of the outstanding common stock of the Company, (i) Diamondback will have the right to designate up to three persons to serve as directors of the Company and (ii) the
54
board of directors of the Company may not appoint any person other than a Diamondback seconded employee as an executive officer of the Company unless such appointment is approved, in advance, by either (x) Diamondback (which approval may not be unreasonably withheld or conditioned) or (y) the affirmative vote of the holders of at least 80 % of the voting power of the capital stock of the Company. Currently, there are two Diamondback designees to the board of directors of the Company—Travis Stice and Kaes Van’t Hof.
At the open of business on November 13, 2023, Nasdaq ceased trading of the common units and commenced trading of the Class A Common Stock on Nasdaq under the existing ticker symbol “VNOM,” and the Company became the successor registrant to the Partnership. No action by the current holders of common units was required. A new CUSIP number has been issued for the Class A Common Stock, which became effective at the Effective Time. Because the Partnership was already treated as a corporation for U.S. federal income tax purposes pre-Conversion, the Conversion did not affect the Company’s status as a corporation for U.S. federal income tax purposes or materially impact the U.S. federal income tax treatment of its common equity holders.
Organization
The Company is a publicly traded Delaware corporation focused on owning and acquiring mineral interests and royalty interests in oil and natural gas properties primarily in the Permian Basin.
As of December 31, 2023, Diamondback beneficially owned approximately 56 % of the Company’s total Common Stock outstanding.
Basis of Presentation
The accompanying consolidated financial statements and related notes thereto were prepared in conformity with accounting principles generally accepted in the United States (“GAAP”). All material intercompany balances and transactions are eliminated in consolidation.
Reclassifications
Certain prior period amounts have been reclassified to conform to the current period financial statement presentation. These reclassifications had no effect on the previously reported total assets, total liabilities, stockholders’ equity, results of operations or cash flows.
2. SUMMARY OF SIGNIFICANT ACCOUNTING POLICIES
Use of Estimates
Certain amounts included in or affecting the Company’s financial statements and related disclosures must be estimated by management, requiring certain assumptions to be made with respect to values or conditions that cannot be known with certainty at the time the financial statements are prepared. These estimates and assumptions affect the amounts the Company reports for assets and liabilities and the Company’s disclosure of contingent assets and liabilities as of the date of the financial statements.
Making accurate estimates and assumptions is particularly difficult in the oil and natural gas industry given the challenges resulting from volatility in oil and natural gas prices. For instance, the war in Ukraine and the Israel-Hamas War, rising interest rates, global supply chain disruptions, concerns about a potential economic downturn or recession and measures to combat persistent inflation and instability in the financial sector have contributed to recent pricing and economic volatility. The financial results of companies in the oil and natural gas industry have been and may continue to be impacted materially as a result of changing market conditions. Such circumstances generally increase uncertainty in the Company’s accounting estimates, particularly those involving financial forecasts.
The Company evaluates these estimates on an ongoing basis, using historical experience, consultation with experts and other methods the Company considers reasonable in each particular circumstance. Nevertheless, actual results may differ significantly from the Company’s estimates. Any effects on the Company’s business, financial position or results of operations resulting from revisions to these estimates are recorded in the period in which the facts that give rise to the revision become known. Significant items subject to such estimates and assumptions include, estimates of proved oil and natural gas reserves
55
and related present value estimates of future net cash flows therefrom, the carrying value of oil and natural gas interests, estimates of third party operated royalty income related to expected sales volumes and prices, the recoverability of costs of unevaluated properties, the fair value determination of assets and liabilities, including those acquired by the Company, fair value estimates of commodity derivatives and estimates of income taxes, including deferred tax valuation allowances.
Cash and Cash Equivalents
Cash and cash equivalents represent unrestricted cash on hand and include all highly liquid investments purchased with a maturity of three months or less and money market funds. The Company maintains cash and cash equivalents in bank deposit accounts which, at times, may exceed the federally insured limits. The Company has not experienced any significant losses from such investments.
Royalty Income Receivable
Royalty income receivables consist of receivables for oil and natural gas sales made by the Company’s third-party operators and Diamondback. The operators remit payment for production directly to the Company. Most payments for production are received within three months after the production date. Payments on new wells added organically or through acquisition may be further delayed due to title opinion work which is required to be completed by the operator before payments are released.
Derivative Instruments
The Company is required to recognize its derivative instruments on the consolidated balance sheets as assets or liabilities at fair value with such amounts classified as current or long-term based on their anticipated settlement dates. The accounting for the changes in fair value of a derivative depends on the intended use of the derivative and resulting designation. The Company has not designated its derivative instruments as hedges for accounting purposes and, as a result, marks its derivative instruments to fair value and recognizes the cash and non-cash change in fair value on derivative instruments for each period in the consolidated statements of operations under the caption “Gain (loss) on derivative instruments, net.”
Revenue from Contracts with Customers
Royalty income represents the right to receive revenues from oil, natural gas and natural gas liquids sales obtained by the operator of the wells in which the Company owns a royalty interest. Royalty income is recognized at the point control of the product is transferred to the purchaser. Virtually all of the pricing provisions in the Company’s contracts are tied to a market index.
Royalty income from oil, natural gas and natural gas liquids sales
The Company’s oil, natural gas and natural gas liquids sales contracts are generally structured whereby the producer of the properties in which the Company owns a royalty interest sells the Company’s proportionate share of oil, natural gas and natural gas liquids production to the purchaser and the Company collects its percentage royalty based on the revenue generated. In this scenario, the Company recognizes revenue when control transfers to the purchaser at the wellhead or at the gas processing facility based on the Company’s percentage ownership share of the revenue, net of any deductions for gathering and transportation.
56
Transaction price allocated to remaining performance obligations
The Company’s right to royalty income does not originate until production occurs and, therefore, is not considered to exist beyond each day’s production. Therefore, there are no remaining performance obligations under any of the Company’s royalty income contracts.
Contract balances
Under the Company’s royalty income contracts, it has the right to receive royalty income from the producer once production has occurred, at which point payment is unconditional. Accordingly, the Company’s royalty income contracts do not give rise to contract assets or liabilities under Accounting Standards Codification 606.
Prior-period performance obligations
The Company records revenue in the month production is delivered to the purchaser. However, settlement statements for certain oil, natural gas and natural gas liquids sales may not be received for 30 to 90 days after the date production is delivered, and as a result, the Company is required to estimate the amount of royalty income to be received based upon the Company’s interest. The Company records the differences between its estimates and the actual amounts received for royalties in the month that payment is received from the producer. Any identified differences between its revenue estimates and actual revenue received historically have not been significant. The Company believes that the pricing provisions of its oil, natural gas and natural gas liquids contracts are customary in the industry. To the extent actual volumes and prices of oil and natural gas sales are unavailable for a given reporting period because of timing or information not received from third parties, the royalties related to expected sales volumes and prices for those properties are estimated and recorded.
Oil and Natural Gas Properties
The Company uses the full cost method of accounting for its oil and natural gas properties. Under this method, all acquisition costs are capitalized and amortized on a composite unit of production method based on proved oil, natural gas liquids and natural gas reserves. Sales of oil and natural gas properties, whether or not being amortized currently, are accounted for as adjustments of capitalized costs, with no gain or loss recognized, unless such adjustments would significantly alter the relationship between capitalized costs and proved reserves of oil, natural gas liquids and natural gas. At December 31, 2023 and 2022, the Company’s oil and natural gas properties consist solely of mineral interests in oil and natural gas properties.
Depletion of evaluated oil and natural gas properties is computed on the units of production method, whereby capitalized costs are amortized over total proved reserves. The average depletion rate per barrel equivalent unit of production was $10.20 , $9.86 and $10.04 for the years ended December 31, 2023, 2022 and 2021, respectively. Depletion for oil and natural gas properties was $146.1 million, $121.1 million and $103.0 million for the years ended December 31, 2023, 2022 and 2021, respectively.
Under the full cost method of accounting, the Company is required to perform a ceiling test each quarter. The test determines a limit, or ceiling, on the book value of the proved oil and natural gas properties. Net capitalized costs are limited to the lower of unamortized oil and natural gas interests net of deferred income taxes, or the cost center ceiling. The cost center ceiling is defined as the sum of (i) estimated future net revenues, discounted at 10 % per annum, from proved reserves, based on the trailing 12-month unweighted average of the first-day-of-the-month price, adjusted for any contract provisions and excluding the estimated abandonment costs for properties with asset retirement obligations recorded on the balance sheet, (ii) the cost of properties not being amortized, if any, and (iii) the lower of cost or market value of unproved properties included in the cost being amortized, including related deferred taxes for differences between the book and tax basis of the oil and natural gas properties. If the net book value, including related deferred taxes, exceeds the ceiling, an impairment or non-cash write-down is required. See Note 5—Oil and Natural Gas Interests for additional discussion of the Company’s oil and natural gas properties.
Costs associated with unevaluated properties are excluded from the full cost pool until the Company has made a determination as to the existence of proved reserves. The Company assesses all items classified as unevaluated property at least annually for possible impairment. The Company assesses properties on an individual basis or as a group if properties are individually insignificant. The assessment includes consideration of the following factors, among others: intent of the operator to drill; remaining lease term with the current operator; geological and geophysical evaluations; drilling results and activity; the assignment of proved reserves; and the economic viability of development if proved reserves are assigned. During any period in
57
which these factors indicate an impairment, the cumulative drilling costs incurred to date for such property and all or a portion of the associated leasehold costs are transferred to the full cost pool and are then subject to amortization.
Debt Issuance Costs
Other assets include capitalized costs related to the credit facility of $15.5 million and $9.7 million, and accumulated amortization of those costs over the term of the credit facility of $10.0 million and $9.5 million as of December 31, 2023, and 2022, respectively.
Related Party Transactions
Royalty Income Receivable
As of December 31, 2023 and December 31, 2022, Diamondback, either directly or through its consolidated subsidiaries, owed the Company $3.3 million and $6.3 million, respectively, for royalty income received from third parties for the Company’s production, which had not yet been remitted to the Company.
Lease Bonus Income
During the year ended December 31, 2023, Diamondback, either directly or through its consolidated subsidiaries, paid the Company $107.8 million of lease bonus income primarily related to new leases in the Permian Basin. Lease bonus income for the year ended December 31, 2023 includes a lease bonus payment of $95.8 million to the Operating Company from a lease agreement with a subsidiary of Diamondback covering certain Permian Basin acreage on terms substantially identical to the Operating Company’s other lease arrangements with Diamondback. This transaction was considered and approved by the conflicts committee of the board of directors. During the year ended December 31, 2022, Diamondback, either directly or through its consolidated subsidiaries, paid the Company $23.4 million of lease bonus income primarily related to lease ratification and certain leases acquired in the Swallowtail Acquisition.
Other Related Party Transactions
See Note 4—Acquisitions and Divestitures for significant related party acquisitions of oil and natural gas interests.
See Note 7—Stockholders' Equity for further details regarding equity transactions with related parties.
All other related party transactions with Diamondback or its affiliates have been stated on the face of the consolidated financial statements or were insignificant for the years ended December 31, 2023, 2022 and 2021, respectively.
Accrued Liabilities
The Company’s accrued liabilities are financial instruments for which the carrying value approximates fair value.
Accrued liabilities consist of the following at December 31, 2023, and 2022:
| December 31, | |||||||||||
| 2023 | 2022 | ||||||||||
| (In thousands) | |||||||||||
| Interest payable | $ | $ | |||||||||
| Ad valorem taxes payable | |||||||||||
| Derivatives instruments payable | |||||||||||
| Other | |||||||||||
| Total accrued liabilities | $ | $ | |||||||||
58
Concentrations
The Company is subject to risk resulting from the concentration of the Company’s royalty income in producing oil and natural gas properties and receivables with several significant purchasers. For the year ended December 31, 2023, two purchasers each accounted for more than 10% of royalty income: Vitol Midstream Pipeline LLC (16 %) and DK Trading and Supply LLC (15 %). For the year ended December 31, 2022, two purchasers each accounted for more than 10% of royalty income: Shell Trading (US) Company (14 %) and Vitol Midstream Pipeline LLC (14 %). For the year ended December 31, 2021, three purchasers each accounted for more than 10% of royalty income: Trafigura Trading LLC (17 %), Shell Trading (US) Company (16 %) and Vitol Midstream Pipeline LLC (12 %). The Company does not require collateral and does not believe the loss of any single purchaser would materially impact the Company’s operating results, as crude oil and natural gas are fungible products with well-established markets and numerous purchasers.
Income Taxes
The Company uses the asset and liability method of accounting for income taxes, under which deferred tax assets and liabilities are recognized for the future tax consequences of (i) temporary differences between the financial statement carrying amounts and the tax bases of existing assets and liabilities and (ii) operating loss and tax credit carryforwards. Deferred income tax assets and liabilities are based on enacted tax rates applicable to the future period when those temporary differences are expected to be recovered or settled. The effect of a change in tax rates on deferred tax assets and liabilities is recognized in income in the period the rate change is enacted. A valuation allowance is provided for deferred tax assets when it is more likely than not the deferred tax assets will not be realized.
The Company recognizes interest and penalties related to income tax matters as interest expense and general and administrative expenses, respectively. During the years ended December 31, 2023, 2022 and 2021, there were no
Non-controlling Interest
Non-controlling interest in the accompanying consolidated financial statements represents Diamondback’s ownership in the net assets of the Operating Company. When Diamondback’s relative ownership interest in the Operating Company changes, adjustments to non-controlling interest and stockholders’ equity, tax effected, will occur. Because these changes in the Company’s ownership interest in the Operating Company did not result in a change of control, the transactions were accounted for as equity transactions under ASC Topic 810, “Consolidation.” This guidance requires that any differences between the carrying value of the Company’s basis in the Operating Company and the fair value of the consideration received are recognized directly in equity and attributed to the controlling interest. See Note 7—Stockholders' Equity for further discussion of changes in ownership interest.
Recent Accounting Pronouncements
Recently Adopted Pronouncements
There are no recently adopted pronouncements.
Accounting Pronouncements Not Yet Adopted
In November 2023, the FASB issued ASU 2023-07, “Segment Reporting (Topic 280) – Improvements to Reportable Segment Disclosures,” which updates reportable segment disclosure requirements primarily through enhanced disclosures about significant segment expenses and information used to assess segment performance. The amendments are effective for fiscal years beginning after December 15, 2023, and for interim periods within fiscal years beginning after December 15, 2024. Early adoption is permitted. The amendments should be applied retrospectively to all prior periods presented in the financial statements. Management is currently evaluating this ASU to determine its impact on the Company's disclosures. Adoption of the update will not impact the Company’s financial position, results of operations or liquidity.
In December 2023, the FASB issued ASU 2023-09, “Income Taxes (Topic 740) – Improvements to Income Tax Disclosures,” which requires that certain information in a reporting entity’s tax rate reconciliation be disaggregated, and provides additional requirements regarding income taxes paid. The amendments are effective for annual periods beginning after December 15, 2024, with early adoption permitted, and should be applied either prospectively or retrospectively. Management
59
is currently evaluating this ASU to determine its impact on the Company’s disclosures. Adoption of the update will not impact the Company’s financial position, results of operations or liquidity.
The Company considers the applicability and impact of all ASUs. ASUs not listed above were assessed and determined to be either not applicable, previously disclosed, or not material upon adoption.
3. REVENUE FROM CONTRACTS WITH CUSTOMERS
Royalty income represents the right to receive revenues from oil, natural gas and natural gas liquids sales obtained by the operator of the wells in which the Company owns a royalty interest. Royalty income is recognized at the point control of the product is transferred to the purchaser at the wellhead or at the gas processing facility based on the Company’s percentage ownership share of the revenue, net of any deductions for gathering and transportation. Virtually all of the pricing provisions in the Company’s contracts are tied to a market index.
For the years ended December 31, 2023, 2022 and 2021, any revenues recognized in the current reporting period for performance obligations satisfied in prior reporting periods were not material.
The following table disaggregates the Company’s total royalty income by product type:
| Year Ended December 31, | |||||||||||||||||
| 2023 | 2022 | 2021 | |||||||||||||||
| (In thousands) | |||||||||||||||||
| Oil income | $ | $ | $ | ||||||||||||||
| Natural gas income | |||||||||||||||||
| Natural gas liquids income | |||||||||||||||||
| Total royalty income | $ | $ | $ | ||||||||||||||
4. ACQUISITIONS AND DIVESTITURES
2023 Activity
Acquisitions
GRP Acquisition
On November 1, 2023, the Company and the Operating Company acquired certain mineral and royalty interests from Royalty Asset Holdings, LP, Royalty Asset Holdings II, LP and Saxum Asset Holdings, LP, affiliates of Warwick Capital Partners and GRP Energy Capital (collectively, “GRP”) pursuant to a definitive purchase and sale agreement for approximately 9.02 million common units and $759.6 million in cash, including transaction costs and subject to customary post-closing adjustments (the “GRP Acquisition”). The mineral and royalty interests acquired in the GRP Acquisition represent approximately 4,600 net royalty acres in the Permian Basin, plus approximately 2,700 additional net royalty acres in other major basins. The cash consideration for the GRP Acquisition was funded through a combination of cash on hand and held in escrow, borrowings under the Operating Company’s revolving credit facility, proceeds from the 2031 Notes (as defined in Note 6—Debt) and proceeds from the $200.0 million common unit issuance to Diamondback discussed further in Note 7—Stockholders' Equity.
Drop Down Transaction
On March 8, 2023, the Company acquired certain mineral and royalty interests from subsidiaries of Diamondback for approximately $74.5 million in cash, including customary closing adjustments for net title benefits (the “Drop Down”). The mineral and royalty interests acquired in the Drop Down represent approximately 660 net royalty acres in Ward County in the Southern Delaware Basin, 100 % of which are operated by Diamondback, and have an average net royalty interest of approximately 7.2 % and current production of approximately 300 BO/d. The Company funded the Drop Down through a combination of cash on hand and borrowings under the Operating Company’s revolving credit facility. The Drop Down was accounted for as a transaction between entities under common control with the properties acquired recorded at Diamondback’s
60
historical carrying value in the Company’s consolidated balance sheet. The historical carrying value of the properties approximated the Drop Down purchase price.
Other Acquisitions
Additionally during the year ended December 31, 2023 the Company acquired, in individually insignificant transactions from unrelated third-party sellers, mineral and royalty interests representing 286 net royalty acres in the Permian Basin for an aggregate purchase price of approximately $70.4 million, including customary closing adjustments. The Company funded these acquisitions with cash on hand and borrowings under the Operating Company’s revolving credit facility.
2022 Activity
Acquisitions
During the year ended December 31, 2022, in individually insignificant transactions, the Company acquired from unrelated third-party sellers mineral and royalty interests representing 375 net royalty acres in the Permian Basin for an aggregate net purchase price of approximately $65.8 million, including customary closing adjustments. The Company funded these acquisitions with cash on hand and borrowings under the Operating Company’s revolving credit facility.
Divestitures
In the fourth quarter of 2022, the Company divested its entire position in the Eagle Ford Shale consisting of 681 net royalty acres of third party operated acreage for an aggregate net sales price of $53.7 million, including customary closing adjustments.
In the third quarter of 2022, the Company divested 93 net royalty acres of third party operated acreage located entirely in Loving county in the Delaware Basin for an aggregate net sales price of $29.9 million, including customary closing adjustments.
In the first quarter of 2022, the Company divested 325 net royalty acres of third party operated acreage located entirely in Upton and Reagan counties in the Midland Basin for an aggregate net sales price of $29.3 million, including customary closing adjustments.
2021 Acquisitions
Swallowtail Acquisition
On October 1, 2021, the Company and the Operating Company acquired certain mineral and royalty interests from Swallowtail Royalties LLC and Swallowtail Royalties II LLC (the “Swallowtail entities”) pursuant to a definitive purchase and sale agreement for approximately 15.25 million common shares and approximately $225.3 million in cash (the “Swallowtail Acquisition”). The mineral and royalty interests acquired in the Swallowtail Acquisition represent 2,313 net royalty acres primarily in the Northern Midland Basin, of which 62 % are operated by Diamondback. The Swallowtail Acquisition had an effective date of August 1, 2021. The cash portion of this transaction was funded through a combination of cash on hand and approximately $190.0 million of borrowings under the Operating Company’s revolving credit facility.
Other 2021 Acquisitions
Additionally during the year ended December 31, 2021, the Company acquired, from unrelated third party sellers, mineral and royalty interests representing 392 net royalty acres in the Permian Basin for an aggregate purchase price of approximately $55.1 million, after post-closing adjustments. The Company funded these acquisitions with cash on hand and borrowings under the Operating Company’s revolving credit facility.
61
5. OIL AND NATURAL GAS INTERESTS
Oil and natural gas interests include the following:
| December 31, | |||||||||||
| 2023 | 2022 | ||||||||||
| (In thousands) | |||||||||||
| Oil and natural gas interests: | |||||||||||
| Subject to depletion | $ | $ | |||||||||
| Not subject to depletion | |||||||||||
| Gross oil and natural gas interests | |||||||||||
| Accumulated depletion and impairment | ( | ( | |||||||||
| Oil and natural gas interests, net | |||||||||||
| Land | |||||||||||
| Property, net of accumulated depletion and impairment | $ | $ | |||||||||
| Balance of costs not subject to depletion: | |||||||||||
| Incurred in 2023 | $ | ||||||||||
| Incurred in 2022 | |||||||||||
| Incurred in 2021 | |||||||||||
| Prior | |||||||||||
| Total not subject to depletion | $ | ||||||||||
As of December 31, 2023 and 2022, the Company had mineral and royalty interests representing 34,217 and 26,315 net royalty acres, respectively.
Costs associated with unevaluated properties are excluded from the full cost pool until a determination as to the existence of proved reserves can be made. The inclusion of the Company’s unevaluated costs into the amortization base is expected to be completed within to ten years .
Based on the results of the quarterly ceiling tests, the Company was not
6. DEBT
Long-term debt consisted of the following as of the dates indicated:
| December 31, | |||||||||||
| 2023 | 2022 | ||||||||||
| (In thousands) | |||||||||||
| $ | $ | ||||||||||
| Revolving credit facility | |||||||||||
| Unamortized debt issuance costs | ( | ( | |||||||||
| Unamortized discount | ( | ( | |||||||||
| Total long-term debt | $ | $ | |||||||||
62
Issuance of 2031 Notes
On October 19, 2023, the Company completed an offering of $400.0 million in aggregate principal amount of its 7.375 % Senior Notes maturing on November 1, 2031 (the “2031 Notes”). The Company received net proceeds of approximately $394.0 million, after deducting the initial purchasers’ discount and transaction costs from the 2031 Notes. The Company loaned the gross proceeds to the Operating Company, which used the proceeds to partially fund the cash portion of the GRP Acquisition.
The Notes
The Notes are senior unsecured obligations of the Company, initially guaranteed on a senior unsecured basis by the Operating Company, and will pay interest semi-annually. Diamondback will not guarantee the Notes. In the future, each of the Company’s restricted subsidiaries that either (i) guarantees any of its or a guarantor’s indebtedness, or (ii) is a domestic restricted subsidiary and is an obligor with respect to any indebtedness under any credit facility will be required to guarantee the Notes.
The Operating Company’s Revolving Credit Facility
On May 31, 2023, the Operating Company entered into a tenth amendment to the existing credit facility, which among other things, (i) maintained the maximum credit amount of $2.0 billion, (ii) increased the borrowing base from $580.0 million to $1.0 billion and (iii) increased the aggregate elected commitment amount from $500.0 million to $750.0 million.
On September 22, 2023, the Operating Company entered into an eleventh and separately a twelfth amendment to the existing credit facility, which among other things, (i) extended the maturity date from June 2, 2025, to September 22, 2028, (ii) maintained the maximum credit amount of $2.0 billion, (iii) further increased the borrowing base from $1.0 billion to $1.3 billion upon consummation of the GRP Acquisition, (iv) further increased the aggregate elected commitment amount from $750.0 million to $850.0 million, and (v) waived the automatic reduction of the borrowing base that otherwise would have occurred upon the consummation of the issuance of the 2031 Notes.
As of December 31, 2023, the Operating Company had $263.0 million of outstanding borrowings and $587.0 million available for future borrowings under the Operating Company’s revolving credit facility. For the years ended December 31, 2023, 2022 and 2021, the weighted average interest rate on borrowings under the Operating Company’s revolving credit facility was 7.41 %, 4.22 %, and 2.35 %, respectively.
The outstanding borrowings under the credit facility bear interest at a rate elected by the Operating Company that is equal to (i) term SOFR plus 0.10 % (“Adjusted Term SOFR”), or (ii) an alternate base rate (which is equal to the greatest of the prime rate, the Federal Funds effective rate plus 0.50 %, and 1-month Adjusted Term SOFR plus 1.00 %), in each case plus the applicable margin. The applicable margin ranges from 1.00 % to 2.00 % per annum in the case of the alternative base rate and from 2.00 % to 3.00 % per annum in the case of Adjusted Term SOFR, in each case depending on the amount of the loans outstanding in relation to the commitment, which is calculated using the least of the maximum credit amount, the aggregate elected commitment amount and the borrowing base. The Operating Company is obligated to pay a quarterly commitment fee ranging from 0.375 % to 0.500 % per year on the unused portion of the commitment. The credit facility is secured by substantially all the assets of the Company and the Operating Company.
The credit facility contains various affirmative, negative and financial maintenance covenants. These covenants, among other things, limit additional indebtedness, additional liens, sales of assets, mergers and consolidations, dividends and distributions, transactions with affiliates, excess cash and entering into certain swap agreements and require the maintenance of the financial ratios described below.
| Financial Covenant | Required Ratio | |||||||
Ratio of total net debt to EBITDAX, as defined in the credit facility | Not greater than | |||||||
Ratio of current assets to liabilities, as defined in the credit facility | Not less than | |||||||
Ratio of secured debt to EBITDAX, as defined in the credit facility | Not greater than | |||||||
As of December 31, 2023, the Operating Company was in compliance with all financial maintenance covenants under its credit facility.
63
Interest expense
The following amounts have been incurred and charged to interest expense for the years ended December 31, 2023, 2022 and 2021:
| Year Ended December 31, | |||||||||||||||||
| 2023 | 2022 | 2021 | |||||||||||||||
| (In thousands) | |||||||||||||||||
| Interest expense | $ | $ | $ | ||||||||||||||
| Other fees and expenses | |||||||||||||||||
| Less: interest income | |||||||||||||||||
| Interest expense, net | $ | $ | $ | ||||||||||||||
7. STOCKHOLDERS’ EQUITY
At December 31, 2023, the Company had a total of 86,144,273 90,709,946 7,946,507 shares of Class A Common Stock and 90,709,946 shares of Class B Common Stock were beneficially owned by Diamondback, representing approximately 56 % of the Company’s total shares outstanding. Diamondback also beneficially owns 90,709,946 Operating Company shares, representing a 51 % non-controlling ownership interest in the Operating Company. The Operating Company shares and the Company’s Class B Common Stock beneficially owned by Diamondback are exchangeable from time to time for the Company’s Class A Common Stock (that is, one Operating Company share and one Company Class B Common Stock share, together, will be exchangeable for one Company Class A Common Stock share).
Viper Issuance of Common Units to Diamondback
On October 31, 2023, the Company issued approximately 7.22 million of its common units to Diamondback at a price of $27.72 per unit for total net proceeds of approximately $200.0 million pursuant to a common unit purchase and sale agreement entered into with Diamondback on September 4, 2023. The net proceeds of this common unit issuance were used to fund a portion of the cash consideration for the GRP Acquisition.
Common Stock Repurchase Program
The board of directors of the General Partner previously authorized a $750.0 million common unit repurchase program, which has been ratified and continued by the Company’s board of directors with respect to the repurchase of the Company’s Class A Common Stock, excluding excise tax, over an indefinite period of time. The Company intends to purchase shares of Class A Common Stock under the repurchase program opportunistically with funds from cash on hand, free cash flow from operations and potential liquidity events such as the sale of assets. This repurchase program may be suspended from time to time, modified, extended or discontinued by the board of directors of the Company at any time.
During the years ended December 31, 2023, 2022 and 2021, repurchases under the repurchase program totaled $95.2 million, $150.6 million, and $46.0 million, respectively. Repurchases for the year ended December 31, 2023 include approximately $28.7 million for the repurchase of 1.0 million shares of Class A Common Stock from GRP in a privately negotiated transaction in the fourth quarter of 2023. Repurchases for the year ended December 31, 2022 include approximately $37.3 million for the repurchase of 1.5 million shares of Class A Common Stock from a significant shareholder in a privately negotiated transaction. As of December 31, 2023, $434.2 million remains available under the repurchase program, excluding excise tax.
Changes in Ownership of Consolidated Subsidiaries
Non-controlling interest in the accompanying consolidated financial statements represents Diamondback’s ownership in the net assets of the Operating Company. Diamondback’s relative ownership interest in the Operating Company can change due to the Company’s public offerings of shares, issuance of shares for acquisitions, issuance of share-based compensation, repurchases of common shares and distribution equivalent rights paid on the Company’s shares. These changes in ownership percentage result in adjustments to non-controlling interest and stockholders’ equity, tax effected, but do not impact earnings.
64
The following table summarizes the changes in stockholders’ equity due to changes in ownership interest during the period:
| Year Ended December 31, | |||||||||||||||||
| 2023 | 2022 | 2021 | |||||||||||||||
| (In thousands) | |||||||||||||||||
| Net income (loss) attributable to the Company | $ | $ | $ | ||||||||||||||
| Change in ownership of consolidated subsidiaries | ( | ( | |||||||||||||||
| Change from net income (loss) attributable to the Company's stockholders and transfers with non-controlling interest | $ | $ | $ | ( | |||||||||||||
Cash Dividends
The board of directors of the Company has established a dividend policy, consistent with the pre-Conversion distribution policy, whereby the Operating Company distributes all or a portion of its available cash on a quarterly basis to its unitholders (including Diamondback and the Company) and the Company in turn distributes all or a portion of the available cash it receives from the Operating Company to shareholders of its Class A Common Stock. The Company currently intends to pay quarterly variable dividends of at least 75 % of its available cash less the base dividend declared and the amount paid in stock repurchases as part of the Company’s buyback program for the applicable quarter. Additionally, the Company’s board of directors approved excluding the $28.7 million one-time share repurchase from GRP that occurred in November 2023 from the calculation of cash available for distribution for the fourth quarter of 2023.
The Company’s available cash and the available cash of the Operating Company for each quarter, a non-GAAP measure, is determined by the Company’s board of directors following the end of such quarter. The Company expects that its available cash will generally equal the Adjusted EBITDA attributable to the Company for the applicable quarter, less cash needed for income taxes payable, debt service, contractual obligations, fixed charges and reserves for future operating or capital needs that the Company’s board of directors deems necessary or appropriate, lease bonus income (net of applicable taxes), distribution equivalent rights payments and preferred distributions.
The percentage of cash available for distribution by the Operating Company pursuant to the distribution policy may change quarterly to enable the Operating Company to retain cash flow to help strengthen the Company’s balance sheet while also expanding the return of capital program through the Company’s stock repurchase program.
The Company is also required to pay a quarterly preferred dividend in respect of its Class B Common Stock in the aggregate amount of $20,000 per quarter, which is consistent with the Partnership’s pre-Conversion preferred distribution requirement. Other than the preferred dividend requirement, the Company is not required to pay dividends to its common stockholders on a quarterly or other basis, and declaration of any other dividends in the future will be solely in the discretion of the Company’s board of directors.
65
The following table presents information regarding cash distributions and dividends paid during the years ended December 31, 2023, 2022 and 2021 (in thousands, except for per unit amounts):
| Period | Amount per Operating Company Unit | Operating Company Distributions to Diamondback | Amount per Common Unit | Common Unitholders(1) | Declaration Date | Unitholder Record Date | Payment Date | |||||||||||||||||||||||||||||||||||||
| Q4 2020 | $ | $ | $ | $ | February 19, 2021 | March 4, 2021 | March 11, 2021 | |||||||||||||||||||||||||||||||||||||
| Q1 2021 | $ | $ | $ | $ | April 27, 2021 | May 13, 2021 | May 20, 2021 | |||||||||||||||||||||||||||||||||||||
| Q2 2021 | $ | $ | $ | $ | July 28, 2021 | August 12, 2021 | August 19, 2021 | |||||||||||||||||||||||||||||||||||||
| Q3 2021 | $ | $ | $ | $ | October 27, 2021 | November 11, 2021 | November 18, 2021 | |||||||||||||||||||||||||||||||||||||
| Q4 2021 | $ | $ | $ | $ | February 16, 2022 | March 4, 2022 | March 11, 2022 | |||||||||||||||||||||||||||||||||||||
| Q1 2022 | $ | $ | $ | $ | April 27, 2022 | May 12, 2022 | May 19, 2022 | |||||||||||||||||||||||||||||||||||||
| Q2 2022 | $ | $ | $ | $ | July 26, 2022 | August 16, 2022 | August 23, 2022 | |||||||||||||||||||||||||||||||||||||
| Q3 2022 | $ | $ | $ | $ | November 3, 2022 | November 17, 2022 | November 25, 2022 | |||||||||||||||||||||||||||||||||||||
| Q4 2022 | $ | $ | $ | $ | February 15, 2023 | March 3, 2023 | March 10, 2023 | |||||||||||||||||||||||||||||||||||||
| Q1 2023 | $ | $ | $ | $ | April 26, 2023 | May 11, 2023 | May 18, 2023 | |||||||||||||||||||||||||||||||||||||
| Q2 2023 | $ | $ | $ | $ | July 25, 2023 | August 10, 2023 | August 17, 2023 | |||||||||||||||||||||||||||||||||||||
| Q3 2023 | $ | $ | $ | $ | November 2, 2023 | November 16, 2023 | November 24, 2023 | |||||||||||||||||||||||||||||||||||||
(1)Payments made prior to the Conversion include amounts paid to Diamondback for the 731,500 common units then beneficially owned by Diamondback. Payments made after the Conversion include amounts paid to shareholders of Class A Common Stock, including the 7,946,507 shares of Class A Common Stock owned by Diamondback.
Cash dividends will be made to the common stockholders of record on the applicable record date, generally within 60 days after the end of each quarter.
Allocation of Net Income
The Partnership, as the previous managing member of the Operating Company, had an agreement, as amended on December 28, 2021, whereby special allocations of the Operating Company’s income and gains over losses and deductions (but before depletion) were made to Diamondback through December 31, 2022. These special income allocations reduced the taxable income allocated to the Partnership’s common unitholders during 2022 and 2021.
8. EARNINGS PER COMMON SHARE
The net income (loss) per share of Class A Common Stock on the consolidated statements of operations is based on the net income (loss) attributable to the Company’s Class A Common Stock for the year ended December 31, 2023, and common units for the years ended December 31, 2022 and 2021. For the years ended December 31, 2022 and 2021, the Partnership’s net income (loss) was allocated wholly to the common unitholders, as the General Partner did not have an economic interest. Payments made to the Company’s stockholders are determined in relation to the cash dividend policy described in Note 7—Stockholders' Equity.
Basic and diluted earnings per share of the Company’s Class A Common Stock are calculated using the two-class method. The two-class method is an earnings allocation proportional to the respective ownership among holders of Class A Common Stock and participating securities. Basic net income (loss) per share of Class A Common Stock is calculated by dividing net income (loss) by the weighted-average shares of Class A Common Stock outstanding during the period. Diluted net income (loss) per share of Class A Common Stock gives effect, when applicable, to unvested shares of Class A Common Stock granted under the LTIP.
66
A reconciliation of the components of basic and diluted earnings per common share is presented in the table below:
| Year Ended December 31, | |||||||||||||||||
| 2023 | 2022 | 2021 | |||||||||||||||
(In thousands, except per share amounts) | |||||||||||||||||
| Net income (loss) attributable to the period | $ | $ | $ | ||||||||||||||
Less: net income (loss) allocated to participating securities(1) | |||||||||||||||||
| Net income (loss) attributable to common stockholders | $ | $ | $ | ||||||||||||||
| Weighted average common shares outstanding: | |||||||||||||||||
| Basic weighted average common shares outstanding | |||||||||||||||||
| Effect of dilutive securities: | |||||||||||||||||
Potential common shares issuable(2) | |||||||||||||||||
| Diluted weighted average common shares outstanding | |||||||||||||||||
Net income (loss) per common stock, basic | $ | $ | $ | ||||||||||||||
Net income (loss) per common stock, diluted | $ | $ | $ | ||||||||||||||
(1) Unvested restricted stock shares that contain non-forfeitable distribution equivalent rights granted are considered participating securities and therefore are included in the earnings per share calculation pursuant to the two-class method.
(2) For the years ended December 31, 2023 and 2022, no 10,160 potential common shares were excluded in the computation of diluted earnings per common share because their inclusion would have been anti-dilutive.
9. INCOME TAXES
The Company’s total income tax expense and benefit for the years ended December 31, 2023 and 2022, respectively, differed from amounts computed by applying the United States federal statutory tax rate to pre-tax income for the period primarily due to net income attributable to the non-controlling interest and the impact of reductions to the valuation allowance in 2023 and in 2022. For the year ended December 31, 2021, total income tax expense differed from amounts computed by applying the United States federal statutory rate to pre-tax income for the period primarily due to net income attributable to the non-controlling interest and maintaining a valuation allowance on the Company’s deferred tax assets.
The components of the provision for income taxes and effective tax rates for the years ended December 31, 2023, 2022 and 2021 are as follows:
| Year Ended December 31, | |||||||||||||||||
| 2023 | 2022 | 2021 | |||||||||||||||
| (In thousands) | |||||||||||||||||
| Current income tax provision (benefit): | |||||||||||||||||
| Federal | $ | $ | $ | ||||||||||||||
| State | |||||||||||||||||
| Total current income tax provision (benefit) | |||||||||||||||||
| Deferred income tax provision (benefit): | |||||||||||||||||
| Federal | ( | ( | |||||||||||||||
| State | ( | ||||||||||||||||
| Total deferred income tax provision (benefit) | ( | ( | |||||||||||||||
| Total provision (benefit) from income taxes | $ | $ | ( | $ | |||||||||||||
| Effective tax rates | % | ( | % | % | |||||||||||||
67
A reconciliation of the statutory federal income tax amount to the recorded expense is as follows:
| Year Ended December 31, | |||||||||||||||||
| 2023 | 2022 | 2021 | |||||||||||||||
| (In thousands) | |||||||||||||||||
| Income tax expense (benefit) at the federal statutory rate (21%) | $ | $ | $ | ||||||||||||||
| Impact of nontaxable noncontrolling interest | ( | ( | ( | ||||||||||||||
| State income tax expense (benefit), net of federal tax effect | |||||||||||||||||
| Change in valuation allowance | ( | ( | ( | ||||||||||||||
| Other, net | ( | ( | ( | ||||||||||||||
| Provision for (benefit from) income taxes | $ | $ | ( | $ | |||||||||||||
The components of the Company’s deferred tax assets and liabilities as of December 31, 2023 and 2022 are as follows:
| Year Ended December 31, | |||||||||||
| 2023 | 2022 | ||||||||||
| (In thousands) | |||||||||||
| Deferred tax assets: | |||||||||||
| Net operating loss and capital loss carryforwards | $ | $ | |||||||||
| Investment in the Operating Company | |||||||||||
| Total deferred tax assets | |||||||||||
| Valuation allowance | ( | ( | |||||||||
| Net deferred tax assets | |||||||||||
| Net deferred tax assets (liabilities) | $ | $ | |||||||||
At December 31, 2023, the Company has net deferred tax assets of approximately $56.7 million, including immaterial federal capital loss carryforwards expiring in 2026 and immaterial state operating loss carryforwards. Deferred taxes are provided on the difference between the Company’s basis for financial accounting purposes and basis for federal income tax purposes in its investment in the Operating Company.
During the years ended December 31, 2023 and 2022, the Company recognized discrete income tax benefits of $7.0 million and $49.7 million, respectively, related to a partial release of its beginning-of-the-year valuation allowance, based on a change in judgment about the realizability of its deferred tax assets in future years.
The Company principally operates in the state of Texas. For the years ended December 31, 2023 and 2022, the Company recognized $2.5 million and $1.1 million, respectively, in state income tax expense primarily for its share of Texas margin tax attributable to the Company’s results which are included in a combined tax return filed by Diamondback. At December 31, 2023, the Company did not have any significant uncertain tax positions requiring recognition in the financial statements. The Company’s 2020 through 2023 tax years remain open to examination by tax authorities.
The Inflation Reduction Act of 2022 (“IRA”) was enacted on August 16, 2022, and imposed an excise tax of 1% on the fair market value of certain public company stock repurchases for tax years beginning after December 31, 2022, and included several other provisions applicable to U.S. income taxes for corporations. The Company did not accrue excise tax during the year ended December 31, 2023 due to stock issuances exceeding stock repurchases for the year.
10. DERIVATIVES
During 2023, the Company used fixed price swap contracts, fixed price basis swap contracts and costless collars with corresponding put and call options to reduce price volatility associated with certain of its royalty income. At December 31, 2023, the Company has puts, costless collars and fixed price basis swap contracts outstanding.
The Company’s derivative contracts are based upon reported settlement prices on commodity exchanges, with put contracts for oil based on WTI Cushing and fixed price basis swaps for oil based on the spread between the WTI Cushing crude oil price and the Argus WTI Midland crude oil price. The Company’s fixed price basis swaps for natural gas are for the spread between the Waha Hub natural gas price and the Henry Hub natural gas price. The weighted average differential represents the
68
amount of reduction to the WTI Cushing oil price and the Waha Hub natural gas price for the notional volumes covered by the basis swap contracts. Under the Company’s costless collar contracts, each collar has an established floor price and ceiling price. When the settlement price is below the floor price, the counterparty is required to make a payment to the Company, and when the settlement price is above the ceiling price, the Company is required to make a payment to the counterparty. When the settlement price is between the floor and the ceiling, there is no payment required.
By using derivative instruments to economically hedge exposure to changes in commodity prices, the Company exposes itself to credit risk and market risk. Credit risk is the failure of the counterparty to perform under the terms of the derivative contract. When the fair value of a derivative contract is positive, the counterparty owes the Company, which creates credit risk. The Company’s counterparties are all participants in the amended and restated credit facility, which is secured by substantially all of the assets of the Operating Company; therefore, the Company is not required to post any collateral. The Company’s counterparties have been determined to have an acceptable credit risk; therefore, the Company does not require collateral from its counterparties.
As of December 31, 2023, the Company had the following outstanding derivative contracts. When aggregating multiple contracts, the weighted average contract price is disclosed.
| Swaps | Collars | Puts | |||||||||||||||||||||||||||
| Settlement Month | Settlement Year | Type of Contract | Bbls/MMBtu Per Day | Index | Weighted Average Differential | Weighted Average Floor Price | Weighted Average Ceiling Price | Strike Price | Deferred Premium | ||||||||||||||||||||
| OIL | |||||||||||||||||||||||||||||
Jan. - Mar. | 2024 | Puts | WTI Cushing | $ | $ | $ | $ | $( | |||||||||||||||||||||
Apr. - Jun. | 2024 | Puts | WTI Cushing | $ | $ | $ | $ | $( | |||||||||||||||||||||
Jul. - Dec. | 2024 | Puts | WTI Cushing | $ | $ | $ | $ | $( | |||||||||||||||||||||
Jan. - Jun. | 2024 | Costless Collar | WTI Cushing | $ | $ | $ | $ | $ | |||||||||||||||||||||
Jul. - Dec. | 2024 | Costless Collar | WTI Cushing | $ | $ | $ | $ | $ | |||||||||||||||||||||
| NATURAL GAS | |||||||||||||||||||||||||||||
Jan. - Dec. | 2024 | Basis Swaps | Waha Hub | $( | $ | $ | $ | $ | |||||||||||||||||||||
| Jan. - Dec. | 2025 | Basis Swaps | Waha Hub | $( | $ | $ | $ | $ | |||||||||||||||||||||
Balance Sheet Offsetting of Derivative Assets and Liabilities
The fair value of derivative instruments is generally determined using established index prices and other sources which are based upon, among other things, futures prices and time to maturity. These fair values are recorded by netting asset and liability positions, including any deferred premiums, that are with the same counterparty and are subject to contractual terms which provide for net settlement. See Note 11—Fair Value Measurements for further details.
Gains and Losses on Derivative Instruments
The following table summarizes the gains and losses on derivative instruments included in the consolidated statements of operations and the net cash receipts (payments) on derivatives for the periods presented:
| Year Ended December 31, | |||||||||||||||||
| 2023 | 2022 | 2021 | |||||||||||||||
| (In thousands) | |||||||||||||||||
| Gain (loss) on derivative instruments | $ | ( | $ | ( | $ | ( | |||||||||||
Net cash receipts (payments) on derivatives(1) | $ | ( | $ | ( | $ | ( | |||||||||||
(1)The year ended December 31, 2022 includes cash paid on commodity contracts terminated prior to their contractual maturity of $6.6 million.
69
11. FAIR VALUE MEASUREMENTS
Fair value is defined as the price that would be received to sell an asset or paid to transfer a liability in an orderly transaction between market participants at the measurement date. Valuation techniques used to measure fair value must maximize the use of observable inputs and minimize the use of unobservable inputs.
The fair value hierarchy is based on three levels of inputs, of which the first two are considered observable and the last unobservable, that may be used to measure fair value. The Company’s assessment of the significance of a particular input to the fair value measurements requires judgment and may affect the valuation of the assets and liabilities being measured and their placement within the fair value hierarchy. The Company uses appropriate valuation techniques based on available inputs to measure the fair values of its assets and liabilities.
Level 1 - Observable inputs that reflect unadjusted quoted prices for identical assets or liabilities in active markets as of the reporting date.
Level 2 - Observable market-based inputs or unobservable inputs that are corroborated by market data. These are inputs other than quoted prices in active markets included in Level 1, which are either directly or indirectly observable as of the reporting date.
Level 3 - Unobservable inputs that are not corroborated by market data and may be used with internally developed methodologies that result in management’s best estimate of fair value.
Financial assets and liabilities are classified based on the lowest level of input that is significant to the fair value measurement.
Assets and Liabilities Measured at Fair Value on a Recurring Basis
Certain assets and liabilities are reported at fair value on a recurring basis on the Company’s consolidated balance sheets, including the Company’s derivative instruments. The fair values of the Company’s derivative contracts are measured internally using established commodity futures price strips for the underlying commodity provided by a reputable third party, the contracted notional volumes, and time to maturity. These valuations are Level 2 inputs in the fair value hierarchy. The net amounts are classified as current or noncurrent based on their anticipated settlement dates.
The following table provides (i) fair value measurement information for financial assets and liabilities measured at fair value on a recurring basis, (ii) the gross amounts of recognized derivative assets and liabilities, (iii) the amounts offset under master netting arrangements with counterparties, and (iv) the resulting net amounts presented in the Company’s consolidated balance sheets as of December 31, 2023 and December 31, 2022.
| As of December 31, 2023 | ||||||||||||||||||||
| Level 1 | Level 2 | Level 3 | Total Gross Fair Value | Gross Amounts Offset in Balance Sheet | Net Fair Value Presented in Balance Sheet | |||||||||||||||
| (In thousands) | ||||||||||||||||||||
| Assets: | ||||||||||||||||||||
| Current: | ||||||||||||||||||||
| Derivative instruments | $ | $ | $ | $ | $ | ( | $ | |||||||||||||
| Non-current: | ||||||||||||||||||||
| Derivative instruments | $ | $ | $ | $ | $ | ( | $ | |||||||||||||
| Liabilities: | ||||||||||||||||||||
| Current: | ||||||||||||||||||||
| Derivative instruments | $ | $ | $ | $ | $ | ( | $ | |||||||||||||
| Non-current: | ||||||||||||||||||||
| Derivative instruments | $ | $ | $ | $ | $ | ( | $ | |||||||||||||
70
| As of December 31, 2022 | ||||||||||||||||||||
| Level 1 | Level 2 | Level 3 | Total Gross Fair Value | Gross Amounts Offset in Balance Sheet | Net Fair Value Presented in Balance Sheet | |||||||||||||||
| (In thousands) | ||||||||||||||||||||
| Assets: | ||||||||||||||||||||
| Current: | ||||||||||||||||||||
| Derivative instruments | $ | $ | $ | $ | $ | ( | $ | |||||||||||||
| Non-current: | ||||||||||||||||||||
| Derivative instruments | $ | $ | $ | $ | $ | ( | $ | |||||||||||||
| Liabilities: | ||||||||||||||||||||
| Current: | ||||||||||||||||||||
| Derivative instruments | $ | $ | $ | $ | $ | ( | $ | |||||||||||||
| Non-current: | ||||||||||||||||||||
| Derivative instruments | $ | $ | $ | $ | $ | ( | $ | |||||||||||||
Assets and Liabilities Not Recorded at Fair Value
The following table provides the fair value of financial instruments that are not recorded at fair value in the consolidated balance sheets:
| December 31, 2023 | December 31, 2022 | ||||||||||||||||||||||
| Carrying Value | Fair Value | Carrying Value | Fair Value | ||||||||||||||||||||
| (In thousands) | |||||||||||||||||||||||
| Debt: | |||||||||||||||||||||||
| Revolving credit facility | $ | $ | $ | $ | |||||||||||||||||||
| $ | $ | $ | $ | ||||||||||||||||||||
| $ | $ | $ | $ | ||||||||||||||||||||
(1) The carrying value includes associated deferred loan costs and any discount.
The fair value of the Operating Company’s revolving credit facility approximates the carrying value based on borrowing rates available to the Company for bank loans with similar terms and maturities and is classified as Level 2 in the fair value hierarchy. The fair value of the Notes was determined using the December 31, 2023 quoted market price, a Level 1 classification in the fair value hierarchy.
Assets and Liabilities Measured at Fair Value on a Nonrecurring Basis
Certain assets and liabilities are measured at fair value on a nonrecurring basis in certain circumstances. These assets and liabilities can include mineral and royalty interests acquired in asset acquisitions and subsequent write-downs of the Company’s proved oil and natural gas interests to fair value when they are impaired or held for sale.
See Note 2—Summary of Significant Accounting Policies and Note 5—Oil and Natural Gas Interests for further discussion of non-recurring fair value adjustments.
Fair Value of Financial Assets
The Company has other financial instruments consisting of cash and cash equivalents, royalty income receivable, income tax receivable, prepaid expenses, other assets, accounts payable, accrued liabilities and income taxes payable. The carrying value of these instruments approximate their fair value because of the short-term nature of the instruments.
12. COMMITMENTS AND CONTINGENCIES
The Company is a party to various routine legal proceedings, disputes and claims from time to time arising in the ordinary course of its business. While the ultimate outcome of any pending proceedings, disputes or claims, and any resulting impact on the Company, cannot be predicted with certainty, the Company’s management believes that none of these matters, if ultimately decided adversely, will have a material adverse effect on the Company’s financial condition, results of operations or
71
cash flows. The Company’s assessment is based on information known about the pending matters and its experience in contesting, litigating and settling similar matters. Actual outcomes could differ materially from the Company’s assessment. The Company records reserves for contingencies related to outstanding legal proceedings, disputes or claims when information available indicates that a loss is probable and the amount of the loss can be reasonably estimated.
13. SUBSEQUENT EVENTS
Cash Dividend
On February 15, 2024, the board of directors of the Company approved a cash dividend for the fourth quarter of 2023 of 0.56 per share of Class A Common Stock and $0.69 per Operating Company unit, in each case, payable on March 12, 2024, to stockholders of record at the close of business on March 5, 2024. The dividend on Class A Common Stock consists of a base quarterly dividend of $0.27 per share and a variable quarterly dividend of $0.29 per share.
14. SUPPLEMENTAL INFORMATION ON OIL AND NATURAL GAS OPERATIONS (Unaudited)
The Company’s oil and natural gas reserves are attributable solely to properties within the United States.
Capitalized oil and natural gas costs
Aggregate capitalized costs related to oil and natural gas production activities with applicable accumulated depreciation, depletion and amortization are as follows:
| December 31, | |||||||||||
| 2023 | 2022 | ||||||||||
| (In thousands) | |||||||||||
| Oil and natural gas interests: | |||||||||||
| Proved | $ | $ | |||||||||
| Unproved | |||||||||||
| Total oil and natural gas interests | |||||||||||
| Accumulated depletion and impairment | ( | ( | |||||||||
| Net oil and natural gas interests capitalized | $ | $ | |||||||||
Costs incurred in oil and natural gas activities
Costs incurred in oil and natural gas property acquisition activities are as follows:
| Year Ended December 31, | |||||||||||||||||
| 2023 | 2022 | 2021 | |||||||||||||||
| (In thousands) | |||||||||||||||||
| Acquisition costs: | |||||||||||||||||
| Proved properties | $ | $ | $ | ||||||||||||||
| Unproved properties | |||||||||||||||||
| Total | $ | $ | $ | ||||||||||||||
Results of Operations from Oil and Natural Gas Producing Activities
Substantially all of the Company’s producing activities are from oil and natural gas activities and are included in the “—Consolidated Statements of Operations” above.
Oil and Natural Gas Reserves
Proved oil and natural gas reserve estimates and their associated future net cash flows were prepared by our internal reservoir engineers and audited by Ryder Scott Company, L.P., independent petroleum engineers, as of December 31, 2023 and 2022 and prepared by Ryder Scott as of December 31, 2021. The reserve estimates represent the Company’s net revenue interest in the Company’s properties. Proved reserves were estimated in accordance with guidelines established by the SEC, which require that reserve estimates be prepared under existing economic and operating conditions based upon SEC Prices for
72
the periods ended December 31, 2023, 2022 and 2021, respectively. Reserve estimates do not include any value for probable or possible reserves that may exist, nor do they include any value for undeveloped acreage. All of the Company’s proved reserves included in the reserve reports are located in the continental United States. Although the estimates are believed to be reasonable, actual future production, cash flows, taxes, development expenditures, operating expenses and quantities of recoverable oil and natural gas reserves may vary substantially from these estimates.
There are numerous uncertainties inherent in estimating quantities of proved oil and natural gas reserves. Oil and natural gas reserve engineering is a subjective process of estimating underground accumulations of oil and natural gas that cannot be precisely measured and the accuracy of any reserve estimate is a function of the quality of available data and of engineering and geological interpretation and judgment. Results of drilling, testing and production subsequent to the date of the estimate may justify revision of such estimate. Accordingly, reserve estimates are often different from the quantities of oil and natural gas that are ultimately recovered.
The following table presents changes in estimated proved reserves, which were prepared in accordance with the rules and regulations of the SEC.
| Oil (MBbls) | Natural Gas (MMcf) | Natural Gas Liquids (MBbls) | Total (MBOE)(1) | ||||||||||||||||||||
| Proved Developed and Undeveloped Reserves: | |||||||||||||||||||||||
| As of December 31, 2020 | |||||||||||||||||||||||
| Purchase of reserves in place | |||||||||||||||||||||||
| Extensions and discoveries | |||||||||||||||||||||||
| Revisions of previous estimates | ( | ( | ( | ||||||||||||||||||||
| Divestitures | ( | ( | ( | ( | |||||||||||||||||||
| Production | ( | ( | ( | ( | |||||||||||||||||||
| As of December 31, 2021 | |||||||||||||||||||||||
| Purchase of reserves in place | |||||||||||||||||||||||
| Extensions and discoveries | |||||||||||||||||||||||
| Revisions of previous estimates | |||||||||||||||||||||||
| Divestitures | ( | ( | ( | ( | |||||||||||||||||||
| Production | ( | ( | ( | ( | |||||||||||||||||||
| As of December 31, 2022 | |||||||||||||||||||||||
| Purchase of reserves in place | |||||||||||||||||||||||
| Extensions and discoveries | |||||||||||||||||||||||
| Revisions of previous estimates | ( | ||||||||||||||||||||||
| Production | ( | ( | ( | ( | |||||||||||||||||||
| As of December 31, 2023 | |||||||||||||||||||||||
| Proved Developed Reserves: | |||||||||||||||||||||||
| December 31, 2021 | |||||||||||||||||||||||
| December 31, 2022 | |||||||||||||||||||||||
| December 31, 2023 | |||||||||||||||||||||||
| Proved Undeveloped Reserves: | |||||||||||||||||||||||
| December 31, 2021 | |||||||||||||||||||||||
| December 31, 2022 | |||||||||||||||||||||||
| December 31, 2023 | |||||||||||||||||||||||
(1) Includes total proved reserves of 91,417 MBOE, 81,895 MBOE, 69,060 MBOE and 57,647 MBOE as of December 31, 2023, 2022, 2021 and 2020, respectively, attributable to a non-controlling interest in the Company.
Revisions represent changes in previous reserves estimates, either upward or downward, resulting from new information normally obtained from development drilling and production history or resulting from a change in economic factors, such as commodity prices, operating costs or development costs.
73
During the year ended December 31, 2023, the Company’s total extensions and discoveries of 25,558 MBOE resulted primarily from the drilling of 904 new wells and from 179 new proved undeveloped locations added. The Company’s total positive revisions of previous estimated quantities of 138 MBOE consist of positive revisions of 5,688 MBOE primarily attributable to performance revisions which were largely offset by PUD downgrades of 5,548 MBOE. Total purchases of reserves in place of 18,977 MBOE resulted primarily from the GRP Acquisition and other acquisitions of certain mineral and royalty interests.
During the year ended December 31, 2022, the Company’s total extensions and discoveries of 25,858 MBOE resulted primarily from the drilling of 636 new wells and from 199 new proved undeveloped locations added. The Company’s total positive revisions of previous estimated quantities of 8,477 MBOE were due to positive revisions of 15,484 MBOE attributable to price and performance revisions which were largely offset by PUD downgrades of 7,007 MBOE. Total purchases of reserves in place of 1,006 MBOE resulted from multiple acquisitions of certain mineral and royalty interests.
During the year ended December 31, 2021, the Company’s total extensions and discoveries of 30,981 MBOE resulted primarily from the drilling of 407 new wells and from 336 new proved undeveloped locations added. The Company’s total negative revisions of previous estimated quantities of 918 MBOE were due to PUD downgrades of 11,263 MBOE which were largely offset by positive revisions of 10,345 MBOE attributable to price and performance revisions. Total purchases of reserves in place of 9,102 MBOE resulted from multiple acquisitions of certain mineral and royalty interests, including the Swallowtail Acquisition.
Proved Undeveloped Reserves
As of December 31, 2023, the Company’s PUD reserves totaled 20,860 MBbls of oil, 42,116 MMcf of natural gas and 7,999 MBbls of natural gas liquids, for a total of 35,878 MBOE. PUDs will be converted from undeveloped to developed as the applicable wells begin production. The Company’s PUD reserves were from 529 horizontal wells, all of which Diamondback operates. Of the horizontal locations, 154 are Middle Spraberry/Jo Mill wells, 140 are Wolfcamp A wells, 120 are Lower Spraberry wells, 74 are Wolfcamp B wells, 35 are Bone Spring wells and six are Dean wells.
The following table includes the changes in PUD reserves for 2023:
| (MBOE) | |||||
Beginning proved undeveloped reserves at December 31, 2022 | |||||
| Undeveloped reserves transferred to developed | ( | ||||
| Revisions | ( | ||||
| Purchases | |||||
| Extensions and discoveries | |||||
Ending proved undeveloped reserves at December 31, 2023 | |||||
The decrease in PUD reserves was primarily attributable to the conversion of 13,021 MBOE of PUD reserves into proved developed reserves and downward revisions of 5,341 MBOE primarily attributable to PUD downgrades of 5,548 MBOE. These reductions in PUD reserves were partially offset by positive additions of 10,097 MBOE, primarily from 179 new horizontal well locations attributable to extensions resulting from strategic drilling of wells to delineate our acreage position and acquisitions of 2,534 MBOE.
All of the Company’s PUD drilling locations are scheduled to be drilled within five years from the date they were initially recorded. As of December 31, 2023, none of the Company’s total proved reserves were classified as proved developed non-producing.
Standardized Measure of Discounted Future Net Cash Flows
The standardized measure of discounted future net cash flows is based on SEC Prices. The projections should not be viewed as realistic estimates of future cash flows, nor should the “standardized measure” be interpreted as representing current value to the Company. Material revisions to estimates of proved reserves may occur in the future; development and production of the reserves may not occur in the periods assumed; actual prices realized are expected to vary significantly from those used; and actual costs may vary.
74
The following table sets forth the standardized measure of discounted future net cash flows attributable to the Company’s proved oil and natural gas reserves as of December 31, 2023, 2022 and 2021:
| December 31, | |||||||||||||||||
| 2023 | 2022 | 2021 | |||||||||||||||
| (In thousands) | |||||||||||||||||
| Future cash inflows | $ | $ | $ | ||||||||||||||
| Future production taxes | ( | ( | ( | ||||||||||||||
| Future income tax expense | ( | ( | ( | ||||||||||||||
| Future net cash flows | |||||||||||||||||
| 10% discount to reflect timing of cash flows | ( | ( | ( | ||||||||||||||
Standardized measure of discounted future net cash flows(1) | $ | $ | $ | ||||||||||||||
The following table presents the SEC Prices as adjusted for differentials and contractual arrangements utilized in the computation of future cash inflows:
| December 31, | |||||||||||||||||
| 2023 | 2022 | 2021 | |||||||||||||||
| Oil (per Bbl) | $ | $ | $ | ||||||||||||||
| Natural gas (per Mcf) | $ | $ | $ | ||||||||||||||
| Natural gas liquids (per Bbl) | $ | $ | $ | ||||||||||||||
Principal changes in the standardized measure of discounted future net cash flows attributable to the Company’s proved reserves are as follows:
| Year Ended December 31, | |||||||||||||||||
| 2023 | 2022 | 2021 | |||||||||||||||
| (In thousands) | |||||||||||||||||
| Standardized measure of discounted future net cash flows at the beginning of the period | $ | $ | $ | ||||||||||||||
| Purchase of minerals in place | |||||||||||||||||
| Divestiture of reserves | ( | ( | |||||||||||||||
| Sales of oil and natural gas, net of production costs | ( | ( | ( | ||||||||||||||
| Extensions and discoveries | |||||||||||||||||
| Net changes in prices and production costs | ( | ||||||||||||||||
| Revisions of previous quantity estimates | |||||||||||||||||
| Net changes in income taxes | ( | ( | |||||||||||||||
| Accretion of discount | |||||||||||||||||
| Net changes in timing of production and other | ( | ||||||||||||||||
| Standardized measure of discounted future net cash flows at the end of the period | $ | $ | $ | ||||||||||||||
75
ITEM 9. CHANGES IN AND DISAGREEMENTS WITH ACCOUNTANTS ON ACCOUNTING AND FINANCIAL DISCLOSURE
None.
ITEM 9A. CONTROLS AND PROCEDURES
Evaluation of Disclosure Controls and Procedures. Under the direction of our Chief Executive Officer and Chief Financial Officer, we have established disclosure controls and procedures, as defined in Rule 13a-15(e) and 15d-15(e) under the Exchange Act, that are designed to ensure that information required to be disclosed by us in the reports that we file or submit under the Exchange Act is recorded, processed, summarized and reported within the time periods specified in the SEC’s rules and forms. The disclosure controls and procedures are also intended to ensure that such information is accumulated and communicated to management, including our Chief Executive Officer and Chief Financial Officer, as appropriate to allow timely decisions regarding required disclosures. In designing and evaluating the disclosure controls and procedures, management recognizes that any controls and procedures, no matter how well designed and operated, can provide only reasonable assurance of achieving the desired control objectives. In addition, the design of disclosure controls and procedures must reflect the fact that there are resource constraints and that management is required to apply judgment in evaluating the benefits of possible controls and procedures relative to their costs.
As of December 31, 2023, an evaluation was performed under the supervision and with the participation of management, including our Chief Executive Officer and Chief Financial Officer, of the effectiveness of the design and operation of our disclosure controls and procedures pursuant to Rule 13a-15(b) under the Exchange Act. Based upon our evaluation, our Chief Executive Officer and Chief Financial Officer have concluded that as of December 31, 2023, our disclosure controls and procedures are effective.
Changes in Internal Control over Financial Reporting. There have not been any changes in our internal control over financial reporting that occurred during the quarter ended December 31, 2023 that have materially affected, or are reasonably likely to materially affect, internal controls over financial reporting.
MANAGEMENT’S REPORT ON INTERNAL CONTROL OVER FINANCIAL REPORTING
The management of our Company is responsible for establishing and maintaining adequate internal control over financial reporting of the Company. The Company’s internal control over financial reporting is a process designed under the supervision of the Company’s Chief Executive Officer and Chief Financial Officer to provide reasonable assurance regarding the reliability of financial reporting and the preparation of the Company’s financial statements for external purposes in accordance with generally accepted accounting principles.
Management conducted an evaluation of the effectiveness of the Company’s internal control over financial reporting based on the framework in the 2013 Internal Control-Integrated Framework issued by the Committee of Sponsoring Organizations of the Treadway Commission. Based on its evaluation under the framework in the 2013 Internal Control-Integrated Framework, management did not identify any material weaknesses in the Company’s internal control over financial reporting and determined that the Company maintained effective internal control over financial reporting as of December 31, 2023.
Because of its inherent limitations, internal control over financial reporting may not prevent or detect misstatements. Also, projections of any evaluation of effectiveness to future periods are subject to the risk that controls may become inadequate because of changes in conditions, or that the degree of compliance with the policies or procedures may deteriorate.
Grant Thornton LLP, the independent registered public accounting firm that audited the consolidated financial statements of the Company included in this Annual Report on Form 10-K, has issued their report on the effectiveness of the Company’s internal control over financial reporting at December 31, 2023. The report, which expresses an unqualified opinion on the effectiveness of the Company’s internal control over financial reporting at December 31, 2023, is included in this Item under the heading “Report of Independent Registered Public Accounting Firm.”
76
REPORT OF INDEPENDENT REGISTERED PUBLIC ACCOUNTING FIRM
Board of Directors and Stockholders
Viper Energy, Inc.
Opinion on internal control over financial reporting
We have audited the internal control over financial reporting of Viper Energy, Inc. (a Delaware corporation) and subsidiaries (the “Company”) as of December 31, 2023, based on criteria established in the 2013 Internal Control—Integrated Framework issued by the Committee of Sponsoring Organizations of the Treadway Commission (“COSO”). In our opinion, the Company maintained, in all material respects, effective internal control over financial reporting as of December 31, 2023, based on criteria established in the 2013 Internal Control—Integrated Framework issued by COSO.
We also have audited, in accordance with the standards of the Public Company Accounting Oversight Board (United States) (“PCAOB”), the consolidated financial statements of the Company as of and for the year ended December 31, 2023, and our report dated February 22, 2024 expressed an unqualified opinion on those financial statements.
Basis for opinion
The Company’s management is responsible for maintaining effective internal control over financial reporting and for its assessment of the effectiveness of internal control over financial reporting, included in the accompanying Management’s Report on Internal Control Over Financial Reporting. Our responsibility is to express an opinion on the Company’s internal control over financial reporting based on our audit. We are a public accounting firm registered with the PCAOB and are required to be independent with respect to the Company in accordance with the U.S. federal securities laws and the applicable rules and regulations of the Securities and Exchange Commission and the PCAOB.
We conducted our audit in accordance with the standards of the PCAOB. Those standards require that we plan and perform the audit to obtain reasonable assurance about whether effective internal control over financial reporting was maintained in all material respects. Our audit included obtaining an understanding of internal control over financial reporting, assessing the risk that a material weakness exists, testing and evaluating the design and operating effectiveness of internal control based on the assessed risk, and performing such other procedures as we considered necessary in the circumstances. We believe that our audit provides a reasonable basis for our opinion.
Definition and limitations of internal control over financial reporting
A company’s internal control over financial reporting is a process designed to provide reasonable assurance regarding the reliability of financial reporting and the preparation of financial statements for external purposes in accordance with generally accepted accounting principles. A company’s internal control over financial reporting includes those policies and procedures that (1) pertain to the maintenance of records that, in reasonable detail, accurately and fairly reflect the transactions and dispositions of the assets of the company; (2) provide reasonable assurance that transactions are recorded as necessary to permit preparation of financial statements in accordance with generally accepted accounting principles, and that receipts and expenditures of the company are being made only in accordance with authorizations of management and directors of the company; and (3) provide reasonable assurance regarding prevention or timely detection of unauthorized acquisition, use, or disposition of the company’s assets that could have a material effect on the financial statements.
Because of its inherent limitations, internal control over financial reporting may not prevent or detect misstatements. Also, projections of any evaluation of effectiveness to future periods are subject to the risk that controls may become inadequate because of changes in conditions, or that the degree of compliance with the policies or procedures may deteriorate.
/s/ GRANT THORNTON LLP
Oklahoma City, Oklahoma
February 22, 2024
77
ITEM 9B. OTHER INFORMATION
None of the Company’s directors or officers adopted terminated
ITEM 9C. DISCLOSURE REGARDING FOREIGN JURISDICTIONS THAT PREVENT INSPECTIONS
Not applicable.
78
PART III
ITEM 10. DIRECTORS, EXECUTIVE OFFICERS AND CORPORATE GOVERNANCE
Information as to Item 10 will be set forth in our definitive proxy statement, which is to be filed pursuant to Regulation 14A with the SEC within 120 days after the close of the year ended December 31, 2023.
We have adopted a Code of Business Conduct and Ethics that applies to our Chief Executive Officer, Chief Financial Officer, principal accounting officer and controller and persons performing similar functions. Any amendments to or waivers from the code of business conduct and ethics will be disclosed on our website. The Company also has made the Code of Business Conduct and Ethics available on our website under the “Investors—Corporate Governance” section at https://www.viperenergy.com. We intend to satisfy the disclosure requirements under Item 5.05 of Form 8-K regarding an amendment to, or waiver from, a provision of the Code of Business Conduct and Ethics by posting such information on our website at the address specified above.
ITEM 11. EXECUTIVE COMPENSATION
Information as to Item 11 will be set forth in our definitive proxy statement, which is to be filed pursuant to Regulation 14A with the SEC within 120 days after the close of the year ended December 31, 2023.
ITEM 12. SECURITY OWNERSHIP OF CERTAIN BENEFICIAL OWNERS AND MANAGEMENT AND RELATED STOCKHOLDER MATTERS
Information as to Item 12 will be set forth in our definitive proxy statement, which is to be filed pursuant to Regulation 14A with the SEC within 120 days after the close of the year ended December 31, 2023.
ITEM 13. CERTAIN RELATIONSHIPS AND RELATED TRANSACTIONS, AND DIRECTOR INDEPENDENCE
Information as to Item 13 will be set forth in our definitive proxy statement, which is to be filed pursuant to Regulation 14A with the SEC within 120 days after the close of the year ended December 31, 2023.
ITEM 14. PRINCIPAL ACCOUNTANT FEES AND SERVICES
Information as to Item 14 will be set forth in our definitive proxy statement, which is to be filed pursuant to Regulation 14A with the SEC within 120 days after the close of the year ended December 31, 2023.
79
PART IV
ITEM 15. EXHIBITS AND FINANCIAL STATEMENT SCHEDULES
3. Exhibits | ||||||||
80
81
82
Exhibit Number | Description | |||||||
| 101 | The following financial information from the Registrant’s Annual Report on Form 10-K for the year ended December 31, 2023, formatted in Inline XBRL: (i) Consolidated Balance Sheets, (ii) Consolidated Statements of Operations, (iii) Consolidated Statement of Changes in Stockholders’ Equity, (iv) Consolidated Statements of Cash Flows and (v) Notes to Consolidated Financial Statements. | |||||||
| 104 | Cover Page Interactive Data File (formatted as Inline XBRL and contained in Exhibit 101). | |||||||
* | Filed herewith. | ||||
+ | Management contract, compensatory plan or arrangement. | ||||
++ | The certifications attached as Exhibit 32.1 accompany this Annual Report on Form 10-K pursuant to 18 U.S.C. Section 1350, as adopted pursuant to Section 906 of the Sarbanes-Oxley Act of 2002, and shall not be deemed “filed” by the Registrant for purposes of Section 18 of the Securities Exchange Act of 1934, as amended. | ||||
| # | Schedules (or similar attachments) have been omitted pursuant to Item 601(a)(5) of Regulation S-K and will be provided to the Securities and Exchange Commission upon request. | ||||
ITEM 16. FORM 10-K SUMMARY
None.
83
SIGNATURES
Pursuant to the requirements of the Securities and Exchange Act of 1934, the Registrant has duly caused this Annual Report to be signed on its behalf by the undersigned thereunto duly authorized.
VIPER ENERGY, INC. | |||||||||||
| Date: | February 22, 2024 | ||||||||||
| By: | VIPER ENERGY, INC. | ||||||||||
| By: | /s/ Travis D. Stice | ||||||||||
| Name: | Travis D. Stice | ||||||||||
| Title: | Chief Executive Officer | ||||||||||
Pursuant to the requirements of the Securities and Exchange Act of 1934, this Annual Report has been signed below by the following persons on behalf of the Registrant and in the capacities and on the dates indicated.
| Signature | Title | Date | ||||||||||||
| /s/ Travis D. Stice | Chief Executive Officer and Director | February 22, 2024 | ||||||||||||
| Travis D. Stice | (Principal Executive Officer) | |||||||||||||
| /s/ Teresa L. Dick | Chief Financial Officer | February 22, 2024 | ||||||||||||
| Teresa L. Dick | (Principal Financial and Accounting Officer) | |||||||||||||
| /s/ Steven E. West | Chairman of the Board and Director | February 22, 2024 | ||||||||||||
| Steven E. West | ||||||||||||||
/s/ Kaes Van’t Hof | Director | February 22, 2024 | ||||||||||||
Kaes Van’t Hof | ||||||||||||||
| /s/ W. Wesley Perry | Director | February 22, 2024 | ||||||||||||
| W. Wesley Perry | ||||||||||||||
| /s/ Spencer D. Armour | Director | February 22, 2024 | ||||||||||||
| Spencer D. Armour | ||||||||||||||
| /s/ James L. Rubin | Director | February 22, 2024 | ||||||||||||
| James L. Rubin | ||||||||||||||
| /s/ Frank C. Hu | Director | February 22, 2024 | ||||||||||||
| Frank C. Hu | ||||||||||||||
/s/ Laurie H. Argo | Director | February 22, 2024 | ||||||||||||
Laurie H. Argo | ||||||||||||||
84