Table of Contents
| REGISTRATION STATEMENT PURSUANT TO SECTION 12(b) OR (g) OF THE SECURITIES EXCHANGE ACT OF 1934 |
| ANNUAL REPORT PURSUANT TO SECTION 13 OR 15(d) OF THE SECURITIES EXCHANGE ACT OF 1934 |
| TRANSITION REPORT PURSUANT TO SECTION 13 OR 15(d) OF THE SECURITIES EXCHANGE ACT OF 1934 |
| SHELL COMPANY REPORT PURSUANT TO SECTION 13 OR 15(d) OF THE SECURITIES EXCHANGE ACT OF 1934 |
Title of each class |
Trading symbol |
Name of each exchange on which registered | ||
| |
|
|||
| 5,000 per share |
|
| ☒ |
☐ Accelerated Filer |
☐ Non-accelerated filer |
|
| ☐ U.S. GAAP |
☒ by the International Accounting Standards Board |
☐ Other |
| Auditor Name: |
Auditor Location: |
Auditor Firm ID: |
Table of Contents
TABLE OF CONTENTS
i
Table of Contents
ii
Table of Contents
PRESENTATION OF FINANCIAL AND OTHER INFORMATION
The financial statements included in this annual report are prepared in accordance with International Financial Reporting Standards, or IFRS, as issued by the International Accounting Standards Board, or the IASB.
Unless expressly stated otherwise, all financial data included in this annual report are presented on a consolidated basis.
We were established on January 11, 2019 pursuant to a “comprehensive stock transfer” under Korean law, whereby holders of the common stock of Woori Bank and certain of its subsidiaries transferred all of their shares to us, a new financial holding company, and in return received shares of our common stock. As a result of the stock transfer, Woori Bank and certain of its former wholly-owned subsidiaries, Woori FIS Co., Ltd., Woori Finance Research Institute Co., Ltd., Woori Credit Information Co., Ltd., Woori Fund Services Co., Ltd. and Woori Private Equity Asset Management Co., Ltd., became our direct and wholly-owned subsidiaries. Accordingly, our overall business and operations after the stock transfer, on a consolidated basis, are identical to those of Woori Bank on a consolidated basis immediately prior to the stock transfer. See “Item 4.A. History and Development of the Company—Establishment of Woori Financial Group.”
The stock transfer constituted a succession for purposes of Rule 12g-3(a) under the Securities Exchange Act of 1934, as amended (the “Exchange Act”), such that our common stock was deemed registered under Section 12(b) of the Exchange Act by operation of Rule 12g-3(a). Following the stock transfer, we file reports under the Exchange Act as the successor issuer to Woori Bank.
In our consolidated financial statements for financial reporting periods beginning on or after January 1, 2019, the stock transfer is accounted for as a transaction among entities under common control applying the pooling of interests method of accounting (book value accounting). We initially recognized the transferred assets and liabilities at their book value as of the date of the stock transfer in such consolidated financial statements, and no goodwill was recognized in connection with the transaction.
The consolidated financial statements included in this annual report as of dates and for periods prior to the date of our establishment in January 2019 pursuant to the stock transfer were prepared based on the consolidated financial statements for Woori Bank and its subsidiaries, except that Woori FIS Co., Ltd., Woori Finance Research Institute Co., Ltd., Woori Credit Information Co., Ltd., Woori Fund Services Co., Ltd. and Woori Private Equity Asset Management Co., Ltd. were consolidated on a line-by-line basis instead of being presented as assets and liabilities held for sale. Unless expressly stated otherwise, historical financial data included in this annual report as of dates and for periods prior to our establishment are for Woori Bank and its subsidiaries, on a consolidated basis, with the foregoing modification. For further information regarding the accounting treatment of the stock transfer, see Note 1 of the notes to our consolidated financial statements included elsewhere in this annual report.
Unless otherwise indicated or required by the context, “we,” “us,” “our” and similar terms used in this annual report refer to Woori Financial Group and its subsidiaries (including Woori Bank) and, for periods prior to our establishment, refer to Woori Bank and its subsidiaries.
In this annual report:
| • | references to “Korea” are to the Republic of Korea; |
| • | references to the “government” are to the government of the Republic of Korea; |
| • | references to “Won” or “₩” are to the currency of Korea; |
| • | references to “U.S. dollars,” “$” or “US$” are to the currency of the United States; and |
| • | references to “Euros” or “EUR” are to the currency of the European Economic and Monetary Union. |
Discrepancies between totals and the sums of the amounts contained in any table may be a result of rounding.
For your convenience, this annual report contains conversions of Won amounts into U.S. dollars at the noon buying rate of the Federal Reserve Bank of New York for Won in effect on December 30, 2022, which was ₩1,260.2= US$1.00.
1
Table of Contents
FORWARD-LOOKING STATEMENTS
The U.S. Securities and Exchange Commission encourages companies to disclose forward-looking information so that investors can better understand a company’s future prospects and make informed investment decisions. This annual report contains forward-looking statements.
Words and phrases such as “aim,” “anticipate,” “assume,” “believe,” “contemplate,” “continue,” “estimate,” “expect,” “future,” “goal,” “intend,” “may,” “objective,” “plan,” “positioned,” “predict,” “project,” “risk,” “seek to,” “shall,” “should,” “will likely result,” “will pursue” and words and terms of similar substance used in connection with any discussion of future operating or financial performance or our expectations, plans, projections or business prospects identify forward-looking statements. In particular, the statements under the headings “Item 3.D. Risk Factors,” “Item 4.B. Business Overview” and “Item 5. Operating and Financial Review and Prospects” regarding our financial condition and other future events or prospects are forward-looking statements. All forward-looking statements are management’s present expectations of future events and are subject to a number of factors and uncertainties that could cause actual results to differ materially from those described in the forward-looking statements.
In addition to the risks related to our business discussed under “Item 3.D. Risk Factors,” other factors could cause actual results to differ materially from those described in the forward-looking statements. These factors include, but are not limited to:
| • | our ability to successfully implement our strategy; |
| • | future levels of non-performing loans; |
| • | our growth and expansion; |
| • | the adequacy of allowances for credit and other losses; |
| • | technological changes; |
| • | interest rates; |
| • | investment income; |
| • | availability of funding and liquidity; |
| • | our exposure to market risks; and |
| • | adverse market and regulatory conditions. |
By their nature, certain disclosures relating to these and other risks are only estimates and could be materially different from what actually occurs in the future. As a result, actual future gains, losses or impact on our income or results of operations could materially differ from those that have been estimated. For example, revenues could decrease, costs could increase, capital costs could increase, capital investment could be delayed and anticipated improvements in performance might not be fully realized.
In addition, other factors that could cause actual results to differ materially from those estimated by the forward-looking statements contained in this annual report could include, but are not limited to:
| • | general economic and political conditions in Korea or other countries that have an impact on our business activities or investments; |
| • | the monetary and interest rate policies of Korea; |
| • | inflation or deflation; |
| • | unanticipated volatility in interest rates; |
| • | foreign exchange rates; |
| • | prices and yields of equity and debt securities; |
2
Table of Contents
| • | the performance of the financial markets in Korea and globally; |
| • | changes in domestic and foreign laws, regulations and taxes; |
| • | changes in competition and the pricing environment in Korea; and |
| • | regional or general changes in asset valuations. |
For further discussion of the factors that could cause actual results to differ, see the discussion under “Item 3.D. Risk Factors” contained in this annual report. We caution you not to place undue reliance on the forward-looking statements, which speak only as of the date of this annual report. Except as required by law, we are not under any obligation, and expressly disclaim any obligation, to update or alter any forward-looking statements, whether as a result of new information, future events or otherwise.
All subsequent forward-looking statements attributable to us or any person acting on our behalf are expressly qualified in their entirety by the cautionary statements contained or referred to in this annual report.
| Item 1. | IDENTITY OF DIRECTORS, SENIOR MANAGEMENT AND ADVISERS |
Not Applicable
| Item 2. | OFFER STATISTICS AND EXPECTED TIMETABLE |
Not Applicable
| Item 3. | KEY INFORMATION |
| Item 3.A. | [Reserved] |
| Item 3.B. | Capitalization and Indebtedness |
Not Applicable
| Item 3.C. | Reasons for the Offer and Use of Proceeds |
Not Applicable
| Item 3.D. | Risk Factors |
Risks relating to our corporate credit portfolio
The largest portion of our exposure is to small- and medium-sized enterprises, and financial difficulties experienced by companies in this segment may result in a deterioration of our asset quality and have an adverse impact on us.
Our loans to small- and medium-sized enterprises amounted to ₩112,696 billion, or 33.4% of our total loans, as of December 31, 2021, and ₩122,925 billion, or 35.6% of our total loans, as of December 31, 2022. As of December 31, 2022, Won-denominated loans to small- and medium-sized enterprises that were classified as substandard or below were ₩399 billion, representing 0.3% of such loans to those enterprises. See “Item 4.B. Business Overview—Corporate Banking—Small and Medium-Sized Enterprise Banking.” We recorded charge-offs of ₩117 billion in respect of our Won-denominated loans to small- and medium-sized enterprises in 2022, compared to charge-offs of ₩158 billion in 2021 and ₩219 billion in 2020. According to data compiled by the Financial Supervisory Service, the industry-wide delinquency ratios for Won-denominated loans to small- and medium-sized enterprises decreased in 2021 but increased in 2022, and was 0.32% as of December 31, 2022. The delinquency ratio for small- and medium-sized enterprises is calculated as the ratio of (1) the outstanding balance of such loans in respect of which either principal or interest payments are overdue by one month or more to (2) the aggregate outstanding balance of such loans. Our delinquency ratio for such loans denominated in Won was 0.3% as of December 31, 2021 and 0.3% as of December 31, 2022. Our delinquency ratio may increase in 2023 as a result of, among other things, adverse changes in economic conditions in Korea and globally. See
3
Table of Contents
“—Other risks relating to our business—Unfavorable changes in the global financial markets could adversely affect our results of operations and financial condition.” Accordingly, we may be required to take measures to decrease our exposures to these customers.
In light of the impact on the financial condition and liquidity position of small- and medium-sized enterprises in Korea as a result of the global financial crisis occurring in 2008, the Korean government introduced measures intended to encourage Korean banks to provide financial support to small- and medium-sized enterprise borrowers. For example, the Korean government requested that Korean banks, including Woori Bank, establish a “fast track” program to provide liquidity assistance to small- and medium-sized enterprises on an expedited basis. Under the “fast track” program established by Woori Bank, liquidity assistance is provided to small- and medium-sized enterprise borrowers applying for such assistance, in the form of new short-term loans or maturity extensions or interest rate adjustments with respect to existing loans, after expedited credit review and approval. The aggregate amount of outstanding small- and medium-sized enterprise loans made by us under the “fast track” program was ₩86 billion as of December 31, 2022, which represented 0.07% of our total small- and medium-sized enterprise loan portfolio as of such date. Furthermore, loans made by us under the “fast track” program are partially guaranteed by the Korean government’s public financial institutions, including the Korea Credit Guarantee Fund and the Korea Technology Finance Corporation.
The overall prospects for the Korean economy in 2023 and beyond remain uncertain, especially in light of the COVID-19 pandemic affecting many countries worldwide, including Korea, and the Korean government may extend or renew existing or past policies and initiatives or introduce new policies or initiatives to encourage Korean banks to provide financial support to small- and medium-sized enterprises. See “—Other risks relating to our business—The COVID-19 pandemic has adversely affected and may continue to adversely affect our business, financial condition or results of operations.” For example, the Financial Services Commission requested that 15 Korean banks, including Woori Bank, extend special low-rate loans to small merchants affected by the COVID-19 pandemic beginning in April 2020. Such Korean banks, including Woori Bank, provided new loans under such program until January 3, 2022. In addition, Korean financial regulatory authorities, including the Financial Services Commission and the Financial Supervisory Service, adopted guidelines for Korean banks to extend loan terms and defer interest payments with respect to small- and medium sized enterprises and small merchants affected by the COVID-19 pandemic starting from April 2020, but such measures ceased to be effective in September 2022. As of December 31, 2022, the aggregate amount of loans affected by such measures provided by the four major commercial Korean banks, including Woori Bank, Kookmin Bank, KEB Hana Bank and Shinhan Bank, was ₩36.8 trillion, of which ₩11.2 trillion was provided by Woori Bank. In October 2022, the Korean government also launched the New Start Fund, a debt adjustment program, under which pandemic-hit micro-enterprises and self-employed business owners can apply for debt adjustment, and once accepted, will be supported through customized debt adjustment plans according to their respective credit conditions and types of loans. Under the New Start Fund program, the Korean government may purchase the loan directly and then make adjustment, or if the relevant financial institution agrees, allow the relevant financial institution to restructure the loan directly. We believe that, to date, our participation in such government-led initiatives has not caused us to extend a material amount of credit that we would not have otherwise extended nor materially impacted our results of operations and financial condition in general. However, there can be no assurance that our future participation in such government-led initiatives would not lead us to extend credit to small- and medium-sized enterprise borrowers that we would not otherwise extend, or offer terms for such credit that we would not otherwise offer, in the absence of such initiatives. Furthermore, there is no guarantee that the financial condition and liquidity position of our small- and medium-sized enterprise borrowers benefiting from such initiatives will improve sufficiently for them to service their debt on a timely basis, or at all. Accordingly, increases in our exposure to small- and medium-sized enterprises resulting from such government-led initiatives may have a material adverse effect on our results of operations and financial condition.
On October 4, 2022, Woori Bank started to operate a deferment program similar to the “COVID-19 SME and Small Merchant Financial Support Program”, which had been established by the Korean government for small- and medium-sized enterprises and small merchants that have been negatively impacted by the COVID-19 pandemic. Under this deferment program, with respect to loans made to borrowers which have been adversely
4
Table of Contents
impacted by the COVID-19 pandemic (excluding loans related to the sale or lease of real property and loans made to borrowers engaged in certain unwholesome businesses), Woori Bank may extend their maturity date up until September 30, 2025, and may defer the borrowers’ payment obligation for the interests and principal of such loans up until September 2023.
Many small- and medium-sized enterprises represent sole proprietorships or very small businesses dependent on a relatively limited number of suppliers or customers and tend to be affected by fluctuations in the Korean and global economy to a greater extent than large corporate borrowers. In addition, small- and medium-sized enterprises often maintain less sophisticated financial records than large corporate borrowers. Therefore, it is generally more difficult for us to judge the level of risk inherent in lending to these enterprises, as compared to large corporations. However, in light of the COVID-19 pandemic, the Bank of Korea early implemented the Basel III final reforms in September 2020, which lowered the average risk weight of loans extended to small- and medium-sized enterprises with no credit rating from 100% to 85% in an effort to boost such lending.
In addition, many small- and medium-sized enterprises have close business relationships with large corporations in Korea, primarily as suppliers. Any difficulties encountered by those large corporations would likely harm the liquidity and financial condition of related small- and medium-sized enterprises, including those to which we have exposure, also resulting in an impairment of their ability to repay loans.
Financial difficulties experienced by small- and medium-sized enterprises as a result of, among other things, adverse changes in domestic and global economic conditions, could have an adverse impact on the ability of small- and medium-sized enterprises to make payments on their loans. For example, the COVID-19 pandemic has had a significant adverse impact on the Korean and global economy, including disruptions in supply chains, declines in the sales and deterioration in the financial conditions of small- and medium-sized enterprises. See “—Other risks relating to our business—The COVID-19 pandemic has adversely affected and may continue to adversely affect our business, financial condition or results of operations.” In addition, aggressive marketing and competition among banks to lend to this segment may lead to a deterioration in the asset quality of our loans to this segment in the future. Any such deterioration would result in increased charge-offs, higher provisioning and reduced interest and fee income from this segment, which would have an adverse impact on our financial condition and results of operations.
We have exposure to companies in certain troubled industries, and financial difficulties of these companies may adversely impact us.
As of December 31, 2022, the total amount of loans provided by us to construction, shipbuilding and shipping companies in Korea amounted to ₩6,022 billion, ₩253 billion and ₩193 billion, or 1.7%, 0.1% and 0.1% of our total loans, respectively. We also have other exposures to Korean construction, shipbuilding and shipping companies, including in the form of guarantees extended for the benefit of such companies and debt and equity securities of such companies held by us. In the case of construction companies, we have potential exposure in the form of guarantees provided to us by general contractors with respect to financing extended by us for residential and commercial real estate development projects, as well as commitments to purchase asset-backed securities secured by the assets of companies in the construction industry and other commitments we enter into relating to project financing for such real estate projects which may effectively function as guarantees. In the case of shipbuilding companies, such exposures include refund guarantees extended by us on behalf of shipbuilding companies to cover their obligation to return a portion of the ship order contract amount to customers in the event of performance delays or defaults under shipbuilding contracts.
The construction industry in Korea has undergone significant fluctuations in recent years. Following a period of growth from 2015 to 2018, the construction industry had stagnated from 2019 to 2020, caused mainly by the uncertainty resulting from the Korean government’s strengthening of mortgage and other lending regulations to control the rising real property prices. After a brief period of recovery in 2021, the construction industry has again experienced a downturn starting in 2022, caused by the rise in interest rates and the resulting decline in demand for residential property throughout Korea, as well as drastic changes in the price and availability of construction materials due to disruptions in global supply chains caused by the ongoing
5
Table of Contents
invasion of Ukraine by Russia. While the shipbuilding industry has experienced rapid growth in recent years led by an increase in global demand for liquefied natural gas carriers resulting from stronger environmental regulations and global energy security concerns, the prospects for this industry currently remain uncertain given the slowdown in the global economy and a rise in shipbuilding costs and resulting prices. In the case of shipping companies in Korea, the COVID-19 pandemic and the ensuing global lockdown caused a severe downturn in the industry in 2020. Although the industry subsequently showed signs of recovery from the pandemic as the levels of consumer spending and global trade began to rise, the industry currently faces difficulties, among others arising from a deteriorating global economy and disruptions in the global supply chain due to port congestions and the continuing COVID-19 lockdowns in China.
In addition, we have significant exposures to companies in the hotel, leisure and transportation industries, which have been adversely impacted by the COVID-19 pandemic. As of December 31, 2022, the total amount of loans provided by us to companies in the hotel, leisure and transportation industries amounted to an aggregate ₩11,244 billion, or 3.3% of our total loans. While the business activities, results of operations and financial condition of companies in such industries may recover as the impact of the pandemic decreases, the timeline for such recovery remains uncertain, and we may be required to record substantial additional allowances relating to such companies.
The allowance for credit losses that we have established against our credit exposures to companies in the Korean construction, shipbuilding and shipping industries as well as the hotel, leisure and transportation industries may not be sufficient to cover all future losses arising from these and other exposures. If the credit quality of our exposures to such companies declines further, we may incur substantial additional provisions for credit loss, which could adversely impact our results of operations and financial condition. Furthermore, although a portion of our loans to companies in the construction, shipbuilding and shipping industries as well as the hotel, leisure and transportation industries are secured by collateral, such collateral may not be sufficient to cover uncollectible amounts in respect of such loans.
A large portion of our exposure is concentrated in a relatively small number of large corporate borrowers, which increases the risk of our corporate credit portfolio.
As of December 31, 2022, our 20 largest exposures to corporate borrowers (including loans, debt and equity securities, credit-related commitments and other exposures) totaled ₩66,929 billion, which represented 12.1% of our total exposures. As of that date, our single largest corporate exposure was to Korea Development Bank, to which we had outstanding credits in the form of debt securities of ₩14,123 billion and loans in Won of ₩165 billion, representing 2.6% of our total exposures in the aggregate. Aside from exposure to the Korean government and government-related agencies, our next largest exposure was to Kookmin Bank, to which we had outstanding exposure of ₩1,028 billion representing 0.2% of our total exposures. Any deterioration in the financial condition of our large corporate borrowers, including those in industries particularly affected by the COVID-19 pandemic or to which we have significant exposures such as the hotel, leisure and transportation industries, the retail and wholesale industries and the manufacturing industry, may require us to record substantial additional allowances and may have a material adverse impact on our results of operations and financial condition.
We have exposure to the largest Korean commercial conglomerates, known as “chaebols,” and, as a result, financial difficulties of chaebols may have an adverse impact on us.
Of our 20 largest corporate exposures as of December 31, 2022, 3 were to companies that were members of the 40 largest chaebols in Korea. As of that date, the total amount of our exposures to these chaebols was ₩21,622 billion, or 3.9% of our total exposures. If the credit quality of our exposures to chaebols declines as a result of financial difficulties they experience or for other reasons, we could incur additional provisions for credit loss, which would adversely impact our results of operations and financial condition. See “Item 4.B. Business Overview—Assets and Liabilities—Loan Portfolio—Exposure to Chaebols.”
6
Table of Contents
The allowances we have established against these exposures may not be sufficient to cover all future losses arising from these exposures. In addition, in the case of any of these companies that are currently in or in the future may enter into workout, restructuring, reorganization or liquidation proceedings, our recoveries from those companies may be limited. We may, therefore, experience future losses with respect to these exposures.
We have exposure to companies that are currently or may in the future be put in restructuring and may suffer losses as a result of additional provisions for credit loss required or the adoption of restructuring plans with which we do not agree.
As of December 31, 2022, our credit exposures to companies that were in workout or corporate restructuring amounted to ₩186 billion or 0.03% of our total credit exposures, of which ₩127 billion or 68.3% was classified as substandard or below and substantially all of which was classified as impaired. As of the same date, our allowance for credit losses on these credit exposures amounted to ₩65 billion, or 34.9% of these exposures. These allowances may not be sufficient to cover all future losses arising from our credit exposure to these companies. Furthermore, we have other exposure to such companies in the form of debt and equity securities of such companies held by us (including equity securities we acquired as a result of debt-to-equity conversions). Including such securities, our exposures as of December 31, 2022 to companies in workout or restructuring amounted to ₩186 billion, or 0.03% of our total exposures. Our exposures to such companies may also increase in the future, including as a result of adverse conditions in the Korean economy. In addition, in the case of borrowers that are or become subject to workout, we may be forced to restructure our credits pursuant to restructuring plans approved by other creditor financial institutions of the borrower, or to dispose of our credits to other creditors on unfavorable terms, which may adversely affect our results of operations and financial condition.
Risks relating to our consumer credit portfolio
We may experience increases in delinquencies in our consumer loan and credit card portfolios.
In recent years, consumer debt has increased rapidly in Korea. Our portfolio of consumer loans amounted to ₩148,361 billion as of December 31, 2021 and ₩143,940 billion as of December 31, 2022. Our credit card portfolio amounted to ₩9,757 billion as of December 31, 2021 and ₩10,370 billion as of December 31, 2022. As of December 31, 2022, our consumer loans and credit card receivables represented 41.7% and 3.0% of our total lending, respectively. See “Item 4.B. Business Overview—Consumer Banking—Lending Activities” and “Item 4.B. Business Overview—Credit Cards—Products and Services.”
The growth in our consumer loan portfolio in recent years, together with adverse changes in economic conditions in Korea and globally, may lead to increasing delinquencies and a deterioration in asset quality. The amount of our consumer loans classified as substandard or below was ₩354 billion (or 0.2% of our consumer loan portfolio) as of December 31, 2021 and ₩392 billion as of December 31, 2022 (or 0.3% of our consumer loan portfolio). We charged off consumer loans amounting to ₩161 billion in 2022, as compared to ₩173 billion in 2021 and ₩182 billion in 2020, and recorded provisions for credit loss in respect of consumer loans of ₩206 billion in 2022, as compared to ₩168 billion in 2021 and ₩131 billion in 2020. Within our consumer loan portfolio, the outstanding balance of general purpose household loans, which, unlike mortgage or home equity loans, are often unsecured and therefore tend to carry a higher credit risk, amounted to ₩32,003 billion, or 21.6% of our total outstanding consumer loans, as of December 31, 2021 and ₩28,694 billion, or 19.9% of our total outstanding consumer loans, as of December 31, 2022.
In our credit card segment, outstanding balances overdue by more than one month amounted to ₩79 billion, or 0.8% of our credit card receivables, as of December 31, 2021 and ₩143 billion, or 1.4% of our credit card receivables, as of December 31, 2022. In line with industry practice, we have restructured a portion of our delinquent credit card account balances as loans. As of December 31, 2022, these restructured loans amounted to ₩134 billion, or 1.3% of our credit card balances. Because these restructured loans are not initially recorded as being delinquent, our delinquency ratios do not fully reflect all delinquent amounts relating to our credit card balances. Including all restructured loans, outstanding balances overdue by more than one month accounted
7
Table of Contents
for 2.6% of our credit card balances as of December 31, 2022. We charged off credit card balances amounting to ₩220 billion in 2022, as compared to ₩220 billion in 2021 and ₩246 billion in 2020, and recorded provisions for credit loss in respect of credit card balances of ₩222 billion in 2022, as compared to ₩177 billion in 2021 and ₩188 billion in 2020. Delinquencies may increase in the future as a result of, among other things, adverse economic conditions in Korea, additional government regulation or the inability of Korean consumers to manage increased household debt.
A deterioration of the asset quality of our consumer loan and credit card portfolios would require us to record increased provisions for credit loss and charge-offs and adversely affect our financial condition and results of operations. In addition, our large exposure to consumer loans means that we are exposed to changes in economic conditions affecting Korean consumers. Accordingly, economic difficulties in Korea that harm those consumers could result in further deterioration in the credit quality of our consumer loan and credit card portfolios. For example, the severe impact of the COVID-19 pandemic on Korea’s economy may disrupt the business, activities and operations of our consumers, which in turn could result in a significant decrease in the number of financial transactions or the inability of our consumers to meet existing payment or other obligations to us. In addition, a rise in unemployment or an increase in interest rates in Korea could adversely affect the ability of consumers to make payments and increase the likelihood of potential defaults. See “Risks relating to Korea—Unfavorable financial and economic developments in Korea may have an adverse effect on us.”
In addition, we are exposed to changes in regulations and policies on consumer lending by the Korean government, which may adopt measures to restrict consumer lending or encourage financial institutions to provide financial support to certain types of retail borrowers. In 2014 and 2015, the Korean government implemented several measures to encourage consumer spending and revive the housing market in Korea, including loosening regulations on mortgage lending, which contributed to an increase in our portfolio of consumer loans. However, the Korean government introduced various measures from the second half of 2016 to 2021 to tighten regulations on mortgage and other lending and housing subscription in response to the rapid growth in consumer debt and concerns over speculative investments in real estate in certain areas. Although the Korean government has since begun to reverse some of these measures by introducing a number of policy measures that seek to sustain housing prices and activity levels in the Korean real estate market over the course of 2022, the impact of such policy measures are not yet clear. A decrease in housing prices, together with the high level of consumer debt and rising interest rate levels, could result in declines in consumer spending and reduced economic growth, which may lead to increases in delinquency levels of our consumer loan and credit card portfolios.
Under a pre-workout program established by Korean banks for retail borrowers with outstanding short-term debt, including Woori Bank, which has been in operation since April 2009, maturity extensions and/or interest reductions are provided to retail borrowers with total loans of ₩1.5 billion or less (consisting of no more than ₩500 million of unsecured loans and ₩1 billion of secured loans) who are in arrears on their payments for more than 30 days but less than 90 days or for retail borrowers with an annual income of ₩40 million or less who have been in arrears on their payments for 30 days or more on an aggregate basis for the 12 months prior to their application, among others. The aggregate amount of consumer credit (including credit card receivables) we provided which became subject to the pre-workout program in 2022 was ₩53 billion. While we believe that our operation of the pre-workout program has not had a material impact on the overall credit quality of our consumer loan and credit card portfolios to date, our participation in such government-led initiatives to provide financial support to retail borrowers may lead us to offer credit terms for such borrowers that we would not otherwise offer in the absence of such initiatives, which may have an adverse effect on our results of operations and financial condition.
A decline in the value of the collateral securing our consumer loans and our inability to realize full collateral value may adversely affect our consumer credit portfolio.
A substantial portion of our consumer loans is secured by real estate, the values of which have fluctuated significantly in recent years. Although it is our general policy to lend up to 70% of the appraised value of collateral (except in certain regulated areas designated by the government where we generally limit our lending
8
Table of Contents
to 50% of the appraised value of collateral, and for first-time homebuyers, we may lend up to 80% of the appraised value of collateral) and to periodically re-appraise our collateral, a downturn in the real estate markets in Korea may result in a decline in the value of the collateral securing our mortgage and home equity loans. If collateral values decline in the future, they may not be sufficient to cover uncollectible amounts in respect of secured loans extended by us. Any declines in the value of the real estate or other collateral securing our consumer loans, or our inability to obtain additional collateral in the event of such declines, could result in a deterioration in our asset quality and may require us to record additional allowances for credit losses.
In Korea, foreclosure on collateral generally requires a written petition to a court. An application, when made, may be subject to delays and administrative requirements that may decrease the value of such collateral. We cannot guarantee that we will be able to realize the full value on our collateral as a result of, among other factors, delays in foreclosure proceedings and defects in the perfection of our security interest in collateral. Our failure to recover the expected value of collateral could expose us to potential losses.
Risks relating to our financial holding company structure and strategy
We may not succeed in implementing our strategy to take advantage of, or fail to realize the anticipated benefits of, our financial holding company structure.
We were established as a new financial holding company in January 2019 pursuant to a “comprehensive stock transfer” under Korean law, following the completion of which Woori Bank, Woori FIS Co., Ltd., Woori Finance Research Institute Co., Ltd., Woori Credit Information Co., Ltd., Woori Fund Services Co., Ltd. and Woori Private Equity Asset Management Co., Ltd. became our wholly-owned subsidiaries. See “Item 4A. History and Development of the Company—Establishment of Woori Financial Group.”
One of our principal strategies is to take advantage of our financial holding company structure to become a comprehensive financial services provider capable of developing and cross-selling a diverse range of products and services to our large existing base of retail and corporate banking customers. An intended benefit of our financial holding company structure is that it enhances our ability to engage in mergers and acquisitions which we may decide to pursue as part of our strategy. Accordingly, we may consider acquiring or merging with other financial institutions, particularly in the non-banking sector, to achieve more balanced growth and further diversify our revenue base. We may also continue to seek opportunities to expand our operations in markets outside Korea. See “Item 4.B. Business Overview—Strategy” and “—We may not be able to successfully execute our overseas expansion strategy.”
The integration of companies we may acquire or merge with in the future under our financial holding company structure could require a significant amount of time, financial resources and management attention. Moreover, that process could place a burden on our operations (including our risk management operations) or information technology systems, reduce employee morale, produce unintended inconsistencies in our standards, controls, procedures or policies, and affect our relationships with customers and our ability to retain key personnel. The realization of the anticipated benefits of our financial holding company structure may be blocked, delayed or reduced as a result of many factors, some of which may be outside our control. These factors include:
| • | competition from other financial institutions, as well as private equity firms and other potential acquirers, in Korea and elsewhere in terms of identifying and winning bids for attractive merger and acquisition targets in the financial industry, including the non-banking sector, which may make it challenging for us to successfully acquire, or which may require us to pay a high acquisition price for, such targets; |
| • | difficulties in integrating the diverse activities and operations of our subsidiaries or any companies we may acquire, including risk management operations and information technology systems, personnel, policies and procedures; |
| • | difficulties in reorganizing or reducing overlapping personnel, branches, networks and administrative functions; |
9
Table of Contents
| • | restrictions under the Financial Holding Company Act and other regulations on transactions between a financial holding company and, or among, its subsidiaries; |
| • | failure to leverage our financial holding company structure to realize operational efficiencies and to cross-sell multiple products and services; |
| • | unforeseen contingent risks, including lack of required capital resources, increased tax liabilities or restrictions in our overseas operations, relating to our financial holding company structure; |
| • | unexpected business disruptions; |
| • | failure to attract, develop and retain personnel with necessary expertise; |
| • | loss of customers; and |
| • | labor unrest. |
Accordingly, we may not be able to realize the anticipated benefits of our financial holding company structure, and our business, results of operations and financial condition may suffer as a result.
We depend on limited forms of funding to fund our operations at the holding company level.
We are a financial holding company with no significant assets other than the shares of our subsidiaries. Our primary sources of funding and liquidity are dividends from our subsidiaries, sales of interests in our subsidiaries and direct borrowings and issuances of equity or debt securities at the holding company level. In addition, as a financial holding company, we are required to meet certain minimum financial ratios under Korean law, including with respect to liquidity and capital adequacy. Our ability to meet our obligations to our direct creditors and employees and our other liquidity needs and regulatory requirements at the holding company level depends on timely and adequate distributions from our subsidiaries and our ability to sell our securities or obtain credit from our lenders.
The ability of our subsidiaries to pay dividends to us depends on their financial condition and operating results. In the future, our subsidiaries may enter into agreements, such as credit agreements with lenders or indentures relating to high-yield or subordinated debt instruments, that impose restrictions on their ability to make distributions to us, and the terms of future obligations and the operation of Korean law could prevent our subsidiaries from making sufficient distributions to us to allow us to make payments on our outstanding obligations. See “—As a financial holding company, we largely depend on receiving dividends from our subsidiaries to pay dividends on our common stock.” Any delay in receipt of or shortfall in payments to us from our subsidiaries could result in our inability to meet our liquidity needs and regulatory requirements, including minimum liquidity and capital adequacy ratios, which may disrupt our operations at the holding company level.
In addition, our creditors will generally not be able to assert claims on the assets of our subsidiaries. Furthermore, our inability to sell our securities or obtain funds from our lenders on favorable terms, or at all, could also result in our inability to meet our liquidity needs and regulatory requirements and may disrupt our operations at the holding company level.
As a financial holding company, we largely depend on receiving dividends from our subsidiaries to pay dividends on our common stock.
Since our principal assets at the holding company level are the shares of our subsidiaries, our ability to pay dividends on our common stock largely depends on dividend payments from those subsidiaries. Those dividend payments are subject to the Korean Commercial Code, the Bank Act and regulatory limitations, generally based on capital levels and retained earnings, imposed by the various regulatory agencies with authority over those entities. The ability of our subsidiaries to pay dividends may be subject to regulatory restrictions to the extent that paying dividends would impair their respective non-consolidated profitability, financial condition or other cash flow needs. For example:
| • | under the Korean Commercial Code, dividends may only be paid out of distributable income, an amount which is calculated by subtracting the aggregate amount of a company’s paid-in capital and certain |
10
Table of Contents
| mandatory legal reserves as well as certain unrealized profits from its net assets, in each case as of the end of the prior fiscal period; |
| • | under the Bank Act, a bank also must credit at least 10% of its net profit to a legal reserve each time it pays dividends on distributable income until that reserve equals the amount of its total paid-in capital; and |
| • | under the Bank Act and the requirements of the Financial Services Commission, if a bank fails to meet its required capital adequacy ratio or otherwise becomes subject to management improvement measures imposed by the Financial Services Commission, then the Financial Services Commission may restrict the declaration and payment of dividends by that bank. |
Our subsidiaries may not continue to meet the applicable legal and regulatory requirements for the payment of dividends in the future. If they fail to do so, they may stop paying or reduce the amount of the dividends they pay to us, which would have an adverse effect on our ability to pay dividends on our common stock.
The implementation of the Korean government’s privatization plan may have an adverse effect on us and your interests as a shareholder.
In June 2013, the Korean government, through the Public Funds Oversight Committee of the Financial Services Commission, announced an updated plan to privatize Woori Finance Holdings, Woori Bank’s former parent company, and its former subsidiaries. The privatization plan provided for the segregation of such entities into three groups and the disposal of the Korean government’s interest in these entities held through the Korea Deposit Insurance Corporation, or the KDIC, in a series of transactions, most of which have been completed. Such transactions included the following:
| • | Kwangju Bank and Kyongnam Bank. In May 2014, Woori Finance Holdings established KJB Financial Group and KNB Financial Group through a spin-off of its businesses related to the holding of the shares and thereby controlling the business operations of Kwangju Bank and Kyongnam Bank, respectively. As a result of such spin-off, KJB Financial Group became the owner of the shares of Kwangju Bank previously held by Woori Finance Holdings and KNB Financial Group became the owner of the shares of Kyongnam Bank previously held by Woori Finance Holdings. Woori Finance Holdings no longer owned any shares of Kwangju Bank or Kyongnam Bank, and neither they nor their new holding companies were its subsidiaries, after the spin-off. Following such spin-off, each of these banks was merged with its holding company, and in October 2014, the KDIC sold its 56.97% ownership interest in Kwangju Bank and Kyongnam Bank to JB Financial Group and BNK Financial Group (formerly known as BS Financial Group), respectively. |
| • | Woori Investment & Securities and Other Subsidiaries. In March 2014, Woori Finance Holdings sold its 52.0% ownership interest in Woori Financial to KB Financial Group. In May 2014, Woori Finance Holdings sold its 100.0% ownership interest in Woori Asset Management to Kiwoom Securities and sold its 100.0% ownership interest in Woori F&I to Daishin Securities. In June 2014, Woori Finance Holdings sold its 37.9% ownership interest in Woori Investment & Securities, its 51.6% ownership interest in Woori Aviva Life Insurance and its 100.0% ownership interest in Woori FG Savings Bank to NongHyup Financial Group in a collective sale. As a result of such sales, Woori Investment & Securities, Woori Asset Management, Woori Aviva Life Insurance, Woori FG Savings Bank, Woori F&I and Woori Financial were no longer subsidiaries of Woori Finance Holdings, and it no longer owned any shares in such former subsidiaries. |
| • | Woori Bank. In November 2014, Woori Finance Holdings merged with and into Woori Bank. As a result of the merger, the other former subsidiaries of Woori Finance Holdings, including Woori Card, Woori Private Equity, Woori FIS, Woori Investment Bank and Woori Finance Research Institute, became Woori Bank’s subsidiaries. In December 2014, the KDIC sold 40,143,022 shares of Woori Bank’s common stock (representing 5.9% of its outstanding common stock) through a bidding process in Korea. In addition, in December 2016 and January 2017, the KDIC sold an aggregate of 200,685,395 |
11
Table of Contents
| shares of Woori Bank’s common stock (representing 29.7% of its outstanding common stock) in stakes ranging from 3.7% to 6.0% to seven financial companies through a bidding process. In 2017, pursuant to a series of transactions related to call options previously granted in connection with the KDIC’s sale of Woori Bank’s common stock in December 2014, the KDIC sold an aggregate of 19,852,364 shares of Woori Bank’s common stock (representing 2.9% of its outstanding common stock). As a result of such transactions, the KDIC’s ownership interest in Woori Bank was reduced to 18.4%. |
| • | Woori Financial Group. In connection with our establishment in January 2019 as a new financial holding company pursuant to a “comprehensive stock transfer” under Korean law, the KDIC received 124,604,797 shares of our outstanding common stock in exchange for the common stock of Woori Bank it owned. In June 2019, the Financial Services Commission approved the KDIC’s plan to sell all such common stock in multiple transactions by 2022. In April 2021, pursuant to this plan, the KDIC sold an aggregate of 14,445,354 shares of our common stock (representing 2.0% of our outstanding common stock) in a block trade. In December 2021, the KDIC sold an aggregate 9.3% of our outstanding common stock in stakes ranging from 1.0% to 4.0% to four companies and 1.0% to our employee stock ownership association. In February 2022, the KDIC sold an aggregate of 15,860,000 shares of our common stock (representing 2.2% of our outstanding common stock) in a block trade. The KDIC further sold an aggregate of 17,000,000 shares, or 2.3%, of Woori Financial Group’s outstanding common stock in a block trade in May 2022. As a result of such transactions, the KDIC currently owns 1.3% of our outstanding common stock. |
See “Item 4.A. History and Development of the Company—Privatization Plan.”
The implementation of the Korean government’s privatization plan, including the expected sale of the KDIC’s remaining ownership interest in us to third parties, may have an adverse effect on us and your interest as a shareholder. Although the KDIC has already disposed of most of its ownership interest in us, the KDIC’s sale of its remaining interest to third parties may affect our business, management, strategy, capital structure and assets and liabilities and lead to diversion of management attention, a loss of customers and labor unrest. There is also no guarantee that prior sales by KDIC of its ownership interest in us will not result in unintended adverse tax consequences for us and our subsidiaries, as well as our shareholders. See “—Risks relating to our common stock and ADSs—Prior sales by the KDIC of shares of our common stock may result in adverse Korean tax consequences for you.” Accordingly, the implementation of the privatization plan may have a material adverse effect on the trading price of our common stock and American depositary shares, or ADSs, and your interests as a shareholder.
We may not be able to successfully execute our overseas expansion strategy.
As part of our business strategy, we have been seeking opportunities to expand our operations in markets outside Korea, including through the opening of additional overseas branches and offices as well as strategic acquisitions and investments, particularly in South and Southeast Asia. For example, Woori Bank expanded its network of branches to India, where it established branches in Chennai, Gurgaon and Mumbai from 2012 to 2017. In October 2016, Woori Bank acquired a 51% equity interest in Wealth Development Bank, a thrift bank in the Philippines. In November 2016, Woori Bank obtained a banking license to establish a local subsidiary in Vietnam, Woori Bank Vietnam, which commenced operations in January 2017 and currently operates 20 branches throughout the country. In June 2018, Woori Bank acquired VisionFund (Cambodia) Ltd., a microfinance deposit-taking institution in Cambodia, and renamed it WB Finance Co., Ltd. In February 2020, WB Finance Co., Ltd. merged with Woori Finance (Cambodia) Plc., a Cambodian microfinance institution, and in November 2021, it obtained a commercial banking license from the Cambodian financial authorities and began its nationwide operations as Woori Bank (Cambodia) PLC. Notwithstanding the foregoing, the expansion of our operations abroad may be difficult due to the presence of established competitors in the relevant local markets. In addition, overseas expansion and the management of international operations may require significant financial expenditures as well as management attention, and will subject us to the challenges of operating in an unfamiliar business environment with different regulatory, legal and taxation systems and political, economic and social
12
Table of Contents
risks. Accordingly, there is no guarantee that we will be successful in executing our overseas expansion strategy. The failure of our overseas expansion strategy could have an adverse impact on our business, results of operations and financial condition.
We may not generate sufficient additional fees to achieve our revenue diversification strategy.
An important element of our overall strategy is increasing our fee income in order to diversify our revenue base. Historically, our primary source of revenues has been net interest income from our banking operations at Woori Bank. Our current sources of fee income include our investment banking, asset management, assets trustee, currency transfers and lending businesses. However, to date, except for fees collected in connection with certain of our services including investment banking, asset management and currency transfers (including foreign exchange-related commissions), we have not generated substantial fee income. We intend to continue to develop new sources of fee income as part of our business strategy, including through our current investment banking, asset management, assets trustee and lending businesses, as well as through merger with or acquisition of non-banking businesses which we may decide to pursue. For example, in March 2023, we acquired a 52% equity interest as well as the management rights in Daol Investment, which is a venture capital company with ₩1.4 trillion of assets under its management. See “Item 4.B. Business Overview—Strategy.” However we may not be successful in our efforts to develop new sources of fee income, and the new sources of fee income we have developed may not generate sufficient additional fees to achieve our revenue diversification strategy. Although we, like many other Korean financial institutions, have begun to charge fees to our customers more regularly, customers may prove unwilling to pay additional fees, even in exchange for more attractive value-added services, and their reluctance to do so would adversely affect the implementation of our strategy to increase our fee income. Furthermore, the fees that we charge to customers are subject to regulation by Korean financial regulatory authorities, which may seek to implement regulations or measures that may have an adverse impact on our ability to achieve this aspect of our strategy.
Risks relating to competition
Competition in the Korean financial industry is intense, and we may lose market share and experience declining margins as a result.
Competition in the Korean financial market has been and is likely to remain intense. Some of the financial institutions that we compete with are larger in terms of asset size and customer base and have longer operating histories as financial holding companies, greater financial resources or more specialized capabilities than us and our subsidiaries. In addition, in the area of our core banking operations, most Korean banks have been focusing on retail customers and small- and medium-sized enterprises in recent years, although they have begun to generally increase their exposure to large corporate borrowers, and have been focusing on developing fee income businesses as increasingly important sources of revenue. In the area of credit cards, increased competition in the payments market and the resulting increase in our marketing activities, as well as the general trend towards lower merchant fees, are adversely affecting profits in the segment. In our new capital segment, our profitability may be adversely affected by increasing competition in the automobile finance and lease finance markets. The competition and market saturation resulting from this common focus may make it more difficult for us to secure retail, small- and medium-sized enterprise and large corporate customers with the credit quality and on credit terms necessary to maintain or increase our income and profitability.
In addition, the introduction of Internet-only banks in Korea is expected to increase competition in the Korean banking industry. Internet-only banks generally operate without branches and conduct most of their operations through electronic means, which enable them to minimize costs and offer customers higher interest rates on deposits or lower lending rates. In April 2017, Kbank, the first Internet-only bank in Korea, in which Woori Bank owns 12.6% of the equity with voting rights as of December 31, 2022, commenced operations. Kakao Bank and Toss Bank, both mobile-only banks, commenced operations in July 2017 and October 2021, respectively.
13
Table of Contents
Furthermore, the following general regulatory reforms in the Korean financial industry have increased competition among banks and other financial institutions in Korea:
| • | In the second half of 2015, the Korean government implemented measures to facilitate bank account portability of retail customers by requiring commercial banks to establish systems that allow retail customers to easily switch their bank accounts at one commercial bank to another and automatically transfer the automatic payment settings of their former accounts to the new ones. |
| • | In March 2016, the Financial Services Commission introduced an individual savings account scheme in Korea, which enables individuals to efficiently manage a wide range of retail investment vehicles, including cash deposits, investment funds and securities investment products, from a single integrated account with one financial institution and offers tax benefits on investment returns. Since the scheme backed by the Korean government allows only one individual savings account per person, financial institutions have been competing to retain existing customers and attract new customers since the launch of the individual savings account scheme. Over 30 financial institutions, including banks, securities companies and insurance companies, have registered with the Financial Services Commission to sell their individual savings account products, and we expect fierce competition among these institutions. |
| • | In April 2019, the Financial Services Commission approved and is currently conducting test procedures for a financial regulatory sandbox, a framework set up to allow financial services providers to test new business models in a less regulated environment, as part of its efforts to work closely with the fintech sector and provide support to facilitate its development. A variety of financial services have been similarly approved for such testing under the financial regulatory sandbox. |
| • | In December 2019, the Financial Services Commission launched an “open banking” system, which allows customers to view banking account information and make wire transfers, regardless of institution, through a single mobile application. This integrated system is expected to allow fintech firms to share payment networks with banks, thereby lowering transaction fees and encouraging the development of new payment services. |
| • | In August 2020, amendments to the Credit Information Use and Protection Act established the framework for MyData services in Korea, which allow the collection of customers’ personal credit information from credit information providers/users or public institutions upon the customer’s request and subject to compliance requirements, so that customers may access such collected personal credit information in whole or in part. In January 2021, the Financial Services Commission granted licenses to 28 companies to operate as MyData service providers, 14 of which were fintech firms. Competition between traditional financial institutions and fintech firms is expected to intensify, particularly with respect to the relevant asset management services. As of December 31, 2022, 64 companies, including 23 fintech companies, have been granted a MyData license. MyData services are currently offered through Woori WON Banking, Woori Bank’s main mobile banking application, as well as through Woori Card’s mobile application. |
| • | In March 2023, the Financial Services Commission and the Financial Supervisory Service jointly hosted the initial working group meeting of a task force committed to improving the management and operating practices of banks and banking system. One of the goals of the task force is to promoting competition in the banking sector. During the initial working group meeting, authorities discussed ways to allow entry of new banks and boost competition between banks and nonbanks. These measures under discussion include, without limitation, (1) introducing small licensing units and small-scale specialized banks, (2) allowing entry of additional internet-only banks, regional banks and nation-wide banks, (3) converting mutual savings banks into regional banks and regional banks into nation-wide banks, (4) allowing credit card companies to provide comprehensive payment settlement services, (5) allowing securities firms to provide payment settlement services to corporate entities, (6) permitting insurance companies to concurrently operate payment settlement services, (7) expanding banks’ loans to small and medium-sized enterprises and small-loans to lower-income groups, and (8) extending nonbanks’ scope of services in handling policy fund loans and policy mortgages. The task force has held and will hold |
14
Table of Contents
| future working group meetings to discuss these issues and we expect that they will develop specific measures to increase competition in the banking sector in the near future. In addition, in February 2023, the Korea Fair Trade Commission conducted on-site examinations of the major banks, including us, to determine whether the banks have engaged in unfair trade practices. |
Overall, we expect that such measures may not only intensify competition among traditional financial institutions in Korea, but also allow new market participants such as fintech firms to potentially gain market share in certain areas in which we operate.
The Korean financial industry is undergoing significant consolidation through which the number of nationwide commercial banks in Korea has significantly decreased since the financial crisis in Korea in the late 1990s. A number of significant mergers and acquisitions in the financial industry have also taken place in Korea in recent years, including the merger of Hana Bank into Korea Exchange Bank in 2015, KB Financial Group’s acquisition of Hyundai Securities Co., Ltd. in 2016 and the subsequent merger of Hyundai Securities with and into KB Investment & Securities Co., Ltd. in 2016. In 2016, Mirae Asset Securities Co., Ltd. acquired a 43% interest in KDB Daewoo Securities Co., Ltd., and subsequently merged with and into Mirae Asset Securities. In 2014, pursuant to the implementation of the Korean government’s privatization plan with respect to Woori Finance Holdings and its former subsidiaries, Woori Financial, Woori Asset Management and Woori F&I were acquired by KB Financial Group, Kiwoom Securities and Daishin Securities, respectively, and Woori Investment & Securities, Woori Aviva Life Insurance and Woori FG Savings Bank were acquired by NongHyup Financial Group. In addition, in October 2014, the KDIC’s ownership interest in Kwangju Bank and Kyongnam Bank were acquired by JB Financial Group and BNK Financial Group (formerly known as BS Financial Group), respectively. See “Item 4.A. History and Development of the Company—Privatization Plan.” In 2020, Hana Financial Group acquired The-K Non-Life Insurance Co., Ltd. to form Hana Insurance Co., Ltd. Orange Life Insurance, Ltd. (formerly known as ING Life Insurance Korea, Ltd.) became a wholly-owned subsidiary of Shinhan Financial Group following the acquisition of equity interests by Shinhan Financial Group in February 2019 and January 2020, which subsequently merged with and into Shinhan Life Insurance Co., Ltd. in July 2021. In 2020, Shinhan Financial Group acquired the venture capital firm Neoplux. In January 2022, Shinhan Financial Group’s subsidiary, Shinhan Asset Management Co., Ltd., merged with Shinhan Alternative Investment Management Inc. In July 2022, Shinhan Financial Group acquired BNP Paribas Cardif General Insurance, and established Shinhan EZ General Insurance. In 2020, KB Financial Group acquired The Prudential Life Insurance Company of Korea Ltd., which merged with KB Life Insurance in January 2023, with the surviving entity’s name changed to KB Life Insurance Co., Ltd.
We expect that consolidation in the Korean financial industry will continue. Other financial institutions may seek to acquire or merge with other entities, and the financial institutions resulting from such consolidation may, by virtue of their increased size and business scope, provide significantly greater competition for us. We also believe that foreign financial institutions, many of which have greater experience and resources than we do, may seek to compete with us in providing financial products and services either by themselves or in partnership with existing Korean financial institutions. Increased competition and continuing consolidation may lead to decreased margins, resulting in a material adverse impact on our future profitability. Accordingly, our results of operations and financial condition may suffer as a result of increasing competition in the Korean financial industry.
Competition for customer deposits may increase, resulting in a loss of our deposit customers or an increase in our funding costs.
In recent years, we have faced increasing pricing pressure on deposit products from our competitors. If we do not continue to offer competitive interest rates to our deposit customers, we may lose their business. In addition, even if we are able to match our competitors’ pricing, doing so may result in an increase in our funding costs, which may have an adverse impact on our results of operations.
15
Table of Contents
Other risks relating to our business
The COVID-19 pandemic has adversely affected and may continue to adversely affect our business, financial condition or results of operations.
COVID-19, an infectious disease caused by severe acute respiratory syndrome coronavirus 2, has spread globally and was declared a “pandemic” by the World Health Organization in March 2020. The global outbreak of COVID-19 has led to global economic and financial disruptions and has adversely affected our business operations. We have been subjected to and remain subject to a number of related risks, including but not limited to:
| • | an increase in defaults on loan payments from our customers who may not be able to meet payment obligations, which may lead to an increase in delinquency ratios and a deterioration in asset quality, resulting in increased charge-offs, higher provisioning and reduced interest and fee income; |
| • | decreases in interest rates followed by recent increases in interest rates worldwide (see “—An increase in interest rates would decrease the value of our debt securities portfolio and raise our funding costs while reducing loan demand and the repayment ability of our borrowers, which could adversely affect us”); |
| • | depreciation of the Won against major foreign currencies, which may increase our costs in servicing foreign currency-denominated debt and result in foreign exchange losses (see “—Unfavorable changes in the global financial markets could adversely affect our results of operations and financial condition”); |
| • | impairments in the fair value of our investments in companies that may be adversely affected by the pandemic; |
| • | disruption in the normal operations of our business resulting from the contraction of the disease by our employees or customers, which may necessitate our employees to be quarantined and/or our offices or branches to be temporarily shut down; and |
| • | disruption resulting from the necessity for social distancing, including, for example, temporary arrangements for employees to work remotely, which may lead to a reduction in labor productivity. |
The impact of the COVID-19 outbreak had a negative impact on our results of operations in 2022 and may continue to do so in the future, but it is not possible to predict the duration or the full magnitude of the overall harm that may result from the COVID-19 outbreak in the long term.
In addition, in response to the outbreak, Korean financial regulatory authorities, including the Financial Services Commission and the Financial Supervisory Service, have adopted policies for Korean banks to provide relief or assistance to customers. For example, the Korean government has implemented policies to extend loan terms and defer payments on interest and principal with respect to certain borrowers. In particular, in April 2020, the Korean government established the “COVID-19 SME and Small Merchant Financial Support Program” for small- and medium-sized enterprises and small merchants that are in good standing and have been negatively impacted by the COVID-19 pandemic (which excludes consumer loans and loans relating to the sale or leasing of real estate). As of December 31, 2022, our total loans (including payment guarantees) subject to this program amounted to ₩2,177 billion. Although the program was originally scheduled to expire in September 2021, it has been extended four times before being terminated in September 2022.
On October 4, 2022, Woori Bank started to operate a deferment program similar to the “COVID-19 SME and Small Merchant Financial Support Program”. Under this deferment program, with respect to loans made to borrowers which have been adversely impacted by the COVID-19 pandemic (excluding loans related to the sale or lease of real property and loans made to borrowers engaged in certain unwholesome businesses), Woori Bank may extend their maturity date up until September 30, 2025, and may defer the borrowers’ payment obligation for the interests and principal of such loans up until September 2023. In October 2022, the Korean government also launched the New Start Fund, a debt adjustment program, under which pandemic-hit micro-enterprises and self-employed business owners can apply for debt adjustment, and once accepted, will be supported through
16
Table of Contents
customized debt adjustment plans according to their respective credit conditions and types of loans. Under the New Start Fund program, the Korean government may purchase the loan directly and then make adjustment, or if the relevant financial institution agrees, allow the relevant financial institution to restructure the loan directly. See “—Risks relating to our corporate credit portfolio—The largest portion of our credit exposure is to small- and medium-sized enterprises, and financial difficulties experienced by companies in this segment may result in a deterioration of our asset quality and have an adverse impact on us.”
We and our subsidiaries have also implemented additional measures, both financial, such as offering discounts on the interest rates of certain loans and waiving ATM transaction fees in certain areas in Korea affected by COVID-19, and non-financial, such as installing acrylic transparent barriers in our branches and distributing masks to protect our customers and workforce. We have also established a group emergency management committee to accurately assess the relevant risks, proactively develop countermeasures and enhance reporting and communication systems on a group-wide basis. Notwithstanding such efforts, in the event that COVID-19 or other types of widespread infectious diseases cannot be effectively and timely contained, our business, financial condition, results of operations and cash flows may continue to be adversely affected.
Unfavorable changes in the global financial markets could adversely affect our results of operations and financial condition.
The overall prospects for the Korean and global economy in 2023 and beyond remain uncertain. In recent years, the global financial markets have experienced significant volatility as a result of, among other things:
| • | the occurrence of severe health epidemics, such as the COVID-19 pandemic; |
| • | hostilities, political or social tensions involving Russia (including the invasion of Ukraine by Russia and ensuing actions that the United States and other countries have taken or may take in the future) and the resulting adverse effects on the global supply of oil and other natural resources and the global financial markets; |
| • | interest rate fluctuations as well as changes in policy rates by the U.S. Federal Reserve and other central banks, a rise in inflation rates and volatility in stock markets and exchange rates worldwide; |
| • | financial and social difficulties affecting many countries worldwide, in particular in Latin America and Europe; |
| • | adverse developments in the financial markets and industry, in particular those faced by several banks in the United States and Europe; |
| • | a deterioration in economic and trade relations between the United States and its major trading partners, including China; |
| • | escalations in trade protectionism globally and geopolitical tensions in East Asia and the Middle East; |
| • | the slowdown of economic growth in China and other major emerging market economies; and |
| • | political and social instability in various countries in the Middle East, including Iran, Syria, Iraq and Egypt. |
In light of the high level of interdependence of the global economy, unfavorable changes in the global financial markets, including as a result of any of the foregoing developments, could have a material adverse effect on the Korean economy and financial markets, and in turn on our business, financial condition and results of operations.
We are also exposed to adverse changes and volatility in the global and Korean financial markets as a result of our liabilities and assets denominated in foreign currencies and our holdings of trading and investment securities, including structured products. The value of the Won relative to major foreign currencies in general and the U.S. dollar in particular has fluctuated widely in recent years and has been subject to significant volatility as a result of the COVID-19 pandemic, the invasion of Ukraine by Russia and the ensuing sanctions against Russia
17
Table of Contents
and, more recently, the widening difference in policy rates between the United States and Korea. A depreciation of the Won will increase our cost of servicing our foreign currency-denominated debt, while continued exchange rate volatility may also result in foreign exchange losses for us. Furthermore, as a result of the deterioration in global and Korean economic conditions, there has been downward pressure on securities prices, including the stock prices of Korean and foreign companies in which we hold an interest. Such developments have resulted in and may lead to further trading and valuation losses on our trading and investment securities portfolio as well as impairment losses on our investments in joint ventures and associates. See “—An increase in interest rates would decrease the value of our debt securities portfolio and raise our funding costs while reducing loan demand and the repayment ability of our borrowers, which could adversely affect us.”
Adverse developments affecting the financial services industry, including events or concerns involving liquidity of financial institutions, could adversely affect our business, financial condition or results of operations.
Adverse developments affecting financial institutions, such as events involving liquidity that are rumored or actual, have in the past and may in the future lead to bank failures and market-wide liquidity problems. For example, on March 10, 2023, Silicon Valley Bank, or SVB, was closed by the California Department of Financial Protection and Innovation, which appointed the Federal Deposit Insurance Commission, or the FDIC, as receiver. To protect insured depositors, the FDIC transferred all of the deposits and substantially all of the assets of SVB to Silicon Valley Bridge Bank, N.A., a full-service bridge bank that will be operated by the FDIC as it stabilizes the institution and implements an orderly resolution. On March 12, 2023, the FDIC, which was also appointed by the New York State Department of Financial Services as receiver, transferred all of the deposits and substantially all of the assets of Signature Bank to Signature Bridge Bank, N.A. (“Bridge Bank”), a full-service bank that will be operated by the FDIC as it markets the institution to potential bidders. On March 8, 2023, Silvergate Capital Corporation, the holding company for Silvergate Bank, announced its intent to wind down operations and voluntarily liquidate Silvergate Bank.
Other banks have come under pressure and face uncertainty as a result of the failure of SVB, Signature Bank, and Silvergate Bank, and we cannot assure you whether or not the FDIC and other applicable government authorities will take similar or different actions with respect to other banking institutions. Korean financial institutions, including savings banks, Internet-only banks and the banking system generally in Korea, may experience volatile stock prices and significant losses in their equity value, and depositors may withdraw significant amounts from their accounts at these institutions, both of which could lead to closure or other significant distress. In such event, the Korean government may require us and other large financial holding companies in Korea to intervene, as it has required to do so in the past, which may strain our resources and have an adverse impact on our results of operations, cash flow, and financial condition.
In addition, we may be impacted by current or future negative perceptions and expectations about the prospects for the financial services industry, which could worsen over time and result in downward pressure on, and continued or accelerated volatility of, bank securities. Such events involving limited liquidity, defaults, non-performance or other adverse developments that affect financial institutions, transactional counterparties or other companies in the financial services industry or the financial services industry generally, or concerns or rumors about any events of these kinds or other similar risks, have in the past and may in the future lead to market-wide liquidity issues or increase our risk in various dealings with our counterparties, among others.
Our risk management system may not be fully effective at all times, including operational risk.
We seek to monitor and manage our risk exposure through a standardized risk management system, which encompasses a multi-tiered risk management governance structure under our Board Risk Management Committee, our centralized credit risk management system called the Credit Wizard system, reporting and monitoring systems, early warning systems and other risk management infrastructure, using a variety of risk management strategies and techniques. See “Item 11. Quantitative and Qualitative Disclosures about Market Risk.” However, such risk management strategies and techniques employed by us and the judgments that accompany their application cannot anticipate the economic and financial outcome in all market environments, and many of our risk management strategies and techniques have a basis in historical market behavior that may
18
Table of Contents
limit the effectiveness of such strategies and techniques in times of significant market stress or other unforeseen circumstances. Furthermore, our risk management strategies may not be effective in a difficult or less liquid market environment, as other market participants may be attempting to use the same or similar strategies as us to deal with such market conditions. In such circumstances, it may be difficult for us to reduce our risk positions due to the activity of such other market participants.
We also seek to identify and manage our exposure to operational risk, which we define as the risk of loss resulting from inadequate or failed internal processes, people and systems or from external events, primarily through its system of comprehensive policies and control framework, including internal audits and inspections. In addition to our internal audits and inspections, the Financial Supervisory Service conducts general annual audits of our operations, as well as special audits and investigations as the need arises on particular aspects of our operations, such as risk management, internal control, credit monitoring and liquidity. In the ordinary course of these audits or investigations, the Financial Supervisory Service routinely issues warning notices where it determines that a regulated financial institution or such institution’s employees have failed to comply with the applicable laws or rules, regulations and guidelines of the Financial Supervisory Service. We have in the past received, and expect in the future to receive, such notices, and we have taken and will continue to take appropriate actions in response to such notices. For example, the Financial Supervisory Service launched an investigation into us in April 2022 after we discovered that one of our employees had embezzled an aggregate amount of approximately ₩70.8 billion between 2012 and 2020. The Financial Supervisory Service released an interim report in July 2022, stating that it would take all necessary actions against the embezzler, as well as our other employees and executives for any illegal or inappropriate acts, in accordance with the relevant laws and regulatory procedures. The Financial Supervisory Service also stated that it would work with the Financial Services Commission to devise a plan for improving the internal controls of banks and other financial institutions to prevent the future occurrence of any such large-scale financial incidents. For a further discussion of the incident, see “—We may suffer losses due to employee misconduct.” and “Item 8.A. Consolidated Statements and Other Financial Information—Legal Proceedings and Regulatory Actions.” While we intend to fully cooperate with the Financial Supervisory Service in its audits and investigations and take any remedial measures as necessary, no assurance can be given that these remedial measures would be sufficient to prevent similar or more adverse operational risks from materializing.
We have provided certain assets as collateral in connection with our secured borrowings and could be required to make payments and realize losses in the future relating to those assets.
We have provided certain assets as collateral for our secured borrowings in recent years. As of December 31, 2022, the aggregate amount of assets we had provided as collateral for our secured borrowings was ₩21,748 billion. These secured borrowings may take the form of asset securitization transactions, where we nominally sell our assets to a securitization vehicle that issues securities backed by those assets, although the assets remain on our statements of financial position. These secured borrowings are intended to be fully repaid through recoveries on collateral. Some of these nominal asset sales were with recourse, which means that if delinquencies arise with respect to such assets, we will be required to either repay a proportionate amount of the related secured borrowing (by reversing the nominal sale and repurchasing such assets) or compensate the securitization vehicle for any net shortfalls in its recoveries on such assets. If we are required to make payments on such assets, or to repay our secured borrowings on those assets and are unable to make sufficient recoveries on them, we may realize further losses on these assets.
An increase in interest rates would decrease the value of our debt securities portfolio and raise our funding costs while reducing loan demand and the repayment ability of our borrowers, which could adversely affect us.
Interest rates in Korea have been subject to significant fluctuations in the past. The Bank of Korea increased its policy rate from 1.25% to 1.50% in November 2017 and 1.75% in November 2018 in light of improved growth prospects in Korea and rising interest rate levels globally, but it again reduced its policy rate to 1.50% in June 2019 and 1.25% in October 2019 to address the sluggishness of the global and domestic economies. Amid rising concerns of a potential global recession as a result of the COVID-19 pandemic, the Bank of Korea further reduced its policy rate to 0.75% in March 2020 and 0.50% in May 2020. However, as the economy began to
19
Table of Contents
show signs of recovery from the COVID-19 pandemic starting from the second half of 2021, the Bank of Korea gradually raised its policy rate to 0.75% in August 2021, 1.00% in November 2021, and to pre-pandemic level of 1.25% in January 2022. More recently, in response to rising levels of household debt and inflation in Korea as well as globally, the Bank of Korea raised its policy rate to 1.50% in April 2022, 1.75% in May 2022, 2.25% in July 2022, 2.50% in August 2022, 3.00% in October 2022, 3.25% in November 2022 and 3.50% in January 2023. All else being equal, increases in interest rates in the future could lead to a decline in the value of our portfolio of debt securities, which generally pay interest based on a fixed rate. A sustained increase in interest rates will also raise our funding costs, while reducing loan demand, especially among consumers. Rising interest rates may therefore require us to re-balance our asset portfolio and our liabilities in order to minimize the risk of potential mismatches and maintain our profitability. See “Item 11. Quantitative and Qualitative Disclosures about Market Risk.” In addition, rising interest rate levels may adversely affect the Korean economy and the financial condition of our corporate and consumer borrowers, including holders of our credit cards, which in turn may lead to a deterioration in our credit portfolio. In particular, since most of our consumer and corporate loans bear interest at rates that adjust periodically based on prevailing market rates, a sustained increase in interest rates would increase the interest costs of our consumer and corporate borrowers and will adversely affect their ability to make payments on their outstanding loans.
Uncertainties regarding the transition away from the London Interbank Offered Rate, or LIBOR, or any other interest rate benchmark could have adverse consequences for market participants, including us.
The ICE Benchmark Administration, the administrator of the London Interbank Offered Rate, or LIBOR, ceased publication of short-term U.S. dollar LIBOR settings and all non-U.S. dollar LIBOR settings on a representative basis after December 31, 2021, with plans to cease publication of all other U.S. dollar LIBOR settings after June 30, 2023.
Given the extensive use of LIBOR across financial markets, the transition away from LIBOR presents various risks and challenges to financial markets and institutions, including us, and in particular, Woori Bank. We had issued, traded, held or otherwise used various products and securities that referenced LIBOR, including, among others, loans, securities, deposits, borrowings, derivatives and debentures. In response, we established a LIBOR response plan to identify the impacts and risks to its business associated with the transition away from LIBOR, and to prepare and implement an action plan to ensure a smooth transition to alternative benchmark rates, and to date, has substantively completed such transition, with a strategy in place for the remainder of such transactions that involve LIBOR settings that expire in 2023.
The ongoing transition away from LIBOR or any other interest rate benchmark could result in increased financial, operational, legal, reputational and/or compliance risks. For example, a significant challenge in our benchmark transition has been managing the impact of the LIBOR transition on the contractual mechanics of LIBOR-based financial instruments and contracts that mature after the announced deadlines. As described above, certain of the remaining instruments and contracts do not provide for alternative reference rates or appropriate fallback clauses. Even if such instruments and contracts provide for alternative reference rates, such alternative reference rates are likely to differ from the prior benchmark rates and may require us to pay interest at higher rates on the related obligations, which could adversely impact our interest expenses, results of operations and cash flows. While there are a number of international working groups focused on transition plans and the provision of fallback contract language that seek to minimize market disruption, replacement of LIBOR or any other benchmark with a new benchmark rate, such as the Secured Overnight Financing Rate, or SOFR, could adversely impact the value of and return on existing instruments and contracts. Moreover, replacement of LIBOR or other benchmark rates could result in market dislocations and have other adverse consequences for market participants, including the potential for increased costs, and litigation risks, including the potential for disputes with counterparties regarding the interpretation and enforceability of fallback contract language in LIBOR-based financial instruments and contracts.
Our funding is highly dependent on short-term deposits, which dependence may adversely affect our operations.
We meet a significant amount of our funding requirements through short-term funding sources, which consist primarily of customer deposits. As of December 31, 2022, approximately 95.3% of these deposits had
20
Table of Contents
maturities of one year or less or were payable on demand. In the past, a substantial proportion of these customer deposits have been rolled over upon maturity. We cannot guarantee, however, that depositors will continue to roll over their deposits in the future. In the event that a substantial number of these short-term deposit customers withdraw their funds or fail to roll over their deposits as higher-yielding investment opportunities emerge, our liquidity position could be adversely affected. We may also be required to seek more expensive sources of short-term and long-term funding to finance our operations. See “Item 5.B. Liquidity and Capital Resources—Financial Condition—Liquidity.”
Labor union unrest may disrupt our operations and hinder our ability to continue to reorganize our operations.
Most financial institutions in Korea have experienced periods of labor unrest. In recent years, we have transferred or merged some of the business operations of our subsidiaries and affiliates into one or more entities and implemented other forms of corporate and operational restructuring, including in connection with the Korean government’s privatization plan with respect to Woori Finance Holdings and its former subsidiaries. See “—Risks relating to our structure and strategy—The implementation of the Korean government’s privatization plan may have an adverse effect on us and your interests as a shareholder.” We may also decide to implement other organizational or operational changes, as well as acquisitions or dispositions, in the future. Such efforts have in the past been met with significant opposition from labor unions in Korea. Actual or threatened labor disputes may in the future disrupt the reorganization process and our business operations, which in turn may adversely impact our financial condition and results of operations.
The secondary market for corporate bonds in Korea is not fully developed, and, as a result, we may not be able to realize the full “marked-to-market” value of debt securities we hold when we sell any of those securities.
As of December 31, 2022, we held debt securities issued by Korean companies and financial institutions (other than those issued by government-owned or -controlled enterprises or financial institutions, which include the Bank of Korea, the Korea Development Bank, the Export-Import Bank of Korea, the Korea Housing Finance Corporation and the Industrial Bank of Korea, among others) with a total book value of ₩9,631 billion in our trading and investment securities portfolio. The market value of these securities could decline significantly due to various factors, including future increases in interest rates or a deterioration in the financial and economic condition of any particular issuer or of Korea in general. Any of these factors individually or a combination of these factors would require us to write down the fair value of these debt securities, resulting in impairment losses. Because the secondary market for corporate bonds in Korea is not fully developed, the market value of many of these securities as reflected on our consolidated statements of financial position is determined by reference to suggested prices posted by Korean rating agencies, which measure prices based on observable market data. These valuations, however, may differ significantly from the actual value that we could realize in the event we elect to sell these securities. As a result, we may not be able to realize the full “marked-to-market” value at the time of any such sale of these securities and thus may incur additional losses.
We may be required to raise additional capital if our capital adequacy ratios deteriorate or the applicable capital requirements change in the future, but we may not be able to do so on favorable terms or at all.
Under the capital adequacy requirements of the Financial Services Commission, as of December 31, 2022, we as a bank holding company were required to maintain a total minimum common equity Tier I capital adequacy ratio of 8.0%, Tier I capital adequacy ratio of 9.5% and combined Tier I and Tier II capital adequacy ratio of 11.5%, on a consolidated basis (including applicable additional capital buffers and requirements as described below), and Woori Bank as a bank was required to maintain a total minimum common equity Tier I capital adequacy ratio of 8.0%, Tier I capital adequacy ratio of 9.5% and combined Tier I and Tier II capital adequacy ratio of 11.5%, on a consolidated basis (including applicable additional capital buffers and requirements as described below). As of December 31, 2022, our common equity Tier I capital, Tier I capital and combined Tier I and Tier II capital adequacy ratios were 11.57%, 13.62% and 15.30%, respectively, and Woori Bank’s common equity Tier I capital, Tier I capital and combined Tier I and Tier II capital adequacy ratios were 12.68%, 13.67% and 15.60%, respectively, all of which exceeded the minimum levels required by the Financial
21
Table of Contents
Services Commission. However, our capital base and capital adequacy ratios may deteriorate in the future if our results of operations or financial condition deteriorates for any reason, or if we are not able to deploy our funding into suitably low-risk assets.
The current capital adequacy requirements of the Financial Services Commission are derived from a set of bank capital measures, referred to as Basel III, which the Basel Committee on Banking Supervision initially introduced in 2009 and began phasing in starting from 2013. Commencing in July 2013, the Financial Services Commission promulgated a series of amended regulations implementing Basel III, pursuant to which Korean banks and bank holding companies were required to maintain a minimum ratio of common equity Tier I capital (which principally includes equity capital, capital surplus and retained earnings) to risk-weighted assets of 3.5% and Tier I capital to risk-weighted assets of 4.5% from December 1, 2013, which minimum ratios were increased to 4.0% and 5.5%, respectively, from January 1, 2014 and increased further to 4.5% and 6.0%, respectively, from January 1, 2015. Such requirements are in addition to the pre-existing requirement for a minimum ratio of Tier I and Tier II capital (less any capital deductions) to risk-weighted assets of 8.0%, which remains unchanged. The amended regulations also require an additional capital conservation buffer of 2.5% in 2022 and 2023, as well as a potential counter-cyclical capital buffer of up to 2.5%, which is determined on a quarterly basis by the Financial Services Commission. Furthermore, we and Woori Bank were each designated as a domestic systemically important bank holding company and a domestic systematically important bank, respectively, for 2022 and 2023 by the Financial Services Commission, which subjects us and Woori Bank to the additional capital requirement of 1.0% in 2022 and 2023. The implementation of Basel III in Korea may have a significant effect on the capital requirements of Korean financial institutions, including us. See “Item 4.B. Business Overview—Supervision and Regulation—Principal Regulations Applicable to Financial Holding Companies—Capital Adequacy” and “Item 4.B. Business Overview—Supervision and Regulation—Principal Regulations Applicable to Banks—Capital Adequacy.”
We may be required to obtain additional capital in the future in order to remain in compliance with the applicable capital adequacy and other regulatory requirements. However, we may not be able to obtain additional capital on favorable terms, or at all. Our ability to obtain additional capital at any time may be constrained to the extent that banks, bank holding companies or other financial institutions in Korea or from other countries are seeking to raise capital at the same time. To the extent that we fail to comply with applicable capital adequacy or other regulatory requirements in the future, Korean regulatory authorities may impose penalties on us ranging from a warning to suspension or revocation of our banking license.
We engage in limited activities relating to Iran and Russia, which may result in regulatory or enforcement actions under relevant laws and regulations of the United States and other jurisdictions as a result of such activities, which may adversely affect our business and reputation.
The U.S. Department of the Treasury’s Office of Foreign Assets Control, or OFAC, administers and enforces certain laws and regulations (which we refer to as OFAC sanctions) that impose restrictions on activities or transactions within U.S. jurisdiction with certain countries, governments, entities and individuals that are the subject of OFAC sanctions, including Iran and Russia. Non-U.S. persons generally are not automatically bound by OFAC sanctions, but to the extent they engage in transactions completed in part in the United States or through U.S. persons (such as, for example, wiring an international payment that clears through a bank branch in New York), they are required to comply with OFAC sanctions. The European Union also enforces certain laws and regulations that impose restrictions on nationals and entities of, and business conducted in, member states with respect to activities or transactions with certain countries, governments, entities and individuals that are the subject of such laws and regulations, including with respect to targeted entities in Iran and Russia. The United Nations Security Council and other governmental entities (including Korea and the United Kingdom) also impose similar sanctions.
The United States also maintains indirect sanctions, which we refer to collectively as U.S. secondary sanctions, which provide authority for the imposition of U.S. sanctions on non-U.S. persons that engage in targeted transactions or activities with no connection to U.S. jurisdiction. Secondary sanctions are implemented under a wide and growing range of statutes and Executive Orders, and the standard language of most Executive Orders provides authority to impose sanctions on non-U.S. persons providing material support to parties subject
22
Table of Contents
to OFAC sanctions. Secondary sanctions have been of increasing importance in recent years, particularly (but not only) with respect to Iran, Russia, and North Korea. Iran has also been designated as a “jurisdiction of primary money laundering concern” under Section 311 of the USA PATRIOT Act, potentially subjecting banks dealing with Iranian financial institutions to increased regulatory scrutiny.
Violations of OFAC sanctions via transactions with a U.S. jurisdictional nexus can result in substantial civil or criminal penalties. Even when no such jurisdictional nexus exists, parties that engage in targeted activities under secondary sanctions may themselves become the target of OFAC sanctions, including, among other things, the blocking of any property subject to U.S. jurisdiction in which the sanctioned party has an interest, which would include a prohibition on transactions or dealings within U.S. jurisdiction involving securities of the sanctioned party. Financial institutions engaging in targeted activities could in some instances be sanctioned by termination or restriction of their ability to maintain correspondent accounts in the United States. The imposition of sanctions against foreign financial institutions pursuant to U.S. secondary sanctions is discretionary and not automatic, requiring affirmative action by the U.S. administration.
Previously, Korea benefited from a “significant reduction” exception, or SRE, that exempted Korean companies from many U.S. secondary sanctions in connection with purchases of crude oil and natural gas from Iran that met a series of conditions, including restrictions on the currencies involved and stringent limits on the use of proceeds of oil and gas purchases. The U.S. Department of State announced that as of May 2, 2019, it would discontinue the exemption.
In 2022, we engaged in the following activities relating to Iran:
| • | We operate certain accounts for the Central Bank of Iran, or the CBI, which were opened by the CBI pursuant to a service agreement entered into by us and the CBI in September 2010, as amended from time to time, to facilitate trade between Korea and Iran. In light of the discontinuation of the SRE, from July 8, 2019 to September 20, 2019, we limited activity in the existing CBI accounts to processing payments for exports of humanitarian goods to Iran, and due to the imposition of additional secondary sanctions against the CBI on September 20, 2019, we ceased all activity in the existing CBI accounts until July 12, 2020. Starting July 13, 2020, at the request of the Korean government, we resumed processing payments for exports of certain humanitarian goods to Iran, such as those permitted under OFAC General License No. 8A, which authorizes certain humanitarian trades involving the CBI. In resuming the transactions involving the CBI account for humanitarian trade, we consulted with the Korean government, which, in turn, received confirmation from OFAC that these transactions are currently permitted under OFAC sanctions laws. In addition, we have been conducting extensive Know Your Customer (KYC) and enhanced due diligence (EDD) reviews to ensure that all humanitarian trade transactions involving Iran and the CBI are undertaken in accordance with OFAC sanctions. In 2022, our total fee revenue from such activities amounted to ₩0.22 million, and as there were no expenses directly applicable to such activities under our internal management accounts, we estimate that our net income before tax from such activities also amounted to ₩0.22 million. |
| • | In the past, we also provided fund transfer and financing services to Korean exporters and importers in connection with their trade transactions with Iranian parties that were permitted under the relevant Korean sanctions regime. We have discontinued all trade financing activities relating to export and import trades involving the CBI accounts since November 5, 2018. Since 2019, all such exports and imports were settled through telegraphic transfer and did not involve our financing services, including all transactions involving the CBI. However, we continue to honor our obligations on a limited basis under previously-issued bank guarantees to the extent that such activities do not violate OFAC sanctions or implicate U.S. secondary sanctions. In 2022, our total fee revenue from the relevant telegraphic transfer services amounted to ₩0.10 million. As there were no expenses directly applicable to such activities under our internal management accounts, we estimate that our net income before tax from such activities also amounted to ₩0.10 million. |
| • | We also maintain a limited number of deposit accounts in Korea for an Iranian financial institution subject to OFAC sanctions that were opened prior to it becoming subject to OFAC sanctions. The relevant accounts have since been restricted, and no transactions are currently allowed through these accounts. Accordingly, there were no fee revenues from maintaining such deposit accounts, and there were no expenses directly applicable to such activities under our internal management accounts, in 2022. |
23
Table of Contents
Unless stated otherwise, we intend to continue the above activities to the extent permitted under applicable laws and regulations and not prohibited by any applicable sanctions laws.
While we do not believe that our past activities relating to Iran violated OFAC sanctions or are sanctionable under applicable U.S. secondary sanctions, U.S. authorities are afforded wide discretion and there is no guarantee that such activities will not be found to have violated OFAC sanctions or involved sanctionable activity under U.S. secondary sanctions, or that any other government will not determine that our activities violated applicable sanctions of other countries. Sanctions against Iran continue to evolve rapidly, and future changes in law could also adversely affect us.
Our business and reputation could be adversely affected if the U.S. government were to determine that our past or ongoing activities relating to Iran violated OFAC sanctions or involved sanctionable activities under U.S. secondary sanctions, or if any other government were to determine that such activities violated applicable sanctions of other countries. For example, any prohibition or conditions placed on our use of U.S. correspondent accounts could effectively eliminate our access to the U.S. financial system, including U.S. dollar clearing transactions, which would adversely affect our business, and any other sanctions or civil or criminal penalties imposed could also adversely affect our business. We intend to take all necessary measures to the extent possible to ensure that such prohibitions or conditions are not placed on us.
Furthermore, there is no guarantee that other countries (including Korea) that had provided sanctions relief to Iran in conjunction with the 2015 Joint Comprehensive Plan of Action (JCPOA) will not decide to re-impose sanctions relating to Iran, especially if there are further negative political developments relating to the Middle East or Iran’s involvement in the conflict in Ukraine. It is also possible that the United States, Korea or other countries might seek to expand their sanctions relating to Iran in the future beyond those existing currently. Such governmental actions and policies may also increase the risk of our violating certain sanctions or becoming a target of sanctions as a result of our past or future activities relating to Iran.
We have been cooperating with an investigation relating to compliance with U.S. sanctions and other U.S. laws led by the U.S. Attorney’s Office for the Southern District of New York and the New York State Office of the Attorney General regarding certain of our transactions involving sanctioned countries. We have provided the investigating authorities with information and documents pursuant to the applicable laws and regulations. We voluntarily reported the relevant transactions to OFAC, including a limited number of previous transactions that may have involved Iran, Sudan, Syria and Cuba, and shared such information with banking regulators including the Federal Reserve Bank of New York and the New York Department of Financial Services, or DFS. On December 3, 2020, OFAC concluded its investigation with a cautionary letter as its final enforcement action, and DFS also informed our counsel on February 2, 2022 that it would close its investigation without any enforcement action. However, the investigations by other U.S. government authorities have not been formally concluded and may continue to require our cooperation, although such investigations have been dormant for a number of years to our knowledge. It is not possible to predict the outcome of such investigations at this time, and there can be no assurance that such investigations will not result in an unfavorable outcome or adversely affect our business or reputation.
Following Russia’s further invasion of Ukraine in February 2022, various countries, including the United States, have imposed additional sanctions on a number of Russian individuals and entities, and restricted or prohibited certain activities relating to Russia such as making new investments or the provision of certain services. The Russian government also listed the Republic of Korea as an “unfriendly state” in March 2022. We have a Russia-based subsidiary, which represents 0.16% of our total assets and 0.19% of our revenue as of December 31, 2022. The Russian subsidiary is engaged in certain ordinary course business activities with Russian entity counterparties, some of which have become subject to additional sanctions since February 2022. Where necessary or appropriate, we have taken actions to negotiate repayment terms in Rubles to promote compliance with applicable sanctions and have prepared response plans in the event of additional sanctions. While we do not believe that such activities violate OFAC or other sanctions or would reasonably be expected to result in the imposition of U.S. secondary sanctions, U.S. authorities are afforded wide discretion and there is no guarantee that such activities will not be found to have violated OFAC sanctions or involved sanctionable activity under U.S. secondary sanctions, or that any other government will not determine that our activities
24
Table of Contents
violated applicable sanctions of other countries. Our business and reputation could be adversely affected if the U.S. government, or any other government, were to determine that our past or ongoing activities relating to Russia violated any of the applicable sanctions. Sanctions against Russia continue to evolve rapidly, and future changes in law could also adversely affect us. The further expansion of sanctions against Russia and the Russian financial sector by the United States or other countries (including Korea), as well as Russian countermeasures against foreign-owned companies, may adversely affect our business and reputation.
Furthermore, some of our U.S. investors may be required to divest their investments in us or forego the purchase of our securities under the laws of certain U.S. states relating to investments by state-owned entities or under internal investment policies relating to companies (or their affiliates) doing business with Iran or Russia, or investors may decide for reputational reasons to divest or forego such investments. We are aware of initiatives by U.S. governmental entities and U.S. institutional investors, such as pension funds, to adopt or consider adopting laws, regulations or policies prohibiting transactions with or investment in, or requiring divestment from, entities doing business with countries identified as state sponsors of terrorism, such as Iran, or with Russia. There can be no assurance that the foregoing will not occur or that such occurrence will not have a material adverse effect on the value of our common stock and ADSs.
Our operations may be subject to increasing and continually evolving cybersecurity and other technological risks.
With the proliferation of new technologies and the increasing use of the Internet and mobile devices to conduct financial transactions, our operations as a financial institution have been, and will continue to be, subject to an increasing risk of cyber incidents relating to these activities, the nature of which is continually evolving. Our computer systems, software and networks are subject to cyber incidents, such as disruptions, delays or other difficulties affecting our information technology systems, computer viruses or other malicious codes, loss or destruction of data (including confidential client information), unauthorized access, account takeover attempts and cyber attacks. A significant portion of our daily operations relies on our information technology systems, including customer service, billing, the secure processing, storage and transmission of confidential and other information as well as the timely monitoring of a large number of complex transactions.
South Korea’s Defense Ministry increased the Cyber Protection Condition or CPCON level from Level 4 (attention) to 3 (caution) in March 2022. In response, we have taken actions to implement cybersecurity measures that are commensurate with this increase in CPCON level. Specifically, we strengthened our systems to detect and block hacking attempts and malicious code distribution as well as DDoS response. We are also working on identifying and confirming best practices to optimize our cybersecurity measures.
We have made substantial and ongoing investments into building systems and protections to address cybersecurity and related risks including obtaining ISMS-P from Financial Security Institute and ISO27001 and ISO27701 from the International Organization for Standardization to validate our protocols, personnel, and facilities in respect of personal information data protection. Although our commitment to optimized cybersecurity and ongoing compliance will continue, there is no guarantee that such measures will provide complete protection against cyber threats.
In addition, because methods used to cause cyber attacks change frequently or, in some cases, are not recognized until launched, we may be unable to implement effective preventive measures or proactively address these methods. Furthermore, these cyber threats may arise from human error, accidental technological failure and third parties with whom we do business. If we were to be subject to a system failure or other cyber incident, it could result in the disclosure of confidential client information, damage to our reputation with our customers and in the market, customer dissatisfaction, additional costs to us, regulatory penalties, exposure to litigation and other financial losses to both us and our customers, which could have an adverse effect on our business and results of operations.
Our business may be adversely affected by legal claims and regulatory actions against us.
We are subject to the risk of legal claims and regulatory actions, which may expose us to monetary damages and legal costs, injunctive relief, criminal and civil penalties, sanctions against our management and employees
25
Table of Contents
and regulatory restrictions on our operations, as well as reputational harm. See “Item 8.A. Consolidated Statements and Other Financial Information—Legal Proceedings and Regulatory Actions.”
We are unable to predict the outcome of many of the legal claims and regulatory actions in which we are involved, and the scope of the claims or actions or the total amount in dispute in such matters may increase. Furthermore, adverse decisions, findings or resolutions in such matters could encourage other parties, including governmental authorities in other jurisdictions, to bring similar claims and actions against us. Accordingly, the outcome of current and future legal claims and regulatory actions, particularly those for which it is difficult to assess the maximum potential exposure or the ultimate adverse impact with any degree of certainty, may materially and adversely impact our business, reputation, results of operations and financial condition.
We may suffer losses due to employee misconduct.
Our businesses are exposed to risk from potential non-compliance by our employees with our policies, applicable laws or regulations, as well as other types of employee misconduct or negligence and fraud, which could result in civil, regulatory or criminal investigations, litigations and charges, regulatory sanctions and reputational or financial harm. For example, in April 2022, we became aware of, and reported to the relevant government authorities, a series of embezzlements committed between 2012 and 2020 by one of our employees. As of December 31, 2022, we determined that the aggregate amount of such embezzlements was approximately ₩70.8 billion but have since recovered ₩3.4 billion of this amount. In September 2022, the Seoul Central District court sentenced the embezzler to 13 years in prison, which decision is currently on appeal. The Financial Supervisory Service has concluded its investigation and, in January 2023, its disciplinary committee approved various penalties to be issued to certain Woori Bank employees in connection with the embezzlement. In addition, another employee of ours has been arrested under the allegation of aiding certain suspicious overseas wire transfers that are subject to pending investigations by the Korean government and alerting the transferors of such investigations. See “Item 8.A. Consolidated Statements and Other Financial Information—Legal Proceedings and Regulatory Actions.” These and other instances of employee misconduct could result in damages to our reputation, additional costs to us, regulatory penalties, exposure to litigation and other financial losses to us. There can be no assurance that we will be able to fully recoup any financial losses that we may have sustained as a result of the employee misconduct. Furthermore, it is not always possible to deter or fully prevent employee misconduct and the precautions we take to prevent and detect such activity may not always be fully effective. Accordingly, there can be no assurance that employee misconduct will not occur again in the future.
We are generally subject to Korean corporate governance and disclosure standards, which differ in significant respects from those in other countries.
Companies in Korea, including us, are subject to corporate governance standards applicable to Korean public companies which differ in many respects from standards applicable in other countries, including the United States. As a reporting company registered with the U.S. Securities and Exchange Commission and listed on the New York Stock Exchange, we are subject to certain corporate governance standards as mandated by the Sarbanes-Oxley Act of 2002. However, foreign private issuers, including us, are exempt from certain corporate governance requirements under the Sarbanes-Oxley Act or under the rules of the New York Stock Exchange. There may also be less publicly available information about Korean companies, such as us, than is regularly made available by public or non-public companies in other countries. Such differences in corporate governance standards and less public information could result in less than satisfactory corporate governance practices or disclosure to investors in certain countries.
Risks relating to government regulation and policy
Strengthening of consumer protection laws applicable to financial institutions could adversely affect our operations.
As a financial services provider, we are subject to a variety of regulations in Korea that are designed to protect financial consumers. In recent years, in light of heightened public concern regarding privacy issues, the Korean government has placed greater emphasis on protection of personal information by financial institutions
26
Table of Contents
and has implemented a number of measures to enhance consumer protection. Under the Personal Information Protection Act, financial institutions, as personal information managers, may not collect, store, maintain, utilize or provide resident registration numbers of their customers, unless other laws or regulations specifically require or permit the management of resident registration numbers. In addition, under the Use and Protection of Credit Information Act, a financial institution has a higher duty to protect all information that it collects from its customers and is required to treat such information as credit information. A financial institution’s ability to transfer or provide the information to its affiliates or holding company is considerably restricted. Quintuple damages may be imposed on a financial institution for leakage of such information. Furthermore, under the Electronic Financial Transaction Act, a financial institution is primarily responsible for compensating its customers harmed by a cyber security breach affecting the financial institution even if the breach is not directly attributable to the financial institution.
The Financial Consumer Protection Act became effective as of March 25, 2021. Under the Act, we as a financial instrument distributor are subject to heightened investor protection measures, including stricter distribution guidelines, improved financial dispute resolution procedures, increased liability for customer losses and newly imposed penalty surcharges. See “Item 4.B. Business Overview—Supervision and Regulation—Laws and Regulations Governing Other Business Activities—The Financial Consumer Protection Act.”
These and other measures that may be implemented by the Korean government to strengthen consumer protection laws applicable to financial institutions may limit our operational flexibility and cause us to incur significant additional compliance costs, as well as subject us to increased potential liability to our customers, which could adversely affect our business and performance.
The Korean government may promote lending and financial support by the Korean financial industry to certain types of borrowers as a matter of policy, which financial institutions, including us, may decide to follow.
Through its policy guidelines and recommendations, the Korean government has promoted and, as a matter of policy, may continue to attempt to promote lending by the Korean financial industry to particular types of borrowers. For example, the Korean government has in the past announced policy guidelines requesting financial institutions to participate in remedial programs for troubled corporate borrowers, as well as policies aimed at promoting certain sectors of the economy, including measures such as making low interest funding available to financial institutions that lend to these sectors. We expect that all loans or credits made pursuant to such government policies will be reviewed in accordance with our credit approval procedures. However, these or any future government policies may influence us to lend to certain sectors or in a manner in which we otherwise would not in the absence of such policies.
In the past, the Korean government has also announced policies under which financial institutions in Korea are encouraged to provide financial support to particular sectors. For example, in light of the deteriorating financial condition and liquidity position of small- and medium-sized enterprises in Korea and adverse conditions in the Korean economy affecting such enterprises, in April 2020 the Korean government temporarily introduced measures intended to encourage Korean banks to provide financial support to small- and medium-sized enterprise borrowers, including guidelines for Korean banks to extend loan terms and defer interest payments with respect to small- and medium sized enterprises and small merchants affected by the COVID-19 pandemic. See “—Risks relating to our corporate credit portfolio—The largest portion of our exposure is to small- and medium-sized enterprises, and financial difficulties experienced by companies in this segment may result in a deterioration of our asset quality and have an adverse impact on us.” In addition, in September 2019, in response to increasing levels of consumer debt and amid concerns over the debt-servicing capacity of retail borrowers if interest rates were to rise, the Korean government requested Korean banks to participate in a mortgage loan refinancing program for low-income individuals with low repayment ability aimed at reducing the payment burden on outstanding mortgage loans.
The Korean government may in the future request financial institutions in Korea, including us, to make investments in or provide other forms of financial support to particular sectors of the Korean economy as a matter of policy, which financial institutions, including us, may decide to accept. We may incur costs or losses as a result of providing such financial support.
27
Table of Contents
The Financial Services Commission may impose burdensome measures on us if it deems us or one of our subsidiaries to be financially unsound.
If the Financial Services Commission deems our financial condition or the financial condition of our subsidiaries to be unsound, or if we or our subsidiaries fail to meet applicable regulatory standards, such as minimum capital adequacy and liquidity ratios, the Financial Services Commission may order or recommend, among other things:
| • | admonitions or warnings with respect to us or our officers; |
| • | capital increases or reductions; |
| • | assignments of contractual rights and obligations relating to financial transactions; |
| • | a suspension of performance by our officers of their duties and the appointment of receivers; |
| • | disposals of property holdings or closures of subsidiaries or branch offices or downsizing; |
| • | stock cancellations or consolidations; |
| • | suspension of performance of duties of officers and appointment of managers; |
| • | transfer of all or part of a business; |
| • | mergers with other financial institutions; |
| • | acquisition of us by a third party; and |
| • | suspensions of a part or all of our business operations (not more than six months, in the case of a suspension of all business operations). |
If any of these measures are imposed on us by the Financial Services Commission, they could harm our business, results of operations and financial condition. In addition, if the Financial Services Commission orders us to partially or completely reduce our capital, you may lose part or all of your investment.
Risks relating to Korea
Unfavorable financial and economic developments in Korea may have an adverse effect on us.
We are incorporated in Korea, and a substantial majority of our operations are located in Korea. As a result, we are subject to political, economic, legal and regulatory risks specific to Korea, and our performance and successful fulfillment of our operational strategies are dependent to a large extent on the overall Korean economy. The economic indicators in Korea in recent years have shown mixed signs of deterioration and recovery. Following a period of deterioration due to the debilitating effects of the COVID-19 pandemic on the Korean economy as well as on the economies of Korea’s major trading partners in 2020 (see “—Other risks relating to our business—The COVID-19 pandemic has adversely affected and may continue to adversely affect our business, financial condition or results of operations.”), the overall Korean economy showed some signs of recovery in 2021. However, the Korean economy in 2022 was characterized by high levels of uncertainty resulting from high inflation rates, a rise in interest rates and a depreciation of the Won against the U.S. dollar. As a result, future growth of the Korean economy is subject to many factors beyond our control, including developments in the global economy.
In recent years, adverse conditions and volatility in the worldwide financial markets, fluctuations in oil and commodity prices and the increasing weakness of the global economy, mainly due to the COVID-19 pandemic and more recently due to Russia’s invasion of Ukraine and ensuing sanctions against Russia, have contributed to the uncertainty of global economic prospects in general and have adversely affected, and may continue to adversely affect, the Korean economy. See “—Other risks relating to our business—Unfavorable changes in the global financial markets could adversely affect our results of operations and financial condition.” The value of the Won relative to major foreign currencies has fluctuated significantly and, as a result of deteriorating global and Korean economic conditions, there has been significant volatility in the stock prices of Korean companies
28
Table of Contents
recently. Further declines in the Korea Composite Stock Price Index, or the KOSPI, and large amounts of sales of Korean securities by foreign investors and subsequent repatriation of the proceeds of such sales may adversely affect the value of the Won, the foreign currency reserves held by financial institutions in Korea, and the ability of Korean companies to raise capital. Any future deterioration of the Korean or global economy could adversely affect our business, financial condition and results of operations.
Developments that could have an adverse impact on the Korean economy include:
| • | declines in consumer confidence and a slowdown in consumer spending; |
| • | the occurrence of severe health epidemics in Korea or other parts of the world, such as the COVID-19 pandemic; |
| • | adverse developments in the financial markets and industry; |
| • | adverse conditions or developments in the economies of countries and regions that are important export markets for Korea, such as China, the United States, Europe and Japan, or in emerging market economies in Asia or elsewhere, including as a result of deteriorating economic and trade relations between the United States and China; |
| • | adverse changes or volatility in foreign currency reserve levels, commodity prices (including oil prices), exchange rates (including fluctuation of the U.S. dollar, the euro or the Japanese yen exchange rates or revaluation of the Chinese Renminbi), interest rates, inflation rates or stock markets; |
| • | deterioration in economic or diplomatic relations between Korea and its trading partners or allies, including deterioration resulting from territorial or trade disputes or disagreements in foreign policy; |
| • | hostilities, political or social tensions involving Russia (including the invasion of Ukraine by Russia and ensuing actions that the United States and other countries have taken or may take in the future) and the resulting adverse effects on the global supply of oil and other natural resources and the global financial markets; |
| • | increased sovereign default risk in select countries and the resulting adverse effects on the global financial markets; |
| • | a deterioration in the financial condition or performance of small- and medium-sized enterprises and other companies in Korea due to the Korean government’s policies to increase minimum wages and limit working hours of employees; |
| • | investigations of chaebols and their senior management for possible misconduct; |
| • | a continuing rise in the level of household debt and increasing delinquencies and credit defaults by consumer and small- and medium-sized enterprise borrowers in Korea; |
| • | social and labor unrest; |
| • | substantial changes in the market prices of Korean real estate; |
| • | the economic impact of any pending or future free trade agreements or of any changes to existing free trade agreements; |
| • | a substantial decrease in tax revenues and a substantial increase in the Korean government’s expenditures for fiscal stimulus measures, unemployment compensation and other economic and social programs, in particular in light of the Korean government’s ongoing efforts to provide emergency relief payments to households and emergency loans to corporations in need of funding due to COVID-19, which, together, would likely lead to an increase in the Korean government’s debt and a national budget deficit; |
| • | financial problems or lack of progress in the restructuring of chaebols, other large troubled companies (including those in the construction, shipbuilding and shipping sectors as well as the hotel, leisure and transportation sectors) and their suppliers; |
29
Table of Contents
| • | loss of investor confidence arising from corporate accounting irregularities or corporate governance issues concerning certain chaebols; |
| • | increases in social expenditures to support an aging population in Korea or decreases in economic productivity due to the declining population size in Korea; |
| • | geo-political uncertainty and risk of further attacks by terrorist groups around the world; |
| • | natural or man-made disasters that have a significant adverse economic or other impact on Korea or its major trading partners; |
| • | political uncertainty or increasing strife among or within political parties in Korea; |
| • | hostilities or political or social tensions involving oil-producing countries in the Middle East (including a potential escalation of hostilities between the United States and Iran) and Northern Africa and any material disruption in the global supply of oil or sudden increase in the price of oil; |
| • | increased reliance on exports to service foreign currency debts, which could cause friction with Korea’s trading partners; |
| • | political or social tensions involving Russia and any resulting adverse effects on the supply of oil or the global financial markets; |
| • | an increase in the level of tensions or an outbreak of hostilities between North Korea and Korea or the United States; and |
| • | changes in financial regulations in Korea. |
Escalations in tensions with North Korea could have an adverse effect on us and the market price of our ADSs.
Relations between Korea and North Korea have been tense throughout Korea’s modern history. The level of tension between the two Koreas has fluctuated and may increase abruptly as a result of current and future events. In particular, there have been heightened security concerns in recent years stemming from North Korea’s nuclear weapon and ballistic missile programs as well as its hostile military actions against Korea. Some of the significant incidents in recent years include the following:
| • | North Korea renounced its obligations under the Nuclear Non-Proliferation Treaty in January 2003 and has conducted six rounds of nuclear tests since October 2006, including claimed detonations of hydrogen bombs, and warheads that can be mounted on ballistic missiles. Over the years, North Korea has also conducted a series of ballistic missile tests, including missiles launched from submarines and intercontinental ballistic missiles that it claims can reach the United States mainland. North Korea has increased the frequency of its missile tests in 2022, firing over 60 ballistic missiles, including 8 intercontinental ballistic missiles. In response, the Korean government has repeatedly condemned the provocations and flagrant violations of relevant United Nations Security Council resolutions. In February 2016, the government also closed the inter-Korea Gaeseong Industrial Complex in response to North Korea’s fourth nuclear test in January 2016. Internationally, the United Nations Security Council has passed a series of resolutions condemning North Korea’s actions and significantly expanding the scope of sanctions applicable to North Korea. Over the years, the United States and the European Union have also expanded their sanctions applicable to North Korea. |
| • | In March 2010, a Korean naval vessel was destroyed by an underwater explosion, killing many of the crewmen on board. The Korean government formally accused North Korea of causing the sinking, while North Korea denied responsibility. Moreover, in November 2010, North Korea fired more than 100 artillery shells that hit Korea’s Yeonpyeong Island near the Northern Limit Line, which acts as the de facto maritime boundary between Korea and North Korea on the west coast of the Korean peninsula, causing casualties and significant property damage. The Korean government condemned North Korea for the attack and vowed stern retaliation should there be further provocation. |
30
Table of Contents
North Korea’s economy also faces severe challenges, which may further aggravate social and political pressures within North Korea. Although bilateral summit meetings between the two Koreas were held in April 2018, May 2018 and September 2018 and between the United States and North Korea in June 2018, February 2019 and June 2019, there can be no assurance that the level of tensions affecting the Korean peninsula will not escalate in the future. Any further increase in tensions, which may occur, for example, if North Korea experiences a leadership crisis, high-level contacts between Korea and North Korea break down or military hostilities occur, could have a material adverse effect on the Korean economy and on our business, financial condition and results of operations and the market value of our common stock and ADSs.
Labor unrest in Korea may adversely affect our operations.
Economic difficulties in Korea or increases in corporate reorganizations and bankruptcies could result in layoffs and higher unemployment. Such developments could lead to social unrest and substantially increase government expenditures for unemployment compensation and other costs for social programs. According to statistics from the Korea National Statistical Office, the unemployment rate increased from 3.8% in 2019 to 4.0% in 2020, but decreased to 3.7% in 2021 and further decreased to 2.9% in 2022. Further increases in unemployment and any resulting labor unrest in the future could adversely affect our operations, as well as the operations of many of our customers and their ability to repay their loans, and could adversely affect the financial condition of Korean companies in general, depressing the price of their securities. Any of these developments may have an adverse effect on our financial condition and results of operations.
Risks relating to our common stock and ADSs
We or our major shareholders may sell shares of our common stock in the future, and such sales may adversely affect the market price of our common stock and ADSs and may dilute your investment and relative ownership interest in us.
We have no current plans for any public offerings of our common stock, ADSs or securities exchangeable for or convertible into such securities. However, it is possible that we may decide to offer or sell such securities in the future.
IMM Private Equity, Inc., through its special purpose company Nobis1, Inc., currently owns 40,560,000 shares, or 5.57%, of our outstanding common stock. BlackRock Fund Advisors currently owns 36,888,004 shares, or 5.07%, of our outstanding common stock. See “Item 7.A. Major Shareholders.” In the future, such major shareholders or any other shareholder that owns a large number of shares of our outstanding common stock may choose to sell large blocks of our common stock in a public offering or privately to a strategic or financial investor. Any future offerings or sales by us of our common stock or ADSs or securities exchangeable for or convertible into such securities, significant sales of our common stock by a major shareholder, or the public perception that such an offering or sale may occur, could have an adverse effect on the market price of our common stock and ADSs. Furthermore, any offerings by us in the future of any such securities could have a dilutive impact on your investment and relative ownership interest in us.
Prior sales by the KDIC of shares of our common stock may result in adverse Korean tax consequences for you.
Under applicable Korean tax laws, a non-Korean holder who held Woori Bank’s common stock or ADSs prior to our establishment as a new financial holding company in January 2019 pursuant to a “comprehensive stock transfer” under Korean law will be able to defer taxation on any capital gains arising from the stock transfer, by virtue of the Special Tax Treatment Control Law of Korea, or the STTCL, until such holder’s sale of our common stock or ADSs received in the stock transfer, at which time the tax basis of such common stock or ADSs will be the acquisition price at which such holder acquired such Woori Bank common stock or ADSs. However, non-Korean holders that are corporations may not defer such portion of tax on capital gains arising from the stock transfer that is attributable to the amount by which the market price of our common stock or ADSs (as calculated in accordance with applicable Korean laws and regulations) is in excess of the market price of
31
Table of Contents
Woori Bank’s common stock or ADSs. Any such non-Korean holder of our common stock or ADS, including a corporation, which seeks to defer taxation on capital gains arising from the stock transfer will be required to submit a tax deferral application in prescribed form to the Korean tax authorities when filing its tax return for the 2019 tax year. Notwithstanding the foregoing, if the KDIC disposed of 50% or more of the shares of our common stock it received in the stock transfer between the end of 2019 and the end of 2021, the deferral of taxation on capital gains will not be available, and a non-Korean holder who received our common stock or ADSs in the stock transfer will generally be subject to Korean tax on capital gains in an amount equal to the lower of (i) 11.0% (inclusive of local income tax) of the gross realization proceeds (i.e., the value of our common stock or ADSs such holder received in the stock transfer) or (ii) 22.0% (inclusive of local income tax) of the net realized gain. However, such capital gains tax may not apply, or may apply at a reduced rate, if such holder establishes its entitlement to an exemption or rate reduction under an applicable tax treaty or Korean tax law. See “Item 10.E. Taxation—Korean Taxation—Tax Treaties” for information regarding tax treaty benefits.
While the KDIC received a tax ruling from the National Tax Service of Korea in June 2019 that the sale of the shares of our common stock it received in the stock transfer will be treated as a sale of shares due to an unavoidable reason (i.e., a disposal of shares in order to fulfil a legally imposed obligation) and that the deferral of taxation on capital gains will continue to apply even if the sale occurred within two years from the end of 2019, there is no assurance that such tax ruling will be followed. Accordingly, if you received our common stock or ADSs in the stock transfer, prior sales by the KDIC of shares of our common stock may result in adverse Korean tax consequences for you.
Ownership of our common stock is restricted under Korean law.
Under the Financial Holding Company Act, a single shareholder, together with its affiliates, is generally prohibited from owning more than 10.0% of the issued and outstanding shares of voting stock of a bank holding company such as us that controls a nationwide bank, with the exception of certain shareholders that are non-financial business group companies, whose applicable limit was reduced from 9.0% to 4.0% pursuant to an amendment of the Financial Holding Company Act which became effective in February 2014. To the extent that the total number of shares of our common stock (including those represented by ADSs) that you and your affiliates own together exceeds the applicable limits, you will not be entitled to exercise the voting rights for the excess shares, and the Financial Services Commission may order you to dispose of the excess shares within a period of up to six months. Failure to comply with such an order would result in an administrative fine of up to 0.03% of the book value of such shares per day until the date of disposal. Non-financial business group companies can no longer acquire more than 4.0% of the issued and outstanding shares of voting stock of a bank holding company pursuant to the amended Financial Holding Company Act, which grants an exception for non-financial business group companies which, at the time of the enactment of the amended provisions, held more than 4.0% of the shares thereof with the approval of the Financial Services Commission before the amendment. See “Item 4.B. Business Overview—Supervision and Regulation—Principal Regulations Applicable to Financial Holding Companies—Restrictions on Ownership of a Financial Holding Company.”
You will not be able to exercise dissent and appraisal rights unless you have withdrawn the underlying shares of our common stock and become our direct shareholder.
In some limited circumstances, including the transfer of the whole or any significant part of our business and the merger or consolidation of us with another company, dissenting shareholders have the right to require us to purchase their shares under Korean law. However, if you hold our ADSs, you will not be able to exercise such dissent and appraisal rights if the depositary refuses to do so on your behalf. Our deposit agreement does not require the depositary to take any action in respect of exercising dissent and appraisal rights. In such a situation, holders of our ADSs must withdraw the underlying common stock from the ADS facility (and incur charges relating to that withdrawal) and become our direct shareholder prior to the record date of the shareholders’ meeting at which the relevant transaction is to be approved, in order to exercise dissent and appraisal rights.
32
Table of Contents
You may be limited in your ability to deposit or withdraw common stock.
Under the terms of our deposit agreement, holders of common stock may deposit such stock with the depositary’s custodian in Korea and obtain ADSs, and holders of ADSs may surrender ADSs to the depositary and receive common stock. However, to the extent that a deposit of common stock exceeds any limit that we may specify from time to time, that common stock will not be accepted for deposit unless our consent with respect to such deposit has been obtained. We currently have not set any such limit; however, we have the right to do so at any time. Under the terms of the deposit agreement, no consent would be required if the shares of common stock were to be obtained through a dividend, free distribution, rights offering or reclassification of such stock. We have consented, under the terms of the deposit agreement, to any deposit unless the deposit would be prohibited by applicable laws or violate our articles of incorporation. If we choose to impose a limit on deposits in the future, however, we might not consent to the deposit of any additional common stock. In that circumstance, if you surrender ADSs and withdraw common stock, you may not be able to deposit the stock again to obtain ADSs. See “Item 4.B. Business Overview—Supervision and Regulation—Restrictions Applicable to Shares” and “Item 10.D. Exchange Controls—Restrictions Applicable to Shares.”
You will not have preemptive rights in some circumstances.
The Korean Commercial Code, as amended, and our articles of incorporation require us, with some exceptions, to offer shareholders the right to subscribe for new shares of our common stock in proportion to their existing shareholding ratio whenever new shares are issued. If we offer any rights to subscribe for additional shares of our common stock or any rights of any other nature, the depositary, after consultation with us, may make the rights available to holders of our ADSs or use commercially feasible efforts to dispose of the rights on behalf of such holders, in a riskless principal capacity, and make the net proceeds available to such holders. The depositary will make rights available to holders of our ADSs only if:
| • | we have requested in a timely manner that those rights be made available to such holders; |
| • | the depositary has received the documents that are required to be delivered under the terms of the deposit agreement, which may include confirmation that a registration statement filed by us under the U.S. Securities Act of 1933, as amended, or the Securities Act, is in effect with respect to those shares or that the offering and sale of those shares is exempt from or is not subject to the registration requirements of the Securities Act; and |
| • | the depositary determines, after consulting with us, that the distribution of rights is lawful and commercially feasible. |
Holders of our common stock located in the United States may not exercise any rights they receive absent registration or an exemption from the registration requirements under the Securities Act.
We are under no obligation to file any registration statement with the U.S. Securities and Exchange Commission or to endeavor to cause such a registration statement to be declared effective. Moreover, we may not be able to establish an exemption from registration under the Securities Act. Accordingly, you may be unable to participate in our rights offerings and may experience dilution in your holdings. If a registration statement is required for you to exercise preemptive rights but is not filed by us or is not declared effective, you will not be able to exercise your preemptive rights for additional ADSs and you will suffer dilution of your equity interest in us. If the depositary is unable to sell rights that are not exercised or not distributed or if the sale is not lawful or feasible, it will allow the rights to lapse, in which case you will receive no value for these rights.
Your dividend payments and the amount you may realize upon a sale of your ADSs will be affected by fluctuations in the exchange rate between the U.S. dollar and the Won.
Our common stock is listed on the KRX KOSPI Market of the Korea Exchange and quoted and traded in Won. Cash dividends, if any, in respect of the shares represented by the ADSs will be paid to the depositary in Won and then converted by the depositary into U.S. dollars, subject to certain conditions. Accordingly, fluctuations in the exchange rate between the Won and the U.S. dollar will affect, among other things, the
33
Table of Contents
amounts you will receive from the depositary in respect of dividends, the U.S. dollar value of the proceeds that you would receive upon a sale in Korea of the shares of our common stock obtained upon surrender of ADSs and the secondary market price of ADSs. Such fluctuations will also affect the U.S. dollar value of dividends and sales proceeds received by holders of our common stock.
The market value of your investment may fluctuate due to the volatility of, and government intervention in, the Korean securities market.
Our common stock is listed on the KRX KOSPI Market, which has a smaller market capitalization and is more volatile than the securities markets in the United States and many European countries. The market value of ADSs may fluctuate in response to the fluctuation of the trading price of shares of our common stock on the KRX KOSPI Market. The KRX KOSPI Market has experienced substantial fluctuations in the prices and volumes of sales of listed securities and the KRX KOSPI Market has prescribed a fixed range in which share prices are permitted to move on a daily basis. The KOSPI was 2,575.9 on April 17, 2023. There is no guarantee that the stock prices of Korean companies will not decline again in the future. Like other securities markets, including those in developed markets, the Korean securities market has experienced problems including market manipulation, insider trading and settlement failures. The recurrence of these or similar problems could have a material adverse effect on the market price and liquidity of the securities of Korean companies, including our common stock and ADSs, in both the domestic and the international markets.
The Korean government has the potential ability to exert substantial influence over many aspects of the private sector business community, and in the past has exerted that influence from time to time. For example, the Korean government has induced mergers to reduce what it considers excess capacity in a particular industry and has also induced private companies to publicly offer their securities. Similar actions in the future could have the effect of depressing or boosting the Korean securities market, whether or not intended to do so. Accordingly, actions by the government, or the perception that such actions are taking place, may take place or has ceased, may cause sudden movements in the market prices of the securities of Korean companies in the future, which may affect the market price and liquidity of our common stock and ADSs.
If the Korean government deems that emergency circumstances are likely to occur, it may restrict you and the depositary from converting and remitting dividends and other amounts in U.S. dollars.
If the Korean government deems that certain emergency circumstances, including, but not limited to, severe and sudden changes in domestic or overseas economic circumstances, extreme difficulty in stabilizing the balance of payments or implementing currency, exchange rate and other macroeconomic policies, have occurred or are likely to occur, it may impose certain restrictions provided for under the Foreign Exchange Transaction Law, including the suspension of payments or requiring prior approval from governmental authorities for any transaction. See “Item 10.D. Exchange Controls—General.”
Other Risks
You may not be able to enforce a judgment of a foreign court against us.
We are a corporation with limited liability organized under the laws of Korea. A majority of our directors and officers and other persons named in this annual report reside in Korea, and a significant portion of the assets of our directors and officers and other persons named in this annual report and a substantial majority of our assets are located in Korea. As a result, it may not be possible for you to effect service of process within the United States, or to enforce against them or us in the United States judgments obtained in United States courts based on the civil liability provisions of the federal securities laws of the United States. There is doubt as to the enforceability in Korea, either in original actions or in actions for enforcement of judgments of United States courts, of civil liabilities predicated on the United States federal securities laws.
34
Table of Contents
| Item 4. | INFORMATION ON THE COMPANY |
For certain of the information required by subpart 1400 of Regulation S-K not included in this Item 4, see “Item 8.A. Consolidated Statements and Other Financial Information.”
| Item 4.A. | History and Development of the Company |
Overview
We are a financial holding company that was newly established on January 11, 2019 pursuant to a “comprehensive stock transfer” under Korean law, whereby holders of the common stock of Woori Bank and certain of its subsidiaries transferred all of their shares to us and in return received shares of our common stock. We were established under the Financial Holding Company Act of Korea, which, together with associated regulations and a related Enforcement Decree, enables banks and other financial institutions, including insurance companies, invest trust companies, credit card companies and securities companies, to be organized and managed under the auspices of a single financial holding company. As a result of the stock transfer, Woori Bank and certain of its former wholly-owned subsidiaries, Woori FIS Co., Ltd., Woori Finance Research Institute Co., Ltd., Woori Credit Information Co., Ltd., Woori Fund Services Co., Ltd. and Woori Private Equity Asset Management Co., Ltd., became our direct and wholly-owned subsidiaries. Accordingly, our overall business and operations after the stock transfer, on a consolidated basis, are identical to those of Woori Bank on a consolidated basis immediately prior to the stock transfer.
The stock transfer constituted a succession for purposes of Rule 12g-3(a) under the Securities Exchange Act of 1934, as amended, such that our common stock was deemed registered under Section 12(b) of the Exchange Act by operation of Rule 12g-3(a). Following the stock transfer, we file reports under the Exchange Act as the successor issuer to Woori Bank.
Our legal and commercial name is Woori Financial Group Inc. Our registered office and corporate headquarters are located at 51, Sogong-ro, Jung-gu, Seoul, Korea. Our telephone number is 822-2125-2000. Our website address is https://www.woorifg.com.
The U.S. Securities and Exchange Commission, or the SEC, maintains a website (http://www.sec.gov), which contains reports, proxy and information statements and other information regarding issuers that file electronically with the SEC.
History
Establishment of Woori Bank
The predecessor of Woori Bank was originally established in 1899 and operated as the Commercial Bank of Korea until 1998, when it was acquired by the KDIC and merged with another commercial bank, Hanil Bank, which had been established in 1932. The surviving entity in the merger was renamed Hanvit Bank, which name was changed to Woori Bank in May 2002.
Establishment of Woori Finance Holdings
In response to a financial and economic downturn in Korea beginning in late 1997, the Korean government announced and implemented a series of comprehensive policy packages to address structural weaknesses in the Korean economy and the financial sector. As part of these measures, on October 1, 1998, the KDIC purchased 95.0% of the outstanding shares of the Commercial Bank of Korea and 95.6% of the outstanding shares of Hanil Bank, and subsequently merged Hanil Bank into the Commercial Bank of Korea (which was renamed Hanvit Bank). These banks had suffered significant losses in 1997 and 1998. The Korean government took pre-emptive measures to ensure the survival of these and other banks as it believed that bank failures would have a substantial negative impact on the Korean economy.
In December 2000, the Korean government wrote down the capital of Hanvit Bank, as well as Kyongnam Bank, Kwangju Bank and Peace Bank of Korea, to zero through a Financial Services Commission capital
35
Table of Contents
reduction order pursuant to its regulatory authority. The Korean government immediately recapitalized these banks by injecting public funds through the KDIC. In December 2000, the KDIC made initial capital injections to Hanvit Bank (₩2,764 billion), Kyongnam Bank (₩259 billion), Kwangju Bank (₩170 billion) and Peace Bank of Korea (₩273 billion), in return for new shares of those banks. The KDIC also agreed to make additional capital contributions, not involving the issuance of new shares, in the future, which were made in September 2001 to Hanvit Bank (₩1,877 billion), Kyongnam Bank (₩94 billion), Kwangju Bank (₩273 billion) and Peace Bank of Korea (₩339 billion).
In addition, in November 2000, the KDIC established Hanaro Merchant Bank to restructure substantially all of the assets and liabilities of four failed merchant banks (Yeungnam Merchant Banking Corporation, Central Banking Corporation, Korea Merchant Banking Corporation and H&S Investment Bank) that were transferred to it.
In March 2001, the KDIC established Woori Finance Holdings as a new financial holding company and transferred all of the shares in each of Hanvit Bank, Kyongnam Bank, Kwangju Bank, Peace Bank of Korea and Hanaro Merchant Bank held by the KDIC to Woori Finance Holdings in exchange for its newly issued shares. Accordingly, Woori Finance Holdings became the sole owner of those entities. Woori Finance Holdings subsequently listed its common stock on the KRX KOSPI Market in June 2002 and listed ADSs representing its common stock on the New York Stock Exchange in September 2003.
Reorganization and Expansion of Woori Finance Holdings and Woori Bank
Following its establishment and its acquisition of its subsidiaries, Woori Finance Holdings developed a reorganization and integration plan designed to reorganize the corporate structure of some of its subsidiaries and integrate its operations under a single management structure. As part of this plan:
| • | From December 2001 through February 2002, Peace Bank of Korea was restructured by: |
| • | splitting off its commercial banking operations and merging them into Woori Bank; |
| • | changing the name of Peace Bank of Korea to Woori Credit Card; and |
| • | transferring the credit card operations of Woori Bank to Woori Credit Card. |
| • | In March 2003, the credit card operations of Kwangju Bank were transferred to Woori Credit Card. |
| • | In August 2003, Woori Investment Bank (formerly named Hanaro Merchant Bank) was merged with Woori Bank. |
In succeeding years, Woori Finance Holdings and Woori Bank further reorganized and expanded their operations, including through mergers, acquisitions and investments. For example:
| • | In March 2004, Woori Credit Card was merged with Woori Bank. |
| • | In October and December 2004, Woori Finance Holdings acquired an aggregate 27.3% voting interest in LG Investment & Securities Co., Ltd., which was subsequently renamed Woori Investment & Securities. |
| • | In May 2005, Woori Finance Holdings acquired a 90.0% interest in LG Investment Trust Management Co., Ltd., which was subsequently renamed Woori Asset Management. |
| • | In October 2005, Woori Bank established Woori Private Equity as a consolidated subsidiary. |
| • | In April 2008, Woori Finance Holdings acquired a 51.0% interest in LIG Life Insurance Co., Ltd., which was subsequently renamed Woori Aviva Life Insurance. |
| • | In March 2011, Woori Finance Holdings acquired certain assets and assumed certain liabilities of Samhwa Mutual Savings Bank through a newly established subsidiary, Woori FG Savings Bank. |
| • | In September 2012, Woori FG Savings Bank acquired certain assets and assumed certain liabilities of Solomon Mutual Savings Bank. |
36
Table of Contents
| • | In October 2012, Woori Finance Holdings established Woori Finance Research Institute, which engages in economic and finance research, management consulting, and management and sales of intellectual property rights. |
| • | In April 2013, Woori Bank effected a spin-off of its credit card business into a newly established wholly-owned subsidiary of Woori Finance Holdings, Woori Card. |
| • | In June 2013, through an internal reorganization, Kumho Investment Bank (previously a subsidiary of Woori Private Equity and subsequently renamed Woori Investment Bank), in which Woori Finance Holdings held a 41.6% interest, became its consolidated subsidiary, and ₩70 billion of new capital was injected into such entity. |
| • | In January 2014, Woori Bank completed the purchase of an additional 27% equity interest (in addition to the 6% equity interest it previously acquired through its subsidiary PT. Bank Woori Indonesia) in PT. Bank Himpunan Saudara 1906 Tbk, an Indonesian commercial bank with a network of over 100 branches and offices throughout Indonesia. In December 2014, PT. Bank Woori Indonesia merged with and into PT. Bank Himpunan Saudara 1906 Tbk. The merged entity, in which Woori Bank currently holds an 84.2% equity interest, was renamed PT Bank Woori Saudara Indonesia 1906 Tbk and became its consolidated subsidiary. |
| • | In October 2016, Woori Bank acquired a 51% equity interest in Wealth Development Bank, a thrift bank in the Philippines with a network of 16 branches and approximately 300 employees. |
| • | In November 2016, Woori Bank obtained a banking license to establish a local subsidiary in Vietnam, Woori Bank Vietnam, which commenced operations in January 2017. |
| • | In June 2018, Woori Bank acquired VisionFund (Cambodia) Ltd., a microfinance deposit-taking institution in Cambodia, and renamed it WB Finance Co., Ltd. In February 2020, WB Finance Co., Ltd. merged with Woori Finance (Cambodia) Plc., a Cambodian microfinance institution, and in November 2021, it obtained a commercial banking license from the Cambodian financial authorities and began its nationwide operations as Woori Bank (Cambodia) PLC. |
| • | In November 2018, Woori Bank established a German subsidiary, Woori Bank Europe Gmbh, which is headquartered in Frankfurt. |
Privatization Plan
In June 2013, the Korean government, through the Public Funds Oversight Committee of the Financial Services Commission, announced an updated plan to privatize Woori Finance Holdings and its former subsidiaries, including Woori Bank. The privatization plan provided for the segregation of such entities into three groups and the disposal of the Korean government’s interest in these entities held through the KDIC in a series of transactions, most of which have been completed.
Spin-off of Kwangju Bank and Kyongnam Bank
In August 2013, the board of directors of Woori Finance Holdings approved a plan to establish two new companies, KJB Financial Group and KNB Financial Group (which we refer to as the New Holdcos), through a spin-off of its businesses related to the holding of the shares and thereby controlling the business operations of Kwangju Bank and Kyongnam Bank, respectively. The spin-off was approved at an extraordinary general meeting of the shareholders of Woori Finance Holdings held in January 2014 and was effected in May 2014. After the spin-off, KJB Financial Group owned the shares of Kwangju Bank previously held by Woori Finance Holdings, and KNB Financial Group owned the shares of Kyongnam Bank previously held by Woori Finance Holdings. Woori Finance Holdings no longer owned any shares of Kwangju Bank or Kyongnam Bank, and neither they nor the New Holdcos were its subsidiaries, after the spin-off. Following the spin-off, each of these banks was merged with the relevant New Holdco.
In October 2014, the KDIC sold its 56.97% ownership interest in Kwangju Bank and Kyongnam Bank to JB Financial Group and BNK Financial Group (formerly known as BS Financial Group), respectively.
37
Table of Contents
Disposal of Woori Financial, Woori Asset Management, Woori F&I, Woori Investment & Securities, Woori Aviva Life Insurance and Woori FG Savings Bank
In March 2014, Woori Finance Holdings sold its 52.0% ownership interest in Woori Financial to KB Financial Group for the sale price of ₩280 billion.
In May 2014, Woori Finance Holdings sold its 100.0% ownership interest in Woori Asset Management to Kiwoom Securities for the sale price of ₩76 billion.
In June 2014, Woori Finance Holdings sold its 100.0% ownership interest in Woori F&I to Daishin Securities for the sale price of ₩368 billion.
In June 2014, Woori Finance Holdings also sold its 37.9% ownership interest in Woori Investment & Securities, its 51.6% ownership interest in Woori Aviva Life Insurance and its 100.0% ownership interest in Woori FG Savings Bank to NongHyup Financial Group Inc. for the sale price of ₩1,039 billion in a collective sale.
Merger of Woori Bank and Woori Finance Holdings
In July 2014, Woori Bank entered into a merger agreement with Woori Finance Holdings, providing for the merger of Woori Finance Holdings with and into Woori Bank. The merger agreement was approved by the shareholders of Woori Finance Holdings at an extraordinary general meeting held on October 10, 2014. Pursuant to the merger agreement, Woori Finance Holdings merged with and into Woori Bank on November 1, 2014, such that Woori Bank remained as the surviving entity, and Woori Finance Holdings ceased to exist, after the merger. In connection with the merger, shareholders of Woori Finance Holdings recorded in its shareholder register as of November 1, 2014 received one share of Woori Bank’s common stock for each share of common stock of Woori Finance Holdings they held.
As a result of the merger, the other remaining subsidiaries of Woori Finance Holdings, including Woori Card, Woori Private Equity, Woori FIS, Woori Investment Bank and Woori Finance Research Institute, became Woori Bank’s subsidiaries. Accordingly, Woori Bank’s overall business and operations after the merger, on a consolidated basis, were substantially identical to those of Woori Finance Holdings on a consolidated basis prior to the merger.
Woori Bank was an unlisted corporation prior to the merger, while Woori Finance Holdings had its common stock listed on the KRX KOSPI Market and its ADSs listed on the New York Stock Exchange. Following the merger, Woori Bank became newly listed on the KRX KOSPI Market and succeeded to Woori Finance Holdings’ listing on the New York Stock Exchange.
Sales of the KDIC’s Ownership Interest
Pursuant to the Korean government’s privatization plan, in December 2014, the KDIC sold 40,143,022 shares of Woori Bank’s common stock (representing 5.9% of its outstanding common stock) through a bidding process in Korea. In addition, in December 2016 and January 2017, the KDIC sold an aggregate of 200,685,395 shares of Woori Bank’s common stock (representing 29.7% of its outstanding common stock) in stakes ranging from 3.7% to 6.0% to seven financial companies through a bidding process. In 2017, pursuant to a series of transactions related to call options previously granted in connection with the KDIC’s sale of Woori Bank’s common stock in December 2014, the KDIC sold an aggregate of 19,852,364 shares of Woori Bank’s common stock (representing 2.9% of its outstanding common stock). As a result of such transactions, the KDIC’s ownership interest in Woori Bank was reduced to 18.4%. In connection with our establishment in January 2019 as a new financial holding company pursuant to a “comprehensive stock transfer” under Korean law, the KDIC received 124,604,797 shares of our outstanding common stock in exchange for the common stock of Woori Bank it owned. In June 2019, the Financial Services Commission approved the KDIC’s plan to sell all such common stock in multiple transactions by 2022. In April 2021, pursuant to such plan, the KDIC sold 14,445,354 shares of our common stock (representing 2.0% of our outstanding common stock) in a block trade. In December 2021, the KDIC sold an aggregate 9.3% of our outstanding common stock in stakes ranging from 1.0% to 4.0% to four
38
Table of Contents
companies and 1.0% to our employee stock ownership association. In February 2022, the KDIC sold an aggregate of 15,860,000 shares of our common stock (representing 2.2% of our outstanding common stock) in a block trade. In May 2022, the KDIC further sold an aggregate of 17,000,000 shares of our common stock (representing 2.3% of our outstanding common stock) in a block trade. The KDIC currently owns 1.3% of our outstanding common stock.
In December 2016, in connection with the KDIC’s sale of shares of Woori Bank’s common stock, Woori Bank entered into an agreement with the KDIC, pursuant to which Woori Bank was required to use its best efforts to cause an employee of the KDIC nominated by it to be appointed as Woori Bank’s non-standing director, so long as the KDIC either (x) owned 10% or more of Woori Bank’s total issued shares with voting rights or (y) owned more than 4% but less than 10% of Woori Bank’s total issued shares with voting rights and remained its largest shareholder (other than the National Pension Service of Korea). After such agreement with Woori Bank expired, we entered into an agreement with the KDIC with similar terms in July 2019, which has since been terminated as the KDIC’s ownership interest in us has been reduced to less than 4.0%.
Establishment of Woori Financial Group
We were established as a new financial holding company on January 11, 2019 pursuant to a “comprehensive stock transfer” under Korean law, whereby holders of the common stock of Woori Bank and certain of its subsidiaries transferred all of their shares to us and in return received shares of our common stock. The stock transfer was approved by the shareholders of Woori Bank at an extraordinary general meeting held on December 28, 2018. In the stock transfer, each holder of one share of Woori Bank’s common stock recorded in its shareholder register as of November 15, 2018 received one share of our common stock. In addition, we issued our common stock to Woori Bank in exchange for the outstanding common stock of certain of Woori Bank’s wholly-owned subsidiaries that became our wholly-owned direct subsidiaries. Specifically, in connection with the stock transfer, Woori Bank transferred all shares of common stock held by it of Woori FIS Co., Ltd., Woori Finance Research Institute Co., Ltd., Woori Credit Information Co., Ltd., Woori Fund Services Co., Ltd. and Woori Private Equity Asset Management Co., Ltd., all of which were Woori Bank’s wholly-owned subsidiaries, to us and, as consideration for such transferred shares, received shares of our common stock in accordance with the specified stock transfer ratio applicable to each such subsidiary. Following the completion of the stock transfer, Woori Bank, Woori FIS Co., Ltd., Woori Finance Research Institute Co., Ltd., Woori Credit Information Co., Ltd., Woori Fund Services Co., Ltd. and Woori Private Equity Asset Management Co., Ltd. became our direct and wholly-owned subsidiaries.
39
Table of Contents
The following chart illustrates the organizational structure of Woori Bank prior to the completion of the stock transfer:
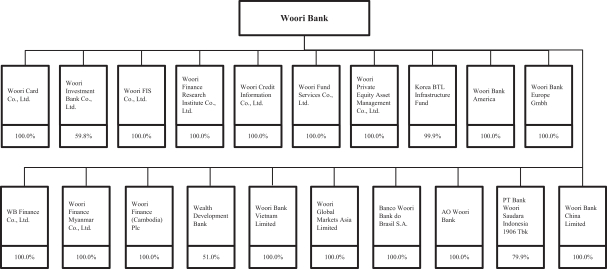
The following chart illustrates our organizational structure after the completion of the stock transfer:
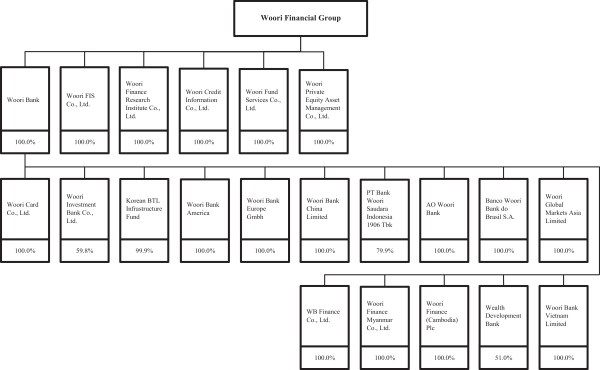
40
Table of Contents
In connection with the stock transfer, Woori Bank’s common stock was suspended from trading from January 9, 2019 and was de-listed from the KRX KOSPI Market on February 13, 2019. Following the stock transfer, our common stock was newly listed on the KRX KOSPI Market on February 13, 2019, and our ADSs succeeded to the listing of Woori Bank’s ADSs on the New York Stock Exchange on January 11, 2019.
The shareholders of Woori Bank were entitled to exercise appraisal rights with respect to its common stock held by them at a purchase price of ₩16,079 per share, in accordance with Korean law. The period for exercise of appraisal rights started on December 28, 2018 and ended on January 7, 2019, during which shareholders exercised appraisal rights with respect to an aggregate of 11,453,702 shares of common stock of Woori Bank. The payment of the purchase price for such common stock held by the exercising shareholders was made on January 9, 2019, in the aggregate amount of ₩184 billion. As a result of the exchange for our common stock of such treasury shares obtained by Woori Bank pursuant to the exercise of appraisal rights by its shareholders and other treasury shares it held, as well as the transfer by Woori Bank of the shares it held in its relevant subsidiaries to us, Woori Bank received 18,346,782 shares of our common stock in the stock transfer, which constituted our treasury shares and represented 2.7% of our total issued common stock as of January 11, 2019. In March 2019, Woori Bank sold all such shares to institutional investors in a block trade.
Reorganization and Expansion of Woori Financial Group
After our establishment, we have further reorganized and expanded our operations, including through mergers, acquisitions and investments. For example:
| • | In August 2019, we acquired a 73% equity interest in Woori Asset Management Corp. (formerly known as Tongyang Asset Management Corp.) from Tongyang Life Insurance Co., Ltd., which became our consolidated subsidiary. |
| • | In September 2019, we conducted a “comprehensive stock exchange” under Korean law with Woori Bank, the former parent company of Woori Card, whereby Woori Bank transferred all of its Woori Card shares to us and in return received a combination of 42,103,377 shares of our common stock and ₩598 billion in cash, based on an exchange ratio of 0.4697442 shares of our common stock for each Woori Card share. As a result of the stock exchange, Woori Card ceased to be Woori Bank’s subsidiary and became our direct and wholly-owned subsidiary. Pursuant to applicable Korean law, Woori Bank was required to dispose of the 42,103,377 shares of our common stock it received in the stock exchange within six months of its consummation and sold 28,890,707 of such shares to Fubon Life Insurance Co., Ltd. in September 2019 for ₩358 billion and 13,212,670 of such shares in block trades in November 2019. |
| • | In September 2019, we acquired a 59.83% equity interest in Woori Investment Bank from Woori Bank, its former parent company, for a purchase price of ₩393 billion. As a result of the purchase, Woori Investment Bank ceased to be Woori Bank’s subsidiary and became our direct consolidated subsidiary. Woori Investment Bank’s common stock is listed on the KRX KOSPI Market. |
| • | In October 2019, Woori Bank acquired a 20% equity interest in Lotte Card Co., Ltd., which was the sixth largest credit card issuer in Korea at the time of acquisition, according to the Financial Statistics Information System, which is maintained by the Financial Supervisory Service. See “Item 4.B. Business Overview—Credit Cards.” |
| • | In December 2019, we acquired Woori Global Asset Management Co. (formerly known as ABL Global Asset Management Co.) from Anbang Asset Management (Hong Kong) Co., Limited, which became our consolidated subsidiary. |
| • | In December 2019, we acquired an aggregate 51% equity interest in Woori Asset Trust Co., Ltd. (formerly known as Kukje Asset Trust Ltd.), consisting of (i) 44.46% from its majority shareholders, including former chairman Jae-Eun Yoo, and (ii) 6.54% from Woori Bank. As part of the share purchase agreement with the former majority shareholders, we have agreed to additionally acquire a 21.27% |
41
Table of Contents
| equity interest in the future, subject to certain conditions. As of March 31, 2023, we have completed the additional acquisitions and currently own an aggregate 72.3% equity interest in Woori Asset Trust Co., Ltd., which is currently our consolidated subsidiary. |
| • | In December 2020, we acquired a 74.0% equity interest in Woori Financial Capital Co., Ltd. (formerly known as Aju Capital Co., Ltd.) from Well to Sea Investment for a purchase price of ₩572 billion. Notwithstanding the foregoing, for accounting purposes, Woori Financial Capital Co., Ltd. became our consolidated subsidiary in October 2020. In March 2021, we acquired Woori Savings Bank (formerly known as Aju Savings Bank) from Woori Financial Capital Co., Ltd., our consolidated subsidiary, and as a result, Woori Savings Bank ceased to be the subsidiary of Woori Financial Capital Co., Ltd. and became our direct consolidated subsidiary. We acquired additional equity interests in Woori Financial Capital Co., Ltd. of 12.9% and 3.6% from Aju Corporation in April 2021 and May 2021, respectively, as a result of which our aggregate equity interest in Woori Financial Capital Co., Ltd. became 90.5%. In August 2021, we acquired the remaining shares of Woori Financial Capital Co., Ltd. and integrated Woori Financial Capital Co., Ltd. as our wholly-owned subsidiary through a “comprehensive stock exchange” under Korean law. As a result of such transaction, the total number of our outstanding shares of common stock increased to 728,058,225. |
| • | In January 2022, we established Woori Financial F&I Inc. as a wholly-owned subsidiary to invest in non-performing loans and restructuring companies. |
| • | In March 2023, we acquired a 52% equity interest as well as the management rights in Daol Investment from its largest shareholder, Daol Investment & Securities Co., Ltd. Daol Investment is a venture capital company with ₩1.4 trillion of assets under its management, and has the 5th largest amount of assets under its management among all venture capital companies in South Korea based on applicable industry standards. We subsequently changed its name to Woori Venture Partners Co., Ltd. |
| Item 4.B. | Business Overview |
We are one of the largest financial holding companies in Korea, in terms of consolidated total assets, and our operations include Woori Bank, one of the largest commercial banks in Korea. Our subsidiaries collectively engage in a broad range of businesses, including corporate banking, consumer banking, credit card operations, investment banking, capital markets activities, international banking, asset management, bancassurance and other businesses. We provide a wide range of products and services to our customers, which mainly comprise small- and medium-sized enterprises and individuals, as well as some of Korea’s largest corporations. As of December 31, 2022, we had, on a consolidated basis, total assets of ₩480,474 billion, total liabilities of ₩448,847 billion and total equity of ₩31,627 billion.
As one of the leading financial services groups in Korea, we believe our core competitive strengths include the following:
Strong and long standing relationships with corporate customers. Historically our operations concentrated on large corporate customers. As a result, we believe that we have strong relationships with many of Korea’s leading corporate groups, and we are the main creditor bank to 10 of the 32 largest Korean corporate borrowers. Further enhancing our corporate loan portfolio is our ability to lend to small- and medium-sized enterprise customers. As of December 31, 2022, we had 424,062 small- and medium-sized enterprise borrowers.
Large and loyal retail customer base. With respect to our consumer banking operations, we have the third-largest deposit base among Korean commercial banks, and over 24.5 million retail customers, representing about half of the Korean adult population. Of these customers, over 10.0 million are active customers, meaning that they have a deposit account with us with a balance of at least ₩300,000 or have a loan account with us.
Extensive distribution and marketing network. We serve our customers primarily through one of the largest banking networks in Korea, comprising 713 branches and 3,950 ATMs and cash dispensers as of December 31, 2022. Through Woori Bank, we also operate 10 dedicated corporate banking centers and 86 general managers for our large corporate customers and 774 relationship managers stationed at 582 branches (as well as 500 additional non-stationed employees who serve as relationship managers as needed) for our small- and medium-sized
42
Table of Contents
enterprise customers as of December 31, 2022. In addition, we have Internet and mobile banking platforms to enhance customer convenience, reduce service delivery costs and allow our branch staff to focus on marketing and sales.
Strong capital base. As of December 31, 2022, our consolidated equity totaled ₩32 trillion, and our total capital adequacy ratio was 15.30%. Our management team at the holding company carefully coordinates the capital and dividend plans of each of our subsidiaries and for the consolidated group to ensure that we optimize our capital position. We believe our strong capital base and coordinated capital management enable us to support growth of our core businesses and to pursue franchise-enhancing initiatives such as selective investments and acquisitions.
Strong and experienced management team. We benefit from our management team’s extensive experience accumulated with our subsidiaries and their predecessors. In January 2019, Tae-Seung Son assumed the role of our representative director, president and chief executive officer, which we believe enhanced the quality of our management team and our corporate governance. In March 2023, Jong-Yong Yim assumed the role of our representative director, president and chief executive officer, which we believe will continue to enhance the quality of our new management team and future competitiveness. We also believe that the extensive experience of many members of our management team in the financial sector will help us to continue to strengthen our operations.
Strategy
We aim to continue to build our position as a comprehensive financial services provider in Korea, with a view to having our business platform and operating structure on par with those of leading global financial institutions. The key elements of our strategy are as follows:
Provide comprehensive financial services and maximize synergies among our subsidiaries through our financial holding company structure. We plan to become a comprehensive financial services provider capable of developing and cross-selling a diverse range of products and services to our large existing base of retail and corporate banking customers, so that we can more effectively compete with leading domestic and international financial institutions. We believe that the adoption of a financial holding company structure will continue to help us increase customer satisfaction, generate synergies and maximize profitability, by creating an integrated system among our affiliated companies and allowing us to effectively provide various financial services, including comprehensive one-stop asset management services customized for clients, based on active expansion of non-banking and global business operations. One of the intended benefits of our financial holding company structure is that it enhances our ability to engage in mergers and acquisitions which we may decide to pursue as part of our strategy. For example, in an effort to expand our asset management services, we acquired equity interests in Woori Asset Management Corp., Woori Global Asset Management Co. and Woori Asset Trust Co., Ltd. in 2019 and Woori Financial Capital Co., Ltd. in 2020, which became our consolidated subsidiaries. We also established Woori Financial F&I Inc. as our direct consolidated subsidiary in January 2022. In an effort to expand our non-banking business, we acquired a 52% equity interest as well as the management rights in Daol Investment, a venture capital company with ₩1.4 trillion of assets under its management, in March 2023. We may consider additionally acquiring or merging with other financial institutions, particularly in the non-banking sector, to achieve more balanced growth and further diversify our revenue base.
In addition, we believe our financial holding company structure gives us a competitive advantage over stand-alone banks and other financial institutions by:
| • | allowing us to offer a more extensive range of financial products and services; |
| • | enabling us to share customer information, which is not permitted outside a financial holding company structure, thereby enhancing our risk management and cross-selling capabilities; |
| • | enhancing our ability to reduce costs in areas such as back-office processing and procurement; and |
| • | enabling us to raise and manage capital on a centralized basis. |
43
Table of Contents
We aim to maximize the synergies from our diverse financial product and service offerings by cross developing and selling products and encouraging collaboration of operations among our subsidiaries. In particular, we promote collaborative projects across our investment banking, digital, wealth management and global operations.
Further improve our asset quality and strengthen our risk management practices. Woori Bank was one of the earliest and most aggressive banks in Korea to actively reduce non-performing loans through charge-offs and sales to third parties, and has taken various measures to facilitate the disposal of its substandard or below loans. As a result of these and other initiatives, our ratio of non-performing loans to total loans has been maintained at a relatively low level in recent years. Specifically, our ratio of non-performing loans to total loans was 0.27% as of December 31, 2021 and 0.29% as of December 31, 2022.
One of our highest priorities is to maintain our strong asset quality and enhance our risk management practices on an ongoing basis. We have created a centralized group-wide risk management organization, installed a comprehensive warning and monitoring system, adopted uniform loan loss provisioning policies across all subsidiaries and implemented an advanced credit evaluation system called the “Credit Wizard” at Woori Bank. We have undertaken a series of group-wide reviews of our credit risk management procedures, as well as our risk management infrastructure, in order to develop and implement various measures to further standardize and improve our risk management procedures and systems.
We intend to vigorously maintain a manageable risk profile and balance that risk profile with adequate returns. We believe that our continual focus on upgrading our risk management systems and practices will enable us to maintain our strong asset quality, improve our financial performance and enhance our competitiveness.
Enhance customer profitability through optimization of channel usage, products and services for each customer segment. Our extensive distribution network and wide range of quality products and services has enabled us to serve our customers effectively. However, we intend to further enhance the value proposition to our customers by differentiating products and delivery channels based on the distinct needs of different customer segments.
Retail customers. We generally segment our retail customers into four groups: high net worth; mass affluent; middle class; and mass market. We believe we are relatively competitive in our core customer base, which includes mass affluent and middle class customers, and we serve these customers through our branches by selling customized higher margin services and products, such as investment advice, mutual funds, insurance and personal loans. For our mass market customers, we offer simple, easy-to-understand and relatively more standardized products such as basic deposit and lending products, including mortgage loans, and we encourage the use of alternative distribution channels such as the Internet, mobile banking and ATMs by our mass market customers such that we can serve them in a cost-efficient manner. We serve our high net worth individuals via branches and dedicated private banking centers staffed with experienced private bankers who offer sophisticated tailored financial services. In addition to serving retail customers based on segment, we also offer products and services based on customers’ life cycles to optimize our financial solutions for such customers.
Corporate customers. We continually and vigorously review our portfolio of large corporate and small- and medium-sized enterprise customers to refine our database of core accounts and industries in terms of profitability potential. We seek to expand our relationship beyond a pure lending relationship by promoting our foreign exchange, factoring, trade finance and investment banking services to our core small- and medium-sized enterprise customers and cross-selling our investment banking services, derivatives and other risk hedging products, as well as employee retirement products, to our core large corporate customers.
In addition to our customer segment-based marketing strategy, we aim to improve customer loyalty by strengthening customer retention and implementing a customer-focused sales culture and thereby develop a system pursuant to which our growth is facilitated by the growth of our customers.
Diversify our revenue base with a view to reducing our exposure to interest rate cycles and increasing profitability. Currently, in line with the Korean banking industry, we derive a substantial majority of our revenues from our loan and other credit products. To reduce our traditional reliance on lending as a source of
44
Table of Contents
revenue and to increase our profitability, we have been seeking to further diversify our earnings base, in particular by focusing on fee-based services, such as foreign exchange, trade finance and derivatives products, investment banking and advisory investment trust services for our corporate customers and asset management and mutual funds, investment trust products and beneficiary certificates, and life and non-life insurance products for our retail customers.
In addition, we intend to carefully consider potential acquisitions or other strategic investments that fit within our overall strategy. When considering acquisitions, we will focus on opportunities that supplement the range of products and services we offer and strengthen our existing customer base, enable us to maintain our standard for asset quality and profitability and provide us with a reasonable return on our investment. We may also consider acquiring or merging with other financial institutions, particularly in the non-banking sector, to achieve more balanced growth and further diversify our revenue base.
Accelerate digital innovation. The digital finance market has recently seen major growth due to the entry of fintech firms and the rapid digital transformations of our competitors, and the recent social distancing trends resulting from the COVID-19 pandemic have only accelerated the digitalization of finance. We have actively engaged in such trends through the adoption of innovative initiatives and aim to become a leader in digitization. As part of such efforts, in May 2015, Woori Bank established a mobile financial service platform through the launch of the first mobile-only banking service in Korea called WiBee Bank, and in April 2017, Kbank, formed by a consortium with KT Corporation and 20 other companies, in which we, through Woori Bank, own 12.6% of the equity with voting rights as of December 31, 2022, launched its services to become the first Internet-only bank in Korea.
We have also strengthened our alliances with information technology companies to provide innovative electronic payment methods, including Woori Samsung Pay with Samsung Electronics, which is a cardless ATM withdrawal system that utilizes smartphones. Through such partnership with Samsung Electronics, we introduced additional services that allow customers to open checking accounts and apply for debit cards from April 2019, and utilize currency exchange services using the Samsung Pay mobile application from May 2019.
In August 2016, we also launched a program to discover and provide support to innovative fintech startup companies in Korea, currently known as Digital Innovation Lab, or DinnoLab. In October 2019, DinnoLab established an office in Vietnam to support the overseas expansion of such startup companies. In June 2019, we introduced a robotic process automation system to improve our operations, minimize human error, support business activities and increase efficiency and productivity. In August 2019, we launched Woori WON Banking, our main mobile banking application, to provide enhanced digital platform services to our customers.
In May 2020, we launched our “Digital First, Change Everything” campaign and established the Digital Innovation Committee, which comprises certain executive officers, to focus on such group-wide digital strategies. In August 2020, we entered into a memorandum of understanding with KT Corporation to form a joint venture to collaborate on data-based financial services, including a business utilizing MyData, a government initiative for the pooling of customers’ data for the provision of financial services, and in January 2021, the Financial Services Commission granted MyData business licenses to Woori Bank and Woori Card. In addition, in 2021, we established the following four “Digital First, Digital Initiative” strategies to promote digital innovation by emphasizing the diffusion of digitalization over a medium- to long-term and creating visible results:
| • | enhance our competitive strengths in mobile banking; |
| • | digitalize our channels and business; |
| • | establish competitive advantages in new markets and technologies; and |
| • | reorganize our digital foundation. |
In 2021, pursuant to such strategies, we enhanced our mobile applications and established one-on-one channels that provide customized customer services, including “WON Concierge,” “WON Concierge PB” and “AI Consulting Bot,” an AI-based customer consultation service. We also established a second office of
45
Table of Contents
DinnoLab in October 2021 to enhance cooperation with startup companies and successfully launched MyData services in December 2021. Finally, we expanded our DevOps organization to provide the relevant personnel with additional autonomy and budget usage.
In February 2022, we recruited and hired a chief digital officer to oversee our group-wide digital strategies and initiatives. Subsequently we implemented a digital strategy to increase the use of our groupwide platforms by our customer base, build data and AI infrastructure, and develop and strengthen our digital-focused personnel. In January 2022, we started to utilize blockchain-based mobile driver’s license (mDL) through the adoption of Decentralized Identity (DID) technology. In December 2021, we entered into a MOU with LG AI Research and have subsequently partnered together to develop Artificial Intelligence (AI) language system that is focused on the financial industry, through LG AI Research’s super-giant AI model “EXAONE”. In September 2022, we started to develop guidelines and digital competency standards for our Career Development Program, in an effort to develop and support our digital professionals at the group level. In November 2022, we established a Digital Initiative Planning Committee to focus on further development in data and new technology governance at the group level. Through these initiatives, and among others, as of December 31, 2022, Woori Bank and Woori Card have achieved an aggregate of 10 million monthly active users. We are in the process of developing the required strategy and the infrastructure to allow universal banking centered around bank application systems, and are striving towards having such system available by 2024.
Expand presence in the global market. We continually expand our global network mainly through Woori Bank and Woori Card and aim to strengthen our overseas operations to diversify our profit base, which is currently concentrated in Korea. We currently maintain, in aggregate, over 560 branches in over 20 countries and have made major strides in our overseas operations since our establishment of the first overseas branch of a Korean commercial bank in Tokyo, Japan in 1968. In December 2014, Woori Bank became the first Korean bank to be involved in a merger with a listed overseas bank when its subsidiary PT. Bank Woori Indonesia merged with and into PT. Bank Himpunan Saudara 1906 Tbk, which was renamed PT Bank Woori Saudara Indonesia 1906 Tbk. In October 2016, Woori Bank acquired a 51% equity interest in Wealth Development Bank, a thrift bank in the Philippines, and partnered with Vicsal Development Corporation, an operator of department stores and supermarkets in the Philippines and another major shareholder of Wealth Development Bank, to actively expand its base of local customers. In addition, in November 2016, Woori Bank obtained a banking license to establish a local subsidiary in Vietnam, Woori Bank Vietnam, which commenced operations in January 2017 and manages the local operations of Woori Bank’s branches in Vietnam. Furthermore, Woori Bank has expanded the scope of its operations in Myanmar, Indonesia, Cambodia and the Philippines in order to capitalize on the potential for high growth and profitability in Southeast Asia and established a representative office in Poland as well as additional branches in India. In June 2018, Woori Bank acquired VisionFund (Cambodia) Ltd., a microfinance deposit-taking institution in Cambodia, and renamed it WB Finance Co., Ltd, and in November 2018, Woori Bank established a German subsidiary, Woori Bank Europe Gmbh, which is headquartered in Frankfurt. In February 2020, WB Finance Co., Ltd. merged with Woori Finance (Cambodia) Plc., a Cambodian microfinance institution, and in November 2021, it obtained a commercial banking license from the Cambodian financial authorities and began its nationwide operations as Woori Bank (Cambodia) PLC. Woori Bank has a presence in over 20 countries with over 460 branches and offices outside Korea. In 2016, Woori Card expanded overseas by establishing TuTu Finance-WCI Myanmar Co., Ltd., microfinance firm, in Myanmar. In August 2022, Woori Card acquired a 82.03% equity interest in PT Batavia Prosperindo Finance, Tbk, a consumer finance company in Indonesia, and renamed it to PT Woori Finance Indonesia, Tbk.
Develop and increase productivity of our professional workforce. We aim to retain the most qualified and highly-trained professionals in the market, and we intend to continue to focus on the development and training of our core professionals. In order to boost employee morale and productivity, we aim to create an environment that nurtures development and growth and accordingly have implemented performance-based incentive programs to recognize high performers on both an individual and business group level. In addition, a rigorous ethics management program and related measures have been instituted to reduce operational risk and help ensure compliance with our internal standards and policies.
46
Table of Contents
Corporate Banking
We provide commercial banking services to large corporate customers (including government-owned enterprises) and small- and medium-sized enterprises in Korea. Currently, our corporate banking operations consist mainly of lending to and taking deposits from our corporate customers. We also provide ancillary services on a fee basis, such as inter-account transfers, transfers of funds from branches and agencies of a company to its headquarters and transfers of funds from a company’s customer accounts to the company’s main account. We provide our corporate banking services predominantly through Woori Bank.
The following table sets forth the balances and percentages of our total lending and total deposits represented by our large corporate and small- and medium-sized enterprise customer loans and deposits, respectively, and the number of such customers as of the dates indicated:
| As of December 31, | ||||||||||||||||
| 2021 | 2022 | |||||||||||||||
| Amount | % of Total |
Amount | % of Total |
|||||||||||||
| (in billions of Won, except percentages) | ||||||||||||||||
| Loans(1): |
||||||||||||||||
| Small- and medium-sized enterprise(2) |
₩ | 112,696 | 33.4 | % | ₩ | 122,925 | 35.6 | % | ||||||||
| Large corporate(3) |
37,268 | 11.0 | 34,519 | 10.0 | ||||||||||||
| Others(4) |
29,753 | 8.8 | 33,657 | 9.7 | ||||||||||||
|
|
|
|
|
|
|
|
|
|||||||||
| Total |
₩ | 179,717 | 53.2 | % | ₩ | 191,101 | 55.3 | % | ||||||||
|
|
|
|
|
|
|
|
|
|||||||||
| Deposits: |
||||||||||||||||
| Small- and medium-sized enterprise |
₩ | 65,975 | 20.8 | % | ₩ | 70,492 | 20.6 | % | ||||||||
| Large corporate |
103,846 | 32.7 | 108,536 | 31.7 | ||||||||||||
|
|
|
|
|
|
|
|
|
|||||||||
| Total |
₩ | 169,821 | 53.4 | % | ₩ | 179,028 | 52.3 | % | ||||||||
|
|
|
|
|
|
|
|
|
|||||||||
| Number of borrowers: |
||||||||||||||||
| Small- and medium-sized enterprise |
409,249 | 424,062 | ||||||||||||||
| Large corporate |
2,386 | 2,493 | ||||||||||||||
| (1) | Not including due from banks, other financial assets and outstanding credit card balances, and prior to deducting allowance for credit losses and present value discount or reflecting deferred origination costs. |
| (2) | Loans to “small- and medium-sized enterprises” as defined in the Framework Act on Small and Medium Enterprises of Korea and related regulations (and including project finance loans to such enterprises). See “—Small- and Medium-Sized Enterprise Banking.” |
| (3) | Loans to companies that are not “small- and medium-size enterprises” as defined in the Framework Act on Small and Medium Enterprises of Korea and related regulations, and typically including companies that have assets of ₩12 billion or more and are therefore subject to external audit under the Act on External Audit of Stock Companies. See “—Large Corporate Banking.” |
| (4) | Includes loans to governmental agencies, foreign loans and other corporate loans. |
Corporate loans we provide consist principally of the following:
| • | working capital loans, which are loans used for general working capital purposes, typically with a maturity of one year or less, including notes discounted and trade finance; and |
| • | facilities loans, which are loans to finance the purchase of materials, equipment and facilities, typically with a maturity of three years or more. |
On the deposit-taking side, we currently offer our corporate customers several types of corporate deposit products. These products can be divided into two general categories: demand deposits that have no restrictions on deposits or withdrawals, but which offer a relatively low interest rate; and time deposits from which withdrawals are restricted for a period of time, but offer higher interest rates. We also offer installment deposits, certificates of deposit and repurchase instruments. We offer varying interest rates on our deposit products depending upon the rate of return on our income-earning assets, average funding costs and interest rates offered by other nationwide commercial banks.
47
Table of Contents
Small- and Medium-Sized Enterprise Banking
We use the term “small- and medium-sized enterprises” as defined in the Framework Act on Small and Medium Enterprises of Korea and related regulations. Under the Framework Act on Small and Medium Enterprises of Korea and related regulations, in order to qualify as a small- and medium-sized enterprise, (i) the enterprise’s total assets at the end of the immediately preceding fiscal year must be less than ₩500 billion, (ii) the enterprise must meet the average or annual sales revenue standards prescribed by the Enforcement Decree of the Framework Act on Small and Medium Enterprises that are applicable to the enterprise’s primary business, and (iii) the enterprise must meet the standards of substantial management independence from ownership as prescribed by the Enforcement Decree of the Framework Act on Small and Medium Enterprises. However, pursuant to amendments to the Framework Act on Small and Medium Enterprises and its Enforcements Decree, which became effective in June 2020, an enterprise that qualifies as a small- and medium-sized enterprise pursuant to the above definition shall no longer be considered a small- and medium-sized enterprise if it is incorporated into, or is deemed to be incorporated into, a business group subject to certain disclosure requirements under the Monopoly Regulation and Fair Trade Act. Furthermore, certified social enterprises (as defined in the Social Enterprise Promotion Act of Korea), cooperatives, federations of cooperatives, social cooperatives and federations of social cooperatives, federations of heterogeneous cooperatives that consist of small- and medium-sized enterprises under the Framework Act on Small and Medium Enterprises (as defined in the Framework Act on Cooperatives), cooperatives, federations and national federations (as defined in the Consumer Cooperatives Act), as well as cooperatives, business cooperatives and federations of cooperatives (as defined in the Small and Medium Enterprise Cooperatives Act) that satisfy the requirements prescribed by the Framework Act on Small and Medium Enterprises, may also qualify as small- and medium-sized enterprises. The small- and medium-sized enterprise segment of the corporate banking market has grown significantly in recent years, including as a result of government measures to encourage lending to these enterprises. As of December 31, 2022, 19.7% of our small- and medium-sized enterprise loans were extended to borrowers in the manufacturing industry, 16.4% were extended to borrowers in the retail and wholesale industries, and 7.4% were extended to borrowers in the hotel, leisure and transportation industries.
We service our small- and medium-sized enterprise customers primarily through Woori Bank’s network of branches and small- and medium-sized enterprise relationship managers. As of December 31, 2022, Woori Bank had stationed one or more relationship managers at 582 branches, of which 421 were located in the Seoul metropolitan area. The relationship managers specialize in servicing the banking needs of small- and medium-sized enterprise customers and concentrate their marketing efforts on developing new customers in this segment. As of December 31, 2022, Woori Bank had a total of 774 small- and medium-sized enterprise relationship managers stationed at its branches (as well as 500 non-stationed employees who serve as relationship managers as needed).
In addition to increasing our dedicated staffing and branches, our strategy for this banking segment is to identify promising industry sectors and to develop and market products and services targeted towards customers in these sectors. We have also developed in-house industry specialists who can help us identify leading small- and medium-sized enterprises in, and develop products and marketing strategies for, these targeted industries. In addition, we operate customer loyalty programs at Woori Bank for our most profitable small- and- medium-sized enterprise customers and provide them with benefits and services such as preferential rates, free seminars and workshops and complementary invitations to cultural events.
Lending Activities. We provide both working capital loans and facilities loans to our small- and medium-sized enterprise customers. As of December 31, 2022, working capital loans and facilities loans accounted for 42.2% and 53.6% respectively, of our total small- and medium-sized enterprise loans. As of December 31, 2022, we had 424,062 small- and medium-sized enterprise borrowers.
As of December 31, 2022, secured loans and loans guaranteed by a third party accounted for 80.4% and 5.6%, respectively, of our small- and medium-sized enterprise loans. As of December 31, 2022, approximately 74.2% of the secured loans were secured by real estate or movable property and 0.5% were secured by deposits. Working capital loans generally have a maturity of one year, but may be extended on an annual basis for an aggregate term of three to five years. Facilities loans have a maximum maturity of 15 years.
48
Table of Contents
When evaluating the extension of working capital loans and facilities loans, we review the creditworthiness and capability to generate cash of the small- and medium-sized enterprise customer. Furthermore, we take corporate guarantees and credit guarantee letters from other financial institutions and use deposits that the borrower has with us or securities pledged to us as collateral.
The value of any collateral is defined using a formula that takes into account the appraised value of the property, any prior liens or other claims against the property and an adjustment factor based on a number of considerations including, with respect to property, the value of any nearby property sold in a court-supervised auction during the previous five years. We generally revalue any collateral on a periodic basis (every year for real estate (with apartments being revalued every month, subject to the availability of certain specified market value information), every year for equipment, every month for deposits and every week for stocks listed on a major Korean stock exchange) or if a trigger event occurs with respect to the loan in question.
Pricing. We establish the pricing for our small- and medium-sized enterprise loan products based principally on transaction risk, our cost of funding and market considerations. Our lending rates are generally determined using our Credit Wizard system. We use our Credit Wizard system to manage our lending activities, and input data gathered from loan application forms, credit scores of borrowers and the appraisal value of collateral provided by external valuation experts into the Credit Wizard system and update such information periodically to reflect changes in such information. See “Item 11. Quantitative and Qualitative Disclosures about Market Risk—Credit Risk Management—Credit Evaluation and Approval.” We measure transaction risk using factors such as the credit rating assigned to a particular borrower and the value and type of collateral. Our system also takes into account cost factors such as the current market interest rate, opportunity cost and cost of capital, as well as a spread calculated to achieve a target rate of return. Depending on the price and other terms set by competing banks for similar borrowers, we may reduce the interest rate we charge to compete more effectively with other banks. Loan officers have limited discretion in deciding what interest rates to offer, and significant variations require review at higher levels. As of December 31, 2022, approximately 73.5% of our small- and medium-sized enterprise loans had interest rates that varied with reference to current market interest rates.
Large Corporate Banking
Our large corporate customers consist of companies that are not “small- and medium-size enterprises” as defined in the Framework Act on Small and Medium Enterprises of Korea and related regulations, and typically include companies that have assets of ₩12 billion or more and are therefore subject to external audit under the Act on External Audit of Stock Companies. As a result of our history and development, particularly the history of Woori Bank, we remain the main creditor bank to many of Korea’s largest corporate borrowers.
In terms of our outstanding loan balance, as of December 31, 2022, 36.5% of our large corporate loans were extended to borrowers in the finance and insurance industries, 33.1% were extended to borrowers in the manufacturing industry, and 8.3% were extended to borrowers in the retail and wholesale industries.
We service our large corporate customers primarily through Woori Bank’s network of dedicated corporate banking centers and general managers. Woori Bank operates 10 dedicated corporate banking centers, all of which are located in the Seoul metropolitan area. Each center is staffed with one or more general managers, and certain centers are headed by a senior general manager. Depending on the center, each such manager is responsible for large corporate customers that either are affiliates of a particular chaebol or operate in a particular industry or region. As of December 31, 2022, Woori Bank had a total of 86 general managers who focus on marketing to and managing the accounts of large corporate customers.
Our strategy for the large corporate banking segment is to develop new products and cross-sell our existing products and services to our core base of large corporate customers. In particular, we continue to focus on marketing fee-based products and services such as foreign exchange and trade finance services, derivatives and other risk hedging products, investment banking services and advisory services. We have also been reviewing the credit and risk profiles of our existing customers as well as those of our competitors, with a view to identifying a target group of high-quality customers on whom we can concentrate our marketing efforts. In addition, we are seeking to continue to increase the chaebol-, region- and industry-based specialization of the managers at our
49
Table of Contents
dedicated corporate banking centers, including through the operation of a knowledge management database that allows greater sharing of marketing techniques and skills.
Lending Activities. We provide both working capital loans and facilities loans to our large corporate customers. As of December 31, 2022, working capital loans (including domestic usance, bills bought and securities sold under repurchase agreements) and facilities loans accounted for 67.1% and 19.2% respectively, of our total large corporate loans.
Loans to large corporate customers may be secured by real estate or deposits or be unsecured. As of December 31, 2022, secured loans and loans guaranteed by a third party accounted for 21.1% and 4.3% respectively, of our large corporate loans. Since a relatively low percentage of our large corporate loan portfolio is secured by collateral, we may be required to establish larger allowances for credit losses with respect to any such loans that become non-performing or impaired. See “—Assets and Liabilities—Asset Quality of Loans—Loan Loss Provisioning Policy.” As of December 31, 2022, approximately 65.0% of the secured loans were secured by real estate and approximately 2.8% were secured by deposits. Working capital loans generally have a maturity of one year but may be extended on an annual basis for an aggregate term of three to five years. Facilities loans have a maximum maturity of 15 years.
We evaluate creditworthiness and collateral for our loans to large corporate customers in essentially the same way as we do for loans to small- and medium-sized enterprise customers. See “—Small- and Medium-Sized Enterprise Banking—Lending Activities.”
Pricing. We determine the pricing of our loans to large corporate customers in the same way that we determine the pricing of our loans to small- and medium-sized enterprise customers. See “—Small- and Medium-Sized Enterprise Banking—Pricing.” As of December 31, 2022, approximately 83.7% of these loans had interest rates that varied with reference to current market interest rates.
Consumer Banking
We provide retail banking services to consumers in Korea. Our consumer banking operations consist mainly of lending to and taking deposits from our retail customers. We also provide ancillary services on a fee basis, such as wire transfers. While we have historically attracted and held large amounts of consumer deposits through our extensive branch network, our substantial consumer lending growth occurred principally in recent years, in line with the increase in the overall level of consumer debt in Korea. We provide our consumer banking services primarily through Woori Bank. See “—Branch Network and Other Distribution Channels.”
We classify our consumer banking customers based on their individual net worth and contribution to our consumer banking operations into four groups: high net worth; mass affluent; middle class; and mass market. We differentiate our products, services and service delivery channels with respect to these segments and target our marketing and cross-selling efforts based on this segmentation. With respect to the high net worth and mass affluent segments, we have established private banking operations to better service customers in these segments. See “—Private Banking Operations.” With respect to the middle class segment, we seek to use our branch-level sales staff to maximize the overall volume of products and services we provide. With respect to the mass market segment, we have focused on increasing our operating efficiency by encouraging customers to migrate to low-cost alternative service delivery channels, such as the Internet, call centers, mobile banking and ATMs.
50
Table of Contents
Lending Activities
We offer a variety of consumer loan products to households and individuals. We differentiate our product offerings based on a number of factors, including the customer’s age group, the purpose for which the loan is used, collateral requirements and maturity. The following table sets forth the balances and percentage of our total lending represented by our consumer loans as of the dates indicated:
| As of December 31, | ||||||||||||||||
| 2021 | 2022 | |||||||||||||||
| Amount(1) | % of Total Loans(2) |
Amount(1) | % of Total Loans(2) |
|||||||||||||
| (in billions of Won, except percentage) | ||||||||||||||||
| General purpose household loans |
₩ | 46,584 | 13.8 | % | ₩ | 43,614 | 12.6 | % | ||||||||
| Mortgage loans |
69,902 | 20.7 | 69,299 | 20.1 | ||||||||||||
| Home equity loans |
31,875 | 9.4 | 31,027 | 9.0 | ||||||||||||
|
|
|
|
|
|
|
|
|
|||||||||
| Total |
₩ | 148,361 | 43.9 | % | ₩ | 143,940 | 41.7 | % | ||||||||
|
|
|
|
|
|
|
|
|
|||||||||
| (1) | Not including outstanding credit card balances, and prior to deducting allowance for credit losses and present value discount or reflecting deferred origination costs. |
| (2) | Total loans do not include other financial assets and are before the deduction of allowance for credit losses and present value discount and the reflection of deferred origination costs. |
Our consumer loans consist of:
| • | general purpose household loans, which are loans made to customers for any purpose (other than mortgage and home equity loans), and include overdraft loans, which are loans extended to customers to cover insufficient funds when they withdraw funds from their demand deposit accounts with us in excess of the amount in such accounts up to a limit established by us; and |
| • | mortgage loans, which are loans made to customers to finance home purchases, construction, improvements or rentals, and home equity loans, which are loans made to customers secured by their homes to ensure loan repayment. |
For secured loans, including mortgage and home equity loans, we generally lend up to 70% of the collateral value (except in certain regulated areas designated by the government where we generally limit our lending to 50% of the appraised value of collateral, and for first-time homebuyers, we may lend up to 80% of the appraised value of collateral) minus the value of any lien or other security interest that is prior to our security interest. In calculating the collateral value for real estate for such secured consumer loans (which principally consists of residential properties), we generally use the fair value of the collateral as appraised by KB Land, the Korea Real Estate Board or other external appraisal experts, which is collated in our Credit Wizard system. We generally revalue collateral on a periodic basis. As of December 31, 2022, the revaluation frequency was every year for real estate (with apartments being revalued every month, subject to the availability of certain specified market value information), every year for equipment, every month for deposits and every week for stocks listed on a major Korean stock exchange.
A borrower’s eligibility for general purpose household loans is primarily determined by such borrower’s creditworthiness. In reviewing a potential borrower’s loan application, we also consider the suitability of the borrower’s proposed use of funds, as well as the borrower’s ability to provide a first-priority mortgage. A borrower’s eligibility for a home equity loan is primarily determined by such borrower’s creditworthiness (including as determined by our internal credit scoring protocols) and the value of the collateral property, as well as any third party guarantees of the borrowed amounts.
We also offer a variety of collective housing loans, including loans to purchase property or finance the construction of housing units, loans to contractors to be used for working capital purposes, and loans to educational institutions and non-profit entities to finance the construction of dormitories. Collective housing loans subject us to the risk that the housing units will not be sold. As a result, we review the probability of the sale of the housing unit when evaluating the extension of a loan. We also review the borrower’s creditworthiness
51
Table of Contents
and the suitability of the borrower’s proposed use of funds. Furthermore, we take a lien on the land on which the housing unit is to be constructed as collateral. If the collateral is not sufficient to cover the loan, we also take a guarantee from the Housing Finance Credit Guarantee Fund as security.
General Purpose Household Loans
Our general purpose household loans may be secured by real estate (other than homes), deposits or securities. As of December 31, 2022, approximately ₩25,840 billion, or 59.2%, of our general purpose household loans were unsecured, although some of these loans were guaranteed by a third party. Overdraft loans are primarily unsecured and typically have a maturity between one and three years.
Pricing. The interest rates on our general purpose household loans are either a periodic floating rate (which is based on a base rate determined for three-month, six-month or twelve-month periods, further adjusted to account for the borrower’s credit score and our opportunity cost) or a fixed rate that reflects our internal cost of funding and similar adjustments, but taking into account interest rate risks.
Our interest rates also incorporate a margin based on, among other things, the type of collateral (if any), priority with respect to any security, our target loan-to-value ratio and loan duration. We also can adjust the applicable rate based on current or expected profit contribution of the customer. Our lending rates are generally determined by our Credit Wizard system. The applicable interest rate is determined at the time of the drawdown of the loan. We also charge a termination fee in the event a borrower repays the loan prior to maturity. As of December 31, 2022, approximately 65.5% of our general purpose household loans had floating interest rates.
Mortgage and Home Equity Lending
We provide customers with a number of mortgage and home equity loan products that have flexible features, including terms, repayment schedules, amounts and eligibility for loans. The maximum term of our mortgage and home equity loans is typically 40 years. Most of our mortgage and home equity loans provided prior to January 2016 have an interest-only payment period of 10 years or less. However, the Korea Federation of Banks’ implementation of its Guidelines on Banks’ Mortgage Loan Screening changed the default interest-only payment period to one year or less, which applies to loans that were originated subsequent to the effective date of the Guidelines in January 2016. With respect to mortgage and home equity loans, we determine the eligibility of borrowers based on the borrower’s personal information, transaction history and credit history using our Credit Wizard system. See “Item 11. Quantitative and Qualitative Disclosures about Market Risk—Credit Risk Management—Credit Evaluation and Approval.” The eligibility of a borrower that is participating in a housing lottery will depend on proof that it has paid a deposit or can obtain a guarantee from a Korean government-related housing fund.
As of December 31, 2022, approximately 60.1% of our mortgage and home equity loans were secured by residential or other property, 28.5% of our mortgage and home equity loans were guaranteed by Korean government-related housing funds and 2.8% of our mortgage and home equity loans, contrary to general practices in the United States, were unsecured (although the use of proceeds from mortgage and home equity loans is restricted for the purpose of financing home purchases and some of these loans were guaranteed by a third party). One reason that a portion of our mortgage and home equity loans are unsecured is that we, along with other Korean banks, provide advance loans to borrowers for the down payment of new housing (particularly apartments) that is in the process of being built. Once construction is completed, which may take several years, these mortgage and home equity loans become secured by the new housing purchased by these borrowers. As of December 31, 2022, we had issued unsecured construction loans relating to housing where construction was not completed in the amount of ₩2,853 billion. For the year ended December 31, 2022, the average initial loan-to-value ratio of our mortgage loans and home equity loans was approximately 59.8% and 45.2% respectively, compared to 53.8% and 32.4% for the year ended December 31, 2021. The average loan-to-value ratio of our mortgage loans and home equity loans as of December 31, 2022 was approximately 43.4% and 35.3% respectively, compared to 41.7% and 33.1% as of December 31, 2021.
Pricing. The interest rates for our mortgage and home equity loans are determined on essentially the same basis as our general purpose household loans, except that for mortgage and home equity loans we place
52
Table of Contents
significantly greater weight on the value of any collateral that is being provided to secure the loan. The base rate we use in determining the interest rate for our mortgage and home equity loans is identical to the base rate we use to determine pricing for our general purpose household loans. As of December 31, 2022, approximately 68.2% of our outstanding mortgage and home equity loans had floating interest rates.
Private Banking Operations
Our private banking operations within Woori Bank aim to service our high net worth and mass affluent retail customers. As of December 31, 2022, we had 268.118 customers who qualified for private banking services, representing 1.1% of our total retail customer base. Of the total deposits of our retail unit of ₩124.8 trillion as of December 31, 2022, high net worth and mass affluent customers accounted for 64.2%.
Through our private bankers, we provide financial and real estate advisory services to our high net worth and mass affluent customers. We also market differentiated investment and banking products and services to these segments, including beneficiary certificates, overseas mutual fund products, specialized bank accounts and credit cards. In addition, we have developed a customer loyalty program for our private banking customers that provides preferential rate and fee benefits and awards. We have also segmented our private banking operations by introducing exclusive private client services for high net worth customers who individually maintain a deposit balance of at least ₩100 million. We believe that our private banking operations will allow us to increase our revenues from our existing high net worth and mass affluent customers, as well as attract new customers in these segments.
Woori Bank has 592 branches that offer private banking services. These branches are staffed by 650 private bankers, and almost all of the branches are located in metropolitan areas, including Seoul.
Woori Bank also operates an advisory center in Seoul for its private banking clients, which employs 21 specialists advising on matters of law, tax, real estate, risk assessment and investments.
Deposit-Taking Activities
We are one of the largest deposit holders among Korean banks, in large part due to our nationwide branch network. The balance of our deposits from retail customers was ₩120,520 billion as of December 31, 2021 and ₩132,916 billion as of December 31, 2022, which constituted 37.9% and 38.8%, respectively, of the balance of our total deposits.
We offer diversified deposit products that target different customers with different needs and characteristics. These deposit products fall into five general categories:
| • | demand deposits, which either do not accrue interest or accrue interest at a lower rate than time, installment or savings deposits. The customer may deposit and withdraw funds at any time and, if the deposits are interest-bearing, they accrue interest at a fixed or variable rate depending on the period and/or amount of deposit; |
| • | time deposits, which generally require a customer to maintain a deposit for a fixed term during which interest accrues at a fixed or floating rate. Early withdrawals require penalty payments. The term for time deposits typically ranges from one month to five years; |
| • | savings deposits, which allow the customer to deposit and withdraw funds at any time and accrue interest at a fixed rate set by us depending upon the period and amount of deposit; |
| • | certificates of deposit, the maturities of which range from 30 days to five years, with a required minimum deposit of ₩10 million. Interest rates on certificates of deposit vary with the length of deposit and prevailing market rates. Certificates of deposit may be sold at face value or at a discount with the face amount payable at maturity; and |
| • | other deposits, which consist mainly of deposits for notes payable, trust accounts, deposits for cash management accounts, housing installments and mutual installments. |
53
Table of Contents
The following table sets forth the percentage of our total retail and corporate deposits represented by each deposit product category as of December 31, 2022:
| Demand Deposits |
Time Deposits |
Savings Deposits |
Certificates of Deposit |
Other Deposits | ||||
| 11.75% | 53.20% | 32.07% | 1.54% | 1.44% |
We offer varying interest rates on our deposit products depending on market interest rates as reflected in average funding costs, the rate of return on our interest-earning assets and the interest rates offered by other commercial banks. Generally, the interest payable is the highest on certificate of deposit accounts and decreases with other deposits and time deposits and savings deposit accounts receiving relatively less interest, and demand deposits accruing little or no interest.
We also offer deposits in foreign currencies and a specialized deposit product, the apartment application comprehensive deposit, which is a monthly installment comprehensive savings program providing the holder with a preferential right to subscribe for new national housing units constructed under the Housing Act or new privately constructed housing units. This deposit product requires monthly installments of ₩20,000 to ₩500,000, terminates when the holder is selected as a subscriber for a housing unit and accrues interest at variable rates depending on the term.
The Monetary Policy Board of the Bank of Korea imposes a reserve requirement on Won currency deposits of commercial banks based generally on the type of deposit instrument. The minimum reserve requirement ratio for certain types of deposit instruments, such as time deposits, periodic deposits and certificates of deposit, is 2% of the average balance of Won currency demand deposits outstanding while the minimum reserve requirement ratio for other types of deposit instrument is 7% of the average balance of Won currency demand deposits outstanding. See “—Supervision and Regulation—Principal Regulations Applicable to Banks—Liquidity.” Ongoing regulatory reforms have removed all controls on lending rates and deposit rates (except for the prohibition on interest payments on current account deposits).
The Depositor Protection Act provides for a deposit insurance system where the KDIC guarantees to depositors the repayment of their eligible bank deposits. The KDIC insures a maximum of ₩50 million per individual for deposits and interest in a single financial institution, regardless of when the deposits were made or the size of the deposits. See “—Supervision and Regulation—Principal Regulations Applicable to Banks—Deposit Insurance System.” We pay a quarterly premium of 0.02% of our average deposits and a quarterly special contribution of 0.025% of our average deposits, in each case for the relevant quarter. For the year ended December 31, 2022, we paid an aggregate of ₩424 billion of such premiums and contributions.
Branch Network and Other Distribution Channels
Woori Bank had a total of 713 banking branches in Korea as of December 31, 2022, which was one of the most extensive networks of branches among Korean commercial banks. In recent years, demand in Korea for mutual funds and other asset management products as well as bancassurance products has been rising. These products require an extensive sales force and customer interaction to sell, further emphasizing the need for a large branch network. As a result, an extensive branch network is important to attracting and maintaining retail customers, as they generally conduct a significant portion of their financial transactions through bank branches. We believe that our extensive branch network in Korea helps us to maintain our retail customer base, which in turn provides us with a stable and relatively low cost funding source.
54
Table of Contents
The following table presents the geographical distribution of Woori Bank’s banking branch network in Korea as of December 31, 2022:
| Total | ||||||||
| Number | % of Total |
|||||||
| Area |
||||||||
| Seoul |
310 | 43.5 | % | |||||
| Six largest cities (other than Seoul) |
130 | 18.2 | % | |||||
| Other |
273 | 38.3 | % | |||||
|
|
|
|
|
|||||
| Total |
713 | 100.0 | % | |||||
|
|
|
|
|
|||||
In order to maximize access to our products and services, we have established an extensive network of ATMs and cash dispensers, which are located in branches as well as unmanned outlets. Woori Bank had 3,950 ATMs and cash dispensers as of December 31, 2022.
We actively promote the use of alternative service delivery channels in order to provide convenient service to customers. We also benefit from customers’ increasing use of these channels, as they allow us to maximize the marketing and sales functions at the branch level, reduce employee costs and improve profitability. The following tables set forth information, for the periods indicated, relating to the number of transactions and the fee revenue of our alternative service delivery channels with respect to Woori Bank.
| For the year ended December 31, | ||||||||||||
| 2020 | 2021 | 2022 | ||||||||||
| ATMs(1): |
||||||||||||
| Number of transactions (millions) |
213 | 182 | 162 | |||||||||
| Fee income (billions of Won) |
₩ | 25 | ₩ | 22 | ₩ | 20 | ||||||
| Telephone banking: |
||||||||||||
| Number of users |
6,315,007 | 6,298,041 | 6,279,122 | |||||||||
| Number of transactions (millions) |
126 | 108 | 87 | |||||||||
| Fee income (billions of Won) |
₩ | 0.9 | ₩ | 0.9 | ₩ | 0.6 | ||||||
| Internet banking: |
||||||||||||
| Number of users |
18,545,393 | 19,187,033 | 19,961,881 | |||||||||
| Number of transactions (millions) |
17,082 | 19,047 | 18,097 | |||||||||
| Fee income (billions of Won) |
₩ | 191 | ₩ | 210 | ₩ | 213 | ||||||
| (1) | Includes cash dispensers. |
Most of our electronic banking transactions do not generate fee income as many of those transactions are free of charge, such as balance inquiries, consultations with customer representatives or transfers of money. This is particularly true for telephone banking services, where a majority of the transactions are balance inquiries or consultations with customer representatives, although other services such as money transfers are also available.
Our automated telephone banking system offers a variety of services, including inter-account fund transfers, balance and transaction inquiries and customer service inquiries. We also operate a call center that handles calls from customers, engages in telemarketing and assists in our collection efforts.
Our Internet banking services include balance and transaction inquiries, money transfers, loan applications, bill payment and foreign exchange transactions. We seek to maintain and increase our Internet banking customer base by focusing largely on our younger customers and those that are able to access the Internet easily (such as office workers) as well as by developing additional Internet-based financial services and products. We also develop new products to target different types of customers with respect to our Internet banking services, and have developed a service that enables private banking customers to access their accounts on a website that provides specialized investment advice. We also offer online escrow services.
55
Table of Contents
In addition, we provide mobile banking services to our customers, which is available to all our Internet-registered users. These services allow our customers to complete selected banking transactions through major Korean telecommunications networks using their smart phones or other mobile devices. We provide general mobile banking services through our Woori WON Banking mobile application and are expanding our mobile banking services to Southeast Asia.
We also offer our “Win-CMS” service to corporate customers of Woori Bank, which provides an integrated electronic cash management system and in-house banking platform for such customers.
Credit Cards
We offer credit card products and services mainly to consumers and corporate customers in Korea. In April 2013, as a part of our strategy to enhance our credit card operations and increase its synergies with our other businesses, Woori Bank effected a horizontal spin-off of its credit card business, and the former credit card business of Woori Bank was operated by its wholly-owned subsidiary, Woori Card, until September 2019, when we conducted a “comprehensive stock exchange” under Korean law with Woori Bank, pursuant to which Woori Card became our direct and wholly-owned subsidiary. See “Item 4.A. History and Development of the Company—Establishment of Woori Financial Group—Reorganization and Expansion of Woori Financial Group.”
As of December 31, 2022, Woori Card’s market share based on transaction volume was approximately 8.1%, which ranked Woori Card as the sixth largest credit card issuer in Korea, according to the Financial Statistics Information System, which is maintained by the Financial Supervisory Service.
Our credit card operations benefit from Woori Card’s ownership of a 7.65% equity stake in BC Card. BC Card is co-owned by KT Corporation, which is one of Korea’s largest telecommunications companies, and other Korean financial institutions, and operates the second largest merchant payment network in Korea as measured by transaction volume. This ownership stake allows us to outsource production and delivery of new credit cards, the preparation of monthly statements, management of merchants and other ancillary services to BC Card for our credit card operations. In addition, in October 2019, Woori Bank acquired a 20% equity interest in Lotte Card Co., Ltd., which was the fifth largest credit card issuer in Korea at the time of acquisition, according to the Financial Statistics Information System, which is maintained by the Financial Supervisory Service.
Products and Services
We currently have the following principal brands of credit cards outstanding:
| • | a “Woori” brand; |
| • | a “BC Card” brand; and |
| • | a “Visa” brand. |
We issue “Visa” brand cards under a non-exclusive license agreement with Visa International Service Association and also issue “MasterCard,” “JCB”, “Union Pay”, and “Diners Club” brand cards under a non-exclusive, co-branding agreement with BC Card.
We offer a number of different services to holders of our credit cards. Generally, these services include:
| • | credit purchase services, which allow cardholders to purchase merchandise or services on credit and repay such credit on a lump-sum or installment basis; |
| • | cash advance services from ATMs and bank branches; and |
| • | credit card loans, which are loans that cardholders can obtain based on streamlined application procedures. |
Unlike in the United States and many other countries, where most credit cards are revolving cards that allow outstanding balances to be rolled over from month to month so long as a required minimum percentage is repaid, cardholders in Korea are generally required to pay for their non-installment purchases as well as cash advances within approximately 15 to 60 days of purchase or advance, depending on their payment cycle.
56
Table of Contents
The following tables set forth certain data relating to the credit card operations of Woori Card (including BC Cards and Visa Cards issued through the BC Card consortium) as of the dates or for the periods indicated:
| As of or for the year ended December 31, | ||||||||||||
| 2020 | 2021 | 2022 | ||||||||||
| (in billions of Won, unless indicated otherwise) | ||||||||||||
| Number of credit card holders (at year end) (thousands of holders) |
||||||||||||
| General accounts |
13,157 | 12,400 | 12,126 | |||||||||
| Corporate accounts |
563 | 549 | 582 | |||||||||
|
|
|
|
|
|
|
|||||||
| Total |
13,720 | 12,949 | 12,708 | |||||||||
|
|
|
|
|
|
|
|||||||
| Active ratio(1) |
56.53 | % | 61.18 | % | 62.94 | % | ||||||
| Credit card interest and fees |
||||||||||||
| Installment and cash advance interest |
₩ | 226 | ₩ | 225 | ₩ | 282 | ||||||
| Annual membership fees |
90 | 92 | 95 | |||||||||
| Merchant fees |
888 | 958 | 1,009 | |||||||||
| Other fees |
644 | 711 | 914 | |||||||||
|
|
|
|
|
|
|
|||||||
| Total |
₩ | 1,848 | ₩ | 1,986 | ₩ | 2,299 | ||||||
|
|
|
|
|
|
|
|||||||
| Charge volumes |
||||||||||||
| General purchase |
₩ | 60,228 | ₩ | 65,517 | ₩ | 72,019 | ||||||
| Installment purchase |
10,225 | 11,765 | 10,111 | |||||||||
| Cash advance |
4,314 | 4,884 | 5,791 | |||||||||
| Card loan |
4,610 | 4,104 | 3,010 | |||||||||
|
|
|
|
|
|
|
|||||||
| Total |
₩ | 79,377 | ₩ | 86,270 | ₩ | 90,931 | ||||||
|
|
|
|
|
|
|
|||||||
| Outstanding balances (at year end) |
||||||||||||
| General purchase |
₩ | 3,060 | ₩ | 3,550 | ₩ | 4,146 | ||||||
| Installment purchase |
2,022 | 2,589 | 2,955 | |||||||||
| Cash advance |
483 | 674 | 636 | |||||||||
| Card loan |
2,997 | 2,964 | 2,662 | |||||||||
|
|
|
|
|
|
|
|||||||
| Total |
₩ | 8,562 | ₩ | 9,776 | ₩ | 10,398 | ||||||
|
|
|
|
|
|
|
|||||||
| Average outstanding balances |
||||||||||||
| General purchase |
₩ | 3,199 | ₩ | 3,439 | ₩ | 3,953 | ||||||
| Installment purchase |
1,934 | 2,303 | 2,780 | |||||||||
| Cash advance |
523 | 552 | 693 | |||||||||
| Card loan |
2,861 | 3,272 | 2,976 | |||||||||
|
|
|
|
|
|
|
|||||||
| Total |
₩ | 8,517 | ₩ | 9,567 | ₩ | 10,403 | ||||||
|
|
|
|
|
|
|
|||||||
| Delinquency ratios(2) |
||||||||||||
| Less than 1 month |
0.85 | 0.74 | 1.29 | |||||||||
| From 1 month to 3 months |
0.51 | 0.49 | 0.78 | |||||||||
| From 3 months to 6 months |
0.51 | 0.32 | 0.59 | |||||||||
| Over 6 months |
0.00 | 0.00 | 0.01 | |||||||||
|
|
|
|
|
|
|
|||||||
| Total |
1.88 | % | 1.55 | % | 2.67 | % | ||||||
|
|
|
|
|
|
|
|||||||
| Non-performing loan ratio(3) |
0.71 | % | 0.49 | % | 0.84 | % | ||||||
| Gross charge-offs |
₩ | 246 | ₩ | 220 | ₩ | 220 | ||||||
| Recoveries |
65 | 65 | 53 | |||||||||
|
|
|
|
|
|
|
|||||||
| Net charge-offs |
₩ | 181 | ₩ | 155 | ₩ | 167 | ||||||
|
|
|
|
|
|
|
|||||||
| Gross charge-off ratio(4) |
2.89 | % | 2.30 | % | 2.12 | % | ||||||
| Net charge-off ratio(5) |
2.13 | % | 1.62 | % | 1.60 | % | ||||||
| (1) | Represents the ratio of accounts used at least once within the past month to total accounts as of the end of the relevant year. |
| (2) | Our delinquency ratios may not fully reflect all delinquent amounts relating to our outstanding balances since a certain portion of delinquent credit card balances (defined as balances one day or more past due) were restructured into loans and were not treated as being delinquent at the time of conversion or for a period of time thereafter. Including all restructured loans, outstanding balances overdue by more than one month accounted for 2.6% of our credit card balances as of December 31, 2022. |
57
Table of Contents
| (3) | Represents the ratio of balances that are more than three months overdue to total outstanding balances as of the end of the relevant year. These ratios do not include the following amounts of previously delinquent credit card balances restructured into loans that were classified as normal or precautionary as of December 31, 2020, 2021 and 2022: |
| As of December 31, | ||||||||||||
| 2020 | 2021 | 2022 | ||||||||||
| (in billions of Won) | ||||||||||||
| Restructured loans |
₩ | 123 | ₩ | 82 | ₩ | 124 | ||||||
| (4) | Represents the ratio of gross charge-offs for the year to average outstanding balances for the year. Our charge-off policy is to charge off balances which are more than six months past due (including previously delinquent credit card balances restructured into loans that are more than six months overdue from the point at which the relevant balances were so restructured), except for those balances with a reasonable probability of recovery. |
| (5) | Represents the ratio of net charge-offs for the year to average outstanding balances for the year. |
We offer a diverse range of credit card products within our various brands. Factors that determine which type of card a particular cardholder may receive include net worth, age, location, income level and the particular programs or services that may be associated with a particular card. Targeted products that we offer include:
| • | cards that offer additional benefits, such as frequent flyer miles and award program points that can be redeemed for services, products or cash; |
| • | gold cards, platinum cards and other preferential members’ cards that have higher credit limits and provide additional services; |
| • | corporate and affinity cards that are issued to employees or members of particular companies or organizations; and |
| • | revolving credit cards and cards that offer travel services and insurance. |
In recent years, credit card issuers in Korea have agreed with selected cardholders to restructure their delinquent credit card account balances as loans that have more gradual repayment terms, in order to retain fundamentally sound customers who are experiencing temporary financial difficulties and to increase the likelihood of eventual recovery on those balances. In line with industry practice, we have restructured a portion of our delinquent credit card account balances as loans. The general qualifications to restructure delinquent credit card balances as loans are that the delinquent amount be in excess of ₩1 million. The terms of the restructured loans usually require the payment of approximately 10% to 20% of the outstanding balance as a down payment and that they be guaranteed by a third party and carry higher interest rates than prevailing market rates. These loans are usually required to be repaid by the borrower in installments over terms ranging from three months to 60 months. As of December 31, 2022, the total amount of our restructured loans was ₩134 billion. Because restructured loans are not initially recorded as being delinquent, our delinquency ratios do not fully reflect all delinquent amounts relating to our outstanding credit card balances.
Payments and Charges
Revenues from our credit card operations consist principally of cash advance charges, merchant fees, interest income from credit card loans, interest on late and deferred payments, and annual membership fees paid by cardholders.
Each cardholder is allocated an aggregate credit limit in respect of all cards issued under his or her account and each month. We advise each cardholder of the credit limit relating to the cards in his or her monthly billing statement. Credit limits in respect of card loans are established separately. We conduct ongoing monitoring of all cardholders and accounts, and may reduce the credit limit or cancel an existing cardholder’s card based on current economic conditions, receipt of new negative credit data from third party sources or the cardholder’s score under the credit risk management systems we use to monitor their behavior, even if the cardholder continues to make timely payments in respect of his or her cards. We consider an account delinquent if the payment due is not received on the first monthly payment date on which such payment was due, and late fees are immediately applied. Late fee charges and computation of the delinquency period are based on each outstanding
58
Table of Contents
unpaid transaction or installment, as applicable. See “Item 11. Quantitative and Qualitative Disclosures about Market Risk—Credit Risk Management—Credit Review and Monitoring.”
Payments on amounts outstanding on our credit cards must be made (at the cardholder’s election at the time of purchase) either in full on each monthly payment date, in the case of lump-sum purchases, or in equal monthly installments over a fixed term from two months to 36 months, in the case of installment purchases. Cardholders may prepay installment purchases at any time without penalty. Payment for cash advances must be made on a lump sum basis. Payments for card loans must be made on an equal principal installment basis over a fixed term from three months up to a maximum of 60 months, up to a maximum loan amount of ₩50 million.
No interest is charged on lump-sum purchases that are paid in full by the monthly payment date. For installment purchases, we charge a fixed rate of interest on the outstanding balance of the transaction amount, based on the installment period selected at the time of purchase. For a new cardholder, we currently apply an interest rate between approximately 9.5% and 19.9% per annum as determined by the cardholder’s application system score. See “Item 11. Quantitative and Qualitative Disclosures about Market Risk—Credit Risk Management—Credit Evaluation and Approval—Credit Card Approval Process” and “—Credit Review and Monitoring—Credit Card Review and Monitoring.”
For cash advances, finance charges start accruing immediately following the cash withdrawal. We currently charge a periodic finance charge on the outstanding balance of cash advance of approximately 5.9% to 19.9% per annum. The periodic finance charge assessed on such balances is calculated by multiplying the daily installment balances for each day during the billing cycle by the applicable periodic finance charge rate, and aggregating the results for each day in the billing period. In addition to finance charges, cardholders using cash advance networks operated by companies that are not financial institutions (such as Hannet and NICE) are charged a minimum commission of ₩700 and a maximum of ₩1,000 per withdrawal.
We also generally charge a basic annual membership fee up to ₩1,000,000 for our credit cards, which is determined based on various factors including the type of card, and whether affiliation options are selected by the cardholder. For certain cards, such as the Nu Biz, we will waive membership fees if customers charge above a certain amount.
We outsource the management of merchants to BC Card. We charge merchant fees to merchants for processing transactions. Merchant fees vary depending on the type of merchant and the total transaction amounts generated by the merchant. As of December 31, 2022, we charged merchants an average of 1.23% of their respective total transaction amounts. In addition to merchant fees, we receive nominal interchange fees for international card transactions.
Capital Markets Activities
We engage in capital markets activities for our own account and for our customers. Our capital markets activities include securities investment and trading, derivatives trading, asset securitization services and investment banking.
Securities Investment and Trading
We invest in and trade securities for our own account, in order to maintain adequate sources of liquidity and to generate interest and dividend income and capital gains. As of December 31, 2022, our investment portfolio, which consists of financial assets at fair value through other comprehensive income and securities at amortized cost, and our trading portfolio, which consists of financial assets at fair value through profit or loss (excluding deposits, derivative assets and loans), had a combined total book value of ₩72,031 billion and represented 15.0% of our total assets.
Our trading and investment portfolios consist primarily of Korean treasury securities and debt securities issued by Korean government agencies, local governments or government-invested enterprises, and debt
59
Table of Contents
securities issued by financial institutions. As of December 31, 2022, we held debt securities with a total book value of ₩70,565 billion, of which:
| • | debt securities at amortized cost accounted for ₩28,269 billion, or 40.1%; |
| • | debt securities at fair value through other comprehensive income accounted for ₩32,146 billion, or 45.5%; and |
| • | debt securities at fair value through profit or loss accounted for ₩10,150 billion, or less than 14.4%. |
Of these amounts, as of December 31, 2022, debt securities issued by the Korean government amounted to ₩10,082 billion, or 35.7% of our debt securities at amortized cost, ₩5,488 billion, or 17.1% of our debt securities at fair value through other comprehensive income, and ₩2,754 billion, or 27.1% of our debt securities at fair value through profit or loss.
From time to time, we also purchase and sell equity securities for our securities portfolios. Our equity securities consist primarily of equities listed on the KRX KOSPI Market or the KRX KOSDAQ Market. As of December 31, 2022:
| • | equity securities at fair value through other comprehensive income had a book value of ₩939 billion, or 2.8% of our securities at fair value through other comprehensive income portfolio; and |
| • | equity securities at fair value through profit or loss accounted for ₩527 billion, or 4.9% of our securities at fair value through profit or loss portfolio. |
Funds that are not used for lending activities are used for investment and liquidity management purposes, including investment and trading in securities. See “—Assets and Liabilities—Securities Investment Portfolio.”
For a discussion of our risk management policies with respect to our securities trading activities, see “Item 11. Quantitative and Qualitative Disclosures about Market Risk—Market Risk Management—Market Risk Management for Trading Activities.”
Derivatives Trading
We offer derivatives products and engage in derivatives trading, mostly for our corporate customers. Our trading volume for derivative products issued for trading and hedging purposes was ₩353,659 billion in 2020, ₩390,720 billion in 2021 and ₩389,339 billion in 2022. Our aggregate net trading gain from derivatives issued for trading and hedging purposes for the years ended December 31, 2020, 2021 and 2022 was ₩320 billion, ₩323 billion, and ₩545 billion, respectively.
We provide and trade a number of derivatives products principally through sales or brokerage accounts for our customers, including:
| • | interest rate swaps, options and futures, relating principally to Won interest rate risks; |
| • | index futures and options, relating to stock market fluctuations; |
| • | cross currency swaps, relating to foreign exchange risks, largely for Won against U.S. dollars; and |
| • | foreign exchange forwards, swaps, options and futures, relating to foreign exchange risks. |
Our derivatives operations focus on addressing the needs of our corporate clients to hedge their risk exposure and on hedging our risk exposure resulting from such client contracts. We also engage in derivatives trading activities to hedge the interest rate and foreign currency risk exposure that arises from our own assets and liability positions. In addition, we engage in proprietary trading of derivatives, such as index options and futures within our regulated open position limits, for the purpose of generating capital gains.
60
Table of Contents
The following shows the estimated fair value of derivatives we held or had issued for trading purposes as of the dates indicated:
| As of December 31, | ||||||||||||||||
| 2021 | 2022 | |||||||||||||||
| Estimated Fair Value of Assets |
Estimated Fair Value of Liabilities |
Estimated Fair Value of Assets |
Estimated Fair Value of Liabilities |
|||||||||||||
| (in billions of Won) | ||||||||||||||||
| Currency derivatives |
₩ | 3,922 | ₩ | 3,348 | ₩ | 6,212 | ₩ | 6,869 | ||||||||
| Interest rate derivatives |
157 | 314 | 699 | 491 | ||||||||||||
| Equity derivatives |
724 | 905 | 1,295 | 1,545 | ||||||||||||
|
|
|
|
|
|
|
|
|
|||||||||
| Total |
₩ | 4,803 | ₩ | 4,567 | ₩ | 8,206 | ₩ | 8,905 | ||||||||
|
|
|
|
|
|
|
|
|
|||||||||
For a discussion of our risk management policies with respect to our derivatives trading activities, see “Item 11. Quantitative and Qualitative Disclosures about Market Risk—Market Risk Management—Market Risk Management for Trading Activities.”
Asset Securitization Services
We are active in the Korean asset-backed securities market. Through Woori Bank, we participate in asset securitization transactions in Korea by acting as arranger, trustee or liquidity provider. In 2022, we were involved in asset securitization transactions with an initial aggregate issue amount of ₩718 billion and generated total fee income of approximately ₩1.4 billion in connection with such transactions. The securities issued in asset securitization transactions are sold mainly to institutional investors buying through Korean securities firms.
Investment Banking
Through Woori Bank and Woori Investment Bank, we engage in investment banking activities in Korea. In addition, we provide project finance and financial advisory services, in the area of social overhead capital projects such as highway, port, power and water and sewage projects, as well as structured finance, leveraged buy-out financing, equity and venture financing and mergers and acquisitions financing services. In 2022, the net non-interest income from Woori Bank’s investment banking activities (including its Hong Kong subsidiary’s investment banking activities) was approximately ₩406.4 billion, while the net non-interest income from Woori Investment Bank’s investment banking activities was approximately ₩78.8 billion.
We believe that significant opportunities exist for us to leverage our existing base of large corporate and small- and medium-sized banking customers to cross-sell investment banking services. We intend to expand our investment banking operations to take advantage of these opportunities, with a view to increasing our fee income and further diversifying our revenue base.
International Banking
Through Woori Bank, we engage in various international banking activities, including foreign exchange services and dealing, import and export-related services, offshore lending, syndicated loans and foreign currency securities investment. These services are provided primarily to our domestic customers and overseas subsidiaries and affiliates of Korean corporations and, to a limited extent, to local companies and individuals. We also raise foreign currency funding through our international banking operations. In addition, we provide commercial banking services to retail and corporate customers in select overseas markets.
61
Table of Contents
The table below sets forth certain information regarding our foreign currency assets and borrowings:
| As of December 31, | ||||||||
| 2021 | 2022 | |||||||
| (in millions of US$) | ||||||||
| Total foreign currency assets |
US$ | 51,680 | US$ | 53,873 | ||||
| Foreign currency borrowings |
||||||||
| Call money |
268 | 316 | ||||||
| Long-term borrowings |
4,234 | 4,295 | ||||||
| Short-term borrowings |
6,965 | 9,611 | ||||||
|
|
|
|
|
|||||
| Total foreign currency borrowings |
US$ | 11,467 | US$ | 14,222 | ||||
|
|
|
|
|
|||||
The table below sets forth the overseas subsidiaries and direct branches of Woori Bank in operation as of December 31, 2022:
| Business Unit(1) |
Location | |
| Subsidiaries: |
||
| Woori America Bank |
United States | |
| Woori Bank China Limited |
China | |
| PT Bank Woori Saudara Indonesia 1906 Tbk |
Indonesia | |
| AO Woori Bank |
Russia | |
| Banco Woori Bank do Brasil S.A. |
Brazil | |
| Woori Global Markets Asia Limited |
China (Hong Kong) | |
| Woori Bank Vietnam Limited |
Vietnam | |
| Wealth Development Bank |
Philippines | |
| Woori Finance Myanmar Co., Ltd. |
Myanmar | |
| Woori Bank (Cambodia) PLC. |
Cambodia | |
| Woori Bank Europe Gmbh |
Germany | |
| Branches, Agencies and Representative Offices: |
||
| London Branch |
United Kingdom | |
| Tokyo Branch |
Japan | |
| Singapore Branch |
Singapore | |
| Hong Kong Branch |
China (Hong Kong) | |
| Bahrain Branch |
Bahrain | |
| Dhaka Branch |
Bangladesh | |
| Gaeseong Branch(2) |
Korea | |
| New York Agency |
United States | |
| Los Angeles Branch |
United States | |
| Chennai Branch |
India | |
| Sydney Branch |
Australia | |
| Dubai Branch |
United Arab Emirates | |
| Gurgaon Branch |
India | |
| Mumbai Branch |
India | |
| Kuala Lumpur Representative Office |
Malaysia | |
| Yangon Representative Office |
Myanmar | |
| Iran Representative Office(3) |
Iran | |
| Katowice Representative Office |
Poland |
| (1) | Does not include subsidiaries and branches in liquidation or dissolution. |
| (2) | Due to the shutdown of the Gaeseong Industrial Complex in February 2016, the Gaeseong Branch is currently located at our corporate headquarters in Seoul. |
| (3) | No longer operational (i.e., no employees or office space) since December 2018 following the re-imposition of sanctions. |
62
Table of Contents
The principal activities of the overseas branches and subsidiaries of Woori Bank are providing trade financing and local currency funding for Korean companies and Korean nationals operating in overseas markets as well as servicing local customers and providing foreign exchange services in conjunction with our headquarters. On a limited basis, such overseas branches and subsidiaries also engage in the investment and trading of securities of foreign issuers.
Woori America Bank currently operates over 25 branches in states including New York, New Jersey, Maryland, Virginia, Pennsylvania and California and provides retail and corporate banking services targeted towards the Korean-American community. As of December 31, 2022, Woori America Bank had total assets of US$3,111 million and shareholders’ equity of US$440 million.
In November 2007, Woori Bank established a local subsidiary in China, Woori Bank China Limited, which currently has branches in Beijing, Shanghai, Shenzhen, Suzhou, Tianjin, Dalian, Chengdu, Weihai, Chongqing and Shenyang. Woori Bank also established a local subsidiary in Russia, AO Woori Bank, in January 2008 to provide general banking services and it currently has branches in Moscow and St. Petersburg and a representative office in Vladivostok. As of December 31, 2022, AO Woori Bank had total assets of US$620 million and total liability of US$558 million, and its operating revenue was US$62 million in 2022.
In January 2014, Woori Bank completed the purchase of an additional 27% equity interest (in addition to the 6% equity interest it previously acquired through its subsidiary PT. Bank Woori Indonesia) in PT. Bank Himpunan Saudara 1906 Tbk, an Indonesian commercial bank with a network of over 100 branches and offices throughout Indonesia. In December 2014, PT. Bank Woori Indonesia merged with and into PT. Bank Himpunan Saudara 1906 Tbk. The merged entity, in which Woori Bank currently holds an 84.2% equity interest, was renamed PT Bank Woori Saudara Indonesia 1906 Tbk and became Woori Bank’s consolidated subsidiary. As of December 31, 2022, PT Bank Woori Saudara Indonesia 1906 Tbk had total assets of US$3,330 million and shareholders’ equity of US$624 million.
In October 2016, Woori Bank acquired a 51% equity interest in Wealth Development Bank, a thrift bank in the Philippines with a network of 25 branches and 438 employees as of December 31, 2022.
In November 2016, Woori Bank obtained a banking license to establish a local subsidiary in Vietnam, Woori Bank Vietnam, which commenced operations in January 2017 and currently operates 20 branches throughout the country.
Woori Bank is also expanding its network of branches in South and Southeast Asia through our other local subsidiaries, including PT Bank Woori Saudara Indonesia 1906, Tbk, Woori Finance Myanmar and Wealth Development Bank. In June 2018, Woori Bank acquired VisionFund (Cambodia) Ltd., a microfinance deposit-taking institution in Cambodia, and renamed it WB Finance Co., Ltd. In February 2020, WB Finance Co., Ltd. merged with Woori Finance (Cambodia) Plc., a Cambodian microfinance institution, and in November 2021, it obtained a commercial banking license from the Cambodian financial authorities and began its nationwide operations as Woori Bank (Cambodia) PLC. As of December 31, 2022, Woori Bank (Cambodia) PLC. had total assets of US$1,451 million and shareholders’ equity of US$318 million.
In November 2018, Woori Bank established a German subsidiary, Woori Bank Europe Gmbh, which is headquartered in Frankfurt and conducts our European operations. As of December 31, 2022, Woori Bank Europe Gmbh had total assets of US$697 million and shareholders’ equity of US$90 million.
63
Table of Contents
Asset Management
Trust Management Services
Money Trusts. Through Woori Bank, we offer money trust products to our customers and manage the funds they invest in money trusts. The money trusts we manage are generally trusts with a fixed life that allow investors to share in the investment performance of the trust in proportion to the amount of their investment in the trust. We principally offer the following types of money trust products:
| • | retirement trusts, which invest funds received from corporations or organizations and manage these funds until they are withdrawn to pay retirement funds to a corporation’s officers or employees or an organization’s members; |
| • | pension trusts, which invest funds received until pension benefits are due to be disbursed to a pension beneficiary; and |
| • | specified money trusts, which invest cash received as trust property at the direction of the trustors and, once the trust matures, disburse the principal and any gains to the trust beneficiaries. |
We also offer other types of money trusts that have a variety of differing characteristics with respect to, for example, maturities and tax treatment.
Under Korean law, the assets of our money trusts are segregated from our assets and are not available to satisfy the claims of our creditors. We are, however, permitted to maintain deposits of surplus funds generated by trust assets in certain circumstances as set forth under the Financial Investment Services and Capital Markets Act and the regulations thereunder. Except for specified money trusts, we have investment discretion over all money trusts, which are pooled and managed jointly for each type of trust. Specified money trusts are established on behalf of individual customers, typically corporations, which direct our investment of trust assets.
We receive fees for our trust management services that are generally based upon a percentage, ranging between 0.01% and 1.2%, of the net asset value of the assets under management. We also receive penalty payments when customers terminate their trust deposit prior to the original contract maturity. Fees that we received for trust management services (including those fees related to property trust management services, described below, but excluding those fees relating to guaranteed trusts, which are eliminated in consolidation) amounted to ₩86 billion in 2020, ₩117 billion in 2021 and ₩132 billion in 2022.
For some of the money trusts we manage, we have guaranteed the principal amount of an investor’s investment as well as a fixed rate of interest. We no longer offer new money trust products where we guarantee both the principal amount and a fixed rate of interest. We continue to offer pension-type money trusts that provide a guarantee of the principal amount of an investor’s investment.
The following table shows the balances of our money trusts by type as of the dates indicated. We consolidate within our financial statements trust accounts for which we guarantee both the repayment of the principal amount and a fixed rate of interest and trust accounts for which we guarantee only the repayment of the principal amount, while we do not consolidate performance trusts on which we do not guarantee principal or interest:
| As of December 31, | ||||||||
| 2021 | 2022 | |||||||
| (in billions of Won) | ||||||||
| Principal and interest guaranteed trusts |
₩ | — | ₩ | — | ||||
| Principal guaranteed trusts |
1,275 | 1,186 | ||||||
| Performance trusts |
42,249 | 44,431 | ||||||
|
|
|
|
|
|||||
| Total |
₩ | 43,524 | ₩ | 45,617 | ||||
|
|
|
|
|
|||||
The trust assets we manage consist principally of investment securities, loans made from the trusts and amounts due from banks. The investment securities consist of government-related debt securities, corporate debt securities, including bonds and commercial paper, equity securities and other securities. As of December 31,
64
Table of Contents
2022, our money trusts had invested in securities with an aggregate book value of ₩11,610 billion, which accounted for approximately 24.9% of our money trust assets. Debt securities accounted for ₩5,372 billion of this amount.
Our money trusts also invest, to a lesser extent, in equity securities, including beneficiary certificates issued by investment trust management companies. As of December 31, 2022, equity securities held by our money trusts amounted to ₩6,239 billion, which accounted for approximately 13.4% of our money trust assets. Of this amount, ₩14 billion was from money trusts over which we had investment discretion and the remainder was from specified money trusts.
Loans made by our money trusts are similar in type to the loans made by our banking operations. As of December 31, 2022, our money trusts had made loans in the aggregate principal amount of ₩7,287 billion (excluding loans to our banking operations of ₩1,980 billion), which accounted for approximately 15.6% of our money trust assets.
The amounts due from banks consist of local currency and foreign currencies. As of December 31, 2022, such amounts due from banks totaled ₩25,111 billion, which accounted for approximately 53.8% of our money trust assets.
If the income from a money trust for which we provide a guarantee is less than the amount of the payments we have guaranteed, we will need to pay the amount of the shortfall with funds from special reserves maintained in our trust accounts, followed by basic fees from that money trust and funds from our banking operations. We net any payments we make as a result of these shortfalls against any gains we receive from other money trusts. No material payments of any such shortfall amounts were made in 2022.
Property Trusts. Through Woori Bank and Woori Asset Trust Co., Ltd., we also offer property trust management services, where we manage non-cash assets in return for a fee. Non-cash assets include mostly receivables (including those securing asset-backed securities), real property and securities, but can also include movable property such as artwork. Under these arrangements, we render escrow or custodial services for the property in question and collect fees in return.
In 2022, our property trust fees generally ranged from 0.003% to 5.00% of total assets under management, depending on the type of trust account product. As of December 31, 2022, the balance of our property trusts totaled ₩76,444 billion.
Property trusts are not consolidated within our financial statements.
Investment Trust Management
Through Woori Asset Management Corp., Woori Global Asset Management Co. and Woori Private Equity Asset Management Co. Ltd., we offer investment trust products to our customers and manage the assets invested by them in investment trusts. The investment trust products we offer generally take the form of beneficiary certificates evidencing an ownership interest in a particular investment trust. We currently offer various different types of investment trust products, including:
| • | securities funds, where securities (excluding certain securities relating to, among others, real estate, ship investment companies, social infrastructure and overseas resource development) consist of more than 50% of their assets; |
| • | real estate funds, where real estate (including investments in, among others, derivatives based on underlying assets consisting of real estate and loans to corporations relating to real estate development) consist of more than 50% of their assets; |
| • | special asset funds, where assets other than securities and real estate consist of more than 50% of their assets; |
| • | mixed asset funds, which do not have the restrictions that apply to securities funds, real estate funds and special asset funds; and |
65
Table of Contents
| • | money market funds, which invest in short-term financial products, such as call loans, commercial paper, certificates of deposit and short-term treasury notes and corporate bonds. |
The investment trusts we manage are generally trusts that allow investors to share in the investment performance of the trust in proportion to the amount of their investment in the trust. We have investment discretion over all investment trusts. Investment trusts calculate the value of their assets as often as required by the relevant laws and regulations, and any change in the overall valuation of their assets will be reflected in the price of their beneficiary certificates. The trust will disburse principal and any return on investment based on the price of their beneficiary certificates at maturity or upon the receipt of a redemption request, as applicable. In addition to investment trust products, we provide our institutional clients with various investment advisory and discretionary asset investment services.
The following table shows the balances of our investment trusts by type as of December 31, 2022. Under IFRS, we do not consolidate investment trusts due to the fact that the assets invested are not our assets but customer assets:
| As of December 31, | ||||
| 2022(1) | ||||
| (in billions of Won) | ||||
| Securities funds |
₩ | 23,684 | ||
| Real estate funds |
1,223 | |||
| Special asset funds |
2,391 | |||
| Mixed asset funds |
207 | |||
| Money market funds |
12,157 | |||
|
|
|
|||
| Total |
₩ | 39,662 | ||
|
|
|
|||
| (1) | Includes assets under management by Woori Private Equity Asset Management Co., Ltd. See “—Other Businesses—Private Equity.” |
We receive fees for our investment trust management services consisting of management fees in connection with establishing, operating and managing the investment trust, asset management fees and related advisory fees. These fees are calculated by multiplying the daily net asset value of the trust by a percentage provided in the trust documentation. Fees accrue on a daily basis and are paid out as expenses periodically. Fees from our investment trust management services amounted to ₩17 billion in 2022.
Although our current customer base consists mainly of institutional investors, we have been seeking to market our investment trust products to retail customers through our consumer banking network. We believe that significant opportunities exist for us to leverage our existing base of consumer banking customers to cross-sell our investment trust products. We intend to focus on the development of new products tailored to particular customer segments and the enhancement of sales and distribution capabilities through each of our marketing channels to meet our customers’ needs.
Trustee and Custodian Services Relating to Securities Investment Trusts
Through Woori Bank, as of December 31, 2022, we acted as a trustee for 4,420 securities investment trusts, mutual funds and other investment funds. We receive a fee for acting as a trustee and generally perform the following functions:
| • | receiving payments made in respect of such securities; |
| • | executing trades in respect of such securities on behalf of the investment fund, based on instructions from the relevant investment fund management company; and |
| • | in certain cases, authenticating beneficiary certificates issued by investment trust management companies and handling settlements in respect of such beneficiary certificates. |
For the year ended December 31, 2022, our fee income from such services was ₩24.7 billion.
66
Table of Contents
Other Businesses
Management of National Housing and Urban Fund
In April 2008, through Woori Bank, we were selected to be the lead manager of the National Housing and Urban Fund. The National Housing and Urban Fund provides financial support to low-income households in Korea by providing mortgage financing and construction loans for projects to build small- and medium-sized housing. As of December 31, 2022, outstanding housing loans from the National Housing and Urban Fund amounted to approximately ₩133.6 trillion, of which we originated ₩84.4 trillion. The activities of the National Housing and Urban Fund are funded primarily by the issuance of national housing bonds, which must be purchased by persons and legal entities wishing to make real estate-related registrations and filings, and by subscription savings deposits held at the National Housing and Urban Fund.
In return for managing the operations of the National Housing and Urban Fund, we receive a monthly fee. This fee consists of a fund raising fee and a loan origination fee. The fund raising fee is based on the number of National Housing and Urban Fund subscription savings deposit accounts opened and the level of activity for existing accounts and the number of National Housing and Urban Fund bonds issued or redeemed. The loan origination fee is based on the number of new National Housing and Urban Fund loans and the number of National Housing and Urban Fund mortgage loans to contractors constructing housing units that are assumed by the individual buyers of housing units and the level of activity for existing loans during each month. We received total fees of approximately ₩55 billion for managing the National Housing and Urban Fund in 2022.
Bancassurance
The term “bancassurance” refers to the marketing and sale by commercial banks of insurance products manufactured within a group of affiliated companies or by third-party insurance companies. Through Woori Bank, we market a wide range of bancassurance products. In 2022, we generated fee income of approximately ₩110 billion through the marketing of bancassurance products. We believe that we will be able to continue to develop an important new source of fee-based revenues by expanding our offering of these products. We have entered into bancassurance marketing arrangements with 30 insurance companies, including TongYang Life Insurance, Hanwha Life Insurance, Samsung Life Insurance, Samsung Fire and Marine Insurance, Hyundai Fire and Marine Insurance and American International Assurance, and plan to enter into additional insurance product marketing arrangements with other leading insurance companies whose names and reputation are likely to be familiar to our customer base.
Private Equity
In 2016, Woori Private Equity Co., Ltd., which was established in October 2005, registered as a specialized private placement collective investment business under the Financial Investment Services and Capital Markets Act and changed its name to Woori Private Equity Asset Management Co., Ltd., or Woori PEAM. Such registration enabled it to manage specialized private placement collective investment vehicles (which include hedge funds) targeting professional investors, in addition to its existing business of making long-term and strategic investments in buyout target companies and actively involving itself in their management.
Currently Woori PEAM serves as the general partner of 7 private equity funds. Such private equity funds include Woori Shinyoung Growth Cap Private Equity Fund 1, the size of which is approximately ₩163 billion; Woori Q Corporate Restructuring Private Equity Fund, the size of which is approximately ₩155 billion; Arden Woori Apparel 1st Private Equity Fund, the size of which is approximately ₩21 billion; Woori-Dino Private Equity Fund 1, the size of which is approximately ₩10.2 billion; Green ESG Growth Private Equity Fund 1, the size of which is approximately ₩165 billion; NH-Woori Newdeal Growth Alpha Private Equity Fund 1, the size of which is approximately ₩220 billion; and Australia Green Energy Private Equity Fund 1, the size of which is approximately ₩124 billion. In addition to the aforementioned 7 private equity funds, Woori PEAM has previously launched Woori Hanwha Eureka Private Equity Fund, which was liquidated in November 2022 for ₩43.5 billion.
67
Table of Contents
Woori PEAM also established and currently manages 16 alternative investment funds with an aggregate investment amount of approximately ₩1.21 trillion. The aggregate amount of assets under management of these 16 alternative investment funds is approximately ₩699 billion.
We expect that Woori PEAM will continue to provide us with investment opportunities, through identifying potential investees suffering from inefficient management and effecting financial restructuring and strategic reorientation in those investees so as to enhance their enterprise value, as well as serve as a source of business for other segments by managing specialized private placement collective investment vehicles for professional investors.
Competition
We compete with other financial institutions in Korea, including principally nationwide and regional Korean commercial banks and branches of foreign banks operating in Korea. In addition, in particular segments such as credit cards, securities and insurance, we compete with specialized financial institutions focusing on such segments. Some of the financial institutions we compete with are larger in terms of asset size and customer base and have greater financial resources or more specialized capabilities than us or our subsidiaries.
Competition in the Korean financial market has been and is likely to remain intense. In particular, in the area of our core banking operations, most Korean banks have been focusing on retail customers and small- and medium-sized enterprises in recent years, although they have begun to increase their exposure to large corporate borrowers, and have been focusing on developing fee income businesses, including bancassurance, as increasingly important sources of revenue. In the area of credit cards, increased competition in the payments market and the resulting increase in our marketing activities, as well as the general trend towards lower merchant fees, are adversely affecting profits in the segment. In our new capital segment, our profitability may be adversely affected by increasing competition in the automobile finance and lease finance markets.
In addition, the introduction of Internet-only banks in Korea is expected to increase competition in the Korean banking industry. Internet-only banks generally operate without branches and conduct most of their operations through electronic means, which enable them to minimize costs and offer customers higher interest rates on deposits or lower lending rates. In April 2017, Kbank, the first Internet-only bank in Korea, in which Woori Bank owns 12.6% of the equity with voting rights as of December 31, 2022, commenced operations. Kakao Bank and Toss Bank, both mobile-only banks, commenced operations in July 2017 and October 2021, respectively.
Furthermore, the following general regulatory reforms in the Korean financial industry have increased competition among banks and other financial institutions in Korea:
| • | In the second half of 2015, the Korean government implemented measures to facilitate bank account portability of retail customers by requiring commercial banks to establish systems that allow retail customers to easily switch their bank accounts at one commercial bank to another and automatically transfer the automatic payment settings of their former accounts to the new ones. |
| • | In March 2016, the Financial Services Commission introduced an individual savings account scheme in Korea, which enables individuals to efficiently manage a wide range of retail investment vehicles, including cash deposits, investment funds and securities investment products, from a single integrated account with one financial institution and offers tax benefits on investment returns. Since the scheme backed by the Korean government allows only one individual savings account per person, financial institutions have been competing to retain existing customers and attract new customers since the launch of the individual savings account scheme. Over 30 financial institutions, including banks, securities companies and insurance companies, have registered with the Financial Services Commission to sell their individual savings account products, and we expect fierce competition among these institutions. |
| • | In April 2019, the Financial Services Commission approved and is currently conducting test procedures for a financial regulatory sandbox, a framework set up to allow financial service providers to test new business models in a less regulated environment, as part of its efforts to work closely with the fintech |
68
Table of Contents
| sector and provide support to facilitate its development. A variety of financial services have been similarly approved for such testing under the financial regulatory sandbox. |
| • | In December 2019, the Financial Services Commission launched an “open banking” system, which allows customers to view banking account information and make wire transfers, regardless of institution, through a single mobile application. Such integrated system is expected to allow fintech firms to share payment networks with banks, thereby lowering transaction fees and encouraging the development of new payment services. |
| • | In August 2020, amendments to the Credit Information Use and Protection Act established the framework for MyData services in Korea, which allow the collection of customers’ personal credit information from credit information providers/users or public institutions upon the customer’s request and subject to compliance requirements, so that customers may access such collected personal credit information in whole or in part. In January 2021, the Financial Services Commission granted licenses to 28 companies to operate as MyData service providers, 14 of which were fintech firms, and competition between traditional financial institutions and fintech firms is expected to intensify, particularly with respect to the relevant asset management services. As of December 31, 2022, 64 companies, including 23 fintech companies, have been granted a MyData license. MyData services are currently offered through Woori WON Banking, Woori Bank’s main mobile banking application, as well as through Woori Card’s mobile application. |
| • | In March 2023, the Financial Services Commission and the Financial Supervisory Service jointly hosted the initial working group meeting of a task force committed to improving the management and operating practices of banks and banking system. One of the goals of the task force is to promote competition in the banking sector. During the initial working group meeting, authorities discussed ways to allow entry of new banks and boost competition between banks and nonbanks. These measures under discussion include, without limitation, (1) introducing small licensing units and small-scale specialized banks, (2) allowing entry of additional internet-only banks, regional banks and nation-wide banks, (3) converting mutual savings banks into regional banks and regional banks into nation-wide banks, (4) allowing credit card companies to provide comprehensive payment settlement services, (5) allowing securities firms to provide payment settlement services to corporate entities, (6) permitting insurance companies to concurrently operate payment settlement services, (7) expanding banks’ loans to small and medium-sized enterprises and small-loans to lower-income groups, and (8) extending nonbanks’ scope of services in handling policy fund loans and policy mortgages. The task force has held and will hold future working group meetings to discuss these issues and we expect that they will develop specific measures to increase competition in the banking sector in the near future. In addition, in February 2023, the Korea Fair Trade Commission conducted on-site examinations of the major banks, including us, to determine whether the banks have engaged in unfair trade practices. |
Overall, such measures may not only intensify competition among traditional financial institutions in Korea, but also allow new market participants such as fintech firms to potentially gain market share in certain areas in which we operate.
Moreover, the Korean financial industry is undergoing significant consolidation through which the number of nationwide commercial banks in Korea has significantly decreased since the financial crisis in Korea in the late 1990s. A number of significant mergers and acquisitions in the financial industry have also taken place in Korea in recent years, including the merger of Hana Bank into Korea Exchange Bank in 2015, KB Financial Group’s acquisition of Hyundai Securities Co., Ltd. in 2016 and the subsequent merger of Hyundai Securities with and into KB Investment & Securities Co., Ltd. in 2016. In 2016, Mirae Asset Securities Co., Ltd. acquired a 43% interest in KDB Daewoo Securities Co., Ltd., which subsequently merged with and into Mirae Asset Securities. In 2014, pursuant to the implementation of the Korean government’s privatization plan with respect to Woori Finance Holdings and its former subsidiaries, Woori Financial, Woori Asset Management and Woori F&I were acquired by KB Financial Group, Kiwoom Securities and Daishin Securities, respectively, and Woori Investment & Securities, Woori Aviva Life Insurance and Woori FG Savings Bank were acquired by NongHyup
69
Table of Contents
Financial Group. In addition, in October 2014, the KDIC’s ownership interest in Kwangju Bank and Kyongnam Bank were acquired by JB Financial Group and BNK Financial Group (formerly known as BS Financial Group), respectively. See “Item 4.A. History and Development of the Company—Privatization Plan.” In 2020, Hana Financial Group acquired The-K Non-Life Insurance Co., Ltd. to form Hana Insurance Co., Ltd. Orange Life Insurance, Ltd. (formerly known as ING Life Insurance Korea, Ltd.) became a wholly-owned subsidiary of Shinhan Financial Group following the acquisition of equity interests by Shinhan Financial Group in February 2019 and January 2020, which subsequently merged with and into Shinhan Life Insurance Co., Ltd. in July 2021. In 2020, Shinhan Financial Group acquired the venture capital firm Neoplux. In January 2022, Shinhan Financial Group’s subsidiary, Shinhan Asset Management Co., Ltd., merged with Shinhan Alternative Investment Management Inc. In July 2022, Shinhan Financial Group acquired BNP Paribas Cardif General Insurance, and established Shinhan EZ General Insurance. In 2020, KB Financial Group acquired The Prudential Life Insurance Company of Korea Ltd., which merged with KB Life Insurance in January 2023, with the surviving entity’s name changed to KB Life Insurance Co., Ltd.
We expect that consolidation in the Korean financial industry will continue. Other financial institutions may seek to acquire or merge with other entities, and the financial institutions resulting from this consolidation may, by virtue of their increased size and business scope, provide significantly greater competition for us. We also believe that foreign financial institutions, many of which have greater experience and resources than we do, may seek to compete with us in providing financial products and services either by themselves or in partnership with existing Korean financial institutions. See “Item 3.D. Risk Factors—Risks relating to competition.”
Assets and Liabilities
The tables below and accompanying discussions provide selected financial highlights regarding our assets and liabilities on a consolidated basis.
Certain information with respect to our loan portfolio and the asset quality of our loans is presented below on a basis consistent with certain requirements of the Financial Services Commission applicable to Korean financial institutions, which differs (as described below where applicable) from the presentation of such information in our financial statements prepared in accordance with IFRS, as we believe that such alternative presentation allows us to provide additional details regarding our loan portfolio and the asset quality of our loans which would be helpful to our investors.
Loan Portfolio
As of December 31, 2022, the balance of our total loan portfolio was ₩345,411 billion. As of December 31, 2022, 89.2% of our total loans were Won-denominated loans and 10.8% of our total loans were denominated in other currencies. Of the ₩37,353 billion of foreign currency-denominated loans as of that date, approximately 78.0% represented “foreign” loans provided by Woori Bank to offshore entities and individuals. Woori Bank extends such foreign loans primarily through its overseas branches to affiliates of large Korean manufacturing companies for trade financing and working capital.
Except where we specify otherwise, all loan amounts stated below do not include amounts due from banks and other receivables and are prior to deducting allowance for credit losses and present value discount or reflecting deferred origination costs, and all corporate loan amounts stated below include loans made to the Korean government and government-owned agencies and banks.
70
Table of Contents
Loan Types
The following table presents loans by type as of the dates indicated. Total loans reflect our loan portfolio, including past due amounts.
| As of December 31, | ||||||||
| 2021 | 2022 | |||||||
| (in billions of Won) | ||||||||
| Domestic: |
||||||||
| Corporate(1): |
||||||||
| Commercial and industrial |
₩ | 131,695 | ₩ | 145,500 | ||||
| Lease financing |
1,743 | 2,207 | ||||||
| Trade financing |
8,341 | 6,762 | ||||||
| Other commercial |
16,443 | 12,802 | ||||||
|
|
|
|
|
|||||
| Total corporate |
158,222 | 167,271 | ||||||
| Consumer: |
||||||||
| General purpose household |
42,164 | 38,447 | ||||||
| Mortgage |
69,902 | 69,299 | ||||||
| Home equity |
31,875 | 31,027 | ||||||
|
|
|
|
|
|||||
| Total consumer |
143,941 | 138,773 | ||||||
| Credit cards |
9,757 | 10,370 | ||||||
|
|
|
|
|
|||||
| Total domestic |
311,920 | 316,414 | ||||||
| Foreign: |
||||||||
| Corporate(2): |
||||||||
| Commercial and industrial |
18,926 | 21,103 | ||||||
| Lease financing |
26 | |||||||
| Trade financing |
1,270 | 629 | ||||||
| Other commercial |
1,299 | 2,072 | ||||||
|
|
|
|
|
|||||
| Total corporate |
21,495 | 23,830 | ||||||
| Consumer |
4,420 | 5,167 | ||||||
|
|
|
|
|
|||||
| Total foreign |
25,915 | 28,997 | ||||||
|
|
|
|
|
|||||
| Total loans(3) |
₩ | 337,835 | ₩ | 345,411 | ||||
|
|
|
|
|
|||||
| Less: present value discount |
(7 | ) | (10 | ) | ||||
| Less: deferred origination costs (fees) |
858 | 852 | ||||||
| Less: allowance for credit losses |
(1,887 | ) | (2,334 | ) | ||||
|
|
|
|
|
|||||
| Total loans, net |
₩ | 336,799 | ₩ | 343,919 | ||||
|
|
|
|
|
|||||
| (1) | Including loans made to banks and the Korean government and government-owned agencies. |
| (2) | Including loans made to banks. |
| (3) | Not including due from banks and other financial assets (or other receivables) and prior to deducting allowance for credit losses and present value discount or reflecting deferred origination costs. |
Loan Concentrations
On a consolidated basis, our exposure to any single person (regardless of whether such person is an individual or an entity) or any single borrower (any single person together with any individual and/or entity that shares the same credit risk with such person) is limited by law to 20% and 25%, respectively, of our “net aggregate equity capital,” as defined under the Enforcement Decree of the Financial Holding Company Act. See “—Supervision and Regulation—Principal Regulations Applicable to Financial Holding Companies—Financial Exposure to Any Individual Customer and Major Investor.” In addition, Woori Bank’s exposure to any single borrower or any single person is limited by the Bank Act to 20% and 25%, respectively, of its total Tier I and Tier II capital.
71
Table of Contents
20 Largest Exposures by Borrower
As of December 31, 2022, our exposures to our 20 largest borrowers or issuers totaled ₩66,929 billion and accounted for 12.1% of our total exposures. The following table sets forth our total exposures to those borrowers or issuers as of that date:
| Loans | Guarantees and acceptances |
Amounts classified as substandard or below(3) |
||||||||||||||||||||||||||||||
| Company (Credit Rating)(1) |
Won currency |
Foreign currency |
Equity securities |
Debt securities |
Total exposures |
Collateral(2) | ||||||||||||||||||||||||||
| (in billions of Won) | ||||||||||||||||||||||||||||||||
| Korean Government(4) |
₩ | — | ₩ | — | ₩ | — | ₩ | 18,126 | ₩ | — | ₩ | 18,126 | ₩ | — | ₩ | — | ||||||||||||||||
| Korea Development Bank (AAA) |
— | 165 | — | 14,123 | — | 14,288 | — | — | ||||||||||||||||||||||||
| Industrial Bank of Korea (AAA) |
— | 304 | — | 8,922 | — | 9,226 | — | — | ||||||||||||||||||||||||
| Korea Housing Finance Corporation (AAA) |
— | — | — | 7,924 | — | 7,924 | — | — | ||||||||||||||||||||||||
| The Bank of Korea(4) |
720 | — | — | 2,910 | — | 3,630 | — | — | ||||||||||||||||||||||||
| Export-Import Bank of Korea (AAA) |
— | — | — | 2,151 | — | 2,151 | — | — | ||||||||||||||||||||||||
| KOREA ELECTRIC POWER CORPORATION (AAA) |
1,400 | — | — | 398 | 30 | 1,828 | — | — | ||||||||||||||||||||||||
| Kookmin Bank (AAA) |
991 | 37 | — | — | — | 1,028 | 240 | — | ||||||||||||||||||||||||
| Samsung Heavy Industries Co.,Ltd. (BBB) |
— | 7 | — | — | 1,002 | 1,009 | 21 | — | ||||||||||||||||||||||||
| Shinhan Securities Co.,Ltd. (AA) |
950 | — | — | — | — | 950 | — | — | ||||||||||||||||||||||||
| MIRAE ASSET SECURITIES.CO., LTD (AA) |
910 | — | — | — | — | 910 | — | — | ||||||||||||||||||||||||
| SHINHAN BANK (AAA) |
752 | 38 | — | 55 | 5 | 850 | 552 | — | ||||||||||||||||||||||||
| SMALL BUSINESS CORPORATION (B+) |
— | — | — | 795 | — | 795 | — | — | ||||||||||||||||||||||||
| IBK Asset Management Co.,Ltd.(B) |
— | — | — | 646 | — | 646 | — | — | ||||||||||||||||||||||||
| Hana Securities Co., Ltd. (AA) |
638 | — | — | — | — | 638 | — | — | ||||||||||||||||||||||||
| KIWOOM ASSET MANAGEMENT.Co.Ltd. (A+) |
620 | — | — | — | — | 620 | — | — | ||||||||||||||||||||||||
| POSCO INTERNATIONAL (AAA) |
— | 440 | — | — | 161 | 601 | — | — | ||||||||||||||||||||||||
| SAMSUNG ELECTRONICS CO,.LTD (AAA) |
250 | 321 | — | — | — | 571 | — | — | ||||||||||||||||||||||||
| Hyundai Heavy Industries Co., Ltd. (A) |
— | 13 | — | — | 556 | 569 | — | — | ||||||||||||||||||||||||
| Defense Acquisition Program Administration (A) |
— | — | — | — | 569 | 569 | — | — | ||||||||||||||||||||||||
|
|
|
|
|
|
|
|
|
|
|
|
|
|
|
|
|
|||||||||||||||||
| Total |
₩ | 7,231 | ₩ | 1,325 | ₩ | — | ₩ | 56,050 | ₩ | 2,323 | ₩ | 66,929 | ₩ | 813 | ₩ | — | ||||||||||||||||
|
|
|
|
|
|
|
|
|
|
|
|
|
|
|
|
|
|||||||||||||||||
| (1) | Credit ratings are from a domestic credit rating agency, including Korea Ratings Corporation, NICE Investors Service Co. and Korea Investors Services Inc., as of December 31, 2022. If multiple ratings were available, the lowest one is indicated. |
| (2) | The value of collateral is appraised based on future cash flow and observable market price. |
| (3) | Classification is based on the Financial Services Commission’s asset classification criteria. |
| (4) | Credit rating is unavailable. |
72
Table of Contents
As of December 31, 2022, 3 of these top 20 borrowers or issuers were companies belonging to the 40 largest chaebols in Korea. See “Item 3.D. Risk Factors—Risks relating to our corporate credit portfolio—We have exposure to the largest Korean commercial conglomerates, known as “chaebols,” and, as a result, financial difficulties of chaebols may have an adverse impact on us.”
Exposure to Chaebols
As of December 31, 2022, 3.9% of our total exposure was to the 40 largest chaebols in Korea. The following table shows, as of December 31, 2022, our total exposures to the 10 chaebols to which we have the largest exposure:
| Loans | Guarantees and acceptances |
Amounts Classified as substandard or below(2) |
||||||||||||||||||||||||||||||
| Chaebol |
Won currency |
Foreign currency |
Equity securities |
Debt securities |
Total exposures |
Collateral(1) | ||||||||||||||||||||||||||
| (in billions of Won) | ||||||||||||||||||||||||||||||||
| Samsung |
₩ | 942 | ₩ | 1,047 | ₩ | 18 | ₩ | 10 | ₩ | 1,298 | ₩ | 3,315 | ₩ | 25 | ₩ | — | ||||||||||||||||
| Hyundai Motors |
1,276 | 634 | 1 | 50 | 423 | 2,384 | — | — | ||||||||||||||||||||||||
| SK |
1,198 | 354 | 6 | 11 | 353 | 1,922 | 226 | — | ||||||||||||||||||||||||
| GS |
496 | 77 | — | 10 | 1,133 | 1,716 | — | — | ||||||||||||||||||||||||
| Hanwha |
1,015 | 175 | — | 112 | 186 | 1,488 | 376 | — | ||||||||||||||||||||||||
| Mirae Asset |
1,160 | — | — | 218 | — | 1,378 | — | — | ||||||||||||||||||||||||
| Lotte |
924 | 190 | — | 20 | 49 | 1,183 | — | — | ||||||||||||||||||||||||
| LG |
757 | 253 | 1 | — | 16 | 1,027 | — | — | ||||||||||||||||||||||||
| Hyosung |
179 | 393 | — | 19 | 233 | 824 | 325 | — | ||||||||||||||||||||||||
| Kolon |
546 | 71 | — | 9 | 130 | 756 | 127 | — | ||||||||||||||||||||||||
|
|
|
|
|
|
|
|
|
|
|
|
|
|
|
|
|
|||||||||||||||||
| Total |
₩ | 8,493 | ₩ | 3,194 | ₩ | 26 | ₩ | 459 | ₩ | 3,821 | ₩ | 15,993 | ₩ | 1,079 | ₩ | — | ||||||||||||||||
|
|
|
|
|
|
|
|
|
|
|
|
|
|
|
|
|
|||||||||||||||||
| (1) | The value of collateral is appraised based on future cash flow and observable market price. |
| (2) | Classification is based on the Financial Services Commission’s asset classification criteria. |
Loan Concentration by Industry
The following table shows, as of December 31, 2022, the aggregate balance of our domestic and foreign corporate loans by industry concentration and as a percentage of our total corporate lending:
| Aggregate corporate loan balance |
Percentage of total corporate loan balance |
|||||||
| (in billions of Won) | ||||||||
| Industry |
||||||||
| Manufacturing |
₩ | 42,956 | 22.5 | % | ||||
| Financial and insurance |
22,937 | 12.0 | ||||||
| Retail and wholesale |
24,214 | 12.7 | ||||||
| Hotel, leisure and transportation |
11,244 | 5.9 | ||||||
| Construction |
6,779 | 3.5 | ||||||
| Government and government agencies |
194 | 0.1 | ||||||
| Other |
82,777 | 43.3 | ||||||
|
|
|
|
|
|||||
| Total |
₩ | 191,101 | 100.0 | % | ||||
|
|
|
|
|
|||||
73
Table of Contents
Maturity Analysis
The following table sets out, as of December 31, 2022, the scheduled maturities (time remaining until maturity) of our loan portfolio:
| 1 year or less | Over 1 year but not more than 5 years |
Over 5 years but not more than 15 years |
Over 15 years | Total | ||||||||||||||||
| (in billions of Won) | ||||||||||||||||||||
| Loans in local currency |
₩ | 134,594 | ₩ | 79,594 | ₩ | 10,916 | ₩ | 57,583 | ₩ | 282,687 | ||||||||||
| Loans in foreign currencies |
10,467 | 11,180 | 3,977 | 1,721 | 27,345 | |||||||||||||||
| Domestic banker’s usance |
2,877 | — | — | — | 2,877 | |||||||||||||||
| Credit card accounts |
8,379 | 1,826 | 75 | 90 | 10,370 | |||||||||||||||
| Bills bought in foreign currencies |
3,651 | — | — | — | 3,651 | |||||||||||||||
| Bills bought in local currency |
206 | 328 | — | — | 534 | |||||||||||||||
| Factoring receivables |
15 | 10 | — | — | 25 | |||||||||||||||
| Advances for customers on guarantees |
23 | 3 | — | — | 26 | |||||||||||||||
| Private placement bonds |
296 | 144 | 25 | 20 | 485 | |||||||||||||||
| Securitized loans |
— | 2,911 | 80 | — | 2,991 | |||||||||||||||
| Call loans |
3,223 | 47 | — | — | 3,270 | |||||||||||||||
| Bonds purchased under resale agreements |
6,849 | — | — | — | 6,849 | |||||||||||||||
| Financial lease receivables |
88 | 2,035 | 128 | — | 2,251 | |||||||||||||||
| Installment financial bonds |
55 | 1,688 | 307 | — | 2,050 | |||||||||||||||
| Others |
— | — | — | — | — | |||||||||||||||
|
|
|
|
|
|
|
|
|
|
|
|||||||||||
| Total loans |
₩ | 170,723 | ₩ | 99,766 | ₩ | 15,508 | ₩ | 59,414 | ₩ | 345,411 | ||||||||||
|
|
|
|
|
|
|
|
|
|
|
|||||||||||
A significant portion of our loans with maturities of one year is renewed annually. We typically roll over our working capital loans and consumer loans (other than those payable in installments) after we conduct our normal loan review in accordance with our loan review procedures. Under our internal guidelines, we may generally extend working capital loans on an annual basis for an aggregate term of five years. Those guidelines also allow us to generally extend consumer loans other than home equity loans for another term on an annual basis for an aggregate term of up to five years (and home equity loans for an aggregate term of up to 10 years).
74
Table of Contents
Interest Rates
The following table shows, as of December 31, 2022, the total amount of our loans due after one year that have fixed interest rates and variable or adjustable interest rates:
| Fixed Rate(1) |
Variable or adjustable rates(2) |
Total | ||||||||||
| (in billions of Won) | ||||||||||||
| Loans in local currency |
₩ | 48,305 | ₩ | 99,788 | ₩ | 148,093 | ||||||
| Loans in foreign currencies |
4,959 | 11,919 | 16,878 | |||||||||
| Domestic banker’s usance |
— | — | — | |||||||||
| Credit card accounts |
1,991 | — | 1,991 | |||||||||
| Bills bought in foreign currencies |
— | — | — | |||||||||
| Bills bought in local currency |
328 | — | 328 | |||||||||
| Factoring receivables |
10 | — | 10 | |||||||||
| Advances for customers on guarantees |
3 | — | 3 | |||||||||
| Private placement bonds |
139 | 50 | 189 | |||||||||
| Securitized loans |
2,121 | 870 | 2,991 | |||||||||
| Call loans |
47 | — | 47 | |||||||||
| Bonds purchased under resale agreements |
— | — | — | |||||||||
| Financial lease receivables |
2,163 | — | 2,163 | |||||||||
| Installment financial bonds |
1,995 | — | 1,995 | |||||||||
| Others |
— | — | — | |||||||||
|
|
|
|
|
|
|
|||||||
| Total loans |
₩ | 62,061 | ₩ | 112,627 | ₩ | 174,688 | ||||||
|
|
|
|
|
|
|
|||||||
| (1) | Fixed rate loans are loans for which the interest rate is fixed for the entire term. |
| (2) | Variable or adjustable rate loans are loans for which the interest rate is not fixed for the entire term. |
For additional information regarding our management of interest rate risk, see “Item 11. Quantitative and Qualitative Disclosures about Market Risk—Market Risk Management—Asset and Liability Management.”
Asset Quality of Loans
Except where we specify otherwise, all loan amounts stated below do not include amounts due from banks and other receivables and are prior to deducting allowance for credit losses and present value discount or reflecting deferred origination costs, and all corporate loan amounts stated below include loans made to the Korean government and government-owned agencies and banks.
Loan Classifications
The Financial Services Commission generally requires Korean financial institutions to analyze and classify their assets by quality into one of five categories for reporting purposes. In making these classifications, we take into account a number of factors, including the financial position, profitability and transaction history of the borrower, and the value of any collateral or guarantee taken as security for the extension of credit. This classification method, and our related provisioning policy, is intended to fully reflect the borrower’s capacity to repay.
75
Table of Contents
The following is a summary of the asset classification criteria we apply for corporate and consumer loans, based on the asset classification guidelines of the Financial Services Commission. Credit card receivables are subject to classification based on the number of days past due, as required by the Financial Services Commission. We also apply different criteria for other types of credits such as loans to the Korean government or to government-related or controlled entities, certain bills of exchange and certain receivables.
| Asset Classification |
Characteristics | |
| Normal |
Credits extended to customers that, based on our consideration of their business, financial position and future cash flows, do not raise concerns regarding their ability to repay the credits. | |
| Precautionary |
Credits extended to customers that:
• based on our consideration of their business, financial position and future cash flows, show potential risks with respect to their ability to repay the credits, although showing no immediate default risk; or
• are in arrears for one month or more but less than three months. | |
| Substandard |
Either:
• credits extended to customers that, based on our consideration of their business, financial position and future cash flows, are judged to have incurred considerable default risks as their ability to repay has deteriorated; or
• the portion that we expect to collect of total loans (i) extended to customers that have been in arrears for three months or more, (ii) extended to customers that have incurred serious default risks due to the occurrence of, among other things, final refusal to pay their debt instruments, entry into liquidation or bankruptcy proceedings, or closure of their businesses, or (iii) extended to customers who have outstanding loans that are classified as “doubtful” or “estimated loss.” | |
| Doubtful |
Credits exceeding the amount we expect to collect of total credits to customers that:
• based on our consideration of their business, financial position and future cash flows, have incurred serious default risks due to noticeable deterioration in their ability to repay; or
• have been in arrears for three months or more but less than 12 months. | |
76
Table of Contents
| Asset Classification |
Characteristics | |
| Estimated Loss |
Credits exceeding the amount we expect to collect of total credits to customers that:
• based on our consideration of their business, financial position and future cash flows, are judged to have to be accounted as a loss as the inability to repay became certain due to serious deterioration in their ability to repay;
• have been in arrears for 12 months or more; or
• have incurred serious risks of default in repayment due to the occurrence of, among other things, final refusal to pay their debt instruments, liquidation or bankruptcy proceedings or closure of their business. | |
Loan Loss Provisioning Policy
Under IFRS 9 Financial Instruments, or IFRS 9, we establish allowances for credit losses based on expected credit losses instead of incurred losses by assessing changes in expected credit losses and recognizing such changes as impairment loss (or reversal of impairment loss) in profit or loss. Under IFRS 9, the allowance required to be established with respect to a loan or financial asset is the amount of the expected 12-month credit loss or the expected lifetime credit loss for the applicable loan or financial asset, according to three stages of credit risk deterioration since initial recognition.
If additions or changes to the allowance for credit losses are required, then we record provisions for credit loss, which are included in impairment losses due to credit loss and treated as charges against current income. Credit exposures that we deem to be uncollectible, including actual loan losses, net of recoveries of previously charged-off amounts, are charged directly against the allowance for credit losses. See “Item 5.A. Operating Results—Critical Accounting Policies—Impairment of Loans and Allowance for Credit Losses.”
We conclude that a loan is impaired when it is under one of the following conditions:
| • | when the principal is past due by 90 days or more due to significant deterioration in credit; |
| • | for loans overdue for less than 90 days, when it is determined that not even a portion of the loan will be recovered unless a claim action, such as disposal of collateral, is taken; or |
| • | when other objective indicators of impairment have been noted for the loan. |
In addition, if our allowance for credit losses is deemed insufficient for regulatory purposes, we compensate for the difference by recording a planned regulatory reserve for credit loss, which is segregated within our retained earnings. The level of planned regulatory reserve for credit loss required to be recorded is equal to the amount by which our allowance for credit losses under IFRS is less than the greater of (x) the amount of expected loss calculated using the internal ratings-based approach under Basel II and as approved by the Financial Supervisory Service and (y) the required amount of credit loss reserve calculated based on guidelines prescribed by the Financial Services Commission. The following table sets forth the Financial Services Commission’s guidelines applicable to our subsidiary Woori Bank for the minimum percentages of the outstanding principal amount of the relevant loans or balances that the credit loss reserve must cover:
| Loan classifications |
Corporate(1) | Consumer |
Credit card |
Credit card | ||||||
| Normal |
0.85% or above | (4) | 1% or above | 1.1% or above | 2.5% or above | |||||
| Precautionary |
7% or above | 10% or above | 40% or above | 50% or above | ||||||
| Substandard |
20% or above | 20% or above | 60% or above | 65% or above | ||||||
| Doubtful |
50% or above | 55% or above | 75% or above | 75% or above | ||||||
| Estimated loss |
100% | 100% | 100% | 100% | ||||||
77
Table of Contents
| (1) | Subject to certain exceptions pursuant to the Banking Industry Supervision Regulations of Korea. |
| (2) | Applicable for credit card receivables for general purchases of products or services. |
| (3) | Applicable for cash advances, card loans and revolving loan receivables. |
| (4) | ‘0.9% or above’ in case of normal credits comprising loans to certain industries including construction, retail and wholesale sales, accommodations, restaurant, real estate and lease. |
In addition, according to the Regulation on the Supervision of Banking Business, banks are required to maintain allowances for credit losses with respect to their confirmed guarantees, including confirmed acceptances, as well as their outstanding but unused credit lines. The amount of these allowances must be calculated using the same rates applicable to normal, precautionary, substandard, doubtful, and estimated loss credits that make up their outstanding loans and other credits, as described above.
The process to determine the allowances for off-balance sheet positions under IFRS 9 is similar to the methodology used for loans. Any loss amounts are recognized as a provision in the consolidated statements of financial position within liabilities and charged to the consolidated statement of income as a component of the impairment losses due to credit loss.
The actual amount of credit losses we incur may differ from our loss estimates as a result of changing economic conditions, changes in industry or geographic concentrations, or other factors. We monitor the differences between our estimated and actual incurred credit losses, and we undertake detailed periodic assessments of both individual loans and credit portfolios, the models we use to estimate incurred credit losses in those portfolios and the adequacy of our overall allowances.
Loan Aging Schedule
The following table shows our loan aging schedule (excluding accrued interest) as of the dates indicated. In line with industry practice, we have restructured a portion of our delinquent credit card balances as loans.
| As of December 31, 2022 | ||||||||||||||||||||||||||||||||||||||||||||||||
| Normal | Past due by 1 month or less |
Past due by 1-3 months |
Past due by 3-6 months |
Past due by more than 6 months |
Total | |||||||||||||||||||||||||||||||||||||||||||
| (in billions of Won, except percentages) | ||||||||||||||||||||||||||||||||||||||||||||||||
| Amount | % | Amount past due |
% |
Amount past due |
% | Amount past due |
% | Amount past due |
% | Amount | % | |||||||||||||||||||||||||||||||||||||
| Domestic |
||||||||||||||||||||||||||||||||||||||||||||||||
| Corporate(1) |
||||||||||||||||||||||||||||||||||||||||||||||||
| Commercial and industrial |
₩ | 144,765 | 41.9 | % | ₩ | 331 | 0.1 | % | ₩ | 190 | 0.1 | % | ₩ | 102 | 0.0 | % | ₩ | 112 | 0.0 | % | ₩ | 145,500 | 42.1 | % | ||||||||||||||||||||||||
| Lease financing |
2,196 | 0.6 | 6 | 0.0 | 2 | 0.0 | 2 | 0.0 | 1 | 0.0 | 2,207 | 0.6 | ||||||||||||||||||||||||||||||||||||
| Trade financing |
6,754 | 2.0 | 1 | 0.0 | 5 | 0.0 | 1 | 0.0 | 1 | 0.0 | 6,762 | 2.0 | ||||||||||||||||||||||||||||||||||||
| Other commercial |
12,781 | 3.7 | 8 | 0.0 | 5 | 0.0 | 6 | 0.0 | 2 | 0.0 | 12,802 | 3.7 | ||||||||||||||||||||||||||||||||||||
|
|
|
|
|
|
|
|
|
|
|
|
|
|
|
|
|
|
|
|
|
|
|
|
|
|||||||||||||||||||||||||
| Total corporate |
166,496 | 48.2 | 346 | 0.1 | 202 | 0.1 | 111 | 0.0 | 116 | 0.0 | 167,271 | 48.4 | ||||||||||||||||||||||||||||||||||||
| Consumer |
||||||||||||||||||||||||||||||||||||||||||||||||
| General purpose household |
37,957 | 11.0 | 234 | 0.1 | 110 | 0.0 | 71 | 0.0 | 75 | 0.0 | 38,447 | 11.1 | ||||||||||||||||||||||||||||||||||||
| Mortgages |
68,838 | 19.9 | 323 | 0.1 | 66 | 0.0 | 37 | 0.0 | 35 | 0.0 | 69,299 | 20.1 | ||||||||||||||||||||||||||||||||||||
| Home equity |
30,836 | 8.9 | 122 | 0.0 | 35 | 0.0 | 17 | 0.0 | 17 | 0.0 | 31,027 | 9.0 | ||||||||||||||||||||||||||||||||||||
|
|
|
|
|
|
|
|
|
|
|
|
|
|
|
|
|
|
|
|
|
|
|
|
|
|||||||||||||||||||||||||
| Total consumer |
137,631 | 39.8 | 679 | 0.2 | 211 | 0.1 | 125 | 0.0 | 127 | 0.0 | 138,773 | 40.2 | ||||||||||||||||||||||||||||||||||||
| Credit cards |
10,092 | 2.9 | 134 | 0.0 | 81 | 0.0 | 61 | 0.0 | 2 | 0.0 | 10,370 | 3.0 | ||||||||||||||||||||||||||||||||||||
|
|
|
|
|
|
|
|
|
|
|
|
|
|
|
|
|
|
|
|
|
|
|
|
|
|||||||||||||||||||||||||
| Total domestic |
314,219 | 91.0 | 1,159 | 0.3 | 494 | 0.1 | 297 | 0.1 | 245 | 0.1 | 316,414 | 91.6 | ||||||||||||||||||||||||||||||||||||
| Foreign |
||||||||||||||||||||||||||||||||||||||||||||||||
| Corporate(2) |
||||||||||||||||||||||||||||||||||||||||||||||||
| Commercial and industrial |
20,935 | 6.1 | 23 | 0.0 | 8 | 0.0 | 19 | 0.0 | 118 | 0.0 | 21,103 | 6.1 | ||||||||||||||||||||||||||||||||||||
| Lease financing |
26 | 0.0 | — | 0.0 | — | 0.0 | — | 0.0 | — | 0.0 | 26 | 0.0 | ||||||||||||||||||||||||||||||||||||
| Trade financing |
561 | 0.2 | — | 0.0 | — | 0.0 | 2 | 0.0 | 66 | 0.0 | 629 | 0.2 | ||||||||||||||||||||||||||||||||||||
| Other commercial |
2,072 | 0.6 | — | 0.0 | — | 0.0 | — | 0.0 | — | 0.0 | 2,072 | 0.6 | ||||||||||||||||||||||||||||||||||||
|
|
|
|
|
|
|
|
|
|
|
|
|
|
|
|
|
|
|
|
|
|
|
|
|
|||||||||||||||||||||||||
| Total corporate |
23,594 | 6.8 | 23 | 0.0 | 8 | 0.0 | 21 | 0.0 | 184 | 0.1 | 23,830 | 6.9 | ||||||||||||||||||||||||||||||||||||
| Consumer |
5,077 | 1.5 | 20 | 0.0 | 20 | 0.0 | 12 | 0.0 | 38 | 0.0 | 5,167 | 1.5 | ||||||||||||||||||||||||||||||||||||
|
|
|
|
|
|
|
|
|
|
|
|
|
|
|
|
|
|
|
|
|
|
|
|
|
|||||||||||||||||||||||||
| Total foreign |
28,671 | 8.3 | 43 | 0.0 | 28 | 0.0 | 33 | 0.0 | 222 | 0.1 | 28,997 | 8.4 | ||||||||||||||||||||||||||||||||||||
|
|
|
|
|
|
|
|
|
|
|
|
|
|
|
|
|
|
|
|
|
|
|
|
|
|||||||||||||||||||||||||
| Total loans(3) |
₩ | 342,890 | 99.3 | % | ₩ | 1,202 | 0.3 | % | ₩ | 522 | 0.2 | % | ₩ | 330 | 0.1 | % | ₩ | 467 | 0.1 | % | ₩ | 345,411 | 100.0 | % | ||||||||||||||||||||||||
|
|
|
|
|
|
|
|
|
|
|
|
|
|
|
|
|
|
|
|
|
|
|
|
|
|||||||||||||||||||||||||
78
Table of Contents
| (1) | Including loans made to banks and the Korean government and government-owned agencies. |
| (2) | Including loans made to banks. |
| (3) | Not including due from banks and other receivables, and prior to deducting allowance for credit losses and present value discount or reflecting deferred origination costs. |
| As of December 31, 2021 | ||||||||||||||||||||||||||||||||||||||||||||||||
| Normal | Past due by 1 month or less |
Past due by 1-3 months |
Past due by 3-6 months |
Past due by more than 6 months |
Total | |||||||||||||||||||||||||||||||||||||||||||
| (in billions of Won, except percentages) | ||||||||||||||||||||||||||||||||||||||||||||||||
| Amount | % | Amount past due |
% |
Amount past due |
% | Amount past due |
% | Amount past due |
% | Amount | % | |||||||||||||||||||||||||||||||||||||
| Domestic |
||||||||||||||||||||||||||||||||||||||||||||||||
| Corporate(1) |
||||||||||||||||||||||||||||||||||||||||||||||||
| Commercial and industrial |
₩ | 131,286 | 38.9 | % | ₩ | 126 | 0.0 | % | ₩ | 89 | 0.0 | % | ₩ | 61 | 0.0 | % | ₩ | 133 | 0.0 | % | ₩ | 131,695 | 39.0 | % | ||||||||||||||||||||||||
| Lease financing |
1,735 | 0.5 | 4 | 0.0 | 1 | 0.0 | 1 | 0.0 | 2 | 0.0 | 1,743 | 0.5 | ||||||||||||||||||||||||||||||||||||
| Trade financing |
8,332 | 2.5 | 1 | 0.0 | 2 | 0.0 | 1 | 0.0 | 5 | 0.0 | 8,341 | 2.5 | ||||||||||||||||||||||||||||||||||||
| Other commercial |
16,424 | 4.9 | 5 | 0.0 | 2 | 0.0 | 1 | 0.0 | 11 | 0.0 | 16,443 | 4.9 | ||||||||||||||||||||||||||||||||||||
|
|
|
|
|
|
|
|
|
|
|
|
|
|
|
|
|
|
|
|
|
|
|
|
|
|||||||||||||||||||||||||
| Total corporate |
157,777 | 46.7 | 136 | 0.0 | 94 | 0.0 | 64 | 0.0 | 151 | 0.0 | 158,222 | 46.8 | ||||||||||||||||||||||||||||||||||||
| Consumer |
||||||||||||||||||||||||||||||||||||||||||||||||
| General purpose household |
41,835 | 12.4 | 147 | 0.0 | 64 | 0.0 | 43 | 0.0 | 75 | 0.0 | 42,164 | 12.5 | ||||||||||||||||||||||||||||||||||||
| Mortgages |
69,621 | 20.6 | 185 | 0.1 | 37 | 0.0 | 24 | 0.0 | 34 | 0.0 | 69,901 | 20.7 | ||||||||||||||||||||||||||||||||||||
| Home equity |
31,756 | 9.4 | 72 | 0.0 | 23 | 0.0 | 14 | 0.0 | 11 | 0.0 | 31,876 | 9.4 | ||||||||||||||||||||||||||||||||||||
|
|
|
|
|
|
|
|
|
|
|
|
|
|
|
|
|
|
|
|
|
|
|
|
|
|||||||||||||||||||||||||
| Total consumer |
143,212 | 42.4 | 404 | 0.1 | 124 | 0.0 | 81 | 0.0 | 120 | 0.0 | 143,941 | 42.6 | ||||||||||||||||||||||||||||||||||||
| Credit cards |
9,606 | 2.8 | 72 | 0.0 | 48 | 0.0 | 31 | 0.0 | — | 0.0 | 9,757 | 2.9 | ||||||||||||||||||||||||||||||||||||
|
|
|
|
|
|
|
|
|
|
|
|
|
|
|
|
|
|
|
|
|
|
|
|
|
|||||||||||||||||||||||||
| Total domestic |
310,595 | 91.9 | 612 | 0.2 | 266 | 0.1 | 176 | 0.1 | 271 | 0.1 | 311,920 | 92.3 | ||||||||||||||||||||||||||||||||||||
| Foreign |
||||||||||||||||||||||||||||||||||||||||||||||||
| Corporate(2) |
||||||||||||||||||||||||||||||||||||||||||||||||
| Commercial and industrial |
18,782 | 5.6 | 13 | 0.0 | 10 | 0.0 | 14 | 0.0 | 107 | 0.0 | 18,926 | 5.6 | ||||||||||||||||||||||||||||||||||||
| Lease financing |
— | 0.0 | — | 0.0 | — | 0.0 | — | 0.0 | — | 0.0 | — | 0.0 | ||||||||||||||||||||||||||||||||||||
| Trade financing |
1,270 | 0.4 | — | 0.0 | — | 0.0 | — | 0.0 | — | 0.0 | 1,270 | 0.4 | ||||||||||||||||||||||||||||||||||||
| Other commercial |
1,299 | 0.4 | — | 0.0 | — | 0.0 | — | 0.0 | — | 0.0 | 1,299 | 0.4 | ||||||||||||||||||||||||||||||||||||
|
|
|
|
|
|
|
|
|
|
|
|
|
|
|
|
|
|
|
|
|
|
|
|
|
|||||||||||||||||||||||||
| Total corporate |
21,351 | 6.4 | 13 | 0.0 | 10 | 0.0 | 14 | 0.0 | 107 | 0.0 | 21,495 | 6.4 | ||||||||||||||||||||||||||||||||||||
| Consumer |
4,308 | 1.3 | 21 | 0.0 | 18 | 0.0 | 11 | 0.0 | 62 | 0.0 | 4,420 | 1.3 | ||||||||||||||||||||||||||||||||||||
|
|
|
|
|
|
|
|
|
|
|
|
|
|
|
|
|
|
|
|
|
|
|
|
|
|||||||||||||||||||||||||
| Total foreign |
25,659 | 7.6 | 34 | 0.0 | 28 | 0.0 | 25 | 0.0 | 169 | 0.1 | 25,915 | 7.7 | ||||||||||||||||||||||||||||||||||||
|
|
|
|
|
|
|
|
|
|
|
|
|
|
|
|
|
|
|
|
|
|
|
|
|
|||||||||||||||||||||||||
| Total loans(3) |
₩ | 336,254 | 99.5 | % | ₩ | 646 | 0.2 | % | ₩ | 294 | 0.1 | % | ₩ | 201 | 0.1 | % | ₩ | 440 | 0.1 | % | ₩ | 337,835 | 100.0 | % | ||||||||||||||||||||||||
|
|
|
|
|
|
|
|
|
|
|
|
|
|
|
|
|
|
|
|
|
|
|
|
|
|||||||||||||||||||||||||
| (1) | Including loans made to banks and the Korean government and government-owned agencies. |
| (2) | Including loans made to banks. |
| (3) | Not including due from banks and other receivables, and prior to deducting allowance for credit losses and present value discount or reflecting deferred origination costs. |
Credit Exposures to Companies in Workout, Restructuring or Rehabilitation
Workout is a voluntary procedure through which we, together with the borrower and other creditors, seek to restore the borrower’s financial stability and viability. Previously, workouts were regulated under a series of Corporate Restructuring Promotion Acts, which last expired on June 30, 2018. In September 2018, the National Assembly of Korea adopted a new Corporate Restructuring Promotion Act, which became effective on October 16, 2018 and is scheduled to expire on October 15, 2023. However, on January 30, 2023, the Financial Services Commission announced its intention to extend the Corporate Restructuring Promotion Act. Under the new Corporate Restructuring Promotion Act, creditors of a financially troubled borrower may participate in a creditors’ committee, which is authorized to prohibit such creditors from exercising their rights against the borrower, commence workout procedures and approve or make revisions to a reorganization plan prepared by the lead creditor bank, the borrower and external experts. The composition of the creditors’ committee is determined at the initial meeting of the committee by the approval of creditors holding not less than 75% of the borrower’s total outstanding debt held by creditors who were notified of the initial meeting of the committee. Although creditors that are not financial institutions or hold less than 1% of the total outstanding debt of the borrower need not be notified of the initial meeting of the creditors’ committee, if such creditors wish to participate, they may not be excluded. Any decision of the creditors’ committee requires the approval of creditors holding not less than
79
Table of Contents
75% of the total outstanding debt of the borrower. However, if a single creditor holds 75% or more of the borrower’s total outstanding debt held by the creditors comprising the creditors’ committee, any decision of the creditors’ committee requires the approval of not less than 40% of the total number of creditors (including such single creditor) comprising the committee. An additional approval of creditors holding not less than 75% of the secured debt is required with respect to the borrower’s debt restructuring. Once approved, any decision made by the creditors’ committee is binding on all creditors of the borrower, with the exception of those creditors that were excluded by a resolution of the committee at its initial meeting and those who exercised their right to request that their claims be purchased. Creditors that voted against commencement of workout, approval or revision of the reorganization plan, debt restructuring, granting of new credit, extension of the joint management process or other resolutions of the committee have the right to request the creditors that voted in favor of such matters to purchase their claims at a mutually agreed price within seven days from the resolution of the committee. In the event that the parties are not able to agree on the terms of purchase, a coordination committee consisting of experts would determine the terms. The creditors that oppose a decision made by the coordination committee may request a court to change such decision.
Korean law also provides for corporate rehabilitation proceedings, which are court-supervised procedures to rehabilitate an insolvent company. Under these procedures, a restructuring plan is adopted at a meeting of interested parties, including creditors of the company. That restructuring plan is subject to court approval.
A portion of our loans to and debt securities of corporate customers are currently in workout, restructuring or rehabilitation. As of December 31, 2022, ₩183 billion, or 0.04%, of our total loans and debt securities were in workout, restructuring or rehabilitation. This included ₩15 billion of loans to and debt securities of large corporate borrowers in workout, restructuring or rehabilitation and ₩165 billion of loans to and debt securities of small- and medium-sized enterprises in workout, restructuring or rehabilitation, which represented 0.00% and 0.04% of our total loans and debt securities, respectively. At Woori Bank, the Corporate Restoration Department manages its workout, restructured and rehabilitated loans. Upon approval of a workout, restructuring or rehabilitation plan, a credit exposure is initially classified as precautionary or lower and thereafter cannot be classified higher than precautionary with limited exceptions. If a corporate borrower is in workout, restructuring or rehabilitation, we take the status of the borrower into account in assessing our loans to and collateral from that borrower for purposes of establishing our allowance for credit losses.
The following table shows, as of December 31, 2022, our 10 largest exposures that were in workout, restructuring or rehabilitation:
| Loans | Equity Securities |
Debt Securities |
Guarantees and Acceptances |
Total Exposures |
Collateral(1) | Amounts Classified as Substandard or Below(2) |
Allowance for Credit Loss |
|||||||||||||||||||||||||||||
| Company |
Won Currency |
Foreign Currency |
||||||||||||||||||||||||||||||||||
| (in billions of Won) | ||||||||||||||||||||||||||||||||||||
| CREA |
₩ | 16 | ₩ | — | ₩ | — | ₩ | — | ₩ | — | ₩ | 16 | ₩ | 8 | ₩ | 16 | ₩ | 6 | ||||||||||||||||||
| WE-CARE TRADING CO |
— | 12 | — | — | — | 12 | 12 | — | 1 | |||||||||||||||||||||||||||
| THE SOURCE OFFICE |
— | 11 | — | — | — | 11 | 11 | — | 1 | |||||||||||||||||||||||||||
| PT Delta Dunia Tekstil A |
— | 10 | — | — | — | 10 | 6 | 10 | 3 | |||||||||||||||||||||||||||
| Vehiclesystem |
9 | — | — | — | — | 9 | 6 | 9 | 4 | |||||||||||||||||||||||||||
| Crea Gunsan |
6 | — | — | — | — | 6 | 5 | 4 | 2 | |||||||||||||||||||||||||||
| Chew Young Roo |
6 | — | — | — | — | 6 | 2 | 6 | 6 | |||||||||||||||||||||||||||
| Genicos Co., Ltd. |
6 | — | — | — | — | 6 | 6 | 4 | 1 | |||||||||||||||||||||||||||
| Trans-Pacific Resources Ltd. |
4 | 1 | — | — | — | 5 | 2 | 3 | 2 | |||||||||||||||||||||||||||
| Deotech Korea Co., Ltd. |
5 | — | — | — | — | 5 | 5 | 5 | — | |||||||||||||||||||||||||||
|
|
|
|
|
|
|
|
|
|
|
|
|
|
|
|
|
|
|
|||||||||||||||||||
| Total |
₩ | 52 | ₩ | 34 | ₩ | — | ₩ | — | ₩ | — | ₩ | 86 | ₩ | 63 | ₩ | 57 | ₩ | 26 | ||||||||||||||||||
|
|
|
|
|
|
|
|
|
|
|
|
|
|
|
|
|
|
|
|||||||||||||||||||
| (1) | The value of collateral is appraised based on future cash flow and observable market price. |
| (2) | Classification is based on the Financial Services Commission’s asset classification criteria. |
80
Table of Contents
Non-Performing Loans
Non-performing loans include commercial and consumer loans which are past due by 90 days or more. In addition, non-performing loans include those loans that, even if they are not past due, are classified as “substandard,” “doubtful” or “estimated loss” based on the Financial Services Commission’s asset classification criteria. Moreover, when a consumer loan borrower has any loans that are classified as “substandard,” “doubtful” or “estimated loss” under such criteria, all loans to such borrower are classified as non-performing loans. See “—Loan Classifications” above. The following table shows, as of the dates indicated, certain details of our total non-performing loan portfolio:
| As of December 31, | ||||||||
| 2021 | 2022 | |||||||
| (in billions of Won, except percentages) | ||||||||
| Total non-performing loans |
₩ | 927 | (1) | ₩ | 1,016 | (2) | ||
| As a percentage of total loans |
0.27 | % | 0.29 | % | ||||
| (1) | Excludes ₩82 billion of previously delinquent credit card balances restructured into loans that were classified as normal or precautionary. |
| (2) | Excludes ₩124 billion of previously delinquent credit card balances restructured into loans that were classified as normal or precautionary. |
The above amounts do not include loans classified as substandard or below that we sold to United Asset Management Corp., or UAMCO, to certain structured companies, or to other third parties. See “—Sales of Non-Performing Loans.”
We have also issued securities backed by non-performing loans and other assets. Some of these transactions involved transfers of loans through securitizations where control of the loans has not been surrendered and, therefore, are not treated as sale transactions. Instead, the assets remain on our balance sheet with the securitization proceeds treated as part of borrowings. These assets are included in the table above.
81
Table of Contents
The following table sets forth, as of the dates indicated, our total non-performing loans by type of loan:
| As of December 31, | ||||||||||||||||
| 2021 | 2022 | |||||||||||||||
| Amount | % | Amount | % | |||||||||||||
| (in billions of Won, except percentages) | ||||||||||||||||
| Domestic |
||||||||||||||||
| Corporate: |
||||||||||||||||
| Commercial and industrial |
₩ | 353 | 38.10 | % | ₩ | 396 | 38.90 | % | ||||||||
| Lease financing |
5 | 0.50 | 8 | 0.70 | % | |||||||||||
| Trade financing |
16 | 1.70 | 24 | 2.40 | % | |||||||||||
| Other commercial |
48 | 5.20 | 13 | 1.30 | % | |||||||||||
|
|
|
|
|
|
|
|
|
|||||||||
| Total corporate |
422 | 45.50 | 441 | 43.30 | % | |||||||||||
| Consumer: |
||||||||||||||||
| General purpose household(1) |
173 | 18.70 | 221 | 21.70 | % | |||||||||||
| Mortgage |
88 | 9.50 | 90 | 8.90 | % | |||||||||||
|
|
|
|
|
|
|
|
|
|||||||||
| Total consumer |
261 | 28.20 | 310 | 30.60 | % | |||||||||||
| Credit cards |
49 | 5.30 | 88 | 8.70 | % | |||||||||||
|
|
|
|
|
|
|
|
|
|||||||||
| Total domestic |
732 | 79.00 | 839 | 82.60 | % | |||||||||||
| Foreign |
||||||||||||||||
| Corporate: |
||||||||||||||||
| Commercial and industrial |
96 | 10.40 | 93 | 9.10 | % | |||||||||||
| Lease financing |
— | 0.00 | — | 0.00 | % | |||||||||||
| Trade financing |
— | 0.00 | — | 0.00 | % | |||||||||||
| Other commercial |
— | 0.00 | — | 0.00 | % | |||||||||||
|
|
|
|
|
|
|
|
|
|||||||||
| Total corporate |
96 | 10.40 | 93 | 9.10 | % | |||||||||||
| Consumer |
99 | 10.70 | 84 | 8.30 | % | |||||||||||
|
|
|
|
|
|
|
|
|
|||||||||
| Total foreign |
195 | 21.10 | 177 | 17.40 | % | |||||||||||
|
|
|
|
|
|
|
|
|
|||||||||
| Total non-performing loans |
₩ | 927 | 100.0 | % | ₩ | 1,016 | 100.0 | % | ||||||||
|
|
|
|
|
|
|
|
|
|||||||||
| (1) | Includes home equity loans. |
The following table presents an analysis of the changes in our non-performing loans for each of the years indicated:
| Year ended December 31, | ||||||||
| 2021 | 2022 | |||||||
| (in billions of Won) | ||||||||
| Balance at the beginning of the year |
₩ | 1,236 | ₩ | 927 | ||||
| Additions to non-performing loans |
||||||||
| Loans transferred into non-performing loans |
1,300 | 1,372 | ||||||
| Reductions in non-performing loans |
||||||||
| Loans sold |
(375 | ) | (353 | ) | ||||
| Loans modified and returned to performing loans |
(232 | ) | (118 | ) | ||||
| Loans paid down or paid off |
(380 | ) | (318 | ) | ||||
| Loans charged-off |
(622 | ) | (494 | ) | ||||
| Other |
— | — | ||||||
|
|
|
|
|
|||||
| Total net reductions to non-performing loans |
(309 | ) | 89 | |||||
|
|
|
|
|
|||||
| Balance at the end of the year |
₩ | 927 | ₩ | 1,016 | ||||
|
|
|
|
|
|||||
82
Table of Contents
Top 20 Non-Performing Loans. As of December 31, 2022, our 20 largest non-performing loans accounted for 19.3% of our total non-performing loan portfolio. The following table shows, as of that date, certain information regarding those loans:
| Gross principal outstanding |
Allowance for credit losses |
Collateral(1) | Industry | |||||||||||
| (in billions of Won) | ||||||||||||||
| Borrower A |
₩ | 25 | ₩ | 25 | ₩ | — | Manufacturing | |||||||
| Borrower B |
16 | 6 | 8 | Manufacturing | ||||||||||
| Borrower C |
15 | 2 | 15 | Manufacturing | ||||||||||
| Borrower D |
20 | 5 | — | Manufacturing | ||||||||||
| Borrower E |
19 | 11 | — | Other | ||||||||||
| Borrower F |
12 | 1 | 12 | Other | ||||||||||
| Borrower G |
12 | 1 | 11 | Retail and wholesale | ||||||||||
| Borrower H |
11 | 7 | 4 | Retail and wholesale | ||||||||||
| Borrower I |
9 | 4 | 6 | Manufacturing | ||||||||||
| Borrower J |
6 | 6 | 2 | Manufacturing | ||||||||||
| Borrower K |
6 | 1 | 4 | Retail and wholesale | ||||||||||
| Borrower L |
6 | — | — | Manufacturing | ||||||||||
| Borrower M |
5 | 5 | — | Manufacturing | ||||||||||
| Borrower N |
5 | 3 | 6 | Manufacturing | ||||||||||
| Borrower O |
5 | — | 5 | Manufacturing | ||||||||||
| Borrower P |
5 | 3 | 5 | Manufacturing | ||||||||||
| Borrower Q |
5 | — | 30 | Retail and wholesale | ||||||||||
| Borrower R |
5 | — | — | Manufacturing | ||||||||||
| Borrower S |
4 | 1 | 6 | Manufacturing | ||||||||||
| Borrower T |
4 | — | — | Manufacturing | ||||||||||
|
|
|
|
|
|
|
|||||||||
| Total |
₩ | 195 | ₩ | 81 | ₩ | 114 | ||||||||
|
|
|
|
|
|
|
|||||||||
| (1) | The value of collateral is appraised based on future cash flow and observable market price. |
Non-Performing Loans and Impaired Loans
The term “non-performing loan” is used for our asset quality management in accordance with the Banking Industry Supervision Regulations of Korea, whereas the term “impaired loan” is used for financial reporting purposes based on our internal accounting policies in accordance with IFRS 9.
Major differences between non-performing loans and impaired loans are as follows:
| Item |
Non-performing loans |
Impaired loans | ||
| Relevant regulation or accounting principle | Banking Industry Supervision Regulations of Korea (loans classified as “substandard,” “doubtful” or “estimated loss”) |
Our internal policy based on IFRS 9 | ||
| Scope | Loans | Loans (not including due from banks and other financial assets) under IFRS 9 | ||
| Purchased impaired loans | Not included | Included | ||
| Loans classified as “precautionary” based on the Financial Services Commission’s asset classification criteria | Not included | Loans classified as “precautionary,” for which the borrower has a capital deficit or its auditor’s opinion on its financial statements is modified or qualified, are included | ||
83
Table of Contents
The following table shows, as of the dates indicated, the amounts of impaired loans and non-performing loans:
| As of December 31, | ||||||||
| 2021 | 2022 | |||||||
| (in billions of Won) | ||||||||
| Impaired loans |
₩ | 1,158 | ₩ | 1,683 | ||||
| Non-performing loans |
927 | 1,016 | ||||||
Non-Performing Loan Strategy
One of our goals is to improve our asset quality, in part by reducing our non-performing loans. We have standardized the credit risk management systems of our subsidiaries to reduce our risks relating to future non-performing loans. Our credit rating systems are designed to prevent our subsidiaries from extending new loans to high-risk borrowers as determined by their credit rating. Woori Bank’s credit monitoring system also brings to its attention any sudden increase in a borrower’s credit risk, enabling close monitoring of such loans. See “Item 11. Quantitative and Qualitative Disclosures about Market Risk—Credit Risk Management.”
Each of our subsidiaries has one or more units that are responsible for managing non-performing loans. At Woori Bank, for example, the Credit Management and Collection Department and the Corporate Restoration Department generally oversee the process for resolving non-performing loans transferred to them by other Woori Bank business units. We believe that by centralizing the management of our non-performing loans within each subsidiary, we can become more effective in dealing with the issues relating to these loans by pooling institutional knowledge and creating a more specialized workforce.
When a loan becomes non-performing, we will begin a due diligence review of the borrower’s assets, send a notice demanding payment or stating that we will take legal action, and prepare for legal action. At the same time, we initiate our non-performing loan management process, which begins with:
| • | identifying loans subject to a proposed sale by assessing the estimated losses from such sale based on the estimated recovery value of collateral, if any, for such non-performing loans; |
| • | identifying loans subject to charge-off based on the estimated recovery value of collateral, if any, for such non-performing loans and the estimated rate of recovery of unsecured loans; and |
| • | on a limited basis, identifying corporate loans subject to normalization efforts based on the cash-flow situation of the borrower. |
Once we have confirmed the details of a non-performing loan, we make efforts to recover amounts owed to us. Methods for resolving non-performing loans include the following:
| • | commencing collection proceedings; |
| • | commencing legal actions to seize collateral; |
| • | writing off these amounts, transferring them to specific subsidiaries in charge of collections and authorizing those subsidiaries to recover what they can with respect to these amounts or to sell these loans to third parties; and |
| • | with respect to large corporations, commencing or participating in voluntary workouts or restructurings mandated by Korean courts. |
In addition to making efforts to collect on our non-performing loans, we also undertake measures to reduce the overall level of our non-performing loans. These measures include:
| • | selling our non-performing loans to structured companies established in connection with our joint ventures with several financial institutions; and |
| • | selling our non-performing loans to third parties, including UAMCO. |
84
Table of Contents
See “—Sales of Non-Performing Loans.” We generally expect to suffer a partial loss on loans that we sell or securitize, to the extent such sales and securitizations are recognized as such under IFRS.
Foreclosure and Collateral. We generally foreclose on mortgages or exercise our security interests in respect of other collateral if a collateralized obligation becomes overdue for more than three months. At that time, we will petition a court to foreclose on collateral and to sell that collateral through a court-supervised auction. Under Korean law, that petition must be filed with a court that has jurisdiction over the mortgaged property, and must be filed together with a copy of the mortgage agreement and an extract of the court registry regarding the subject property. The court will then issue an order to commence the foreclosure auction, which will be registered in the court registry of the subject property. If no bidder bids at least the minimum amount set by the court on the first auction date, the court will set another date for a subsequent auction approximately one month later. Each time a new auction date is set, the minimum auction price will be lowered by approximately 20%. The auction procedure outlined above, however, might not apply to companies currently undergoing restructuring, recovery proceedings, workout or other court proceedings where there may be restrictions on auction procedures. Unlike laws relating to foreclosure in the United States, Korean law does not provide for non-judicial foreclosure. During 2020, 2021 and 2022, we held collateral with respect to loan balances overdue for more than three months representing approximately 0.1%, 0.1% and 0.2%, respectively, of our interest-bearing loan balances in each of those periods.
Korean financial institutions, including us, maintain general policies to assess a potential customer’s eligibility for loans based on that entity’s credit quality, rather than requiring a particular level of collateral, especially in the case of large corporate borrowers. As a result, the ratio of our collateral to non-performing corporate loans is relatively low when compared with our total exposures. For secured consumer loans, however, we generally impose limits on loan amounts based on the collateral we receive. See “—Consumer Banking—Lending Activities.”
We reflect this collateral level when we estimate the future cash flow for our loans, which we calculate using a discounted cash flow method. With respect to loans to borrowers that we do not believe will be going concerns in the future, the lower collateral ratio has a direct effect on cash flow estimates and results in a higher level of allowances. With respect to loans to borrowers that we expect to be going concerns, the lower collateral ratio has an effect on cash flow estimates but we also consider other factors, including future operating income and future asset disposals and restructuring, in determining allowance levels. Accordingly, for these latter borrowers, the effect of lower collateral levels on allowances is mitigated by other characteristics of the borrower, and that lower collateral level will not necessarily result in a higher level of allowances.
Sales of Non-Performing Loans
The overall asset quality of our loan portfolio is affected by sales of non-performing loans. These sales have been made primarily to third parties. The following table sets forth information regarding our sales of loans for the periods indicated:
| Year Ended December 31, | ||||||||||||||||||||||||||||||||||||
| 2020 | 2021 | 2022 | ||||||||||||||||||||||||||||||||||
| Purchaser |
Net Carrying Amount(1) |
Sale Price |
Gain (Loss) |
Net Carrying Amount(1) |
Sale Price |
Gain (Loss) |
Net Carrying Amount(1) |
Sale Price |
Gain (Loss) |
|||||||||||||||||||||||||||
| (in billions of Won) | ||||||||||||||||||||||||||||||||||||
| KAMCO |
₩ | 14 | ₩ | 14 | ₩ | — | ₩ | — | ₩ | — | ₩ | — | ₩ | — | ₩ | — | ₩ | — | ||||||||||||||||||
| Structured companies |
₩ | 60 | ₩ | 67 | ₩ | 7 | ₩ | 61 | ₩ | 76 | ₩ | 15 | ₩ | 26 | ₩ | 32 | ₩ | 6 | ||||||||||||||||||
| UAMCO(2) |
87 | 98 | 11 | 90 | 105 | 15 | 85 | 113 | 28 | |||||||||||||||||||||||||||
| Others(3) |
29 | 54 | 25 | 36 | 114 | 78 | 27 | 78 | 51 | |||||||||||||||||||||||||||
|
|
|
|
|
|
|
|
|
|
|
|
|
|
|
|
|
|
|
|||||||||||||||||||
| Total |
₩ | 190 | ₩ | 233 | ₩ | 43 | ₩ | 187 | ₩ | 295 | ₩ | 108 | ₩ | 138 | ₩ | 223 | ₩ | 85 | ||||||||||||||||||
|
|
|
|
|
|
|
|
|
|
|
|
|
|
|
|
|
|
|
|||||||||||||||||||
| (1) | Net carrying amount represents the net value of non-performing loans after deduction of allowance for credit losses on such basis. |
| (2) | Woori Bank holds a 14% equity interest in UAMCO. |
| (3) | Includes ₩28 billion of sales to D&CM Corporation in 2021, which may be subject to repurchase by us. |
85
Table of Contents
Allocation and Analysis of Allowances for Credit Losses
The following table presents, as of the dates indicated, the allocation of our allowances for credit losses by loan type:
| As of December 31, | ||||||||||||||||
| 2021 | 2022 | |||||||||||||||
| (in billions of Won, except percentages) | ||||||||||||||||
| Domestic |
||||||||||||||||
| Corporate: |
||||||||||||||||
| Commercial and industrial |
₩ | 897 | 47.5 | % | ₩ | 1,148 | 49.2 | % | ||||||||
| Lease financing |
19 | 1.0 | 4 | 0.2 | % | |||||||||||
| Trade financing |
87 | 4.6 | 153 | 6.6 | % | |||||||||||
| Other commercial |
60 | 3.2 | 51 | 2.2 | % | |||||||||||
|
|
|
|
|
|
|
|
|
|||||||||
| Total corporate |
1,063 | 56.3 | 1,356 | 58.2 | % | |||||||||||
| Consumer: |
||||||||||||||||
| General purpose household(1) |
389 | 20.6 | 450 | 19.3 | % | |||||||||||
| Mortgage |
13 | 0.7 | 15 | 0.6 | % | |||||||||||
|
|
|
|
|
|
|
|
|
|||||||||
| Total consumer |
402 | 21.3 | 465 | 19.9 | % | |||||||||||
| Credit cards |
255 | 13.5 | 303 | 13.0 | % | |||||||||||
|
|
|
|
|
|
|
|
|
|||||||||
| Total domestic |
1,720 | 91.1 | 2,124 | 91.1 | % | |||||||||||
| Foreign |
||||||||||||||||
| Corporate: |
||||||||||||||||
| Commercial and industrial |
123 | 6.5 | 139 | 6.0 | % | |||||||||||
| Trade financing |
1 | 0.1 | 2 | 0.1 | % | |||||||||||
| Other commercial |
4 | 0.2 | 6 | 0.3 | % | |||||||||||
|
|
|
|
|
|
|
|
|
|||||||||
| Total corporate |
128 | 6.8 | 147 | 6.4 | % | |||||||||||
| Consumer |
39 | 2.1 | 63 | 2.7 | % | |||||||||||
|
|
|
|
|
|
|
|
|
|||||||||
| Total foreign |
167 | 8.9 | 210 | 9.1 | % | |||||||||||
|
|
|
|
|
|
|
|
|
|||||||||
| Total allowance for credit losses(2) |
₩ | 1,887 | 100.0 | % | ₩ | 2,334 | 100.0 | % | ||||||||
|
|
|
|
|
|
|
|
|
|||||||||
| (1) | Includes home equity loans. |
| (2) | Not including due from banks and other financial assets. |
86
Table of Contents
The following table presents an analysis of the changes in our allowances for credit losses for each of the years indicated:
| Year ended December 31, | ||||||||||||
| 2020 | 2021 | 2022 | ||||||||||
| (in billions of Won) | ||||||||||||
| Balance at the beginning of the year(1) |
₩ | 1,575 | ₩ | 1,909 | ₩ | 1,887 | ||||||
| Bad debt expenses for the period |
787 | 555 | 861 | |||||||||
| Changes due to business combination |
175 | 28 | 6 | |||||||||
| Increase on repurchases of non-performing loans |
— | — | — | |||||||||
| Gross charge-offs: |
||||||||||||
| Domestic: |
||||||||||||
| Corporate: |
||||||||||||
| Commercial and industrial |
(171 | ) | (157 | ) | (122 | ) | ||||||
| Lease financing |
— | (2 | ) | (1 | ) | |||||||
| Trade financing |
(23 | ) | (12 | ) | (4 | ) | ||||||
| Other commercial |
(6 | ) | (3 | ) | (2 | ) | ||||||
|
|
|
|
|
|
|
|||||||
| Total corporate |
(200 | ) | (174 | ) | (129 | ) | ||||||
| Consumer: |
||||||||||||
| General purpose household(1) |
(178 | ) | (173 | ) | (161 | ) | ||||||
| Mortgage |
(4 | ) | — | — | ||||||||
|
|
|
|
|
|
|
|||||||
| Total consumer |
(182 | ) | (173 | ) | (161 | ) | ||||||
| Credit cards |
(246 | ) | (220 | ) | (220 | ) | ||||||
| Total domestic |
(628 | ) | (567 | ) | (510 | ) | ||||||
| Foreign |
(43 | ) | (61 | ) | (13 | ) | ||||||
|
|
|
|
|
|
|
|||||||
| Total gross charge-offs |
(671 | ) | (628 | ) | (523 | ) | ||||||
| Recoveries: |
||||||||||||
| Domestic: |
||||||||||||
| Corporate: |
||||||||||||
| Commercial and industrial |
54 | 47 | 48 | |||||||||
| Lease financing |
— | — | — | |||||||||
| Trade financing |
4 | 3 | 3 | |||||||||
| Other commercial |
8 | 5 | 4 | |||||||||
|
|
|
|
|
|
|
|||||||
| Total corporate |
66 | 55 | 55 | |||||||||
| Consumer: |
||||||||||||
| General purpose household(1) |
39 | 41 | 38 | |||||||||
| Mortgage |
32 | 34 | 32 | |||||||||
|
|
|
|
|
|
|
|||||||
| Total consumer |
71 | 75 | 70 | |||||||||
| Credit cards |
66 | 66 | 54 | |||||||||
|
|
|
|
|
|
|
|||||||
| Total domestic |
203 | 196 | 179 | |||||||||
| Foreign: |
— | — | 1 | |||||||||
|
|
|
|
|
|
|
|||||||
| Total recoveries |
203 | 196 | 180 | |||||||||
|
|
|
|
|
|
|
|||||||
| Net charge-offs |
(468 | ) | (432 | ) | (343 | ) | ||||||
| Disposal |
(76 | ) | (105 | ) | (68 | ) | ||||||
| Foreign exchange translation effects |
(3 | ) | 6 | (1 | ) | |||||||
| Others(2) |
(81 | ) | (75 | ) | (8 | ) | ||||||
| Adjustment from discontinuing operations |
— | — | — | |||||||||
|
|
|
|
|
|
|
|||||||
| Balance at the end of the year |
₩1,909 | ₩1,886 | ₩2,334 | |||||||||
|
|
|
|
|
|
|
|||||||
| Ratio of net charge-offs during the period to average loans outstanding during the period |
0.2 | % | 0.2 | % | 0.1 | % | ||||||
| (1) | Includes home equity loans. |
| (2) | Includes unwinding of discount. |
87
Table of Contents
Loan Charge-Offs
The credit approval process we have implemented includes assessing credit risk before extending loans and monitoring outstanding loans, in order to minimize loans that must be charged off. To the extent charge-offs are required, we follow charge-off policies aimed at maximizing accounting transparency, minimizing any waste of resources in managing loans which have a low probability of being collected and reducing our non-performing loan ratio.
Loans To Be Charged Off. We charge off loans that are deemed to be uncollectible by virtue of their falling under any of the following categories:
| • | loans for which collection is not foreseeable due to insolvency, bankruptcy, compulsory execution, disorganization, dissolution or the shutting down of the business of the debtor; |
| • | loans for which collection is not foreseeable due to the death or disappearance of the debtor; |
| • | loans for which expenses of collection exceed the collectable amount; |
| • | loans on which collection is not possible through legal or any other means; |
| • | payments in arrears in respect of credit cards (excluding credit card loans) that are overdue for more than six months; |
| • | payments outstanding on corporate and consumer loans that are overdue for more than 12 months; or |
| • | the portion of loans classified as estimated loss, net of any recovery from collateral, which is deemed to be uncollectible. |
Procedure for Charge-off Approval. In order to charge off corporate loans, in the case of Woori Bank, an application for a charge-off must be submitted by a branch to the Credit Management and Collection Department promptly and, in any event, within one month after the corporate loan is classified as estimated loss. The department evaluates and approves the application. Then, Woori Bank must seek an approval from the Financial Supervisory Service for its charge-offs, which is typically granted. At the same time, Woori Bank refers the approval of the charge-off by the Credit Management and Collection Department to its Audit Committee for review to ensure compliance with its internal procedures for charge-offs, which include consultations with the branch submitting the charge-off application. Once Woori Bank receives approval from the Financial Supervisory Service, Woori Bank must also obtain approval from its senior management to charge off those loans.
With respect to consumer loans and credit card balances, we follow a different process to determine which consumer loans and credit card balances should be charged off, based on the length of time those loans or balances are past due. We charge off consumer loans which are 12 months overdue and credit card balances which are six months overdue and have been classified as estimated loss.
Treatment of Loans Charged Off. Once loans are charged off, we classify them as charged-off loans. In the case of Woori Bank, these loans are then transferred to our wholly-owned subsidiary, Woori Credit Information, which is in charge of collections. It will attempt to recover amounts owed or to sell these loans to third parties.
In the case of collateralized loans, our general policy is to petition a court to foreclose and sell the collateral through a court-supervised auction if a collateralized loan becomes overdue for more than three months. If a debtor still fails to repay and the court grants its approval for foreclosure, we will sell the collateral and recover the principal amount and interest accrued up to the amount of the proceeds from such sale, net of expenses incurred for the sale.
Credit Rehabilitation Programs for Delinquent Consumer Borrowers
In light of the rapid increase in delinquencies in credit card and other consumer credit in recent years, and concerns regarding potential social issues posed by the growing number of individuals with bad credit, the Korean government has implemented a number of measures intended to support the rehabilitation of the credit of
88
Table of Contents
delinquent consumer borrowers. These measures may affect the amount and timing of our collections and recoveries on our delinquent consumer credits.
In 2002, the Financial Services Commission established the Credit Counseling and Recovery Service based upon an agreement among approximately 160 financial institutions in Korea. Upon application to the Credit Counseling and Recovery Service and approval by creditor financial institutions representing a majority of the outstanding unsecured debt and two-thirds of the outstanding secured debt, a qualified “credit delinquent person” with outstanding debts to two or more financial institutions in an aggregate amount not exceeding ₩500 million may participate in an individual work-out program designed to restructure such person’s debt and rehabilitate such person’s credit. The aggregate amount of loans of Woori Bank which became subject to such individual work-out programs in 2022 was ₩137 billion. In 2022, Woori Bank recovered approximately ₩12 billion with respect to its loans subject to such individual work-out programs.
Under the Korean Debtor Recovery and Bankruptcy Law, a qualified individual debtor with outstanding debts in an aggregate amount not exceeding threshold amounts of ₩1 billion of unsecured debt and/or ₩1.5 billion of secured debt may restructure his or her debts through a court-supervised debt restructuring that is binding on creditors. The aggregate amount of loans of Woori Bank which became subject to such court-supervised debt restructuring in 2022 was ₩304 billion. In 2022, Woori Bank recovered ₩67 billion with respect to its loans subject to such court-supervised debt restructuring.
In September 2008, to support consumer borrowers with low credit scores, the Financial Services Commission established the Credit Rehabilitation Fund to purchase from creditors the loans of such borrowers that are in default and to provide guarantees so that such loans may be refinanced at lower rates. The Credit Rehabilitation Fund provides support to (i) individuals with low credit scores who are in default on loans not exceeding ₩50 million in principal amount in the aggregate (which requirement will be waived for individuals who are “basic living welfare recipients”) for a period of three months or more and (ii) individuals with low credit scores ranging from category 6 to 10 who are in default on loans not exceeding ₩30 million in principal amount in the aggregate (which requirement will be waived for individuals who are basic living welfare recipients) and the interest rate of which is 30% or more.
In March 2009, the Financial Services Commission requested Korean banks, including Woori Bank, to establish a “pre-workout program,” including a credit counseling and recovery service, for retail borrowers with outstanding short-term debt. Under the pre-workout program, which has been in operation since April 2009, maturity extensions and/or interest rate adjustments are provided to retail borrowers with total loans of ₩1.5 billion or less (consisting of no more than ₩500 million of unsecured loans and ₩1 billion of secured loans) who are in arrears on their payments for more than 30 days but less than 90 days or for retail borrowers with an annual income of ₩40 million or less who have been in arrears on their payments for 30 days or more on an aggregate basis for the 12 months prior to their application, among others. The aggregate amount of consumer credit Woori Bank provided which became subject to the pre-workout program in 2022 was ₩53 billion. See “Item 3.D. Risk Factors—Risks relating to our consumer credit portfolio—We may experience increases in delinquencies in our consumer loan and credit card portfolios.”
89
Table of Contents
Net Charge-Offs. The following table presents information regarding our ratios of net charge-offs to average loans outstanding for each of the years indicated:
| Year ended December 31, | ||||||||||||||||||||||||||||||||||||
| 2020 | 2021 | 2022 | ||||||||||||||||||||||||||||||||||
| Average loans |
Net charge-offs |
Net charge- offs/Average loans |
Average loans |
Net charge-offs |
Net charge- offs/Average loans |
Average loans |
Net charge-offs |
Net charge- offs/Average loans |
||||||||||||||||||||||||||||
| (in billions of Won) | ||||||||||||||||||||||||||||||||||||
| Loans in local currency |
₩ | 233,362 | ₩ | 238 | 0.10 | % | ₩ | 262,345 | ₩ | 224 | 0.09 | % | ₩ | 280,518 | ₩ | 148 | 0.05 | % | ||||||||||||||||||
| Loans in foreign currencies |
19,977 | 31 | 0.16 | 22,194 | 44 | 0.20 | 27,627 | 11 | 0.04 | |||||||||||||||||||||||||||
| Domestic banker’s usance |
2,855 | — | 0.00 | 3,013 | — | 0.00 | 3,653 | — | 0.00 | |||||||||||||||||||||||||||
| Credit card accounts |
8,215 | 180 | 2.19 | 9,203 | 155 | 1.68 | 10,035 | 167 | 1.66 | |||||||||||||||||||||||||||
| Bills bought in foreign currencies |
6,304 | — | 0.00 | 5,878 | — | 0.00 | 6,361 | — | 0.00 | |||||||||||||||||||||||||||
| Bills bought in local currency |
121 | — | 0.00 | 158 | — | 0.00 | (37 | ) | — | 0.00 | ||||||||||||||||||||||||||
| Factoring receivables |
33 | — | 0.00 | 26 | — | 0.00 | 34 | — | 0.00 | |||||||||||||||||||||||||||
| Advances for customers on guarantees |
18 | 13 | 72.22 | 28 | 5 | 17.86 | 24 | 1 | 4.17 | |||||||||||||||||||||||||||
| Private placement bonds |
294 | 5 | 1.70 | 504 | — | 0.00 | 512 | — | 0.00 | |||||||||||||||||||||||||||
| Securitized loans |
2,269 | — | 0.00 | 2,673 | — | 0.00 | 2,992 | 10 | 0.33 | |||||||||||||||||||||||||||
| Call loans |
2,618 | — | 0.00 | 2,185 | — | 0.00 | 3,463 | — | 0.00 | |||||||||||||||||||||||||||
| Bonds purchased under resale agreements |
2,666 | — | 0.00 | 3,244 | — | 0.00 | 3,220 | — | 0.00 | |||||||||||||||||||||||||||
| Financial lease receivables |
373 | — | 0.00 | 909 | — | 0.00 | 1,364 | 1 | 0.07 | |||||||||||||||||||||||||||
| Installment financial bonds |
1,076 | 1 | 0.09 | 2,378 | 4 | 0.17 | 3,049 | 5 | 0.16 | |||||||||||||||||||||||||||
| Others |
— | — | 0.00 | — | — | 0.00 | — | — | 0.00 | |||||||||||||||||||||||||||
|
|
|
|
|
|
|
|
|
|
|
|
|
|
|
|
|
|
|
|||||||||||||||||||
| Total net charge-offs |
₩ | 280,181 | ₩ | 468 | 0.17 | % | ₩ | 314,738 | ₩ | 432 | 0.14 | % | ₩ | 342,815 | ₩ | 343 | 0.10 | % | ||||||||||||||||||
|
|
|
|
|
|
|
|
|
|
|
|
|
|
|
|
|
|
|
|||||||||||||||||||
Securities Investment Portfolio
Investment Policy
We invest in and trade Won-denominated securities and, to a lesser extent, foreign currency-denominated securities for our own account to:
| • | maintain asset stability and diversification; |
| • | maintain adequate sources of back-up liquidity to match funding requirements; and |
| • | supplement income from core lending activities. |
In making securities investments, we take into account a number of factors, including external broker analyses and internal assessments of macroeconomic trends, industry analysis, credit evaluation, maturity and trading history in determining whether to make a particular investment.
Our investments in debt securities include primarily bonds issued by government-related entities, as well as corporate bonds that have been guaranteed by banks (other than merchant banks), government-related funds or privately capitalized funds that we consider to have a low credit risk.
Our securities investments are subject to various regulations, including limitations prescribed under the Financial Holding Company Act and the Bank Act. Under these regulations, a financial holding company may not own (i) more than 5% of the total issued and outstanding shares of another finance-related company, (ii) any shares of its affiliates, other than its direct or indirect subsidiaries, or (iii) any shares of a non-finance-related company. In addition, a bank must limit its investments in equity securities and bonds with a maturity in excess of three years (other than monetary stabilization bonds issued by the Bank of Korea and Korean government bonds) to 100% of the sum of its total Tier I and Tier II capital amount (less any capital deductions). A bank is also generally prohibited from acquiring more than 15% of the shares with voting rights issued by any other corporation, subject to certain exceptions. Pursuant to the Bank Act, a bank and its trust accounts are prohibited from acquiring the shares of a major shareholder (for the definition of “major shareholder,” see “—Supervision
90
Table of Contents
and Regulation—Principal Regulations Applicable to Banks—Financial Exposure to Any Individual Customer or Major Shareholder”) of that bank in excess of an amount equal to 1% of the sum of the bank’s Tier I and Tier II capital (less any capital deductions). Further information on the regulatory environment governing our investment activities is set out in “—Supervision and Regulation—Principal Regulations Applicable to Financial Holding Companies—Liquidity,” “—Supervision and Regulation—Principal Regulations Applicable to Financial Holding Companies—Restrictions on Shareholdings in Other Companies,” “—Supervision and Regulation—Principal Regulations Applicable to Banks—Liquidity” and “—Supervision and Regulation—Principal Regulations Applicable to Banks—Restrictions on Shareholdings in Other Companies.”
Our investments in foreign currencies are subject to certain limits and restrictions specified in our internal guidelines relating to country exposure, a single issuer and type of security exposure, and total investments by individual business groups.
Maturity Analysis
The following table categorizes our debt securities by maturity and weighted average yield as of December 31, 2022:
| As of December 31, 2022 | ||||||||||||||||||||||||||||||||||||||||
| Within 1 year | Over 1 but Within 5 years |
Over 5 but Within 10 years |
Over 10 years | Total | ||||||||||||||||||||||||||||||||||||
| (in billions of Won, except percentages) | ||||||||||||||||||||||||||||||||||||||||
| Amount | Weighted Average Yield(1) |
Amount | Weighted Average Yield(1) |
Amount | Weighted Average Yield(1) |
Amount | Weighted Average Yield(1) |
Amount | Weighted Average Yield(1) |
|||||||||||||||||||||||||||||||
| Financial assets at fair value through other comprehensive income: |
||||||||||||||||||||||||||||||||||||||||
| Korean treasury and government agencies |
₩ | 1,661 | 1.18 | % | ₩ | 3,515 | 1.39 | % | ₩ | 312 | 1.74 | % | ₩ | — | — | % | ₩ | 5,488 | 1.34 | % | ||||||||||||||||||||
| Financial institutions |
9,284 | 1.82 | 7,587 | 2.30 | — | — | — | — | 16,871 | 2.04 | ||||||||||||||||||||||||||||||
| Corporate |
1,772 | 1.36 | 2,160 | 2.13 | 112 | 2.54 | — | — | 4,044 | 1.80 | ||||||||||||||||||||||||||||||
| Foreign currency bonds |
2,572 | 2.78 | 2,723 | 3.05 | 61 | 4.87 | 288 | 3.91 | 5,644 | 2.99 | ||||||||||||||||||||||||||||||
| Securities loaned |
— | — | 99 | 2.37 | — | — | — | — | 99 | 2.37 | ||||||||||||||||||||||||||||||
|
|
|
|
|
|
|
|
|
|
|
|||||||||||||||||||||||||||||||
| Total |
₩ | 15,289 | 1.86 | % | ₩ | 16,084 | 2.21 | % | ₩ | 485 | 2.32 | % | ₩ | 288 | 3.91 | % | ₩ | 32,146 | 2.06 | % | ||||||||||||||||||||
|
|
|
|
|
|
|
|
|
|
|
|||||||||||||||||||||||||||||||
| Financial assets at amortized cost: |
||||||||||||||||||||||||||||||||||||||||
| Korean treasury and government agencies |
₩ | 2,287 | 2.07 | % | ₩ | 7,727 | 1.33 | % | ₩ | 68 | 1.41 | % | ₩ | — | — | % | ₩ | 10,082 | 1.50 | % | ||||||||||||||||||||
| Financial institutions |
3,624 | 3.57 | 6,632 | 3.89 | 24 | 3.53 | — | — | 10,280 | 3.78 | ||||||||||||||||||||||||||||||
| Corporate |
531 | 2.51 | 3,858 | 2.21 | 1,694 | 2.54 | 152 | 2.21 | 6,235 | 2.32 | ||||||||||||||||||||||||||||||
| Foreign currency bonds |
750 | 2.16 | 892 | 2.16 | 10 | 2.91 | 20 | 3.98 | 1,672 | 2.18 | ||||||||||||||||||||||||||||||
|
|
|
|
|
|
|
|
|
|
|
|||||||||||||||||||||||||||||||
| Total |
₩ | 7,192 | 2.87 | % | ₩ | 19,109 | 2.43 | % | ₩ | 1,796 | 2.51 | % | ₩ | 172 | 2.42 | % | ₩ | 28,269 | 2.55 | % | ||||||||||||||||||||
|
|
|
|
|
|
|
|
|
|
|
|||||||||||||||||||||||||||||||
| (1) | The weighted average yield for the portfolio represents the yield to maturity for each individual security, weighted using its book value (which is the amortized cost in the case of financial assets at amortized cost and the fair value in the case of financial assets at fair value through other comprehensive income). |
Funding
We fund our lending and other activities using various sources, both domestic and foreign. Our primary funding strategy is to maintain stable and low-cost funding. We have in the past achieved this in part by
91
Table of Contents
increasing the average balances of low-cost customer deposits, in particular demand deposits and savings deposits.
Customer deposits are our principal funding source. Customer deposits accounted for 80.9% of our total funding as of December 31, 2021 and 81.2% of our total funding as of December 31, 2022.
We also acquire funding through the following sources:
| • | long-term debt, including the issuance of senior and subordinated debentures and borrowings from government-affiliated funds and entities and other financial institutions; |
| • | short-term borrowings, including borrowings from our trust accounts and from the Bank of Korea, and call money; and |
| • | the issuance of hybrid securities, including bond-type hybrid securities. |
As of December 31, 2022, 84.7% of our total funding was denominated in Won.
Deposits
Although the majority of our deposits are short-term, it has been our experience that the majority of our depositors generally roll over their deposits at maturity, providing us with a stable source of funding. See “Item 3.D. Risk Factors—Other risks relating to our business—Our funding is highly dependent on short-term deposits, which dependence may adversely affect our operations.” The following table shows the average balances of our deposits and the average costs of our deposits for the periods indicated:
| For the year ended December 31, | ||||||||||||||||||||||||
| 2020 | 2021 | 2022 | ||||||||||||||||||||||
| Average Balance(1) |
Average Cost |
Average Balance(1) |
Average Cost |
Average Balance(1) |
Average Cost |
|||||||||||||||||||
| (in billions of Won, except percentages) | ||||||||||||||||||||||||
| Demand deposits |
₩ | 10,110 | 0.48 | % | ₩ | 14,634 | 0.72 | % | ₩ | 12,875 | 0.68 | % | ||||||||||||
| Time deposits and savings deposits(2) |
225,563 | 0.91 | 243,708 | 0.61 | 258,594 | 1.24 | ||||||||||||||||||
| Certificates of deposit |
1,677 | 1.31 | 2,858 | 0.94 | 5,263 | 2.19 | ||||||||||||||||||
| Other deposits(3) |
34,861 | 1.03 | 38,374 | 0.73 | 47,978 | 1.48 | ||||||||||||||||||
|
|
|
|
|
|
|
|
|
|
|
|
|
|||||||||||||
| Average total deposits |
₩ | 272,211 | 0.91 | % | ₩ | 299,574 | 0.64 | % | ₩ | 324,710 | 1.27 | % | ||||||||||||
|
|
|
|
|
|
|
|
|
|
|
|
|
|||||||||||||
| (1) | Average balances are based on daily balances for Woori Bank and on quarterly balances for all of our other subsidiaries and our structured companies. |
| (2) | Savings deposits are deposits that allow the customers to deposit and withdraw funds at any time and accrue interest at a fixed rate set by us depending upon the period and amount of deposit. |
| (3) | Mutual installment deposits are interest-bearing deposits offered by us, which enable customers to become eligible to apply for loans secured by such deposits while they maintain an account with us. In order to qualify to apply for such a loan, a customer must make required periodic deposits to the mutual installment account for a contracted term of less than five years. Any such loan will be secured in an amount up to the holder’s mutual installment deposit and will be subject to the same loan underwriting policy we apply for other secured loans. For the portion of the loan, if any, that is not secured, we apply the same loan underwriting policy as we would for other unsecured loans. |
For a description of our retail deposit products, see “—Business—Consumer Banking—Lending Activities—Mortgage and Home Equity Lending” and “—Business—Consumer Banking—Deposit-Taking Activities.”
The Depositor Protection Act provides insurance for certain deposits of banks in Korea through a deposit insurance system. See “—Supervision and Regulation—Principal Regulations Applicable to Banks—Deposit Insurance System.” The KDIC insures a maximum of ₩50 million per individual for deposits and interest in a single financial institution, regardless of when the deposits were made or the size of the deposits. In addition to the insured deposits applicable in Korea, the insured status for deposits in our foreign subsidiaries are determined based on the individual insurance limits enacted within local regulations, and are thus subject to differing
92
Table of Contents
national deposit insurance regimes. Our total uninsured deposits across all jurisdictions amounted to ₩248,587 billion as of December 31, 2021 and ₩264,351 billion as of December 31, 2022.
Uninsured Time Deposits
Our uninsured time deposits refer to our uninsured deposits that have a fixed maturity, including time deposits and installment savings deposits. The following table presents, as of December 31, 2022, the remaining maturities of our uninsured time deposits:
| As of December 31, 2022 | ||||
| (in billions of Won) | ||||
| Maturing within three months |
₩ | 66,582 | ||
| After three but within six months |
29,296 | |||
| After six but within 12 months |
45,910 | |||
| After 12 months |
9,591 | |||
|
|
|
|||
| Total |
₩ | 151,379 | ||
|
|
|
|||
Supervision and Regulation
Principal Regulations Applicable to Financial Holding Companies
General
The Financial Holding Company Act, last amended on December 31, 2022, regulates Korean financial holding companies and their subsidiaries. The entities that regulate and supervise Korean financial holding companies and their subsidiaries are the Financial Services Commission and the Financial Supervisory Service.
The Financial Services Commission exerts direct control over financial holding companies pursuant to the Financial Holding Company Act. Among other things, the Financial Services Commission approves the establishment of financial holding companies, issues regulations on the capital adequacy of financial holding companies and their subsidiaries, and drafts regulations relating to the supervision of financial holding companies.
Following the instructions and directives of the Financial Services Commission, the Financial Supervisory Service supervises and examines financial holding companies and their subsidiaries. In particular, the Financial Supervisory Service sets requirements relating to Korean financial holding companies’ liquidity and capital adequacy ratios and establishes reporting requirements within the authority delegated under the Financial Services Commission regulations. Financial holding companies must submit quarterly reports to the Financial Supervisory Service discussing business performance, financial status and other matters identified in the Enforcement Decree of the Financial Holding Company Act.
Under the Financial Holding Company Act, a financial holding company is a company which primarily engages in controlling its subsidiaries by holding equity stakes in them equal in aggregate to at least 50% of the financial holding company’s aggregate assets based on its balance sheet as of the end of the immediately preceding fiscal year. A company is required to obtain approval from the Financial Services Commission to become a financial holding company.
A financial holding company may engage only in controlling the management of its subsidiaries, as well as certain ancillary activities including:
| • | financially supporting its direct and indirect subsidiaries; |
| • | raising capital necessary for investment in its subsidiaries or providing financial support to its direct and indirect subsidiaries; |
| • | supporting the business of its direct and indirect subsidiaries, including the development and marketing of financial products; |
93
Table of Contents
| • | providing data processing, legal, accounting and other resources and services that have been commissioned by its direct and indirect subsidiaries so as to support their operations; and |
| • | any other businesses exempted from authorization, permission or approval under the applicable laws and regulations. |
The Financial Holding Company Act requires every financial holding company (other than a financial holding company that is controlled by another financial holding company) and its subsidiaries to obtain prior approval from the Financial Services Commission before acquiring control of another company or to file a report with the Financial Services Commission within 30 days thereafter in certain cases (including acquiring control of another company whose assets are less than ₩100 billion as of the end of the immediately preceding fiscal year). In addition, the Financial Services Commission must grant permission to liquidate or to merge with any other company before the liquidation or merger. A financial holding company must report to the Financial Services Commission when certain events, including the following, occur:
| • | when the largest shareholder changes; |
| • | in the case of a bank holding company, when a major investor changes; |
| • | when the shareholding of the controlling shareholder (i.e., the “largest shareholder” or a “principal shareholder,” each as defined in the Financial Holding Company Act) or a person who has a “special relationship” with such controlling shareholder (as defined in the Enforcement Decree of the Financial Holding Company Act) changes by 1% or more of the total issued and outstanding voting shares of the financial holding company; |
| • | when it changes its corporate name; |
| • | when there is a cause for its dissolution; |
| • | when it or its subsidiaries cease to control any of their respective direct or indirect subsidiaries by disposing of their shares of such direct or indirect subsidiary; and |
| • | other cases prescribed by the Enforcement Decree of the Financial Holding Company Act, in which the soundness of management of a financial holding company may be undermined. |
Capital Adequacy
The Financial Holding Company Act does not provide for a minimum paid-in capital requirement related to financial holding companies. However, all financial holding companies are required to maintain a specified level of solvency. In addition, with respect to the allocation of net profit earned in a fiscal term, a financial holding company must set aside in its legal reserve an amount equal to at least 10% of its net income after tax each time it pays dividends on its net profits earned until its legal reserve reaches at least the aggregate amount of its paid-in capital.
A bank holding company, which is a financial holding company controlling banks or other financial institutions conducting banking business as prescribed in the Financial Holding Company Act, is required to maintain a total minimum consolidated capital adequacy ratio of 11.5% (including applicable additional capital buffers and requirements as described below). “Consolidated capital adequacy ratio” is defined as the ratio of equity capital as a percentage of risk-weighted assets on a consolidated basis, determined in accordance with the Financial Services Commission requirements that have been formulated based on Bank of International Settlements, or BIS, standards. “Equity capital,” as applicable to bank holding companies, is defined as the sum of common equity Tier I capital, additional Tier I capital and Tier II capital less any deductible items, each as defined under the Regulation on the Supervision of Financial Holding Companies. “Risk-weighted assets” is defined as the sum of credit risk-weighted assets, market risk-weighted assets and operational risk-weighted assets.
Pursuant to regulations promulgated by the Financial Services Commission commencing in 2013 to implement Basel III, Korean bank holding companies were required to maintain a minimum ratio of common
94
Table of Contents
equity Tier I capital to risk-weighted assets of 3.5% and Tier I capital to risk-weighted assets of 4.5% from December 1, 2013, which minimum ratios were increased to 4.0% and 5.5%, respectively, from January 1, 2014 and increased further to 4.5% and 6.0%, respectively, from January 1, 2015. Such requirements are in addition to the pre-existing requirement for a minimum ratio of Tier I and Tier II capital (less any capital deductions) to risk-weighted assets of 8.0%, which remains unchanged. The amended regulations also require an additional capital conservation buffer of 2.5%, as well as a potential counter-cyclical capital buffer of up to 2.5%, which is determined on a quarterly basis by the Financial Services Commission. Furthermore, bank holding companies designated as domestic systemically important banks for 2023 by the Financial Services Commission are subject to an additional capital requirement of 1.0%.
Liquidity
All financial holding companies are required to match the maturities of their assets and liabilities on a non-consolidated basis in accordance with the Financial Holding Company Act in order to ensure liquidity. Financial holding companies must:
| • | maintain a Won liquidity ratio (defined as Won assets due within one month, including marketable securities, divided by Won liabilities due within one month) of not less than 100% on a non-consolidated basis; |
| • | maintain a foreign currency liquidity ratio (defined as foreign currency liquid assets due within three months divided by foreign currency liabilities due within three months) of not less than 80% on a non-consolidated basis (except that such requirement is not applicable to a financial holding company whose foreign currency liabilities constitute less than 1% of its total assets); |
| • | maintain a ratio of foreign currency liquid assets due within seven days less foreign currency liabilities due within seven days as a percentage of total foreign currency assets of not less than 0% on a non-consolidated basis (except that such requirement is not applicable to a financial holding company whose foreign currency liabilities constitute less than 1% of its total assets); |
| • | maintain a ratio of foreign currency liquid assets due within a month less foreign currency liabilities due within a month as a percentage of total foreign currency assets of not less than negative 10% on a non-consolidated basis (except that such requirement is not applicable to a financial holding company whose foreign currency liabilities constitute less than 1% of its total assets); and |
| • | make quarterly reports regarding their Won liquidity and foreign currency liquidity to the Financial Supervisory Service. |
Financial Exposure to Any Individual Customer and Major Investor
Subject to certain exceptions, the aggregate credit (as defined in the Financial Holding Company Act, the Bank Act, the Financial Investment Services and Capital Markets Act, the Insurance Business Act, the Mutual Savings Bank Act and the Specialized Credit Financial Business Act, respectively) of a financial holding company and its direct and indirect subsidiaries that are banks, merchant banks, financial investment companies, insurance companies, savings banks or specialized credit financial business companies (which we refer to as “Financial Holding Company Total Credit”) to a single group of companies that belong to the same conglomerate as defined in the Monopoly Regulations and Fair Trade Act will not be permitted to exceed 25% of net aggregate equity capital (as defined below).
“Net aggregate equity capital” is defined under the Enforcement Decree of the Financial Holding Company Act as the sum of:
| (1) | in case of a financial holding company, the capital amount as defined in Article 24-3(7), Subparagraph 2 of the Enforcement Decree of the Financial Holding Company Act; |
| (2) | in case of a bank, the capital amount as defined in Article 2(1), Subparagraph 5 of the Bank Act; |
| (3) | in case of a merchant bank, the capital amount as defined in Article 342(1) of the Financial Investment Services and Capital Markets Act; |
95
Table of Contents
| (4) | in case of a financial investment company, the capital amount as defined in Article 37(3) of the Enforcement Decree of the Financial Investment Services and Capital Markets Act; |
| (5) | in case of an insurance company, the capital amount as defined in Article 2, Subparagraph 15 of the Insurance Business Act; |
| (6) | in case of a savings bank, the capital amount as defined in Article 2, Subparagraph 4 of the Mutual Savings Bank Act; and |
| (7) | in case of a specialized credit financial business company, the capital amount as defined in Article 2, Subparagraph19 of the Specialized Credit Financial Business Act; |
less the sum of:
| (1) | the amount of shares of direct and indirect subsidiaries held by the financial holding company; |
| (2) | the amount of shares that are cross-held by each direct and indirect subsidiary that is a bank, merchant bank, financial investment company, insurance company, savings bank or specialized credit financial business company; and |
| (3) | the amount of shares of a financial holding company held by such direct and indirect subsidiaries that are banks, merchant banks, financial investment companies, insurance companies, savings banks or specialized credit financial business companies. |
The Financial Holding Company Total Credit to a single individual or judicial person may not exceed 20% of the net aggregate equity capital. In addition, the Financial Holding Company Total Credit to a shareholder holding (together with the persons who have a “special relationship” with the shareholder, as defined in the Enforcement Decree of the Financial Holding Company Act) in aggregate more than 10% of the total issued and outstanding voting shares of a financial holding company generally may not exceed the lesser of (x) 25% of the net aggregate equity capital and (y) the amount of the equity capital of the financial holding company multiplied by the shareholding ratio of the shareholder (together with the persons who have a special relationship with the shareholder).
Further, the total sum of credits (as defined in the Financial Holding Company Act, the Bank Act, the Financial Investment Services and Capital Markets Act, the Insurance Business Act, the Mutual Savings Bank Act and the Specialized Credit Financial Business Act, respectively) of a bank holding company and its direct and indirect subsidiaries that are banks, merchant banks, financial investment companies, insurance companies, savings banks or specialized credit financial business companies as applicable (which we refer to as “Bank Holding Company Total Credit”) extended to a “major investor” (as defined below) (together with the persons who have a special relationship with that major investor) will not be permitted to exceed the lesser of (x) 25% of the net aggregate equity capital and (y) the amount of the equity capital of the bank holding company multiplied by the shareholding ratio of the major investor, except for certain cases.
“Major investor” is defined as:
| • | a shareholder holding (together with persons who have a special relationship with that shareholder) in excess of 10% (or in the case of a bank holding company controlling regional banks only, 15%) in the aggregate of the bank holding company’s total issued and outstanding voting shares; or |
| • | a shareholder holding (together with persons who have a special relationship with that shareholder) more than 4% in the aggregate of the total issued and outstanding voting shares of the bank holding company controlling nationwide banks, where the shareholder is the largest shareholder or has actual control over the major business affairs of the bank holding company through, for example, appointment and dismissal of the officers pursuant to the Enforcement Decree of the Financial Holding Company Act. |
In addition, the total sum of the Bank Holding Company Total Credit granted to all of a bank holding company’s major investor must not exceed 25% of the bank holding company’s net aggregate equity capital. Furthermore, any bank holding company that, together with its direct and indirect subsidiaries, intends to extend
96
Table of Contents
credit to the bank holding company’s major investor in an amount equal to or exceeding the lesser of (x) the amount equivalent to 0.1% of the net aggregate equity capital and (y) ₩5 billion, in any single transaction, must obtain prior unanimous board resolutions and then, immediately after providing the credit, must file a report to the Financial Services Commission and publicly disclose the filing of the report.
Restrictions on Transactions Among Direct and Indirect Subsidiaries and Financial Holding Company
Generally, a direct or indirect subsidiary of a financial holding company may not extend credits (excluding the amount of corporate credit card payments issued by a direct or indirect subsidiary of a financial holding company that is engaged in the banking business) to that financial holding company. In addition, a direct or indirect subsidiary of a financial holding company may not extend credits (excluding the amount of corporate credit card payments issued by a direct or indirect subsidiary of a financial holding company that is engaged in the banking business) to other direct or indirect subsidiaries of the financial holding company in excess of 10% of its capital amount on an individual basis or to those subsidiaries in excess of 20% of its capital amount on an aggregate basis. The subsidiary extending the credit must also obtain an adequate level of collateral depending on the type of such collateral from the other subsidiaries unless the credit is otherwise approved by the Financial Services Commission. The adequate level of collateral for each type of collateral is as follows:
| (1) | for deposits and installment savings, obligations of the Korean government or the Bank of Korea, obligations guaranteed by the Korean government or the Bank of Korea, obligations secured by securities issued or guaranteed by the Korean government or the Bank of Korea, 100% of the credit extended; |
| (2) | for obligations of municipal governments under the Local Autonomy Act, local public enterprise under the Local Public Enterprises Act and investment institutions and other quasi-investment institutions under the Basic Act on the Management of Government-Invested Institution or for obligations guaranteed by, or secured by the securities issued or guaranteed by, the aforementioned entities pursuant to the relevant regulations, 110% of the credit extended; and |
| (3) | for any property other than those set forth in paragraphs (1) and (2) above, 130% of the credit extended. |
Subject to certain exceptions, a direct or indirect subsidiary of a financial holding company is prohibited from owning the shares of any other direct or indirect subsidiaries (other than those directly controlled by that direct or indirect subsidiary) under the common control of the financial holding company.
Subject to certain exceptions, a direct or indirect subsidiary of a financial holding company is also prohibited from owning the shares of the financial holding company controlling that direct or indirect subsidiary. The transfer of certain assets classified as precautionary or below between a financial holding company and its direct or indirect subsidiary or between the direct and indirect subsidiaries of a financial holding company is prohibited except for:
| (1) | transfers to a special purpose company, or entrustment with a trust company, for an asset-backed securitization transaction under the Asset-Backed Securitization Act; |
| (2) | transfers to a mortgage-backed securities issuance company for a mortgage securitization transaction; |
| (3) | transfers or in-kind contributions to a corporate restructuring vehicle under the Corporate Restructuring Investment Companies Act; and |
| (4) | transfers to a corporate restructuring company under the Industry Promotion Act. |
Disclosure of Management Performance
For the purpose of protecting the depositors and investors in the subsidiaries of financial holding companies, the Financial Services Commission requires financial holding companies to disclose certain material matters including:
| (1) | financial condition and profit and loss of the financial holding company and its direct and indirect subsidiaries; |
97
Table of Contents
| (2) | fund-raising by the financial holding company and its direct and indirect subsidiaries and the appropriation of such funds; |
| (3) | any sanctions levied on the financial holding company and its direct and indirect subsidiaries under the Financial Holding Company Act or any corrective measures or sanctions under the Act on the Structural Improvement of the Financial Industry; and |
| (4) | occurrence of any non-performing assets or financial incident that may have a material adverse effect, or any other event as prescribed in the applicable regulations. |
Restrictions on Shareholdings in Other Companies
Generally, a financial holding company may not own (i) more than 5% of the total issued and outstanding shares of another finance-related company, (ii) any shares of its affiliates, other than its direct or indirect subsidiaries or (iii) any shares of a non-finance-related company.
Restrictions on Shareholdings by Direct and Indirect Subsidiaries
Generally, a direct subsidiary of a financial holding company may not control any other company other than, as an indirect subsidiary of the financial holding company:
| • | financial institutions established in foreign jurisdictions; |
| • | certain financial institutions which are engaged in any business that the direct subsidiary may conduct without any licenses or permits; |
| • | certain financial institutions whose business is related to the business of the direct subsidiary as described by the Enforcement Decree of the Financial Holding Company Act (for example, a bank subsidiary may control only credit information companies, debt collection companies, credit card companies and financial investment companies with a dealing, brokerage, collective investment, investment advice, discretionary investment management and/or trust license); |
| • | certain financial institutions whose business is related to the financial business as prescribed by the regulations of the Ministry of Economy and Finance; and |
| • | certain companies which are not financial institutions but whose business is related to the financial business of the financial holding company as prescribed by the Enforcement Decree of the Financial Holding Company Act (for example, a finance-related research company or a finance-related information technology company). |
Acquisition of such indirect subsidiaries by direct subsidiaries of a financial holding company requires prior permission from the Financial Services Commission or the submission of a report to the Financial Services Commission, depending on the types of the indirect subsidiaries and the amount of total assets of the indirect subsidiaries.
Subject to certain exceptions, an indirect subsidiary of a financial holding company may not control any other company. If an indirect subsidiary of a financial holding company had control over another company at the time it became such an indirect subsidiary, the indirect subsidiary is required to dispose of its interest in the other company within two years from such time.
Restrictions on Transactions between a Bank Holding Company and its Major Investor
A bank holding company and its direct and indirect subsidiaries may not acquire (including through their respective trust accounts) shares issued by the bank holding company’s major investor in excess of 1% of the net aggregate equity capital (as defined above). In addition, if those entities intend to acquire shares issued by that major investor in any single transaction equal to or exceeding the lesser of (x) the amount equivalent to 0.1% of the net aggregate equity capital and (y) ₩5 billion, that entity must obtain prior unanimous board resolutions and then, immediately after the acquisition, file a report to the Financial Services Commission and publicly disclose the filing of the report.
98
Table of Contents
Restrictions on Ownership of a Financial Holding Company
Under the Financial Holding Company Act, a financial institution generally may not control a financial holding company. In addition, any single shareholder and persons who have a special relationship with that shareholder may acquire beneficial ownership of up to 10% of the total issued and outstanding shares with voting rights of a bank holding company that controls nationwide banks or 15% of the total issued and outstanding shares with voting rights of a bank holding company that controls only regional banks, subject to certain exceptions. Among others, the Korean government and the Korea Deposit Insurance Corporation are not subject to this limit. “Non-financial business group companies” (as defined below), however, may not acquire the beneficial ownership of shares of a bank holding company controlling nationwide banks in excess of 4% of that bank holding company’s outstanding voting shares unless they obtain the approval of the Financial Services Commission and agree not to exercise voting rights in respect of shares in excess of the 4% limit, in which case they may acquire beneficial ownership of up to 10%. Any other person (whether a Korean national or a foreign investor) may acquire no more than 10% of total voting shares issued and outstanding of a bank holding company controlling nationwide banks unless they obtain approval from the Financial Services Commission in each instance where the total holding will exceed 10% (or 15% in the case of a bank holding company controlling only regional banks), 25% or 33% of the total voting shares issued and outstanding of that bank holding company controlling nationwide banks.
Furthermore, in the case where a person (including Korean and foreign investors, but excluding certain persons prescribed under the Enforcement Decree of the Financial Holding Company Act) (i) acquires in excess of 4% of the total issued and outstanding voting shares of any bank holding company (other than a bank holding company controlling only regional banks), (ii) becomes the largest shareholder of such bank holding company in which such person has acquired in excess of 4% of the total issued and outstanding voting shares, (iii) changes its shareholding in such bank holding company, in which it has acquired in excess of 4% of the total issued and outstanding voting shares, by 1% or more of the total issued and outstanding voting shares of such bank holding company or (iv) is a private equity fund or an investment purpose company holding in excess of 4% of the total outstanding voting shares of a bank holding company and changes its members or shareholders, such person must file a report on such change with the Financial Services Commission (x) in case of (i) and (iii), by the last day of the month following the month in which such change occurred, or (y) in case of (ii) and (iv), within ten days after the end of the month in which such change occurred.
“Non-financial business group companies” as defined under the Financial Holding Company Act include:
| (1) | any same shareholder group where the aggregate net assets of all non-financial business companies belonging to that group equals or exceeds 25% of the aggregate net assets of all members of that group; |
| (2) | any same shareholder group where the aggregate assets of all non-financial business companies belonging to that group equals or exceeds ₩2 trillion; |
| (3) | any mutual fund where a same shareholder group identified in (1) or (2) above beneficially owns and/or exercises the voting rights of more than 4% of the total issued and outstanding voting shares of that mutual fund; |
| (4) | any private equity fund (a) where a person falling under any of items (1) through (3) above is a limited partner holding not less than 10% of the total amount of contributions to the private equity fund, or (b) where a person falling under any of items (1) through (3) above is a general partner, or (c) where the total equity of the private equity fund acquired by each affiliate belonging to several enterprise groups subject to the limitation on mutual investment is 30% or more of the total amount of contributions to the private equity fund; or |
| (5) | the investment purpose company concerned, where a private equity fund falling under item (4) above acquires or holds stocks in excess of 4% of the stock or equity of such company or exercises de facto control over significant managerial matters of such company through appointment or dismissal of executives or in any other manner. |
99
Table of Contents
Sharing of Customer Information among Financial Holding Company and its Subsidiaries
Under the Act on Use and Protection of Credit Information, any individual customer’s credit information must be disclosed or otherwise used by financial institutions only to determine, establish or maintain existing commercial transactions with them and only after obtaining written consent to use that information. In addition, under the Act on Real Name Financial Transactions and Confidentiality, an individual working at a financial institution may not provide or reveal information or data concerning the contents of financial transactions to other persons unless such individual receives a request or consent in writing from the holder of a title deed, except under certain exceptions stipulated in the Act. Under the Financial Holding Company Act, a financial holding company and its direct and indirect subsidiaries, however, may share certain credit information of individual customers among themselves for internal management purposes outlined in the Enforcement Decree of the Financial Holding Company Act (such as credit risk management, internal control and customer analysis), without the customers’ written consent, subject to the methods and procedures for provision of such information set forth therein. A subsidiary financial investment company with a dealing and/or brokerage license of a financial holding company may provide that financial holding company and its other direct and indirect subsidiaries information relating to the aggregate amount of cash or securities that a customer of the financial investment company with a dealing and/or brokerage license has deposited, for internal management purposes outlined in the Enforcement Decree of the Financial Holding Company Act, subject to the methods and procedures for provision of such information set forth therein. Recent amendments to the Financial Holding Company Act, which became effective on November 29, 2014, limit the scope of credit information that may be shared without the customers’ prior consent and require certain procedures for provision of customer information as prescribed by the Financial Services Commission. Beginning on May 29, 2015, notice must be given to customers at least once a year regarding (i) the provider of customer information, (ii) the recipient of customer information, (iii) the purpose of providing the information and (iv) the categories of the information provided.
Principal Regulations Applicable to Banks
The banking system in Korea is governed by the Bank Act and the Bank of Korea Act of 1950, as amended. In addition, Korean banks are subject to the regulations and supervision of the Bank of Korea, the Monetary Policy Board of the Bank of Korea, the Financial Services Commission and its executive body, the Financial Supervisory Service.
The Bank of Korea, established in June 1950 under the Bank of Korea Act, performs the customary functions of a central bank. It seeks to contribute to the sound development of the national economy by price stabilization through establishing and implementing efficient monetary and credit policies with a focus on financial stability. The Bank of Korea acts under instructions of the Monetary Policy Board, the supreme policy-making body of the Bank of Korea.
Under the Bank of Korea Act, the Monetary Policy Board’s primary responsibilities are to formulate monetary and credit policies and to determine the operations, management and administration of the Bank of Korea.
The Financial Services Commission (formerly known as the Financial Supervisory Commission), established in April 1998, regulates commercial banks pursuant to the Bank Act, including establishing guidelines on capital adequacy of commercial banks, and promulgates regulations relating to supervision of banks. Furthermore, the Financial Services Commission regulates market entry into the banking business.
The Financial Supervisory Service, established in January 1999, is subject to the instructions and directives of the Financial Services Commission and carries out supervision and examination of commercial banks. In particular, the Financial Supervisory Service sets requirements both for the prudent control of liquidity and for capital adequacy and establishes reporting requirements pursuant to the authority delegated to it under the Financial Services Commission regulations, pursuant to which banks are required to submit annual reports on financial performance and shareholdings, regular reports on management strategy and non-performing loans, including write-offs, and management of problem companies and plans for the settlement of bad loans.
100
Table of Contents
Under the Bank Act, approval to commence a banking business must be obtained from the Financial Services Commission. Commercial banking business is defined as the lending of funds acquired predominantly from the acceptance of demand deposits for a period not exceeding one year or subject to the limitation established by the Financial Services Commission, for a period between one year and three years. Long-term financing business is defined as the lending, for periods in excess of one year, of funds acquired predominantly from paid-in capital, reserves or other retained earnings, the acceptance of time deposits with maturities of at least one year, or the issuance of debentures or other bonds. A bank wishing to enter into any business other than banking businesses, such as a trust business, must file a report to the Financial Services Commission. For businesses that are subject to license or approval requirements under applicable laws, such as an approval to commence a trust business under the Financial Investment Services and Capital Markets Act, such report must be filed concurrently with a relevant license or approval application to the Financial Services Commission. In addition, approval to merge with any other banking institution, to liquidate, spin off, or close a banking business or to transfer all or a part of a business must be obtained from the Financial Services Commission.
If the Financial Services Commission deems a bank’s financial condition to be unsound or if a bank fails to meet the applicable capital adequacy ratio set forth under Korean law, the Financial Services Commission may order:
| • | admonitions or warnings with respect to the bank or its officers; |
| • | capital increases or reductions; |
| • | assignments of contractual rights and obligations relating to financial transactions; |
| • | a suspension of performance by its officers of their duties and the appointment of receivers; |
| • | disposals of property holdings or closures of subsidiaries or branch offices or downsizing; |
| • | stock cancellations or consolidations; |
| • | suspension of performance of duties of officers and appointment of managers; |
| • | transfer of all or part of a business; |
| • | mergers with other financial institutions; |
| • | acquisition of such bank by a third party; and/or |
| • | suspensions of a part or all of its business operations (not more than six months, in the case of a suspension of all business operations). |
Capital Adequacy
The Bank Act requires nationwide banks, such as us, to maintain a minimum paid-in capital of ₩100 billion and regional banks to maintain a minimum paid-in capital of ₩25 billion. All banks, including foreign bank branches in Korea, are also required to maintain a prescribed solvency position. A bank must also set aside in its legal reserve an amount equal to at least 10% of the net income after tax each time it pays dividends on net profits earned until its legal reserve reaches at least the aggregate amount of its paid-in capital.
Under the Detailed Regulation on the Supervision of the Banking Business, the capital of a bank is divided into two categories, Tier I and Tier II capital. Tier I capital (core capital) consists of (i) common equity Tier I capital, including paid-in capital, capital surplus and retained earnings related to common equity and accumulated other comprehensive gains and losses, and (ii) additional Tier I capital, including paid-in capital and capital surplus related to hybrid Tier I capital instruments that, among other things, qualify as contingent capital and are subordinated to subordinated debt. Tier II capital (supplementary capital) consists of, among other things, capital and capital surplus from the issuance of Tier II capital instruments, allowances for loan losses on loans classified as “normal” or “precautionary,” subordinated debt and other capital securities which meet the standards prescribed by the governor of the Financial Supervisory Service under Article 26(2) of the Regulation on the Supervision of the Banking Business.
101
Table of Contents
All banks must meet minimum ratios of Tier I and Tier II capital (less any capital deductions) to risk-weighted assets, determined in accordance with Financial Services Commission requirements that have been formulated based on BIS standards. These requirements were adopted and became effective in 1996, and were amended effective January 1, 2008 upon the implementation by the Financial Supervisory Service of Basel II. Under such requirements, all domestic banks and foreign bank branches are required to meet a minimum ratio of Tier I and Tier II capital (less any capital deductions) to risk-weighted assets of 8.0%. Commencing in July 2013, the Financial Services Commission promulgated a series of amended regulations implementing Basel III, pursuant to which Korean banks and bank holding companies were required to maintain a minimum ratio of common equity Tier I capital to risk-weighted assets of 3.5% and Tier I capital to risk-weighted assets of 4.5% from December 1, 2013, which minimum ratios were increased to 4.0% and 5.5%, respectively, from January 1, 2014 and increased further to 4.5% and 6.0%, respectively, from January 1, 2015. Such requirements are in addition to the pre-existing requirement for a minimum ratio of Tier I and Tier II capital (less any capital deductions) to risk-weighted assets of 8.0%, which remains unchanged. The amended regulations also require an additional capital conservation buffer of 2.5% in 2022 and 2023, as well as a potential counter-cyclical capital buffer of up to 2.5%, which is determined on a quarterly basis by the Financial Services Commission. Furthermore, we and Woori Bank were each designated as a domestic systemically important bank holding company and a domestic systematically important bank, respectively, for 2022 and 2023 by the Financial Services Commission, which subjects us and Woori Bank to the additional capital requirement of 1.0% in 2022 and 2023.
Under the Detailed Regulation on the Supervision of the Banking Business, the following risk-weight ratios must be applied by Korean banks in respect of home mortgage loans:
| (1) | for those banks which adopted a standardized approach for calculating credit risk capital requirements, a risk-weight ratio between 20% and 150% depending on the borrower’s source of funding and position in the loan-to-value bracket and whether the loan is considered a high-risk home mortgage loan; and |
| (2) | for those banks which adopted an internal ratings-based approach for calculating credit risk capital requirements, a risk-weight ratio calculated with reference to the probability of default, loss given default and exposure at default, each as defined under the Detailed Regulation on the Supervision of the Banking Business. |
Liquidity
All banks are required to ensure adequate liquidity by matching the maturities of their assets and liabilities in accordance with the Regulation on the Supervision of the Banking Business. Banks may not invest an amount exceeding 100% of their Tier I and Tier II capital (less any capital deductions) in equity securities and certain other securities with a redemption period of over three years. This stipulation does not apply to Korean government bonds, Monetary Stabilization Bonds issued by the Bank of Korea or debentures and stocks referred to in items 1 and 2, respectively, of paragraph (6) of Article 11 of the Act on the Structural Improvement of the Financial Industry. The Financial Services Commission uses the liquidity coverage ratio as the principal liquidity risk management measure, and currently requires each Korean bank to:
| • | maintain a liquidity coverage ratio of not less than 100% (temporarily reduced to 92.5% until June 2023 in response to the COVID-19 pandemic); |
| • | maintain a foreign currency liquidity coverage ratio of not less than 80% (temporarily reduced to 70% until June 2022 for purposes of increasing foreign currency liquidity in the Korean financial markets); and |
| • | submit monthly reports with respect to the maintenance of these ratios. |
In April 2020, in order to encourage financial institutions to provide financial support to companies adversely affected by COVID-19, the Financial Services Commission announced that it would temporarily lower the required liquidity coverage ratio to 85% and the required foreign currency liquidity coverage ratio to 70%. Following a series of extensions by the Financial Services Commission, the temporary deregulation measures
102
Table of Contents
for the foreign currency liquidity coverage ratio expired at the end of June 2022, and the temporary deregulation measures for the liquidity coverage ratio will incrementally return to normal, but the timeline for such normalization to 100% has not been finalized yet.
The Monetary Policy Board of the Bank of Korea is empowered to fix and alter minimum reserve requirements that banks must maintain against their deposit liabilities. The current minimum reserve ratios are:
| • | 7% of average balances for Won currency demand deposits outstanding; |
| • | 0% of average balances for Won currency employee asset establishment savings deposits, employee long-term savings deposits, employee house purchase savings deposits, long-term house purchase savings deposits, household long-term savings deposits and employee preferential savings deposits outstanding (with respect to employee-related deposits and household long-term savings deposits, only if such deposits were made prior to February 28, 2013); and |
| • | 2% of average balances for Won currency time deposits, installment savings deposits, mutual installments, housing installments and certificates of deposit outstanding. |
For foreign currency deposit liabilities, a 2% minimum reserve ratio is applied to time deposits with a maturity of one month or longer, certificates of deposit with a maturity of 30 days or longer and savings deposits with a maturity of six months or longer and a 7% minimum reserve ratio is applied to other deposits. A 1% minimum reserve ratio applies to deposits in offshore accounts, immigrant accounts and resident accounts opened by foreign exchange banks as well as foreign currency certificates of deposit held by account holders of such offshore accounts, immigrant accounts and resident accounts opened by foreign exchange banks.
Furthermore, under the Regulation on the Supervision of the Banking Business, Woori Bank is required to maintain a minimum “mid- to long-term foreign exchange funding ratio” of 100%. “Mid-to long term foreign exchange funding ratio” refers to the ratio of (1) the total outstanding amount of foreign exchange borrowing with a maturity of more than one year to (2) the total outstanding amount of foreign exchange lending with a maturity of one year or more.
Net Stable Funding Ratio and Leverage Ratio Requirements
The Financial Services Commission has implemented the Regulation on Supervision of the Banking Business, which imposes certain liquidity- and leverage-related ratio requirements on banks in Korea, in accordance with Basel III. Pursuant to such Regulation, each Korean bank is required to:
| • | maintain a net stable funding ratio (defined as the ratio of the available amount of stable funding to the required amount of stable funding) of not less than 100%, where (i) the available amount of stable funding generally refers to the portion of liabilities and capital expected to be reliable over a one-year time horizon and (ii) the required amount of stable funding generally refers to the amount of stable funding that is required to be maintained based on the liquidity characteristics, residual maturities and off-balance sheet exposures of the bank’s assets, each as calculated in accordance with the Detailed Regulation on Supervision of the Banking Business; |
| • | maintain a leverage ratio (defined as the ratio of core capital to total exposures) of not less than 3%, where (i) core capital includes paid-in capital, capital surplus, retained earnings and hybrid Tier I capital instruments and (ii) total exposures include on-balance sheet exposures, derivative exposures, securities financing transaction exposures and off-balance sheet exposures, each as calculated in accordance with the Detailed Regulation on Supervision of the Banking Business; and |
| • | submit monthly reports with respect to the maintenance of these ratios. |
Financial Exposure to Any Individual Customer or Major Shareholder
Under the Bank Act, subject to certain exceptions, the sum of large exposures by a bank—in other words, the total sum of its credits to single individuals, juridical persons or business groups that exceed 10% of the sum
103
Table of Contents
of Tier I and Tier II capital (less any capital deductions)—generally must not exceed five times the sum of Tier I and Tier II capital (less any capital deductions). In addition, subject to certain exceptions, banks generally may not extend credit (including loans, guarantees, purchases of securities (limited to those extended for financial support) and any other transactions that directly or indirectly create credit risk) in excess of 20% of the sum of Tier I and Tier II capital (less any capital deductions) to a single individual or juridical person, or grant credit in excess of 25% of the sum of Tier I and Tier II capital (less any capital deductions) to a single group of companies as defined in the Monopoly Regulations and Fair Trade Act.
The Bank Act also provides for certain restrictions on extending credits to a major shareholder. A “major shareholder” is defined as:
| • | a shareholder holding (together with persons who have a special relationship with that shareholder) in excess of 10%; (or 15% in the case of regional banks) in the aggregate of the bank’s total issued and outstanding voting shares; or |
| • | a shareholder holding (together with persons who have a special relationship with such shareholder) in excess of 4% in the aggregate of the bank’s (excluding regional banks) total issued and outstanding voting shares of a bank (excluding shares subject to the shareholding restrictions on “non-financial business group companies” as described below), where such shareholder is the largest shareholder or has actual control over the major business affairs of the bank through, for example, appointment and dismissal of the officers pursuant to the Enforcement Decree of the Bank Act. Non-financial business group companies primarily consist of: (i) any single shareholding group whose non-financial company assets comprise no less than 25% of its aggregate net assets; (ii) any single shareholding group whose non-financial company assets comprise no less than ₩2 trillion in aggregate; or (iii) any investment company under the Financial Investment Services and Capital Markets Act of which any single shareholding group identified in (i) or (ii) above, owns more than 4% of the total issued and outstanding shares. |
Under these restrictions, banks may not extend credits to a major shareholder (together with persons who have a special relationship with that shareholder) in an amount greater than the lesser of (x) 25% of the sum of the bank’s Tier I and Tier II capital (less any capital deductions) and (y) the relevant major shareholder’s shareholding ratio multiplied by the sum of the bank’s Tier I and Tier II capital (less any capital deductions). In addition, the total sum of credits granted to all major shareholders must not exceed 25% of the bank’s Tier I and Tier II capital (less any capital deductions).
Interest Rates
Korean banks generally depend on deposits as their primary funding source. Under the Act on Registration of Credit Business and Protection of Finance Users and the regulations thereunder, interest rates on loans made by registered banks in Korea to individuals or small corporations, as defined under the Framework Act on Small and Medium Enterprises, currently may not exceed 20% per annum. Historically, interest rates on deposits and lending were regulated by the Monetary Policy Board. There are no controls on deposit interest rates in Korea, except for the prohibition on interest payments on current account deposits.
Lending to Small- and Medium-Sized Enterprises
In order to obtain funding from the Bank of Korea at concessionary rates for their small- and medium-sized enterprise loans, banks are required to allocate a certain minimum percentage of any quarterly increase in their Won currency lending to small- and medium-sized enterprises. Currently, this minimum percentage is 45% in the case of nationwide banks and 60% in the case of regional banks. If a bank does not comply with this requirement, the Bank of Korea may:
| • | require the bank to prepay all or a portion of funds provided to that bank in support of loans to small- and medium-sized enterprises; or |
| • | lower the bank’s credit limit. |
104
Table of Contents
Disclosure of Management Performance
For the purpose of protecting depositors and investors in commercial banks, the Financial Services Commission requires commercial banks to publicly disclose certain material matters, including:
| • | financial condition and profit and loss of the bank and its subsidiaries; |
| • | fund raising by the bank and the appropriation of such funds; |
| • | any sanctions levied on the bank under the Bank Act or any corrective measures or sanctions under the Act on the Structural Improvement of the Financial Industry; and |
| • | except as may otherwise have been disclosed by a bank or its financial holding company listed on the KRX KOSPI Market in accordance with the Financial Investment Services and Capital Markets Act, occurrence of any of the following events or any other event as prescribed by the applicable regulations that have damaged or are likely to damage the soundness of the bank’s management: |
| (i) | loans bearing no profit made to a single business group in an amount exceeding 10% of the sum of the bank’s Tier I and Tier II capital (less any capital deductions) as of the end of the previous month (where the loan exposure to that borrower is calculated pursuant to the criteria under the Detailed Regulation on the Supervision of the Banking Business), unless the loan exposure to that group is not more than ₩4 billion; and |
| (ii) | any loss due to court judgments or similar decisions in civil proceedings in an amount exceeding 1% of the sum of the bank’s Tier I and Tier II capital (less any capital deductions) as of the end of the previous month, unless the loss is not more than ₩1 billion. |
Restrictions on Lending
Pursuant to the Bank Act and its sub-regulations, commercial banks may not provide:
| • | loans directly or indirectly secured by a pledge of a bank’s own shares; |
| • | loans directly or indirectly to enable a natural or juridical person to buy the bank’s own shares; |
| • | loans to any of the bank’s officers or employees, other than de minimis loans of up to (i) ₩20 million in the case of a general loan, (ii) ₩50 million in the case of a general loan plus a housing loan or (iii) ₩60 million in the aggregate for general loans, housing loans and loans to pay damages arising from wrongful acts of employees in financial transactions; |
| • | credit (including loans) secured by a pledge of shares of a subsidiary corporation of the bank or to enable a natural or juridical person to buy shares of a subsidiary corporation of the bank; or |
| • | loans to any officers or employees of a subsidiary corporation of the bank, other than general loans of up to ₩20 million or general and housing loans of up to ₩50 million in the aggregate. |
Regulations Relating to Retail Household Loans
The Financial Services Commission has implemented a number of changes in recent years to the regulations relating to retail household lending by banks. Under the currently applicable regulations:
| • | as to any new loans secured by housing (including apartments) located nationwide, the loan-to-value ratio (the aggregate principal amount of loans secured by such collateral over the appraised value of the collateral) should not exceed 70%; |
| • | as to any new loans secured by housing (including apartments) located in “excessive investment,” “high speculation” or “adjustment target” areas, in each case as designated by the Minister of Land, Infrastructure and Transport, the loan-to-value ratio should not exceed 50%, except that such maximum loan-to-value ratio shall be 70% for low-income households that (i) have an annual income of less than ₩90 million, (ii) do not currently own any housing and (iii) are using the loan to purchase low-price housing valued at ₩900 million or less; |
105
Table of Contents
| • | as to any new loans secured by housing to be extended to a household that already owns one or more houses, the maximum loan-to-value ratio is 10% lower than the applicable loan-to-value ratio described above; |
| • | any new loans secured by housing (including apartments) located in excessive investment, high speculation or adjustment target areas, in each case as designated by the government, are not permitted for households that already own one or more houses unless otherwise specified by the applicable regulations. However, as of March 2, 2023 and onwards, in the case of households that already own one or more houses, the loan-to value for the purpose of purchasing homes in target is allowed up to 30%, and up to 60% in non-targeted areas; |
| • | as to any new loans secured by housing (including apartments) located in excessive investment, high speculation or adjustment target areas, in each case as designated by the government, the borrower’s debt-to-income ratio (calculated as (1) the aggregate annual total payment amount of the principal of and interest on loans secured by such housing and other housing over (2) the borrower’s annual income) should not exceed 40%, except that such maximum debt-to-income ratio is 60% for low-income households that (i) have an annual income of less than ₩90 million, (ii) do not currently own any housing and (iii) are using the loan to purchase low-price housing valued at ₩600 million or less and (iv) are first-time homebuyers; |
| • | as to any new loans secured by apartments located in an unregulated Seoul metropolitan area to be extended to a household that already owns one or more houses, the maximum debt-to-income ratio is 10% lower than the applicable debt-to-income ratio described above; and |
| • | as to any new loans extended to a household that has already obtained a loan secured by housing (including apartments) located in excessive investment, high speculation or adjustment target areas, in each case as designated by the government, where the price exceeds ₩600 million (based on the data of a certified rating institution, for which the detailed standards shall be as determined by the director of the Financial Supervisory Service), the borrower’s debt-service-ratio (calculated as (1) the aggregate annual total payment amount of the principal of and interest on financial liabilities, including the loans secured by such high-priced housing, divided by (2) the borrower’s annual income) should not exceed 40% unless otherwise specified by the applicable regulations. |
Restrictions on Investments in Property
A bank may not invest in securities set forth below in excess of 100% of the sum of the bank’s Tier I and Tier II capital (less any capital deductions):
| • | debt securities (within the meaning of paragraph (3) of Article 4 of the Financial Investment Services and Capital Markets Act) the maturity of which exceeds three years, but excluding government bonds, monetary stabilization bonds issued by the Bank of Korea and bonds within the meaning of item 2, paragraph (6) of Article 11 of the Act on the Structural Improvement of the Financial Industry; |
| • | equity securities, but excluding securities within the meaning of item 1, paragraph (6) of Article 11 of the Act on the Structural Improvement of the Financial Industry; |
| • | derivatives linked securities (within the meaning of paragraph (7) of Article 4 of the Financial Investment Services and Capital Markets Act) the maturity of which exceeds three years; and |
| • | beneficiary certificates, investment contracts and depositary receipts (within the meaning of paragraph (2) of Article 4 of the Financial Investment Services and Capital Markets Act) the maturity of which exceeds three years. |
A bank may possess real estate property only to the extent necessary for the conduct of its business. The aggregate value of such property may not exceed 60% of the sum of the bank’s Tier I and Tier II capital (less any capital deductions). Any property that a bank acquires by exercising its rights as a secured party, or which a bank is prohibited from acquiring under the Bank Act, must be disposed of within three years, unless specified otherwise by the regulations thereunder.
106
Table of Contents
Restrictions on Shareholdings in Other Companies
Under the Bank Act, a bank may not own more than 15% of shares outstanding with voting rights of another corporation, except where, among other reasons:
| • | that corporation engages in a category of financial businesses set forth by the Financial Services Commission; or |
| • | the acquisition of shares by the bank is necessary for the corporate restructuring of such corporation and is approved by the Financial Services Commission. |
In the above exceptional cases, the total investment in corporations in which the bank owns more than 15% of the outstanding shares with voting rights may not exceed (i) 20% of the sum of Tier I and Tier II capital (less any capital deductions) or (ii) 30% of the sum of Tier I and Tier II capital (less any capital deductions) where the acquisition satisfies the requirements determined by the Financial Services Commission.
The Bank Act provides that a bank using its bank accounts and its trust accounts is not permitted to acquire the shares issued by the major shareholder of such bank in excess of an amount equal to 1% of the sum of Tier I and Tier II capital (less any capital deductions).
Restrictions on Bank Ownership
Under the Bank Act, a single shareholder and persons who have a special relationship with that shareholder generally may acquire beneficial ownership of no more than 10% of a nationwide bank’s total issued and outstanding shares with voting rights and no more than 15% of a regional bank’s total issued and outstanding shares with voting rights. The Korean government, the KDIC and bank holding companies qualifying under the Financial Holding Company Act are not subject to this limit. Pursuant to the Bank Act, non-financial business group companies may not acquire beneficial ownership of shares of a nationwide bank in excess of 4% (or 15% in the case of a regional bank) of that bank’s outstanding voting shares, unless they satisfy certain requirements set forth by the Enforcement Decree of the Bank Act, obtain the approval of the Financial Services Commission and agree not to exercise voting rights in respect of shares in excess of the 4% limit (or the 15% limit in the case of a regional bank), in which case they may acquire beneficial ownership of up to 10% of a nationwide bank’s outstanding voting shares. The Bank Act grants an exception for non-financial business group companies which, at the time of the enactment of the amended provisions, held more than 4% of the shares of a bank.
In addition, if a foreign investor, as defined in the Foreign Investment Promotion Act, owns in excess of 4% of a nationwide bank’s outstanding voting shares, non-financial business group companies may acquire beneficial ownership of up to 10% (or 15% in the case of a regional bank) of that bank’s outstanding voting shares, and in excess of 10% (or 15% in the case of a regional bank), 25% or 33% of that bank’s outstanding voting shares with the approval of the Financial Services Commission, in each instance, up to the number of shares owned by the foreign investor. Any other person (whether a Korean national or a foreign investor), with the exception of non-financial business group companies described above, may acquire no more than 10% of a nationwide bank’s total voting shares issued and outstanding, unless they obtain approval from the Financial Services Commission in each instance where the total holding will exceed 10% (or 15% in the case of regional banks), 25% or 33% of the bank’s total voting shares issued and outstanding provided that, in addition to the foregoing threshold shareholding ratios, the Financial Services Commission may, at its discretion, designate a separate and additional threshold shareholding ratio.
Deposit Insurance System
The Depositor Protection Act provides insurance for certain deposits of banks in Korea through a deposit insurance system. Under the Depositor Protection Act, all banks governed by the Bank Act are required to pay an insurance premium to the KDIC on a quarterly basis, and the rate is determined under the Enforcement Decree to the Depositor Protection Act. If the KDIC makes a payment on an insured amount, it will acquire the depositors’ claims with respect to that payment amount. The KDIC insures a maximum of ₩50 million per individual for deposits and interest in a single financial institution, regardless of when the deposits were made or the size of the deposits.
107
Table of Contents
Restrictions on Foreign Exchange Position
Under the Korean Foreign Exchange Transaction Law, each of a bank’s net overpurchased and oversold positions may not exceed 50% of its shareholder’s equity as of the end of the prior month.
Laws and Regulations Governing Other Business Activities
A bank must register with the Ministry of Economy and Finance to enter the foreign exchange business, which is governed by the Foreign Exchange Transaction Act of Korea. A bank must obtain the permission of the Financial Services Commission to enter the securities business, which is governed by regulations under the Financial Investment Services and Capital Markets Act. Under these laws, a bank may engage in the foreign exchange business, securities repurchase business, governmental/public bond underwriting business and governmental bond dealing business.
Regulations on Trust Business
A bank must obtain approval from the Financial Services Commission to engage in trust businesses. The Trust Act and the Financial Investment Services and Capital Markets Act govern the trust activities of banks, and they are subject to various legal and accounting procedures and requirements, including the following:
| • | under the Trust Act, assets accepted in trust by a bank in Korea must be segregated from other assets in the accounts of that bank; and |
| • | depositors and other general creditors cannot obtain or assert claims against the assets comprising the trust accounts in the event the bank is liquidated or wound-up. |
The bank must make a special reserve of 25% or more of fees from each unspecified money trust account for which a bank guarantees the principal amount and a fixed rate of interest until the total reserve for that account equals 5% of the trust amount.
Under the Financial Investment Services and Capital Markets Act, which became effective in February 2009, a bank with a trust business license (such as Woori Bank) is permitted to offer both specified money trust account products and unspecified money trust account products. However, pursuant to guidelines from regulatory authorities that discourage the sale of unspecified money trust account products, sales of such products have generally been suspended.
Regulations on Credit Card Business
General
In order to enter the credit card business, a company must obtain a license from the Financial Services Commission. Credit card businesses are governed by the Specialized Credit Financial Business Act, which sets forth specific requirements with respect to the credit card business as well as generally prohibiting unsound business practices relating to the credit card business which may infringe on the rights of credit card holders or negatively affect the soundness of the credit card industry. Credit card companies, including our wholly-owned subsidiary, Woori Card, are regulated by the Financial Services Commission and the Financial Supervisory Service.
Disclosure and Reports
Under the Specialized Credit Financial Business Act and the regulations thereunder, a credit card company is required to disclose on a periodic and on-going basis certain material matters and events. In addition, a credit card company must submit periodic reports with respect to its results of operations to the Governor of the Financial Supervisory Service, in accordance with the guidelines of the Financial Supervisory Service.
Restrictions on Funding
Under the Specialized Credit Financial Business Act and the regulations thereunder, a credit card company must ensure that its total assets do not exceed an amount equal to eight times its equity capital and that the ratio
108
Table of Contents
of its adjusted equity capital to its adjusted total assets is not less than 8.0%. However, if a credit card company is unable to comply with such limit upon the occurrence of unavoidable events, such as drastic changes in the domestic and global financial markets, such limit may be adjusted through a resolution of the Financial Services Commission.
Risk of Loss Due to Lost, Stolen, Forged or Altered Credit Cards
Under the Specialized Credit Financial Business Act, a credit card company is liable for any loss arising from the unauthorized use of credit cards or debit cards after it has received notice from the holder of the loss or theft of the card. A credit card company is also responsible for any losses resulting from the use of forged or altered credit cards, debit cards and pre-paid cards. A credit card company may, however, transfer all or part of this latter risk of loss to holders of credit card in the event of willful misconduct or gross negligence by holders of credit card if the terms and conditions of the agreement entered between the credit card company and members of such cards specifically provide for that transfer.
For these purposes, disclosure of a customer’s password that is made intentionally or through gross negligence, or the transfer of or giving as collateral of the credit card or debit card, is considered willful misconduct or gross negligence. However, a disclosure of a cardholder’s password that is made under irresistible force or threat to cardholder or his/her relatives’ life or health will not be deemed as willful misconduct or negligence of the cardholder.
Each credit card company must institute appropriate measures to fulfill these obligations, such as establishing provisions, purchasing insurance or joining a cooperative association.
Pursuant to the Specialized Credit Financial Business Act and its Enforcement Decree, a credit card company will be liable for any losses arising from loss or theft of a credit card (which was not from the holder’s willful misconduct or negligence) during the period beginning 60 days before the notice by the holder to the credit card company.
Pursuant to the Specialized Credit Financial Business Act, the Financial Services Commission may either restrict the limit or take other necessary measures against the credit card company with respect to such matters as the maximum limits on the amount per credit card, details of credit card terms and conditions, management of credit card merchants and collection of claims, including the following:
| • | maximum limits for cash advances on credit cards; |
| • | use restrictions on debit cards with respect to per day or per transaction usage; |
| • | aggregate issuance limits and maximum limits on the amount per card on pre-paid cards; and |
| • | other matters prescribed by the Enforcement Decree to the Specialized Credit Financial Business Act. |
Lending Ratio in Ancillary Business
Pursuant to the Enforcement Decree to the Specialized Credit Financial Business Act, a credit card company must maintain an aggregate quarterly average outstanding lending balance to credit cardholders (including cash advances and credit card loans, but excluding restructured loans) no greater than the sum of (i) its aggregate quarterly average outstanding credit card balance arising from the purchase of goods and services and (ii) the aggregate quarterly debit card transaction volume.
Issuance of New Cards and Solicitation of New Cardholders
The Specialized Credit Financial Business Act and its Enforcement Decree establish the conditions under which a credit card company may issue new cards and solicit new members. New credit cards may be issued only to the following persons:
| • | persons who are at least 19 years old when they apply for a credit card; |
109
Table of Contents
| • | persons whose capability to pay bills as they come due has been verified using standards established by the credit card company; and |
| • | in the case of minors who are 18 years old, persons who submit documents evidencing employment as of the date of the credit card application, such as an employment certificate, or persons for whom the issuance of a credit card is necessitated by governmental policies, such as financial aid. |
In addition, a credit card company may not solicit credit card members by:
| • | providing economic benefits or promising to provide economic benefits in excess of 10% of the annual credit card fee (in the case of credit cards with annual fees that are less than the average of the annual fees charged by major credit cards in Korea, the annual fee will be deemed to be equal to such average annual fee) in connection with issuing a credit card; provided, however, that providing economic benefits to or promising to provide economic benefits not exceeding the amount of the annual credit card fee to an applicant that becomes a credit card member through an online platform is permissible; |
| • | soliciting applicants on roads, public places or along corridors used by the general public; |
| • | soliciting applicants through visits, except those visits made upon prior consent and visits to a business area; |
| • | soliciting applicants through the Internet, without verifying whether the applicant is who he or she purports to be using a digital signature under the Digital Signature Act which is capable of verifying his or her real name; and |
| • | soliciting applicants through pyramid sales methods. |
Compliance Rules on Collection of Receivable Claims
Pursuant to Supervisory Regulation on the Specialized Credit Financial Business, a credit card company may not, when collecting receivable claims:
| • | exert violence or threaten violence; |
| • | inform a related party (a guarantor of the debtor, blood relative or fiancé(e) of the debtor, a person living in the same household as the debtor or a person working in the same workplace as the debtor) of the debtor’s obligations without just cause; |
| • | provide false information relating to the debtor’s obligation to the debtor or his or her related parties; |
| • | threaten to sue or sue the debtor for fraud despite lack of affirmative evidence to establish that the debtor has submitted forged or false documentation with respect to his or her ability to make payment; |
| • | visit or telephone the debtor during late evening hours (between the hours of 9:00 p.m. and 8:00 a.m.); and |
| • | utilize other uncustomary methods to collect the receivables that interfere with the privacy or the peace in the workplace of the debtor or his or her related parties. |
Regulations on Class Actions Regarding Securities
The Law on Class Actions Regarding Securities was enacted as of January 20, 2004 and last amended on May 28, 2013. The Law on Class Actions Regarding Securities governs class actions suits instituted by one or more representative plaintiff(s) on behalf of 50 or more persons who claim to have been damaged in a capital markets transaction involving securities issued by a listed company in Korea.
Applicable causes of action with respect to such suits include:
| • | claims for damages caused by misleading information contained in a securities statement; |
| • | claims for damages caused by the filing of a misleading business report, semi-annual report, or quarterly report; |
110
Table of Contents
| • | claims for damages caused by insider trading or market manipulation; and |
| • | claims instituted against auditors for damages caused by accounting irregularities. |
Any such class action may be instituted upon approval from the presiding court and the outcome of such class action will have a binding effect on all potential plaintiffs who have not joined the action, with the exception of those who have filed an opt out notice with such court.
Regulations on Financial Investment Business
General
The Financial Investment Services and Capital Markets Act, which became effective in February 2009, regulates and governs the financial investment business in Korea. The entities that regulate and supervise financial investment companies are the Financial Services Commission, the Financial Supervisory Service and the Securities and Futures Commission.
Under the Financial Investment Services and Capital Markets Act, a company must obtain a license from the Financial Services Commission to commence a financial investment business such as a brokerage business, a dealing business or an underwriting business, or register with the Financial Services Commission to commence a financial investment business such as an investment advisory business or a discretionary investment management business. A bank is permitted to engage in certain types of financial investment business as specified under the Enforcement Decree of the Bank Act. Prior to commencing a financial investment business, a bank must file a report with the Financial Services Commission and apply for a license pursuant to the Financial Investment Services and Capital Markets Act.
Consolidation of Capital Markets-Related Laws
Prior to the effectiveness of the Financial Investment Services and Capital Markets Act, there were separate laws regulating various types of financial institutions depending on the type of financial institution (e.g., securities companies, futures companies, trust business companies and asset management companies) and subjecting financial institutions to different licensing and ongoing regulatory requirements (e.g., the Korean Securities Exchange Act, the Futures Business Act and the Indirect Investment Asset Management Business Act). By applying one uniform set of rules to the same financial business having the same economic function, the Financial Investment Services and Capital Markets Act attempts to improve and address issues caused by the previous regulatory system under which the same economic function relating to capital markets-related businesses are governed by multiple regulations. To this end, the Financial Investment Services and Capital Markets Act categorizes capital markets-related businesses into six different functions, as follows:
| • | dealing, trading and underwriting of “financial investment products” (as defined below); |
| • | brokerage of financial investment products; |
| • | establishment of collective investment schemes and the management thereof; |
| • | investment advice; |
| • | discretionary investment management; and |
| • | trusts (together with the five businesses set forth above, the “Financial Investment Businesses”). |
Accordingly, all financial businesses relating to financial investment products have been reclassified as one or more of the Financial Investment Businesses described above, and financial institutions are subject to the regulations applicable to their relevant Financial Investment Businesses, regardless of the type of the financial institution. For example, under the Financial Investment Services and Capital Markets Act, derivative businesses conducted by former securities companies and future companies will be subject to the same regulations.
Banking and insurance businesses are not subject to the Financial Investment Services and Capital Markets Act and will continue to be regulated under separate laws. However, they may become subject to the Financial Investment Services and Capital Markets Act if their activities involve any financial investment businesses requiring a license pursuant to the Financial Investment Services and Capital Markets Act.
111
Table of Contents
Comprehensive Definition of Financial Investment Products
In an effort to encompass the various types of securities and derivative products available in the capital markets, the Financial Investment Services and Capital Markets Act sets forth a comprehensive term “financial investment products,” defined to mean all financial products with a risk of loss in the invested amount (in contrast to “deposits,” which are financial products for which the invested amount is protected or preserved). Financial investment products are classified into two major categories: (i) “securities” (financial investment products in which the risk of loss is limited to the invested amount) and (ii) “derivatives” (financial investment products in which the risk of loss may exceed the invested amount). As a result of the general and broad definition of financial investment products, a variety of financial products may be defined as a financial investment product, which would enable Financial Investment Companies (defined below) to handle a broader range of financial products. Under the Financial Investment Services and Capital Markets Act, entities formerly licensed as securities companies, asset management companies, futures companies and other entities engaging in any Financial Investment Business are classified as “Financial Investment Companies.”
New License System and the Conversion of Existing Licenses
Under the Financial Investment Services and Capital Markets Act, Financial Investment Companies are able to choose the type of Financial Investment Business in which to engage (through a “check the box” method set forth in the relevant license application), by specifying the desired (i) Financial Investment Business, (ii) financial investment product and (iii) target customers to which financial investment products may be sold or distributed (that is, general investors or professional investors). Licenses will be issued under the specific business sub-categories described in the foregoing sentence. For example, it would be possible for a Financial Investment Company to obtain a license to engage in the Financial Investment Business of (i) dealing (ii) over the counter derivatives products (iii) only with sophisticated investors.
Financial institutions that engage in business activities constituting a Financial Investment Business are required to take certain steps, such as renewal of their license or registration, in order to continue engaging in such business activities. Financial institutions that are not licensed Financial Investment Companies are not permitted to engage in any Financial Investment Business, subject to the following exceptions: (i) banks and insurance companies are permitted to engage in certain categories of Financial Investment Businesses for a period not exceeding six months commencing on the effective date of the Financial Investment Services and Capital Markets Act; and (ii) other financial institutions that engaged in any Financial Investment Business prior to the effective date of the Financial Investment Services and Capital Markets Act (whether in the form of a concurrent business or an incidental business) are permitted to continue such Financial Investment Business for a period not exceeding six months commencing on the effective date of the Financial Investment Services and Capital Markets Act.
Expanded Business Scope of Financial Investment Companies
Under the previous regulatory regime in Korea, it was difficult for a financial institution to explore a new line of business or expand upon its existing line of business. For example, previously a financial institution licensed as a securities company generally was not permitted to engage in the asset management business. In contrast, under the Financial Investment Services and Capital Markets Act, pursuant to the integration of its current businesses involving financial investment products into a single Financial Investment Business, a licensed Financial Investment Company is permitted to engage in all types of Financial Investment Businesses, subject to satisfying relevant regulations (for example, maintaining an adequate “Chinese Wall,” to the extent required). As to incidental businesses (that is, a financial related business which is not a Financial Investment Business), the Financial Investment Services and Capital Markets Act generally allows a Financial Investment Company to freely engage in such incidental businesses by shifting away from the previous positive-list system towards a more comprehensive system. In addition, a Financial Investment Company is permitted to (i) outsource marketing activities by contracting “introducing brokers” that are individuals but not employees of the Financial Investment Company, (ii) engage in foreign exchange businesses related to their Financial Investment Business and (iii) participate in the settlement network, pursuant to an agreement among the settlement network participants.
112
Table of Contents
Improvement in Investor Protection Mechanism
While the Financial Investment Services and Capital Markets Act widens the scope of financial businesses in which financial institutions are permitted to engage, a more rigorous investor-protection mechanism is also imposed upon Financial Investment Companies dealing in financial investment products. The Financial Investment Services and Capital Markets Act distinguishes general investors from sophisticated investors and provides new or enhanced protections to general investors. For instance, the Financial Investment Services and Capital Markets Act expressly provides for a strict know-your-customer rule for general investors and imposes an obligation that Financial Investment Companies should market financial investment products suitable to each general investor, using written explanatory materials. Under the Financial Investment Services and Capital Markets Act, a Financial Investment Company could be liable if a general investor proves (i) damage or losses relating to such general investor’s investment in financial investment products solicited by such Financial Investment Company and (ii) the absence of the requisite written explanatory materials, without having to prove fault or causation. With respect to conflicts of interest between Financial Investment Companies and investors, the Financial Investment Services and Capital Markets Act expressly requires (i) disclosure of any conflict of interest to investors and (ii) mitigation of conflicts of interest to a comfortable level or abstention from the relevant transaction.
Other Changes to Securities / Fund Regulations
The Financial Investment Services and Capital Markets Act changed various securities regulations including those relating to public disclosure, insider trading and proxy contests, which were previously governed by the Korean Securities Exchange Act. For example, the 5% and 10% reporting obligations under the Korean Securities Exchange Act have become more stringent. The Indirect Investment and Asset Management Business Act strictly limited the kind of vehicles that could be utilized under a collective investment scheme, restricting the range of potential vehicles to trusts and corporations, and the type of funds that can be used for investments. However, under the Financial Investment Services and Capital Markets Act, these restrictions have been significantly liberalized, permitting all vehicles that may be created under Korean law, such as limited liability companies or partnerships, to be used for the purpose of collective investments and allowing investment funds to be more flexible as to their investments.
Act on the Corporate Governance of Financial Companies
The Act on the Corporate Governance of Financial Companies, which became effective on August 1, 2016, was enacted to address the need for strengthened regulations on corporate governance of financial institutions and to serve as a uniform set of regulations on corporate governance matters applicable to financial institutions across a variety of industry sectors. It contains several key measures, including (i) eligibility requirements for officers of financial institutions and standards for determining whether officers of financial institutions may hold concurrent positions in other companies, (ii) standards for composition and operation of the board of directors of financial institutions, (iii) standards for establishment, composition and operation of various committees of the board of directors of financial institutions, (iv) regulations on internal control and risk management, (v) requirements and procedures for the approval of a change of major shareholders and (vi) special regulations to protect the rights of minority shareholders of financial institutions.
The Financial Consumer Protection Act
The Financial Consumer Protection Act became effective in March 2021 (certain provisions relating to internal control under such Act became effective in September 2021). The Financial Consumer Protection Act aims to protect financial consumers and establish a sound market order in the financial product sales and advisory businesses. The Financial Consumer Protection Act consolidates existing regulations relating to the sale of financial products and consumer protection, such as the Financial Investment Services and Capital Markets Act, the Banking Act and the Insurance Business Act, and applies to the financial industry on a cross-sectoral basis.
113
Table of Contents
Application of the Financial Consumer Protection Act
All financial products that are classified as (i) deposits, (ii) loans, (iii) investment products or (iv) insurance products are subject to the Financial Consumer Protection Act. These four types of products encompass most of the products covered by the Bank Act, the Financial Investment Services and Capital Markets Act and the Insurance Business Act.
Six Principles Regulating Selling Activities
The Financial Consumer Protection Act consolidates existing regulations relating to financial business operations into standards that cover the following six principles: (i) suitability, (ii) appropriateness, (iii) duty to explain, (iv) prohibition of unfair sales practices, (v) prohibition of improper solicitation and (vi) advertisements. Among these six principles, suitability, appropriateness and duty to explain apply only to “general financial consumers,” although certain “professional financial consumers” may elect to be treated as “general financial consumers,” in which case all six principles would apply to them.
Internal Control Requirements for Consumer Protection
The Financial Consumer Protection Act requires sellers of financial products to have adequate internal control standards to protect consumers. The Enforcement Decree to the Financial Consumer Protection Act sets forth details of certain of such internal control standards as follows:
| • | Establishment of the authority and responsibilities of the decision maker, such as the representative director or a director, in the implementation of internal control measures; |
| • | Development of an organizational structure and designation of personnel responsible for consumer protection matters, including the establishment of a financial consumer protection committee; |
| • | Implementation of (i) inter-departmental consultation procedures for the development and sale of financial products, (ii) processes for internal deliberations and the incorporation of opinions from independent third-party advisers, (iii) standards for vetting advertisements, (iv) mandatory training requirements for officers and employees and qualification requirements, (v) standards for the prevention of conflicts of interest, (vi) proper management of confidential information, and (vii) disclosure obligations when potential harm to consumers arises; and |
| • | Establishment of standards for performance-based compensation of the officers and employees in charge of sales of financial products. |
Right to Withdraw Subscriptions and Right to Terminate Contracts
Under the Financial Consumer Protection Act, consumers will have the right to withdraw subscriptions, allowing them to receive a refund during a statutory cooling-off period following the execution of the relevant subscription agreement. This right generally applies to all types of financial products with the exception of deposits; although in the case of investment products, the right to withdraw applies only to highly complex funds and trusts. Consumers also have the right to terminate a contract if the sellers violate the Financial Consumer Protection Act in relation to the sales process. The right to terminate contracts applies to long-term contracts, but such right must be exercised within a shorter period of (i) one year from the time that the customer becomes aware that the financial product was sold in violation of the regulatory requirements or (ii) five years from the date on which the relevant contract was made.
Punitive Penalty Surcharges
In the case of a violation of the principles regarding the duty to explain, prohibition of unfair sales practices, prohibition of improper solicitation and advertisements, sellers will now be subject to a punitive penalty of up to half the “amount that is the purpose of the contract” (which would be the deposit amount in the case of deposit products, the loan amount in the case of loan products, the investment amount in the case of investment products, and the insurance premium in the case of insurance products), depending on the severity of the violation of the Financial Consumer Protection Act.
114
Table of Contents
Environmental, Social and Governance (ESG)
We launched our ESG initiative, “Good Finance for the NEXT”, in 2021. In connection with this initiative, we appointed a female attorney with expertise in ESG related issues as a member of our Board and the chairman of our ESG Management Committee of our Board, to provide us with supervision and insight with respect to ESG management. We established a public foundation, named Woori Future Foundation, to fund projects relating to improving the quality of life of the underprivileged. We made efforts to address the climate crisis, biodiversity, and the circular economy. We worked on stakeholder co-prosperity management. We also worked on establishing transparent corporate governance structure to facilitate and induce prompt and diverse disclosures with respect to ESG related issues.
Our endeavors have been well-received and have contributed significantly to our exceptional performance in major ESG evaluations worldwide. Specifically, we have been ranked at the top global level concerning ESG ratings. Consequently we received “AA” rating (i.e. the second highest rating) from MSCI ESG Research, a global provider of research, ratings and analysis of ESG related business practices. We are included in the Dow Jones Sustainability Asia Pacific Index, which is designed to measure the performance of Asia-Pacific sustainability leaders as identified by S&P Global through the Corporate Sustainability Assessment and represents the top 20% of the 600 largest companies in the Asia-Pacific developed region in the S&P Global Broad Market Index based on long-term economic, environmental and social criteria. We also received a “grade A” from the Korea Institute of Corporate Governance and Sustainability, a non-profit corporate governance service provider and global think tank focused on enhancing ESG policies across organizations.
| Item 4.C. | Organizational Structure |
The following chart provides an overview of our structure, including our significant subsidiaries and our ownership of such subsidiaries as of April 21, 2023:
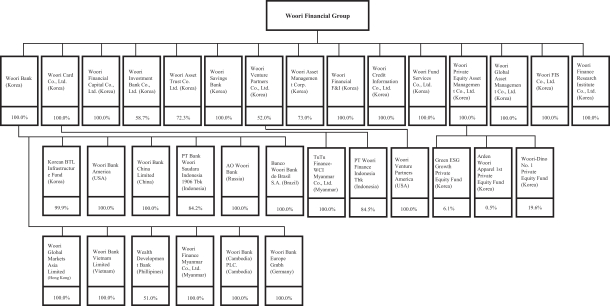
115
Table of Contents
The following table provides summary information for our subsidiaries (other than structured companies) that are consolidated in our consolidated financial statements as of and for the year ended December 31, 2022:
| Subsidiary(1) |
Percentage of Ownership |
Total Assets | Shareholders’ Equity |
Operating Revenue |
Net Income attributable to owners |
|||||||||||||||
| (in millions of Won, except percentages) | ||||||||||||||||||||
| Woori Bank |
100.0 | % | ₩ | 443,340,979 | ₩ | 25,757,186 | ₩ | 38,656,623 | ₩ | 2,937,257 | ||||||||||
| Woori Card Co., Ltd. |
100.0 | % | 16,118,967 | 2,426,511 | 1,845,296 | 204,385 | ||||||||||||||
| Woori Financial Capital Co., Ltd. |
100.0 | % | 12,581,473 | 1,540,719 | 1,323,574 | 183,328 | ||||||||||||||
| Woori Investment Bank Co., Ltd. |
58.7 | % | 5,657,191 | 674,781 | 406,157 | 91,794 | ||||||||||||||
| Woori Asset Trust Co., Ltd. |
51.0 | (2)% | 322,098 | 227,525 | 137,114 | 60,319 | ||||||||||||||
| Woori Savings Bank. |
100.0 | % | 1,786,495 | 229,816 | 110,868 | 10,607 | ||||||||||||||
| Woori Asset Management Corp. |
73.0 | % | 185,389 | 122,821 | 35,019 | 1,259 | ||||||||||||||
| Woori Credit Information Co., Ltd. |
100.0 | % | 42,832 | 33,592 | 38,549 | 1,784 | ||||||||||||||
| Woori Fund Services Co., Ltd. |
100.0 | % | 25,094 | 22,403 | 16,337 | 3,917 | ||||||||||||||
| Woori Private Equity Asset Management Co., Ltd. |
100.0 | % | 94,434 | 89,762 | 7,830 | 1,902 | ||||||||||||||
| Woori Global Asset Management Co., Ltd |
100.0 | % | 34,988 | 27,898 | 13,711 | 211 | ||||||||||||||
| Woori FIS Co., Ltd. |
100.0 | % | 112,117 | 57,472 | 296,235 | 1,069 | ||||||||||||||
| Woori Finance Research Institute Co., Ltd. |
100.0 | % | 6,456 | 3,852 | 7,006 | 46 | ||||||||||||||
| Woori Financial F&I Inc. |
100.0 | % | 336,141 | 200,579 | 8,086 | 867 | ||||||||||||||
| (1) | In March 2023, we acquired a 52% equity interest in Daol Investment, a venture capital company. We subsequently changed its name to Woori Venture Partners Co., Ltd. |
| (2) | As of December 31, 2022, our ownership interest was 67.2% excluding treasury stocks. As of March 31, 2023, we have completed additional acquisitions and our ownership percentage is 72.3% including treasury stocks (our ownership interest is 95.3% excluding such treasury stocks). |
| Item 4.D. | Property, Plants and Equipment |
Our registered office and corporate headquarters, with a total area of approximately 97,222 square meters, are located at 51, Sogong-ro, Jung-gu, Seoul, Korea. Information regarding certain of our properties in Korea as of December 31, 2022 is presented in the following table:
| Type of Facility/Building |
Location |
Area | ||||
| (square meters) | ||||||
| Woori Bank registered office and corporate headquarters |
51, Sogong-ro, Jung-gu, Seoul, Korea 04632 | 97,222 | ||||
| Woori Bank Sangam Tower |
17, World Cup buk-ro 60-gil, Mapo-gu, Seoul, Korea 03921 | 81,475 | ||||
| Woori Bank Digital Tower |
48,Sogong-ro, Jung.gu, Seoul, Korea 04631 | 33,022 | ||||
As of December 31, 2022, we had a network of 713 banking branches in Korea, 200 of which are housed in buildings owned by us, while the remaining branches are leased properties. Lease terms are generally from two to three years and seldom exceed five years. We also have subsidiaries in the United States, China, Hong Kong, Russia, Indonesia, Cambodia, Brazil, Myanmar, the Philippines, Vietnam and Germany and branches, agencies and representative offices across the world. See “Item 4.B. Business Overview—Capital Markets Activities—International Banking.” We do not own any material properties outside of Korea.
As of December 31, 2022, the net book value of the properties owned by us and our right-of-use assets was ₩2,778 billion and ₩365 billion, respectively. As of the same date, our lease liabilities amounted to ₩319 billion.
116
Table of Contents
| Item 4A. | UNRESOLVED STAFF COMMENTS |
We do not have any unresolved comments from the U.S. Securities and Exchange Commission staff regarding our periodic reports under the Exchange Act.
| Item 5. | OPERATING AND FINANCIAL REVIEW AND PROSPECTS |
| Item 5.A. | Operating Results |
Overview
The following discussion is based on our consolidated financial statements, which have been prepared in accordance with IFRS as issued by the IASB. The consolidated financial statements include the accounts of subsidiaries over which substantive control is exercised through either majority ownership of voting stock and/or other means. Investments in joint ventures and associates (which are companies over which we have the ability to exercise significant influence) are accounted for by the equity method of accounting and are reported in investments in joint ventures and associates.
Trends in the Korean Economy
Our financial position and results of operations have been and will continue to be significantly affected by financial and economic conditions in Korea. Substantial growth in lending in Korea to small- and medium-sized enterprises in recent years, and financial difficulties experienced by such enterprises as a result of, among other things, adverse changes in economic conditions in Korea and globally (such as inflation, rise in interest rates and the COVID-19 pandemic which still affects many countries worldwide, including Korea, although to a lesser extent compared with prior year), may lead to increasing delinquencies and a deterioration in overall asset quality in the credit exposures of Korean banks to small- and medium-sized enterprises. Our loans to small- and medium-sized enterprises increased from ₩112,696 as of December 31, 2021 to ₩122,925 billion as of December 31, 2022. In 2022, we recorded charge-offs of ₩117 billion in respect of our Won-denominated loans to small- and medium-sized enterprises, compared to charge-offs of ₩158 billion in 2021. See “Item 3.D. Risk Factors—Risks relating to our corporate credit portfolio—The largest portion of our exposure is to small- and medium-sized enterprises, and financial difficulties experienced by companies in this segment may result in a deterioration of our asset quality and have an adverse impact on us.”
In recent years, commercial banks, consumer finance companies and other financial institutions in Korea have also made significant investments and engaged in aggressive marketing in consumer lending (including mortgage and home equity loans), leading to substantially increased competition in this segment. From the second half of 2016 to 2021, the Korean government introduced various measures to tighten regulations on mortgage and other lending and housing subscription in response to the rapid growth in consumer debt and concerns over speculative investments in real estate in certain areas. Demand for residential property and their prices in certain areas, including Seoul, continued to increase until the beginning of 2022. However, overall in 2022, housing prices and activity levels in the Korean real estate market decreased and the Korean government has since begun to introduce a number of policy measures, including the lifting of borrowing limits, to sustain housing prices and induce a soft landing of the housing market. Our consumer loan portfolio decreased from ₩148,361 billion as of December 31, 2021 to ₩143,940 billion as of December 31, 2022. A decrease in housing prices as a result of the implementation of such measures, together with the high level of consumer debt and deteriorating domestic and global economic conditions, could result in declines in consumer spending and reduced economic growth, which may lead to increasing delinquencies and a deterioration in asset quality. In 2022, we recorded charge-offs of ₩161 billion and provisions for credit losses of ₩206 billion in respect of our consumer loan portfolio, compared to charge-offs of ₩173 billion and provisions for credit losses of ₩168 billion in 2021. See “Item 3.D. Risk Factors—Risks relating to our consumer credit portfolio.”
The Korean economy is closely tied to, and is affected by developments in, the global economy. The overall prospects for the Korean and global economy in 2023 and beyond remain uncertain. In recent years, the global financial markets have experienced significant volatility as a result of, among other things:
| • | the occurrence of severe health epidemics, such as the COVID-19 pandemic; |
117
Table of Contents
| • | hostilities, political or social tensions involving Russia (including the invasion of Ukraine by Russia and ensuing actions that the United States and other countries have taken or may take in the future) and the resulting adverse effects on the global supply of oil and other natural resources and the global financial markets; |
| • | interest rate fluctuations as well as changes in policy rates by the U.S. Federal Reserve and other central banks; |
| • | financial and social difficulties affecting many countries worldwide, in particular in Latin America and Europe; |
| • | adverse developments in the global financial markets and industry, in particular those faced by several banks in the United States and Europe; |
| • | a deterioration in economic and trade relations between the United States and its major trading partners, including China; |
| • | escalations in trade protectionism globally and geopolitical tensions in East Asia and the Middle East; |
| • | the slowdown of economic growth in China and other major emerging market economies; |
| • | political and social instability in various countries in the Middle East, including Syria, Iraq and Egypt. |
In light of the high level of interdependence of the global economy, unfavorable changes in the global financial markets, including as a result of any of the foregoing developments, could have a material adverse effect on the Korean economy and financial markets, and in turn on our business, financial condition and results of operations.
In addition, in March 2023, Silicon Valley Bank, Signature Bank and other banks closed and entered into receivership, or winded down their operations. Although these adverse developments did not take place in Korea, such events involving limited liquidity, defaults, non-performance or other adverse developments that affect financial institutions, transactional counterparties or other companies in the financial services industry or the financial services industry generally, or concerns or rumors about any events of these kinds or other similar risks, have in the past and may in the future lead to market-wide liquidity issues. See “Item 3.D. Risk Factors—Other risks relating to our business—Adverse developments affecting the financial services industry, including events or concerns involving liquidity by financial institutions, could adversely affect our business, financial condition or results of operations.”
The global outbreak of COVID-19, which was declared a “pandemic” by The World Health Organization in March 2020, has led to global economic and financial disruptions, including impact on international trade and business activities, sharp declines and significant volatility in the financial markets as well as decreases in interest rates worldwide. See “Item 3.D. Risk Factors—Other risks relating to our business— The COVID-19 pandemic has adversely affected and may continue to adversely affect our business, financial condition or results of operations” and “Item 3.D. Risk Factors—Other risks relating to our business—An increase in interest rates would decrease the value of our debt securities portfolio and raise our funding costs while reducing loan demand and the repayment ability of our borrowers, which could adversely affect us.”
The interest rates on our interest-earning assets and interest-bearing liabilities, and therefore our net interest income, are affected by The Bank of Korea’s policy rates. On March 16, 2020, the Bank of Korea lowered its policy rate to 0.75% from 1.25%, which was further lowered to 0.5% on May 28, 2020, in response to deteriorating economic conditions resulting from the COVID-19 pandemic. The Bank of Korea raised its policy rate from 0.50% to 0.75% on August 26, 2021, to 1.00% on November 25, 2021, to 1.25% on January 14, 2022, to 1.50% on April 14, 2022, to 1.75% in May 2022, to 2.25% in July 2022, to 2.50% in August 2022, to 3.00% in October 2022, to 3.25% in November 2022 and to 3.50% in January 2023 in response to rising levels of household debt and inflationary pressures.
We are also exposed to adverse changes and volatility in the global and Korean financial markets as a result of our liabilities and assets denominated in foreign currencies and our holdings of trading and investment securities, including structured products. The value of the Won relative to major foreign currencies in general and
118
Table of Contents
the U.S. dollar in particular has fluctuated widely in recent years and has been subject to significant volatility as a result of the COVID-19 pandemic, and by the invasion of Ukraine by Russia. A depreciation of the Won will increase our cost of servicing our foreign currency-denominated debt, while continued exchange rate volatility may also result in foreign exchange losses for us. Furthermore, as a result of changes in global and Korean economic, social and political conditions, there has been volatility in securities prices, including the stock prices of Korean and foreign companies in which we hold an interest. Such volatility has resulted in and may lead to further trading and valuation losses on our trading and investment securities portfolio as well as impairment losses on our investments in joint ventures and associates.
As a result of volatile conditions in the Korean and global economies and financial markets, as well as factors such as fluctuations in oil and commodity prices, interest and exchange rate fluctuations, higher unemployment, lower consumer confidence, stock market volatility, changes in fiscal and monetary policies and continued tensions with North Korea, the economic outlook for the financial services sector in Korea in 2023 and for the foreseeable future remains highly uncertain.
Cessation of LIBOR
The ICE Benchmark Administration, the administrator of the London Interbank Offered Rate, or LIBOR, ceased publication of short-term U.S. dollar LIBOR settings and all non-U.S. dollar LIBOR settings on a representative basis after December 31, 2021, with plans to cease publication of all other U.S. dollar LIBOR settings after June 30, 2023. Given the extensive use of LIBOR across financial markets, the transition away from LIBOR presents various risks and challenges to financial markets and institutions, including us, and in particular, Woori Bank. We had issued, traded, held or otherwise used various products and securities that referenced LIBOR, including, among others, loans, securities, deposits, borrowings, derivatives and debentures. In response, we established a LIBOR response plan to identify the impacts and risks to its business associated with the transition away from LIBOR, and to prepare and implement an action plan to ensure a smooth transition to alternative benchmark rates, and to date, has substantively completed such transition, with a strategy in place for the remainder of such transactions that involve LIBOR settings that expire in 2023.
Changes in Securities Values, Exchange Rates and Interest Rates
Fluctuations of exchange rates, interest rates and stock prices affect, among other things, the demand for our products and services, the value of and rate of return on our assets, the availability and cost of funding and the financial condition of our customers. The following table shows, for the dates indicated, the stock price index of all equities listed on the KRX KOSPI Market as published in the KOSPI, the Won to U.S. dollar exchange rates and benchmark Won borrowing interest rates.
| June 30, 2018 |
Dec. 31, 2018 |
June 30, 2019 |
Dec. 31, 2019 |
June 30, 2020 |
Dec. 31, 2020 |
June 30, 2021 |
Dec. 31, 2021 |
June 30, 2022 |
Dec. 31, 2022 |
|||||||||||||||||||||||||||||||
| KOSPI |
2,326.13 | 2,041.04 | 2,130.62 | 2,197.67 | 2,108.33 | 2,873.47 | 3,296.68 | 2,977.65 | 2,332.64 | 2,236.40 | ||||||||||||||||||||||||||||||
| ₩/US$ exchange rates(1) |
₩ | 1,111.79 | ₩ | 1,112.85 | ₩ | 1,154.58 | ₩ | 1,155.46 | ₩ | 1,200.50 | ₩ | 1,086.11 | ₩ | 1,130.42 | ₩ | 1,188.59 | ₩ | 1,298.95 | ₩ | 1,260.18 | ||||||||||||||||||||
| Corporate bond rates(2) |
2.9 | % | 2.6 | % | 2.0 | % | 2.0 | % | 1.8 | % | 1.7 | % | 2.0 | % | 2.5 | % | 4.5 | % | 5.5 | % | ||||||||||||||||||||
| Treasury bond rates(3) |
2.1 | % | 1.8 | % | 1.5 | % | 1.4 | % | 0.8 | % | 1.0 | % | 1.5 | % | 1.8 | % | 3.5 | % | 3.7 | % | ||||||||||||||||||||
| (1) | Represents the noon buying rate on the dates indicated. |
| (2) | Measured by the yield on three-year Korean corporate bonds rated as A+ by the Korean credit rating agencies. |
| (3) | Measured by the yield on three-year treasury bonds issued by the Ministry of Economy and Finance of Korea. |
119
Table of Contents
Results of Operations
Net Interest Income
The following table shows, for the years indicated, the principal components of our interest income:
| Year ended December 31, | Percentage change | |||||||||||||||||||
| 2020 | 2021 | 2022 | 2021/2020 | 2022/2021 | ||||||||||||||||
| (in billions of Won) | (%) | |||||||||||||||||||
| Interest income |
||||||||||||||||||||
| Financial assets at fair value through profit or loss |
₩ | 49 | ₩ | 46 | ₩ | 107 | (6.1 | )% | 132.6 | % | ||||||||||
| Financial assets at fair value through other comprehensive income |
437 | 381 | 633 | (12.8 | ) | 66.1 | ||||||||||||||
| Financial assets at amortized cost: |
||||||||||||||||||||
| Securities at amortized cost |
383 | 325 | 515 | (15.1 | ) | 58.5 | ||||||||||||||
| Loans and other financial assets at amortized cost: |
||||||||||||||||||||
| Interest on due from banks |
54 | 47 | 244 | (13.0 | ) | 419.1 | ||||||||||||||
| Interest on loans |
8,570 | 9,065 | 13,109 | 5.8 | 44.6 | |||||||||||||||
| Interest on other receivables |
31 | 31 | 47 | 0.0 | 51.6 | |||||||||||||||
|
|
|
|
|
|
|
|||||||||||||||
| Subtotal |
9,038 | 9,468 | 13,915 | 4.8 | 47.0 | |||||||||||||||
|
|
|
|
|
|
|
|||||||||||||||
| Total interest income |
9,524 | 9,895 | 14,655 | 3.9 | 48.1 | |||||||||||||||
|
|
|
|
|
|
|
|||||||||||||||
| Interest expense |
||||||||||||||||||||
| Deposits |
2,487 | 1,907 | 4,121 | (23.3 | ) | 116.1 | ||||||||||||||
| Borrowings |
270 | 220 | 598 | (18.5 | ) | 171.8 | ||||||||||||||
| Debentures |
723 | 727 | 1,036 | 0.6 | 42.5 | |||||||||||||||
| Others |
37 | 48 | 195 | 29.7 | 306.3 | |||||||||||||||
| Lease liabilities |
9 | 7 | 8 | (22.2 | ) | 14.3 | ||||||||||||||
|
|
|
|
|
|
|
|||||||||||||||
| Total interest expense |
3,526 | 2,909 | 5,958 | (17.5 | ) | 104.8 | ||||||||||||||
|
|
|
|
|
|
|
|||||||||||||||
| Net interest income |
₩ | 5,998 | ₩ | 6,986 | ₩ | 8,697 | 16.5 | % | 24.5 | % | ||||||||||
|
|
|
|
|
|
|
|||||||||||||||
| Net interest margin(1) |
1.65 | % | 1.74 | % | 1.96 | % | ||||||||||||||
| (1) | The ratio of net interest income to average interest-earning assets. |
Comparison of 2022 to 2021
Interest Income. Interest income increased 48.1% from ₩9,895 billion in 2021 to ₩14,655 billion in 2022, primarily due to a 44.6% increase in interest on loans, which was enhanced by a 58.5% increase in interest on securities at amortized cost and a 66.1% increase in interest on financial assets at fair value through other comprehensive income. The average balance of interest-earning assets increased 10.71% from ₩401,368 billion in 2021 to ₩444,373 billion in 2022, due to the growth of our loan portfolio, an increase in financial assets at fair value through profit or loss, an increase in financial assets at fair value through other comprehensive income, and an increase in securities at amortized cost. The effect of this increase was enhanced by a 83 basis point increase in the average yield on interest-earning assets from 2.47% in 2021 to 3.30% in 2022, which reflected the higher overall level of interest rates prevailing in Korea in 2022 compared to 2021, as discussed above in “—Overview—Trends in the Korean Economy.”
The 44.6% increase in interest on loans from ₩9,065 billion in 2021 to ₩13,109 billion in 2022 was principally due to:
| • | a 14.59% increase in the average volume of commercial and industrial loans from ₩135,776 billion in 2021 to ₩155,581 billion in 2022, which was enhanced by a 108 basis point increase in the average yield on such loans from 2.57% in 2021 to 3.65% in 2022; |
120
Table of Contents
| • | a 0.59% decrease in the average volume of general purpose household loans (including home equity loans) from ₩79,923 billion in 2021 to ₩79,453 billion in 2022, which was partially offset by a 117 basis point increase in the average yield on such loans from 3.51% in 2021 to 4.68% in 2022; and |
| • | a 34.29% increase in the average volume of lease financing loans from ₩3,287 billion in 2021 to ₩4,414 billion in 2022, which was enhanced by a 41 basis point increase in the average yield on such loans from 3.62% in 2021 to 4.03% in 2022. |
The average volumes of commercial and industrial loans, and lease financing loans increased primarily due to the increased demand from borrowers in need of financing in light of the higher overall interest rates prevailing in Korea in 2022 compared to 2021. The average volume of general purpose household loans decreased primarily due to the decreased demand for credit loans and home equity loans. The average yields on commercial and industrial loans, general purpose household loans and lease financing loans increased mainly due to the higher overall level of interest rates prevailing in Korea in 2022 compared to 2021. Overall, the average volume of loans increased 8.92% from ₩314,738 billion in 2021 to ₩342,815 billion in 2022, while the average yield on loans increased by 94 basis points from 2.88% in 2021 to 3.82% in 2022.
The 58.5% increase in interest on securities at amortized cost from ₩325 billion in 2021 to ₩515 billion in 2022 was principally due to a 30.0% increase in the average volume of securities at amortized cost from ₩16,503 billion in 2021 to ₩21,450 billion in 2022, which was principally due to an increase in Won-denominated debt securities from financial institutions. Such increase was enhanced by a 43 basis point increase in the average yield on such assets from 1.97% in 2021 to 2.40% in 2022, which reflected the higher overall level of interest rates prevailing in Korea in 2022 compared to 2021.
The 66.1% increase in interest on financial assets at fair value through other comprehensive income from ₩381 billion in 2021 to ₩633 billion in 2022 was principally due to a 53 basis point increase in the average yield on financial assets at fair value through other comprehensive income from 1.24% in 2021 to 1.77% in 2022, which was principally due to the higher overall level of interest rates prevailing in Korea in 2022 compared to 2021. Such increase was partially enhanced by a 16.7% increase in the average volume of such assets from ₩30,724 billion in 2021 to ₩35,848 billion in 2022, which was principally due to increases in Won-denominated debt securities from financial institutions and Won-denominated treasury bonds.
Interest Expense. Interest expense increased 104.8% from ₩2,909 billion in 2021 to ₩5,958 billion in 2022, primarily due to a 116.1% increase in interest expense on deposits, which was enhanced by an 171.8% increase in interest expense on borrowings. The average cost of interest-bearing liabilities increased by 64 basis points from 0.76% in 2021 to 1.40% in 2022, which mainly reflected the higher overall level of interest rates prevailing in Korea in 2022 compared to 2021, as well as a decrease in the volume of low-cost deposits. The effect of this increase was partially enhanced by a 10.9% increase in the average balance of interest-bearing liabilities from ₩384,650 billion in 2021 to ₩426,482 billion in 2022, which was principally due to increases in the average balances of deposits, borrowings and debentures.
The 116.1% increase in interest expense on deposits from ₩1,907 billion in 2021 to ₩4,121 billion in 2022 resulted mainly from:
| • | a 63 basis point increase in the average cost of Won-denominated time and savings deposits from 0.61% in 2021 to 1.24% in 2022, which was partially enhanced by a 6.1% increase in the average balance of such deposits from ₩243,708 billion in 2021 to ₩258,594 billion in 2022; and |
| • | a 75 basis point increase in the average cost of other deposits (other than Won-denominated demand deposits, time and savings deposits and certificates of deposit) from 0.73% in 2021 to 1.48% in 2022, which was partially enhanced by a 25.0% increase in the average balance of such deposits from ₩38,374 billion in 2021 to ₩47,978 billion in 2022. |
The increases in the average cost of Won-denominated time and savings deposits and other deposits were primarily attributable to the higher overall level of interest rates prevailing in Korea in 2022 compared to 2021, while the increases in the average volume of Won-denominated time and savings deposits and other deposits
121
Table of Contents
mainly reflected the customers’ continuing preference for low-risk products and institutions in Korea in light of the continuing uncertainty in financial markets in 2022 resulting from the COVID-19 pandemic and the higher overall interest rates in 2022 compared to 2021.
Overall, the average cost of deposits increased by 63 basis points from 0.64% in 2021 to 1.27% in 2022, while the average volume of deposits increased 8.4% from ₩299,574 billion in 2021 to ₩324,710 billion in 2022.
The 171.8% increase in interest expense on borrowings from ₩220 billion in 2021 to ₩598 billion in 2022 was primarily due to a 104 basis point increase in the average cost of borrowings from 0.95% in 2021 to 1.99% in 2022, which mainly reflected the higher overall level of interest rates prevailing in Korea in 2022 compared to 2021. Such increase was partially enhanced by an 29.2% increase in the average balance of borrowings from ₩23,216 billion in 2021 to ₩30,004 billion in 2022, which was mainly attributable to our continued use of borrowings to meet our funding needs.
The 42.5% increase in interest expense on debentures from ₩727 billion in 2021 to ₩1,036 billion in 2022 was primarily due to a 13.4% increase in the average balance of debentures from ₩40,935 billion in 2021 to ₩46,414 billion in 2022, which was enhanced by a 45 basis point increase in the average cost of debentures from 1.78% in 2021 to 2.23% in 2022. The increase in the average balance of debentures mainly reflected the increase in debentures issued by our subsidiaries Woori Card and Woori Financial Capital in 2022, while the increase in the average cost of debentures was mainly due to the higher level of interest rates prevailing in Korea in 2022 compared to 2021.
Net Interest Margin. Net interest margin represents the ratio of net interest income to average interest-earning assets. Our overall net interest margin increased from 1.74% in 2021 to 1.96% in 2022, which was primarily due to a 24.5% increase in our net interest income from ₩6,986 billion in 2021 to ₩8,697 billion in 2022 and a 10.7% increase in the average balance of our interest-earning assets from ₩401,368 billion in 2021 to ₩444,373 billion in 2022. The increase in interest income outpaced a decrease in interest expense, resulting in the increase in net interest income. The growth in average interest-earning assets was mostly offset by an increase in average interest-bearing liabilities from ₩384,650 billion in 2021 to ₩426,482 billion in 2022. The increase in net interest margin was driven mainly by an increase in our net interest spread, which represents the difference between the average yield on our interest-earning assets and the average cost of our interest-bearing liabilities, from 1.71% in 2021 to 1.90% in 2022. The increase in our net interest spread reflected a larger increase in the yield on interest-earning assets compared to the increase in the average cost of interest-bearing liabilities, primarily due to the earlier adjustment of interest rates on interest-earning assets compared to interest rates on interest-bearing liabilities in the context of a higher interest rate environment in 2022 compared to 2021.
Comparison of 2021 to 2020
Interest Income. Interest income increased 3.9% from ₩9,524 billion in 2020 to ₩9,895 billion in 2021, primarily due to a 5.8% increase in interest on loans, which was offset in part by a 15.1% decrease in interest on securities at amortized cost and a 12.8% decrease in interest on financial assets at fair value through other comprehensive income. The average balance of interest-earning assets increased 10.5% from ₩363,234 billion in 2020 to ₩401,368 billion in 2021, principally due to the growth of our loan portfolio. The effect of this increase was partially offset by a 15 basis point decrease in the average yield on interest-earning assets from 2.62% in 2020 to 2.47% in 2021, which reflected the lower overall level of interest rates prevailing in Korea in 2021 compared to 2020, as discussed above in “—Overview—Trends in the Korean Economy.”
The 5.8% increase in interest on loans from ₩8,570 billion in 2020 to ₩9,065 billion in 2021 was principally due to:
| • | a 13.9% increase in the average volume of commercial and industrial loans from ₩119,251 billion in 2020 to ₩135,776 billion in 2021, which was partially offset by a 13 basis point decrease in the average yield on such loans from 2.70% in 2020 to 2.57% in 2021; |
122
Table of Contents
| • | a 7.8% increase in the average volume of general purpose household loans (including home equity loans) from ₩74,123 billion in 2020 to ₩79,923 billion in 2021, which was partially offset by a 14 basis point decrease in the average yield on such loans from 3.65% in 2020 to 3.51% in 2021; and |
| • | a 127.0% increase in the average volume of lease financing loans from ₩1,448 billion in 2020 to ₩3,287 billion in 2021, which was enhanced by a 31 basis point increase in the average yield on such loans from 3.31% in 2020 to 3.62% in 2021. |
The average volumes of commercial and industrial loans, general purpose household loans and lease financing loans increased primarily due to increased demand from borrowers in need of financing in light of the COVID-19 pandemic as well as increases in home purchases in the case of general purpose household loans, which include home equity loans and loans for large-scale home lease deposits. The average yields on commercial and industrial loans, general purpose household loans and lease financing loans decreased mainly due to the lower overall level of interest rates prevailing in Korea in 2021 compared to 2020. Overall, the average volume of loans increased 12.3% from ₩280,181 billion in 2020 to ₩314,738 billion in 2021, while the average yield on loans decreased by 18 basis points from 3.06% in 2020 to 2.88% in 2021.
The 15.1% decrease in interest on securities at amortized cost from ₩383 billion in 2020 to ₩325 billion in 2021 was principally due to a 12.9% decrease in the average volume of securities at amortized cost from ₩18,945 billion in 2020 to ₩16,503 billion in 2021, which was principally due to a decrease in Won-denominated debt securities from financial institutions. Such decrease was enhanced by a 5 basis point decrease in the average yield on such assets from 2.02% in 2020 to 1.97% in 2021, which reflected the lower overall level of interest rates prevailing in Korea in 2021 compared to 2020.
The 12.8% decrease in interest on financial assets at fair value through other comprehensive income from ₩437 billion in 2020 to ₩381 billion in 2021 was principally due to a 33 basis point decrease in the average yield on financial assets at fair value through other comprehensive income from 1.57% in 2020 to 1.24% in 2021, which was principally due to the lower overall level of interest rates prevailing in Korea in 2021 compared to 2020. Such decrease was partially offset by a 10.2% increase in the average volume of such assets from ₩27,868 billion in 2020 to ₩30,724 billion in 2021, which was principally due to increases in Won-denominated debt securities from financial institutions and Won-denominated treasury bonds.
Interest Expense. Interest expense decreased 17.5% from ₩3,526 billion in 2020 to ₩2,909 billion in 2021, primarily due to a 23.3% decrease in interest expense on deposits, which was enhanced by an 18.5% decrease in interest expense on borrowings. The average cost of interest-bearing liabilities decreased by 26 basis points from 1.02% in 2020 to 0.76% in 2021, which mainly reflected the lower overall level of interest rates prevailing in Korea in 2021 compared to 2020, as well as an overall increase of loans that typically have lower interest rates. The effect of this decrease was partially offset by a 10.8% increase in the average balance of interest-bearing liabilities from ₩347,004 billion in 2020 to ₩384,650 billion in 2021, which was principally due to increases in the average balances of deposits, debentures and borrowings.
The 23.3% decrease in interest expense on deposits from ₩2,487 billion in 2020 to ₩1,907 billion in 2021 resulted mainly from:
| • | a 30 basis point decrease in the average cost of Won-denominated time and savings deposits from 0.91% in 2020 to 0.61% in 2021, which was partially offset by an 8.0% increase in the average balance of such deposits from ₩225,563 billion in 2020 to ₩243,708 billion in 2021; and |
| • | a 30 basis point decrease in the average cost of other deposits (other than Won-denominated demand deposits, time and savings deposits and certificates of deposit) from 1.03% in 2020 to 0.73% in 2021, which was partially offset by a 10.1% increase in the average balance of such deposits from ₩34,861 billion in 2020 to ₩38,374 billion in 2021. |
The decreases in the average cost of Won-denominated time and savings deposits and other deposits were primarily attributable to the lower overall level of interest rates prevailing in Korea in 2021 compared to 2020, while the increases in the average volume of Won-denominated time and savings deposits and other deposits
123
Table of Contents
mainly reflected customers’ continuing preference for low-risk products and institutions in Korea in light of the continuing uncertainty in financial markets in 2021 resulting from the COVID-19 pandemic.
Overall, the average cost of deposits decreased by 27 basis points from 0.91% in 2020 to 0.64% in 2021, while the average volume of deposits increased 10.1% from ₩272,211 billion in 2020 to ₩299,574 billion in 2021.
The 18.5% decrease in interest expense on borrowings from ₩270 billion in 2020 to ₩220 billion in 2021 was primarily due to a 31 basis point decrease in the average cost of borrowings from 1.26% in 2020 to 0.95% in 2021, which mainly reflected the lower overall level of interest rates prevailing in Korea in 2021 compared to 2020. Such decrease was partially offset by an 8.6% increase in the average balance of borrowings from ₩21,368 billion in 2020 to ₩23,216 billion in 2021, which was mainly attributable to our increased use of borrowings to meet our funding needs in light of the lower interest rate environment in Korea.
The 0.6% increase in interest expense on debentures from ₩723 billion in 2020 to ₩727 billion in 2021 was primarily due to a 26.7% increase in the average balance of debentures from ₩32,315 billion in 2020 to ₩40,935 billion in 2021, which was mostly offset by a 46 basis point decrease in the average cost of debentures from 2.24% in 2020 to 1.78% in 2021. The increase in the average balance of debentures mainly reflected additional debentures attributable to the addition of Woori Financial Capital as a consolidated subsidiary starting on October 20, 2020, while the decrease in the average cost of debentures was mainly due to the lower overall level of interest rates prevailing in Korea in 2021 compared to 2020.
Net Interest Margin. Net interest margin represents the ratio of net interest income to average interest-earning assets. Our overall net interest margin increased from 1.65% in 2020 to 1.74% in 2021, as a 16.5% increase in our net interest income from ₩5,998 billion in 2020 to ₩6,986 billion in 2021 outpaced a 10.5% increase in the average balance of our interest-earning assets from ₩363,234 billion in 2020 to ₩401,368 billion in 2021. The increase in interest income was enhanced by a decrease in interest expense, resulting in the increase in net interest income. The growth in average interest-earning assets was mostly offset by an increase in average interest-bearing liabilities from ₩347,004 billion in 2020 to ₩384,650 billion in 2021. The increase in net interest margin was driven mainly by an increase in our net interest spread, which represents the difference between the average yield on our interest-earning assets and the average cost of our interest-bearing liabilities, from 1.60% in 2020 to 1.71% in 2021. The increase in our net interest spread reflected a larger decrease in the average cost of interest-bearing liabilities compared to the decrease in the yield on interest-earning assets between the two periods, primarily due to the earlier adjustment of interest rates on interest-earning assets compared to interest rates on interest-bearing liabilities in the context of a lower interest rate environment in 2021 compared to 2020.
124
Table of Contents
Impairment Losses Due to Credit Loss
The following table shows, for the years indicated, the components of our impairment losses due to credit loss.
| Year ended December 31, | Percentage change | |||||||||||||||||||
| 2020 | 2021 | 2022 | 2021/2020 | 2022/2021 | ||||||||||||||||
| (in billions of Won) | (%) | |||||||||||||||||||
| Impairment loss due to credit loss on financial assets measured at fair value through other comprehensive income |
₩ | (2 | ) | ₩ | (5 | ) | ₩ | 1 | 150.0 | % | N/M | (1) | ||||||||
| Reversal of (provision for) impairment loss due to credit loss on securities at amortized cost |
1 | (1 | ) | (3 | ) | N/M | (1) | 200 | ||||||||||||
| Provisions for credit loss on loans and other financial assets at amortized cost |
(791 | ) | (552 | ) | (882 | ) | (30.2 | ) | 59.8 | |||||||||||
| Reversal of provisions on (provisions for) guarantees |
18 | 11 | (7 | ) | (38.9 | ) | N/M | (1) | ||||||||||||
| Reversal of provisions on (provisions for) unused loan commitments |
(10 | ) | 10 | 6 | N/M | (1) | (40 | ) | ||||||||||||
|
|
|
|
|
|
|
|||||||||||||||
| Total impairment losses due to credit loss |
₩ | (784 | ) | ₩ | (537 | ) | ₩ | (885 | ) | (31.5 | ) | 64.8 | ||||||||
|
|
|
|
|
|
|
|||||||||||||||
| (1) | N/M = not meaningful. |
Comparison of 2022 to 2021
Our impairment losses due to credit loss increased 64.8% from ₩537 billion in 2021 to ₩885 billion in 2022, primarily due to a 59.8% increase in provisions for credit loss on loans and other financial assets at amortized cost from ₩552 billion in 2021 to ₩882 billion in 2022. Such increase in provisions for credit loss on loans and other financial assets at amortized cost was primarily due to our preemptive measures to account for a potential increase in expected credit loss that could result from a deterioration in the overall asset quality due to the adverse changes in economic conditions in Korea and globally in 2022.
Comparison of 2021 to 2020
Our impairment losses due to credit loss decreased 31.5% from ₩784 billion in 2020 to ₩537 billion in 2021, primarily due to a 30.2% decrease in provisions for credit loss on loans and other financial assets at amortized cost from ₩791 billion in 2020 to ₩552 billion in 2021. Such decrease in provisions for credit loss on loans and other financial assets at amortized cost was primarily due to increases in provision for loan losses in respect of our corporate and consumer loan portfolios in 2020, which were not repeated in 2021. Such increases in 2020 were mainly attributable to our preemptive measures to account for a potential increase in expected credit loss that could result from a deterioration in the overall asset quality of our corporate and consumer loan portfolios due to the COVID-19 pandemic.
Allowance for Credit Losses
For information on our allowance for credit losses, see “Item 4.B. Business Overview—Assets and Liabilities—Loan Portfolio—Allocation and Analysis of Allowances for Credit Losses.”
125
Table of Contents
Corporate Loans
The following table shows, for the years indicated, certain information regarding our impaired corporate loans (including government loans and bank loans):
| As of December 31, | ||||||||||||
| 2020 | 2021 | 2022 | ||||||||||
| Impaired corporate loans as a percentage of total corporate loans |
0.5 | % | 0.3 | % | 0.5 | % | ||||||
| Allowance for credit losses for corporate loans as a percentage of total corporate loans |
0.8 | 0.7 | 0.8 | |||||||||
| Allowance for credit losses for corporate loans as a percentage of impaired corporate loans |
172.4 | 219.7 | 159.9 | |||||||||
| Net charge-offs of corporate loans as a percentage of total corporate loans |
0.1 | 0.1 | 0.0 | |||||||||
During 2022, both impaired corporate loans and allowance for credit losses for corporate loans, each as a percentage of total corporate loans, increased primarily due to a deterioration in the overall credit quality of our corporate loans, which outpaced an increase in the total amount of our corporate loans from ₩179,717 billion as of December 31, 2021 to ₩191,101 billion as of December 31, 2022. However, allowance for credit losses for corporate loans as a percentage of impaired corporate loans decreased during 2022, as a 26.2% increase in allowance for credit losses for corporate loans from ₩1,191 billion as of December 31, 2021 to ₩1,503 billion as of December 31, 2022 was outpaced by a 73.4% increase in impaired corporate loans from ₩542 billion as of December 31, 2021 to ₩940 billion as of December 31, 2022. The increase in our impaired corporate loans was mainly attributable to the deterioration of the overall asset quality of our corporate loan portfolio due to the adverse changes in economic conditions in Korea and globally in 2022. The increase in our allowance for credit losses for corporate loans was mainly attributable to our preemptive measures to account for a potential increase in expected credit loss that could result from a deterioration in the overall asset quality of our corporate loan portfolio caused by the potentially adverse economic conditions in Korea and globally in 2023 and beyond. Net charge-offs of corporate loans as a percentage of total corporate loans represented 0.1% and 0.0% as of December 31, 2021 and 2022, respectively.
During 2021, impaired corporate loans and allowance for credit losses for corporate loans, each as a percentage of total corporate loans, decreased primarily due to an increase in the total amount of our corporate loans from ₩157,303 billion as of December 31, 2020 to ₩179,717 billion as of December 31, 2021. However, allowance for credit losses for corporate loans as a percentage of impaired corporate loans increased during 2021, as a 3.8% decrease in allowance for credit losses for corporate loans from ₩1,238 billion as of December 31, 2020 to ₩1,191 billion as of December 31, 2021 was outpaced by a 24.5% decrease in impaired corporate loans from ₩718 billion as of December 31, 2020 to ₩542 billion as of December 31, 2021. The decrease in our impaired corporate loans was mainly attributable to the improvement of the overall asset quality of our corporate loan portfolio following a recovery from the COVID-19 pandemic. The decrease in our allowance for credit losses for corporate loans was mainly attributable to our preemptive measures to account for a potential increase in expected credit loss that could result from a deterioration in the overall asset quality of our corporate loan portfolio due to the COVID-19 pandemic in 2020, which was not repeated in 2021. Net charge-offs of corporate loans as a percentage of total corporate loans remained stable at 0.1% as of December 31, 2020 and 2021.
126
Table of Contents
Consumer Loans and Credit Card Balances
The following table shows, for the years indicated, certain information regarding our impaired loans to the consumer sector, excluding credit card balances:
| As of December 31, | ||||||||||||
| 2020 | 2021 | 2022 | ||||||||||
| Impaired consumer loans as a percentage of total consumer loans |
0.4 | % | 0.3 | % | 0.4 | % | ||||||
| Allowance for credit losses for consumer loans as a percentage of total consumer loans |
0.3 | 0.3 | 0.4 | |||||||||
| Allowance for credit losses for consumer loans as a percentage of impaired consumer loans |
76.7 | 88.0 | 93.6 | |||||||||
| Net charge-offs of consumer loans as a percentage of total consumer loans |
0.1 | 0.1 | 0.1 | |||||||||
Our impaired consumer loans and allowance for credit losses for consumer loans, each as a percentage of total consumer loans, increased from 0.3% in 2021 to 0.4% in 2022 as a 12.8% increase in impaired consumer loans from ₩500 billion as of December 31, 2021 to ₩564 billion as of December 31, 2022 was enhanced by a 3.0% decrease in total consumer loans from ₩148,361 billion as of December 31, 2021 to ₩143,940 billion as of December 31, 2022. Allowance for credit losses for consumer loans as a percentage of impaired consumer loans also increased, as a 20.0% increase in allowance for credit losses for consumer loans from ₩440 billion as of December 31, 2021 to ₩528 billion as of December 31, 2022 outpaced the increase in impaired consumer loans due to the expected deterioration in the overall asset quality of our consumer loan portfolio caused by the adverse changes in economic conditions in Korea and globally in 2022. Net charge-offs of consumer loans as a percentage of total consumer loans remained stable at 0.1% as of December 31, 2021 and 2022.
During 2021, allowance for credit losses and net charge-offs, each as a percentage of total consumer loans, remained stable at 0.3% and 0.1% respectively. Impaired consumer loans as a percentage of total consumer loans decreased as a 6.9% decrease in impaired consumer loans from ₩537 billion as of December 31, 2020 to ₩500 billion as of December 31, 2021 was enhanced by an 8.0% increase in total consumer loans from ₩138,119 billion as of December 31, 2020 to ₩148,361 billion as of December 31, 2021. However, allowance for credit losses for consumer loans as a percentage of impaired consumer loans increased, as a 6.8% increase in allowance for credit losses for consumer loans from ₩412 billion as of December 31, 2020 to ₩440 billion as of December 31, 2021 was enhanced by the decrease in impaired consumer loans. The decrease in impaired consumer loans was mainly attributable to our active efforts to charge off impaired consumer loans to improve the overall quality of our consumer loan portfolio, while the increase in allowance for credit losses for consumer loans was mainly attributable to the increase in our total consumer loans.
The following table shows, for the years indicated, certain information regarding our impaired credit card balances:
| As of December 31, | ||||||||||||
| 2020 | 2021 | 2022 | ||||||||||
| Impaired credit card balances as a percentage of total credit card balances(1) |
2.1 | % | 1.2 | % | 1.7 | % | ||||||
| Allowance for credit losses for credit card balances as a percentage of total credit card balances(1) |
3.0 | 2.6 | 2.9 | |||||||||
| Allowance for credit losses for credit card balances as a percentage of impaired credit card balances(1) |
143.9 | 219.8 | 169.3 | |||||||||
| Net charge-offs of credit card balances as a percentage of total credit card balances(1) |
2.1 | 1.6 | 1.6 | |||||||||
| (1) | Includes corporate credit card balances. |
During 2022, impaired credit card balances and allowance for credit losses for credit card balances, each as a percentage of total credit card balances, increased mainly because a deterioration in the overall credit quality of our credit card portfolio outpaced a 6.3% increase in total credit card balances from ₩9,757 billion as of
127
Table of Contents
December 31, 2021 to ₩10,370 billion as of December 31, 2022. However, allowance for credit losses for credit card balances as a percentage of impaired credit card balances decreased, as a 18.8% increase in our allowance for credit losses for credit card balances from ₩255 billion as of December 31, 2021 to ₩303 billion as of December 31, 2022 was outpaced by a 54.3% increase in impaired credit card balances from ₩116 billion as of December 31, 2021 to ₩179 billion as of December 31, 2022. Net charge-offs of credit card balances as a percentage of total credit card balances remained stable at 1.6% as of December 31, 2021 and 2022.
During 2021, impaired credit card balances and allowance for credit losses for credit card balances, each as a percentage of total credit card balances, decreased mainly due to a decrease in delinquency rates due to heightened credit review standards, as well as a 14.2% increase in total credit card balances from ₩8,543 billion as of December 31, 2020 to ₩9,757 billion as of December 31, 2021. However, allowance for credit losses for credit card balances as a percentage of impaired credit card balances increased, as a 1.5% decrease in our allowance for credit losses for credit card balances from ₩259 billion as of December 31, 2020 to ₩255 billion as of December 31, 2021 was outpaced by a 35.6% decrease in impaired credit card balances from ₩180 billion as of December 31, 2020 to ₩116 billion as of December 31, 2021. Net charge-offs of credit card balances as a percentage of total credit card balances decreased mainly as a result of a 13.9% decrease in net charge-offs of credit card balances from ₩180 billion as of December 31, 2020 to ₩155 billion as of December 31, 2021, primarily due to the decrease in delinquency rates due to heightened credit review standards, as well as the decrease in total credit card balances.
Net Fees and Commissions Income
The following table shows, for the years indicated, the components of our net fees and commissions income:
| Year ended December 31, | Percentage change | |||||||||||||||||||
| 2020 | 2021 | 2022 | 2021/2020 | 2022/2021 | ||||||||||||||||
| (in billions of Won) | (%) | |||||||||||||||||||
| Fees and commissions income |
₩ | 1,694 | ₩ | 2,172 | ₩ | 2,500 | 28.2 | % | 15.1 | % | ||||||||||
| Fees and commissions expense |
(680 | ) | (701 | ) | (790 | ) | 3.1 | 12.7 | ||||||||||||
|
|
|
|
|
|
|
|||||||||||||||
| Total fees and commissions income, net |
₩ | 1,014 | ₩ | 1,471 | ₩ | 1,710 | 45.1 | 16.2 | ||||||||||||
|
|
|
|
|
|
|
|||||||||||||||
Comparison of 2022 to 2021
Our net fees and commissions income increased 16.2% from ₩1,471 billion in 2021 to ₩1,710 billion in 2022, mainly due to a 15.1% increase in fees and commissions income from ₩2,172 billion in 2021 to ₩2,500 billion in 2022, which was partially offset by a 12.7% increase in fees and commissions expense from ₩701 billion in 2021 to ₩790 billion in 2022.
The 15.1% increase in fees and commissions income was primarily due to a 52.8% increase in fees and commissions related to leases from ₩375 billion in 2021 to ₩573 billion in 2022, a 3.8% increase in fees and commissions received on credit cards from ₩573 billion in 2021 to ₩595 billion in 2022 and a 23.1% increase in fees and commissions from trust management from ₩216 billion in 2021 to ₩266 billion in 2022. The increase in fees and commissions related to leases was mainly due to the increased fees and commissions received related to leases of Woori Financial Capital, the increase in fees and commissions received on credit cards was mainly attributable to an increase in credit card transactions resulting from the easing of COVID-19 social distancing requirements and the subsequent increase in consumer spending, and the increase in fees and commissions from trust management was primarily attributable to increases in compensation relating to the management of land trusts in the form of construction completion guarantees.
The 12.7% increase in fees and commissions expense was primarily due to a 24.4% increase in fees and commissions paid from ₩262 billion in 2021 to ₩326 billion in 2022. The increase in fees and commissions paid was primarily attributable to an increase in foreign currency payment related fees paid at Woori Bank and an increase in Won payment related fees paid at Woori Card.
128
Table of Contents
Comparison of 2021 to 2020
Our net fees and commissions income increased 45.1% from ₩1,014 billion in 2020 to ₩1,471 billion in 2021, mainly due to a 28.2% increase in fees and commissions income from ₩1,694 billion in 2020 to ₩2,172 billion in 2021, which was partially offset by a 3.1% increase in fees and commissions expense from ₩680 billion in 2020 to ₩701 billion in 2021.
The 28.2% increase in fees and commissions income was primarily due to a 346.4% increase in fees and commissions related to leases from ₩84 billion in 2020 to ₩375 billion in 2021, a 12.8% increase in fees and commissions received on credit cards from ₩508 billion in 2020 to ₩573 billion in 2021 and a 34.2% increase in fees and commissions from trust management from ₩161 billion in 2020 to ₩216 billion in 2021. The increase in fees and commissions related to leases was mainly due to the additional fees and commissions received related to leases attributable to the addition of Woori Financial Capital as a consolidated subsidiary starting on October 20, 2020, the increase in fees and commissions received on credit cards was mainly attributable to an increase in credit card transactions primarily due to the COVID-19 social distancing requirements and the increase in fees and commissions from trust management was primarily attributable to an increase in sales of our ELT and ETF products and increased overall activity by Woori Asset Trust.
The 3.1% increase in fees and commissions expense was primarily due to a 6.1% increase in fees and commissions paid from ₩247 billion in 2020 to ₩262 billion in 2021. The increase in fees and commissions paid was primarily attributable to the addition of Woori Financial Capital as a consolidated subsidiary starting on October 20, 2020.
For further information regarding our net fees and commissions income, see Note 31 of the notes to our consolidated financial statements included elsewhere in this annual report.
Net Gain on Financial Instruments
The following table shows, for the years indicated, the components of our net gain on financial instruments:
| Year ended December 31, | Percentage change | |||||||||||||||||||
| 2020 | 2021 | 2022 | 2021/2020 | 2022/2021 | ||||||||||||||||
| (in billions of Won) | (%) | |||||||||||||||||||
| Net gain on financial instruments at fair value through profit or loss |
₩ | 422 | ₩ | 326 | ₩ | 239 | (22.7 | )% | (26.7 | )% | ||||||||||
| Net gain (loss) on financial assets at fair value through other comprehensive income |
24 | 33 | (21 | ) | 37.5 | N/M | (1) | |||||||||||||
| Net gain arising on disposals of financial assets at amortized cost |
44 | 107 | 74 | 143.2 | (30.8 | ) | ||||||||||||||
|
|
|
|
|
|
|
|||||||||||||||
| Total net gain on financial instruments |
₩ | 490 | ₩ | 466 | ₩ | 292 | (4.9 | ) | (37.3 | ) | ||||||||||
|
|
|
|
|
|
|
|||||||||||||||
| (1) | N/M = not meaningful. |
Comparison of 2022 to 2021
Our net gain on financial instruments decreased 37.3% from ₩466 billion in 2021 to ₩292 billion in 2022. This decrease was primarily attributable to a 26.7% decrease in net gain on financial instruments at fair value through profit or loss from ₩326 billion in 2021 to ₩239 billion in 2022, and a 30.8% decrease in net gain arising on disposals of financial assets at amortized cost from ₩107 billion in 2021 to ₩74 billion in 2022.
The 26.7% decrease in net gain on financial instruments at fair value through profit or loss resulted mainly from a change from a net loss on the transaction and valuation of currency derivatives of ₩29 billion in 2021 to a net loss on the transaction and valuation of currency derivatives of ₩1,111 billion in 2022. This was offset in significant part by a change from a net gain on the transaction and valuation of interest rate derivatives of ₩273 billion in 2021 to a net gain on the transaction and valuation of interest rate derivatives of ₩1,591 billion in 2022.
129
Table of Contents
The 30.8% decrease in net gain arising on disposals of financial assets at amortized cost was primarily because in 2021 we realized gains on sales of project finance loans, but that did not occur in 2022, and also because our gains on sales of our non-performing card receivables decreased in 2022 compared to 2021.
Comparison of 2021 to 2020
Our net gain on financial instruments decreased 4.9% from ₩490 billion in 2020 to ₩466 billion in 2021. This decrease was primarily attributable to a 22.7% decrease in net gain on financial instruments at fair value through profit or loss from ₩422 billion in 2020 to ₩326 billion in 2021, which was partially offset by a 143.2% increase in net gain arising on disposals of financial assets at amortized cost from ₩44 billion in 2020 to ₩107 billion in 2021.
The 22.7% decrease in net gain on financial instruments at fair value through profit or loss resulted mainly from a change from a net gain on the transaction and valuation of currency derivatives of ₩656 billion in 2020 to a net loss on the transaction and valuation of currency derivatives of ₩29 billion in 2021. This was offset in significant part by a change from a net loss on the transaction and valuation of interest rate derivatives of ₩271 billion in 2020 to a net gain on the transaction and valuation of interest rate derivatives of ₩273 billion in 2021.
The 143.2% increase in net gain arising on disposals of financial assets at amortized cost was primarily attributable to gains realized on sales of certain of our non-performing card loans and project finance loans in 2021, which did not occur in 2020.
For further information regarding our net gain on financial instruments, see Notes 33 and 34 of the notes to our consolidated financial statements included elsewhere in this annual report.
General and Administrative Expenses
The following table shows, for the years indicated, the components of our general and administrative expenses:
| Year ended December 31, | Percentage change | |||||||||||||||||||
| 2020 | 2021 | 2022 | 2021/2020 | 2022/2021 | ||||||||||||||||
| (in billions of Won) | (%) | |||||||||||||||||||
| Employee benefits |
₩ | 2,533 | ₩ | 2,701 | ₩ | 2,912 | 6.6 | % | 7.8 | % | ||||||||||
| Depreciation and amortization |
521 | 524 | 522 | 0.6 | (0.4 | ) | ||||||||||||||
| Other general and administrative expenses |
902 | 922 | 1,096 | 2.2 | 18.9 | |||||||||||||||
|
|
|
|
|
|
|
|||||||||||||||
| General and administrative expenses |
₩ | 3,956 | ₩ | 4,147 | ₩ | 4,530 | 4.8 | 9.2 | ||||||||||||
|
|
|
|
|
|
|
|||||||||||||||
Comparison of 2022 to 2021
Our general and administrative expenses increased 9.2% from ₩4,147 billion in 2021 to ₩4,530 billion in 2022, primarily as a result of a 7.8% increase in employee benefits from ₩2,701 billion in 2021 to ₩2,912 billion in 2022, which was enhanced by a 18.9% increase in other general and administrative expenses from ₩922 billion in 2021 to ₩1,096 billion in 2022.
The 7.8% increase in employee benefits was primarily due to an 10.8% increase in short-term employee benefits, which include salaries and other employee benefits, from ₩2,321 billion in 2021 to ₩2,571 billion in 2022. Such increase was partially offset by a 6.6% decrease in termination benefits from ₩181 billion in 2021 to ₩169 billion in 2022. The increase in short-term employee benefits was principally due to an increase in employee salaries as a result of an increase in average wages. The decrease in termination benefits was due to a decrease in payments through our early retirement program.
The 18.9% increase in other general and administrative expenses was principally due to increases in advertising expenses, and expenses relating to taxes and public utilities’ charges.
130
Table of Contents
Comparison of 2021 to 2020
Our general and administrative expenses increased 4.8% from ₩3,956 billion in 2020 to ₩4,147 billion in 2021, primarily as a result of a 6.6% increase in employee benefits from ₩2,533 billion in 2020 to ₩2,701 billion in 2021, which was enhanced by a 2.2% increase in other general and administrative expenses from ₩902 billion in 2020 to ₩922 billion in 2021.
The 6.6% increase in employee benefits was primarily due to an 8.3% increase in short-term employee benefits, which include salaries and other employee benefits, from ₩2,144 billion in 2020 to ₩2,321 billion in 2021. Such increase was partially offset by a 10.4% decrease in termination benefits from ₩202 billion in 2020 to ₩181 billion in 2021. The increase in short-term employee benefits was principally due to an increase in employee salaries due to an increase in average wages as well as the number of employees primarily attributable to the addition of Woori Financial Capital as a consolidated subsidiary on October 20, 2020. The decrease in termination benefits was due to a decrease in payments through our early retirement program.
The 2.2% increase in other general and administrative expenses was principally due to increases in telephone and communication expenses, advertising expenses and building maintenance expenses.
For further information regarding our general and administrative expenses, see Note 36-(1) of the notes to our consolidated financial statements included elsewhere in this annual report.
Other Net Operating Expenses
The following table shows, for the years indicated, the components of our other net operating expenses:
| Year ended December 31, | Percentage change | |||||||||||||||||||
| 2020 | 2021 | 2022 | 2021/2020 | 2022/2021 | ||||||||||||||||
| (in billions of Won) | (%) | |||||||||||||||||||
| Other operating income |
₩ | 899 | ₩ | 903 | ₩ | 1,982 | 0.4 | % | 119.5 | % | ||||||||||
| Other operating expenses |
(1,719 | ) | (1,790 | ) | (2,994 | ) | 4.1 | 67.3 | ||||||||||||
|
|
|
|
|
|
|
|||||||||||||||
| Total other net operating expenses |
₩ | (820 | ) | ₩ | (887 | ) | ₩ | (1,012 | ) | 8.2 | % | 14.1 | % | |||||||
|
|
|
|
|
|
|
|||||||||||||||
Comparison of 2022 to 2021
Our other net operating expenses increased 14.1% from ₩887 billion in 2021 to ₩1,012 billion in 2022, as a 67.3% increase in other operating expenses from ₩1,790 billion in 2021 to ₩2,994 billion in 2022 was partially offset by a 119.5% increase in other operating income from ₩903 billion in 2021 to ₩1,982 billion in 2022.
Other operating expenses include principally losses on transaction of foreign exchange, KDIC deposit insurance premiums, contributions to miscellaneous funds, losses related to derivatives designated for hedging, losses on fair value hedged items and miscellaneous other operating expenses. The 67.3% increase in other operating expenses was primarily the result of a 162.1% increase in loss on transactions of foreign exchange from ₩451 billion in 2021 to ₩1,182 billion in 2022, and was enhanced by a 56.6% increase in miscellaneous other operating expenses from ₩470 billion in 2021 to ₩736 billion in 2022. The increase in miscellaneous other operating expenses was primarily due to an increase in lease depreciation costs from ₩251 billion in 2021 to ₩389 billion in 2022 resulting from the increase in lease depreciation costs incurred by Woori Financial Capital. The increase in losses on transaction of foreign exchange, which was principally due to higher exchange rate volatility in 2022 compared to 2021, was mostly offset by a 149.2% increase in gains on transaction of foreign exchange from ₩563 billion in 2021 to ₩1,403 billion in 2022, which is recorded as part of other operating income. On a net basis, net gain on transaction of foreign exchange increased 97.3% from ₩112 billion in 2021 to ₩221 billion in 2022.
Other operating income includes principally gains on transactions of foreign exchange, gains related to derivatives designated for hedging, gains on fair value hedged items and miscellaneous other operating income. The 119.5% increase in other operating income was mainly attributable to a 149.2% increase in gains on
131
Table of Contents
transaction of foreign exchange from ₩563 billion in 2021 to ₩1,403 billion in 2022, a 45.3% increase in miscellaneous other operating income from ₩172 billion in 2021 to ₩250 billion in 2022 and a 143.4% increase in gains on fair value hedged items from ₩106 billion in 2021 to ₩258 billion in 2022. The increase in miscellaneous other operating income was primarily due to an increase in our gains from disposals of lease assets by Woori Financial Capital. The increase in gains on transactions of foreign exchange, which was principally due to higher exchange rate volatility in 2022 compared to 2021, was partially offset by an increase in losses on transactions of foreign exchange, which is recorded as part of other operating expenses as discussed above.
Comparison of 2021 to 2020
Our other net operating expenses increased 8.2% from ₩820 billion in 2020 to ₩887 billion in 2021, as a 4.1% increase in other operating expenses from ₩1,719 billion in 2020 to ₩1,790 billion in 2021 was in small part offset by a 0.4% increase in other operating income from ₩899 billion in 2020 to ₩903 billion in 2021.
Other operating expenses include principally losses on transaction of foreign exchange, KDIC deposit insurance premiums, contributions to miscellaneous funds, losses related to derivatives designated for hedging, losses on fair value hedged items and miscellaneous other operating expenses. The 4.1% increase in other operating expenses was primarily the result of a 147.4% increase in miscellaneous other operating expenses, which was in significant part offset by a 33.6% decrease in loss on transactions of foreign exchange from ₩679 billion in 2020 to ₩451 billion in 2021. The increase in miscellaneous other operating expenses was primarily due to an increase in lease depreciation costs from ₩53 billion in 2020 to ₩251 billion in 2021 resulting from the addition of Woori Financial Capital as a consolidated subsidiary on October 20, 2020. The decrease in losses on transaction of foreign exchange, which was principally due to lower exchange rate volatility in 2021 compared to 2020, was mostly offset by a 25.7% decrease in gains on transaction of foreign exchange from ₩758 billion in 2020 to ₩563 billion in 2021, which is recorded as part of other operating income. On a net basis, net gain on transaction of foreign exchange increased 41.8% from ₩79 billion in 2020 to ₩112 billion in 2021.
Other operating income includes principally gains on transactions of foreign exchange, gains related to derivatives designated for hedging, gains on fair value hedged items and miscellaneous other operating income. The 0.4% increase in other operating income was mainly attributable to a 168.8% increase in miscellaneous other operating income from ₩64 billion in 2020 to ₩172 billion in 2021 and a significant increase in gains on fair value hedged items from ₩10 billion in 2020 to ₩106 billion in 2021, which was mostly offset by a 25.7% decrease in gains on transaction of foreign exchange from ₩758 billion in 2020 to ₩563 billion in 2021. The increase in miscellaneous other operating income was primarily due to an increase in our gains from disposals of lease assets resulting from the addition of Woori Financial Capital as a consolidated subsidiary on October 20, 2020. The decrease in gains on transactions of foreign exchange, which was principally due to lower exchange rate volatility in 2021 compared to 2020, was more than offset by a greater decrease in losses on transactions of foreign exchange, which is recorded as part of other operating expenses as discussed above.
For further information regarding our other net operating expenses, see Notes 36-(2) and (3) of the notes to our consolidated financial statements included elsewhere in this annual report.
Net Other Non-operating Expenses
The following table shows, for the years indicated, the components of our net other non-operating expenses:
| Year ended December 31, | Percentage change | |||||||||||||||||||
| 2020 | 2021 | 2022 | 2021/2020 | 2022/2021 | ||||||||||||||||
| (in billions of Won) | (%) | |||||||||||||||||||
| Other non-operating income |
₩ | 133 | ₩ | 188 | ₩ | 159 | 41.4 | % | (15.4 | )% | ||||||||||
| Other non-operating expenses |
(313 | ) | (223 | ) | (112 | ) | (28.8 | ) | (49.8 | ) | ||||||||||
|
|
|
|
|
|
|
|||||||||||||||
| Total net other non-operating income (expenses) |
₩ | (180 | ) | ₩ | (35 | ) | ₩ | 47 | (80.6 | )% | N/M | (1) | ||||||||
|
|
|
|
|
|
|
|||||||||||||||
| (1) | N/M = not meaningful. |
132
Table of Contents
Comparison of 2022 to 2021
The change from a net other non-operating expenses of ₩35 to a net other non-operating income of ₩47 is resulted by a 49.8% decrease in other non-operating expenses from ₩223 billion in 2021 to ₩112 billion in 2022, and a 15.4% decrease in other non-operating income from ₩188 billion in 2021 to ₩159 billion in 2022.
Other non-operating expenses include principally depreciation on investment properties, operating expenses on investment properties, losses on disposal of investments in joint ventures and associates, losses on disposal of premises and equipment, intangible assets and other assets, impairment losses on premises and equipment, intangible assets and other assets, donations and miscellaneous other non-operating expenses. The 49.8% decrease in other non-operating expenses from ₩223 billion in 2021 to ₩112 billion in 2022 was mainly attributable to a misappropriation of funds from Woori Bank by one of its employees in 2012, 2015 and 2018, which was discovered in April 2022 and recorded as a non-operating expense for 2021.
Other non-operating income includes principally rental fee income, gain on disposal of investment in joint ventures and associates, gain on disposal of premises and equipment, intangible assets and other assets, reversal of impairment loss on premises and equipment, intangible assets and other assets and miscellaneous other non-operating income. The 15.4% decrease in other non-operating income was primarily attributable to a significant decrease in gains on disposal of investment in joint ventures and associates from ₩71 billion in 2021 to ₩1 billion in 2022, which was partially offset by a 9.8% increase in gains on disposal of premises and equipment, intangible assets and other assets from ₩51 billion in 2021 to ₩56 billion in 2022, and a 54.9% increase in miscellaneous other non-operating income from ₩51 billion in 2021 to ₩79 billion in 2022. The decrease in gains on disposal of investment in joint ventures and associates was mainly due to gains in 2021 from our decrease in share ownership interest in Kbank resulting from our non-participation in the capital increase of Kbank, but similar transactions did not occur in 2022, and the increase in gains on disposal of premises and equipment, intangible assets and other assets was primarily due to the sale of Woori Bank’s real estate assets. The increase in miscellaneous other non-operating income was principally due to the return of settlement reserves relating to the U.S. sanctions and Lime investigations. See “Item 3.D. Other Risks Relating to Our Business” and “Item 8.A. Consolidated Statements and Other Financial Information—Legal Proceedings and Regulatory Actions.”
Comparison of 2021 to 2020
The change from a net other non-operating expenses of ₩180 to a net other non-operating income of ₩35 is resulted by a 28.8% decrease in other non-operating expenses from ₩313 billion in 2020 to ₩223 billion in 2021 was enhanced by a 41.4% increase in other non-operating income from ₩133 billion in 2020 to ₩188 billion in 2021.
Other non-operating expenses include principally depreciation on investment properties, operating expenses on investment properties, losses on disposal of premises and equipment, intangible assets and other assets, impairment losses on premises and equipment, intangible assets and other assets, donations and miscellaneous other non-operating expenses. The 28.8% decrease in other non-operating expenses was mainly attributable to a 55.5% decrease in miscellaneous other non-operating expenses from ₩254 billion in 2020 to ₩113 billion in 2021, which was primarily due to provisions relating to the estimated reimbursements and other payments in connection with Woori Bank’s sale of trade finance funds managed by Lime Asset Management Co. as well as derivative-linked fund and securities products tied to yields on treasury bonds of Germany and the United Kingdom. See “Item 8.A. Consolidated Statements and Other Financial Information—Legal Proceedings and Regulatory Actions.” Such decrease was partially offset by provisions relating to the misappropriation of funds from Woori Bank by one of its employees in 2012, 2015 and 2018, which was discovered in April 2022 and recorded as a non-operating expense for 2021.
Other non-operating income includes principally rental fee income, gain on disposal of investment in joint ventures and associates, gain on disposal of premises and equipment, intangible assets and other assets, reversal of impairment loss on premises and equipment, intangible assets and other assets and miscellaneous other non-operating income. The 41.4% increase in other non-operating income was primarily attributable to a
133
Table of Contents
significant increase in gains on disposal of investment in joint ventures and associates from ₩3 billion in 2020 to ₩71 billion in 2021 and a 410.0% increase in gains on disposal of premises and equipment, intangible assets and other assets from ₩10 billion in 2020 to ₩51 billion in 2021, which was partially offset by a 51.4% decrease in miscellaneous other non-operating income from ₩105 billion in 2020 to ₩51 billion in 2021. The increase in gains on disposal of investment in joint ventures and associates was mainly attributable to our non-participation in the capital increase of Kbank, in accordance with the decrease in our share of ownership interest in Kbank, and the increase in gains on disposal of premises and equipment, intangible assets and other assets was primarily due to our sale of equity assets obtained from debt-equity swaps. The decrease in miscellaneous other non-operating income was principally due to additional income of ₩67 billion in 2020 from the liquidation of funds and bargain purchases resulting from the addition of Woori Financial Capital as a consolidated subsidiary on October 20, 2020, that was not repeated in 2021.
For further information regarding our net other non-operating income (expenses), see Notes 37-(3) and (4) of the notes to our consolidated financial statements included elsewhere in this annual report.
Share of Gain (Loss) on Joint Ventures and Associates
Comparison of 2022 to 2021
Our share of gain on joint ventures and associates increased 12.9% from ₩62 billion 2021 to ₩70 billion in 2022. Such increase was primarily due to a 23.8% increase in our gains on valuation of investments in joint ventures and associates from ₩80 billion in 2021 to ₩99 billion in 2022, resulting mainly from an increase in the share of profits from Lotte Card Co., Ltd.
Comparison of 2021 to 2020
Our share of gain on joint ventures and associates decreased 38.6% from ₩101 billion 2020 to ₩62 billion in 2021. Such decrease was primarily due to a 36.5% decrease in our gains on valuation of investments in joint ventures and associates from ₩126 billion in 2020 to ₩80 billion in 2021, resulting mainly from the liquidation of our Well to Sea No.3 Private Equity Fund in 2020.
For further information regarding our investments in joint ventures and associates, see Note 13 of the notes to our consolidated financial statements included elsewhere in this annual report.
Income Tax Expense
Our income tax expense is calculated by adding or subtracting changes in deferred income tax liabilities and assets to income tax amounts payable for the period. Deferred tax assets are recognized for deductible temporary differences, including operating losses and tax credit carry-forwards, while deferred tax liabilities are recognized for taxable temporary differences. Temporary differences are those between the carrying values of assets and liabilities for financial reporting purposes and their tax bases. Deferred tax assets, including the carry-forwards of unused tax losses, are recognized to the extent it is probable that the deferred tax assets will be realized.
Comparison of 2022 to 2021
Income tax expense increased 27.4% from ₩925 billion in 2021 to ₩1,178 billion in 2022, mainly as a result of a 23.4% increase in our net income before income tax expense from ₩3,687 billion in 2021 to ₩4,548 billion in 2022. Our effective tax rate was 25.1% in 2021 and 25.9% in 2022.
Comparison of 2021 to 2020
Income tax expense increased 90.3% from ₩486 billion in 2020 to ₩925 billion in 2021, mainly as a result of an 87.4% increase in our net income before income tax expense from ₩2,001 billion in 2020 to ₩3,687 billion in 2021. Our effective tax rate was 24.3% in 2020 and 25.1% in 2021.
For further information regarding our income tax expense, see Note 38 of the notes to our consolidated financial statements included elsewhere in this annual report.
134
Table of Contents
Net Income
Comparison of 2022 to 2021
Due to the factors described above, our net income increased by 22.0% from ₩2,762 billion in 2021 to ₩3,369 billion in 2022.
Comparison of 2021 to 2020
Due to the factors described above, our net income increased by 82.3% from ₩1,515 billion in 2020 to ₩2,762 billion in 2021.
Results by Principal Business Segment
We compile and analyze financial information for our business segments based upon segment information used by our management for the purposes of resource allocation and performance evaluation. We currently have five operational business segments: banking, credit card, capital, investment banking and other operations. We have added capital as a new business segment following our acquisition of Woori Financial Capital Co., Ltd. (formerly known as Aju Capital Co., Ltd.) in December 2020.
The following table shows, for the years indicated, our results of operations by segment:
| Net income Year ended December 31, |
Net operating income(1) Year ended December 31, |
|||||||||||||||||||||||
| 2020 | 2021 | 2022 | 2020 | 2021 | 2022 | |||||||||||||||||||
| (in billions of Won) | ||||||||||||||||||||||||
| Banking |
₩ | 1,417 | ₩ | 2,340 | ₩ | 2,949 | ₩ | 1,911 | ₩ | 3,073 | ₩ | 3,783 | ||||||||||||
| Credit card |
120 | 201 | 205 | 165 | 281 | 285 | ||||||||||||||||||
| Capital |
— | 141 | 183 | — | 190 | 252 | ||||||||||||||||||
| Investment banking |
63 | 80 | 92 | 70 | 104 | 123 | ||||||||||||||||||
| Others |
652 | 667 | 1,265 | 681 | 681 | 1,292 | ||||||||||||||||||
|
|
|
|
|
|
|
|
|
|
|
|
|
|||||||||||||
| Total(2) |
₩ | 2,252 | ₩ | 3,429 | ₩ | 4,694 | ₩ | 2,827 | ₩ | 4,329 | ₩ | 5,735 | ||||||||||||
|
|
|
|
|
|
|
|
|
|
|
|
|
|||||||||||||
| (1) | Comprises net interest income and net non-interest income after administrative expenses and impairment losses due to credit losses. |
| (2) | Before adjustments for consolidation, inter-segment transactions and certain differences in classification under our management reporting system. |
135
Table of Contents
Banking
This segment primarily consists of the banking operations of Woori Bank and its overseas subsidiaries. Woori Bank provides a wide range of banking and other financial services to large corporations, small- and medium-sized enterprises and individuals in Korea. The following table shows, for the years indicated, our income statement data for this segment:
| Year ended December 31, | Percentage change | |||||||||||||||||||
| 2020 | 2021 | 2022 | 2021/2020 | 2022/2021 | ||||||||||||||||
| (in billions of Won) | (%) | |||||||||||||||||||
| Income statement data |
||||||||||||||||||||
| Net interest income |
₩ | 4,545 | ₩ | 5,158 | ₩ | 6,604 | 13.5 | % | 28.0 | % | ||||||||||
| Non-interest income |
1,423 | 1,662 | 1,521 | 16.8 | (8.5 | ) | ||||||||||||||
| Provision for impairment losses due to credit loss and others |
(512 | ) | (140 | ) | (427 | ) | (72.7 | ) | 205.0 | |||||||||||
| General administrative expenses |
(3,545 | ) | (3,607 | ) | (3,915 | ) | 1.7 | 8.5 | ||||||||||||
|
|
|
|
|
|
|
|||||||||||||||
| Net operating income |
1,911 | 3,073 | 3,783 | 60.8 | 23.1 | |||||||||||||||
| Non-operating income (expense) |
(57 | ) | 40 | 142 | N/M | (1) | 255.0 | |||||||||||||
|
|
|
|
|
|
|
|||||||||||||||
| Net income before tax |
1,854 | 3,113 | 3,925 | 67.9 | 26.1 | |||||||||||||||
| Tax expense |
(437 | ) | (773 | ) | (976 | ) | 76.9 | 26.3 | ||||||||||||
|
|
|
|
|
|
|
|||||||||||||||
| Net income |
₩ | 1,417 | ₩ | 2,340 | ₩ | 2,949 | 65.1 | 26.0 | ||||||||||||
|
|
|
|
|
|
|
|||||||||||||||
| (1) | N/M = not meaningful. |
Comparison of 2022 to 2021
Our net income before tax for this segment increased 26.1% from ₩3,113 billion in 2021 to ₩3,925 billion in 2022. Net income after tax also increased 26.0% from ₩2,340 billion in 2021 to ₩2,949 billion in 2022.
Net interest income for this segment increased 28.0% from ₩5,158 billion in 2021 to ₩6,604 billion in 2022, primarily reflecting the increase in the average balance of loans, which was offset in part by the increase in the average balance of deposits, mainly reflecting the increased demand for such products from customers as discussed above, and the higher interest rates prevailing in Korea in 2022 compared to 2021. The impact of such increase was partially offset by the average cost of deposits and other sources of funding resulting from higher overall interest rates prevailing in Korea in 2022 compared to 2021.
Non-interest income attributable to this segment decreased 8.5% from ₩1,662 billion in 2021 to ₩1,521 billion in 2022, primarily due to losses incurred from the disposal of stock and equity capital, decrease in the valuation of our holdings of stock and equity capital and a decrease in dividend income, which was mainly attributable to decreases in dividends from stock and equity capital.
Impairment losses due to credit loss and others for this segment increased by 205.0% from ₩140 billion in 2021 to ₩427 billion in 2022, primarily due to our preemptive measures in 2022 to account for a potential increase in expected credit loss that could result from a deterioration in the overall asset quality of our corporate and consumer loan portfolios caused by the potentially adverse economic conditions in Korea and globally in 2023 and beyond.
General administrative expenses attributable to this segment increased 8.5% from ₩3,607 billion in 2021 to ₩3,915 billion in 2022, mainly due to increases in our employee salaries, advertising expenses, and computer and IT related expenses.
Non-operating income (expense) for this segment changed from net expense of ₩40 billion in 2021 to net income of ₩142 billion in 2022, primarily due to the misappropriation of funds from Woori Bank by one of its employees in 2012, 2015 and 2018, which was discovered in April 2022 and recorded as a non-operating expense for 2021, and the increase in valuation of investments in joint ventures and associates.
136
Table of Contents
Comparison of 2021 to 2020
Our net income before tax for this segment increased 67.9% from ₩1,854 billion in 2020 to ₩3,113 billion in 2021. Net income after tax also increased 65.1% from ₩1,417 billion in 2020 to ₩2,340 billion in 2021.
Net interest income for this segment increased 13.5% from ₩4,545 billion in 2020 to ₩5,158 billion in 2021, primarily reflecting the increase in the average balance of loans, which was offset in part by the increase in the average balance of deposits, mainly reflecting the increased demand for such products from customers as discussed above. The impact of such increase was partially offset by decreases in the average yield on loans and the average cost of deposits, respectively, principally as a result of the lower overall level of interest rates prevailing in Korea in 2021 compared to 2020.
Non-interest income attributable to this segment increased 16.8% from ₩1,423 billion in 2020 to ₩1,662 billion in 2021, primarily due to an increase in net fees and commissions income, which was mainly due to increases in fees and commissions from trust management, an increase in dividend income, which was mainly attributable to increases in dividends from stock and equity capital, and an increase in gains from our sales of trade receivables.
Impairment losses due to credit loss and others for this segment decreased by 72.7% from ₩512 billion in 2020 to ₩140 billion in 2021, primarily due to increases in provision for loan losses in respect of our corporate and consumer loan portfolios in 2020 which significantly decreased in 2021. Such increases in 2020 were mainly attributable to our preemptive measures to account for a potential increase in expected credit loss that could result from a deterioration in the overall asset quality of our corporate and consumer loan portfolios due to the COVID-19 pandemic.
General administrative expenses attributable to this segment increased 1.7% from ₩3,545 billion in 2020 to ₩3,607 billion in 2021, mainly due to increases in salaries and computer and IT related expenses.
Non-operating income (expense) for this segment changed from net expense of ₩57 billion in 2020 to net income of ₩40 billion in 2021, primarily due to provisions relating to the estimated reimbursements and other payments in connection with Woori Bank’s sale of trade finance funds managed by Lime Asset Management Co. as well as derivative-linked fund and securities products tied to yields on treasury bonds of Germany and the United Kingdom that were incurred in 2020 but not repeated in 2021. Such change was partially offset by provisions relating to the misappropriation of funds from Woori Bank by one of its employees in 2012, 2015 and 2018, which was discovered in April 2022 and recorded as a non-operating expense for 2021.
137
Table of Contents
Credit Card
This segment consists of the credit card operations of Woori Card. Woori Card offers credit card products and services mainly to consumers and corporate customers in Korea. The following table shows, for the years indicated, our income statement data for this segment:
| Year ended December 31, | Percentage change | |||||||||||||||||||
| 2020 | 2021 | 2022 | 2021/2020 | 2022/2021 | ||||||||||||||||
| (in billions of Won) | (%) | |||||||||||||||||||
| Income statement data |
||||||||||||||||||||
| Net interest income |
₩ | 564 | ₩ | 606 | ₩ | 675 | 7.4 | % | 11.4 | % | ||||||||||
| Non-interest income |
4 | 64 | 111 | N/M | (1) | 73.4 | ||||||||||||||
| Provision for impairment losses due to credit loss and others |
(196 | ) | (164 | ) | (239 | ) | (16.3 | ) | 45.7 | |||||||||||
| General administrative expenses |
(207 | ) | (225 | ) | (262 | ) | 8.7 | 16.4 | ||||||||||||
|
|
|
|
|
|
|
|||||||||||||||
| Net operating income |
165 | 281 | 285 | 70.3 | 1.4 | |||||||||||||||
| Non-operating expense |
(6 | ) | (8 | ) | (6 | ) | 33.3 | (25.0 | ) | |||||||||||
|
|
|
|
|
|
|
|||||||||||||||
| Net income before tax |
159 | 273 | 279 | 71.7 | 2.2 | |||||||||||||||
| Tax expense |
(39 | ) | (72 | ) | (74 | ) | 84.6 | 2.8 | ||||||||||||
|
|
|
|
|
|
|
|||||||||||||||
| Net income |
₩ | 120 | ₩ | 201 | ₩ | 205 | 67.5 | 2.0 | ||||||||||||
|
|
|
|
|
|
|
|||||||||||||||
| (1) | N/M = not meaningful. |
Comparison of 2022 to 2021
Our net income before tax for this segment increased 2.2% from ₩273 billion in 2021 to ₩279 billion in 2022. Net income after tax also increased 2.0% from ₩201 billion in 2021 to ₩205 billion in 2022.
Net interest income for this segment increased 11.4% from ₩606 billion in 2021 to ₩675 billion in 2022, primarily due to an increase in the average volume of credit card receivables and financial assets receivables.
Non-interest income attributable to this segment increased 73.4% from ₩64 billion in 2021 to ₩111 billion in 2022, mainly due to an increase in fees and commissions received on credit cards resulting from increased consumer spending following the recovery from the COVID-19 pandemic.
Impairment losses due to credit loss and others for this segment increased 45.7% from ₩164 billion in 2021 to ₩239 billion in 2022, primarily as a result of an increase in financial assets receivables and preemptive measures to account for a potential increase in expected credit loss caused by an increase in delinquency rates.
General administrative expenses attributable to this segment increased 16.4% from ₩225 billion in 2021 to ₩262 billion in 2022, mainly due to increases in employee salaries.
Non-operating expense for this segment decreased from ₩8 billion in 2021 to ₩6 billion in 2022, mainly as a result of a decrease in miscellaneous fees and commissions paid.
Comparison of 2021 to 2020
Our net income before tax for this segment increased 71.7% from ₩159 billion in 2020 to ₩273 billion in 2021. Net income after tax also increased 67.5% from ₩120 billion in 2020 to ₩201 billion in 2021.
Net interest income for this segment increased 7.4% from ₩564 billion in 2020 to ₩606 billion in 2021, primarily due to an increase in the average volume of credit card receivables, including cash advances and credit card loans, which was offset in part by a decrease in the average yield on such receivables.
Non-interest income attributable to this segment increased significantly from ₩4 billion in 2020 to ₩64 billion in 2021, mainly due to an increase in fees and commissions received on credit cards resulting from increased consumer spending following a recovery from the COVID-19 pandemic.
138
Table of Contents
Impairment losses due to credit loss and others for this segment decreased 16.3% from ₩196 billion in 2020 to ₩164 billion in 2021, primarily as a result of a decrease in delinquency rates due to heightened credit review standards.
General administrative expenses attributable to this segment increased 8.7% from ₩207 billion in 2020 to ₩225 billion in 2021, mainly due to increases in salaries.
Non-operating expense for this segment increased from ₩6 billion in 2020 to ₩8 billion in 2021, mainly as a result of an increase in miscellaneous fees and commissions paid.
Capital
This segment consists of the capital operations of Woori Financial Capital, and was newly established beginning in 2021 following our acquisition of Woori Financial Capital Co., Ltd. (formerly known as Aju Capital Co., Ltd.). Woori Financial Capital mainly provides installment finance services and loan services including lease financing. The following table shows, for the year indicated, our income statement data for this segment:
| Year ended December 31, | Percentage change | |||||||||||
| 2021 | 2022 | 2022/2021 | ||||||||||
| (in billions of Won) | (%) | |||||||||||
| Income statement data |
||||||||||||
| Net interest income |
₩ | 316 | ₩ | 376 | 19.0 | % | ||||||
| Non-interest income |
95 | 83 | (12.6 | ) | ||||||||
| Provision for impairment losses due to credit loss and others |
(122 | ) | (107 | ) | (12.3 | ) | ||||||
| General administrative expenses |
(99 | ) | (100 | ) | 1.0 | |||||||
|
|
|
|
|
|
|
|||||||
| Net operating income |
190 | 252 | 32.6 | |||||||||
| Non-operating expense |
(16 | ) | (1 | ) | N/M | (1) | ||||||
|
|
|
|
|
|
|
|||||||
| Net income before tax |
174 | 251 | 44.3 | |||||||||
| Tax expense |
(33 | ) | (68 | ) | 106.1 | |||||||
|
|
|
|
|
|
|
|||||||
| Net income |
₩ | 141 | ₩ | 183 | 29.8 | |||||||
|
|
|
|
|
|
|
|||||||
| (1) | N/M = not meaningful. |
Comparison of 2022 to 2021
Our net income before tax for this segment increased 44.3% from ₩174 billion in 2021 to ₩251 billion in 2022. Net income after tax also increased 29.8% from ₩141 billion in 2021 to ₩183 billion in 2022.
Net interest income for this segment increased 19.0% from ₩316 billion in 2021 to ₩376 billion in 2022, primarily due to higher overall level of interest rates prevailing in Korea in 2022 compared to 2021 and an increase in the size of our loan portfolio.
Non-interest income attributable to this segment decreased 12.6% from ₩95 billion in 2021 to ₩83 billion in 2022, mainly due to a decrease in gains from our invested assets.
Impairment losses due to credit loss and others for this segment decreased 12.3% from ₩122 billion in 2021 to ₩107 billion in 2022, primarily as a result of the sizeable measures taken for the first time in 2021 to account for a potential increase in expected credit loss relating to corporate loans, but similar measures of this scale were not taken in 2022.
General administrative expenses attributable to this segment increased 1.0% from ₩99 billion in 2021 to ₩100 billion in 2022, mainly due to an increase in advertising and sales promotion expenses.
Non-operating expense (income) for this segment changed from net expense of ₩16 billion in 2021 to net income of ₩1 billion in 2022, mainly as a result of losses sustained from the sale of Woori Savings Bank to Woori Financial Group in 2021, but similar transactions did not occur in 2022.
139
Table of Contents
Investment Banking
This segment consists of the investment banking operations of Woori Investment Bank. Woori Investment Bank mainly provides project finance, structured finance, merger and acquisition financing and financial advisory services. The following table shows, for the years indicated, our income statement data for this segment:
| Year ended December 31, | Percentage change | |||||||||||||||||||
| 2020 | 2021 | 2022 | 2021/2020 | 2022/2021 | ||||||||||||||||
| (in billions of Won) | (%) | |||||||||||||||||||
| Income statement data |
||||||||||||||||||||
| Net interest income |
₩ | 78 | ₩ | 108 | ₩ | 118 | 38.5 | % | 9.3 | % | ||||||||||
| Non-interest income |
34 | 49 | 83 | 44.1 | 69.4 | |||||||||||||||
| Provision for impairment losses due to credit loss and others |
(4 | ) | (2 | ) | (16 | ) | (50.0 | ) | 700.0 | |||||||||||
| General administrative expenses |
(38 | ) | (51 | ) | (62 | ) | 34.2 | 21.6 | ||||||||||||
|
|
|
|
|
|
|
|||||||||||||||
| Net operating income |
70 | 104 | 123 | 48.6 | 18.3 | |||||||||||||||
| Non-operating expense |
(1 | ) | — | (1 | ) | (100.0 | ) | 100.0 | ||||||||||||
|
|
|
|
|
|
|
|||||||||||||||
| Net income before tax |
69 | 104 | 122 | 50.7 | 17.3 | |||||||||||||||
| Tax expense |
(6 | ) | (24 | ) | (30 | ) | 300.0 | 25.0 | ||||||||||||
|
|
|
|
|
|
|
|||||||||||||||
| Net income |
₩ | 63 | ₩ | 80 | ₩ | 92 | 27.0 | 15.0 | ||||||||||||
|
|
|
|
|
|
|
|||||||||||||||
Comparison of 2022 to 2021
Our net income before tax for this segment increased 17.3% from ₩104 billion in 2021 to ₩122 billion in 2022. Net income after tax also increased 15.0% from ₩80 billion in 2021 to ₩92 billion in 2022.
Net interest income for this segment, which consists mainly of interest income from financing provided to corporations, increased 9.3% from ₩108 billion in 2021 to ₩118 billion in 2022, primarily reflecting an increase in the average balance of such financing provided to corporate customers.
Non-interest income attributable to this segment increased 69.4% from ₩49 billion in 2021 to ₩83 billion in 2022, mainly due to an increase in fees received from our investment banking activities.
Impairment losses due to credit loss and others for this segment increased 700.0% from ₩2 billion in 2021 to ₩16 billion in 2022, primarily as a result of our preemptive measures in 2022 to account for a potential increase in expected credit loss that could result from a deterioration in the overall asset quality caused by the potentially adverse economic conditions in Korea and globally in 2023 and beyond.
General administrative expenses attributable to this segment increased 21.6% from ₩51 billion in 2021 to ₩62 billion in 2022, mainly due to an increase in salaries resulting from an increase in the number of our employees due to the expansion of our investment banking business.
Comparison of 2021 to 2020
Our net income before tax for this segment increased 50.7% from ₩69 billion in 2020 to ₩104 billion in 2021. Net income after tax also increased 27.0% from ₩63 billion in 2020 to ₩80 billion in 2021.
Net interest income for this segment, which consists mainly of interest income from financing provided to corporations, increased 38.5% from ₩78 billion in 2020 to ₩108 billion in 2021, primarily reflecting an increase in the average balance of such financing provided to corporate customers.
Non-interest income attributable to this segment increased 44.1% from ₩34 billion in 2020 to ₩49 billion in 2021, mainly due to an increase in fees received from our investment banking activities.
Impairment losses due to credit loss and others for this segment decreased 50.0% from ₩4 billion in 2020 to ₩2 billion in 2021, primarily as a result of an expected improvement in the overall asset quality of loans in this segment following a recovery from the COVID-19 pandemic.
140
Table of Contents
General administrative expenses attributable to this segment increased 34.2% from ₩38 billion in 2020 to ₩51 billion in 2021, mainly due to an increase in salaries resulting from an increase in the number of our employees due to the expansion of our investment banking business.
Others
Other operations include the operations of Woori Financial Group and all of our subsidiaries (other than Woori Bank, Woori Card, Woori Financial Capital and Woori Investment Bank), including Woori Asset Trust, Woori Asset Management, Woori Credit Information, Woori Fund Service, Woori Private Equity Asset Management, Woori Global Asset Management, Woori FIS and Woori Finance Research. The following table shows, for the years indicated, our income statement data for this segment:
| Year ended December 31, | Percentage change | |||||||||||||||||||
| 2020 | 2021 | 2022 | 2021/2020 | 2022/2021 | ||||||||||||||||
| (in billions of Won) | (%) | |||||||||||||||||||
| Income statement data |
||||||||||||||||||||
| Net interest income |
₩ | 69 | ₩ | 30 | ₩ | 74 | (56.5 | )% | 146.7 | % | ||||||||||
| Non-interest income |
1,072 | 1,111 | 1,750 | 3.6 | 57.5 | |||||||||||||||
| Provision for impairment losses due to credit loss and others |
(44 | ) | (20 | ) | (38 | ) | (54.5 | ) | 90.0 | |||||||||||
| General administrative expenses |
(416 | ) | (440 | ) | (494 | ) | 5.8 | 12.3 | ||||||||||||
|
|
|
|
|
|
|
|||||||||||||||
| Net operating income |
681 | 681 | 1,292 | 0.0 | 89.7 | |||||||||||||||
| Non-operating income |
1 | 3 | — | 200.0 | (100.0 | ) | ||||||||||||||
|
|
|
|
|
|
|
|||||||||||||||
| Net income before tax |
682 | 684 | 1,292 | 0.3 | 88.9 | |||||||||||||||
| Tax expense |
(30 | ) | (17 | ) | (27 | ) | (43.3 | ) | 58.8 | |||||||||||
|
|
|
|
|
|
|
|||||||||||||||
| Net income |
₩ | 652 | ₩ | 667 | ₩ | 1,265 | 2.3 | 89.7 | ||||||||||||
|
|
|
|
|
|
|
|||||||||||||||
Comparison of 2022 to 2021
Our net income before tax for this segment increased 88.9% from ₩684 billion in 2021 to ₩1,292 billion in 2022. Net income after tax increased 89.7% from ₩667 billion in 2021 to ₩1,265 billion in 2022.
Net interest income for this segment increased 146.7% from ₩30 billion in 2021 to ₩74 billion in 2022, primarily due to an increase in interest income resulting from our addition of Woori Financial F&I as a consolidated subsidiary in January 2022 and an increase in interest income at Woori Savings Bank from higher interest rates and increased loan volume in 2022.
Non-interest income attributable to this segment increased 57.5% from ₩1,111 billion in 2021 to ₩1,750 billion in 2022, primarily as a result of increases in trust fees and management fees.
Impairment losses due to credit loss and others for this segment increased 90.0% from ₩20 billion in 2021 to ₩38 billion in 2022, primarily as a result of our preemptive measures in 2022 to account for a potential increase in expected credit loss that could result from a deterioration in the overall asset quality caused by the potentially adverse economic conditions in Korea and globally in 2023 and beyond.
General administrative expenses attributable to this segment increased 12.3% from ₩440 billion in 2021 to ₩494 billion in 2022, mainly due to increases in salaries resulting from an increase in the number of IT related employees at Woori FIS Co., Ltd. and the establishment of our consolidated subsidiary Woori Financial F&I in January 2022, and increases in IT related depreciation and other costs.
Comparison of 2021 to 2020
Our net income before tax for this segment increased 0.3% from ₩682 billion in 2020 to ₩684 billion in 2021. Net income after tax increased 2.3% from ₩652 billion in 2020 to ₩667 billion in 2021.
141
Table of Contents
Net interest income for this segment decreased 56.5% from ₩69 billion in 2020 to ₩30 billion in 2021, primarily due to the loss of net interest income of Woori Financial Capital as a result of the recognition of capital as a separate segment beginning in 2021.
Non-interest income attributable to this segment increased 3.6% from ₩1,072 billion in 2020 to ₩1,111 billion in 2021, primarily as a result of increases in trust fees and management fees, which more than offset the impact of the recognition of capital as a separate segment beginning in 2021.
Impairment losses due to credit loss and others for this segment decreased 54.5% from ₩44 billion in 2020 to ₩20 billion in 2021, primarily as a result of an expected improvement in the overall asset quality of the loans included in this segment due to recovery from the COVID-19 pandemic, as well as the recognition of capital as a separate segment beginning in 2021.
General administrative expenses attributable to this segment increased 5.8% from ₩416 billion in 2020 to ₩440 billion in 2021, mainly due to increases in salaries resulting from an increase in the number of our employees.
142
Table of Contents
| Item 5.B. | Liquidity and Capital Resources |
Financial Condition
Assets
The following table sets forth, as of the dates indicated, the principal components of our assets:
| As of December 31, | Percentage change | |||||||||||
| 2021 | 2022 | 2022/2021 | ||||||||||
| (in billions of Won) | (%) | |||||||||||
| Cash and cash equivalents |
₩ | 20,613 | ₩ | 34,219 | 66.0 | % | ||||||
| Financial assets at fair value through profit or loss |
13,497 | 19,861 | 47.2 | |||||||||
| Financial assets at fair value through other comprehensive income |
39,120 | 33,085 | (15.4 | ) | ||||||||
| Securities at amortized cost |
17,086 | 28,268 | 65.4 | |||||||||
| Loans and other financial assets at amortized cost: |
348,886 | 355,761 | 2.0 | |||||||||
| Due from banks(2) |
2,867 | 2,995 | 4.5 | |||||||||
| Loans(2) |
336,800 | 343,919 | 2.1 | |||||||||
| Loans in local currency |
273,284 | 282,687 | 3.4 | |||||||||
| Loans in foreign currencies |
24,508 | 26,988 | 10.1 | |||||||||
| Domestic banker’s usance |
3,403 | 2,877 | (15.5 | ) | ||||||||
| Credit card accounts |
9,757 | 10,370 | 6.3 | |||||||||
| Bills bought in foreign currencies |
5,310 | 3,651 | (31.2 | ) | ||||||||
| Bills bought in local currency |
265 | 534 | 101.5 | |||||||||
| Factoring receivables |
18 | 25 | 38.9 | |||||||||
| Advances for customers on guarantees |
27 | 26 | (3.7 | ) | ||||||||
| Privately placed bonds |
519 | 486 | (6.4 | ) | ||||||||
| Securitized loans |
2,875 | 2,991 | 4.0 | |||||||||
| Call loans |
3,481 | 3,626 | 4.2 | |||||||||
| Bonds purchased under resale agreements |
10,333 | 6,849 | (33.7 | ) | ||||||||
| Financial lease receivables |
1,174 | 1,468 | 25.0 | |||||||||
| Installment financial bonds |
2,882 | 2,833 | (1.7 | ) | ||||||||
| Others |
— | — | N/M | (1) | ||||||||
| Loan origination costs and fees |
858 | 852 | (0.7 | ) | ||||||||
| Discounted present value |
(7 | ) | (10 | ) | 42.9 | |||||||
| Loss allowance |
(1,887 | ) | (2,334 | ) | 23.7 | |||||||
| Other financial assets (other receivables)(2) |
9,219 | 8,847 | (4.0 | ) | ||||||||
| Investments in joint ventures and associates |
1,335 | 1,306 | (2.2 | ) | ||||||||
| Investment properties |
389 | 388 | (0.3 | ) | ||||||||
| Premises and equipment |
3,175 | 3,143 | (1.0 | ) | ||||||||
| Other assets(3) |
3,083 | 4,443 | 44.1 | |||||||||
|
|
|
|
|
|||||||||
| Total assets |
₩ | 447,184 | ₩ | 480,474 | 7.4 | |||||||
|
|
|
|
|
|||||||||
| (1) | N/M = not meaningful. |
| (2) | Net of allowance for credit losses. |
| (3) | Includes intangible assets and goodwill, assets held for distribution (sale), net defined benefit assets, current tax assets, deferred tax assets, derivative assets designated for hedging and other assets. |
For further information on our assets, see “Item 4.B. Business Overview—Assets and Liabilities.”
Our total assets increased 7.4% from ₩447,184 billion as of December 31, 2021 to ₩480,474 billion as of December 31, 2022, principally due to a 66% increase in cash and cash equivalents from ₩20,613 billion as of December 31, 2021 to ₩34,219 billion as of December 31, 2022 and a 65.4% increase in securities at amortized
143
Table of Contents
cost from ₩17,086 billion as of December 31, 2021 to ₩28,268 billion as of December 31, 2022, which was enhanced by a 2.1% increase in loans from ₩336,800 billion as of December 31, 2021 to ₩343,919 billion as of December 31, 2022.
The increase in loans was primarily attributable to a 3.4% increase in loans in local currency from ₩273,284 billion as of December 31, 2021 to ₩282,687 billion as of December 31, 2022, which was enhanced by a 10.1% increase in loans in foreign currencies from ₩24,508 billion as of December 31, 2021 to ₩26,988 billion as of December 31, 2022, a 6.3% increase in credit card accounts from ₩9,757 billion as of December 31, 2021 to ₩10,370 billion as of December 31, 2022, a 4.0% increase in securitized loans from ₩2,875 billion as of December 31, 2021 to ₩2,991 billion as of December 31, 2022 and a 4.2% increase in call loans from ₩3,481 billion as of December 31, 2021 to ₩3,626 billion as of December 31, 2022.
The decrease in financial assets at fair value through other comprehensive income was primarily attributable to a 15.7% decrease in debt securities from ₩38,127 billion as of December 31, 2021 to ₩32,146 billion as of December 31, 2022. Such decrease in debt securities was principally due to a decrease in debt securities from financial institutions.
Liabilities and Equity
The following table sets forth, as of the dates indicated, the principal components of our liabilities and our equity:
| As of December 31, | Percentage change | |||||||||||
| 2021 | 2022 | 2022/2021 | ||||||||||
| (in billions of Won) | (%) | |||||||||||
| Liabilities: |
||||||||||||
| Financial liabilities at fair value through profit or loss |
₩ | 4,873 | ₩ | 8,952 | 83.7 | % | ||||||
| Deposits due to customers |
317,900 | 342,105 | 7.6 | |||||||||
| Borrowings |
24,755 | 28,430 | 14.8 | |||||||||
| Debentures |
44,654 | 44,198 | (1.0 | ) | ||||||||
| Provisions |
576 | 546 | (5.2 | ) | ||||||||
| Other financial liabilities |
24,233 | 22,812 | (5.9 | ) | ||||||||
| Other liabilities(1) |
1,388 | 1,804 | 30.0 | |||||||||
|
|
|
|
|
|||||||||
| Total liabilities |
418,379 | 448,847 | 7.3 | |||||||||
|
|
|
|
|
|||||||||
| Equity: |
||||||||||||
| Owner’s equity: |
||||||||||||
| Capital stock |
3,640 | 3,640 | 0.0 | |||||||||
| Hybrid securities |
2,294 | 3,112 | 35.7 | |||||||||
| Capital surplus |
682 | 682 | 0.0 | |||||||||
| Other equity |
(2,167 | ) | (2,423 | ) | 11.8 | |||||||
| Retained earnings(2) |
21,348 | 23,750 | 11.3 | |||||||||
| 25,797 | 28,761 | 11.5 | ||||||||||
| Non-controlling interests |
3,008 | 2,866 | (4.7 | ) | ||||||||
|
|
|
|
|
|||||||||
| Total equity |
28,805 | 31,627 | 9.8 | |||||||||
|
|
|
|
|
|||||||||
| Total liabilities and equity |
₩ | 447,184 | ₩ | 480,474 | 7.4 | |||||||
|
|
|
|
|
|||||||||
| (1) | Includes net defined benefit liability, current tax liabilities, deferred tax liabilities, derivative liabilities designated for hedging and other liabilities. |
| (2) | Includes regulatory reserve for credit loss of ₩2,568 billion as of December 31, 2021 and ₩2,967 billion as of December 31, 2022. |
For further information on our liabilities, see “Item 4.B. Business Overview—Assets and Liabilities.”
Our total liabilities increased 7.3% from ₩418,379 billion as of December 31, 2021 to ₩448,847 billion as of December 31, 2022, principally as a result of a 7.6% increase in deposits due to customers from
144
Table of Contents
₩317,900 billion as of December 31, 2021 to ₩342,105 billion as of December 31, 2022, which was enhanced by a 14.8% increase in borrowing from ₩24,755 billion as of December 31, 2021 to ₩28,430 billion as of December 31, 2022 and a 30.0% increase in other liabilities from ₩1,388 billion as of December 31, 2021 to ₩1,804 billion as of December 31, 2022. The increase in deposits due to customers was primarily due to a 6.2% increase in time deposits from ₩254,319 billion as of December 31, 2021 to ₩270,093 billion as of December 31, 2022, which was enhanced by a 22.9% increase in deposits in foreign currencies from ₩37,644 billion as of December 31, 2021 to ₩46,264 billion as of December 31, 2022 and a 46.6% increase in certificate of deposits from ₩3,586 billion as of December 31, 2021 to ₩5,256 billion as of December 31, 2022.
Our total equity increased 9.8% from ₩28,805 billion as of December 31, 2021 to ₩31,627 billion as of December 31, 2022. Such increase mainly reflected an 11.3% increase in retained earnings from ₩21,348 billion as of December 31, 2021 to ₩23,750 billion as of December 31, 2022 and a 35.7% increase in hybrid securities from ₩2,294 billion as of December 31, 2021 to ₩3,112 billion as of December 31, 2022. The increase in retained earnings was attributable mainly to the net income we generated in 2022. The increase in hybrid securities was due to the issuances of local currency-denominated hybrid securities in February, July and October 2022.
Liquidity
Our primary source of funding has historically been and continues to be customer deposits, particularly lower-cost retail deposits. Customer deposits amounted to ₩317,900 billion and ₩342,105 billion as of December 31, 2021 and 2022, which represented approximately 80.9% and 81.2% of our total funding, respectively. We have historically been able to use customer deposits to finance our operations generally, including meeting a portion of our liquidity requirements. Although the majority of deposits are short term, it has been our experience that the majority of our depositors generally roll over their deposits at maturity, thus providing us with a stable source of funding. However, in the event that a substantial number of our depositors do not roll over their deposits or otherwise decide to withdraw their deposited funds, we would need to place increased reliance on alternative sources of funding, some of which may be more expensive than customer deposits, in order to finance our operations. See “Item 3.D. Risk Factors—Other risks relating to our business—Our funding is highly dependent on short-term deposits, which dependence may adversely affect our operations.” In particular, we may increase our utilization of alternative funding sources such as short-term borrowings and cash and cash equivalents (including funds from maturing loans), as well as liquidating our positions in trading and investment securities and using the proceeds to fund parts of our operations, as necessary.
We also obtain funding through borrowings and issuances of debentures to meet our liquidity needs. Borrowings represented 7.1% and 7.6% of our total funding as of December 31, 2021 and 2022, respectively. Debentures represented 11.4% and 10.5% of our total funding as of December 31, 2021 and 2022, respectively. For further information on our sources of funding, see “Item 4.B. Business Overview—Assets and Liabilities—Funding.”
Our liquidity risks arise from withdrawals of deposits and maturities of our borrowings and debentures, as well as our need to fund our lending, trading and investment activities and to manage our trading positions. Our goal in managing our liquidity is to be able, even under adverse conditions, to meet all of our liability repayments on time and to fund all investment opportunities. For a discussion of how we manage our liquidity risk, see “Item 11. Quantitative and Qualitative Disclosures about Market Risk—Liquidity Risk Management.”
The Financial Services Commission requires each Korean financial holding company and each Korean bank to maintain specific Won and foreign currency liquidity ratios. These ratios require us to keep our ratio of liquid assets to liquid liabilities above certain minimum levels. For a description of these requirements, see “Item 4.B. Business Overview—Supervision and Regulation—Principal Regulations Applicable to Financial Holding Companies—Liquidity” and “—Principal Regulations Applicable to Banks—Liquidity.” We are currently in compliance with all such requirements. In addition, notwithstanding any global economic and financial disruption resulting from the COVID-19 pandemic, we do not expect to experience issues relating to foreign currency liquidity due to the low likelihood of large withdrawals of foreign currency and our access to existing lines of credit in foreign currency.
145
Table of Contents
We are a financial holding company, and substantially all of our operations are in our subsidiaries. Accordingly, we rely on distributions from our subsidiaries, direct borrowings and issuances of debt and equity securities to fund our liquidity obligations at the holding company level. See “Item 3.D. Risk Factors—Risks relating to our financial holding company structure and strategy.”
Contractual Obligations and Off-Balance Sheet Arrangements
The following table sets forth our contractual obligations as of December 31, 2022:
| Payments due by period | ||||||||||||||||||||
| Total | Less than 1 year |
1-3 years | 3-5 years | More than 5 years |
||||||||||||||||
| (in billions of Won) | ||||||||||||||||||||
| Contractual obligations |
||||||||||||||||||||
| Borrowing obligations(1) |
₩ | 29,013 | ₩ | 21,071 | ₩ | 6,530 | ₩ | 927 | ₩ | 485 | ||||||||||
| Debenture obligations(1) |
46,535 | 23,615 | 15,949 | 3,672 | 3,299 | |||||||||||||||
| Deposits(2)(3) |
349,008 | 332,486 | 10,782 | 4,217 | 1,523 | |||||||||||||||
| Lease obligations |
354 | 170 | 113 | 38 | 33 | |||||||||||||||
| Purchase obligations |
131 | 57 | 34 | 27 | 13 | |||||||||||||||
| Employee severance plan obligations |
3,940 | 9 | 10 | 25 | 3,896 | |||||||||||||||
|
|
|
|
|
|
|
|
|
|
|
|||||||||||
| Total |
₩ | 428,981 | ₩ | 377,408 | ₩ | 33,418 | ₩ | 8,906 | ₩ | 9,249 | ||||||||||
|
|
|
|
|
|
|
|
|
|
|
|||||||||||
| (1) | Includes estimated future interest payments, which have been estimated using contractual interest rates and scheduled contractual maturities of the outstanding borrowings and debentures as of December 31, 2022. In order to calculate future interest payments on debts with floating rates, we used contractual interest rates as of December 31, 2022. |
| (2) | Comprising certificates of deposit, other time deposits and installment deposits. |
| (3) | Includes estimated future interest payments, which have been estimated using weighted average interest rates paid in 2022 for each deposit product category and their scheduled contractual maturities. |
We utilize credit-related financial instruments with off-balance sheet risk in our normal course of business. The primary purpose of those instruments is to generate fee income for us, in return for making credit support and funds available to our customers as required. Such instruments consist primarily of guarantees, commercial letters of credit and unused lines of credit. Guarantees include guarantees for loans, debentures, trade financing arrangements and guarantees for other financings. Contingent liabilities for which guaranteed amounts are not finalized appear as off-balance sheet items in the notes to the financial statements.
We also enter into transactions with certain structured entities, including through the purchase of their subordinated debt and the provision of credit facilities to them. For further information, see Notes 1-(5) and 1-(6) of the notes to our consolidated financial statements included elsewhere in this annual report.
146
Table of Contents
The following table sets forth our off-balance sheet guarantees and commitments as of the dates indicated:
| As of December 31, | ||||||||
| 2021 | 2022 | |||||||
| (in billions of Won) | ||||||||
| Confirmed guarantees |
₩ | 7,988 | ₩ | 7,487 | ||||
| Guarantees for loans |
39 | 40 | ||||||
| Acceptances |
623 | 502 | ||||||
| Guarantees in acceptances of imported goods |
111 | 98 | ||||||
| Other confirmed guarantees |
7,215 | 6,848 | ||||||
| Unconfirmed guarantees |
4,208 | 4,309 | ||||||
| Local letter of credit |
243 | 150 | ||||||
| Letters of credit |
3,187 | 3,014 | ||||||
| Other unconfirmed guarantees |
778 | 1,144 | ||||||
| Commercial paper purchase commitments and others |
792 | 126 | ||||||
| Loan commitments and others: |
||||||||
| Loans |
114,414 | 118,172 | ||||||
| Others |
5,653 | 7,108 | ||||||
We analyze our off-balance sheet legally binding credit-related commitments for possible losses associated with such commitments. We review the ability of the counterparties of the underlying credit-related commitments to perform their obligations under the commitments and, if we determine that a loss is probable and estimable, we establish allowances for possible losses in a manner similar to allowances that we would establish with respect to a loan granted under the terms of the applicable commitment. These allowances are reflected as provisions in our statement of financial position. As of December 31, 2022, we had established provisions for possible losses of ₩183 billion with respect to our guarantees and loan commitments.
Capital Adequacy
We are subject to the capital adequacy requirements of the Financial Services Commission. The requirements applicable commencing in December 2013 pursuant to amended Financial Services Commission regulations promulgated in July 2013 were formulated based on Basel III, which was first introduced by the Basel Committee on Banking Supervision, Bank for International Settlements in December 2009. Under the amended Financial Services Commission regulations, all financial holding companies and banks in Korea are required to maintain certain minimum ratios of Tier I common equity capital, total Tier I capital and total Tier I and Tier II capital to risk-weighted assets. See “Item 4.B. Business Overview—Supervision and Regulation—Principal Regulations Applicable to Financial Holding Companies Capital Adequacy” and “—Principal Regulations Applicable to Banks—Capital Adequacy.”
If a financial holding company or a bank fails to maintain its capital adequacy ratios, the Korean regulatory authorities may impose penalties on such financial holding company or bank ranging from a warning to suspension or revocation of its license. See “Item 3.D. Risk Factors—Other risks relating to our business—We may be required to raise additional capital if our capital adequacy ratios deteriorate or the applicable capital requirements change in the future, but we may not be able to do so on favorable terms or at all.”
147
Table of Contents
The following table sets forth a summary of our capital and capital adequacy ratios as of December 31, 2021 and 2022 based on IFRS and applicable regulatory reporting standards:
| As of December 31, | ||||||||
| 2021 | 2022 | |||||||
| (in billions of Won, except percentages) |
||||||||
| Tier I capital |
||||||||
| Tier I common equity capital |
||||||||
| Capital stock |
₩ | 3,640 | ₩ | 3,640 | ||||
| Capital surplus |
682 | 682 | ||||||
| Retained earnings |
21,348 | 23,750 | ||||||
| Non-controlling interests in consolidated subsidiaries |
16 | 19 | ||||||
| Others |
(3,737 | ) | (4,334 | ) | ||||
| Additional Tier I capital |
||||||||
| Hybrid securities |
2,294 | 3,112 | ||||||
| Other equity |
1,299 | 1,097 | ||||||
| Total Tier I capital |
₩ | 25,542 | ₩ | 27,966 | ||||
| Tier II capital |
||||||||
| Allowance for credit losses(1) |
₩ | 425 | ₩ | 528 | ||||
| Others |
2,974 | 2,910 | ||||||
| Total Tier II capital |
₩ | 3,399 | ₩ | 3,438 | ||||
| Total Tier I and Tier II capital |
₩ | 28,941 | ₩ | 31,404 | ||||
| Risk-weighted assets |
||||||||
| Credit risk-weighted assets |
₩ | 171,200 | ₩ | 182,028 | ||||
| Market risk-weighted assets |
6,388 | 6,759 | ||||||
| Operational risk-weighted assets |
14,915 | 16,520 | ||||||
| Total |
₩ | 192,503 | ₩ | 205,307 | ||||
| Tier I common equity capital ratio |
11.40 | % | 11.57 | % | ||||
| Total Tier I capital ratio |
13.27 | 13.62 | ||||||
| Tier II capital ratio |
1.76 | 1.68 | ||||||
| Total Tier I and Tier II capital ratio |
15.03 | 15.30 | ||||||
| (1) | Allowance for credit losses in respect of credits classified as normal or precautionary is used to calculate Tier II capital only to the extent such allowances represent up to 1.25% of risk-weighted assets. |
Recent Accounting Pronouncements
See Note 2-(1)-2) of the notes to our consolidated financial statements for a description of other recent accounting pronouncements under IFRS as issued by the IASB that have been issued but are not yet effective.
| Item 5.C. | Research and Development, Patents and Licenses, etc. |
Not Applicable
| Item 5.D. | Trend Information |
These matters are discussed under Item 5.A and Item 5.B above where relevant.
| Item 5.E. | Critical Accounting Estimates |
Our financial statements are prepared in accordance with IFRS as issued by IASB. See Notes 2 and 3 of the notes to our financial statements for a discussion of our critical accounting estimates.
148
Table of Contents
| Item 6. | DIRECTORS, SENIOR MANAGEMENT AND EMPLOYEES |
| Item 6.A. | Directors and Senior Management |
Board of Directors
Our board of directors has the ultimate responsibility for managing our affairs. The board currently comprises one standing director, one non-standing director and six outside directors. Standing directors are directors who are our full-time executive officers, while non-standing directors and outside directors are directors who are not full-time executive officers. Outside directors represent a cross-section of respected and experienced members of the academic, financial, corporate and other fields in Korea and elsewhere, and must also satisfy certain requirements under Korean law and our articles of incorporation to evidence their independence from us.
Our articles of incorporation provide that the board can have no more than 15 directors. There must be at least three outside directors and they must comprise a majority of the directors. Each director may be elected for a term of office not exceeding three years and may be re-elected, provided that each outside director may be elected for a term of office not exceeding two years and may be re-elected on an annual basis but may not serve in such office for more than a total of six years. In addition, with respect to all directors, such term of office will be extended until the close of the annual general meeting of shareholders convened in respect of the last fiscal year of the director’s term of office. These terms are subject to the Korean Commercial Code, the Financial Holding Company Act and related regulations.
Our board of directors meets regularly on a quarterly basis to discuss and resolve various corporate matters. The board may also convene for additional extraordinary meetings at the request of the president or chairman of the board. A director (other than the president or chairman of the board) may request the president or chairman of the board to convene an extraordinary meeting. In the event that the president or chairman of the board rejects such request without justifiable reason, another director may convene the extraordinary meeting.
The names and positions of our directors are set forth below. The business address of all of the directors is our registered office at 51, Sogong-ro, Jung-gu, Seoul, Korea.
Standing Directors
Our standing director is as follows:
| Name |
Date of Birth | Position | Director Since | Year Term Ends(1) |
||||||||||||
| Jong-Yong Yim |
August 3, 1959 | President and Chief Executive Officer | March 24, 2023 | 2026 | ||||||||||||
| (1) | The date on which the term will end will be the date of the general shareholders’ meeting in the relevant year. |
Jong-Yong Yim is our president and chief executive officer. He has experience overseeing national policies in the public sector, including in the economic and financial sectors. He previously served at the Ministry of Economy and Finance (formerly the Ministry of Finance and Economy) and the Financial Services Commission. He also served as the chairman of NongHyup Financial Group Inc. Mr. Yim holds a Bachelor of Arts in Economics from Yonsei University and a Master of Arts in Economics from University of Oregon.
Such director is not involved in any significant business activities outside us and our subsidiaries.
Non-Standing Director
Our non-standing director is as follows:
| Name |
Date of Birth | Position | Director Since | Year Term Ends | ||||||||||||
| Won-Duk Lee |
January 15, 1962 | Non-Standing Director | March 25, 2022 | 2023 | (1) | |||||||||||
| (1) | The term will end on December 31, 2023. |
149
Table of Contents
Won-Duk Lee was elected as a non-standing director in March 2022. He became the president and chief executive officer of Woori Bank in March 2022, upon which he resigned his position as our standing director and was newly elected as a non-standing director. He holds a Bachelor of Science in Agriculture and a Master of Arts in Economics from Seoul National University.
Outside Directors
We currently have six outside directors. The terms of three of our former outside directors, Sung-Tae Ro, Sang-Yong Park and Dong-Woo Chang, expired in 2023. At our annual general meeting of shareholders in March 2023, we newly elected Su-Young Yun and Sung-Bae Ji as our outside directors Our current outside directors are as follows:
| Name |
Date of Birth |
Position |
Director Since |
Year Term Ends(1) | ||||||
| In-Sub Yoon |
January 1956 | Outside Director | January 27, 2022 | 2024 | ||||||
| Chan-Hyoung Chung |
February 1956 | Outside Director | March 24, 2023(2) | 2024 | ||||||
| Su-Young Yun |
December 1961 | Outside Director | March 24, 2023 | 2025 | ||||||
| Yo-Hwan Shin |
December 1962 | Outside Director | January 27, 2022 | 2024 | ||||||
| Sung-Bae Ji |
July 1967 | Outside Director | March 24, 2023 | 2025 | ||||||
| Soo-Young Song |
October 1980 | Outside Director | March 25, 2022 | 2024 | ||||||
| (1) | The date on which the term will end will be the date of the general shareholders’ meeting in the relevant year. |
| (2) | Prior to January 11, 2019, served as a director of Woori Bank. |
In-Sub Yoon was elected as an outside director in January 2022 and was previously the chairman of the board of directors of Fubon Hyundai Life Insurance and the chief executive officer of Korea Ratings. He holds a Bachelor of Science in Applied Statistics and a Master of Science in Accounting from Yonsei University.
Chan-Hyoung Chung was elected as an outside director in December 2018 and is currently an outside director of Woori Bank. He holds a Bachelor of Arts in Business Administration and a Master of Business Administration from Korea University.
Su-Young Yun was elected as an outside director in March 2023 and was previously the chief executive officer of Kiwoom Asset Management Co., Ltd. and the vice president of Kiwoom Securities Corp. He holds a Bachelor of Arts in Economics and a Master of Arts in Economics from Seoul National University.
Yo-Hwan Shin was elected as an outside director in January 2022 and was previously the CEO of Shinyoung Securities Co., Ltd. He holds a Bachelor of Arts in Business Administration from Korea University and a Master of Science in Finance from the University of Illinois at Urbana-Champaign.
Sung-Bae Ji was elected as an outside director in March 2023 and was previously the chairman of Korea Venture Capital Association. He is currently the chief executive officer of IMM Investment, Corp. He holds a Bachelor of Arts in Business Administration and a Master of Arts in Business Administration from Seoul National University.
Soo-Young Song was elected as an outside director in March 2022. She is currently a partner at Shin & Kim LLC. She holds a Bachelor of Arts in Business Administration, a Bachelor of Arts in French Language and Literature, a Bachelor of Legislative Law and an Executive Master of Business Administration, each from Seoul National University, and completed the 39th Judicial Training Institute Program.
If any director wishes to enter into a transaction with us in his or her personal capacity, he or she must obtain the prior approval of our board of directors (which shall be granted by two-thirds or more of the total number of the directors, and the relevant transaction shall be fair in terms of its particulars and procedures). The director with an interest in the transaction may not vote at the meeting during which the board approves the transaction.
150
Table of Contents
Executive Officers
In addition to the standing director who is also our executive officer, we currently have the following 7 executive officers.
| Name |
Date of Birth |
Position | ||
| Sung-Wook Lee |
November 13, 1965 | Deputy President | ||
| Gwang-Ik Jang |
January 25, 1965 | Deputy President | ||
| Il-Jin Ouk |
May 3, 1974 | Senior Managing Director | ||
| Kon Ho Kim |
May 10, 1966 | Managing Director | ||
| Jang Keun Park |
June 29, 1967 | Managing Director | ||
| Jeong Soo Lee |
January 5, 1967 | Managing Director | ||
| Jae Hwa Jeon |
June 28, 1968 | Deputy Managing Director and Compliance Officer |
Sung-Wook Lee serves as a deputy president of our finance planning unit. Previously, he served as a senior managing director of our finance planning unit, a managing director of our finance planning division and a senior general manager of our finance and management department. He holds a Bachelor of Arts in Business Administration from Yonsei University.
Gwang-Ik Jang serves as a deputy president of our brand unit. Previously, he served as a director of the planning office of Maeil Broadcasting Network, a director of the press bureau of Maeil Broadcasting Network, and the head of the social department of Maeil Broadcasting Network. He holds a Bachelor of Arts in Economics from Yonsei University, a Master of Arts in Economics from Yonsei University, a Master of Business Administration from University of Michigan and a doctoral degree in Business Administration from Dongguk University.
Il-Jin Ouk serves as a senior managing director of our digital/IT unit. Previously, he served as a managing director of our digital unit and a deputy president of the financial group of Kearney Strategy Consulting, a leader of the strategy unit of E&Y and a principal of BCG. He holds a Bachelor of Arts in Business Administration from Seoul National University and a Master of Business Administration from the University of Chicago.
Kon Ho Kim serves as a managing director of our future business unit. Previously, he served as a senior general manager of our synergy management department and a general manager of Woori Bank’s Yonsei Banking Center. He holds a Bachelor of Arts in Business Administration from Yonsei University and a Master of Arts in Financial Engineering from KAIST.
Jang Keun Park serves as a managing director of our risk management unit. Previously, he served as a senior managing director of the marketing management group and a senior general manager of the head office business department of Woori Bank. He holds a Bachelor of Arts in Statistics from Korea University and a Master of Business Administration from KDI (Michigan State University).
Jeong Soo Lee serves as a managing director of our strategy planning unit. Previously, he served as a senior general manager of our investor relations department, a general manager of our investor relations department and a general manager of the investor relations department of Woori Bank. He holds a Bachelor of Arts in German Language and Literature from Sogang University and a Master of Arts in International Finance from the George Washington University.
Jae Hwa Jeon serves as a deputy managing director and the compliance officer. Previously, he served as a general manager of the Yeouido Corporate Banking Headquarters, a general manager of the Munjeong-jungang Banking Center of Woori Bank, and a general manager of our Compliance Department. He holds a Bachelor of Law from Korea University and a Master of Arts in Financial Engineering from KAIST.
None of the executive officers is involved in any significant business activities outside us and our subsidiaries.
151
Table of Contents
| Item 6.B. | Compensation |
The aggregate remuneration and benefits-in-kind we paid in 2022 to our directors and our other executive officers, including the compliance officer and managing directors, was ₩6,620 million, which includes ₩262 million in provisions for allowances for severance and retirement benefits for such directors and officers. We do not have service contracts with any of these directors or officers that provide for benefits if employment with us is terminated.
The compensation of our director who received total annual compensation exceeding ₩500 million in 2022 was as follows:
| Name |
Position | Total Compensation in 2022 (in millions of Won) |
||||
| Tae-Seung Son |
President and Chief Executive Officer | ₩ | 1,202 | (1) | ||
| (1) | Such compensation does not include a maximum 61,190 shares of our common stock that may be granted in connection with long-term performance from 2022 to 2025. The final number of shares granted will be determined at the time of payment based on the market price of our common stock and other factors. |
| Item 6.C. | Board Practices |
See “Item 6.A. Directors and Senior Management—Board of Directors” and “Item 6.B. Compensation” for information concerning the terms of office and contractual employment arrangements with our directors and executive officers.
Committees of the Board of Directors
We currently have six committees that serve under the board:
| • | the Audit Committee; |
| • | the Board Risk Management Committee; |
| • | the Compensation Committee; |
| • | the Committee for Recommending Executive Officer Candidates; |
| • | the Committee for Recommending Subsidiary Representative Director Candidates; and |
| • | the Board ESG Management Committee. |
The board appoints each member of these committees except for members of the Audit Committee, who are elected by our shareholders at the annual general meeting.
Effective March 24, 2023, the functions of the former Committee for Internal Control Management have been assumed by the Audit Committee.
Audit Committee
This committee consists of four outside directors: Chan-Hyoung Chung, Su-Young Yun, Yo-Hwan Shin, Sung-Bae Ji. The chairman is Su-Young Yun. It reviews all audit and compliance-related matters and makes recommendations to our board. The Audit Committee, whose members must meet certain qualifications as experts under the committee charter, is also responsible for the following:
| • | formulating, executing, evaluating and managing internal audit plans (including the financial and operational audits); |
| • | approving the appointment and dismissal of the head of the audit team; |
| • | approving the appointment of external auditors and evaluating the activities carried out by external auditors; |
| • | formulating appropriate measures to correct problems identified from internal audits; |
152
Table of Contents
| • | overseeing the reporting systems within our financial holding company structure in light of relevant disclosure rules and requirements to ensure compliance with applicable regulations; and |
| • | examining internal procedures or making decisions on material matters that are related to audits as determined by the regulatory authorities, our board or other committees. |
This committee also makes recommendations on regulatory issues to the Financial Supervisory Service, if and when deemed necessary. In addition, in connection with general meetings of shareholders, the committee examines the agenda for, and financial statements and other reports to be submitted by the board of directors, to each general meeting of shareholders. The internal and external auditors report directly to the Audit Committee chairman. Our external auditor is invited to attend meetings of this committee when needed or when matters pertaining to the audit are discussed.
This committee holds regular meetings every quarter or as necessary.
Board Risk Management Committee
This committee consists of three outside directors: In-Sub Yoon, Su-Young Yun and Soo-Young Song. The chairman is In-Sub Yoon. It comprehensively detects, measures, oversees and controls the relevant risks in the management of our subsidiaries and makes determinations on all significant issues relating to our risk management system. The major roles of the Board Risk Management Committee include:
| • | determining and amending risk management policies, guidelines and limits in conformity with the strategy established by the board of directors; |
| • | determining the appropriate level of risks that we should be willing to undertake, including in connection with key business activities such as acquisitions, investments or entering into new business areas, prior to a decision by the board of directors on such matters; |
| • | allocating risk capital and approving the risk limit requests of our subsidiaries; |
| • | reviewing our risk profile, including the level of risks we are exposed to and the status of our risk management operations; and |
| • | monitoring compliance with our risk policies. |
This committee regularly receives reports from the Group Risk Management Council as well as the Group Risk Management Department, which in turn receives reports from subsidiary level risk management committees and groups. See “Item 11. Quantitative and Qualitative Disclosures about Market Risk.” This committee holds regular meetings every quarter.
Compensation Committee
This committee consists of four outside directors: In-Sub Yoon, Chan-Hyoung Chung, Su-Young Yun and Yo-Hwan Shin. The chairman is Yo-Hwan Shin. It is responsible for all matters relating to the following:
| • | evaluating management’s performance in developing our business; |
| • | setting goals and targets with respect to executive performance; and |
| • | fixing executive compensation, including incentives and bonuses. |
This committee holds regular meetings every quarter.
Committee for Recommending Executive Officer Candidates
This committee consists of all six of our outside directors: In-Sub Yoon, Chan-Hyoung Chung, Su-Young Yun, Yo-Hwan Shin, Sung-Bae Ji and Soo-Young Song. The chairman is Sung-Bae Ji. The committee oversees the selection of candidates for the president and chief executive officer, outside directors and Audit Committee members, among others. This committee holds meetings when such persons need to be appointed.
153
Table of Contents
Committee for Recommending Subsidiary Representative Director Candidates
This committee consists of one standing director, Jong-Yong Yim, and all six of our outside directors: In-Sub Yoon, Chan-Hyoung Chung, Su-Young Yun, Yo-Hwan Shin, Sung-Bae Ji and Soo-Young Song. The chairman is Jong-Yong Yim. The committee oversees the selection of candidates for the representative directors of our subsidiaries. This committee holds meetings when such persons need to be appointed.
Board ESG Management Committee
This committee consists of all eight of our directors: Jong-Yong Yim, Won-Duk Lee, In-Sub Yoon, Chan-Hyoung Chung, Su-Young Yun, Yo-Hwan Shin, Sung-Bae Ji, and Soo-Young Song. The chairman is Soo-Young Song. The committee oversees the direction of ESG management strategies and the establishment of such policies. This committee holds regular meetings every six months.
| Item 6.D. | Employees |
As of December 31, 2022, we had a total of 111 full-time employees at our financial holding company, excluding 12 employees that hold concurrent positions at our subsidiaries. The following table sets forth information regarding our employees, on a non-consolidated basis and including employees holding concurrent positions at our subsidiaries, as of the dates indicated:
| As of December 31, | ||||||||||
| 2021 | 2022 | |||||||||
| Woori Financial Group |
Full-time employees | 136 | 123 | |||||||
| Contractual employees | 46 | 54 | ||||||||
| Woori Bank |
Full-time employees | 13,298 | 12,951 | |||||||
| Contractual employees | 907 | 907 | ||||||||
At the holding company level, our employees do not currently have a labor union and are not members of an outside labor union. However, Woori Bank has a labor union, and approximately 66.9% of its employees as of December 31, 2022 were members of the Korea Financial Industry Union. Neither we nor Woori Bank has experienced any significant labor disputes in recent years, although we have made certain concessions to Woori Bank’s labor union and our labor association. See “Item 3.D. Risk Factors—Other risks relating to our business—Labor union unrest may disrupt our operations and hinder our ability to continue to reorganize our operations.” We have placed a high priority on our relationship with our employees and on maintaining an atmosphere of trust and cooperation between our labor and management.
At the holding company level, our employees’ compensation comprises an individual base salary and bonus, which are determined based on the work productivity and performance of each employee and the relevant business unit. We believe that the salaries we pay to our employees and management are similar to those of other large financial companies in Korea. We evaluate employees twice a year (usually in March and September), based on our business performance and evaluations provided by co-workers and superiors. With respect to our compensation program, we do not provide housing leases or loans to our employees.
At Woori Bank, employee compensation is generally based on a combination of the agreed-upon base salary and bonuses. In addition, Woori Bank operates a “salary peak” system, under which an employee’s salary reaches a certain peak and then is gradually reduced as the employee reaches retirement age. Woori Bank’s bonus system is generally based on individual performance and business unit performance. We believe that Woori Bank’s compensation package is similar to that of institutions in the same industry. Woori Bank also provides a wide range of benefits to its employees, including medical insurance, employment insurance, workers compensation, accident insurance, financial aid for children’s tuition and retirement pension plans.
We have an employee stock ownership association, which purchases our shares at the request of our employees using their own funds and financial support by us depending on the amount of purchase by employee. The association is entitled to certain pre-emptive rights. See “Item 10B. Memorandum and Articles of Association—Pre-emptive Rights and Issuances of Additional Shares.”
154
Table of Contents
In accordance with the National Pension Act, we contribute an amount equal to 4.5% of employee wages, and each employee contributes 4.5% of his or her wages, into each employee’s personal pension account. In addition, in accordance with the Guarantee of Worker’s Retirement Benefits Act, we have adopted a retirement pension plan for our employees. Contributions under the retirement pension plan are deposited annually into a financial institution, and an employee may elect to receive a monthly pension or a lump-sum amount upon retirement. Our retirement pension plans are provided in the form of a defined benefit plan and a defined contribution plan. The defined benefit plan guarantees a certain payout at retirement, according to a fixed formula based on the employee’s average wages and the number of years for which the employee has been a plan member. The defined contribution plan, in which the employer’s contribution is determined in advance based on one-twelfth of an employee’s total annual pay, is managed directly by the employees. Under Korean law, we may not terminate the employment of full-time employees except under certain limited circumstances.
| Item 6.E. | Share Ownership |
Common Stock
As of April 17, 2023, the persons who are currently our directors or executive officers, in the aggregate, held 77,954 shares of our common stock. None of these persons individually held more than 1% of our outstanding common stock as of such date. The following table presents information regarding our directors and executive officers who beneficially owned our shares as of April 17, 2023.
| Name of Executive Officer or Director |
Number of Shares of Common Stock |
|||
| Chan-Hyoung Chung |
10,532 | |||
| Won-Duk Lee |
26,500 | |||
| Sung-Wook Lee |
15,000 | |||
| Il-Jin Ouk |
3,000 | |||
| Kon-Ho Kim |
9,160 | |||
| Jeong-Soo Lee |
5,890 | |||
| Jae-Hwa Jeon |
7,872 | |||
| Total |
77,954 | |||
|
|
|
|||
Share-based Payments
Under the Korean Commercial Code and our articles of incorporation, we may, by special resolution of our shareholders, grant to our officers and employees (including the officers and employees of our subsidiaries) who have contributed or are expected to contribute to our establishment, management, technological innovation, etc. options to purchase up to an aggregate of 15.0% of the total number of our then issued shares. We may grant such options to purchase up to 1.0% of the total number of our then issued shares by a resolution of our board of directors.
We have granted cash-settled stock options to certain executive officers. See Note 36-(4) of the notes to our consolidated financial statements. As of the date of this annual report, none of such cash-settled stock options have vested.
| ITEM 6.F. | Disclosure of A Registrant’s Action to Recover Erroneously Awarded Compensation. |
Not Applicable
| Item 7. | MAJOR SHAREHOLDERS AND RELATED PARTY TRANSACTIONS |
| Item 7.A. | Major Shareholders |
The following table presents information regarding the beneficial ownership of our common stock at April 17, 2023 (unless otherwise indicated) by each person or entity known to us to own beneficially more than 5% of the outstanding shares of our common stock.
155
Table of Contents
Except as otherwise indicated, each shareholder identified by name has:
| • | sole voting and investment power with respect to its shares; and |
| • | record and beneficial ownership with respect to its shares. |
| Beneficial Owner |
Number of Shares of Common Stock |
Percentage of Total Shares of Common Stock |
Percentage of Total Shares on a Fully Diluted Basis |
|||||||||
| Employee Stock Ownership Association(1) |
69,301,356 | 9.52 | 9.52 | |||||||||
| National Pension Service(2) |
52,088,451 | 7.15 | 7.15 | |||||||||
| Nobis1, Inc.(3) |
40,560,000 | 5.57 | 5.57 | |||||||||
| BlackRock Fund Advisors(4) |
36,888,004 | 5.07 | 5.07 | |||||||||
| (1) | As of December 31, 2022. |
| (2) | As of December 31, 2022. |
| (3) | Nobis1, Inc., which is an affiliate of IMM Private Equity, acquired 27,040,000 shares of Woori Bank’s common stock, or 4.00% of its outstanding common stock, in December 2016. In accordance with the Bank Act, Nobis1, Inc. received approval from the Financial Services Commission for the acquisition of an additional 13,520,000 shares of Woori Bank’s common stock, or 2.00% of its outstanding common stock, in January 2017, pursuant to an agreement not to exercise the voting rights with respect to such shares. Such shares were exchanged for shares of our common stock in January 2019 in the stock transfer. |
| (4) | As of January 30, 2023. |
In March 2020, pursuant to a commitment made by Woori Bank in connection with its disposal of 42,103,377 shares of our common stock in 2019, in which 28,890,707 of such shares were sold to Fubon Life Insurance Co., Ltd. in September 2019 for ₩358 billion, one person nominated by Fubon Life Insurance Co., Ltd. was elected to serve as our outside director at our annual general meeting of shareholders. In March 2021, the five directors elected pursuant to the stock transfer plan were reappointed as our outside directors at our annual generating meeting of shareholders. In December 2021, through KDIC’s sale of an aggregate of 9.3% of our common stock to five winning bidders, Eugene Private Equity Co., Ltd. became our new major shareholder and thereby nominated one person as an outside director who was subsequently elected at an extraordinary general meeting of shareholders in January 2022.
In 2017, pursuant to a series of transactions related to call options previously granted in connection with the KDIC’s sale of Woori Bank’s common stock in December 2014, the KDIC sold an aggregate of 19,852,364 shares of Woori Bank’s common stock (representing 2.9% of its outstanding common stock). As a result of such transactions, the KDIC’s ownership interest in Woori Bank was reduced to 18.4%. In connection with our establishment in January 2019 as a new financial holding company pursuant to a “comprehensive stock transfer” under Korean law, the KDIC received 124,604,797 shares of our outstanding common stock in exchange for the common stock of Woori Bank it owned. In June 2019, the Financial Services Commission approved the KDIC’s plan to sell all such common stock in multiple transactions by 2022. In April 2021, pursuant to such plan, the KDIC sold 14,445,354 shares of our common stock (representing 2.0% of our outstanding common stock) in a block trade. In December 2021, the KDIC sold an aggregate 9.3% of our outstanding common stock in stakes ranging from 1.0% to 4.0% to four companies and 1.0% to our employee stock ownership association, and in February 2022, the KDIC sold an aggregate of 15,860,000 shares of our common stock (representing 2.2% of our outstanding common stock) in a block trade. In May 2022, the KDIC further sold an aggregate of 17,000,000 shares of our common stock (representing 2.3% of our outstanding common stock) in a block trade. As a result of such transactions, the KDIC currently owns 1.3% of our outstanding common stock.
As of April 17, 2023, our chief executive officer did not own any shares of our common stock. Our executive officers (excluding our chief executive officer) collectively owned 40,922 shares of our common stock. Our outside directors and non-standing director collectively owned 37,032 shares of our common stock.
Other than as set forth above, no other person or entity known by us to be acting in concert, directly or indirectly, jointly or separately, owned 5.0% or more of the outstanding shares of our common stock or exercised control or could exercise control over us as of April 17, 2023. None of our major shareholders has different voting rights from our other shareholders.
As of the close of our shareholders’ register on December 31, 2022, approximately 59.9% of our issued shares were held in Korea by approximately 116,526 shareholders.
156
Table of Contents
| Item 7.B. | Related Party Transactions |
We regularly engage in transactions with entities affiliated with the government, which currently owns 1.3% of our shares through the KDIC. Generally, these transactions include the extension of loans, the purchase of debt securities and other ordinary course activities relating to our banking business. For a description of such transactions, see “Item 4.B. Business Overview—Assets and Liabilities.”
As of December 31, 2022, we also had an aggregate amount of ₩3,620 million in outstanding assets, including loans, from transactions with our key management personnel, which includes our executive officers and directors, as well as the executive officers and directors of our major subsidiaries and the chief executive officers of our other subsidiaries.
All of these loans were made in the ordinary course of business, on substantially the same terms, including interest rates and collateral, as those prevailing at the time for comparable transactions with other persons and did not involve more than the normal risk of collectability or present other unfavorable features.
None of our directors or officers has or had any interest in any transactions effected by us that are or were unusual in their nature or conditions or significant to our business which were effected during the current or immediately preceding year or were effected during an earlier year and remain in any respect outstanding or unperformed.
| Item 7.C. | Interest of Experts and Counsel |
Not Applicable
| Item 8. | FINANCIAL INFORMATION |
| Item 8.A. | Consolidated Statements and Other Financial Information |
See “Item 18. Financial Statements” and pages F-1 through F-190.
You should read the following data together with the more detailed information contained in “Item 5. Operating and Financial Review and Prospects” and our consolidated financial statements included elsewhere in this annual report. Historical results do not necessarily predict future results.
Profitability Ratios and Other Data
| Year ended December 31, | ||||||||||||
| 2020 | 2021 | 2022 | ||||||||||
| (in billions of Won except percentages) | ||||||||||||
| Net income as a percentage of: |
||||||||||||
| Total average assets(1) |
0.40 | % | 0.66 | % | 0.72 | % | ||||||
| Total average equity(1) |
5.79 | 9.81 | 11.12 | |||||||||
| Dividend payout ratio(2) |
19.89 | 25.73 | 25.82 | |||||||||
| Net interest spread(3) |
1.60 | 1.71 | 1.90 | |||||||||
| Net interest margin(4) |
1.65 | 1.74 | 1.96 | |||||||||
| Efficiency ratio(5) |
58.01 | 49.70 | 46.01 | |||||||||
| Equity–to-average asset ratio(6) |
6.90 | 6.71 | 6.44 | |||||||||
| Cost-to-average assets ratio(7) |
1.04 | 0.99 | 0.96 | |||||||||
| (1) | Total average assets (including average interest-earning assets) and total average equity are based on daily balances for Woori Bank and on quarterly balances for all of our other subsidiaries and our structured companies. |
| (2) | Represents the ratio of total dividends declared on common stock as a percentage of net income attributable to owners. |
| (3) | Represents the difference between the yield on average interest-earning assets and cost of average interest-bearing liabilities. |
| (4) | Represents the ratio of net interest income to average interest-earning assets. |
| (5) | Represents the ratio of general and administrative expenses to the sum of net interest income, net fees and commissions income, dividend income, net gain on financial instruments at fair value through profit or loss, net gain on financial assets at fair value through other comprehensive income, net gain arising on financial assets at amortized cost and other net operating expenses. |
| (6) | Represents the ratio of total average equity to total average assets. |
| (7) | Represents the ratio of general and administrative expenses to total average assets. |
157
Table of Contents
Asset Quality Data
| As of December 31, | ||||||||
| 2021 | 2022 | |||||||
| (in billions of Won, except percentages) |
||||||||
| Total loans(1) |
₩ | 337,835 | ₩ | 345,411 | ||||
| Total non-performing loans(2) |
927 | 1,016 | ||||||
| Other impaired loans not included in non-performing loans |
231 | 667 | ||||||
| Total non-performing loans and other impaired loans |
1,158 | 1,683 | ||||||
| Total allowance for credit losses |
1,887 | 2,334 | ||||||
| Non-performing loans as a percentage of total loans |
0.27 | % | 0.29 | % | ||||
| Non-performing loans as a percentage of total assets |
0.21 | % | 0.21 | % | ||||
| Total non-performing loans and other impaired loans as a percentage of total loans |
0.34 | % | 0.49 | % | ||||
| Allowance for credit losses as a percentage of total loans |
0.56 | % | 0.68 | % | ||||
| (1) | Not including due from banks and other financial assets (or other receivables), and prior to deducting allowance for credit losses and present value discount or reflecting deferred origination costs. |
| (2) | Defined as those loans that are past due by 90 days or more or classified as substandard or below based on the Financial Services Commission’s asset classification criteria. See “Item 4.B. Business Overview—Assets and Liabilities—Asset Quality of Loans—Loan Classifications.” |
Selected Financial Information
Average Balances and Related Interest
The following tables show our average balances and interest rates for the past three years:
| Year ended December 31, | ||||||||||||||||||||||||||||||||||||
| 2020 | 2021 | 2022 | ||||||||||||||||||||||||||||||||||
| Average Balance(1) |
Interest Income(2) |
Average Yield |
Average Balance(1) |
Interest Income(2) |
Average Yield |
Average Balance(1) |
Interest Income(2) |
Average Yield |
||||||||||||||||||||||||||||
| (in billions of Won, except percentages) | ||||||||||||||||||||||||||||||||||||
| Assets |
||||||||||||||||||||||||||||||||||||
| Interest-earning assets: |
||||||||||||||||||||||||||||||||||||
| Due from banks |
₩ | 18,966 | ₩ | 54 | 0.28 | % | ₩ | 21,442 | ₩ | 47 | 0.22 | % | ₩ | 24,505 | ₩ | 244 | 1.00 | % | ||||||||||||||||||
| Financial assets at fair value through profit or loss |
4,859 | 49 | 1.01 | 7,271 | 46 | 0.63 | 7,901 | 107 | 1.35 | |||||||||||||||||||||||||||
| Financial assets at fair value through other comprehensive income |
27,868 | 437 | 1.57 | 30,724 | 381 | 1.24 | 35,848 | 633 | 1.77 | |||||||||||||||||||||||||||
| Securities at amortized cost |
18,945 | 383 | 2.02 | 16,503 | 325 | 1.97 | 21,450 | 515 | 2.40 | |||||||||||||||||||||||||||
| Loans(3): |
||||||||||||||||||||||||||||||||||||
| Commercial and industrial |
119,251 | 3,219 | 2.70 | 135,776 | 3,496 | 2.57 | 155,581 | 5,677 | 3.65 | |||||||||||||||||||||||||||
| Trade financing |
10,253 | 153 | 1.49 | 9,866 | 95 | 0.96 | 10,993 | 226 | 2.06 | |||||||||||||||||||||||||||
| Lease financing(4) |
1,448 | 48 | 3.31 | 3,287 | 119 | 3.62 | 4,414 | 178 | 4.03 | |||||||||||||||||||||||||||
| Other commercial |
7,102 | 172 | 2.42 | 7,786 | 175 | 2.25 | 8,654 | 275 | 3.18 | |||||||||||||||||||||||||||
| Securities purchased with agreements to resell |
2,666 | 30 | 1.13 | 3,244 | 33 | 1.02 | 3,220 | 83 | 2.58 | |||||||||||||||||||||||||||
| General purpose household(5) |
74,123 | 2,705 | 3.65 | 79,923 | 2,809 | 3.51 | 79,453 | 3,719 | 4.68 | |||||||||||||||||||||||||||
| Mortgage |
57,123 | 1,592 | 2.79 | 65,653 | 1,653 | 2.52 | 70,465 | 2,223 | 3.15 | |||||||||||||||||||||||||||
| Credit cards(2) |
8,215 | 651 | 7.92 | 9,203 | 685 | 7.44 | 10,035 | 728 | 7.25 | |||||||||||||||||||||||||||
|
|
|
|
|
|
|
|
|
|
|
|
|
|||||||||||||||||||||||||
| Total loans |
280,181 | 8,570 | 3.06 | 314,738 | 9,065 | 2.88 | 342,815 | 13,109 | 3.82 | |||||||||||||||||||||||||||
| Other |
12,415 | 31 | 0.25 | 10,690 | 31 | 0.29 | 11,854 | 47 | 0.40 | |||||||||||||||||||||||||||
|
|
|
|
|
|
|
|
|
|
|
|
|
|||||||||||||||||||||||||
| Total average interest earning assets |
363,234 | 9,524 | 2.62 | 401,368 | 9,895 | 2.47 | 444,373 | 14,655 | 3.30 | |||||||||||||||||||||||||||
|
|
|
|
|
|
|
|
|
|
|
|
|
|||||||||||||||||||||||||
| Total average non-interest earning assets |
16,257 | — | — | 18,174 | — | — | 26,059 | — | — | |||||||||||||||||||||||||||
|
|
|
|
|
|
|
|
|
|
|
|
|
|||||||||||||||||||||||||
| Total average assets |
₩ | 379,491 | ₩ | 9,524 | 2.51 | % | ₩ | 419,542 | ₩ | 9,895 | 2.36 | % | ₩ | 470,432 | ₩ | 14,655 | 3.12 | % | ||||||||||||||||||
|
|
|
|
|
|
|
|
|
|
|
|
|
|||||||||||||||||||||||||
158
Table of Contents
| Year ended December 31, | ||||||||||||||||||||||||||||||||||||
| 2020 | 2021 | 2022 | ||||||||||||||||||||||||||||||||||
| Average Balance(1) |
Interest Expense |
Average Cost |
Average Balance(1) |
Interest Expense |
Average Cost |
Average Balance(1) |
Interest Expense |
Average Cost |
||||||||||||||||||||||||||||
| (in billions of Won, except percentages) | ||||||||||||||||||||||||||||||||||||
| Liabilities |
||||||||||||||||||||||||||||||||||||
| Interest-bearing liabilities: |
||||||||||||||||||||||||||||||||||||
| Deposits due to customers: |
||||||||||||||||||||||||||||||||||||
| Demand deposits |
₩ | 10,110 | ₩ | 49 | 0.48 | % | ₩ | 14,634 | ₩ | 106 | 0.72 | % | ₩ | 12,875 | ₩ | 88 | 0.68 | % | ||||||||||||||||||
| Time and savings deposits |
225,563 | 2,056 | 0.91 | 243,708 | 1,495 | 0.61 | 258,594 | 3,210 | 1.24 | |||||||||||||||||||||||||||
| Certificates of deposit |
1,677 | 22 | 1.31 | 2,858 | 27 | 0.94 | 5,263 | 115 | 2.19 | |||||||||||||||||||||||||||
| Other deposits |
34,861 | 360 | 1.03 | 38,374 | 279 | 0.73 | 47,978 | 708 | 1.48 | |||||||||||||||||||||||||||
|
|
|
|
|
|
|
|
|
|
|
|
|
|||||||||||||||||||||||||
| Total deposits |
272,211 | 2,487 | 0.91 | 299,574 | 1,907 | 0.64 | 324,710 | 4,121 | 1.27 | |||||||||||||||||||||||||||
| Borrowings: |
||||||||||||||||||||||||||||||||||||
| Borrowings |
18,451 | 217 | 1.18 | 19,845 | 157 | 0.79 | 26,793 | 514 | 1.92 | |||||||||||||||||||||||||||
| Securities sold with agreements to resell |
750 | 5 | 0.67 | 819 | 5 | 0.61 | 1,111 | 21 | 1.89 | |||||||||||||||||||||||||||
| Commercial paper |
2,167 | 48 | 2.22 | 2,552 | 58 | 2.27 | 2,100 | 63 | 3.00 | |||||||||||||||||||||||||||
|
|
|
|
|
|
|
|
|
|
|
|
|
|||||||||||||||||||||||||
| Total borrowings |
21,368 | 270 | 1.26 | 23,216 | 220 | 0.95 | 30,004 | 598 | 1.99 | |||||||||||||||||||||||||||
| Debentures |
32,315 | 723 | 2.24 | 40,935 | 727 | 1.78 | 46,414 | 1,036 | 2.23 | |||||||||||||||||||||||||||
| Other |
21,110 | 46 | 0.22 | 20,925 | 55 | 0.26 | 25,354 | 203 | 0.80 | |||||||||||||||||||||||||||
|
|
|
|
|
|
|
|
|
|
|
|
|
|||||||||||||||||||||||||
| Total average interest-bearing liabilities |
347,004 | 3,526 | 1.02 | 384,650 | 2,909 | 0.76 | 426,482 | 5,958 | 1.40 | |||||||||||||||||||||||||||
|
|
|
|
|
|
|
|
|
|
|
|
|
|||||||||||||||||||||||||
| Total average non-interest-bearing liabilities |
6,300 | — | — | 6,727 | — | — | 13,653 | — | — | |||||||||||||||||||||||||||
|
|
|
|
|
|
|
|
|
|
|
|
|
|||||||||||||||||||||||||
| Total average liabilities |
353,304 | 3,526 | 1.00 | 391,377 | 2,909 | 0.74 | 440,135 | 5,958 | 1.35 | |||||||||||||||||||||||||||
|
|
|
|
|
|
|
|
|
|
|
|
|
|||||||||||||||||||||||||
| Total average equity |
26,187 | — | — | 28,165 | — | — | 30,298 | — | — | |||||||||||||||||||||||||||
|
|
|
|
|
|
|
|
|
|
|
|
|
|||||||||||||||||||||||||
| Total average liabilities and equity |
₩ | 379,491 | ₩ | 3,526 | 0.93 | % | ₩ | 419,542 | ₩ | 2,909 | 0.69 | % | ₩ | 470,433 | ₩ | 5,958 | 1.27 | % | ||||||||||||||||||
|
|
|
|
|
|
|
|
|
|
|
|
|
|||||||||||||||||||||||||
| (1) | Average balances are based on daily balances for Woori Bank and on quarterly balances for all of our other subsidiaries and our structured companies. |
| (2) | Interest income from credit cards is derived from interest on credit card loans and credit card installment purchases. |
| (3) | Not including other financial assets, and prior to deducting allowance for credit losses and present value discount or reflecting deferred origination costs. |
| (4) | Includes automobile lease financing to consumer borrowers. |
| (5) | Includes home equity loans. |
159
Table of Contents
Analysis of Changes in Net Interest Income—Volume and Rate Analysis
The following table provides an analysis of changes in interest income, interest expense and net interest income based on changes in volume and changes in rate for 2021 compared to 2020 and 2022 compared to 2021. Information is provided with respect to: (1) effects attributable to changes in volume (changes in volume multiplied by prior rate) and (2) effects attributable to changes in rate (changes in rate multiplied by prior volume). Changes attributable to the combined impact of changes in rate and volume have been allocated proportionately to the changes due to volume changes and changes due to rate changes.
| 2021 vs. 2020 Increase/(decrease) due to changes in |
2022 vs. 2021 Increase/(decrease) due to changes in |
|||||||||||||||||||||||
| Volume | Rate | Total | Volume | Rate | Total | |||||||||||||||||||
| (in billions of Won) | ||||||||||||||||||||||||
| Interest-earning assets |
||||||||||||||||||||||||
| Due from banks |
₩ | 7 | ₩ | (14 | ) | ₩ | (7 | ) | ₩ | 7 | ₩ | 190 | ₩ | 197 | ||||||||||
| Financial assets at fair value through profit or loss |
24 | (27 | ) | (3 | ) | 4 | 57 | 61 | ||||||||||||||||
| Financial assets at fair value through other comprehensive income |
45 | (101 | ) | (56 | ) | 64 | 188 | 252 | ||||||||||||||||
| Securities at amortized cost |
(49 | ) | (9 | ) | (58 | ) | 97 | 93 | 190 | |||||||||||||||
| Loans(1): |
||||||||||||||||||||||||
| Commercial and industrial |
446 | (169 | ) | 277 | 509 | 1,672 | 2,181 | |||||||||||||||||
| Trade financing |
(6 | ) | (52 | ) | (58 | ) | 11 | 120 | 131 | |||||||||||||||
| Lease financing(2) |
61 | 10 | 71 | 41 | 18 | 59 | ||||||||||||||||||
| Other commercial |
17 | (14 | ) | 3 | 20 | 80 | 100 | |||||||||||||||||
| Securities purchased with agreements to resell |
7 | (4 | ) | 3 | — | 50 | 50 | |||||||||||||||||
| General purpose household(3) |
212 | (108 | ) | 104 | (16 | ) | 926 | 910 | ||||||||||||||||
| Mortgage |
238 | (177 | ) | 61 | 121 | 449 | 570 | |||||||||||||||||
| Credit cards |
78 | (44 | ) | 34 | 62 | (19 | ) | 43 | ||||||||||||||||
| Other |
(4 | ) | 4 | — | 3 | 13 | 16 | |||||||||||||||||
|
|
|
|
|
|
|
|
|
|
|
|
|
|||||||||||||
| Total interest income |
₩ | 1,076 | ₩ | (705 | ) | ₩ | 371 | ₩ | 923 | ₩ | 3,837 | ₩ | 4,760 | |||||||||||
|
|
|
|
|
|
|
|
|
|
|
|
|
|||||||||||||
| Interest-bearing liabilities |
||||||||||||||||||||||||
| Deposits due to customers: |
||||||||||||||||||||||||
| Demand deposits |
₩ | 22 | ₩ | 35 | ₩ | 57 | ₩ | (13 | ) | ₩ | (5 | ) | ₩ | (18 | ) | |||||||||
| Time and savings deposits |
165 | (726 | ) | (561 | ) | 91 | 1,624 | 1,715 | ||||||||||||||||
| Certificates of deposit |
15 | (10 | ) | 5 | 23 | 65 | 88 | |||||||||||||||||
| Other deposits |
36 | (117 | ) | (81 | ) | 70 | 359 | 429 | ||||||||||||||||
| Borrowings: |
||||||||||||||||||||||||
| Borrowings |
16 | (76 | ) | (60 | ) | 55 | 302 | 357 | ||||||||||||||||
| Securities sold with agreements to resell |
— | — | — | 2 | 14 | 16 | ||||||||||||||||||
| Commercial paper |
9 | 1 | 10 | (10 | ) | 15 | 5 | |||||||||||||||||
| Debentures |
193 | (189 | ) | 4 | 98 | 211 | 309 | |||||||||||||||||
| Other |
— | 9 | 9 | 12 | 136 | 148 | ||||||||||||||||||
|
|
|
|
|
|
|
|
|
|
|
|
|
|||||||||||||
| Total interest expense |
₩ | 456 | ₩ | (1,073 | ) | ₩ | (617 | ) | ₩ | 328 | ₩ | 2,721 | ₩ | 3,049 | ||||||||||
|
|
|
|
|
|
|
|
|
|
|
|
|
|||||||||||||
| Net interest income |
₩ | 620 | ₩ | 368 | ₩ | 988 | ₩ | 595 | ₩ | 1,116 | ₩ | 1,711 | ||||||||||||
|
|
|
|
|
|
|
|
|
|
|
|
|
|||||||||||||
| (1) | Not including other financial assets and prior to deducting allowance for credit losses and present value discount or reflecting deferred origination costs. |
| (2) | Includes automobile lease financing to consumer borrowers. |
| (3) | Includes home equity loans. |
160
Table of Contents
Legal Proceedings and Regulatory Actions
As a financial institution with diverse operations, we are subject to legal proceedings and regulatory actions in the ordinary course of our business.
Woori Bank
In June 2022, Woori Bank discovered that large amounts of overseas wire transfers had been made under unusual circumstances in 2020 and 2021, and reported such activities to the Financial Supervisory Service. After similar activities were also reported by another bank, the Financial Supervisory Service launched an investigation in August 2022 into wire transfers under similar circumstances across all major banks in Korea, including Woori Bank, which were believed to be made in connection with cryptocurrency arbitrage transactions, in relation to the Foreign Exchange Transactions Act of Korea and the anti-money laundering provisions under the Act on Reporting and Use of Certain Financial Transaction Information of Korea. In an interim report released in September 2022, the Financial Supervisory Service reported that an aggregate of over US$7.2 billion of suspicious overseas wire transfers were made through 12 banks, of which US$1.6 billion had been wired through Woori Bank. An employee of Woori Bank has also been arrested under allegations of aiding such wire transfers and alerting the transferors about the investigations. In April 2023, the Financial Supervisory Service announced that it has concluded its investigation and that it is in the process of deliberating on disciplinary measures pursuant to applicable laws and procedures. The prosecutors’ offices in Korea are also currently investigating these wire transfers and the parties involved pursuant to applicable foreign exchange and anti-money laundering laws and regulations. While Woori Bank intends to fully cooperate with such investigations, it is not possible to predict the final outcome of such investigations at this time. There can be no assurance that such investigations will not result in an unfavorable outcome, including the imposition of monetary damages, fines and other penalties against Woori Bank, which, if significant, may adversely affect its results of operations, cash flows and reputation.
In April 2022, Woori Bank became aware of a series of embezzlements committed between 2012 and 2020 by one of its employees. As of December 31, 2022, Woori Bank has determined that the aggregate amount of such embezzlements was approximately ₩70.8 billion and has recovered ₩3.4 billion of this amount. Woori Bank has reported such incident to the relevant government authorities and has cooperated with their investigations. The Financial Supervisory Service released an interim investigation report in July 2022, stating that the embezzlements occurred primarily as a result of the employee’s actions. In September 2022, the Seoul Central district court sentenced the embezzler to 13 years in prison, which decision is currently on appeal. The Financial Supervisory Service has concluded its investigation, and in January 2023, its disciplinary committee approved various penalties to be issued to certain Woori Bank employees in connection with the embezzlement. There can be no assurance that such decisions by the Financial Supervisory Service, as well as those by other government authorities, will not adversely affect our results of operations, cash flows and reputation.
In August 2019, the Financial Supervisory Service commenced an investigation into past sales by Woori Bank and other banks in Korea of derivative-linked fund and securities products tied to yields on treasury bonds of Germany, the United Kingdom and the United States, which may have resulted in significant losses to certain customers who purchased such products. In December 2019, the dispute settlement committee of the Financial Supervisory Service recommended (i) the reimbursement of 40 to 80% of the related losses to certain customers by the banks involved in the sale of such products, including Woori Bank, and (ii) individual settlements with other customers who were not subject to the 40 to 80% reimbursement recommendation. Accordingly, as of December 31, 2022, Woori Bank reimbursed 1,254 out of the 1,258 customers that agreed to accept the recommendation, which compose a vast majority of the customers with such claims. In March 2020, the Financial Services Commission imposed on Woori Bank a fine of ₩19.7 billion and a six-month ban on sales of new private equity fund products and confirmed the Financial Supervisory Service’s decision to impose a warning of reprimand on our chief executive officer. Immediately following such decision, our chief executive officer, in his individual capacity, filed a request to nullify the warning of reprimand as well as an injunction request to suspend the decision against him in the Seoul Administrative Court. On March 20, 2020, the injunction
161
Table of Contents
request was granted and was affirmed by the Seoul High Court on appeal on August 25, 2020. Such decision was confirmed on September 2, 2020. The warning of reprimand was revoked on August 27, 2021 by the Seoul Administrative Court, which decision was affirmed by the Seoul High Court on July 22, 2022 and by the Supreme Court on December 15, 2022. In addition, Woori Bank filed a formal objection to the Financial Services Commission’s imposition of the fine on May 22, 2020 in the Seoul Central District Court, where the case is currently pending. There can be no assurance that such decisions by the Financial Services Commission and the Financial Supervisory Service (as well as any similar investigations by other government authorities, and private claims by customers, to which we may become subject) will not adversely affect our results of operations, cash flows and reputation.
In February 2020, the Seoul Southern District Prosecutors’ Office commenced an investigation into the management of certain fund products by Lime Asset Management Co. which may have resulted in significant losses to certain customers who purchased such products from banks and securities companies in Korea, including Woori Bank. Such products of Lime Asset Management Co. included trade finance funds with investments in certain funds managed by International Investment Group, which had its license revoked by the Securities and Exchange Commission in November 2018 for concealing losses and selling fraudulent loan assets, triggering suspension of the redemption of such trade finance funds, as well as other fund products. In July 2020, the dispute settlement committee of the Financial Supervisory Service declared that the sale of the trade finance funds was voidable for fraud and misrepresentation by Lime Asset Management Co., and recommended that all sellers of such funds, including Woori Bank, refund the customers in full. Accordingly, Woori Bank refunded an aggregate amount of ₩64.7 billion to 288 customers that had purchased the trade finance funds from Woori Bank. In January 2022, Woori Bank filed a lawsuit in the Seoul Southern District Court against Lime Asset Management Co. and Shinhan Investment Corp., which had entered into a total return swap contract with Lime Asset Management Co. in connection with such trade finance funds, to recover the full amount that it had refunded, the outcome of which remains uncertain. In addition, the dispute settlement committee recommended that the banks involved in the sales of fund products managed by Lime Asset Management Co. other than the trade finance funds reimburse 40% to 80% of the losses to its customers. Accordingly, as of December 31, 2022, Woori Bank reimbursed an aggregate amount of ₩144.9 billion to 1,075 out of the 1,301 customers with losses relating to such fund products, including the amounts that had previously been paid out prior to such recommendation, and is continuing to negotiate a settlement with such customers. In July 2022, the Financial Services Commission imposed on Woori Bank a fine of ₩7.2 billion and a three-month ban on sales of new private equity fund products in connection with the sale of such fund products of Lime Asset Management Co. by Woori Bank. Also in July 2022, Woori Bank satisfied the fine by making a payment of ₩5.8 billion pursuant to the Act on the Regulation of Violations of Public Order, which allows an administrative agency such as the Financial Services Commission to reduce a fine when the concerned party voluntarily pays the fine by within the prescribed deadline for submitting an opinion regarding the imposition of the fine. In addition, in November 2022, the Financial Supervisory Service issued a warning of reprimand to our former chief executive officer, which was not appealed, and also imposed various penalties ranging from temporary reductions in salary to suspensions of duty on Woori Bank’s employees. Woori Bank is fully cooperating with all relevant investigations by government authorities, including investigations by the Seoul Southern District Prosecutors’ Office, but it is not possible to predict the final outcome of such investigations at this time. There can be no assurance that such investigations (as well as any private claims by customers, to which we may become subject) will not result in an unfavorable outcome, including the imposition of monetary damages, fines and other penalties against us, which, if significant, may adversely affect our results of operations, cash flows and reputation.
In April 2020, the Korea Financial Intelligence Unit imposed a penalty of ₩16.5 billion on Woori Bank for its failure to file with the Korea Financial Intelligence Unit certain currency transaction reports, which resulted from errors and malfunctions relating to Woori Bank’s computer systems that failed to detect the relevant transactions. In May 2020, Woori Bank filed an administrative action appealing such monetary penalty. A summary judgement ruling in June 2022 reduced the penalty to ₩2.5 billion, and the amount was confirmed at trial in December 2022. Both Woori Bank and the Korea Financial Intelligence Unit have appealed the ruling, and the case is currently pending.
162
Table of Contents
Other than the legal proceedings discussed above, we and our subsidiaries are not a party to any legal or administrative proceedings, and no proceedings are known by us to be contemplated by governmental authorities or third parties, which, if adversely determined, may have a material adverse effect on our consolidated financial condition or results of operations.
Dividends
We declare our dividend annually at the annual general meeting of shareholders. We generally hold this meeting within three months after the end of each fiscal year. Pursuant to our amended articles of incorporation that went into effect on March 24, 2023, we must pay the annual dividend to the shareholders of record as of the record date, which is set by a resolution of the Board of Directors upon providing at least two (2) weeks prior notice of such date to the public. We can distribute the annual dividend either in cash or in stock. Cash dividends may be paid out of retained earnings that have not been appropriated to statutory reserves. Specifically, we may pay dividends up to the value of the net assets stated on the balance sheet after deducting the sum of capital, the capital reserve and the earned surplus reserve accumulated until the pertinent period for the settlement of our accounts, the amount to be accumulated for the pertinent period for the settlement of our accounts and unrealized profits.
In addition, pursuant to our amended articles of incorporation that went into effect on March 24, 2023, we may declare and distribute quarterly dividends to shareholders registered in our registry as of the end of March, June and September pursuant to a board resolution. Our quarterly dividends shall be authorized by a resolution of the Board of Directors executed within 45 days of the end of March, June and September, as applicable. However, pursuant to amendments to the Financial Investment Services and Capital Markets Act, which are expected to be proposed at some point in 2023, we expect to make corresponding amendments to our articles of incorporation, which may include removing the requirement that quarterly dividends be issued to shareholders registered as of the end of March, June and September.
The table below sets forth the dividend per share of common stock and the total amount of dividends declared by us in respect of the years ended December 31, 2020 and 2021 and 2022. Except as otherwise noted, the dividends set forth below with respect to each year were declared, paid and recorded in the following year.
| Fiscal year | Dividends Per Share of Common Stock |
Total Amount Of Cash Dividends Paid |
||||||
| (in Won) | (in millions of Won) | |||||||
| 2020 | 360 | 260,016 | ||||||
| 2021(1) | 900 | 654,384 | ||||||
| 2022(2) | 1,130 | 822,706 | ||||||
| (1) | Includes interim dividends of Won 108,340 million (Won 150 per share of common stock) declared and paid in 2021. |
| (2) | Includes interim dividends of Won 109,209 million (Won 150 per share of common stock) declared and paid in 2022. |
Future dividends will depend upon our revenues, cash flow, financial condition and other factors. As an owner of ADSs, you will be entitled to receive dividends payable in respect of the shares of common stock represented by such ADSs.
For a description of the tax consequences of dividends paid to our shareholders, see “Item 10.E. Taxation—United States Taxation—Dividends” and “—Korean Taxation—Taxation of Dividends on Common Shares or ADSs.”
| Item 8.B. | Significant Changes |
Not Applicable
| Item 9. | THE OFFER AND LISTING |
| Item 9.A. | Offering and Listing Details |
Principal Markets
The principal trading market for our common stock is the KRX KOSPI Market. Our common stock has been listed on the KRX KOSPI Market under the identifying code 316140 since February 13, 2019, and the ADSs
163
Table of Contents
have been listed on the New York Stock Exchange under the symbol “WF” since January 11, 2019. The ADSs are identified by the CUSIP number 981064108.
Woori Finance Holdings’ common stock was listed on the KRX KOSPI Market on June 24, 2002, and was suspended from trading from October 30, 2014 and de-listed on November 18, 2014 following the merger of Woori Finance Holdings with Woori Bank. Woori Finance Holdings’ ADSs were listed on the New York Stock Exchange since September 29, 2003 and were traded under the CUSIP number 981063100. Following the merger, Woori Bank’s common stock was newly listed on the KRX KOSPI Market on November 19, 2014, and Woori Bank’s ADSs succeeded to the listing of Woori Finance Holdings’ ADSs on the New York Stock Exchange on November 1, 2014. Woori Bank’s ADSs were traded under the CUSIP number 98105T104.
In connection with our establishment in January 2019 as a new financial company pursuant to a “comprehensive stock transfer” under Korean law, Woori Bank’s common stock was suspended from trading from January 9, 2019 and was de-listed from the KRX KOSPI Market on February 13, 2019. Following the stock transfer, our common stock was newly listed on the KRX KOSPI Market on February 13, 2019, and our ADSs succeeded to the listing of Woori Bank’s ADSs on the New York Stock Exchange on January 11, 2019.
As of the date of this annual report, we have 728,058,225 shares of common stock outstanding.
Restrictions Applicable to ADSs
An investor does not need Korean governmental approval to sell or purchase our ADSs in the secondary market outside Korea or to withdraw shares of our common stock from our ADS deposit facility or deliver those withdrawn shares in Korea. However, a foreign investor who intends to acquire shares must obtain an investment registration card from the Financial Supervisory Service as described below. Either the foreign investor or its standing proxy in Korea must immediately report its acquisition of the shares to the governor of the Financial Supervisory Service.
Persons who acquire shares of our common stock by withdrawing those shares from our ADS deposit facility may exercise their preemptive rights for new shares, participate in free distributions and receive dividends on shares without any further Korean governmental approval.
Restrictions Applicable to Shares
As a result of amendments to the Foreign Exchange Transaction Laws and Financial Services Commission regulations (which we refer to collectively as the “Investment Rules”), including the Regulations on Financial Investment Business, adopted since January 1992 in connection with the opening and operation of Korea’s stock market, foreign investors may generally invest, with limited exceptions and subject to procedural requirements, in all shares of Korean companies, whether listed on the KRX KOSPI Market or registered on the KRX KOSDAQ Market. Foreign investors may trade shares listed on the KRX KOSPI Market or registered on the KRX KOSDAQ Market only through the KRX KOSPI Market or the KRX KOSDAQ Market, except in limited circumstances. These circumstances include:
| • | odd-lot share trading; |
| • | acquiring shares (which we refer to as “Converted Shares”) by exercising warrants, conversion rights or exchange rights under bonds with warrants, convertible bonds or exchangeable bonds or withdrawal rights under depositary receipts issued outside of Korea by a Korean company; |
| • | acquiring shares through inheritance, donation, bequest or exercise of shareholders’ rights, including pre-emptive rights or rights to participate in free distributions and receive dividends; |
| • | subject to certain exceptions, over-the-counter transactions between foreign investors of a class of shares for which the limit on aggregate acquisition by foreign investors, as explained below, has been reached or exceeded; and |
| • | sale and purchase of shares at fair value between foreigners who are part of an investor group comprised of foreign companies investing under the control of a common investment manager pursuant to applicable laws or contract. |
164
Table of Contents
For over-the-counter transactions between foreign investors outside the KRX KOSPI Market or the KRX KOSDAQ Market involving a class of shares for which the limit on aggregate acquisition by foreign investors has been reached or exceeded, a financial investment company with a brokerage license in Korea must act as an intermediary. Odd-lot trading of shares outside the KRX KOSPI Market or the KRX KOSDAQ Market must involve a financial investment company with a dealing license in Korea as the other party. Foreign investors may not engage in margin transactions by borrowing shares from financial investment companies with a dealing and/or brokerage license with respect to shares that are subject to a foreign ownership limit.
The Investment Rules require a foreign investor who wishes to invest in shares on the KRX KOSPI Market or the KRX KOSDAQ Market (including Converted Shares and shares being issued for initial listing on the KRX KOSPI Market or registration on the KRX KOSDAQ Market) to register with the Financial Supervisory Service before making an investment. This registration requirement does not apply to foreign investors who acquire Converted Shares with the intention of selling the Converted Shares within three months from the acquisition date. The Financial Supervisory Service will issue an investment registration card to each registering foreign investor. This card must be presented each time the foreign investor opens a brokerage account with a financial investment company with a brokerage license. Foreign investors eligible to obtain an investment registration card include:
| • | foreign nationals who have not been residing in Korea for a consecutive period of six months or more; |
| • | foreign governments; |
| • | foreign municipal authorities; |
| • | foreign public institutions; |
| • | international financial institutions or similar international organizations; |
| • | corporations incorporated under foreign laws; and |
| • | any person in any additional category designated under the Enforcement Decree of the Financial Investment Services and Capital Markets Act. |
All Korean offices of a foreign corporation (as a group) are treated as a separate foreign investor from the offices of the corporation outside Korea for these purposes. However, a foreign corporation or depositary issuing depositary receipts may obtain one or more investment registration cards in its name in certain circumstances identified in the relevant regulations.
When a foreign investor purchases shares through the KRX KOSPI Market or the KRX KOSDAQ Market, it need not make a separate report because the investment registration card system is designed to control and oversee foreign investment through a computer system. If, however, a foreign investor acquires or sells shares outside the KRX KOSPI Market or the KRX KOSDAQ Market, that investor or its standing proxy must report that transaction to the governor of the Financial Supervisory Service at that time. In addition, if a foreign investor acquires or sells its shares in connection with a tender offer, odd-lot trading of shares or trades of a class of shares for which the aggregate foreign ownership limit has been reached or exceeded, that investor or its standing proxy must ensure that the financial investment company engaged to facilitate the transaction reports the transaction to the governor of the Financial Supervisory Service. Also, sale and purchase of shares at fair value between foreigners who are part of an investor group comprised of foreign companies investing under the common control of a common investment manager pursuant to applicable laws or contract are required to be reported to the governor of the Financial Supervisory Service. A foreign investor may appoint a standing proxy to exercise shareholders’ rights or perform any matters related to the foregoing activities if that investor does not perform these activities itself. A foreign investor may be exempted from complying with the standing proxy rules with the approval of the governor of the Financial Supervisory Service in cases deemed unavoidable by reason of conflict between laws of Korea and the home country of the foreign investor.
The shares of a listed Korean company owned by a foreign investor must be electronically registered in accordance with the Act on Electronic Registration of Stocks, Bonds, Etc. through an eligible custodian in Korea.
165
Table of Contents
The same entities eligible to act as a standing proxy are eligible to act as a custodian of shares for a non-resident or foreign investor. A foreign investor may be exempted from complying with the above requirement if it (i) acquires shares publicly offered or sold outside Korea for the purpose of listing on an overseas stock exchange or (ii) acquires or disposes of shares through an overseas stock exchange if such shares are simultaneously listed on the Korea Exchange and such overseas stock exchange.
Under the Investment Rules, with certain limitations, foreign investors may acquire shares of a Korean company without being subject to any foreign investment limit. Under one of these limitations, foreign investors may acquire no more than 40% of the outstanding share capital of designated public corporations. In addition, designated public corporations may set a limit on the acquisition of shares by a single person in their articles of incorporation. If a foreign investor acquires 10% or more of the outstanding shares with voting rights of a Korean company and the investment amount is at least ₩100 million, that investment constitutes a “foreign direct investment” under the Foreign Investment Promotion Act of Korea. Generally, a foreign direct investment must be reported to the Ministry of Trade, Industry and Energy of Korea. The acquisition of a Korean company’s shares by a foreign investor may be subject to certain foreign or other shareholding restrictions in the event that the restrictions are prescribed in a specific law that regulates the business of the Korean company. For a description of the restrictions applicable to Korean banks, see “—Principal Regulations Applicable to Banks.”
Under the Foreign Exchange Transaction Laws, a foreign investor who intends to acquire shares must designate a foreign exchange bank at which he must open a foreign currency account and a Won account exclusively for stock investments. Approval is not required for remittance into Korea and deposit of foreign currency funds in the foreign currency account. Foreign currency funds may be transferred from the foreign currency account at the time required to place a deposit for, or settle the purchase price of, a stock purchase transaction to a Won account opened at a financial investment company with a dealing and/or brokerage license. Funds in the foreign currency account may be remitted abroad without any Korean governmental approval.
Dividends on shares of Korean companies are paid in Won. Korean governmental approval is not required for foreign investors to receive dividends on, or the Won proceeds from the sale of, any shares to be paid, received and retained in Korea. Dividends paid on, and the Won proceeds of the sale of, any shares held by a non-resident of Korea must be deposited either in a Won account with the investor’s financial investment company with a dealing and/or brokerage license or in its own Won account. Funds in a foreign investor’s Won account may be transferred to its foreign currency account or withdrawn for local living expenses up to certain limits. These funds may also be used to make future investments in shares or to pay the subscription price of new shares obtained through the exercise of pre-emptive rights.
Financial investment companies with a dealing or brokerage license may open foreign currency accounts with foreign exchange banks exclusively to accommodate foreign investors’ stock investments in Korea. Through these accounts, financial investment companies with a dealing or brokerage license may enter into limited foreign exchange transactions, such as converting foreign currency funds and Won funds, either as a counterparty to or on behalf of foreign investors, without the investors having to open their own accounts with foreign exchange banks.
| Item 9.B. | Plan of Distribution |
Not Applicable
| Item 9.C. | Markets |
See “Item 9.A. Offering and Listing Details.”
| Item 9.D. | Selling Shareholders |
Not Applicable
| Item 9.E. | Dilution |
Not Applicable
166
Table of Contents
| Item 9.F. | Expenses of the Issuer |
Not Applicable
| Item 10. | ADDITIONAL INFORMATION |
| Item 10.A. | Share Capital |
Not Applicable
| Item 10.B. | Memorandum and Articles of Association |
Description of Capital Stock
We have set forth below information relating to our capital stock, including brief summaries of some of the provisions of our articles of incorporation, the Korean Commercial Code, Financial Investment Services and Capital Markets Act, and other related laws of Korea. These summaries do not purport to be complete and are subject to our articles of incorporation, and the applicable provisions of the Financial Investment Services and Capital Markets Act, the Korean Commercial Code and those related laws.
Our authorized share capital is 4,000,000,000 shares. Our articles of incorporation authorize us to issue:
| • | shares of common stock, par value ₩5,000 per share; |
| • | “class shares,” par value ₩5,000 per share. |
Subject to applicable laws and regulations, our articles of incorporation authorize us to issue a number of non-voting “class shares” equal to as much as one-half of all of the issued and outstanding shares.
As of the date of this annual report, 728,060,549 shares of common stock were issued and 728,058,225 shares of common stock were outstanding. Pursuant to our articles of incorporation, which became effective upon our establishment on January 11, 2019 and was subsequently amended on March 24, 2023, we are authorized to issue various types of “class shares,” which include shares of voting and non-voting preferred stock, convertible stock, redeemable preferred stock and hybrid securities comprising one or more elements of the foregoing types of shares. There are no class shares currently outstanding. All of the issued and outstanding shares are fully paid and non-assessable and are in electronically registered form. As of the date of this annual report, our authorized but unissued share capital was 3,271,939,451 shares. We may issue the unissued shares without further shareholder approval, but these issuances are subject to a board resolution as provided in the articles of incorporation. See “—Pre-emptive Rights and Issuances of Additional Shares” and “—Dividends and Other Distributions—Distribution of Free Shares.” For a discussion of the history of our share capital, see Note 28 of the notes to our consolidated financial statements and “Item 4.A. History and Development of the Company—History—Establishment of Woori Finance Holdings,” “—Merger of Woori Bank and Woori Finance Holdings” and “—Establishment of Woori Financial Group.”
Our articles of incorporation allow our shareholders, by special resolution adopted by the affirmative votes of at least two-thirds of the voting rights of the shareholders present at a general meeting of shareholders and at least one-third of the total number of issued and outstanding shares, to grant to our officers, directors and employees stock options exercisable for up to 15% of the total number of our issued and outstanding shares. Our board of directors may also grant stock options exercisable for up to 1% of our issued and outstanding shares to our officers and employees other than directors. However, any grant by our board of directors must be approved by our shareholders at their next general meeting convened immediately after the grant date. As of the date of this annual report, our officers, directors and employees do not hold any options to purchase shares of common stock. See “Item 6.E. Share Ownership.”
Our articles of incorporation reflect the adoption of the electronic securities system pursuant to the Act on Electronic Registration of Stocks, Bonds, Etc. Accordingly, in lieu of issuing share certificates, we electronically register the rights to be indicated on our share certificates on the electronic registry of the electronic registration agency.
167
Table of Contents
Organization
We are a financial holding company established under the Financial Holding Company Act. We are registered with the commercial registry office of Seoul District Court.
Interests of Directors
Our articles of incorporation provide that any director who has a material interest in the subject matter of a resolution to be taken by the board of directors cannot vote on such resolution. Our articles of incorporation also provide that the remuneration of our directors is to be determined by the resolution of the general meeting of shareholders.
Our articles of incorporation do not contain any special provisions with respect to the borrowing powers exercisable by directors, their retirement age or a requirement to hold any shares of our capital stock.
See “Item 6.C. Board Practices” for more information on our directors.
Limitation on Liability of Directors
Our articles of incorporation provide that we may, upon the resolution of the general meeting of shareholders, limit the liability of our directors (in their capacity as such) to an amount not less than six times (or three times in case of outside directors) the aggregate amount of the remuneration we paid to such directors during the most recent one-year period, provided that such limitation shall not apply with regard to any liability arising from such directors’ gross negligence, willful misconduct or violation of their duties regarding self-dealing or corporate opportunity.
Dividends and Other Distributions
Dividends. We distribute dividends to shareholders in proportion to the number of shares of the relevant class of capital stock they own. Subject to the requirements of the Korean Commercial Code and other applicable laws and regulations, we expect to pay full annual dividends on newly issued stock for the year in which it is issued. Specifically, we may pay dividends up to the value of the net assets stated on the statement of financial position after deducting the sum of capital, the capital reserve and the earned surplus reserve accumulated until the pertinent period for the settlement of our accounts, the amount to be accumulated for the pertinent period for the settlement of our accounts and unrealized profits.
We declare our dividend annually at the annual general meeting of shareholders. We generally hold this meeting within three months after the end of each fiscal year. We can distribute the annual dividend in (i) cash, (ii) shares, provided that such shares must be distributed at par value and, if the market price of the shares is less than their par value, dividends in shares may not exceed one-half of the total annual dividend (including dividends in shares) or (iii) other forms of consideration. Pursuant to our amended articles of incorporation that went into effect on March 24, 2023, we may set a record date for determining the shareholders entitled to receive dividends by a resolution of the Board of Directors and provided that we give at least two (2) weeks prior notice of such record date to the public.
In addition, we may declare and distribute quarterly dividends to shareholders registered in our registry as of the end of March, June and September pursuant to a board resolution, provided that such resolution shall be made within 45 days from the end of March, June and September. However, pursuant to amendments to the Financial Investment Services and Capital Markets Act, which are expected to proposed at some point in 2023, we expect to make corresponding amendments to our articles of incorporation, which may include removing the requirement that quarterly dividends be issued to shareholders registered as of the end of March, June and September.
Under the Korean Commercial Code and our articles of incorporation, we do not have an obligation to pay any annual or quarterly dividend unclaimed for five years from the payment date.
The Financial Holding Company Act and related regulations require that each time a Korean financial holding company pays an annual dividend, it must set aside in its legal reserve to stated capital an amount equal
168
Table of Contents
to at least one-tenth of its net income after tax until the amount set aside reaches at least the aggregate amount of its stated capital. Unless it sets aside this amount, a Korean financial holding company may not pay an annual dividend. We intend to set aside allowances for loan losses and reserves for severance pay in addition to this legal reserve.
For information regarding taxation of dividends, see “Item 10.E. Taxation—United States Taxation—Dividends” and “—Korean Taxation—Taxation of Dividends on Common Shares or ADSs.”
Distribution of Free Shares. The Korean Commercial Code permits us to pay dividends in the form of shares out of retained or current earnings. It also permits us to distribute to our shareholders, in the form of free shares, an amount transferred from the capital surplus or legal reserve by a resolution of the board of directors. We would be required to distribute those free shares pro rata to all shareholders.
Pre-emptive Rights and Issuances of Additional Shares
We may issue authorized but unissued shares as our board of directors may determine, unless otherwise provided in the Korean Commercial Code. We must, however, offer any new shares on uniform terms to all shareholders who have preemptive rights and are listed on our shareholders’ register as of the applicable record date. Those shareholders are entitled to subscribe for any newly issued shares in proportion to their existing shareholdings. Our articles of incorporation provide, however, that we may issue new shares to persons other than existing shareholders if those shares are:
| • | publicly offered pursuant to Article 165-6 of the Financial Investment Services and Capital Markets Act (where the number of shares so offered may not exceed 50% of our total number of issued shares); |
| • | issued to directors or employees as a result of the exercise of stock options we granted to them pursuant to Article 542-3 of the Korean Commercial Code (where the number of shares so offered may not exceed 15% of our total number of issued shares); |
| • | issued to the members of our employee stock ownership association pursuant to Article 165-7 of the Financial Investment Services and Capital Markets Act; or |
| • | issued to specified foreign investors, foreign or domestic financial institutions, institutional investors or private equity funds for managerial purposes, such as obtaining new technology or improving our financial condition (where the number of shares so offered may not exceed 50% of our total number of issued shares). |
We must give public notice of pre-emptive rights for new shares and their transferability not less than two weeks before the record date (excluding the period during which the shareholders’ register is closed). We will notify the shareholders who are entitled to subscribe for newly issued shares of the deadline for subscription at least two weeks prior to the deadline. If a shareholder fails to subscribe on or before the deadline, its pre-emptive rights will lapse. Our board of directors may determine how to distribute shares in respect of which preemptive rights have not been exercised or where fractions of shares occur.
Under the Financial Investment Services and Capital Markets Act, each member of our employee stock ownership association, whether or not they are shareholders, has a preemptive right, subject to certain exceptions, to subscribe for up to 20% of any shares we publicly offer. This right is exercisable only so long as the total number of shares so acquired and held by the member does not exceed 20% of the total number of shares that have been issued or are newly issued. As of December 31, 2022, our employees owned 9.52% of our common stock through the employee stock ownership association.
In addition, our articles of incorporation permit us to issue convertible bonds or bonds with warrants, each up to an aggregate principal amount of ₩2 trillion, to persons other than existing shareholders. Under the Korean Commercial Code, we are permitted to distribute convertible bonds or bonds with warrants to persons other than existing shareholders only when we deem that this distribution is necessary for managerial purposes, such as obtaining new technology or improving our financial condition. In addition, pursuant to our articles of incorporation and the Act on Electronic Registration of Stocks, Bonds, Etc., in lieu of issuing certificates for bonds, share-related bonds (e.g., convertible bonds and bonds with warrants) and contingent capital securities, we
169
Table of Contents
electronically register rights to be indicated on such certificates on the electronic registry of the electronic registration agency. As of the date of this annual report, we have no convertible bonds or bonds with warrants outstanding.
Voting Rights
Each outstanding share of our common stock is entitled to one vote per share. However, voting rights with respect to shares of common stock that we hold or any of our subsidiaries holds may not be exercised. Unless stated otherwise in a company’s articles of incorporation, the Korean Commercial Code permits holders of an aggregate of 1% or more of the issued and outstanding shares with voting rights to request cumulative voting when electing two or more directors. Our articles of incorporation do not prohibit cumulative voting.
The Korean Commercial Code and our articles of incorporation provide that an ordinary resolution may be adopted if approval is obtained from the holders of at least a majority of those shares of common stock present or represented at a meeting and such majority also represents at least one-fourth of the total of our issued and outstanding voting shares. Holders of non-voting shares (other than enfranchised non-voting shares) will not be entitled to vote on any resolution or to receive notice of any general meeting of shareholders, unless the agenda of the meeting includes consideration of a resolution on which such holders are entitled to vote. The Korean Commercial Code provides that a company’s articles of incorporation may prescribe conditions for the enfranchisement of non-voting shares. For example, if our annual general shareholders’ meeting resolves not to pay to holders of non-voting shares with preferred dividend the annual dividend as determined by the board of directors at the time of issuance of such shares, the holders of non-voting shares with preferred dividend will be entitled to exercise voting rights from the general shareholders’ meeting following the meeting adopting such resolution to the end of a meeting to declare to pay such dividend with respect to the non-voting shares with preferred dividend. Holders of such enfranchised non-voting shares with preferred dividend will have the same rights as holders of common stock to request, receive notice of, attend and vote at a general meeting of shareholders.
The Korean Commercial Code provides that to amend the articles of incorporation, which is also required for any change to the authorized share capital of a company, and in certain other instances, including removal of a director of a company, dissolution, merger or consolidation of a company, transfer of the whole or a significant part of the business of a company, acquisition of all of the business of any other company, acquisition of a part of the business of any other company having a material effect on the business of the company or issuance of new shares at a price lower than their par value, a special resolution must be adopted by the approval of the holders of at least two-thirds of those shares present or represented at a meeting and such special majority must represent at least one-third of the total issued and outstanding shares with voting rights of the company.
In addition, in the case of amendments to the articles of incorporation or any merger or consolidation of a company or in certain other cases, where the rights or interest of the holders of class shares are adversely affected, a resolution must be adopted by a separate meeting of holders of class shares. Such a resolution may be adopted if the approval is obtained from shareholders of at least two-thirds of the class shares present or represented at such meeting and such shares also represent at least one-third of the total issued and outstanding class shares.
A shareholder may exercise his voting rights by proxy given to another person. The proxy must present the power of attorney prior to the start of a meeting of shareholders.
Liquidation Rights
If we are liquidated, the assets remaining after the payment of all our debts, liquidation expenses and taxes will be distributed to the shareholders in proportion to the number of shares held by them. Holders of class shares, none of which are issued or outstanding as of the date of this report, have no preferences in liquidation.
General Meetings of Shareholders
There are two types of general meetings of shareholders: (1) annual general meetings and (2) extraordinary general meetings. We are required to convene our annual general meeting within three months after the end of
170
Table of Contents
each fiscal year. Subject to a board resolution or court approval, an extraordinary general meeting of shareholders may be held when necessary or at the request of the holders of an aggregate of 3% or more of our outstanding shares, or the holders of an aggregate of 0.75% or more of our outstanding stock with voting rights, who have held those shares for at least six months, under the Act on the Corporate Governance of Financial Companies and its sub-regulations.
Under the Korean Commercial Code, an extraordinary general meeting of shareholders may also be convened at the request of our audit committee, subject to a board resolution or court approval. Holders of non-voting shares may be entitled to request a general meeting of shareholders only to the extent the non-voting shares have become enfranchised as described under the section entitled “—Voting Rights” above, hereinafter referred to as “enfranchised non-voting shares.” Meeting agendas will be determined by the board of directors or proposed by holders of an aggregate of 3% or more of the outstanding shares with voting rights or by holders of an aggregate of 0.1% or more of our issued and outstanding shares with voting rights, who have held those shares for at least six months, by way of a written proposal to the board of directors at least six weeks prior to the meeting, under the Act on the Corporate Governance of Financial Companies and its sub-regulations. Written notices or e-mail notices stating the date, place and agenda of the meeting must be given to the shareholders at least two weeks prior to the date of the general meeting of shareholders. Notice may, however, be given to holders of 1% or less of the total number of issued and outstanding shares which are entitled to vote, either by placing at least two public notices at least two weeks in advance of the meeting in at least two daily newspapers or by placing a notice through the electronic disclosure system operated by the Financial Supervisory Service or the Korea Exchange. Shareholders who are not on the shareholders’ register as of the record date will not be entitled to receive notice of the general meeting of shareholders, and they will not be entitled to attend or vote at such meeting. Holders of enfranchised non-voting shares who are on the shareholders’ register as of the record date will be entitled to receive notice of the general meeting of shareholders and they will be entitled to attend and vote at such meeting. Otherwise, holders of non-voting shares will not be entitled to receive notice of or vote at general meetings of shareholders.
The general meeting of shareholders will be held at our head office, which is our registered head office, or, if necessary, may be held anywhere in the vicinity of our head office.
Rights of Dissenting Shareholders
Pursuant to the Financial Investment Services and Capital Markets Act and the Act on the Structural Improvement of the Financial Industry, in certain limited circumstances (including, without limitation, if we transfer all or any significant part of our business, if we acquire a part of the business of any other company and such acquisition has a material effect on our business, or if we merge or consolidate with another company), dissenting holders of shares of our common stock and our stock with preferred dividends will have the right to require us to purchase their shares. To exercise such a right, shareholders must submit to us a written notice of their dissent by the day prior to the general meeting of shareholders. Within 20 days (10 days in the case of a stock transfer or exchange to establish a financial holding company or to own all issued shares of a subsidiary under the Financial Holding Company Act) after the date on which the relevant resolution is passed at such meeting, such dissenting shareholders must request in writing that we purchase their shares. We are obligated to purchase the shares from dissenting shareholders within one month after the end of such request period at a price to be determined by negotiation between us and the shareholder. If we cannot agree on a price with the shareholder through such negotiations, the purchase price will be the arithmetic mean of (x) the weighted average of the closing share prices on the KRX KOSPI Market for the two-month period prior to the date of the adoption of the relevant board of directors’ resolution, (y) the weighted average of the closing share prices on the KRX KOSPI Market for the one-month period prior to the date of the adoption of the relevant board of directors’ resolution and (z) the weighted average of the closing share prices on the KRX KOSPI Market for the one-week period prior to the date of the adoption of the relevant board of directors’ resolution. However, any dissenting shareholder who wishes to contest the purchase price may bring a claim in court.
171
Table of Contents
Required Disclosure of Ownership
Any person who directly or beneficially owns shares of our common stock that have voting rights, whether in the form of shares, ADSs, certificates representing the rights to subscribe for shares or equity-related debt securities (including convertible bonds and bonds with warrants) (which we refer to collectively as “Equity Securities”) that, when taken together with the Equity Securities beneficially owned by specified related persons or by any person acting in concert with that person, account for 5% or more of our total issued and outstanding shares on a fully diluted basis must report that holding to the Financial Services Commission and the KRX KOSPI Market no more than five business days after reaching 5%. That person must also report any subsequent change in the ownership interest of 1% or more of our total issued and outstanding shares on a fully diluted basis to the same entities no more than five business days after the change.
Anyone violating these reporting requirements may suffer criminal sanctions, including fines, imprisonment, an administrative fine of up to (i) 0.001% of the aggregate market value of total issued and outstanding stock or (ii) ₩500 million, whichever is lower, and/or a loss of voting rights with respect to the ownership of Equity Securities exceeding 5% of the total issued and outstanding Equity Securities with respect to which the reporting requirements were violated. Furthermore, the Financial Services Commission may order that person to dispose of the unreported Equity Securities.
In addition to the reporting requirements described above, any person whose direct or beneficial ownership of our stock accounts for 10% or more of the total issued and outstanding stock (which we refer to as a “major shareholder”) must report the status of its shareholding to the Korea Securities Futures Commission and the KRX KOSPI Market within five days after becoming a major shareholder. Also, the major shareholder must report any subsequent change in its ownership interest to those same entities within five days of the occurrence of the change, unless the change in the number of shares is less than 1,000 shares and the amount involved in such change is less than ₩10 million. A major shareholder that violates these reporting requirements may suffer criminal sanctions, including fines or imprisonment.
Other Provisions
Record Date. We may set a record date for determining the shareholders entitled to receive dividends by a resolution of the Board of Directors and provided that we give at least two (2) weeks prior notice of such record date to the public. The record date for quarterly dividends are the end of March, June and September. The Korean Commercial Code and our articles of incorporation permit us, upon at least two weeks’ public notice, to set a record date and/or close the register of shareholders for not more than three months for the purpose of determining the shareholders entitled to certain rights pertaining to the shares. However, if the record date and the period of time during which the register of shareholders is to be closed are fixed in the articles of incorporation, the Korean Commercial Code waives the requirement to provide at least two weeks’ public notice. The trading of shares and the electronic registration in respect thereof may continue while the register of shareholders is closed.
Annual and Interim Reports. At least one week before the annual general meeting of shareholders, we must make our annual report and audited financial statements available for inspection at our head office and at all of our branch offices. Copies of this report, the audited financial statements and any resolutions adopted at the general meeting of shareholders are available to our shareholders.
Under the Financial Investment Services and Capital Markets Act, we must file with the Financial Services Commission and the KRX KOSPI Market an annual business report within 90 days after the end of each fiscal year, a half-year business report within 45 days after the end of the first six months of each fiscal year and quarterly business reports within 45 days after the end of the first three months and nine months of each fiscal year. Copies of such business reports will be available for public inspection at the Financial Services Commission and the KRX KOSPI Market.
Transfer of Shares. Under the Korean Commercial Code, the transfer of shares is effected by the delivery of share certificates. The Act on Electronic Registration of Stocks, Bonds, Etc. provides, however, that in the case
172
Table of Contents
of a company listed on the KRX KOSPI Market such as us, share transfers shall be effected by the electronic registration of the transfer on the electronic registry of the electronic registration agency and issuance of physical share certificates is prohibited. In order to assert shareholders’ rights against us, the transferee must have his name and address registered on the register of shareholders. For this purpose, the electronic registration agency issues a statement of the shareholders (or soyuja-myeong-se) upon request of the company, whereby the company updates its register of shareholders in accordance with the Act on Electronic Registration of Stocks, Bonds, Etc..
Under current Korean regulations, the Korea Securities Depository, internationally recognized foreign custodians, financial investment companies with a dealing license (including domestic branches of foreign financial investment companies with such license), financial investment companies with a brokerage license (including domestic branches of foreign financial investment companies with such license), foreign exchange banks (including domestic branches of foreign banks) and financial investment companies with a collective investment license (including domestic branches of foreign financial investment companies with such license) may act as agents and provide related services for foreign shareholders.
In addition, foreign shareholders may appoint a standing proxy among the foregoing and generally may not allow any person other than the standing proxy to exercise rights to the acquired shares or perform any tasks related thereto on their behalf. Certain foreign exchange controls and securities regulations apply to the transfer of shares by non-residents or non-Koreans. See “Item 9.A. Offering and Listing Details” and “Item 10.D. Exchange Controls.” Except as provided in the Financial Holding Company Act, the ceiling on the aggregate shareholdings of a single shareholder and persons who stand in a special relationship with such shareholder is 10% of our issued and outstanding voting shares. See “Item 4.B. Business Overview—Supervision and Regulation—Principal Regulations Applicable to Financial Holding Companies—Restrictions on Ownership of a Financial Holding Company.”
Our Acquisition of Our Shares. Under the Korean Commercial Code, we may acquire our own shares upon a resolution of a general meeting of shareholders by either (i) purchasing them on a stock exchange or (ii) purchasing a number of shares, other than redeemable shares as set forth in Article 345, Paragraph (1) of the Korean Commercial Code, from each shareholder in proportion to their existing shareholding ratio through the methods set forth in the Presidential Decree, provided that the total purchase price does not exceed the amount of our profit that may be distributed as dividends in respect of the immediately preceding fiscal year.
Additionally, pursuant to the Financial Investment Services and Capital Markets Act and regulations under the Financial Holding Company Act and after submission of certain reports to the Financial Services Commission, we may purchase our own shares on the KRX KOSPI Market or through a tender offer, subject to the restrictions that (i) the aggregate purchase price of such shares may not exceed the total amount available for distribution of dividends at the end of the preceding fiscal year; and (ii) the purchase of such shares shall meet the risk-weighted capital adequacy ratio requirements prescribed in the regulations under the Financial Holding Company Act based on Bank for International Settlements standards.
Subject to certain limited exceptions, our subsidiaries will not be permitted to acquire our shares pursuant to the Financial Holding Company Act.
| Item 10.C. | Material Contracts |
None.
| Item 10.D. | Exchange Controls |
General
The Foreign Exchange Transaction Act of Korea and the Enforcement Decree and regulations under that Act regulate investment in Korean securities by non-residents and issuance of securities outside Korea by Korean companies. We collectively refer to these laws and regulations as the “Foreign Exchange Transaction Laws.” Non-residents may invest in Korean securities only to the extent specifically allowed by the Foreign Exchange Transaction Laws or otherwise permitted by the Ministry of Economy and Finance. The Financial Services
173
Table of Contents
Commission has also adopted regulations that restrict foreign investment in Korean securities and regulate the issuance of securities outside Korea by Korean companies, pursuant to its authority under the Financial Investment Services and Capital Markets Act.
Under the Foreign Exchange Transaction Laws, if the Korean government deems that:
| • | the need to do so is inevitable due to the outbreak of natural calamities, wars, conflict of arms or grave and sudden changes in domestic or foreign economic circumstances or other similar situations, the Ministry of Economy and Finance may temporarily suspend payment, receipt or the whole or part of transactions to which the Foreign Exchange Transaction Laws apply, or impose an obligation to safe-keep, deposit or sell means of payment in or to certain Korean governmental agencies or financial institutions; and |
| • | international balance of payments and international finance are confronted or are likely to be confronted with serious difficulty or the movement of capital between Korea and abroad brings or is likely to bring about serious obstacles in carrying out its currency policies, exchange rate policies and other macroeconomic policies, the Ministry of Economy and Finance may take measures to require any person who intends to perform capital transactions to obtain permission or to require any person who performs capital transactions to deposit part of the payments received in these transactions at certain Korean governmental agencies or financial institutions. |
Both of these actions are subject to limitations specified by the Foreign Exchange Transaction Laws.
Restrictions Applicable to Shares
Under the Foreign Exchange Transaction Laws, a foreign investor who intends to acquire shares must designate a foreign exchange bank at which he or she must open a foreign currency account and a Won account exclusively for stock investments. Approval is not required for remittance into Korea and deposit of foreign currency funds in the foreign currency account. Foreign currency funds may be transferred from the foreign currency account at the time required to place a deposit for, or settle the purchase price of, a stock purchase transaction to a Won account opened at a financial investment company with a dealing and/or brokerage license. Funds in the foreign currency account may be remitted abroad without any Korean governmental approval.
Dividends on shares of Korean companies are paid in Won. Korean governmental approval is not required for foreign investors to receive dividends on, or the Won proceeds from the sale of, any shares to be paid, received and retained in Korea. Dividends paid on, and the Won proceeds of the sale of, any shares held by a non-resident of Korea must be deposited either in a Won account with the investor’s financial investment company with a dealing and/or brokerage license or in its own Won account. Funds in a foreign investor’s Won account may be transferred to its foreign currency account or withdrawn for local living expenses up to certain limits. These funds may also be used to make future investments in shares or to pay the subscription price of new shares obtained through the exercise of pre-emptive rights.
Financial investment companies with a dealing and/or brokerage license may open foreign currency accounts with foreign exchange banks exclusively to accommodate foreign investors’ stock investments in Korea. Through these accounts, such financial investment companies may enter into limited foreign exchange transactions, such as converting foreign currency funds and Won funds, either as a counterparty to or on behalf of foreign investors, without the investors having to open their own accounts with foreign exchange banks.
| Item 10.E. | Taxation |
The following summary is based upon tax laws, regulations, rulings, decrees, income tax conventions (treaties), administrative practice and judicial decisions of Korea and the United States as of the date of this annual report, and is subject to any change in the laws of Korea or the United States that may come into effect after such date.
174
Table of Contents
United States Taxation
This summary describes certain material U.S. federal income tax consequences for a U.S. holder (as defined below) of acquiring, owning, and disposing of common shares or ADSs. This summary applies to you only if you hold the common shares or ADSs as capital assets for U.S. federal income tax purposes (generally, property held for investment). This summary does not apply to you if you are a member of a class of holders subject to special rules, including (but not limited to):
| • | a broker or dealer in securities or currencies; |
| • | a trader in securities that elects to use a mark-to-market method of accounting for securities holdings; |
| • | a bank or financial institution; |
| • | a life insurance company, real estate investment trust, or regulated investment company; |
| • | a tax-exempt organization, qualified retirement plan, individual retirement account, or other tax-deferred account; |
| • | an entity treated as a partnership or other passthrough entity (or investors therein) for U.S. federal income tax purposes; |
| • | a person that holds common shares or ADSs that are a hedge or that are hedged against interest rate or currency risks; |
| • | a person that holds common shares or ADSs as part of a straddle or conversion transaction for tax purposes; |
| • | a person whose functional currency for tax purposes is not the U.S. dollar; or |
| • | a person that owns or is deemed to own (directly, indirectly, or constructively) 10% or more of our stock, measured by voting power or value. |
In addition, this summary does not discuss the application of the U.S. federal estate and gift taxes, the Medicare net investment income tax or the alternative minimum tax, or any state, local or other tax consequences of purchasing, owning, and disposing of common shares or ADSs. You should consult your own tax advisers concerning the U.S. federal, state, local, and other tax consequences of purchasing, owning, and disposing of common shares or ADSs in your particular circumstances.
This summary is based on the Internal Revenue Code of 1986, as amended, its legislative history, existing and proposed regulations promulgated thereunder, and published rulings and court decisions, all as currently in effect. These laws are subject to change, possibly on a retroactive basis. We have not requested a ruling from the Internal Revenue Service with respect to any of the U.S. federal income tax considerations described below, and as a result, the Internal Revenue Service could disagree with portions of this discussion. This summary is for general information purposes only and does not purport to be a complete discussion of all potential tax considerations that may be relevant to a particular person’s decision to acquire common shares or ADSs.
For purposes of this summary, you are a “U.S. holder” if you are the beneficial owner of a common share or an ADS and are:
| • | a citizen or resident of the United States; |
| • | a U.S. domestic corporation; or |
| • | otherwise subject to U.S. federal income tax on a net income basis with respect to income from the common share or ADS. |
In general, if you are the beneficial owner of ADSs, you will be treated as the beneficial owner of the common shares represented by those ADSs for U.S. federal income tax purposes, and no gain or loss will be recognized if you exchange an ADS for the common share represented by that ADS.
175
Table of Contents
Dividends
The gross amount of cash distributions that you receive generally will be taxable as dividends to the extent paid out of our current or accumulated earnings and profits, as determined under United States federal income tax principles. Any dividends you receive (including any withheld taxes) generally will be subject to U.S. federal income taxation as foreign source dividend income and will not be eligible for the dividends received deduction. Dividends paid in Won will be included in your income in a U.S. dollar amount calculated by reference to the exchange rate in effect on the date that you receive the dividend (or the depositary receives the dividend, in the case of ADSs), regardless of whether the payment is in fact converted into U.S. dollars. If such a dividend is converted into U.S. dollars on the date of receipt, you generally should not be required to recognize foreign currency gain or loss in respect of the dividend income.
Subject to certain exceptions for short-term and hedged positions, the U.S. dollar amount of dividends received by an individual with respect to our common shares or ADSs will be subject to taxation at reduced rates if the dividends are “qualified dividends.” Dividends paid on the common shares or ADSs will be treated as qualified dividends if (i) the common shares or ADSs are readily tradable on an established securities market in the United States or we are eligible for the benefits of a comprehensive tax treaty with the United States that the U.S. Treasury determines is satisfactory for purposes of this provision and that includes an exchange of information program; (ii) we were not, in the year prior to the year in which the dividend was paid, and are not, in the year in which the dividend is paid, a passive foreign investment company as defined for U.S. federal income tax purposes, which we refer to as a PFIC, and (iii) certain holding period requirements are met. The ADSs are listed on the New York Stock Exchange and will qualify as readily tradable on an established securities market in the United States so long as they are so listed. In addition, the U.S. Treasury has determined that the Korea-United States income tax treaty (the “Treaty”) meets the requirements for reduced rates of taxation, and we believe we are eligible for the benefits of that Treaty. Based on our audited financial statements, we believe that we were not a PFIC in our 2021 and 2022 taxable years. In addition, based on our current expectations regarding our income, assets and activities, we do not anticipate becoming a PFIC for our 2023 taxable year. Therefore, we believe that dividends received by U.S. holders with respect to either common shares or ADSs will be “qualified dividends.” Holders should consult their own tax advisers regarding the availability of the reduced dividend tax rate in light of their own particular circumstances.
Distributions of additional shares in respect of common shares or ADSs that are made as part of a pro-rata distribution to all of our shareholders generally will not be subject to U.S. federal income tax.
Sale or Other Disposition
For U.S. federal income tax purposes, gain or loss you realize on a sale or other disposition of common shares or ADSs generally will be treated as U.S. source capital gain or loss, and will be long-term capital gain or loss if the common shares or ADSs were held for more than one year. Your ability to offset capital losses against ordinary income is limited. Long-term capital gain recognized by an individual U.S. holder generally is subject to taxation at reduced rates.
If a U.S. holder sells or otherwise disposes of our common shares or ADSs in exchange for currency other than U.S. dollars, the amount realized generally will be the U.S. dollar value of the currency received at the spot rate on the date of sale or other disposition (or, if the shares are traded on an established securities market at such time, in the case of cash basis and electing accrual basis U.S. holders, the settlement date). An accrual basis U.S. holder that does not elect to determine the amount realized using the spot exchange rate on the settlement date will recognize foreign currency gain or loss equal to the difference between the U.S. dollar value of the amount received based on the spot exchange rates in effect on the date of the sale or other disposition and the settlement date. If an accrual basis U.S. holder makes the election described above, it must be applied consistently from year to year and cannot be revoked without the consent of the Internal Revenue Service, or the IRS. A U.S. holder should consult its own tax advisors regarding the treatment of any foreign currency gain or loss realized with respect to any currency received in a sale or other disposition of the common shares or ADSs.
176
Table of Contents
Foreign Tax Credit Considerations
Dividends paid on the common shares or ADSs will constitute income from sources without the United States for U.S. foreign tax credit purposes. As a result of recent changes to the U.S. foreign tax credit rules, for taxable years beginning on or after December 28, 2021, Korean tax generally will need to satisfy certain additional requirements in order to be considered a creditable tax for a U.S. holder, except in the case of a U.S. holder that is eligible for, and properly claims, the benefits of the Treaty. We have not determined whether these requirements have been met, and, accordingly, no assurance can be given that any Korean tax will be creditable for U.S. holders. Alternatively, a U.S. holder may elect to deduct Korean withholding taxes in computing such U.S. holder’s taxable income (provided that the U.S. holder elects to deduct, rather than credit, all foreign income taxes paid or accrued for the relevant taxable year), subject to generally applicable limitations under U.S. tax law.
Any Korean securities transaction tax or agriculture and fishery special surtax that you pay will not be creditable for foreign tax credit purposes.
The calculation of foreign tax credits and, in the case of a U.S. holder that elects to deduct foreign taxes, the availability of deductions involve the application of complex rules that depend on a U.S. holder’s particular circumstances. You should consult your own tax advisers regarding the creditability or deductibility of such taxes.
Specified Foreign Financial Assets
Certain U.S. holders that own “specified foreign financial assets” with an aggregate value in excess of US$50,000 on the last day of the taxable year or US$75,000 at any time during the taxable year are generally required to file an information statement along with their tax returns, currently on IRS Form 8938, with respect to such assets. “Specified foreign financial assets” include any financial accounts held at a non-U.S. financial institution, as well as securities issued by a non-U.S. issuer (which would include the common shares and ADSs) that are not held in accounts maintained by financial institutions. Higher reporting thresholds apply to certain individuals living abroad and to certain married individuals. Regulations extend this reporting requirement to certain entities that are treated as formed or availed of to hold direct or indirect interests in specified foreign financial assets based on certain objective criteria. U.S. holders who fail to report the required information could be subject to substantial penalties. In addition, the statute of limitations for assessment of tax would be suspended, in whole or part. Prospective investors should consult their own tax advisors concerning the application of these rules to their investment in the common shares or ADSs, including the application of the rules to their particular circumstances.
U.S. Information Reporting and Backup Withholding Rules
Payments of dividends and sales proceeds that are made within the United States or through certain U.S.-related financial intermediaries are subject to information reporting and may be subject to backup withholding unless the holder provides an accurate taxpayer identification number and makes any other required certification or otherwise establishes an exemption. Backup withholding is not an additional tax. The amount of any backup withholding from a payment to a U.S. holder will be allowed as a refund or credit against the U.S. holder’s U.S. federal income tax liability, provided the required information is furnished to the IRS in a timely manner.
Korean Taxation
The following summary of Korean tax considerations applies to you so long as you are not:
| • | a resident of Korea; |
| • | a corporation with its head office, principal place of business or place of effective management in Korea; or |
| • | engaged in a trade or business in Korea through a permanent establishment or a fixed base to which the relevant income is attributable or with which the relevant income is effectively connected. |
177
Table of Contents
Please consult your own tax advisers as to the Korean, state, local and other tax consequences of the purchase, ownership and disposition of common shares or ADSs.
Taxation of Dividends on Common Shares or ADSs
We will deduct Korean withholding tax from dividends paid to you (whether payable in cash or in shares) at a rate of 22.0% (inclusive of local income tax). If you are a qualified resident and a beneficial owner of the dividends in a country that has entered into a tax treaty with Korea, you may qualify for a reduced rate of Korean withholding tax. See “—Tax Treaties” below for a discussion on treaty benefits. If we distribute to you free shares representing a transfer of earning surplus or certain capital reserves into paid-in capital, that distribution may be subject to Korean withholding tax.
Taxation of Capital Gains from Transfer of Common Shares or ADSs
As a general rule, capital gains earned by non-residents upon transfer of our common shares or ADSs are subject to Korean withholding tax at the lower of (1) 11.0% (inclusive of local income tax) of the gross proceeds realized or (2) subject to the production of satisfactory evidence of acquisition costs and certain direct transaction costs of the common shares or ADSs, 22.0% (inclusive of local income tax) of the net realized gain, unless exempt from Korean income taxation under the applicable Korean tax treaty with the non-resident’s country of tax residence. See “—Tax Treaties” below for a discussion on treaty benefits. Even if you do not qualify for an exemption under a tax treaty, you will not be subject to the foregoing withholding tax on capital gains if you qualify under the relevant Korean domestic tax law exemptions discussed in the following paragraphs.
In regard to the transfer of our common shares through the Korea Exchange, you will not be subject to the withholding tax on capital gains (as described in the preceding paragraph) if you (1) have no permanent establishment in Korea and (2) did not own or have not owned (together with any shares owned by any person with which you have a certain special relationship) 25% or more of the total issued and outstanding shares, which may include the common shares represented by the ADSs, at any time during the calendar year in which the sale occurs and during the five consecutive calendar years prior to the calendar year in which the sale occurs.
Under Korean tax law, ADSs are viewed as shares of common stock for capital gains tax purposes. Accordingly, capital gains from the sale or disposition of ADSs are taxed (if such sale or disposition constitutes a taxable event) as if such gains are from the sale or disposition of the underlying common shares. Capital gains that you earn (regardless of whether you have a permanent establishment in Korea) from a transfer of ADSs outside of Korea will generally be exempt from Korean income taxation by virtue of the Special Tax Treatment Control Law of Korea, or the STTCL, provided that the issuance of the ADSs is deemed to be an overseas issuance under the STTCL. However, if you transfer ADSs after having converted the underlying common shares, such exemption under the STTCL will not apply and you will be required to file a transfer income tax return or a corporate income tax return and pay tax in Korea with respect to any capital gains derived from such transfer unless the purchaser or a financial investment company with a brokerage license, as applicable, withholds and pays such tax.
If you are subject to tax on capital gains with respect to the sale of ADSs, or of our common shares you acquired as a result of a withdrawal, the purchaser or, in the case of the sale of the common shares on the Korea Exchange or through a financial investment company with a brokerage license in Korea, such financial investment company, is required to withhold Korean tax on capital gains from the sales price in an amount equal to the lower of (1) 11.0% (inclusive of local income tax) of the gross realization proceeds or (2) subject to the production of satisfactory evidence of acquisition costs and certain direct transaction costs of the common shares or ADSs, 22.0% (inclusive of local income tax) of the net realized gain, and to make payment of these amounts to the Korean tax authority, unless you establish your entitlement to an exemption under an applicable tax treaty or domestic tax law. See “—Tax Treaties” below for a discussion on claiming treaty benefits.
178
Table of Contents
Tax Treaties
Korea has entered into a number of income tax treaties with other countries (including the United States), which would reduce or exempt Korean withholding tax on dividends on, and capital gains on transfer of, the common shares or ADSs. For example, under the Korea-United States income tax treaty, reduced rates of Korean withholding tax of 16.5% or 11.0% (depending on your shareholding ratio and inclusive of local income tax) on dividends and an exemption from Korean withholding tax on capital gains are available to residents of the United States that are beneficial owners of the relevant dividend income or capital gains, subject to certain exceptions. However, under Article 17 (Investment or Holding Companies) of the Korea-United States income tax treaty, such reduced rates and exemption do not apply if (i) you are a United States corporation, (ii) by reason of any special measures, the tax imposed on you by the United States with respect to such dividend income or capital gains is substantially less than the tax generally imposed by the United States on corporate profits and (iii) 25% or more of your capital is held of record or is otherwise determined, after consultation between competent authorities of the United States and Korea, to be owned directly or indirectly by one or more persons who are not individual residents of the United States. Also, under Article 16 (Capital Gains) of the Korea-United States income tax treaty, the exemption on capital gains does not apply if (a) you have a permanent establishment in Korea and any shares of common stock in which you hold an interest and which give rise to capital gains are effectively connected to such permanent establishment, (b) you are an individual and you maintain a fixed base in Korea for an aggregate of 183 days or more during a given taxable year and your ADSs or common shares giving rise to capital gains are effectively connected with such fixed base or (c) you are an individual and you are present in Korea for an aggregate of 183 days or more during a given taxable year.
You should inquire for yourself whether you are entitled to the benefit of a tax treaty between Korea and the country where you are a resident. It is the responsibility of the party claiming the benefits of an income tax treaty in respect of dividend payments or capital gains to submit to us, the purchaser or the financial investment company, as applicable, a certificate as to his tax residence. In the absence of sufficient proof, we, the purchaser or the financial investment company, as applicable, must withhold tax at the normal rates. Furthermore, in order for you to claim the benefit of a tax rate reduction or tax exemption on certain Korean source income (such as dividends or capital gains) under an applicable tax treaty, Korean tax law requires you (or your agent) to submit an application (for a reduced withholding tax rate, the “application for entitlement to a reduced tax rate,” and in the case of exemptions from withholding tax, the “application for tax exemption” along with a certificate of your tax residency issued by a competent authority of your country of tax residence, subject to certain exceptions) as the beneficial owner of such Korean source income, or a BO application. For example, a U.S. resident would be required to provide a Form 6166 as a certificate of tax residency together with the application for entitlement to reduced tax rate or the application for tax exemption. Such application should be submitted to the withholding agent prior to the payment date of the relevant income. Subject to certain exceptions, where the relevant income is paid to an overseas investment vehicle (which is not the beneficial owner of such income), or an OIV, a beneficial owner claiming the benefit of an applicable tax treaty with respect to such income must submit its BO application to such OIV, which must submit an OIV report and a schedule of beneficial owners (as well as the BO applications collected from each beneficial owner, if such beneficial owner is applying for a tax exemption) to the withholding agent prior to the payment date of such income. Effective January 1, 2020, an OIV that was not established for the purpose of unjustifiably reducing income tax liabilities in Korea and bears tax liabilities in the country of its residence is deemed to be a beneficial owner of Korean source income for income tax purposes. Starting from January 1, 2022, an OIV is deemed to be a beneficial owner of the Korean source income if (i) under the applicable tax treaty, the OIV bears tax liabilities in the country in which it is established or the OIV is deemed to be the beneficial owner of the Korean source income, and (ii) the Korean source income is eligible for the treaty benefits under the tax treaty. The benefits under a tax treaty between Korea and the country of such OIV’s residence will apply with respect to the relevant income paid to such OIV, subject to certain application requirements as prescribed by the Corporate Income Tax or Individual Income Tax Law. In the case of a tax exemption application, the withholding agent is required to submit such application (together with the applicable OIV report in the case of income paid to an OIV) to the relevant district tax office by the ninth day of the month following the date of the payment of such income.
179
Table of Contents
Inheritance Tax and Gift Tax
If you die while holding an ADS or donate an ADS, it is unclear whether, for Korean inheritance tax and gift tax purposes, you will be treated as the owner of the common shares underlying the ADSs. If the tax authority interprets depositary receipts as the underlying share certificates, you may be treated as the owner of the common shares and your heir or the donee (or in certain circumstances, you as the donor) will be subject to Korean inheritance tax or gift tax presently at the rate of 10% to 50%, provided that the value of the ADSs or common shares is greater than a specified amount.
If you die while holding a common share or donate a common share, your heir or donee (or in certain circumstances, you as the donor) will be subject to Korean inheritance tax or gift tax at the same rate as indicated above.
At present, Korea has not entered into any tax treaty relating to inheritance or gift taxes.
Securities Transaction Tax
If you transfer our common shares on the Korea Exchange, you will be subject to securities transaction tax at the rate of 0.05% (if the transfer is made in 2023), 0.03% (if the transfer is made in 2024) or 0% (if the transfer is made in 2025 and thereafter) and an agriculture and fishery special surtax at the rate of 0.15% of the sale price of the common shares. If your transfer of the common shares is not made on the Korea Exchange, subject to certain exceptions, you will be subject to securities transaction tax at the rate of 0.35% (if the transfer is made in 2023 and thereafter) and will not be subject to an agriculture and fishery special surtax.
Under the Securities Transaction Tax Law, depositary receipts (such as American depositary receipts) constitute share certificates subject to the securities transaction tax. However, the transfer of depositary receipts listed on the New York Stock Exchange, the Nasdaq Global Market, or other qualified foreign exchanges is exempt from the securities transaction tax.
In principle, the securities transaction tax, if applicable, must be paid by the transferor of the common shares or ADSs. When the transfer is effected through a securities settlement company in Korea, such settlement company is generally required to withhold and pay the tax to the tax authorities. When such transfer is made through a financial investment company only, such financial investment company is required to withhold and pay the tax. Where the transfer is effected by a non-resident without a permanent establishment in Korea, other than through a securities settlement company or a financial investment company, the transferee is required to withhold the securities transaction tax.
Non-reporting or under-reporting of securities transaction tax will generally result in penalties equal to 20% to 60% of the non-reported tax amount or 10% to 60% of under-reported tax amount. Also, a failure to timely pay securities transaction tax will result in a penalty equal to 9.125% (or 8.03% starting from February 2022) per annum of the due but unpaid tax amount. The penalties are imposed on the party responsible for paying the securities transaction tax or, if such tax is required to be withheld, on the party that has the obligation to withhold.
| Item 10.F. | Dividends and Paying Agents |
Not Applicable
| Item 10.G. | Statements by Experts |
Not Applicable
| Item 10.H. | Documents on Display |
We are subject to the information requirements of the Exchange Act, and, in accordance therewith, are required to file reports, including annual reports on Form 20-F, and other information with the U.S. Securities and Exchange Commission. These materials, including this annual report and the exhibits thereto, may be
180
Table of Contents
inspected and copied at the Commission’s public reference rooms in Washington, D.C., New York, New York and Chicago, Illinois. Please call the Commission at 1-800-SEC-0330 for further information on the public reference rooms. We are also required to make filings with the Commission by electronic means. Any filings we make electronically will be available to the public over the Internet at the Commission’s web site at http://www.sec.gov.
| Item 10.I. | Subsidiary Information |
Not Applicable
| Item 11. | QUANTITATIVE AND QUALITATIVE DISCLOSURES ABOUT MARKET RISK |
Overview
As a financial services provider, we are exposed to various risks related to our lending and trading businesses, our funding activities and our operating environment, principally through Woori Bank, our banking subsidiary. Our goal in risk management is to ensure that we identify, measure, monitor and control the various risks that arise, and that our organization adheres strictly to the policies and procedures which we establish to address these risks. We seek to take a conservative approach to risk management in order to better insulate our operations from adverse events. Risks we face include:
| • | credit risk; |
| • | market risk (primarily interest rate risk, equity risk, foreign exchange risk and commodity risk); |
| • | liquidity risk; and |
| • | operational and business risk (including legal risk). |
We operate a standardized risk management system which enhances our risk management capabilities by enabling us to exchange information among our and our subsidiaries’ risk management operations. Woori Bank, our banking subsidiary, has further strengthened its risk management systems by (i) using Tier I capital as “available capital” for purposes of our risk capital allocation to fulfill Basel III requirements, and (ii) including “stressed VaR” to our market risk capital calculations in accordance with the guidance of the Financial Supervisory Service. We use our risk management systems to manage our risks within acceptable limits and to otherwise ensure the soundness of our assets and the stability of our operations.
We allocate our total risk capital in accordance with the guidelines set by our Board Risk Management Committee. As described in more detail below, the committee allocates risk capital and approves the risk limit requests of our subsidiaries. Through our standardized risk management system, we allocate our risk capital:
| • | with respect to our credit risk on the basis of a standardized approach as well as other portfolio credit models; |
| • | with respect to our market risk for trading activities based on the VaR method (including the stressed VaR method) for Woori Bank, and a standardized approach for our other subsidiaries; |
| • | with respect to our interest rate risk based on the IRRBB standard method (ΔEVE) on a group-wide basis, replacing the previous historical simulation and standardized methods; and |
| • | with respect to our operational risk through an advanced measurement approach for Woori Bank and a standardized approach for our other subsidiaries, in accordance with Basel III. |
181
Table of Contents
Our risk capital allocation by entity as a percentage of available capital, on a non-consolidated basis, with respect to 2023 is as follows:
| Available capital(1) |
Risk capital |
Risk appetite |
Credit | Market | Operational | Interest rate | Credit Concentration |
Liquidity | Strategic/ Reputation |
|||||||||||||||||||||||||||||||
| (in billions of Won, except percentages) | ||||||||||||||||||||||||||||||||||||||||
| Woori Financial Group |
28,173 | 21,587 | 76.6 | % | 16,989 | 1,100 | 1,698 | 1,303 | 825 | 363 | 845 | |||||||||||||||||||||||||||||
| Woori Bank |
23,099 | 18,143 | 78.5 | % | 14,299 | 1,000 | 1,535 | 850 | 766 | 330 | 693 | |||||||||||||||||||||||||||||
| Woori Card |
2,415 | 1,237 | 51.2 | % | 1,006 | 18 | 87 | 223 | — | — | — | |||||||||||||||||||||||||||||
| Woori Financial Capital |
1,522 | 1,095 | 71.9 | % | 988 | — | 35 | 117 | — | — | — | |||||||||||||||||||||||||||||
| Woori Investment Bank |
664 | 476 | 71.7 | % | 412 | 31 | 16 | 40 | — | — | — | |||||||||||||||||||||||||||||
| Woori Asset Trust |
219 | 47 | 21.6 | % | 38 | — | 15 | 4 | — | — | — | |||||||||||||||||||||||||||||
| Woori Savings Bank |
229 | 142 | 62.0 | % | 123 | — | 5 | 21 | — | — | — | |||||||||||||||||||||||||||||
| (1) | Estimates based on Tier I capital. |
Organization
We have a multi-tiered risk management governance structure. Our Board Risk Management Committee is ultimately responsible for group-wide risk management, and directs the various subordinate risk management entities. The Group Risk Management Council answers to the Board Risk Management Committee and, together with the Group Risk Management Department, coordinates the execution of its directives with each Subsidiary Risk Management Department. Each Subsidiary Risk Management Committee, based on the Board Risk Management Committee’s directives, determines risk management strategies and implements risk management policies and guidelines for the relevant subsidiary, sets the subsidiary’s operational and business risk management policies and guidelines and directs the applicable Subsidiary Risk Management Department with support from the applicable Subsidiary Risk Management Council, but must keep within the risk guidelines of the Board Risk Management Committee. The Subsidiary Risk Management Committees generally receive input from their respective Subsidiary Risk Management Councils and Subsidiary Risk Management Departments.
The following chart sets out our risk management governance structure as of the date of this annual report:
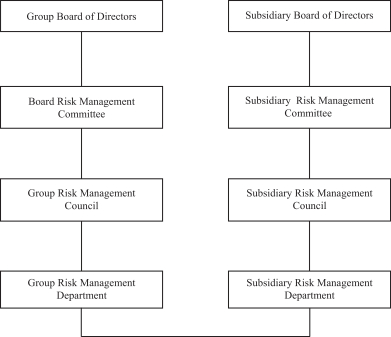
182
Table of Contents
We operate a “double report” system with respect to our risk management procedures. Each of our Subsidiary Risk Management Departments is required to submit risk management reports directly to the Group Risk Management Department. Through this internal reporting system, we are able to better ascertain and strengthen the monitoring of our subsidiaries’ risk management and are able to quickly address any deviation from our group-wide risk policies. We have further supplemented our double report system by strengthening the role and independence of chief risk officers in our subsidiaries and expanding the role of Subsidiary Risk Management Departments. Each Subsidiary Risk Management Department is required to report directly to such subsidiary’s chief risk officer on all material risk management issues as well as following the procedures under the double report system.
The Board Risk Management Committee, the Group Risk Management Council, the Subsidiary Risk Management Committees and the Subsidiary Risk Management Councils are responsible for managing risks relating to credit, markets, asset and liability management and liquidity. Each Subsidiary Risk Management Department is generally responsible for managing operational risks at the relevant subsidiary, while the Audit Department coordinates the execution of our operational and business risk management policy, particularly with regard to internal subsidiary practices, and the Legal and Compliance Department monitors compliance risk and makes suggestions regarding regulatory issues to the Financial Supervisory Service.
Board Risk Management Committee
The Board Risk Management Committee is our highest decision-making body with respect to our risk management operations. Our board of directors has delegated to it the authority to oversee and make determinations on all significant issues relating to our risk management system. It comprehensively manages and controls our risks as well as those of our subsidiaries, so that it may detect, measure, monitor and control the potential risks that may arise during management. The committee’s major activities include:
| • | determining and amending risk management policies, guidelines and limits in conformity with the strategy established by the board of directors; |
| • | determining the appropriate level of risks that we should be willing to undertake, including in connection with key business activities such as acquisitions, investments or entering into new business areas, prior to a decision by the board of directors on such matters; |
| • | allocating risk capital to each subsidiary and approving the risk limits of our subsidiaries; |
| • | reviewing our group-wide risk profile, including the level of risks we are exposed to and the status of our risk management operations; and |
| • | monitoring our subsidiaries’ compliance with our risk policies. |
The Board Risk Management Committee is composed of three outside directors. It operates independently from all business groups and individual board members, and reports directly to our board of directors. We require the chairperson of the Board Risk Management Committee to be chosen from among the outside directors in order to enhance the independence and experience level of such chairperson. Our Board Risk Management Committee convenes at least quarterly, and makes decisions by a majority vote of the attending members. At least a majority of the committee members must attend to constitute a quorum.
Group Risk Management Council
Our Group Risk Management Council is responsible for coordinating with the Subsidiary Risk Management Departments to ensure that they execute the policies, guidelines and limits established by the Board Risk Management Committee. The Group Risk Management Council’s major activities include:
| • | analyzing our risk status using information provided by the Subsidiary Risk Management Departments; |
| • | adjusting the integrated risk-adjusted capital allocation plan and risk limits for each of our subsidiaries; |
| • | reviewing the key decisions of each Subsidiary Risk Management Committee and discussing and resolving any risk management issues raised by those committees; |
183
Table of Contents
| • | coordinating issues relating to the integration of our risk management functions; and |
| • | performing any other duties delegated by the Board Risk Management Committee. |
The Group Risk Management Council consists of eleven members, including our chief risk officer and the chief risk officers of our subsidiaries. It operates independently from all business groups, and reports directly to the Board Risk Management Committee. The Group Risk Management Council convenes on a quarterly basis.
Our subsidiaries, in most cases through their respective Subsidiary Risk Management Departments, provide a variety of information to the Group Risk Management Council, including:
| • | reports regarding the status of overall risk management, the status of limit compliance, and analysis and results of stress testing and back testing; and |
| • | reports regarding asset and liability management matters, including changes in risk-weighted assets and the status of our credit portfolio on a periodic basis. |
Subsidiary Risk Management Committees
Each of our subsidiaries’ operating businesses that require risk management delegates risk management authority to its Subsidiary Risk Management Committee. Each Subsidiary Risk Management Committee measures and monitors the various risks faced by the relevant subsidiary and reports to that subsidiary’s board of directors regarding decisions that it makes on risk management issues. It also makes strategic decisions regarding the operations of the relevant subsidiary, such as allocating credit risk limits, setting total exposure limits and market risk-related limits and determining which market risk derivatives instruments the subsidiary can trade. The major activities of each Subsidiary Risk Management Committee include:
| • | determining and monitoring risk policies, guidelines, limits and tolerance levels and the level of subsidiary risk in accordance with group policy, with the support of the relevant Subsidiary Risk Management Council; |
| • | reviewing and analyzing the subsidiary’s risk profile; |
| • | setting limits for and adjusting the risk-adjusted capital allocation plan and risk levels for each business group within the subsidiary; and |
| • | monitoring compliance with our group-wide risk management policies and practices at the business group and subsidiary level. |
Subsidiary Risk Management Council
Each of our relevant subsidiaries has a Subsidiary Risk Management Council, which is responsible for supporting the relevant Subsidiary Risk Management Committee in the implementation of its risk management policies and guidelines for such subsidiary, including by reviewing and reporting on agenda items to be discussed at meetings of the relevant Subsidiary Risk Management Committee, reviewing reports from the relevant Subsidiary Risk Management Department and performing any other duties delegated by the relevant Subsidiary Risk Management Committee.
Each Subsidiary Risk Management Council is generally comprised of the subsidiary’s chief risk management officer, the head of its Subsidiary Risk Management Department and other executive officers responsible for such subsidiary’s risk management-related functions. It operates independently from all business units, and reports directly to the Subsidiary Risk Management Committee.
Credit Risk Management
Our credit risk management policy objectives are to improve our asset quality, reduce our non-performing loans and minimize our concentration risk through a diversified and balanced risk-weighted loan portfolio. We manage credit risk and continually monitor and improve our credit risk-related policies and guidelines to reflect
184
Table of Contents
changing risks in our business and the industries and sectors in which our customers operate. For example, we have recently strengthened our monitoring of asset quality and analysis of risk indicators by focusing on industries and sectors that are impacted by the COVID-19 pandemic and will continue to do so by reflecting any additional volatility or long-term effects thereof.
We believe that an essential part of achieving our credit risk management objectives is utilizing a standardized risk management system so that we can identify and manage the risks generated by our businesses using a consistent approach. Woori Bank is currently using a centralized credit risk management system called the Credit Wizard system. Credit Wizard is a credit risk management system which combines credit risk management and the credit approval process on a transactional level with respect to individual borrowers and approval with respect to each individual loan or credit. The system quantifies credit risk with respect to corporate borrowers using a “mark-to-market” methodology, which reflects both the likelihood of a default by a borrower as well as the likelihood of a change in such borrower’s credit rating, and quantifies credit risk with respect to retail borrowers using a “default mode” methodology, which reflects the likelihood of a default by a borrower. We believe that our Credit Wizard system is a systematic and efficient credit evaluation system and that Woori Bank has expedited its loan review process and improved its ability to monitor and evaluate its overall risk profile by using this system. The main characteristics of our Credit Wizard system are as follows:
| • | automation of credit risk management system, which allows us to centralize and automate many tasks relating to our credit risk management system; |
| • | automatic recognition and processing of different forms of credit, which allows us to process and approve different types of credit, such as new applicants, renewing applicants and changes in the condition of the loan or credit approved; |
| • | incorporation of credit risk management prior to approval of credit, which allows us to consider individualized characteristics of a borrower and enables us to calculate a more accurate price with respect to the loan or credit approved; |
| • | automatic credit risk monitoring after approval of credit, which allows us to evaluate and re-rate the loan or credit on a real-time basis as a result of any change in the characteristics of the borrower (including the condition of the underlying collateral, change in borrowing limit and early warning characteristics); and |
| • | automatic verification of internal procedures and regulations with respect to approval of credit, which reduces our operational risk and ensures that there are no material deviations from our loan and credit policies. |
We also impose a credit risk limit for Woori Bank with respect to “large exposures.” We aim to avoid concentrations of exposure with respect to any single corporate borrower or affiliated group of corporate borrowers. Accordingly, we have established aggregate exposure limits based on capital adequacy levels of Woori Bank and, with respect to individual corporate borrowers, established limits by dividing the “expected loss” with respect to companies affiliated with such corporate borrower with the “unexpected loss” (a measurement of credit risk) of such borrower and converting that into an exposure amount. We use this as the basis for our “large exposure” limits with respect to such corporate borrower.
We impose a “principal investment” limit for investment activities that our subsidiaries undertake as a principal (as opposed to as an agent). The principal investment limit for each subsidiary is set as a certain percentage of the capitalization of such subsidiary.
We use our credit risk management systems to measure and control credit risk, to evaluate and approve new credit and to review and monitor outstanding credit. We conduct various quantitative and qualitative analyses to establish acceptable risk levels that provide what we believe are appropriate levels of return on investments. The credit risk management systems that we use to do this integrate various data, including customers’ financial and economic condition, limits on loans and guarantee amounts, cash flow evaluations, collateral levels, our desired profit margin and the likelihood of unexpected loan losses.
185
Table of Contents
Each relevant subsidiary monitors its level of risk, determines how that level compares to our target optimized level of risk on a monthly basis and produces risk analysis reports and optimization reports on a monthly basis and stress test reports on an ad hoc basis. These reports are sent to the respective Subsidiary Risk Management Committees and to the Board Risk Management Committee and provide a basis to set risk limits for, and allocate capital to, a subsidiary’s business groups.
Credit Evaluation and Approval
Our subsidiaries evaluate the credit of every loan applicant and guarantor before approving any loans, except for:
| • | loans guaranteed by letters of guarantee issued by the Korea Credit Guarantee Fund, the Korea Technology Finance Corporation or certain other specified Korean government-controlled funds; |
| • | loans guaranteed by highly-rated banks; |
| • | loans fully secured by deposits with us; and |
| • | loans against commercial promissory notes issued by creditworthy companies at a discount to the face value of the note determined by the issuer’s creditworthiness. |
The evaluation and approval process differs depending on whether the loan is a corporate loan, a general household consumer loan, or a mortgage or home equity loan, and there is a separate process for credit card applications. For example, Woori Bank has in recent years implemented a standardized “expected loss” and “unexpected loss” credit risk system which we believe enables us to better allocate risk capital by evaluating “unexpected loss” (a measurement of credit risk), “VaR” (a measurement of market risk) and “earnings at risk” (a measurement of whether our assets and liabilities are mismatched).
Woori Bank has also undertaken a number of initiatives to develop credit evaluation and loan approval procedures that are more systematic and efficient. We prefer to use credit rating systems in our credit evaluation and loan approval process because they:
| • | yield a uniform result regardless of the user; |
| • | can be used effectively by employees who do not have extensive experience in credit evaluation; |
| • | can be updated to reflect changing market conditions by changing how factors are weighted; |
| • | significantly limit the scope of employee discretion in the loan assessment and approval process; and |
| • | improve loan processing times while generally resulting in declines in delinquencies among new borrowers. |
Woori Bank operates a Credit Wizard credit evaluation system for corporate loans (including small- and medium-sized enterprise loans) and a consumer credit evaluation system for consumer loans.
Customers apply for loans by submitting a loan application through one of Woori Bank’s branches. These applications are initially reviewed using the appropriate credit evaluation system and, in the case of applications for a small amount or involving applicants with little or no credit risk, are approved by the branch manager or a relationship manager acting in concert with a credit officer based on the credit risk rating they receive under that system. Applications for larger loans and loans which are determined to involve greater credit risk are approved by bodies with greater authority, depending on where those loans fall in a matrix of size, collateral and credit risk. These loan applications will be referred to a credit officer committee at an office located near the customer, which may or may not be at Woori Bank’s headquarters. Every credit officer committee is made up of credit officers from headquarters and has the same level of authority. Applications that cannot be approved by a credit officer committee are referred to a senior credit officer committee or the Loan Committee of Woori Bank,
186
Table of Contents
depending on loan size, collateral and credit risk. The following table sets forth the various Woori Bank committees and personnel involved in its credit evaluation and loan approval process:
| Committee |
Members |
Approval Process | ||
| Headquarters Approval |
||||
| Loan Committee |
Head of the credit support group, head of the risk management group, head of the investment banking business group, head of the corporate banking business group, head of the financial market business group, head of the large corporate credit analysis and approval department and head of SME credit analysis and approval department | 2/3 required for approval; 2/3 required to participate | ||
| Headquarters/Regional Approval |
||||
| Senior Credit Officer Committee |
One head senior credit officer and four to six other senior credit officers (five to seven persons) | 2/3 required for approval; 2/3 required to participate | ||
| Credit Officer Committee |
At least one senior credit officer and two other credit officers (at least three persons) | 2/3 required for approval; 2/3 required to participate | ||
| Individual Approval |
||||
| Loan Officer |
Individual | Approval of the individual | ||
| Branch Manager |
Individual | Approval of the individual | ||
| Head of Team |
Individual | Approval of the individual |
Different individuals or committees review and approve loan applications depending on various factors, including:
| • | the size and type of the loan; |
| • | the level of credit risk established by the credit rating system; |
| • | whether the loan is secured by collateral; and |
| • | if the loan is secured, an assessment of the collateral. |
Loan applications are generally reviewed only by the highest-level committee required to approve the loan, although multiple reviews, including separate reviews at the branch, regional and headquarters level, may occur depending on the size and terms of any particular loan or a borrower’s credit risk.
Corporate Loan Approval Process
Woori Bank’s branches review corporate loan applications using a credit evaluation system for corporate borrowers. Each corporate credit evaluation system measures various quantitative and qualitative factors. The model used by the credit evaluation system to review an application depends, however, on certain characteristics of the potential borrower. Woori Bank’s credit risk management unit, together with its large corporate loan department and small- and medium-sized enterprise loan department, has developed separate credit evaluation models for large corporate borrowers that are subject to external audit under the Act on External Audit of Stock Companies, large corporate borrowers that are not subject to external audit, medium-sized enterprises and SOHO borrowers that either have outstanding loans, or are applying for a loan, in excess of ₩1 billion. In general, each model uses scores from both a computerized evaluation of quantitative financial factors, such as cash flow, income and other representative financial information, and more qualitative factors which are scored using
187
Table of Contents
judgments by the credit officer or officers reviewing the application to produce an overall credit risk rating. These credit evaluation systems provide Woori Bank with tools to make consistent credit decisions and assist it in making risk-based pricing decisions. Woori Bank’s Credit Wizard system, depending on whether the borrower is audited by independent auditors and its size, produces two separate scores based on one of five principal rating models: one for quantitative current financial factors, which is weighted 60 to 70% in determining the Credit Wizard credit risk rating, and another for the more qualitative factors that the judgment of credit officers plays a significant part in determining, which is weighted 30 to 40%. The Credit Wizard credit risk rating estimates the probability that Woori Bank will recover extended credits and the likelihood that borrowers will default. Qualitative factors included in the Credit Wizard system include:
| • | its industry situation; |
| • | a customer’s future financial condition; |
| • | its competitive position in the industry; |
| • | the quality of its management; and |
| • | its operations. |
Other indirect factors included in the credit risk rating include:
| • | its technological merits; |
| • | the nature and the location of any collateral; and |
| • | Woori Bank’s level of priority in that collateral to estimate non-recovery risks. |
These qualitative factors are input into the Credit Wizard system by the credit officer, and are rated based on his or her historical experience and that of the bank.
The Credit Wizard system produces separate credit risk ratings for each borrower. Woori Bank’s credit analysis and approval center evaluates and approves corporate loan applications based on these credit risk ratings. The Credit Wizard system assigns each borrower and facility one of the following 14 credit risk rating grades from AAA to D, which are classified as follows: AAA (extremely strong), AA (very strong), A+ (strong), A– (good), BBB+ (more adequate), BBB (adequate), BBB– (less adequate), BB+ (less susceptible), BB (susceptible), BB– (more susceptible), B+ (slightly weak), B– (weak), C (very weak) and D (default). Certain loans are subject to review by the Loan Committee depending on the size of the loan and the determined credit risk rating. Examples of this include loan applications for secured loans in excess of ₩80 billion for a borrower or facility with a credit risk rating of A- and above, and, at the other extreme for unsecured loans, loan applications in excess of ₩4 billion for a borrower or facility with a credit risk rating of BB– to C. Applications from borrowers with loans on a watch list (see “—Credit Review and Monitoring” below) are also closely monitored.
Woori Bank has adopted a separate and simpler credit evaluation system for SOHOs (such as pharmacies, clinics and restaurants) that either have outstanding loans, or are applying for a loan, of ₩1 billion or less. The system uses simpler credit evaluation models and resembles Woori Bank’s application scoring system for new retail customers. It assigns a credit grade ranging from one to ten to each application based on its evaluation of various factors. Applications are classified as “automatically approved,” “automatically rejected” or “subject to further evaluation,” which is the same as the consumer loan approval process, based on a combination of the internal credit scoring system and the external credit score. For existing borrowings (such as roll-overs of outstanding amounts), such SOHO credit evaluation system is supplemented with a behavioral scoring system. The behavioral scoring system enhances the SOHO credit evaluation system by enabling the consideration of factors such as the customer’s spending history and credit behavior.
With respect to the evaluation of any collateral to which a commercial loan application relates (which principally consists of land, buildings and equipment), the fair value of such underlying collateral for commercial loans is appraised by external valuation experts and such appraisals are collated in Woori Bank’s Credit Wizard
188
Table of Contents
system. Woori Bank uses its Credit Wizard system to manage its lending activities, and inputs data gathered from loan application forms, credit scores of borrowers and the appraisal value of collateral provided by external valuation experts into the Credit Wizard system and updates such information periodically to reflect changes in such information (such as any changes in credit scores of borrowers or the appraisal value of collateral). In addition, to validate the appropriateness of the appraisal values provided by such external valuation experts, Woori Bank reviews the qualification of the external valuation experts (including a review of whether such experts are legitimately registered with the Korea Association of Property Appraisers) and evaluates the assumptions and valuation model used by such experts as well as the appropriateness of variables by reference to market data and comparisons to actual transaction prices in similar regions.
We have set credit limits for our corporate customers. Some of these limits, particularly those imposed by Korean banking regulations, are aimed at preventing loan concentrations relating to any single customer. See “Item 4.B. Business Overview—Supervision and Regulation—Principal Regulations Applicable to Banks—Financial Exposure to Any Individual Customer or Major Shareholder.” In certain cases, we have introduced and implemented internally-developed large exposure limits that are stricter than the applicable Financial Services Commission requirements.
In evaluating applications, credit officers or the Loan Committee will often, in addition to reviewing ratings from these credit evaluation models, also refer to corporate information gathered or ratings assigned by external credit rating agencies, including NICE Investors Service, Korea Investors Service and Korea Ratings, among others. They review the information we obtain from these sources and compare it to the information we have developed internally with respect to our customers to improve the accuracy of our internal credit ratings.
Consumer Loan Approval Process
The consumer loan department of Woori Bank evaluates and approves consumer loan applications using a dedicated consumer credit evaluation system. Woori Bank’s consumer credit evaluation system assigns a credit score to each application based on its evaluation of various factors. These factors include any loan and guarantee limits Woori Bank has set for particular borrowers or groups of borrowers and our evaluation of their cash flows and credit profiles. The system gives each customer’s loan application a grade ranging from one to ten. Woori Bank also uses another score based on the external ratings provided by the Korea Credit Bureau and NICE Information Service Inc. Applications are classified as “automatically approved,” “automatically rejected” and “subject to further evaluation” based on a combination of the scores of these two systems. Woori Bank uses these systems to evaluate all new consumer loan applications, except for:
| • | loans fully secured by deposits with Woori Bank; |
| • | collective mortgage loans; and |
| • | National Housing and Urban Fund mortgage loans. |
Woori Bank augments its consumer credit evaluation system with a behavioral scoring system. The behavioral scoring system enhances the consumer credit evaluation system by enabling the consideration of factors such as the customer’s spending history and credit behavior. By the nature of the information it analyzes, however, the behavioral scoring system can only be used for applications of persons who are existing borrowers, generally consisting of roll-overs of outstanding amounts.
We also evaluate any collateral to which a consumer loan application relates (which principally consists of residential properties) using the fair value of the underlying collateral appraised by KB Land, the Korea Real Estate Board or external appraisal experts as part of our loan approval process. Such appraisals are collated in the Credit Wizard system used by Woori Bank, and such information is updated periodically to reflect changes (such as any changes in credit scores of borrowers or the appraisal value of collateral). For example, Woori Bank automatically obtains re-evaluations for the underlying collateral for secured consumer loans and mortgages every month with respect to apartments. If the value of the collateral declines, we may have the ability to require that the borrower provide more collateral or to change the payment terms of the relevant loan.
189
Table of Contents
Credit Card Approval Process
We have worked to ensure that risk management and credit extension policies with respect to our credit card operations through our direct subsidiary, Woori Card, reflect our group-wide risk management policies and guidelines.
Woori Card reviews each new card application for completeness, accuracy and creditworthiness. It bases this review on various factors that assess the applicant’s ability to repay borrowed amounts. The review process involves three stages:
| • | Initial Application Process. Woori Card verifies basic information by requesting certain documents from the applicant, generally contacts the applicant directly (usually by telephone, although there are personal visits to some applicants) and statistically analyzes the applicant’s personal credit history together with financial and default information gathered from third-party sources and its internal database. The analysis considers various factors including employment, default status and historical relationships with Woori Bank and any delinquency history with other credit card companies. Woori Card also reviews information about an applicant obtained from external databases maintained by the Korea Federation of Banks and Nice Information Service Inc. |
| • | Application Scoring System Process. The application scoring system at Woori Card is a standardized evaluation tool used to determine the probability of a credit card applicant defaulting during the one-year period following issuance. The application scoring system, using a statistical model, assigns risks to factors that indicate a probability of non-payment. The model analyzes credit history, occupation and income data to develop a combined risk score. The applicant’s eligibility to receive a credit card and credit limit is determined by its anticipated delinquency ratio over 90 days within one year. |
| • | Credit Assessment. If the application is approved, then the application scoring system assessment is used to determine the applicant’s credit limit. The aggregate credit limit for a new applicant who is an individual rarely exceeds ₩20 million. There is a separate but similar system for determining the credit limit available to corporate card applicants, which will generally be higher than limits available to individual applicants but will not provide for the ability to obtain cash advances. |
The entire approval process generally takes two to three days and the applicant receives the new card within one week after making an application. Woori Card evaluates and updates the application scoring system on a monthly basis (or more frequently as required) to incorporate new data or adjust the importance placed on existing data or market conditions.
Credit Review and Monitoring
Our credit review and monitoring procedures are designed to reduce the risks of deterioration in our asset quality and to maintain acceptable levels of portfolio risk. These procedures include:
| • | confirming a borrower’s credit rating or score; |
| • | ensuring the accuracy of the credit analysis done by our credit officers; and |
| • | ensuring compliance with internal policies relating to loan approval. |
We believe that these procedures enable us to identify potential non-performing loans as soon as possible and minimize the possibility of approving in advance loans that will become non-performing. These procedures also enable us to manage credit risk more effectively and set interest rates to more accurately reach our targeted level of return.
Loan Review and Monitoring
Woori Bank monitors credit risk with respect to its borrowers using its loan review system. Woori Bank has a loan review unit that oversees its review and monitoring efforts. After a loan has been approved, the relevant
190
Table of Contents
materials or the results generated by Woori Bank’s credit evaluation system, together with any supporting data, are reviewed by an officer in that unit. There are three types of reviews that Woori Bank’s loan review unit undertakes:
| • | Desk review. Desk reviews are the most common and are generally done within five days after a loan has been approved. Although the process is similar, different loans are automatically reviewed by Woori Bank based on the size of the loan. The loan review unit will initiate a desk review of loans approved by a credit officer committee or the Loan Committee, for any corporate loan over ₩5 billion, any consumer loan over ₩1 billion, any loan to a housing applicant group over ₩5 billion or any loan where the loan terms were adjusted. For loans originating from a branch, the loan review unit will randomly initiate a desk review for new domestic loans. For overseas loans, desk reviews are conducted for new loans (including credit limit increases) over US$300,000. Ex post desk reviews are also conducted on consumer and corporate loans approved by a domestic branch manager for borrowers with aggregate unsecured loans over ₩50 million or aggregate secured loans over ₩300 million, and new consumer and corporate loans (including credit limit increases) over US$30,000 approved by overseas branch managers. |
| • | Periodic review. Periodic reviews are done on a quarterly, semi-annual or annual basis with respect to loans that are current and over ₩10 billion or with respect to borrowers who are on a “watch list” with respect to possible insolvency. Quarterly periodic reviews are done for certain corporate borrowers, depending on their size and the borrower’s industry. |
| • | Ad hoc review. Ad hoc reviews can be done at any time. The head of Woori Bank’s Risk Management Department or the chief executive officer or chief financial officer of Woori Bank can initiate ad hoc reviews. Loan review officers who are responsible for desk and periodic reviews also conduct ad hoc reviews. |
Following a review, Woori Bank’s sales office may hold additional meetings with the borrower and adjust the loan amount or the borrower’s credit rating. The loan review unit may also direct sales office personnel to institute early collections or to adjust a borrower’s credit rating, total exposure and asset portfolio without consulting the borrower. The loan review officer may request that the credit officer adjust a borrower’s credit ratings based on various factors, including asset quality, credit limits, applied interest rates and our credit policies. We also continually review other factors, such as industries in which borrowers operate and their domestic and overseas assets and operations, to ensure that our ratings are appropriate.
Woori Bank monitors and manages its exposures to and credit limits for corporations and chaebols on a daily basis. Woori Bank uses its Total Exposure Management System to make real-time inquiries regarding its exposures, either by company or by chaebol, and to manage the credit limits for all kinds of business transactions. Woori Bank monitors and analyzes these exposures on a monthly basis. Corporate borrowers on Woori Bank’s “watch list” are monitored more closely and with respect to additional aspects of their relationships with us. Woori Bank places borrowers on its watch list when it believes that any impediment on a borrower’s ability to meet its financial obligations exists or is pending. Woori Bank may also monitor newly extended credits or any additional credits extended to a previous borrower more frequently if it believes additional monitoring is necessary after reviewing the loan approval process. Credits outstanding to a particular industry or region that Woori Bank believes are higher risk are monitored even more frequently. Based on the results of such monitoring, the loan review unit of Woori Bank provides monthly reports to its chief executive officer and its Risk Management Committee.
Woori Bank has the ability to conduct daily surveillance on the status of its retail borrowers through an online system established by the Korea Federation of Banks. This system, which tracks consumer loans at all major Korean banks and non-banking institutions, permits us to track all loan defaults by any borrower. Woori Bank evaluates the need to monitor consumer loans by using its consumer credit evaluation system, including its behavioral scoring system, and makes adjustments to the credit scoring formula based on the results of that process.
191
Table of Contents
Woori Bank’s loan review unit in its Risk Management Department is required to submit monthly loan review reports and quarterly deficiency reports to the chief executive officer and the head of the Risk Management Department of Woori Bank. The chief executive officer then provides feedback to the relevant sales offices of Woori Bank’s branches through its auditing team or relevant business group. Based on these reports, we may, for example, stop lending to particular borrowers, change credit limits or modify our loan approval procedures. We do not monitor loans to certain borrowers, such as loans to government entities.
Credit Card Review and Monitoring
Woori Card monitors its risk exposure to individual accounts on a regular basis. It monitors each customer’s card usage trends and negative credit data such as delinquency information through both its own credit risk management system (which was developed with the assistance of an outside consultant) and BC Card’s similar system (which BC Card maintains for its member institutions). These systems monitor the behavior of users of Woori Card’s credit cards, using both internally generated information and information from external sources. Woori Card statistically analyzes this information to estimate each customer’s creditworthiness on a monthly basis. The credit risk management system is an integral part of the credit practices at Woori Card and is used to determine increases or decreases in credit limits, reset interest rates, set fee levels, authorize special transactions and approve card loans using criteria such as:
| • | how much credit each customer has incurred in the past (i.e., frequency and amount of payments); |
| • | whether a customer uses his card to make credit card purchases or to get cash advances; |
| • | internal credit scores; and |
| • | whether the customer has been delinquent in making payments. |
After assigning appropriate weightings to each factor, the system computes a behavior score and uses that score to classify each cardholder. Each customer’s credit limit is subject to adjustment in accordance with the monthly updated score. Woori Card uses these results and the results of its application scoring system to evaluate its credit risk management system and make adjustments to its credit scoring formula based on the results of that process.
Woori Card’s credit risk management system has also been able to run various simulations in connection with monitoring its operations, including:
| • | new product simulations, which predict a customer’s likely spending pattern when using a new credit card product and analyzes that pattern to predict the new product’s costs, delinquencies and profitability; and |
| • | credit use limit simulations, which test whether a customer’s credit limit has been properly set by simulating an increase or decrease of that limit. |
Woori Card’s credit administration team manages customer credit risk for users of its credit cards. It reviews and updates its underwriting, credit evaluation, collection, servicing and write-off procedures, and the terms and conditions of card agreements, from time to time in accordance with its business practices, applicable law and guidelines issued by regulatory authorities.
Early Warning Systems
Woori Bank and Woori Card have developed separate early warning systems that monitor the status of both commercial and retail borrowers and evaluate all of a customer’s outstanding credits. These systems monitor various factors, including the financial status, financial transaction status, industry rating and management status of borrowers. They enable our subsidiaries to find defaults and signs of potential delinquency in advance, monitor these problematic credits properly before any default or delayed payment occurs and keep track of
192
Table of Contents
information on the credit status of borrowers. Updated information is input as it becomes available, either automatically from internal and external sources or manually. This information includes data relating to:
| • | credit evaluation and monitoring system results, which determine if a borrower should be put on a watch list; |
| • | loan transactions, such as a borrower’s remaining line of credit and whether it has any dishonored notes, overdue loans or setoffs with respect to collateral deposits which have not matured; |
| • | deposit transactions, such as any decrease in a borrower’s average deposit balance, requests for large volumes of promissory notes or checks, or the inability to pay immediately available funds owed when due; |
| • | foreign exchange transactions, such as unpaid amounts of a borrower’s purchased export bills that have exceeded the maturity date; and |
| • | other information, such as a borrower’s management and employees, business operations, production operations, financial affairs and accounting operations and bank transactions. |
We also monitor borrowers’ credits through online credit reports that are provided by Korea Information Service and National Information & Credit Evaluation, Inc., which are Korean credit reporting agencies.
After gathering this information, for example at Woori Bank, the early warning system reviews such information to monitor any changes that could affect the credit rating of the borrower, approval conditions with respect to the loan or credit, underlying collateral or assigned credit limit of the borrower. Depending on the likelihood of the change, the system automatically sends a signal to the responsible credit officer. The officer then evaluates the information and formulates an action plan, which could result in an adjustment in the borrower’s credit rating or loan pricing, a re-evaluation of the loan or the taking of other preventative measures.
Credit Remediation
We believe that by centralizing the management of our non-performing credits within each subsidiary, we can implement uniform policies for non-performing credit resolution, pool institutional knowledge and create a more specialized (and therefore more efficient) work force. To the extent relevant to its business, each of our subsidiaries has one or more units that are responsible for managing non-performing loans. At Woori Bank, for example, the Credit Management and Collection Department and the Corporate Restoration Department generally oversee the process for resolving non-performing loans transferred to them by Woori Bank’s other business groups. When a loan becomes non-performing, the Credit Management and Collection Department and the Corporate Restoration Department will begin a due diligence review of the borrower’s financial condition, send a notice demanding payment or stating that the group will take legal action, and prepare for legal action. At the same time, Woori Bank initiates its non-performing loan management process. Once Woori Bank has confirmed the details of a non-performing loan, it makes efforts to recover amounts owed to it. Methods for resolving non-performing loans include commencing collection proceedings or legal actions and writing off such loans, transferring them to affiliates in charge of collection and authorizing those subsidiaries to recover what they can. We have also disposed of a number of non-performing credits to UAMCO and various structured companies. See “Item 4.B. Business Overview—Assets and Liabilities—Asset Quality of Loans—Non-Performing Loan Strategy.”
Market Risk Management
The principal market risks to which we are exposed are interest rate risk, foreign exchange risk and, to a lesser extent, equity risk and commodity risk. We divide market risk into risks arising from trading activities and risks relating to management of our assets and liabilities.
Our Board Risk Management Committee establishes risk capital allocation for our trading activities. Our Group Risk Management Department and our Subsidiary Risk Management Departments, in turn, manage more specific risk limits and loss limits and regularly report the results to our Board Risk Management Committee and the relevant Subsidiary Risk Management Committees. We use the standardized method and the internal model method to measure and analyze the market risk from our trading activities.
193
Table of Contents
Market Risk Management for Trading Activities
We measure market risk from trading activities to monitor and control the risk of our business groups and teams that perform those activities. Our trading activities consist of:
| • | trading activities for our own account to realize short-term trading profits in debt (primarily Won-denominated), equity and foreign exchange markets based on our forecasts of changes in market situation and customer demand; and |
| • | trading activities involving derivatives transactions, including interest rate and foreign exchange swaps, forwards, futures and options and, to a lesser extent, commodity derivatives, primarily to sell derivatives products to our customers and to hedge our own market risk. |
Market risk arising from our trading activities can be subdivided into interest rate risk, foreign exchange risk and equity risk:
| • | Interest rate risk is a significant risk to which our trading activities are exposed. This risk arises primarily from our debt securities (which are primarily held by Woori Bank). We set different risk limits for our interest rate risk for our trading and non-trading debt portfolios. |
| • | Foreign exchange risk arises from foreign currency-denominated assets and liabilities in both our trading and non-trading accounts and financial derivatives involving foreign currencies, which are not controlled separately on a trading and asset/liability management basis. |
| • | Equity risk arises from price and volatility fluctuations in equity securities and derivatives. |
The following table shows the volume and types of Woori Bank’s trading positions (including trust accounts) subject to market risk as of the dates indicated:
| As of December 31, | ||||||||
| 2021 | 2022 | |||||||
| (in millions of Won) | ||||||||
| Debt securities |
₩ | 1,492,053 | ₩ | 2,975,992 | ||||
| Equity securities |
23,270 | 30,443 | ||||||
| Spot exchanges(1) |
1,635,226 | 1,763,291 | ||||||
| Derivatives(2) |
10,440,258 | 18,951,560 | ||||||
|
|
|
|
|
|||||
| Total |
₩ | 13,590,806 | ₩ | 23,721,286 | ||||
|
|
|
|
|
|||||
| (1) | Represents the overall net open currency position in each currency, which is the greater of (i) the sum of the absolute values of all short positions and (ii) the sum of the absolute values of all long positions. |
| (2) | For over-the-counter derivatives, represents the absolute value of over-the-counter derivatives measured at fair value at the end of the relevant year. For exchange-traded derivatives, includes the amount of deposits and the collateral posted for such derivatives. |
The Board Risk Management Committee monitors market risk both for the group and for each relevant subsidiary individually. See “—Overview.” The Board Risk Management Committee has established a maximum “risk appetite” for each relevant subsidiary, which is defined as the risk capital of such subsidiary divided by its available capital. “Risk capital” is a benchmark figure that determines the market risk limits, accumulated loss limits (for trading portfolios) and present value of a basis point (or PVBP) limits (for non-trading debt securities) for each subsidiary. Available capital generally consists of shareholder’s equity. Using this benchmark, as of December 31, 2022, we have established market risk limits with respect to Woori Bank as shown in the following table:
| Trading Portfolio |
Non-Trading Portfolio | |||||
| Accumulated Loss Limit |
| |||||
| VaR Limit |
Quarter |
Annual |
PVBP Limit | |||
| (in billions of Won) | ||||||
| ₩ 19.4 |
₩ 120.8 | ₩ 241.6 | ₩ 10.5 | |||
194
Table of Contents
Each of our relevant subsidiaries generally manages its market risk at the portfolio level. To control its exposure, each such subsidiary takes into consideration the market risk limits, accumulated loss limits and PVBP limits set by the Board Risk Management Committee in determining its internal allocation of risk among its various portfolios. Each relevant subsidiary also sets its own stop loss limits with respect to particular types of transactions. Woori Bank uses an integrated market risk management system to manage market risks for trading operations, which enables Woori Bank to generate consistent VaR numbers for all of its trading activities.
In addition, Woori Bank has implemented internal processes which include a number of key controls designed to ensure that fair value is measured appropriately, particularly where a fair value model is internally developed and used to price a significant product. See “Item 5.A. Operating Results—Critical Accounting Policies—Valuation of Financial Assets and Liabilities” and Notes 2-(9)-5), 3-(3) and 11 of the notes to our consolidated financial statements. Woori Bank’s Risk Management Department reviews the existing pricing and valuation models on a regular basis, with a focus on their underlying modeling assumptions and restrictions, to assess the appropriateness of their continued use. In consultation with its Trading Department, Woori Bank’s Risk Management Department recommends potential valuation models to its Fair Value Evaluation Committee. Upon approval by Woori Bank’s Fair Value Evaluation Committee, the selected valuation models are reported to its Risk Management Committee.
Value at Risk analysis. Woori Bank uses daily VaR to measure market risk. Daily VaR is a statistically estimated maximum amount of loss that can occur for a day. Woori Bank uses a 99% confidence level to measure its daily VaR, which means the actual amount of loss may exceed the VaR, on average, once out of 100 business days. Woori Bank uses the “historical simulation method” which takes into account the diversification effects among different risk factors.
Although VaR is a commonly used market risk management technique, it has some inadequacies. Since it is a statistical approach, VaR estimates possible losses over a certain period at a particular confidence level using past market movement data. Past market movements, however, are not necessarily a good indicator of future events. Another problem with VaR is that the time periods used for the model, generally one or 10 days, are assumed to be a sufficient holding period before liquidating the relevant underlying positions. If these holding periods are not sufficient, or too long, VaR may understate or overstate the potential loss. VaR is most appropriate as a risk measure for trading positions in liquid financial markets and will understate the risk associated with severe events, such as a period of extreme liquidity.
The following table shows Woori Bank’s daily VaR as of the dates indicated at a 99% confidence level for a one-day holding period, for interest rate risk, equity risk, foreign exchange risk and commodity risk relating to its trading activities.
| Interest Rate Risk |
Foreign Exchange Risk |
Equity Risk |
Commodity Risk |
Less: Diversification |
VaR for Overall Trading Activities |
|||||||||||||||||||
| (in millions of Won) | ||||||||||||||||||||||||
| As of December 31, 2021 |
4,177 | 5,904 | 2,972 | — | 6,072 | 6,981 | ||||||||||||||||||
| As of December 31, 2022 |
11,800 | 17,608 | 7,055 | — | 17,354 | 19,109 | ||||||||||||||||||
In 2020, 2021 and 2022, the average, high, low and ending amounts of Woori Bank’s daily VaR relating to its trading activities (at a 99% confidence level for a one-day holding period) were as follows:
| As of December 31, 2020 |
For the year ended December 31, 2020 |
As of December 31, 2021 |
For the year ended December 31, 2021 |
As of December 31, 2022 |
For the year ended December 31, 2022 |
|||||||||||||||||||||||||||||||||||||||||||
| Average | Maximum | Minimum | Average | Maximum | Minimum | Average | Maximum | Minimum | ||||||||||||||||||||||||||||||||||||||||
| Interest risk |
₩ | 6,815 | ₩ | 7,959 | ₩ | 15,065 | ₩ | 2,427 | ₩ | 4,177 | ₩ | 4,681 | ₩ | 14,017 | ₩ | 2,405 | ₩ | 11,800 | ₩ | 8,847 | ₩ | 11,987 | ₩ | 4,298 | ||||||||||||||||||||||||
| Foreign exchange risk |
11,160 | 8,814 | 11,233 | 4,613 | 5,904 | 6,745 | 13,144 | 4,747 | 17,608 | 14,002 | 22,251 | 5,421 | ||||||||||||||||||||||||||||||||||||
| Equity risk |
2,283 | 5,783 | 14,394 | 1,982 | 2,972 | 3,637 | 6,676 | 1,609 | 7,055 | 6,590 | 12,448 | 1,806 | ||||||||||||||||||||||||||||||||||||
| Commodity risk |
— | — | — | — | — | — | — | — | — | — | — | — | ||||||||||||||||||||||||||||||||||||
| Diversification |
(11,087 | ) | (11,175 | ) | (18,796 | ) | (3,452 | ) | (6,072 | ) | (7,300 | ) | (20,007 | ) | (3,628 | ) | (17,354 | ) | (12,725 | ) | (19,640 | ) | (4,201 | ) | ||||||||||||||||||||||||
|
|
|
|
|
|
|
|
|
|
|
|
|
|
|
|
|
|
|
|
|
|
|
|
|
|||||||||||||||||||||||||
| Total risk |
₩ | 9,171 | ₩ | 11,381 | ₩ | 21,896 | ₩ | 5,570 | ₩ | 6,981 | ₩ | 7,763 | ₩ | 13,831 | ₩ | 5,134 | ₩ | 19,109 | ₩ | 16,714 | ₩ | 27,046 | ₩ | 7,324 | ||||||||||||||||||||||||
|
|
|
|
|
|
|
|
|
|
|
|
|
|
|
|
|
|
|
|
|
|
|
|
|
|||||||||||||||||||||||||
195
Table of Contents
The graph of Woori Bank’s daily 99% VaR relating to its trading activities in 2022 is as follows:
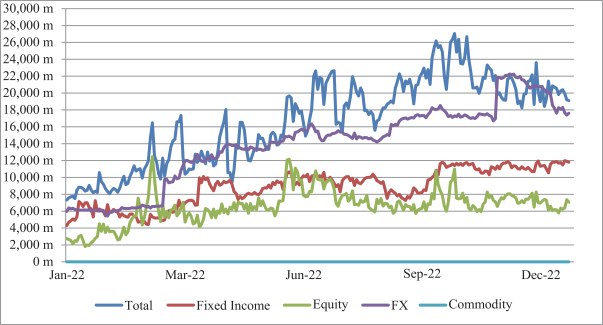
Standardized Method. The standardized method is used to measure the market risk of the positions for which the Financial Supervisory Service has not approved the use of the VaR method. The following table shows Woori Bank’s market risk capital charges measured using the standardized method as of the dates indicated:
| As of December 31, | ||||||||
| 2021 | 2022 | |||||||
| (in millions of Won) | ||||||||
| Risk categories |
||||||||
| Interest risk |
₩ | 20,511 | ₩ | 4,021 | ||||
| Equity risk |
8,569 | 6,896 | ||||||
| Foreign exchanges risk |
50,899 | 66,497 | ||||||
| Commodity risk |
— | — | ||||||
|
|
|
|
|
|||||
| Total |
₩ | 79,979 | ₩ | 77,414 | ||||
|
|
|
|
|
|||||
Back-testing. Woori Bank conducts back testing on a daily basis to validate the adequacy of its market risk management. Back testing compares both the actual and hypothetical profit and loss with VaR calculations and analyzes any results that fall outside a predetermined confidence interval of 99%. The number of times the actual changes in Woori Bank’s profit and loss exceeded the VaR amounts in 2020, 2021 and 2022 was 3.
Stress test. In addition to VaR, Woori Bank performs stress testing to measure market risk. As VaR assumes normal market situations, Woori Bank assesses its market risk exposure to abnormal market fluctuations through stress testing. Stress testing is an important way of supporting VaR since VaR is a statistical expression of possible loss under a given confidence level and holding period. It does not cover potential loss if the market moves in a manner that is outside normal expectations. Stress testing projects the anticipated change in value of holding positions under certain scenarios assuming that no action is taken during a stress event to change the risk profile of a portfolio. The following table shows, for Woori Bank, the loss that would have occurred in its trading portfolio as of December 31, 2022 for assumed short-term extreme changes of a +/-20% change in the equity market and a +/-60 basis point change from interest rates prevailing in the market on that date, under an abnormal stress environment.
196
Table of Contents
| (in billions of Won, except percentages) | ||||||||||||||||||||||||
| Equity Market Chart Market fluctuation amount |
(20 | )% | (10 | )% | (5 | )% | 5 | % | 10 | % | 20 | % | ||||||||||||
|
|
|
|
|
|
|
|
|
|
|
|
|
|||||||||||||
| ₩ | (145 | ) | ₩ | (92.5 | ) | ₩ | (37.6 | ) | ₩ | 5.0 | ₩ | (8.1 | ) | ₩ | (9.1 | ) | ||||||||
|
|
|
|
|
|
|
|
|
|
|
|
|
|||||||||||||
| (in billions of Won, except basis points) | ||||||||||||||||||||||||
| Interest Rate Chart Basis point fluctuation amount |
|
(60) basis points |
|
|
(40) basis points |
|
|
(20) basis points |
|
|
20 basis points |
|
|
40 basis points |
|
|
60 basis Points |
| ||||||
|
|
|
|
|
|
|
|
|
|
|
|
|
|||||||||||||
| ₩ | 22.5 | ₩ | 15.0 | ₩ | 7.5 | ₩ | (7.4 | ) | ₩ | (14.9 | ) | ₩ | (22.3 | ) | ||||||||||
|
|
|
|
|
|
|
|
|
|
|
|
|
|||||||||||||
Interest Rate Risk
Interest rate risk from trading activities arises mainly from our trading of Won-denominated debt securities. Our general trading strategy is to benefit from short-term movements in the prices of debt securities arising from changes in interest rates. As Woori Bank’s trading accounts are marked-to-market daily, Woori Bank manages its interest rate risk related to trading accounts using market value-based tools such as VaR. See “—Asset and Liability Management—Interest Rate Risk.”
Foreign Exchange Risk
Foreign exchange risk arises because we have assets, liabilities and off-balance sheet items such as foreign exchange forwards and currency swaps that are denominated in non-Won currencies. The difference between each of our relevant subsidiaries’ foreign currency assets and liabilities is offset against forward foreign exchange positions to obtain its net foreign currency open position. Woori Bank determines its maximum foreign exchange exposure for both trading and asset and liability management purposes by establishing a limit for this net foreign currency open position. Woori Bank’s Risk Management Committee also establishes VaR limits for its foreign exchange business.
Assets and liabilities denominated in U.S. dollars account for the majority of our foreign currency assets and liabilities. Those denominated in Japanese yen and the euro account for most of the remainder, the majority of which have been swapped into U.S. dollars.
Each of our relevant subsidiaries monitors changes in, and matches of, foreign-currency assets and liabilities in order to reduce exposure to currency fluctuations. Most of our foreign exchange risk arises in connection with the operations of Woori Bank. Our relevant subsidiaries also manage risks relating to exchange rate fluctuations through foreign exchange dealing, including by their overseas branches. However, we conduct foreign exchange dealings primarily on behalf of our customers. Our counterparties are generally domestic and foreign financial institutions and banks. The following table sets forth information concerning Woori Bank’s limits on proprietary foreign exchange dealings as of December 31, 2022:
| Won/U.S. Dollar Dealing | Dealings in other currencies | |||||||||||||||||||||||
| Headquarters | Headquarters | Overseas Branches | ||||||||||||||||||||||
| Total | Individual | Total | Individual | Total | Individual | |||||||||||||||||||
| (in millions of US$) | ||||||||||||||||||||||||
| Open position |
||||||||||||||||||||||||
| Daily maximum limit |
US$ | 1,000 | US$ | 200 | US$ | 200 | US$ | 50 | US$ | 60 | US$ | 15 | ||||||||||||
| Daily closing limit |
200 | 50 | 100 | 20 | 30 | 6 | ||||||||||||||||||
| Stop loss: |
||||||||||||||||||||||||
| Daily |
2 | 0.5 | 0.8 | 0.15 | 0.24 | 0.045 | ||||||||||||||||||
| Monthly |
3 | 0.8 | 2 | 0.5 | 0.6 | 0.15 | ||||||||||||||||||
197
Table of Contents
The following table shows the non-consolidated net open positions of Woori Bank as of the dates indicated. Positive amounts represent long exposures and negative amounts represent short exposures.
| As of December 31, | ||||||||
| 2021 | 2022 | |||||||
| (in millions of US$) | ||||||||
| Currency |
||||||||
| U.S. dollar |
US$ | (57.0 | ) | US$ | 1,315.7 | |||
| Japanese yen |
(60.7 | ) | (43.2 | ) | ||||
| Euro |
(623.2 | ) | (433.5 | ) | ||||
| Others |
254.0 | 254.9 | ||||||
|
|
|
|
|
|||||
| Total |
US$ | (487.0 | ) | US$ | 1,093.9 | |||
|
|
|
|
|
|||||
Equity Risk
Equity price risk and equity volatility risk arise primarily from Woori Bank’s equity portfolio, which consists mainly of futures contracts and options and Won-denominated equity securities, as a result our imposition of strict VaR limits, accumulated loss limits and stress test limits. Equity risk arises in the context of trading activities for our own accounts to realize short-term trading profits with respect to equity securities and trading activities involving certain derivatives transactions.
Derivatives-Related Market Risk
The Foreign Exchange Transaction Regulations of Korea provide that a foreign exchange bank (such as Woori Bank) may generally enter into derivatives transactions without restriction so long as those transactions are not linked with credit risks of a party to the transaction or any third party. If they are, the bank must report the transaction to the Bank of Korea.
Most of the derivatives products that our subsidiaries trade are on behalf of their customers or to hedge their own positions. Our derivatives activities include interest rate and cross-currency swaps, foreign exchange forwards, stock index and interest rate futures, forward rate agreements and currency and over-the-counter equity options.
Asset and Liability Management
Our principal market risk with respect to managing our assets and liabilities is interest rate risk. Interest rate risk arises due to mismatches in the maturities or re-pricing periods of rate-sensitive assets and liabilities, such as loans and deposits. Any imbalance of the maturity of our interest rate-sensitive assets and liabilities and the gap resulting from that imbalance may cause net interest income to be affected by changes in the prevailing level of interest rates. Our principal asset and liability management objectives are to generate stable net interest revenues and protect our asset value against interest rate fluctuations.
Woori Bank uses a standardized asset and liability management system for its Won- and foreign currency-denominated assets and liabilities. In addition, Woori Bank’s system also allows it to manage the assets and liabilities in its trust accounts. Its system uses the historical scenario method to determine interest rate ΔEVE (change in economic value of equity), supplemented by modules to calculate and monitor our liquidity coverage ratio and net stable funding ratio.
Interest Rate Risk
We manage interest rate risk based on rational interest rate forecasts, using gap analysis to measure the difference between interest-sensitive assets and interest-sensitive liabilities, and using simulations to calculate the effect of changing interest rates on income. We principally manage this risk by managing maturity and duration gaps between our interest-earning assets and interest-bearing liabilities.
198
Table of Contents
We measure interest rate risk for Won and foreign currency assets and liabilities, including derivatives and principal guaranteed trust accounts. Most of our interest-earning assets and interest-bearing liabilities are denominated in Won and our foreign currency-denominated assets and liabilities are mostly denominated in U.S. dollars. We believe, however, that our interest rate sensitivity is limited with respect to our Won-denominated assets. Deposits in Won generally bear fixed rates of interest for fixed time periods (other than deposits payable on demand which constituted approximately 43.9% of our total deposits in Won as of December 31, 2022). We generally adjust the interest rates on these deposits when they are rolled over. In addition, as of December 31, 2022, 96.7% of those deposits had current maturities of one year or less. As of December 31, 2022, approximately 74.0% of our Won-denominated loans bore floating rates of interest, and 70.2% of those loans had current maturities of one year or less.
Interest rate gap analysis measures expected changes in net interest revenues by calculating the difference in the amounts of interest-earning assets and interest-bearing liabilities at each maturity and interest resetting date. Woori Bank performs interest rate gap analysis for Won and foreign currency-denominated assets on a monthly basis.
Interest Rate Gap Analysis. For interest rate gap analysis we use or assume the following maturities for different assets and liabilities:
| • | With respect to maturities of assets, for prime rate-linked loans, we apply the actual maturities of each loan; furthermore, we assume the reserves with the Bank of Korea and loans and securities classified as substandard or below to have maximum remaining maturities. |
| • | With respect to maturities of liabilities, for demand deposits with no fixed maturities, a portion of the demand deposits are recognized to have maturities of less than three months as calculated in accordance with Financial Services Commission guidelines. |
Our Board Risk Management Committee’s interest rate risk limit for Woori Bank generally requires that its earnings at risk for Won-denominated accounts be within 10% of its estimated net interest income for a one-year period. We calculate ΔEVE through our standardized asset and liability management system, which uses the historical scenario method to simulate the current portfolio’s net asset value for a one-year holding period at a 99.9% confidence level.
199
Table of Contents
The following tables show, for Woori Bank, on a non-consolidated basis pursuant to the guidelines of the Financial Supervisory Service, the interest rate gap for Won-denominated accounts and foreign currency-denominated accounts as of December 31, 2022:
| As of December 31, 2022 | ||||||||||||||||||||||||
| 0-3 Months | 3-6 Months | 6-12 Months | 1-3 Years | Over 3 Years | Total | |||||||||||||||||||
| (in billions of Won, except percentages) | ||||||||||||||||||||||||
| Won-denominated accounts: |
||||||||||||||||||||||||
| Interest rate-sensitive assets |
||||||||||||||||||||||||
| Free interest rate |
₩ | 17,904 | ₩ | 14,879 | ₩ | 11,439 | ₩ | 19,806 | ₩ | 4,893 | ₩ | 68,921 | ||||||||||||
| Market interest rate |
160,749 | 38,479 | 18,561 | 32,020 | 18,894 | 268,703 | ||||||||||||||||||
| Interest rate pegged to customer deposit |
90 | 71 | 127 | 40 | 13 | 341 | ||||||||||||||||||
|
|
|
|
|
|
|
|
|
|
|
|
|
|||||||||||||
| Total |
₩ | 178,743 | ₩ | 53,429 | ₩ | 30,127 | ₩ | 51,866 | ₩ | 23,800 | ₩ | 337,965 | ||||||||||||
|
|
|
|
|
|
|
|
|
|
|
|
|
|||||||||||||
| Interest rate-sensitive liabilities |
||||||||||||||||||||||||
| Free interest rate |
₩ | 32,294 | ₩ | 4,635 | ₩ | 8,240 | ₩ | 27,477 | ₩ | 28,348 | ₩ | 100,994 | ||||||||||||
| Market interest rate |
101,080 | 35,251 | 59,959 | 10,117 | 4,325 | 210,732 | ||||||||||||||||||
|
|
|
|
|
|
|
|
|
|
|
|
|
|||||||||||||
| Total |
₩ | 133,374 | ₩ | 39,886 | ₩ | 68,199 | ₩ | 37,594 | ₩ | 32,673 | ₩ | 311,726 | ||||||||||||
|
|
|
|
|
|
|
|
|
|
|
|
|
|||||||||||||
| Sensitivity gap |
45,369 | 13,543 | (38,072 | ) | 14,272 | (8,873 | ) | 26,239 | ||||||||||||||||
| Cumulative gap |
45,369 | 58,912 | 20,840 | 35,112 | 26,239 | 26,239 | ||||||||||||||||||
| % of total assets(1) |
12.04 | 15.64 | 5.53 | 9.32 | 6.96 | 6.96 | ||||||||||||||||||
| Total assets in Won |
₩ | 376,746 | ||||||||||||||||||||||
| As of December 31, 2022 | ||||||||||||||||||||||||
| 0-3 Months | 3-6 Months | 6-12 Months | 1-3 Years | Over 3 Years | Total | |||||||||||||||||||
| (in millions of US$, except percentages) | ||||||||||||||||||||||||
| Foreign currency-denominated accounts: |
||||||||||||||||||||||||
| Interest rate-sensitive assets |
||||||||||||||||||||||||
| Free interest rate |
US$ | — | US$ | — | US$ | — | US$ | — | US$ | — | US$ | — | ||||||||||||
| Market interest rate |
18,102 | 2,237 | 846 | 810 | 921 | 22,916 | ||||||||||||||||||
| Interest rate pegged to customer deposit |
— | — | — | — | — | — | ||||||||||||||||||
|
|
|
|
|
|
|
|
|
|
|
|
|
|||||||||||||
| Total |
US$ | 18,102 | US$ | 2,237 | US$ | 846 | US$ | 810 | US$ | 921 | US$ | 22,916 | ||||||||||||
|
|
|
|
|
|
|
|
|
|
|
|
|
|||||||||||||
| Interest rate-sensitive liabilities |
||||||||||||||||||||||||
| Free interest rate |
US$ | — | US$ | — | US$ | — | US$ | — | US$ | 13 | US$ | 13 | ||||||||||||
| Market interest rate |
15,615 | 2,241 | 1,600 | 2,440 | 1,404 | 23,300 | ||||||||||||||||||
|
|
|
|
|
|
|
|
|
|
|
|
|
|||||||||||||
| Total |
US$ | 15,615 | US$ | 2,241 | US$ | 1,600 | US$ | 2,440 | US$ | 1,417 | US$ | 23,313 | ||||||||||||
|
|
|
|
|
|
|
|
|
|
|
|
|
|||||||||||||
| Sensitivity gap |
2,487 | (4 | ) | (754 | ) | (1,630 | ) | (496 | ) | (397 | ) | |||||||||||||
| Cumulative gap |
2,487 | 2,483 | 1,729 | 99 | (397 | ) | (397 | ) | ||||||||||||||||
| % of total assets(1) |
6.59 | % | 6.58 | % | 4.58 | % | 0.26 | % | (1.05 | )% | (1.05 | )% | ||||||||||||
| Total assets in US$ |
US$ | 37,738 | ||||||||||||||||||||||
| (1) | Represents the cumulative gap as a percentage of total assets. |
200
Table of Contents
Duration Gap Analysis. Woori Bank also performs a duration gap analysis to measure and manage its interest rate risk. Duration gap analysis is a more long-term risk indicator than interest rate gap analysis, as interest rate gap analysis focuses only on accounting income and not on the market value of the assets and liabilities. We emphasize duration gap analysis because, in the long run, our principal concern with respect to interest rate fluctuations is the net asset value rather than net interest revenue changes.
For duration gap analysis, we use or assume the same maturities for different assets and liabilities that we use or assume for our interest rate gap analysis.
The following table shows, for Woori Bank, with respect to Won-denominated assets and liabilities, duration gaps and net asset value changes when the interest rate increases by one percentage point as of the specified dates:
| Date |
Interest-bearing asset duration |
Interest-bearing liability duration |
Total asset/liability duration gap |
Net asset value change | ||||||||||||
| (in years) | (in years) | (in years) | (in billions of Won) | |||||||||||||
| June 30, 2021 |
0.95 | 0.97 | (0.01 | ) | 49 | |||||||||||
| December 31, 2021 |
0.91 | 0.95 | 0.00 | 24 | ||||||||||||
| June 30, 2022 |
0.81 | 0.86 | (0.05 | ) | 162 | |||||||||||
| December 31, 2022 |
0.79 | 0.83 | (0.02 | ) | 78 | |||||||||||
We set interest rate risk limits using the historical simulation method, which uses actual historical price, volatility and yield changes in comparison with the current position to generate hypothetical portfolios and calculate a distribution of position and portfolio market value changes. The following table shows Woori Bank’s interest rate ΔEVE with respect to its assets and liabilities for each of the quarters since the fourth quarter of 2021:
| Fourth Quarter 2021 |
First Quarter 2022 |
Second Quarter 2022 |
Third Quarter 2022 |
Fourth Quarter 2022 | ||||||
| (in billions of Won, except percentages) | ||||||||||
| Interest rate ΔEVE |
₩200.6 | ₩444.5 | ₩560.7 | ₩387.7 | ₩144.8 | |||||
The Board Risk Management Committee reviews gap analysis reports, duration gap analysis reports and interest rate limit compliance reports prepared by the Risk Management Department on a quarterly basis.
Foreign Exchange Risk
We manage foreign exchange rate risk arising in connection with the management of our assets and liabilities together with such risks arising from our trading operations. See “—Market Risk Management for Trading Activities—Foreign Exchange Risk” above.
Liquidity Risk Management
Liquidity risk is the risk of insolvency or loss due to disparity between inflow and outflow of funds such as maturity mismatch, including having to obtain funds at a high price or to dispose of securities at an unfavorable price due to lack of available funds. We manage our liquidity in order to meet our financial liabilities from withdrawals of deposits, redemption of matured debentures and repayments at maturity of borrowed funds. We also require sufficient liquidity to fund loans and extend other forms of credits, as well as to make investments in securities. Each of the Subsidiary Risk Management Committees establishes liquidity policies for the respective subsidiary and monitors liquidity on an on-going basis. Our relevant subsidiaries make constant adjustments to take into account variables affecting their liquidity levels. The Subsidiary Risk Management Departments review the uses and sources of funds on a daily basis, taking into consideration the various goals of their respective business groups.
Our liquidity management goal is to be able, even under adverse conditions, to meet all our liability repayments on time and fund all investment opportunities even under adverse conditions.
We maintain diverse sources of liquidity to facilitate flexibility in meeting our funding requirements. We fund our operations principally by accepting deposits from retail and corporate depositors, accessing the call loan
201
Table of Contents
market (a short-term market for loans with maturities of less than one month), issuing debentures and borrowing from the Bank of Korea. We use the majority of funds raised by us to extend loans or purchase securities. Generally, deposits are of shorter average maturity than loans or investments.
In managing liquidity risk, each of our relevant subsidiaries currently determines gap limits, implements those limits and monitors maturity gaps using its asset and liability management system. We also establish gap limits for liquidity management purposes. Each relevant subsidiary has set a total limit in order to manage liquidity risk. For example, Woori Bank’s three-month accumulated gap limits for banking and trust accounts are between (10)% and 10%. In the foreign currency account, the limit for a one-week gap has been set as (3)% or higher and as (10)% or higher for a one-month gap.
Liquidity is maintained by holding sufficient quantities of assets that can be liquidated to meet actual or potential demands for funds from depositors and others. Liquidity is also managed by ensuring that the excess of maturing liabilities over maturing assets in any period is kept to manageable levels relative to the amount of funds we believe we can raise when required. We seek to minimize our liquidity costs by managing our liquidity position on a daily basis and by limiting the amount of cash at any time that is not invested in interest-earning assets or securities.
The Financial Services Commission uses the liquidity coverage ratio, defined as the ratio of highly liquid assets to total net cash outflows over a 30-day period, as the principal liquidity risk management measure and currently requires Korean banks, including Woori Bank, to:
| • | maintain a liquidity coverage ratio of not less than 100% (temporarily reduced to 92.5% until June 2023); |
| • | maintain a foreign currency liquidity coverage ratio of not less than 80% (temporarily reduced to 70% until June 2022 for purposes of increasing foreign currency liquidity in the Korean financial markets); and |
| • | submit monthly reports with respect to the maintenance of these ratios. |
In April 2020, in order to encourage financial institutions to provide financial support to companies adversely affected by COVID-19, the Financial Services Commission announced that it would temporarily lower the required liquidity coverage ratio to 85% and the required foreign currency liquidity coverage ratio to 70%. Following a series of extensions by the Financial Services Commission, the temporary deregulation measures for the foreign currency liquidity coverage ratio expired at the end of June 2022, while the temporary deregulation measures for the liquidity coverage ratio will incrementally return to normal, but the timeline for such normalization to 100% has not been finalized yet.
As of December 31, 2022, Woori Bank’s 30-day liquidity coverage ratio was 104.97%, above the Financial Services Commission’s standard of 92.5%.
The following table shows the liquidity status, on a cumulative basis, and limits for foreign currency accounts of Woori Bank on a non-consolidated basis as of December 31, 2022 in accordance with the Financial Services Commission’s regulations:
| 7 days or less | 8 days –1 month | 3 months or less | ||||||||||
| (in millions of US$, except percentages) | ||||||||||||
| Foreign currency accounts: |
||||||||||||
| Foreign currency assets |
US$ | 22,144 | US$ | 11,407 | US$ | 15,144 | ||||||
| Foreign currency liabilities |
10,964 | 13,990 | 16,906 | |||||||||
| Maturity gap |
11,180 | (2,583 | ) | (1,762 | ) | |||||||
| Cumulative gap (A) |
11,180 | 8,597 | 6,835 | |||||||||
| Total assets (B) |
141,716 | 141,716 | 141,716 | |||||||||
| Liquidity gap ratio (A/B) |
7.89 | % | 6.07 | % | 116.33 | %(1) | ||||||
| Limits |
(3 | )% | (10 | )% | 85 | % | ||||||
| (1) | Liquidity ratio, calculated as foreign currency assets as a percentage of foreign currency liabilities. |
202
Table of Contents
The Subsidiary Risk Management Committees receive reports from the relevant subsidiaries regarding their respective liquidity ratios and liquidity gap ratios on a monthly basis. Based on those reports, each Subsidiary Risk Management Department reports these results to the Board Risk Management Committee on a quarterly basis.
Operational Risk Management
Operational risk is difficult to quantify and subject to different definitions. We define our operational risk as the risk of loss resulting from inadequate or failed internal processes, people and systems or from external events. This definition includes legal risk, but excludes strategic and reputational risk.
To monitor and control operational risks, we maintain a system of comprehensive policies and have put in place a control framework designed to provide a stable and well-managed operational environment throughout our organization. Several bodies are responsible for managing our operational risk, including our Audit and Legal and Compliance Departments and the Subsidiary Risk Management Committees and their respective Subsidiary Risk Management Departments. For example, Woori Bank has implemented a multi-step operational risk management process consisting of engaging in risk self-assessment, establishing key risk indicators, operating an early warning system, managing loss data, measuring operational risk capital, monitoring and reporting risks, promoting a strong risk management culture and developing action plans. Woori Bank has also established policies to change operational risk profiling, select permitted levels of risk, develop action plans and manage results. We are also implementing a group-wide operational risk management system to comply with the operational risk requirements of the final Basel III standards, which will become effective in 2023.
We consider legal risk as a part of our operational risk. The uncertainty of the enforceability of the obligations of our customers and counterparties, including foreclosure on collateral, creates legal risk. Legal risk is higher in new areas of business where the law is often untested in the courts although such risk can also increase in our traditional business to the extent that the legal and regulatory landscape in Korea is changing and many new laws and regulations governing the banking industry remain untested. Our relevant subsidiaries’ legal departments seek to minimize legal risk by using stringent legal documentation, employing procedures designed to ensure that transactions are properly authorized and consulting legal advisers. Each of our relevant subsidiaries’ internal auditors also review loan documentation to ensure that these are correctly drawn up to withstand scrutiny in court should such scrutiny occur.
In connection with our disaster recovery capabilities, Woori Bank has measures in place to recover data and resume core operations within three hours of any business interruption.
The majority of our information technology systems are operated by our subsidiary, Woori FIS. We currently have a “mirror site” in operation with respect to Woori Bank which backs up transaction information on a real-time basis. We also have a “back-up site” in operation with respect to Woori Bank, which backs up transaction information on a daily basis. See “Item 3.D. Risk Factors—Other risks relating to our business—Our operations may be subject to increasing and continually evolving cybersecurity and other technological risks.”
203
Table of Contents
| Item 12. | DESCRIPTION OF SECURITIES OTHER THAN EQUITY SECURITIES |
Fees and Charges
Under the terms of the deposit agreement, as a holder of our ADSs, you are required to pay the following service fees to the depositary:
| Services |
Fees | |
| Issuance of ADSs |
Up to $0.05 per ADS issued | |
| Cancellation of ADSs |
Up to $0.05 per ADS cancelled | |
| Distribution of cash dividends or other cash distributions |
Up to $0.05 per ADS held | |
| Distribution of ADSs pursuant to (i) stock dividends or other free stock distributions, or (ii) exercise of the rights to purchase additional ADSs |
Up to $0.05 per ADS held | |
| Distribution of securities other than ADSs or rights to purchase additional ADSs |
Up to $0.05 per ADS held | |
| ADS services |
Up to $0.05 per ADS held on the applicable record date established by the depositary | |
As a holder of our ADSs, you are also responsible for paying certain fees and expenses such as:
| • | taxes (including applicable interest and penalties) and other governmental charges; |
| • | fees for the transfer and registration of shares charged by the registrar and transfer agent for the shares in Korea (i.e., upon deposit and withdrawal of shares) |
| • | cable, telex and facsimile transmission and delivery expenses; |
| • | expenses and charges incurred in the conversion of foreign currency; |
| • | fees and expenses incurred in connection with compliance with exchange control regulations and other applicable regulatory requirements; and |
| • | fees and expenses incurred in connection with the delivery or servicing of shares on deposit. |
Depositary fees payable upon the issuance and cancellation of ADSs are typically paid to the depositary by the brokers (on behalf of their clients) receiving the newly issued ADSs from the depositary and by the brokers (on behalf of their clients) delivering the ADSs to the depositary for cancellation. The brokers in turn charge these fees to their clients. Depositary fees payable in connection with distributions of cash or securities to ADS holders and the depositary services fee are charged by the depositary to the holders of record of ADSs as of the applicable ADS record date.
The depositary fees payable for cash distributions are generally deducted from the cash being distributed. In the case of distributions other than cash (i.e., stock dividend, rights), the depositary charges the applicable fee to the ADS record date holders concurrent with the distribution. In the case of ADSs registered in the name of the investor (whether certificated or uncertificated in direct registration), the depositary sends invoices to the applicable record date ADS holders. In the case of ADSs held in brokerage and custodian accounts (via the Depository Trust Company, or DTC), the depositary generally collects its fees through the systems provided by DTC (whose nominee is the registered holder of the ADSs held in DTC) from the brokers and custodians holding ADSs in their DTC accounts. The brokers and custodians who hold their clients’ ADSs in DTC accounts in turn charge their clients’ accounts the amount of the fees paid to the depositary.
In the event of refusal to pay the depositary fees, the depositary may, under the terms of the deposit agreement, refuse the requested service until payment is received or may set off the amount of the depositary fees from any distribution to be made to such holder of ADSs.
204
Table of Contents
Note that the fees and charges you may be required to pay may vary over time and may be changed by us and by the depositary. You will receive prior notice of such changes.
Fees and Payments from the Depositary to Us
In 2022, pursuant to an agreement with us, the depositary waived, or made payments to third parties of, approximately $37,013.72 (net of applicable taxes) in the aggregate in connection with proxy process expenses (including printing, postage and distribution expenses), contributions towards investor relations efforts (including investor relations agency fees) and other standard out-of-pocket maintenance costs relating to our ADS facility that were payable by us.
In addition, as part of its service to us, the depositary waives its fees for the standard costs and operating expenses associated with the administration of the ADS facility.
| Item 13. | DEFAULTS, DIVIDEND ARREARAGES AND DELINQUENCIES |
Not Applicable
| Item 14. | MATERIAL MODIFICATIONS TO THE RIGHTS OF SECURITY HOLDERS AND USE OF PROCEEDS |
Not Applicable
| Item 15. | CONTROLS AND PROCEDURES |
Disclosure Controls and Procedures
We have evaluated, with the participation of our chief executive officer and principal financial officer, the effectiveness of our disclosure controls and procedures, as such term is defined in Rules 13a-15(e) and 15d-15(e) under the Exchange Act, as of December 31, 2022. There are inherent limitations to the effectiveness of any system of disclosure controls and procedures, including the possibility of human error and the circumvention or overriding of the controls and procedures. Accordingly, even effective disclosure controls and procedures can only provide reasonable assurance of achieving their control objectives. Based upon our evaluation, our chief executive officer and principal financial officer concluded that our disclosure controls and procedures as of December 31, 2022 were effective to provide reasonable assurance that information required to be disclosed by us in the reports that we file or submit under the Exchange Act, is recorded, processed, summarized and reported, within the time periods specified in the applicable rules and forms, and that it is accumulated and communicated to our management, including our chief executive officer and principal financial officer, as appropriate to allow timely decisions regarding required disclosure.
Management’s Annual Report on Internal Control Over Financial Reporting
Our management is responsible for establishing and maintaining adequate internal control over financial reporting. Our internal control system was designed to provide reasonable assurance to our management and board of directors regarding the reliability of financial reporting and the preparation and fair presentation of published financial statements in accordance with IFRS as issued by the IASB. All internal control systems, no matter how well designed, have inherent limitations. Therefore, even those systems determined to be effective can provide only reasonable assurance with respect to financial statement preparation and presentation and may not prevent or detect misstatements. Also, projections of any evaluation of effectiveness to future periods are subject to the risk that controls may become inadequate because of changes in conditions, or that the degree of compliance with the policies or procedures may deteriorate.
Our management maintains a comprehensive system of controls intended to ensure that transactions are executed in accordance with management’s authorization, assets are safeguarded, and financial records are reliable. Our management also takes steps to ensure that information and communication flows are effective and to monitor performance, including performance of internal control procedures.
205
Table of Contents
Our management assessed the effectiveness of our internal control over financial reporting as of December 31, 2022 based on the criteria established in the Internal Control-Integrated Framework (2013) issued by the Committee of Sponsoring Organizations of the Treadway Commission in May 2013.
Based on this assessment, management believes that, as of December 31, 2022, our internal control over financial reporting is effective.
The effectiveness of our internal control over financial reporting as of December 31, 2022 has been audited by Samil PricewaterhouseCoopers, an independent registered public accounting firm, as stated in its report included herein which expressed an unqualified opinion on the effectiveness of our internal control over financial reporting as of December 31, 2022.
Changes in Internal Control Over Financial Reporting
There has been no change in our internal control over financial reporting during 2022 that has materially affected, or is reasonably likely to materially affect, our internal control over financial reporting.
| Item 16. | RESERVED |
| Item 16A. | AUDIT COMMITTEE FINANCIAL EXPERT |
Our board of directors has determined that each of Dong-Woo Chang, Chan-Hyoung Chung and Sung-Tae Ro, our outside directors and members of our Audit Committee, qualifies as an “audit committee financial expert” and is independent within the meaning of this Item 16A.
| Item 16B. | CODE OF ETHICS |
We have adopted a code of ethics, as defined in Item 16B of Form 20-F under the Exchange Act. Our code of ethics applies to our chief executive officer, principal financial officer and persons performing similar functions as well as to our outside directors and other officers and employees. We also recommend compliance with the code of ethics to our business counterparts. Our code of ethics is available on our website at https://www.woorifg.com. If we amend or delete any provision of this code of ethics, we will disclose such amendment on our website at the same address.
| Item 16C. | PRINCIPAL ACCOUNTANT FEES AND SERVICES |
The following table sets forth the fees billed to us by our independent registered public accountants, Samil PricewaterhouseCoopers, and other firms in the PricewaterhouseCoopers network (which we refer to collectively as PwC), for the fiscal years ended December 31, 2021 and 2022:
| Year ended December 31, | ||||||||
| 2021 | 2022 | |||||||
| (in millions of Won) | ||||||||
| Audit fees |
₩ | 8,574 | ₩ | 8,598 | ||||
| Audit-related fees |
167 | 165 | ||||||
| Tax fees |
437 | 430 | ||||||
| All other fees |
180 | 124 | ||||||
|
|
|
|
|
|||||
| Total fees |
₩ | 9,358 | ₩ | 9,317 | ||||
|
|
|
|
|
|||||
Audit fees in the above table are the aggregate fees billed or expected to be billed by PwC, in connection with the audit of our annual financial statements, the review of our interim financial statements, the review of filings with the U.S. Securities and Exchange Commission and audit of the effectiveness of our internal control over financial reporting.
Audit-related fees in the above table are the aggregate fees billed or expected to be billed by PwC for agreed-upon procedures related to the issuance of comfort letters in connection with the issuance of debt securities.
206
Table of Contents
Tax fees in the above table are the aggregate fees billed or expected to be billed by PwC for assistance in the preparation of certain tax returns and other tax advice.
All other fees in the above table are the aggregate fees billed in each of the fiscal years by PwC for all other services which are not part of the three categories above.
Audit Committee Pre-Approval Policies and Procedures
Our Audit Committee pre-approves all audit services to be provided by our independent auditors. Our Audit Committee’s policy regarding the pre-approval of non-audit services to be provided to us by our independent auditors is that all such services shall be pre-approved by our Audit Committee. Non-audit services that are prohibited to be provided to us by our independent auditors under the rules of the SEC and applicable law may not be pre-approved. In addition, prior to the granting of any pre-approval, our Audit Committee must be satisfied that the performance of the services in question will not compromise the independence of our independent auditors. Our Audit Committee also pre-approves the selection or replacement of the independent auditors of our subsidiaries.
Our Audit Committee did not approve any non-audit services under the de minimis exception of Rule 2-01(c)(7)(i)(C) of Regulation S-X as promulgated by the U.S. Securities and Exchange Commission.
| Item 16D. | EXEMPTIONS FROM THE LISTING STANDARDS FOR AUDIT COMMITTEES |
Not Applicable
| Item 16E. | PURCHASE OF EQUITY SECURITIES BY THE ISSUER AND AFFILIATED PURCHASERS |
Neither we nor any “affiliated purchaser,” as defined in Rule 10b-18(a)(3) of the Exchange Act, purchased any of our equity securities during the period covered by this annual report.
| Item 16F. | CHANGE IN REGISTRANT’S CERTIFYING ACCOUNTANT |
The Act on External Audit of Stock Companies prohibits a publicly listed Korean company from being audited by an external auditor for a fiscal year immediately following a period of three consecutive fiscal years of providing such services to the company pursuant to a designation by the Securities and Futures Commission. Accordingly, as Samil PricewaterhouseCoopers, or PwC, has served as our principal accountant to audit our consolidated financial statements prepared in accordance with IFRS as issued by the IASB for the fiscal years ending December 31, 2020, 2021 and 2022, our Audit Committee, on November 15, 2022, appointed KPMG Samjong Accounting Corp. as our principal accountant to audit our consolidated financial statements prepared in accordance with IFRS as issued by the IASB for the fiscal years ending December 31, 2023, 2024 and 2025. KPMG’s appointment was effective as of December 29, 2022, and PwC’s dismissal was effective as of April 21, 2023 (the date of this annual report), the date of completion of its audit of our financial statements for the fiscal year ending December 31, 2022 and the issuance of its report thereon.
During the two years prior to December 31, 2022 and up until April 21, 2023, or the Pre-Engagement Period, (1) PwC has not issued any reports on our financial statements or on the effectiveness of internal control over financial reporting that contained an adverse opinion or a disclaimer of opinion, nor were the auditor’s reports of PwC qualified or modified as to uncertainty, audit scope, or accounting principles, (2) there has not been any disagreement over any matter of accounting principles or practices, financial statement disclosure, or auditing scope or procedures, which disagreements if not resolved to PwC’s satisfaction would have caused it to make reference to the subject matter of the disagreement in connection with its auditors’ reports, or any “reportable event” as described in Item 16F(a)(1)(v) of Form 20-F.
During the Pre-Engagement Period, neither we nor anyone on our behalf consulted KPMG regarding the application of IFRS as issued by the IASB to a specified transaction, either completed or proposed, or the type of audit opinion that might be rendered on our consolidated financial statements (and neither a written report nor oral advice was provided to us that KPMG concluded was an important factor considered by us in reaching a decision as to any accounting, auditing or financial reporting issue under IFRS as issued by the IASB), except that, in April 2022, we engaged KPMG to conduct an independent investigation into an embezzlement case by an
207
Table of Contents
employee of Woori Bank. During the Pre-Engagement Period, neither we nor anyone on our behalf consulted KPMG regarding any matter that was either the subject of a “disagreement” (as defined in Item 16F(a)(1)(iv) of Form 20-F and the related instructions to Item 16F) or a “reportable event” (as described in Item 16F(a)(1)(v) of Form 20-F).
We provided a copy of the disclosure in this Item 16F to PwC and requested that PwC furnish us with a letter addressed to the Commission stating whether it agrees with such disclosure, and if it does not agree, stating the respects in which it does not agree. A copy of PwC’s letter dated April 21, 2023 is filed as Exhibit 15.1 to this annual report on Form 20-F for the fiscal year ended December 31, 2022.
| Item 16G. | CORPORATE GOVERNANCE |
Differences in Corporate Governance Practices
Pursuant to the rules of the New York Stock Exchange applicable to foreign private issuers like us that are listed on the New York Stock Exchange, we are required to disclose significant differences between the New York Stock Exchange’s corporate governance standards and those that we follow under Korean law. The following is a summary of such significant differences.
| NYSE Corporate Governance Standards |
Woori Financial Group | |
| Director Independence | ||
| Listed companies must have a majority of independent directors. | The majority of our board of directors is independent (as defined in accordance with the New York Stock Exchange’s standards), as six of our eight directors are outside directors. | |
| Executive Session | ||
| Non-management directors must meet in regularly scheduled executive sessions without management. Independent directors should meet alone in an executive session at least once a year. | Our outside directors hold quarterly meetings, which coincide with the quarterly Audit Committee meetings, to discuss matters relating to management issues. The Audit Committee consists of four outside directors. | |
| Nomination/Corporate Governance Committee | ||
| A nomination/corporate governance committee of independent directors is required. The committee must have a charter that addresses the purpose, responsibilities (including development of corporate governance guidelines) and annual performance evaluation of the committee. | We have established a Committee for Recommending Executive Officer Candidates, which consists of six outside directors. | |
| Compensation Committee | ||
| A compensation committee of independent directors is required. The committee must have a charter that addresses the purpose, responsibilities and annual performance evaluation of the committee. The charter must be made available on the company’s website. In addition, in accordance with the SEC rules adopted pursuant to Section 952 of the Dodd-Frank Act, NYSE listing standards were amended to expand the factors relevant in determining whether a committee member has a relationship to the company that will materially affect that member’s duties to the compensation committee.
Additionally, the committee may obtain or retain the advice of a compensation adviser only after taking into consideration all factors relevant to determining that adviser’s independence from management. |
We have established a Compensation Committee consisting of four outside directors. | |
208
Table of Contents
| Audit Committee | ||
| Listed companies must have an audit committee that satisfies the independence and other requirements of Rule 10A-3 under the Exchange Act. All members must be independent. The committee must have a charter addressing the committee’s purpose, an annual performance evaluation of the committee, and the duties and responsibilities of the committee. The charter must be made available on the company’s website. | We have established an Audit Committee consisting of four outside directors, all of whom are independent. Accordingly, we are in compliance with Rule 10A-3 under the Exchange Act. | |
| Audit Committee Additional Requirements | ||
| Listed companies must have an audit committee that is composed of at least three directors. | Our Audit Committee has four members, as described above. | |
| Shareholder Approval of Equity Compensation Plan | ||
| Listed companies must allow its shareholders to exercise their voting rights with respect to any material revision to the company’s equity compensation plan. | We currently do not have an equity compensation plan. | |
| All material matters related to the granting of stock options are provided in our articles of incorporation, and any amendments to the articles of incorporation are subject to shareholders’ approval. | ||
| Corporate Governance Guidelines | ||
| Listed companies must adopt and disclose corporate governance guidelines. | We have adopted corporate governance standards, the Korean-language version of which is available on our website. | |
| Code of Business Conduct and Ethics | ||
| Listed companies must adopt and disclose a code of business conduct and ethics for directors, officers and employees, and promptly disclose any waivers of the code for directors or executive officers. | We have adopted a Code of Ethics and Business Conduct for Directors, Officers and Employees, the Korean-language version of which is available on our website. | |
| Item 16H. | MINE SAFETY DISCLOSURE |
Not Applicable
| Item 16I. | DISCLOSURE REGARDING FOREIGN JURISDICTIONS THAT PREVENT INSPECTIONS |
Not Applicable
| Item 17. | FINANCIAL STATEMENTS |
Not Applicable
| Item 18. | FINANCIAL STATEMENTS |
Reference is made to Item 19(a) for a list of all financial statements filed as part of this annual report.
209
Table of Contents
| Item 19. | EXHIBITS |
| (a) | List of financial statements: |
| Page | ||||
| Audited consolidated financial statements of Woori Financial Group Inc. and subsidiaries prepared in accordance with IFRS as issued by the IASB |
||||
| F-1 | ||||
| Consolidated Statements of Financial Position as of December 31, 2021 and 2022 |
F-4 | |||
| Consolidated Statements of Comprehensive Income for the Years Ended December 31, 2020, 2021 and 2022 |
F-5 | |||
| Consolidated Statements of Changes in Equity for the Years Ended December 31, 2020, 2021 and 2022 |
F-7 | |||
| Consolidated Statements of Cash Flows for the Years Ended December 31, 2020, 2021 and 2022 |
F-11 | |||
| F-14 | ||||
| (b) | Exhibits |
Pursuant to the rules and regulations of the U.S. Securities and Exchange Commission, we have filed certain agreements as exhibits to this Annual Report on Form 20-F. These agreements may contain representations and warranties made by the parties. These representations and warranties have been made solely for the benefit of the other party or parties to such agreements and (i) may be intended not as statements of fact, but rather as a way of allocating the risk to one of the parties to such agreements if those statements turn out to be inaccurate, (ii) may have been qualified by disclosures that were made to such other party or parties and that either have been reflected in the company’s filings or are not required to be disclosed in those filings, (iii) may apply materiality standards different from what may be viewed as material to investors and (iv) were made only as of the date of such agreements or such other date(s) as may be specified in such agreements and are subject to more recent developments. Accordingly, these representations and warranties may not describe our actual state of affairs at the date of this annual report.
210
Table of Contents
| Number |
Description | |
| 101.SCH | Inline XBRL Taxonomy Extension Schema Document | |
| 101.CAL | Inline XBRL Taxonomy Extension Calculation Linkbase Document | |
| 101.DEF | Inline XBRL Taxonomy Extension Definition Linkbase Document | |
| 101.LAB | Inline XBRL Taxonomy Extension Label Linkbase Document | |
| 101.PRE | Inline XBRL Taxonomy Extension Presentation Linkbase Document | |
| 104 | Cover Page Interactive Data File (Embedded within Inline XBRL Instance Document). | |
| * | Incorporated by reference to exhibit 2.1 to the Annual Report on Form 20-F (File No. 001-31811), filed on April 30, 2019. |
| ** | Incorporated by reference to exhibit (a)(1) to the Registration Statement on Form F-6 (File No. 333-229197), filed on January 11, 2019. |
| *** | See Item 10.B. Memorandum and Articles of Association. |
| **** | Incorporated by reference to exhibit 2.4 to the Annual Report on Form 20-F (File No. 001-31811), filed on April 29, 2020. |
| ***** | See Note 1 of the notes to the consolidated financial statements of the registrant included in this Annual Report. |
| ****** | Incorporated by reference to exhibit 11.1 to the Annual Report on Form 20-F (File No. 001-31811), filed on April 30, 2021. |
211
Table of Contents
SIGNATURES
The registrant hereby certifies that it meets all of the requirements for filing on Form 20-F and that it has duly caused and authorized the undersigned to sign this annual report on its behalf.
| Woori Financial Group Inc. (Registrant) |
| /s/ Jong-Yong Yim |
| (Signature) |
| Jong-Yong Yim |
| Chief Executive Officer |
| (Name/Title) |
Date: April 21, 2023
Table of Contents
Korean Won |
U.S. Dollars |
|||||||||||
December 31, 2021 |
December 31, 2022 |
December 31, 2022 |
||||||||||
(in millions) |
(in thousands) |
|||||||||||
ASSETS |
||||||||||||
Cash and cash equivalents (Note 2 and 6) |
||||||||||||
Financial assets at fair value through profit or loss (“FVTPL”) (Notes 4, 7, 11, 12, 18 and 26) |
||||||||||||
Financial assets at fair value through other comprehensive income (“FVTOCI”) (Notes 4, 8, 11, 12, and 18) |
||||||||||||
Securities at amortized cost (Notes 4, 9, 11, 12 and 18) |
||||||||||||
Loans and other financial assets at amortized cost (Notes 4, 10, 11, 12, 18 and 41) |
||||||||||||
Investments in joint ventures and associates (Note 13) |
||||||||||||
Investment properties (Notes 14 and 18) |
||||||||||||
Premises and equipment (Notes 15 and 18) |
||||||||||||
Intangible assets (Note 16) |
||||||||||||
Assets held for sale (Note 17) |
||||||||||||
Net defined benefit asset (Note 24) |
||||||||||||
Current tax assets (Note 38) |
||||||||||||
Deferred tax assets (Note 38) |
||||||||||||
Derivative assets (Designated for hedging) (Notes 4,11,12 and 26) |
||||||||||||
Other assets (Notes 19 and 41) |
||||||||||||
Total assets |
||||||||||||
LIABILITIES |
||||||||||||
Financial liabilities at fair value through profit or loss (“FVTPL”) (Notes 4, 11, 12, 20 and 26) |
||||||||||||
Deposits due to customers (Notes 4,11,21 and 41) |
||||||||||||
Borrowings (Notes 4, 6, 11, 12 and 22) |
||||||||||||
Debentures (Notes 4, 6, 11 and 22) |
||||||||||||
Provisions (Notes 23, 40 and 41) |
||||||||||||
Net defined benefit liability (Note 24) |
||||||||||||
Current tax liabilities (Note 38) |
||||||||||||
Deferred tax liabilities (Note 38) |
||||||||||||
Derivative liabilities (Designated for hedging) (Notes 4,11,12 and 26) |
||||||||||||
Other financial liabilities (Notes 4, 6, 11, 12, 25 and 41) |
||||||||||||
Other liabilities (Notes 6, 25 and 41) |
||||||||||||
Total liabilities |
||||||||||||
EQUITY |
||||||||||||
Owners’ equity (Note 28) |
||||||||||||
Capital stock |
||||||||||||
Hybrid securities |
||||||||||||
Capital surplus |
||||||||||||
Other equity |
( |
) | ( |
) | ( |
) | ||||||
Retained earnings |
||||||||||||
Non-controlling interests |
||||||||||||
Total equity |
||||||||||||
Total liabilities and equity |
||||||||||||
Korean Won |
U.S. Dollars |
|||||||||||||||
2020 |
2021 |
2022 |
2022 |
|||||||||||||
(in millions, except for per share data) |
(in thousands, except per share data) (Note 2) |
|||||||||||||||
| Interest income |
||||||||||||||||
| Financial assets at FVTPL |
||||||||||||||||
| Financial assets at FVTOCI |
||||||||||||||||
| Financial assets at amortized cost |
||||||||||||||||
| Interest expense |
( |
) | ( |
) | ( |
) | ( |
) | ||||||||
| |
|
|
|
|
|
|
|
|||||||||
| Net interest income |
||||||||||||||||
| Fees and commissions income |
||||||||||||||||
| Fees and commissions expense |
( |
) | ( |
) | ( |
) | ( |
) | ||||||||
| |
|
|
|
|
|
|
|
|||||||||
| Net fees and commissions income |
||||||||||||||||
| Dividend income (Notes 11, 32 and 41) |
||||||||||||||||
| Net gain on financial instruments at FVTPL (Notes 11, 33 and 41) |
||||||||||||||||
| Net gain on financial assets at FVTOCI (Notes 11 and 34) |
( |
) | ( |
) | ||||||||||||
| Net gain arising on financial assets at amortized cost (Note 11) |
||||||||||||||||
| Impairment losses due to credit loss (Notes 35 and 41) |
( |
) | ( |
) | ( |
) | ( |
) | ||||||||
| General and administrative expenses (Notes 36 and 41) |
( |
) | ( |
) | ( |
) | ( |
) | ||||||||
| Other net operating expense (Notes 11, 26, 36 and 41) |
( |
) | ( |
) | ( |
) | ( |
) | ||||||||
| |
|
|
|
|
|
|
|
|||||||||
| Operating income |
||||||||||||||||
| Share of gain of joint ventures and associates (Note 13) |
||||||||||||||||
| Other non-operating income (expenses) |
( |
) | ( |
) | ||||||||||||
| |
|
|
|
|
|
|
|
|||||||||
| Non-operating income (expense) |
( |
) |
||||||||||||||
| Net income before income tax expense |
||||||||||||||||
| Income tax expense (Note 38) |
( |
) | ( |
) | ( |
) | ( |
) | ||||||||
| Net income |
||||||||||||||||
| |
|
|
|
|
|
|
|
|||||||||
Korean Won |
U.S. Dollars |
|||||||||||||||
2020 |
2021 |
2022 |
2022 |
|||||||||||||
(in millions, except for per share data) |
(in thousands, except per share data) (Note 2) |
|||||||||||||||
| Net gain (loss) on valuation of equity securities at FVTOCI |
( |
) | ( |
) | ||||||||||||
| Changes in capital due to equity method |
( |
) | ( |
) | ( |
) | ( |
) | ||||||||
| Remeasurement gain (loss) related to defined benefit plan |
||||||||||||||||
| |
|
|
|
|
|
|
|
|||||||||
| Items that will not be reclassified to profit or loss |
||||||||||||||||
| Net gain (loss) on valuation of debt securities at FVTOCI |
( |
) | ( |
) | ( |
) | ||||||||||
| Changes in capital due to equity method |
( |
) | ||||||||||||||
| Net gain (loss) on foreign currency translation of foreign operations |
( |
) | ||||||||||||||
| Net gain(loss) on valuation of hedges of net investments in foreign operations |
— | — |
( |
) | ( |
) | ||||||||||
| Net gain (loss) on valuation of cash flow hedge |
( |
) | ( |
) | ||||||||||||
| |
|
|
|
|
|
|
|
|||||||||
| Items that may be reclassified to profit or loss |
( |
) |
( |
) |
( |
) | ||||||||||
| Other comprehensive income (loss), net of tax |
( |
) |
( |
) |
( |
) | ||||||||||
| Total comprehensive income |
||||||||||||||||
| |
|
|
|
|
|
|
|
|||||||||
| Net income attributable to: |
||||||||||||||||
| Net income attributable to owners |
|
|
||||||||||||||
| Net income attributable to non-controlling interests |
||||||||||||||||
| Total comprehensive income attributable to: |
||||||||||||||||
| Comprehensive income attributable to owners |
||||||||||||||||
| Comprehensive income attributable to non-controlling interests |
||||||||||||||||
| Earnings per share (Note 39) |
||||||||||||||||
| Basic and diluted earnings per share (Unit: In Korean Won and U.S. Dollar) |
||||||||||||||||
Capital Stock |
Hybrid securities |
Capital surplus |
Other equity |
Retained earnings |
Owners’ equity in total |
Non-controlling interests |
Total equity |
|||||||||||||||||||||||||
(Korean Won in millions) |
||||||||||||||||||||||||||||||||
| January 1, 2020 |
|
( |
) | |||||||||||||||||||||||||||||
| Total comprehensive income |
||||||||||||||||||||||||||||||||
| Net income |
||||||||||||||||||||||||||||||||
| Net gain (loss) on valuation of financial instruments at FVTOCI |
( |
) | ||||||||||||||||||||||||||||||
| Net gain (loss) due to disposal of equity securities at FVTOCI |
( |
) | ||||||||||||||||||||||||||||||
| Changes in capital due to equity method |
( |
) | ( |
) | ( |
) | ||||||||||||||||||||||||||
| Loss on foreign currency translation of foreign operations |
( |
) | ( |
) | ( |
) | ( |
) | ||||||||||||||||||||||||
| Gain on valuation of cash flow hedge |
||||||||||||||||||||||||||||||||
| Remeasurement gain related to defined benefit plan |
||||||||||||||||||||||||||||||||
| Transactions with owners and others |
||||||||||||||||||||||||||||||||
| Dividends to common stocks |
( |
) | ( |
) | ( |
) | ( |
) | ||||||||||||||||||||||||
| Issuance of hybrid securities |
||||||||||||||||||||||||||||||||
| Dividends to hybrid securities |
( |
) | ( |
) | ( |
) | ( |
) | ||||||||||||||||||||||||
| Redemption of hybrid securities |
( |
) | ( |
) | ( |
) | ( |
) | ||||||||||||||||||||||||
| Changes in subsidiaries’ capital |
( |
) | ( |
) | ( |
) | ||||||||||||||||||||||||||
| Changes in non-controlling interests related to business combination |
||||||||||||||||||||||||||||||||
| |
|
|
|
|
|
|
|
|
|
|
|
|
|
|
|
|||||||||||||||||
| December 31, 2020 |
( |
) | ||||||||||||||||||||||||||||||
| |
|
|
|
|
|
|
|
|
|
|
|
|
|
|
|
|||||||||||||||||
Capital Stock |
Hybrid securities |
Capital surplus |
Other equity |
Retained earnings |
Owners’ equity in total |
Non-controlling interests |
Total equity |
|||||||||||||||||||||||||
(Korean Won in millions) |
||||||||||||||||||||||||||||||||
| January 1, 2021 |
( |
) | ||||||||||||||||||||||||||||||
| Total comprehensive income |
||||||||||||||||||||||||||||||||
| Net income |
||||||||||||||||||||||||||||||||
| Net gain (loss) on valuation of financial instruments at FVTOCI |
( |
) | ( |
) | ( |
) | ||||||||||||||||||||||||||
| Net gain (loss) due to disposal of equity securities at FVTOCI |
( |
) | ||||||||||||||||||||||||||||||
| Changes in capital due to equity method |
|
( |
) | |||||||||||||||||||||||||||||
| Gain on foreign currency translation of foreign operations |
||||||||||||||||||||||||||||||||
| Gain on valuation of cash flow hedge |
||||||||||||||||||||||||||||||||
| Capital related to non-current assets held for sale |
( |
) | ||||||||||||||||||||||||||||||
| Remeasurement gain related to defined benefit plan |
( |
) | ||||||||||||||||||||||||||||||
| Transactions with owners and others |
||||||||||||||||||||||||||||||||
| Comprehensive stock exchange |
||||||||||||||||||||||||||||||||
| Dividends to common stocks |
( |
) | ( |
) | ( |
) | ( |
) | ||||||||||||||||||||||||
| Acquisition of treasury stocks |
( |
) | ( |
) | ( |
) | ||||||||||||||||||||||||||
| Issuance of hybrid securities |
||||||||||||||||||||||||||||||||
| Dividends to hybrid securities |
( |
) | ( |
) | ( |
) | ( |
) | ||||||||||||||||||||||||
| Redemption of hybrid securities |
( |
) | ( |
) | ( |
) | ( |
) | ||||||||||||||||||||||||
| Changes in subsidiaries’ capital |
( |
) | ( |
) | ( |
) | ||||||||||||||||||||||||||
| Others |
( |
) | ( |
) | ||||||||||||||||||||||||||||
| |
|
|
|
|
|
|
|
|
|
|
|
|
|
|
|
|||||||||||||||||
| December 31, 2021 |
( |
) | ||||||||||||||||||||||||||||||
| |
|
|
|
|
|
|
|
|
|
|
|
|
|
|
|
|||||||||||||||||
Capital Stock |
Hybrid securities |
Capital surplus |
Other equity |
Retained earnings |
Owners’ equity in total |
Non-controlling interests |
Total equity |
|||||||||||||||||||||||||
(Korean Won in millions) |
||||||||||||||||||||||||||||||||
| January 1, 2022 |
( |
) | ||||||||||||||||||||||||||||||
| Total comprehensive income |
||||||||||||||||||||||||||||||||
| Net income |
||||||||||||||||||||||||||||||||
| Net gain (loss) on valuation of financial instruments at FVTOCI |
( |
) | ( |
) | ( |
) | ( |
) | ||||||||||||||||||||||||
| Net gain (loss) due to disposal of equity securities at FVTOCI |
( |
) | ||||||||||||||||||||||||||||||
| Changes in capital due to equity method |
||||||||||||||||||||||||||||||||
| Gain(loss) on foreign currency translation of foreign operations |
( |
) | ||||||||||||||||||||||||||||||
| Loss on valuation of hedges of net investments in foreign operations |
( |
) | ( |
) | ( |
) | ||||||||||||||||||||||||||
| Loss on valuation of cash flow hedge |
( |
) | ( |
) | ( |
) | ||||||||||||||||||||||||||
| Capital related to non-current assets held for sale |
( |
) | ||||||||||||||||||||||||||||||
| Remeasurement gain related to defined benefit plan |
||||||||||||||||||||||||||||||||
| Transactions with owners and others |
||||||||||||||||||||||||||||||||
| Dividends to common stocks |
( |
) | ( |
) | ( |
) | ( |
) | ||||||||||||||||||||||||
| Issuance of hybrid securities |
||||||||||||||||||||||||||||||||
| Dividends to hybrid securities |
( |
) | ( |
) | ( |
) | ( |
) | ||||||||||||||||||||||||
| Redemption of hybrid securities |
( |
) | ( |
) | ( |
) | ( |
) | ||||||||||||||||||||||||
| Changes in subsidiaries’ capital |
( |
) | ||||||||||||||||||||||||||||||
| Changes in non-controlling interests related to business combinations |
||||||||||||||||||||||||||||||||
| |
|
|
|
|
|
|
|
|
|
|
|
|
|
|
|
|||||||||||||||||
| December 31, 2022 |
( |
) | ||||||||||||||||||||||||||||||
| |
|
|
|
|
|
|
|
|
|
|
|
|
|
|
|
|||||||||||||||||
Capital Stock |
Hybrid securities |
Capital surplus |
Other equity |
Retained earnings |
Owners’ equity in total |
Non-controlling interests |
Total equity |
|||||||||||||||||||||||||
(U.S dollars in thousands) (Note 2) |
||||||||||||||||||||||||||||||||
| January 1, 2022 |
( |
) | ||||||||||||||||||||||||||||||
| Total comprehensive income |
||||||||||||||||||||||||||||||||
| Net income |
||||||||||||||||||||||||||||||||
| Net gain (loss) on valuation of financial instruments at FVTOCI |
( |
) | ( |
) | ( |
) | ( |
) | ||||||||||||||||||||||||
| Net gain (loss) due to disposal of equity securities at FVTOCI |
( |
) | ||||||||||||||||||||||||||||||
| Changes in capital due to equity method |
||||||||||||||||||||||||||||||||
| Gain(loss) on foreign currency translation of foreign operations |
( |
) | ||||||||||||||||||||||||||||||
| Loss on valuation of hedges of net investments in foreign operations |
( |
) | ( |
) | ( |
) | ||||||||||||||||||||||||||
| Loss on valuation of cash flow hedge |
( |
) | ( |
) | ( |
) | ||||||||||||||||||||||||||
| Capital related to non-current assets held for sale |
( |
) | ||||||||||||||||||||||||||||||
| Remeasurement gain related to defined benefit plan |
||||||||||||||||||||||||||||||||
| Transactions with owners and others |
||||||||||||||||||||||||||||||||
| Dividends to common stocks |
( |
) | ( |
) | ( |
) | ( |
) | ||||||||||||||||||||||||
| Issuance of hybrid securities |
||||||||||||||||||||||||||||||||
| Dividends to hybrid securities |
( |
) | ( |
) | ( |
) | ( |
) | ||||||||||||||||||||||||
| Redemption of hybrid securities |
( |
) | ( |
) | ( |
) | ( |
) | ||||||||||||||||||||||||
| Changes in subsidiaries’ capital |
( |
) | ||||||||||||||||||||||||||||||
| Changes in non-controlling interests related to business combinations |
||||||||||||||||||||||||||||||||
| |
|
|
|
|
|
|
|
|
|
|
|
|
|
|
|
|||||||||||||||||
| December 31, 2022 |
( |
) | ||||||||||||||||||||||||||||||
| |
|
|
|
|
|
|
|
|
|
|
|
|
|
|
|
|||||||||||||||||
Korean Won |
U.S. Dollars |
|||||||||||||||
2020 |
2021 |
2022 |
2022 |
|||||||||||||
(in millions) |
(in thousands) (Note 2) |
|||||||||||||||
| Cash flows from operating activities: |
||||||||||||||||
| Net income |
|
|||||||||||||||
| Adjustments to net income: |
||||||||||||||||
| Income tax expense |
||||||||||||||||
| Interest income |
( |
) | ( |
) | ( |
) | ( |
) | ||||||||
| Interest expense |
||||||||||||||||
| Dividend income |
( |
) | ( |
) | ( |
) | ( |
) | ||||||||
| |
|
|
|
|
|
|
|
|||||||||
| ( |
) | ( |
) | ( |
) | ( |
) | |||||||||
| |
|
|
|
|
|
|
|
|||||||||
| Additions of expenses not involving cash outflows: | ||||||||||||||||
| Loss on financial instruments at FVTPL |
||||||||||||||||
| Loss on financial assets at FVTOCI |
||||||||||||||||
| Impairment loss due to credit loss |
||||||||||||||||
| Loss on other provisions |
||||||||||||||||
| Retirement benefit |
||||||||||||||||
| Depreciation and amortization |
||||||||||||||||
| Net loss on foreign currency translation |
||||||||||||||||
| Loss on derivatives (designated for hedge) |
||||||||||||||||
| Loss on fair value hedge |
||||||||||||||||
| Loss on valuation of investments in joint ventures and associates |
||||||||||||||||
| Loss on disposal of investments in joint ventures and associates |
||||||||||||||||
| Loss on disposal of premises and equipment, intangible assets and other assets |
||||||||||||||||
| Impairment loss on premises and equipment, intangible assets and other assets |
||||||||||||||||
| |
|
|
|
|
|
|
|
|||||||||
| |
|
|
|
|
|
|
|
|||||||||
| Deductions of income not involving cash inflows: |
||||||||||||||||
| Gain on financial assets at FVTOCI |
( |
) | ( |
) | ( |
) | ( |
) | ||||||||
| Gain on other provisions |
( |
) | ( |
) | ( |
) | ( |
) | ||||||||
| Net profit on foreign currency translation |
( |
) | ( |
) | ||||||||||||
| Gain on derivatives (designated for hedge) |
( |
) | ( |
) | ( |
) | ( |
) | ||||||||
| Gain on fair value hedge |
( |
) | ( |
) | ( |
) | ( |
) | ||||||||
| Gain on valuation of investments in joint ventures and associates |
( |
) | ( |
) | ( |
) | ( |
) | ||||||||
| Gain on disposal of investments in joint ventures and associates |
( |
) | ( |
) | ( |
) | ( |
) | ||||||||
| Gain on disposal of premises and equipment, intangible assets and other assets |
( |
) | ( |
) | ( |
) | ( |
) | ||||||||
| Reversal of impairment loss on premises and equipment, intangible assets and other assets |
( |
) | ( |
) | ( |
) | ( |
) | ||||||||
| Profit from bargain purchase |
( |
) | ||||||||||||||
| Other income |
( |
) | ( |
) | ( |
) | ( |
) | ||||||||
| |
|
|
|
|
|
|
|
|||||||||
| ( |
) | ( |
) | ( |
) | ( |
) | |||||||||
| |
|
|
|
|
|
|
|
|||||||||
Korean Won |
U.S. Dollars |
|||||||||||||||
2020 |
2021 |
2022 |
2022 |
|||||||||||||
(in millions) |
(in thousands) (Note 2) |
|||||||||||||||
| Changes in operating assets and liabilities: |
||||||||||||||||
| Financial instruments at FVTPL |
( |
) | ( |
) | ( |
) | ||||||||||
| Loans and other financial assets at amortized cost |
( |
) | ( |
) | ( |
) | ( |
) | ||||||||
| Other assets |
( |
) | ( |
) | ( |
) | ( |
) | ||||||||
| Deposits due to customers |
||||||||||||||||
| Provisions |
( |
) | ( |
) | ( |
) | ( |
) | ||||||||
| Net defined benefit liability |
( |
) | ( |
) | ( |
) | ( |
) | ||||||||
| Other financial liabilities |
( |
) | ( |
) | ( |
) | ||||||||||
| Other liabilities |
( |
) | ||||||||||||||
| |
|
|
|
|
|
|
|
|||||||||
| ( |
) | ( |
) | |||||||||||||
| |
|
|
|
|
|
|
|
|||||||||
| Cash received (paid) from operating activities: |
||||||||||||||||
| Interest income received |
||||||||||||||||
| Interest expense paid |
( |
) | ( |
) | ( |
) | ( |
) | ||||||||
| Dividends received |
||||||||||||||||
| Income tax paid |
( |
) | ( |
) | ( |
) | ( |
) | ||||||||
| |
|
|
|
|
|
|
|
|||||||||
| |
|
|
|
|
|
|
|
|||||||||
| Net cash inflow (outflow) from operating activities |
( |
) | ||||||||||||||
| |
|
|
|
|
|
|
|
|||||||||
| Cash flows from investing activities: |
||||||||||||||||
| Cash in-flows from investing activities: |
||||||||||||||||
| Disposal of financial instruments at FVTPL |
||||||||||||||||
| Disposal of financial assets at FVTOCI |
||||||||||||||||
| Redemption of securities at amortized cost |
||||||||||||||||
| Disposal of investments in joint ventures and associates |
||||||||||||||||
| Disposal of investment properties |
||||||||||||||||
| Disposal of premises and equipment |
||||||||||||||||
| Disposal of intangible assets |
||||||||||||||||
| Disposal of assets held for sale |
||||||||||||||||
| Net increase of other assets |
||||||||||||||||
| |
|
|
|
|
|
|
|
|||||||||
| |
|
|
|
|
|
|
|
|||||||||
| Cash out-flows from investing activities: |
||||||||||||||||
| Net cash out-flows of business combination |
( |
) | ||||||||||||||
| Net cash out-flows from obtaining control |
( |
) | ( |
) | ( |
) | ||||||||||
| Acquisition of financial instruments at FVTPL |
( |
) | ( |
) | ( |
) | ( |
) | ||||||||
| Acquisition of financial assets at FVTOCI |
( |
) | ( |
) | ( |
) | ( |
) | ||||||||
| Acquisition of securities at amortized cost |
( |
) | ( |
) | ( |
) | ( |
) | ||||||||
| Acquisition of investments in joint ventures and associates |
( |
) | ( |
) | ( |
) | ( |
) | ||||||||
| Acquisition of investment properties |
( |
) | ||||||||||||||
| Acquisition of premises and equipment |
( |
) | ( |
) | ( |
) | ( |
) | ||||||||
| Acquisition of intangible assets |
( |
) | ( |
) | ( |
) | ( |
) | ||||||||
| Changes in subsidiaries |
( |
) | ( |
) | ||||||||||||
| |
|
|
|
|
|
|
|
|||||||||
| ( |
) | ( |
) | ( |
) | ( |
) | |||||||||
| |
|
|
|
|
|
|
|
|||||||||
| Net cash outflow from investing activities |
( |
) | ( |
) | ( |
) | ( |
) | ||||||||
| |
|
|
|
|
|
|
|
|||||||||
Korean Won |
U.S. Dollars |
|||||||||||||||
2020 |
2021 |
2022 |
2022 |
|||||||||||||
(in millions) |
(in thousands) (Note 2) |
|||||||||||||||
| Cash flows from financing activities: |
||||||||||||||||
| Cash in-flows from financing activities: |
||||||||||||||||
| Net cash in-flows from hedging activities |
||||||||||||||||
| Net increase in borrowings |
||||||||||||||||
| Issuance of debentures |
||||||||||||||||
| Net increase of other liabilities |
||||||||||||||||
| Issuance of hybrid securities |
||||||||||||||||
| Paid-in capital increase on non-controlling interests |
||||||||||||||||
| Net increase in non-controlling equity liabilities |
||||||||||||||||
| |
|
|
|
|
|
|
|
|||||||||
| |
|
|
|
|
|
|
|
|||||||||
| Cash out-flows from financing activities: |
||||||||||||||||
| Net cash out-flows from hedging activities |
( |
) | ||||||||||||||
| Redemption of debentures |
( |
) | ( |
) | ( |
) | ( |
) | ||||||||
| Redemption of lease liabilities |
( |
) | ( |
) | ( |
) | ( |
) | ||||||||
| New stock issue cost |
( |
) | ||||||||||||||
| Acquisition of treasury stocks |
( |
) | ||||||||||||||
| Dividends paid |
( |
) | ( |
) | ( |
) | ( |
) | ||||||||
| Redemption of hybrid securities |
( |
) | ( |
) | ( |
) | ( |
) | ||||||||
| Dividends paid to hybrid securities |
( |
) | ( |
) | ( |
) | ( |
) | ||||||||
| Dividends paid to non-controlling interest |
( |
) | ( |
) | ( |
) | ( |
) | ||||||||
| Changes in non-controlling interests |
( |
) | ||||||||||||||
| |
|
|
|
|
|
|
|
|||||||||
| ( |
) | ( |
) | ( |
) | ( |
) | |||||||||
| |
|
|
|
|
|
|
|
|||||||||
| Net cash inflow from financing activities |
||||||||||||||||
| |
|
|
|
|
|
|
|
|||||||||
| Effects of exchange rate changes on cash and cash equivalents |
( |
) | ||||||||||||||
| Net increase (decrease) in cash and cash equivalents |
( |
) | ||||||||||||||
| Cash and cash equivalents, beginning of the period |
||||||||||||||||
| |
|
|
|
|
|
|
|
|||||||||
| Cash and cash equivalents, end of the period (Note 6) |
||||||||||||||||
| |
|
|
|
|
|
|
|
|||||||||
| (1) | Summary of the Parent company |
| Stock transfer company |
Total number of issued shares |
Exchange ratio per share |
Number of Parent company’s stocks |
|||||||||
| Woori Bank |
||||||||||||
| Woori FIS Co., Ltd. |
||||||||||||
| Woori Finance Research Institute Co., Ltd. |
||||||||||||
| Woori Credit Information Co., Ltd. |
||||||||||||
| Woori Fund Service Co., Ltd. |
||||||||||||
| Woori Private Equity Asset Management Co., Ltd. |
||||||||||||
(2) |
Details of the Parent company and subsidiaries (hereinafter ‘Group’) as of December 31, 2021 and 2022 are as follows: |
Percentage of ownership (%) |
Location |
Financial statements date of use |
||||||||||||||
| Subsidiaries |
Main business |
December 31, 2021 |
December 31, 2022 |
|||||||||||||
| Held by |
| |||||||||||||||
| |
|
| ||||||||||||||
| |
| |||||||||||||||
| |
| |||||||||||||||
| |
| |||||||||||||||
| |
| |||||||||||||||
| (*7) |
| |||||||||||||||
| |
| |||||||||||||||
| |
| |||||||||||||||
| |
| |||||||||||||||
| |
| |||||||||||||||
| |
| |||||||||||||||
| |
| |||||||||||||||
| |
| |||||||||||||||
| |
| |||||||||||||||
| Held by |
| |||||||||||||||
| (*1) |
| |||||||||||||||
| |
| |||||||||||||||
| |
| |||||||||||||||
| (*10) |
| |||||||||||||||
| (*1) |
| |||||||||||||||
| |
| |||||||||||||||
| |
| |||||||||||||||
| |
| |||||||||||||||
| |
| |||||||||||||||
| |
| |||||||||||||||
| (*9) |
| |||||||||||||||
| (*1) |
| |||||||||||||||
| (*2) |
|
|
|
| ||||||||||||
| (*2) |
| |||||||||||||||
| Ltd. (*2) |
| |||||||||||||||
| (*2)(*5) |
— | — | | |||||||||||||
| (*2) |
| |||||||||||||||
| (*2) |
| |||||||||||||||
| (*2) |
| |||||||||||||||
| (*2) |
| |||||||||||||||
| (*2) |
| |||||||||||||||
| (*2) |
| |||||||||||||||
| (*2) |
| |||||||||||||||
| (*2)(*5) |
— | — | | |||||||||||||
| ( *2)(*5) |
— | — | | |||||||||||||
| (*2) |
| |||||||||||||||
| (*2) |
| |||||||||||||||
| (*2) |
| |||||||||||||||
| (*2) |
| |||||||||||||||
| ( *2) |
| |||||||||||||||
Percentage of ownership (%) |
Location |
Financial statements date of use |
||||||||||||||
| Subsidiaries |
Main business |
December 31, 2021 |
December 31, 2022 |
|||||||||||||
| (*2) |
||||||||||||||||
| (*2) |
||||||||||||||||
| Woori-HJ 3rd Co., Ltd(*2)(*5) |
— | — | ||||||||||||||
| (*2)(*5) |
— | — | ||||||||||||||
| (*2) |
||||||||||||||||
| (*2) |
||||||||||||||||
| (*2)(*5) |
— | — | ||||||||||||||
| (*2)(*5) |
— | — | ||||||||||||||
| Woori-HC 1st Co., Ltd(*2)(*5) |
— | — | ||||||||||||||
| (*2)(*5) |
— | — | ||||||||||||||
| (*2) |
||||||||||||||||
| (*2) |
||||||||||||||||
| (*2) |
||||||||||||||||
| (*2) |
||||||||||||||||
| (*2) |
||||||||||||||||
| (*2) |
||||||||||||||||
| (*2) |
||||||||||||||||
| (*2) |
||||||||||||||||
| (*2) |
||||||||||||||||
| Woori-HWC 1st Co., Ltd(*2) |
||||||||||||||||
| (*2). |
||||||||||||||||
| (*2) |
||||||||||||||||
| (*2) |
||||||||||||||||
| (*2). |
||||||||||||||||
| (*2). |
||||||||||||||||
| (*2) |
||||||||||||||||
| (*2) |
||||||||||||||||
| (*2) |
||||||||||||||||
| (*2) |
||||||||||||||||
| (*2) |
||||||||||||||||
| (*2) |
||||||||||||||||
| (*2) |
||||||||||||||||
| (*2) |
||||||||||||||||
| (*2) |
||||||||||||||||
| (*2) |
||||||||||||||||
| (*2) |
||||||||||||||||
| (*2) |
||||||||||||||||
| (*2) |
||||||||||||||||
| (*2) |
||||||||||||||||
| (*2) |
— | |||||||||||||||
| (*2) |
— | |||||||||||||||
| (*2) |
— | |||||||||||||||
| (*2) |
— | |||||||||||||||
| (*2) |
— | |||||||||||||||
| (*2) |
— | |||||||||||||||
| (*3)(*5) |
— | — | ||||||||||||||
| (*3) |
||||||||||||||||
| (*3) |
||||||||||||||||
| No. 5-2 (*3) |
||||||||||||||||
| No. 209-1 (*3) |
||||||||||||||||
| No. 26-2 (*3) |
||||||||||||||||
| No.1-2 (*3) |
|
|||||||||||||||
| No. 316-1 (*3) |
||||||||||||||||
| (*3) |
||||||||||||||||
Percentage of ownership (%) |
Location |
Financial statements date of use |
||||||||||||||
| Subsidiaries |
Main business |
December 31, 2021 |
December 31, 2022 |
|||||||||||||
| (*3) |
||||||||||||||||
| (*3) |
||||||||||||||||
| (*3) |
||||||||||||||||
| (*3) |
||||||||||||||||
| (*3) |
— | |||||||||||||||
| (*4) |
||||||||||||||||
| (*4) |
||||||||||||||||
| Held by No. 5-2 |
|
|
|
|
|
|
|
|
|
|
|
|
|
|
|
|
| |
||||||||||||||||
| Held by |
|
|
|
|
|
|
|
|
|
|
|
|
|
|
|
|
| |
||||||||||||||||
| Held by |
||||||||||||||||
| |
||||||||||||||||
| |
— | |||||||||||||||
| 2018-1 Securitization Specialty Co., Ltd.(*2)(*5) |
— | — | ||||||||||||||
| 2019-1 Asset Securitization Specialty Co., Ltd.( *2) |
||||||||||||||||
| 2020-1 Asset Securitization Specialty Co., Ltd.(*2) |
||||||||||||||||
| 2021-1 Asset Securitization Specialty Co., Ltd.(*2) |
|
|||||||||||||||
| 2022-1 Asset Securitization Specialty Co., Ltd.( *2) |
— | |||||||||||||||
| 2022-2 Asset Securitization Specialty Co., Ltd.(*2) |
— | |||||||||||||||
| 2023-1 Asset Securitization Specialty Co., Ltd.(*2) |
— | |
||||||||||||||
| Held by |
||||||||||||||||
| (*2)(*5) |
— | — | ||||||||||||||
| (*2)(*5) |
— | — | ||||||||||||||
| |
— | |||||||||||||||
| Held by |
||||||||||||||||
| (*2)(*5) |
— | — | ||||||||||||||
| ( *2) |
||||||||||||||||
| (*2) |
||||||||||||||||
| (*2) |
||||||||||||||||
| (*2) |
||||||||||||||||
| (*2) |
||||||||||||||||
| (*2) |
||||||||||||||||
| (*2) |
||||||||||||||||
| (*2) |
||||||||||||||||
| (*2) |
||||||||||||||||
| (*2) |
||||||||||||||||
Percentage of ownership (%) |
Location |
Financial statements date of use |
||||||||||||||
| Subsidiaries |
Main business |
December 31, 2021 |
December 31, 2022 |
|||||||||||||
| (*2) |
||||||||||||||||
| (*2)(*5) |
— | |||||||||||||||
| st Co., Ltd.(*2)(*5) |
— | |||||||||||||||
| st Co., Ltd.(*2)(*5) |
— | |||||||||||||||
| Held by |
||||||||||||||||
| (*3) |
||||||||||||||||
| (*3)(*5) |
— | |||||||||||||||
| (*3)(*5) |
— | |||||||||||||||
| (*3) |
||||||||||||||||
| (*3) |
||||||||||||||||
| (*3) |
||||||||||||||||
| (*3) |
||||||||||||||||
| (*3)(*5) |
— | |||||||||||||||
| (*3)(*5) |
— | |||||||||||||||
| (*3)(*11) |
— | |||||||||||||||
| (*3) |
— | |||||||||||||||
| (*3)(*11) |
— | |||||||||||||||
| (*3) |
— | |
||||||||||||||
| (*3) |
— | |||||||||||||||
| (*3) |
— | |||||||||||||||
| Held by |
||||||||||||||||
| (*2) |
||||||||||||||||
| (*2) |
— | |||||||||||||||
| (*2) |
— | |||||||||||||||
| (*2) |
— | |||||||||||||||
| (*2) |
— | |||||||||||||||
| (*2) |
— | |
||||||||||||||
| Held by Private Equity Asset Management Co., Ltd. and Woori Investment Bank Co., Ltd.(*6) |
||||||||||||||||
| (*3) |
||||||||||||||||
| Held by |
||||||||||||||||
| (*3) |
||||||||||||||||
| (*3) |
— | |||||||||||||||
Percentage of ownership (%) |
Location |
Financial statements date of use |
||||||||||||||
| Subsidiaries |
Main business |
December 31, 2021 |
December 31, 2022 |
|||||||||||||
| Investment Bank Co., Ltd., Woori Savings Bank and Woori Private Equity Asset Management Co., Ltd. (*6) |
||||||||||||||||
| Investment Trust No.1 (*3) |
||||||||||||||||
| Investment Bank Co., Ltd. and Woori Private Equity Asset Management Co., Ltd. (*6) |
||||||||||||||||
| Investment Trust No.2 (*3) |
||||||||||||||||
| (*3) |
||||||||||||||||
| Investment Bank Co., Ltd. (*6) |
||||||||||||||||
| Trust No.1 (*3) |
||||||||||||||||
| Trust No.1 (*3) |
||||||||||||||||
| Trust No.2 (*3) |
— | |||||||||||||||
| Global Asset Management Co., Ltd (*6) |
||||||||||||||||
| (*3) |
— | |||||||||||||||
| (*6) |
||||||||||||||||
| Trust No. 1 (*3)(*5) |
— | — | ||||||||||||||
| Private Placement Investment Trust No.1 (*3) |
||||||||||||||||
| No. 1 (*3) |
||||||||||||||||
| Equity Investment Trust No. 1 (*3) |
||||||||||||||||
| (*3) |
||||||||||||||||
| Investment Trust No.1 (*3) |
||||||||||||||||
| (*6) |
||||||||||||||||
| Trust No.1 (*3) |
||||||||||||||||
| (*3) |
|
|||||||||||||||
| Mid-market Secondary General Type PrivateInvestment Trust No.1(EUR) (*3) |
||||||||||||||||
| Investment Trust No. 2 (*3) |
||||||||||||||||
| (*3) |
||||||||||||||||
| (*3) |
— | |||||||||||||||
| (*3) |
— | |||||||||||||||
Percentage of ownership (%) |
Location |
Financial statements date of use |
||||||||||||||
Subsidiaries |
Main business |
December 31, 2021 |
December 31, 2022 |
|||||||||||||
(*6) |
||||||||||||||||
(*3) |
— | |||||||||||||||
(*3) |
— | |||||||||||||||
(*3) |
— | |||||||||||||||
(*6) |
||||||||||||||||
No.1-1 (*3) |
||||||||||||||||
(*6) |
||||||||||||||||
1st (*3) |
— | |||||||||||||||
Investment Trust No.1-1 and Woori G Japan Investment Trust No. 1-2 (*6) |
||||||||||||||||
(*3) |
||||||||||||||||
(*6) |
||||||||||||||||
No.2-1 (*3) |
||||||||||||||||
No.2-1 (*6) |
||||||||||||||||
(*3) |
|
|||||||||||||||
(*3) |
(*8) |
|||||||||||||||
(*6) |
||||||||||||||||
(*3) |
— | |||||||||||||||
| — | ||||||||||||||||
(*6) |
||||||||||||||||
(*3) |
— | |||||||||||||||
| (*1) | Additional investment occurred made for year ended December 31, 2021. |
| (*2) | . , has rights to variable returns from its involvement with the investee, and 3) has the ability to use its power to affect its returns . |
| (*3) |
| (*4) |
| (*5) | the consolidation as of December 31, 2022. |
| (*6) | Determined that the Group controls the investees, considering the Group 1) has the power over the investee, 2) is exposed to or has rights to variable returns from its involvement with the investee, and 3) has the ability to use its power to affect its returns, by two or more subsidiaries’ investment or operation. |
| (*7) |
| (*8) | As the financial statements for the end of the reporting period were not available, the most recent financial statements available from the date of settlement were used. |
| (*9) | The Parent company’s subsidiary WB Finance Co., Ltd. has changed the name to WOORI BANK (CAMBODIA) PLC. |
| (*10) | The Russia—Ukraine conflict has been escalated in February 2022, Russia is imposed to the international sanctions. Due to the sanctions, the lack of liquidity in the Russian foreign exchange market as well as the significant decline in value of the Rubles and the decline in value of Russian companies’ securities are in progress. As a result, the Group may experience situations such as a decrease in value of financial assets or operating assets owned by the Group regarding the conflict, an increase in receivable payment terms, limitation to transfer funds, decrease in the profit. As of December 31, 2022, the Group expects such conflict and sanctions would have financial impacts on the business of AO Woori Bank, one of the subsidiaries, in the future. However, the Group cannot reasonably predict the financial impacts because it is very uncertain to estimate the impact on the Group’s financial position and business performance. |
| (*11) | , it is the percentage of the feeder fund’s ownership in the master fund. |
| (3) | The Group has not consolidated the following entities as of December 31, 2021 and 2022 despite having more than 50% ownership interest: |
As of December 31, 2021 |
||||||||||||
Subsidiaries |
Location |
Main Business |
Percentage of ownership (%) |
|||||||||
(*1) |
||||||||||||
(*1) |
||||||||||||
No. 163-2 (*2)(*4) |
||||||||||||
No. 148-1 (*1)(*4) |
||||||||||||
No. 148-2 ( *1)(*4) |
||||||||||||
(*1)(*4) |
||||||||||||
(*1)(*4) |
||||||||||||
(*1)(*4) |
||||||||||||
No. 7-2 (*1)(*4) |
||||||||||||
(*3)(*4) |
||||||||||||
No. 18-1 (*1)(*4) |
||||||||||||
1-W(EUR) (*2)(*4) |
||||||||||||
No. 1-4 (*2) |
||||||||||||
(*1) |
||||||||||||
(*1)(*4) |
||||||||||||
(*1)(*4) |
||||||||||||
(*1) |
||||||||||||
| (*1) |
| (*2) | The Group does not have power over the fund of funds because the Group cannot decide the relevant activities of the fund through the related contract. The Group does not have the power over the fund’s activities even though it holds more than 50% of ownership interest. |
| (*3) | The Group does not have power over the stock market stabilization fund as the fund’s relevant activities are determined by the management committee, over which the Group does not have substantial control. The Group does not have the power over the fund’s activities even though it holds more than 50% of ownership interest. |
| (*4) | In accordance with the amendment to the Capital Market Act, a specialized investment type private equity fund has been changed to a general private equity fund during the prior period. |
As of December 31, 2022 |
||||||||||||
| Subsidiaries |
Location |
Main Business |
Percentage of ownership (%) |
|||||||||
| (*1) |
||||||||||||
| (*1) |
||||||||||||
| No. 163-2 (*2) |
||||||||||||
| No. 148-1 (*1) |
||||||||||||
| No. 148-2 (*1) |
||||||||||||
| (*1) |
||||||||||||
| (*1) |
||||||||||||
| (*1) |
||||||||||||
| No. 7-2 (*1) |
||||||||||||
| (*3) |
||||||||||||
| No. 18-1 (*1) |
||||||||||||
| 1-W(EUR) (*2) |
||||||||||||
| 1-4 (*2) |
||||||||||||
| (*1) |
||||||||||||
| (*1) |
||||||||||||
| (*1) |
||||||||||||
| (*1) |
||||||||||||
| (*1) |
||||||||||||
| (*1) |
||||||||||||
| NH-Amundi WSCP VIII Private Fund 2(*1) |
||||||||||||
| (*2) |
||||||||||||
| (*1) |
||||||||||||
| (*2) |
||||||||||||
| (*1) | The Group does not have power over the discretionary fund because the fund manager has the sole authority to decide the relevant activities of the investee. The fund manager’s delegated power is exercised not only for the Group, but also for other investors as well. The Group does not have the power over the fund’s activities even though it holds more than 50% of ownership interest. |
| (*2) | The Group does not have power over the fund of funds because the Group cannot decide the relevant activities of the fund through the related contract. The Group does not have the power over the fund’s activities even though it holds more than 50% of ownership interest. |
| (*3) | The Group does not have power over the stock market stabilization fund as the fund’s relevant activities are determined by the management committee, over which the Group does not have substantial control. The Group does not have the power over the fund’s activities even though it holds more than 50% of ownership interest. |
| (4) | The summarized financial information of the major subsidiaries are as follows. The financial information of each subsidiary was prepared on the basis of consolidated financial statements. (Unit: Korean Won in millions): |
As of and for the year ended December 31, 2021 |
||||||||||||||||||||
| Subsidiaries |
Assets |
Liabilities |
Operating revenue |
Net income (loss) attributable to owners |
Comprehensive income (loss) attributable to owners |
|||||||||||||||
| Woori Bank |
||||||||||||||||||||
| Woori Card Co., Ltd. |
||||||||||||||||||||
| Woori Financial Capital Co., Ltd. |
||||||||||||||||||||
| Woori Investment Bank Co., Ltd. |
||||||||||||||||||||
| Woori Asset Trust Co., Ltd. |
||||||||||||||||||||
| Woori Asset Management Corp. |
||||||||||||||||||||
| Woori Savings Bank |
||||||||||||||||||||
| Woori Credit Information Co., Ltd. |
||||||||||||||||||||
| Woori Fund Service Co., Ltd. |
||||||||||||||||||||
| Woori Private Equity Asset Management Co., Ltd. |
||||||||||||||||||||
| Woori Global Asset Management Co., Ltd. |
( |
) | ( |
) | ||||||||||||||||
| Woori FIS Co., Ltd. |
||||||||||||||||||||
| Woori Finance Research Institute Co., Ltd. |
||||||||||||||||||||
As of and for the year ended December 31, 2022 |
||||||||||||||||||||
| Subsidiaries |
Assets |
Liabilities |
Operating revenue |
Net income (loss) attributable to owners |
Comprehensive income (loss) attributable to owners |
|||||||||||||||
| Woori Bank |
||||||||||||||||||||
| Woori Card Co., Ltd. |
||||||||||||||||||||
| Woori Financial Capital Co., Ltd. |
||||||||||||||||||||
| Woori Investment Bank Co., Ltd. |
||||||||||||||||||||
| Woori Asset Trust Co., Ltd. |
||||||||||||||||||||
| Woori Savings Bank |
||||||||||||||||||||
| Woori Asset Management Corp. |
||||||||||||||||||||
| Woori Financial F&I Co., Ltd. |
||||||||||||||||||||
| Woori Credit Information Co., Ltd. |
||||||||||||||||||||
| Woori Fund Service Co., Ltd. |
||||||||||||||||||||
| Woori Private Equity Asset Management Co., Ltd |
||||||||||||||||||||
| Woori Global Asset Management Co., Ltd. |
||||||||||||||||||||
| Woori FIS Co., Ltd. |
||||||||||||||||||||
| Woori Finance Research Institute Co., Ltd. |
||||||||||||||||||||
| (5) | The financial support that the Group provides to consolidated structured entities is as follows: |
| • | Structured entity for asset securitization |
| • | Structured entity for the investments in securities |
| • | Money trust under the Financial Investment Services and Capital Markets Act |
| (6) | The Group has entered into various agreements with structured entities such as asset securitization, structured finance, investment fund, and trust contract. The characteristics of interests and the nature of risks related to unconsolidated structured entities over which the Group does not have control in accordance with IFRS 10 are as follows: |
(unit : Korean Won in millions) |
||||||||||||||||
December 31, 2021 |
||||||||||||||||
Asset securitization |
Structured Finance |
Investment Fund |
Real-estate trust |
|||||||||||||
Total asset of the unconsolidated structured entities |
|
|||||||||||||||
Assets recognized in the consolidated financial statements related to the unconsolidated structured entities |
||||||||||||||||
Financial assets at FVTPL |
||||||||||||||||
Financial assets at FVTOCI |
||||||||||||||||
Financial assets at amortized cost |
||||||||||||||||
Investments in joint ventures and associates |
||||||||||||||||
Derivative assets |
||||||||||||||||
Liabilities recognized in the consolidated financial statements related to the unconsolidated structured entities |
||||||||||||||||
Derivative liabilities |
||||||||||||||||
Other liabilities (provisions) |
||||||||||||||||
The maximum exposure to risks |
||||||||||||||||
Investment assets |
||||||||||||||||
Credit offerings and others |
||||||||||||||||
Loss recognized on unconsolidated structured entities |
||||||||||||||||
(unit : Korean Won in millions) |
||||||||||||||||
December 31, 2022 |
||||||||||||||||
Asset securitization |
Structured Finance |
Investment Fund |
Real-estate trust |
|||||||||||||
Total asset of the unconsolidated structured entities |
||||||||||||||||
Assets recognized in the consolidated financial statements related to the unconsolidated structured entities |
||||||||||||||||
Financial assets at FVTPL |
||||||||||||||||
Financial assets at FVTOCI |
||||||||||||||||
Financial assets at amortized cost |
||||||||||||||||
Investments in joint ventures and associates |
||||||||||||||||
Derivative assets |
||||||||||||||||
Liabilities recognized in the consolidated financial statements related to the unconsolidated structured entities |
||||||||||||||||
Derivative liabilities |
||||||||||||||||
Other liabilities (provisions) |
||||||||||||||||
The maximum exposure to risks |
||||||||||||||||
Investment assets |
||||||||||||||||
Purchase commitment |
||||||||||||||||
Credit offerings and others |
||||||||||||||||
Loss recognized on unconsolidated structured entities |
||||||||||||||||
| (7) | As of December 31, 2021 and 2022, the share of non-controlling interests on the net income and equity of subsidiaries in which non-controlling interests are significant are as follows (Unit: Korean Won in millions): |
December 31, 2021 |
December 31, 2022 |
|||||||
Woori Bank (*) |
||||||||
Woori Investment Bank Co., Ltd. |
||||||||
Woori Asset Trust Co., Ltd. |
||||||||
Woori Asset Management Corp |
||||||||
PT Bank Woori Saudara Indonesia 1906 Tbk |
||||||||
Wealth Development Bank |
||||||||
PT Woori Finance Indonesia Tbk. |
||||||||
(*) |
Hybrid securities issued by Woori Bank |
For the years ended December 31 |
||||||||||||
2020 |
2021 |
2022 |
||||||||||
Woori Bank (*) |
||||||||||||
Woori Financial Capital Co., Ltd. |
||||||||||||
Woori Investment Bank Co., Ltd. |
||||||||||||
Woori Asset Trust Co., Ltd. |
||||||||||||
Woori Asset Management Corp |
||||||||||||
PT Bank Woori Saudara Indonesia 1906 Tbk |
||||||||||||
Wealth Development Bank |
||||||||||||
PT Woori Finance Indonesia Tbk. |
||||||||||||
(*) |
Distribution of the hybrid securities issued by Woori Bank |
For the years ended December 31 |
||||||||||||
2020 |
2021 |
2022 |
||||||||||
Woori Bank (*) |
||||||||||||
Woori Financial Capital Co., Ltd. |
||||||||||||
Woori Investment Bank Co., Ltd. |
||||||||||||
Woori Asset Trust Co., Ltd. |
||||||||||||
PT Bank Woori Saudara Indonesia 1906 Tbk |
||||||||||||
(*) |
Distribution of the hybrid securities issued by Woori Bank |
| ① | IAS 7 ‘ Statement of cash flow |
| a) | Impact on the statements of financial position |
December 31, 2022 |
December 31, 2021 |
January 1, 2021 |
||||||||||
Increase in cash and cash equivalents |
||||||||||||
Decrease in loans and other financial assets at amortized cost |
( |
) | ( |
) | ( |
) | ||||||
| b) | Impact on the statements of cash flow |
December 31, 2022 |
December 31, 2021 |
|||||||
| Increase in cash flows from operating activities |
||||||||
| Increase in exchange rate changes on cash and cash equivalents denominated in foreign currencies |
( |
) | ||||||
| Net increase in cash and cash equivalents |
||||||||
| Increase in cash and cash equivalents, the beginning of the year |
||||||||
| Increase in cash and cash equivalents, the end of the year |
||||||||
| ② | Amendments to IFRS 3 ‘ Business Combination’ |
| ③ | Amendments to IAS 37 ‘ Provisions, Contingent Liabilities and Contingent Assets’ |
| ④ | Amendments to IAS 16 ‘ Property, Plant and Equipment’ |
| ⑤ | Annual Improvements to IFRS 2018-2020 |
| • | IFRS 1 ‘ First time Adoption of Korean International Financial Reporting Standards’ |
| • | IFRS 9 ‘ Financial Instrument’s |
| • | IFRS 16 ‘Lease’ |
| • | IAS 41 ‘ Agriculture’ |
| ① | Amendments to IAS 1 ‘ Presentation of Financial Statements Non-current |
② |
Amendments to IAS 1 ‘ Presentation of Financial Statements |
| ③ | Amendments to IAS 1 ‘ Presentation of Financial Statements’— |
④ |
Amendments to IAS 8 ‘ Accounting Policies, Changes in Accounting Estimates and Errors |
| ⑤ | Amendments to IAS 12 ‘ Income Taxes |
| • | The relative size of the Group’s holding of voting rights and dispersion of holdings of the other vote holders; |
| • | Potential voting rights held by the Group, other vote holders or other parties; |
| • | Rights arising from other contractual arrangements; |
| • | Any additional facts and circumstances that indicate that the Group has, or does not have, the current ability to direct the relevant activities at the time that decisions need to be made, including voting patterns at previous shareholders’ meetings. |
| • | Deferred tax assets or liabilities and assets or liabilities related to employee benefit arrangements are recognized and measured in accordance with IAS 12 Income Taxes and IAS 19 Employee Benefits, respectively; |
| • | Liabilities or equity instruments related to share-based payment arrangements of the acquiree or share-based payment arrangements of the Group entered into to replace share-based payment arrangements of the acquiree are measured in accordance with IFRS 2 Share-based Payment at the acquisition date; and |
| • | Non-current assets (or disposal groups) that are classified as held for sale are measured in accordance with IFRS 5 Non-current Assets Held for Sale and Discontinued Operations |
| • | its assets, including its share of any assets held jointly; |
| • | its liabilities, including its share of any liabilities incurred jointly; |
| • | its revenue from the sale of its share of the output arising from the joint operation; |
| • | its share of the revenue from the sale of the output by the joint operation; |
| • | its expenses, including its share of any expenses incurred jointly. |
| ① | Fees and commission received for brokerage |
| ② | Fees and commission received related to credit |
| ③ | Fees and commission received for electronic finance |
| ④ | Fees and commission received on foreign exchange handling |
| ⑤ | Fees and commission received on foreign exchange |
| ⑥ | Fees and commission received for guarantee |
| ⑦ | Fees and commission received on credit card |
| ⑧ | Fees and commission received on securities business |
| ⑨ | Fees and commission from trust management |
| ⑩ | Fees and commission received on credit Information |
 |
Other fees |
| ① | Interest income |
| ② | Loan origination fees and costs |
| • | The accounting policies and purpose specified for the portfolio, the actual operation of such policies. This includes strategy of the management focusing on the receipt of contractual interest revenue, maintaining a certain level of interest income, matching the duration of financial assets and the duration of corresponding liabilities to obtain the asset, and outflow or realization of expected cash flows from disposal of assets |
| • | The way the performance of a financial asset held under the business model is evaluated, and the way such evaluation is being reported to the management |
| • | The risk affecting the performance of the business model (and financial assets held under the business model), and the way such risk is being managed |
| • | The compensation plan for the management (e.g. whether the management is being compensated based on the fair value of assets or based on contractual cash flows received) |
| • | Frequency, amount, timing and reason for sale of financial assets in the past and forecast of future sale activities. |
| • | Conditions that lead to modification of timing or amount of cash flows |
| • | Contractual terms that adjust contractual nominal interest, including floating rate features |
| • | Early payment features and maturity extension features |
| • | Contractual terms that limit the Group’s claim on cash flows arising from certain assets |
| ① | Financial assets at FVTPL |
| ② | Financial assets at FVTOCI |
| ③ | Financial assets at amortized cost |
| a) | Financial assets at FVTPL and Financial assets at FVTOCI |
| b) | Derivatives |
| c) | Adjustment of valuation amount |
| • | Financial assets at amortized cost |
| • | Debt instruments measured at FVTOCI |
| • | Contract assets as defined by IFRS 15 |
| • | General approach: Financial assets that does not belong to below two models and unused loan commitments |
| • | Simplified approach: When financial assets are either trade receivables, contract assets or lease receivables |
| • | Credit impairment model: Purchased or originated credit-impaired financial assets |
| Useful life | ||
| Buildings used for business purpose |
||
| Structures in leased office |
||
| Properties for business purpose |
| Useful life | ||
| Industrial property rights |
| |
| Development costs |
||
| Software and others |
| • | Fixed payments (including in-substance fixed payments) |
| • | Variable lease payments that depend on an index (or a rate), initially measured using the index or a rate as at the commencement date |
| • | Amounts expected to be payable by the lessee under residual value guarantees |
| • | The exercise price of a purchase option if the lessee is reasonably certain to exercise that option, lease payments of the extended period if the lessee is reasonably certain to exercise extension option, and payments of penalties for terminating the lease, if the lease term reflects the lessee exercising an option to terminate the lease |
| • | When there is an economic relationship between the hedged items and hedging instruments |
| • | When the effect of credit risk is not stronger than the change in value due to the economic relationship between the hedged items and hedging instruments |
| • | When the hedge ratio of hedging relationship is equal to the proportion of the number of items that the Group actually hedges and the number of hedging instruments that the Group actually uses to hedge the number of hedged items |
| • | Loss allowance in accordance with IFRS 9 |
| • | Initial carrying amount less accumulated profit measured in accordance with IFRS 15 |
December 31, 2021 |
December 31, 2022 |
|||||||||
| Total loans (loan receivables, payment guarantees) that are subject to loan deferment and interest deferment |
Corporate | |||||||||
| Retail | ||||||||||
| Total | ||||||||||
| Total loans changed its stage from 12-month to lifetime (Stage 2) expected credit losses |
Corporate | |||||||||
| Retail | ||||||||||
| Total | ||||||||||
| The expected credit loss allowances that are additionally recognized |
Corporate | |||||||||
| Retail | ||||||||||
| Total | ||||||||||
December 31, 2021 |
December 31, 2022 |
|||||||
| Corporate |
||||||||
| Retail |
||||||||
| Total |
|
|
||||||
| Classification |
Stage 1 |
Stage 2 |
Stage 3 | |||
| Definition |
No significant increase in credit risk after initial recognition(*) |
Significant increase in credit risk after initial recognition |
Credit-impaired | |||
| Loss allowance |
12-month expected credit losses: |
Lifetime expected credit losses: | ||||
Expected credit losses that result from those default events on the financial instrument that are possible within 12 months after the reporting date |
Expected credit losses that result from all possible default events over the life of the financial instrument | |||||
(*) |
If the financial instrument has low credit risk at the end of the reporting period, the Group may assume that the credit risk has not increased significantly since initial recognition. |
| Corporate Exposures |
Retail Exposures | |
Asset quality level ‘Precautionary’ or lower |
Asset quality level ‘Precautionary’ or lower | |
More than 30 days past due |
More than 30 days past due | |
‘Warning’ level in early warning system |
Significant decrease in credit rating(*) | |
Debtor experiencing financial difficulties (Capital impairment, Adverse opinion or Disclaimer of opinion by external auditors) |
Deferment of repayment of principal and interest | |
Significant decrease in credit rating (*) |
Deferment of interest | |
Deferment of repayment of principal and interest |
||
Deferment of interest |
(*) |
The Group has applied the below indicators of significant decrease in credit rating since initial recognition as follows, and the estimation method is regularly being monitored. |
| Credit rating |
Significant increased indicator of the credit rating | |||
| Corporate | AAA ~ A+ | More than or equal to 4 steps | ||
A- ~ BBB |
More than or equal to 3 steps | |||
BBB- ~ BB+ |
More than or equal to 2 steps | |||
| BB ~ BB- | More than or equal to 1 step | |||
| Retail | 1 ~ 3 | More than or equal to 3 steps | ||
| 4 ~ 5 | More than or equal to 2 steps | |||
| 6 ~ 10 | More than or equal to 1 step |
| • | When principal and interest of loan is overdue for 90 days or longer due to significant deterioration in credit |
| • | For loans overdue for less than 90 days, when it is determined that not even a portion of the loan will be recovered unless claim actions such as disposal of collaterals are taken |
| • | When other objective indicators of impairment have been noted for the financial asset. |
| • | Development of estimation models through regression analysis of corporate retail/year-by-year |
| • | Calculation of estimated default rate incorporating future economic forecasts by applying estimated macroeconomic indicators provided by verified institutions such as Bank of Korea and National Assembly Budget Office to the estimation model developed |
| • | Forecast of macroeconomic variables |
Basic Scenario |
Upside Scenario |
Downside Scenario |
||||||||||
| Probability weight |
||||||||||||
Basic Scenario |
Upside Scenario |
Downside Scenario |
||||||||||
| GDP growth rate |
|
|||||||||||
| Personal consumption expenditures price index rate |
||||||||||||
| Consumer price index change rate |
||||||||||||
December 31, 2021 |
||||||||
| Corporate |
GDP growth rate | Increase by 1% point | ( |
) | ||||
| Decrease by 1% point | ||||||||
Personal consumption expenditures price index rate |
Increase by 1% point | ( |
) | |||||
| Decrease by 1% point | ||||||||
| Retail |
GDP growth rate | Increase by 1% point | ( |
) | ||||
| Decrease by 1% point | ||||||||
| Consumer price index change rate | Increase by 1% point | ( |
) | |||||
| Decrease by 1% point | ||||||||
December 31, 2022 |
||||||||
| Corporate |
Personal consumption expenditures price index rate |
Increase by 1% point | ( |
) | ||||
| Decrease by 1% point | ||||||||
| Retail |
Consumer price index change rate | Increase by 1% point | ( |
) | ||||
| Decrease by 1% point | ||||||||
(*) |
The sensitivity of the effect of the GDP growth rate on banks’ ECLs is not significant. |
| • | The increase rate between the measured default rate and the predicted default rate is used as a future economic forecast adjustment coefficient and reflected to the applicable estimate for the current year. |
December 31, 2021 |
December 31, 2022 |
|||||||||
| Loans and other financial assets at amortized cost (*1) |
Korean treasury and government agencies | |||||||||
| Banks | ||||||||||
| Corporates | ||||||||||
| Consumers | ||||||||||
| |
|
|
|
|||||||
| Sub-total |
||||||||||
| |
|
|
|
|||||||
| Financial assets at FVTPL (*2) |
Deposits | |||||||||
| Debt securities | ||||||||||
| Loans | ||||||||||
| Derivative assets | ||||||||||
| Others | ||||||||||
| |
|
|
|
|||||||
| Sub-total |
||||||||||
| |
|
|
|
|||||||
| Financial assets at FVTOCI |
Debt securities | |||||||||
| Securities at amortized cost |
Debt securities | |||||||||
| Derivative assets |
Derivative assets (Designated for hedging) | |||||||||
| Off-balance accounts |
Payment guarantees (*3) |
|||||||||
| Loan commitments | ||||||||||
| |
|
|
|
|||||||
| Sub-total |
||||||||||
| |
|
|
|
|||||||
| Total |
||||||||||
| |
|
|
|
|||||||
(*1) |
Cash and cash equivalents are not included. |
| (*2) | Puttable financial instruments are not included. |
| (*3) | As of December 31, 2021 and 2022, the financial guarantee amount of W on and W on are included, respectively. |
December 31, 2021 |
||||||||||||||||||||||||||||
Korea |
China |
USA |
UK |
Japan |
Others (*) |
Total |
||||||||||||||||||||||
| Loans and other financial assets at amortized cost |
||||||||||||||||||||||||||||
| Securities at amortized cost |
||||||||||||||||||||||||||||
| Financial assets at FVTPL |
||||||||||||||||||||||||||||
| Financial assets at FVTOCI |
||||||||||||||||||||||||||||
| Derivative assets (Designated for hedging) |
||||||||||||||||||||||||||||
| Off-balance accounts |
||||||||||||||||||||||||||||
| |
|
|
|
|
|
|
|
|
|
|
|
|
|
|||||||||||||||
| Total |
|
|||||||||||||||||||||||||||
| |
|
|
|
|
|
|
|
|
|
|
|
|
|
|||||||||||||||
(*) |
Others consist of financial assets in Indonesia, Hong Kong, Germany, Australia, and other countries. |
December 31, 2022 |
||||||||||||||||||||||||||||
Korea |
China |
USA |
UK |
Japan |
Others (*) |
Total |
||||||||||||||||||||||
| Loans and other financial assets at amortized cost |
||||||||||||||||||||||||||||
| Securities at amortized cost |
||||||||||||||||||||||||||||
| Financial assets at FVTPL |
||||||||||||||||||||||||||||
| Financial assets at FVTOCI |
||||||||||||||||||||||||||||
| Derivative assets (Designated for hedging) |
||||||||||||||||||||||||||||
| Off-balance accounts |
||||||||||||||||||||||||||||
| |
|
|
|
|
|
|
|
|
|
|
|
|
|
|||||||||||||||
| Total |
||||||||||||||||||||||||||||
| |
|
|
|
|
|
|
|
|
|
|
|
|
|
|||||||||||||||
(*) |
Others consist of financial assets in Indonesia, Hong Kong, Germany, Australia, and other countries. |
December 31, 2021 |
||||||||||||||||||||||||||||
Service |
Manufacturing |
Finance and insurance |
Construction |
Individuals |
Others |
Total |
||||||||||||||||||||||
| Loans and other financial assets at amortized cost |
||||||||||||||||||||||||||||
| Securities at amortized cost |
||||||||||||||||||||||||||||
| Financial assets at FVTPL |
||||||||||||||||||||||||||||
| Financial assets at FVTOCI |
||||||||||||||||||||||||||||
| Derivative assets (Designated for hedging) |
||||||||||||||||||||||||||||
| Off-balance accounts |
||||||||||||||||||||||||||||
| |
|
|
|
|
|
|
|
|
|
|
|
|
|
|||||||||||||||
| Total |
||||||||||||||||||||||||||||
| |
|
|
|
|
|
|
|
|
|
|
|
|
|
|||||||||||||||
December 31, 2022 |
||||||||||||||||||||||||||||
Service |
Manufacturing |
Finance and insurance |
Construction |
Individuals |
Others |
Total |
||||||||||||||||||||||
| Loans and other financial assets at amortized cost |
||||||||||||||||||||||||||||
| Securities at amortized cost |
||||||||||||||||||||||||||||
| Financial assets at FVTPL |
||||||||||||||||||||||||||||
| Financial assets at FVTOCI |
||||||||||||||||||||||||||||
| Derivative assets (Designated for hedging) |
||||||||||||||||||||||||||||
| Off-balance accounts |
||||||||||||||||||||||||||||
| |
|
|
|
|
|
|
|
|
|
|
|
|
|
|||||||||||||||
| Total |
||||||||||||||||||||||||||||
| |
|
|
|
|
|
|
|
|
|
|
|
|
|
|||||||||||||||
December 31, 2021 |
||||||||||||||||
Loans and other financial assets at amortized cost |
Financial assets at FVTPL |
Financial assets at FVTOCI |
||||||||||||||
| Service business |
Distribution business |
General retail business |
||||||||||||||
General wholesale business |
||||||||||||||||
| Sub-total |
||||||||||||||||
Accommodation business |
||||||||||||||||
Travel business |
||||||||||||||||
Art/sports, leisure service |
||||||||||||||||
Food business |
||||||||||||||||
Transportation business |
||||||||||||||||
Others |
||||||||||||||||
| Sub-total |
||||||||||||||||
| Manufacturing |
Textile |
|||||||||||||||
Metal |
||||||||||||||||
Non-metal |
||||||||||||||||
Chemical |
||||||||||||||||
Electronics |
||||||||||||||||
Others |
||||||||||||||||
| Sub-total |
||||||||||||||||
| |
|
|
|
|
|
|||||||||||
| Total |
||||||||||||||||
| |
|
|
|
|
|
|||||||||||
December 31, 2021 |
||||||||||||
Off-balance accounts |
Total |
|||||||||||
| Service business |
Distribution business |
General retail business |
||||||||||
General wholesale business |
||||||||||||
| Sub-total |
||||||||||||
Accommodation business |
||||||||||||
Travel business |
||||||||||||
Art/sports, leisure service |
||||||||||||
Food business |
||||||||||||
Transportation business |
||||||||||||
Others |
||||||||||||
| Sub-total |
||||||||||||
| Manufacturing |
Textile |
|||||||||||
Metal |
||||||||||||
Non-metal |
||||||||||||
Chemical |
||||||||||||
Electronics |
||||||||||||
Others |
||||||||||||
| Sub-total |
||||||||||||
| |
|
|
|
|||||||||
| Total |
||||||||||||
| |
|
|
|
|||||||||
December 31, 2022 |
||||||||||||||||
Loans and other financial assets at amortized cost |
Financial assets at FVTPL |
Financial assets at FVTOCI |
||||||||||||||
| Service business |
Distribution business |
General retail business |
||||||||||||||
| General wholesale business |
||||||||||||||||
| Sub-total |
||||||||||||||||
Accommodation business |
||||||||||||||||
Travel business |
||||||||||||||||
Art/sports, leisure service |
||||||||||||||||
Food business |
||||||||||||||||
Transportation business |
||||||||||||||||
Education Business |
||||||||||||||||
Others |
||||||||||||||||
| |
|
Sub-total |
| |||||||||||||
| Manufacturing |
Textile |
|||||||||||||||
Metal |
||||||||||||||||
Non-metal |
||||||||||||||||
Chemical |
||||||||||||||||
Electronics |
||||||||||||||||
Others |
||||||||||||||||
| Sub-total |
||||||||||||||||
| |
|
|
|
|
|
|||||||||||
| Total |
|
|||||||||||||||
| |
|
|
|
|
|
|||||||||||
December 31, 2022 |
||||||||||||
Off-balance accounts |
Total |
|||||||||||
| Service business |
Distribution business |
General retail business |
||||||||||
| General wholesale business |
||||||||||||
| Sub-total |
||||||||||||
Accommodation business |
||||||||||||
Travel business |
||||||||||||
Art/sports, leisure service |
||||||||||||
Food business |
||||||||||||
Transportation business |
||||||||||||
Education Business |
||||||||||||
Others |
||||||||||||
| |
Sub-total |
|||||||||||
| Manufacturing |
Textile |
|||||||||||
Metal |
||||||||||||
Non-metal |
||||||||||||
Chemical |
||||||||||||
Electronics |
||||||||||||
Others |
||||||||||||
| Sub-total |
||||||||||||
| |
|
|
|
|||||||||
| Total |
|
|||||||||||
| |
|
|
|
|||||||||
December 31, 2021 |
||||||||||||||||||||
Loans and other financial assets at amortized cost |
Financial assets at FVTPL |
Financial assets at FVTOCI |
Off-balance accounts |
Total |
||||||||||||||||
| Accommodation business |
||||||||||||||||||||
| Travel business |
||||||||||||||||||||
| Aviation |
||||||||||||||||||||
| Cosmetics industry |
||||||||||||||||||||
| Distribution business |
||||||||||||||||||||
| Food industry |
||||||||||||||||||||
| Art/sports, leisure service |
||||||||||||||||||||
| |
|
|
|
|
|
|
|
|
|
|||||||||||
| Total |
||||||||||||||||||||
| |
|
|
|
|
|
|
|
|
|
|||||||||||
December 31, 2022 |
||||||||||||||||||||
Loans and other financial assets at amortized cost |
Financial assets at FVTPL |
Financial assets at FVTOCI |
Off-balance accounts |
Total |
||||||||||||||||
| Accommodation business |
||||||||||||||||||||
| Travel business |
||||||||||||||||||||
| Aviation |
||||||||||||||||||||
| Cosmetics industry |
||||||||||||||||||||
| Distribution business |
||||||||||||||||||||
| Food industry |
||||||||||||||||||||
| Art/sports, leisure service |
||||||||||||||||||||
| |
|
|
|
|
|
|
|
|
|
|||||||||||
| Total |
||||||||||||||||||||
| |
|
|
|
|
|
|
|
|
|
|||||||||||
December 31, 2021 |
||||||||||||||||
Loans and other financial assets at amortized cost |
Financial assets at FVTPL |
Financial assets at FVTOCI |
||||||||||||||
| Service business |
Distribution business | General retail business | — | — | ||||||||||||
| General wholesale business | — | — | ||||||||||||||
| Sub-total |
— | — | ||||||||||||||
| Accommodation business | — | — | ||||||||||||||
| Travel business | — | — | ||||||||||||||
| Art/sports, leisure service | — | — | ||||||||||||||
| Food business | — | — | ||||||||||||||
| Transportation business | — | — | ||||||||||||||
| Education business | — | — | ||||||||||||||
| Others | — | — | ||||||||||||||
| Sub-total |
— | — | ||||||||||||||
| Manufacturing |
Textile | — | — | |||||||||||||
| Metal | — | — | ||||||||||||||
Non-metal |
— | — | ||||||||||||||
| Chemical | — | — | ||||||||||||||
| Transportation | — | — | ||||||||||||||
| Electronics | — | — | ||||||||||||||
| Cosmetics | — | — | ||||||||||||||
| Others | — | — | ||||||||||||||
| Sub-total |
— | — | ||||||||||||||
| Total COVID-19 vulnerable business |
— | — | ||||||||||||||
| Other business |
Others | — | ||||||||||||||
| |
|
|
|
|
|
|||||||||||
| Total |
— | |||||||||||||||
| |
|
|
|
|
|
|||||||||||
December 31, 2021 |
||||||||||||
Off-balance accounts |
Total |
|||||||||||
| Service business |
Distribution business | General retail business | ||||||||||
| General wholesale business | ||||||||||||
| Sub-total |
||||||||||||
| Accommodation business | ||||||||||||
| Travel business | ||||||||||||
| Art/sports, leisure service | ||||||||||||
| Food business | ||||||||||||
| Transportation business | ||||||||||||
| Education business | ||||||||||||
| Others | ||||||||||||
| Sub-total |
||||||||||||
| Manufacturing |
Textile | |||||||||||
| Metal | ||||||||||||
Non-metal |
||||||||||||
| Chemical | ||||||||||||
| Transportation | ||||||||||||
| Electronics | ||||||||||||
| Cosmetics | ||||||||||||
| Others | ||||||||||||
| Sub-total |
||||||||||||
| Total COVID-19 vulnerable business |
||||||||||||
| Other business |
Others | |||||||||||
| |
|
|
|
|||||||||
| Total |
||||||||||||
| |
|
|
|
|||||||||
December 31, 2022 |
||||||||||||||||
Loans and other financial assets at amortized cost |
Financial assets at FVTPL |
Financial assets at FVTOCI |
||||||||||||||
| Service business |
Distribution business | General retail business | ||||||||||||||
| General wholesale business | ||||||||||||||||
| Sub-total |
||||||||||||||||
| Accommodation business | ||||||||||||||||
| Travel business | ||||||||||||||||
| Art/sports, leisure service | ||||||||||||||||
| Food business | ||||||||||||||||
| Transportation business | ||||||||||||||||
| Education business | ||||||||||||||||
| Others | ||||||||||||||||
| Sub-total |
||||||||||||||||
| Manufacturing |
Textile | |||||||||||||||
| Metal | ||||||||||||||||
Non-metal |
||||||||||||||||
| Chemical | ||||||||||||||||
| Transportation | ||||||||||||||||
| Electronics | ||||||||||||||||
| Cosmetics | ||||||||||||||||
| Others | ||||||||||||||||
| Sub-total |
||||||||||||||||
| Total COVID-19 vulnerable business |
||||||||||||||||
| Other business |
Others | |||||||||||||||
| |
|
|
|
|
|
|||||||||||
| Total |
||||||||||||||||
| |
|
|
|
|
|
|||||||||||
December 31, 2022 |
||||||||||||
Off-balance accounts |
Total |
|||||||||||
| Service business |
Distribution business | General retail business | ||||||||||
| General wholesale business | ||||||||||||
| Sub-total |
||||||||||||
| Accommodation business | ||||||||||||
| Travel business | ||||||||||||
| Art/sports, leisure service | ||||||||||||
| Food business | ||||||||||||
| Transportation business | ||||||||||||
| Education business | ||||||||||||
| Others | ||||||||||||
| Sub-total |
||||||||||||
| Manufacturing |
Textile | |||||||||||
| Metal | ||||||||||||
Non-metal |
||||||||||||
| Chemical | ||||||||||||
| Transportation | ||||||||||||
| Electronics | ||||||||||||
| Cosmetics | ||||||||||||
| Others | ||||||||||||
| Sub-total |
||||||||||||
| Total COVID-19 vulnerable business |
||||||||||||
| Other business |
Others | |||||||||||
| |
|
|
|
|||||||||
| Total |
||||||||||||
| |
|
|
|
|||||||||
December 31, 2021 |
||||||||||||||||||||
Loans and other financial assets at amortized cost |
Financial assets at FVTPL |
Financial assets at FVTOCI |
Off-balance accounts |
Total |
||||||||||||||||
| Accommodation business |
|
|||||||||||||||||||
| Distribution business |
||||||||||||||||||||
| Art/sports, leisure service |
||||||||||||||||||||
| Total |
||||||||||||||||||||
December 31, 2022 |
||||||||||||||||||||
Loans and other financial assets at amortized cost |
Financial assets at FVTPL |
Financial assets at FVTOCI |
Off-balance accounts |
Total |
||||||||||||||||
| Accommodation business |
||||||||||||||||||||
| Distribution business |
||||||||||||||||||||
| Art/sports, leisure service |
||||||||||||||||||||
| Total |
|
|||||||||||||||||||
December 31, 2021 |
||||||||||||||||||||||||||||||||
Stage 1 |
Stage 2 |
Stage 3 |
Total |
Loss allowance |
Total, net |
|||||||||||||||||||||||||||
Above appropriate credit rating (*1) |
Less than a limited credit rating (*2) |
Above appropriate credit rating (*1) |
Less than a limited credit rating (*2) |
|||||||||||||||||||||||||||||
| Loans and other financial assets at amortized cost |
( |
) | ||||||||||||||||||||||||||||||
| Korean treasury and government agencies |
( |
) | ||||||||||||||||||||||||||||||
| Banks |
( |
) | ||||||||||||||||||||||||||||||
| Corporates |
( |
) | ||||||||||||||||||||||||||||||
| General business |
( |
) | ||||||||||||||||||||||||||||||
| Small- and medium-sized enterprise |
( |
) | ||||||||||||||||||||||||||||||
| Project financing and others |
( |
) | ||||||||||||||||||||||||||||||
| Consumers |
( |
) | ||||||||||||||||||||||||||||||
| Securities at amortized cost |
( |
) | ||||||||||||||||||||||||||||||
| Financial assets at FVTOCI (*3) |
( |
) | ||||||||||||||||||||||||||||||
| |
|
|
|
|
|
|
|
|
|
|
|
|
|
|
|
|||||||||||||||||
| Total |
( |
) | ||||||||||||||||||||||||||||||
| |
|
|
|
|
|
|
|
|
|
|
|
|
|
|
|
|||||||||||||||||
December 31, 2021 |
||||||||||||||||
Collateral value |
||||||||||||||||
Stage1 |
Stage2 |
Stage3 |
Total |
|||||||||||||
| Loans and other financial assets at amortized cost |
||||||||||||||||
| Korean treasury and government agencies |
||||||||||||||||
| Banks |
||||||||||||||||
| Corporates |
||||||||||||||||
| General business |
||||||||||||||||
| Small- and medium-sized enterprise |
||||||||||||||||
| Project financing and others |
||||||||||||||||
| Consumers |
||||||||||||||||
| Securities at amortized cost |
||||||||||||||||
| Financial assets at FVTOCI (*3) |
||||||||||||||||
| |
|
|
|
|
|
|
|
|||||||||
| Total |
||||||||||||||||
| |
|
|
|
|
|
|
|
|||||||||
| (*1) | Credit grade of corporates are AAA ~ BBB, and consumers are grades 1 ~ 6. |
| (*2) | Credit grade of corporates are BBB- ~ C, and consumers are grades 7 ~ 10. |
| (*3) | Financial assets at FVTOCI has been disclosed as the amount before deducting loss allowance because loss allowance does not reduce the carrying amount. |
December 31, 2022 |
||||||||||||||||||||||||||||||||||||
Stage 1 |
Stage 2 |
|||||||||||||||||||||||||||||||||||
Above appropriate credit rating (*1) |
Less than a limited credit rating (*2) |
Above appropriate credit rating (*1) |
Less than a limited credit rating (*2) |
Stage 3 |
Credit impairment model |
Total |
Loss allowance |
Total, net |
||||||||||||||||||||||||||||
| Loans and other financial assets at amortized cost |
( |
) | ||||||||||||||||||||||||||||||||||
| Korean treasury and government agencies |
( |
) | ||||||||||||||||||||||||||||||||||
| Banks |
( |
) | ||||||||||||||||||||||||||||||||||
| Corporates |
( |
) | ||||||||||||||||||||||||||||||||||
| General business |
( |
) | ||||||||||||||||||||||||||||||||||
| Small- and medium-sized enterprise |
( |
) | ||||||||||||||||||||||||||||||||||
| Project financing and others |
( |
) | ||||||||||||||||||||||||||||||||||
| Consumers |
( |
) | ||||||||||||||||||||||||||||||||||
| Securities at amortized cost |
( |
) | ||||||||||||||||||||||||||||||||||
| Financial assets at FVTOCI (*3) |
( |
) | ||||||||||||||||||||||||||||||||||
| |
|
|
|
|
|
|
|
|
|
|
|
|
|
|
|
|
|
|||||||||||||||||||
| Total |
( |
) | ||||||||||||||||||||||||||||||||||
| |
|
|
|
|
|
|
|
|
|
|
|
|
|
|
|
|
|
|||||||||||||||||||
December 31, 2022 |
||||||||||||||||||||
Collateral value |
||||||||||||||||||||
Stage1 |
Stage2 |
Stage3 |
Credit impairment model |
Total |
||||||||||||||||
| Loans and other financial assets at amortized cost |
||||||||||||||||||||
| Korean treasury and government agencies |
||||||||||||||||||||
| Banks |
||||||||||||||||||||
| Corporates |
||||||||||||||||||||
| General business |
||||||||||||||||||||
| Small- and medium-sized enterprise |
||||||||||||||||||||
| Project financing and others |
||||||||||||||||||||
| Consumers |
||||||||||||||||||||
| Securities at amortized cost |
||||||||||||||||||||
| Financial assets at FVTOCI (*3) |
||||||||||||||||||||
| |
|
|
|
|
|
|
|
|
|
|||||||||||
| Total |
||||||||||||||||||||
| |
|
|
|
|
|
|
|
|
|
|||||||||||
(*1) |
Credit grade of corporates are AAA ~ BBB, and consumers are grades 1 ~ 6. |
| (*2) | Credit grade of corporates are BBB- ~ C, and consumers are grades 7 ~ 10. |
| (*3) | Financial assets at FVTOCI has been disclosed as the amount before deducting loss allowance because loss allowance does not reduce the carrying amount. |
December 31, 2021 |
||||||||||||||||||||||||
| Financial assets |
Stage 1 |
Stage 2 |
Stage3 |
Total |
||||||||||||||||||||
Above appropriate credit rating (*1) |
Less than a limited credit rating (*2) |
Above appropriate credit rating (*1) |
Less than a limited credit rating (*2) |
|||||||||||||||||||||
| Off-balance accounts: |
||||||||||||||||||||||||
| Payment Guarantees |
||||||||||||||||||||||||
| Loan Commitments |
||||||||||||||||||||||||
| |
|
|
|
|
|
|
|
|
|
|
|
|||||||||||||
| Total |
||||||||||||||||||||||||
| |
|
|
|
|
|
|
|
|
|
|
|
|||||||||||||
(*1) |
Credit grade of corporates are AAA ~ BBB, and consumers are grades 1 ~ 6. |
| (*2) | Credit grade of corporate are BBB- ~ C, and consumers are grades 7 ~ 10. |
December 31, 2022 |
||||||||||||||||||||||||
| Financial assets |
Stage 1 |
Stage 2 |
Stage3 |
Total |
||||||||||||||||||||
Above appropriate credit rating (*1) |
Less than a limited credit rating (*2) |
Above appropriate credit rating (*1) |
Less than a limited credit rating (*2) |
|||||||||||||||||||||
| Off-balance accounts: |
||||||||||||||||||||||||
| Payment Guarantees |
||||||||||||||||||||||||
| Loan Commitments |
||||||||||||||||||||||||
| |
|
|
|
|
|
|
|
|
|
|
|
|||||||||||||
| Total |
|
|||||||||||||||||||||||
| |
|
|
|
|
|
|
|
|
|
|
|
|||||||||||||
(*1) |
Credit grade of corporates are AAA ~ BBB, and consumers are grades 1 ~ 6. |
| (*2) | Credit grade of corporate are BBB- ~ C, and consumers are grades 7 ~ 10. |
| 5) | Collateral and other credit enhancements |
December 31, 2021 |
For the year ended December 31, 2021 |
December 31, 2022 |
For the year ended December 31, 2022 |
|||||||||||||||||||||||||||||
| Risk factor |
Average |
Maximum |
Minimum |
Average |
Maximum |
Minimum |
||||||||||||||||||||||||||
| Interest rate |
||||||||||||||||||||||||||||||||
| Stock price |
||||||||||||||||||||||||||||||||
| Foreign currencies |
||||||||||||||||||||||||||||||||
| Diversification |
( |
) | ( |
) | ( |
) | ( |
) | ( |
) | ( |
) | ( |
) | ( |
) | ||||||||||||||||
| |
|
|
|
|
|
|
|
|
|
|
|
|
|
|
|
|||||||||||||||||
| Total VaR (*) |
||||||||||||||||||||||||||||||||
| |
|
|
|
|
|
|
|
|
|
|
|
|
|
|
|
|||||||||||||||||
| (*) | VaR (Value at Risk): Retention period of 1 day, Maximum expected losses under 99% level of confidence. |
December 31, 2021 |
December 31, 2022 |
|||||||||||||||
| Δ EVE (*1) |
Δ NII (*2) |
Δ EVE (*1) |
Δ NII (*2) |
|||||||||||||
| Woori Bank |
||||||||||||||||
| Woori Card Co., Ltd. |
||||||||||||||||
| Woori Financial Capital Co., Ltd. |
||||||||||||||||
| Woori Investment Bank Co., Ltd. |
||||||||||||||||
| Woori Asset Trust Co., Ltd. |
||||||||||||||||
| Woori Asset Management Corp. |
||||||||||||||||
| Woori Savings Bank |
||||||||||||||||
| Woori Private Equity Asset Management Co., Ltd. |
||||||||||||||||
| Woori Global Asset Management Co., Ltd. |
||||||||||||||||
| Woori Financial F&I Co., Ltd. |
||||||||||||||||
| (*1) | ΔEVE: change in Economic Value of Equity |
| (*2) | ΔNII: change in Net Interest Income |
December 31, 2021 |
||||||||||||||||||||||||||||
Within 3 months |
4 to 6 months |
7 to 9 months |
10 to 12 months |
1 to 5 years |
Over 5 years |
Total |
||||||||||||||||||||||
| Asset: |
||||||||||||||||||||||||||||
| Loans and other financial assets at amortized cost |
||||||||||||||||||||||||||||
| Financial assets at FVTPL |
||||||||||||||||||||||||||||
| Financial assets at FVTOCI |
||||||||||||||||||||||||||||
| Securities at amortized cost |
||||||||||||||||||||||||||||
| |
|
|
|
|
|
|
|
|
|
|
|
|
|
|||||||||||||||
| Total |
||||||||||||||||||||||||||||
| |
|
|
|
|
|
|
|
|
|
|
|
|
|
|||||||||||||||
| Liability: |
||||||||||||||||||||||||||||
| Deposits due to customers |
||||||||||||||||||||||||||||
| Borrowings |
||||||||||||||||||||||||||||
| Debentures |
||||||||||||||||||||||||||||
| |
|
|
|
|
|
|
|
|
|
|
|
|
|
|||||||||||||||
| Total |
||||||||||||||||||||||||||||
| |
|
|
|
|
|
|
|
|
|
|
|
|
|
|||||||||||||||
December 31, 2022 |
||||||||||||||||||||||||||||
Within 3 months |
4 to 6 months |
7 to 9 months |
10 to 12 months |
1 to 5 years |
Over 5 years |
Total |
||||||||||||||||||||||
| Asset: |
||||||||||||||||||||||||||||
| Loans and other financial assets at amortized cost |
||||||||||||||||||||||||||||
| Financial assets at FVTPL |
||||||||||||||||||||||||||||
| Financial assets at FVTOCI |
||||||||||||||||||||||||||||
| Securities at amortized cost |
||||||||||||||||||||||||||||
| |
|
|
|
|
|
|
|
|
|
|
|
|
|
|||||||||||||||
| Total |
||||||||||||||||||||||||||||
| |
|
|
|
|
|
|
|
|
|
|
|
|
|
|||||||||||||||
| Liability: |
||||||||||||||||||||||||||||
| Deposits due to customers |
||||||||||||||||||||||||||||
| Borrowings |
||||||||||||||||||||||||||||
| Debentures |
||||||||||||||||||||||||||||
| |
|
|
|
|
|
|
|
|
|
|
|
|
|
|||||||||||||||
| Total |
||||||||||||||||||||||||||||
| |
|
|
|
|
|
|
|
|
|
|
|
|
|
|||||||||||||||
December 31, 2021 |
||||||||||||||||||||||||||||||||||||||||
USD |
JPY |
CNY |
EUR |
Others |
Total |
|||||||||||||||||||||||||||||||||||
Foreign currency |
Korean Won equivalent |
Foreign currency |
Korean Won equivalent |
Foreign currency |
Korean Won equivalent |
Foreign currency |
Korean Won equivalent |
Korean Won equivalent |
Korean Won equivalent |
|||||||||||||||||||||||||||||||
| Asset |
||||||||||||||||||||||||||||||||||||||||
| Cash and cash equivalents |
||||||||||||||||||||||||||||||||||||||||
| Loans and other financial assets at amortized cost |
||||||||||||||||||||||||||||||||||||||||
| Financial assets at FVTPL |
||||||||||||||||||||||||||||||||||||||||
| Financial assets at FVTOCI |
||||||||||||||||||||||||||||||||||||||||
| Securities at amortized cost |
||||||||||||||||||||||||||||||||||||||||
| |
|
|
|
|
|
|
|
|
|
|
|
|
|
|
|
|
|
|
|
|||||||||||||||||||||
| Total |
||||||||||||||||||||||||||||||||||||||||
| |
|
|
|
|
|
|
|
|
|
|
|
|
|
|
|
|
|
|
|
|||||||||||||||||||||
| Liability |
| |||||||||||||||||||||||||||||||||||||||
| Financial liabilities at FVTPL |
||||||||||||||||||||||||||||||||||||||||
| Deposits due to customers |
||||||||||||||||||||||||||||||||||||||||
| Borrowings |
||||||||||||||||||||||||||||||||||||||||
| Debentures |
||||||||||||||||||||||||||||||||||||||||
| Other financial liabilities |
||||||||||||||||||||||||||||||||||||||||
| |
|
|
|
|
|
|
|
|
|
|
|
|
|
|
|
|
|
|
|
|||||||||||||||||||||
| Total |
||||||||||||||||||||||||||||||||||||||||
| |
|
|
|
|
|
|
|
|
|
|
|
|
|
|
|
|
|
|
|
|||||||||||||||||||||
| Off-balance accounts |
||||||||||||||||||||||||||||||||||||||||
| |
|
|
|
|
|
|
|
|
|
|
|
|
|
|
|
|
|
|
|
|||||||||||||||||||||
December 31, 2022 |
||||||||||||||||||||||||||||||||||||||||
USD |
JPY |
CNY |
EUR |
Others |
Total |
|||||||||||||||||||||||||||||||||||
Foreign currency |
Korean Won equivalent |
Foreign currency |
Korean Won equivalent |
Foreign currency |
Korean Won equivalent |
Foreign currency |
Korean Won equivalent |
Korean Won equivalent |
Korean Won equivalent |
|||||||||||||||||||||||||||||||
| Asset |
||||||||||||||||||||||||||||||||||||||||
| Cash and cash equivalents |
||||||||||||||||||||||||||||||||||||||||
| Loans and other financial assets at amortized cost |
||||||||||||||||||||||||||||||||||||||||
| Financial assets at FVTPL |
||||||||||||||||||||||||||||||||||||||||
| Financial assets at FVTOCI |
||||||||||||||||||||||||||||||||||||||||
| Securities at amortized cost |
||||||||||||||||||||||||||||||||||||||||
| |
|
|
|
|
|
|
|
|
|
|
|
|
|
|
|
|
|
|
|
|||||||||||||||||||||
| Total |
||||||||||||||||||||||||||||||||||||||||
| |
|
|
|
|
|
|
|
|
|
|
|
|
|
|
|
|
|
|
|
|||||||||||||||||||||
| Liability |
| |||||||||||||||||||||||||||||||||||||||
| Financial liabilities at FVTPL |
||||||||||||||||||||||||||||||||||||||||
| Deposits due to customers |
||||||||||||||||||||||||||||||||||||||||
| Borrowings |
||||||||||||||||||||||||||||||||||||||||
| Debentures |
||||||||||||||||||||||||||||||||||||||||
| Other financial liabilities |
||||||||||||||||||||||||||||||||||||||||
| |
|
|
|
|
|
|
|
|
|
|
|
|
|
|
|
|
|
|
|
|||||||||||||||||||||
| Total |
||||||||||||||||||||||||||||||||||||||||
| |
|
|
|
|
|
|
|
|
|
|
|
|
|
|
|
|
|
|
|
|||||||||||||||||||||
| Off-balance accounts |
||||||||||||||||||||||||||||||||||||||||
| |
|
|
|
|
|
|
|
|
|
|
|
|
|
|
|
|
|
|
|
|||||||||||||||||||||
December 31.2022 |
||||||||||
USD (*1) |
||||||||||
Total Amount (*2) |
Interest Rate Provision |
|||||||||
| Non-derivative financial assets |
Financial assets at FVTOCI | |||||||||
| Financial assets at amortized cost | ||||||||||
| |
|
|
|
|||||||
| Total | ||||||||||
| |
|
|
|
|||||||
| Non-derivative financial liabilities |
Financial liabilities at amortized cost | |||||||||
| |
|
|
|
|||||||
| Derivatives |
Interest rate(trading) | |||||||||
| Currency(trading) | ||||||||||
| Interest rate(hedging) | ||||||||||
| |
|
|
|
|||||||
| Total | ||||||||||
| |
|
|
|
|||||||
| (*1) | Financial instruments related to USD Libor (overnight rate, 1, 3, 6, 12 month rates) that are expired before June 30, 2023 are excluded. |
| (*2) | For contracts that do not have an interest rate alternative clause, The Group is in the process of negotiating to add an interest rate alternative clause. |
| 2) | Maturity analysis of non-derivative financial liabilities |
| a) | Cash flows of principals and interests by remaining contractual maturities of non-derivative financial liabilities as of December 31, 2021 and 2022 are as follows (Unit: Korean Won in millions): |
December 31, 2021 |
||||||||||||||||||||||||||||
Within 3 months |
4 to 6 months |
7 to 9 months |
10 to 12 months |
1 to 5 years |
Over 5 years |
Total |
||||||||||||||||||||||
| Financial liabilities at FVTPL |
||||||||||||||||||||||||||||
| Deposits due to customers |
||||||||||||||||||||||||||||
| Borrowings |
||||||||||||||||||||||||||||
| Debentures |
||||||||||||||||||||||||||||
| Lease liabilities |
||||||||||||||||||||||||||||
| Other financial liabilities |
||||||||||||||||||||||||||||
| |
|
|
|
|
|
|
|
|
|
|
|
|
|
|||||||||||||||
| Total |
||||||||||||||||||||||||||||
| |
|
|
|
|
|
|
|
|
|
|
|
|
|
|||||||||||||||
December 31, 2022 |
||||||||||||||||||||||||||||
Within 3 months |
4 to 6 months |
7 to 9 months |
10 to 12 months |
1 to 5 years |
Over 5 years |
Total |
||||||||||||||||||||||
| Financial liabilities at FVTPL |
||||||||||||||||||||||||||||
| Deposits due to customers |
||||||||||||||||||||||||||||
| Borrowings |
||||||||||||||||||||||||||||
| Debentures |
||||||||||||||||||||||||||||
| Lease liabilities |
||||||||||||||||||||||||||||
| Other financial liabilities |
||||||||||||||||||||||||||||
| |
|
|
|
|
|
|
|
|
|
|
|
|
|
|||||||||||||||
| Total |
||||||||||||||||||||||||||||
| |
|
|
|
|
|
|
|
|
|
|
|
|
|
|||||||||||||||
| b) | Cash flows of principals and interests by expected maturities of non-derivative financial liabilities as of December 31, 2021 and 2022 are as follows (Unit: Korean Won in millions): |
December 31, 2021 |
||||||||||||||||||||||||||||
Within 3 months |
4 to 6 months |
7 to 9 months |
10 to 12 months |
1 to 5 years |
Over 5 years |
Total |
||||||||||||||||||||||
Financial liabilities at FVTPL |
||||||||||||||||||||||||||||
Deposits due to customers |
||||||||||||||||||||||||||||
Borrowings |
||||||||||||||||||||||||||||
Debentures |
||||||||||||||||||||||||||||
Lease liabilities |
||||||||||||||||||||||||||||
Other financial liabilities |
||||||||||||||||||||||||||||
Total |
||||||||||||||||||||||||||||
December 31, 2022 |
||||||||||||||||||||||||||||
Within 3 months |
4 to 6 months |
7 to 9 months |
10 to 12 months |
1 to 5 years |
Over 5 years |
Total |
||||||||||||||||||||||
Financial liabilities at FVTPL |
||||||||||||||||||||||||||||
Deposits due to customers |
||||||||||||||||||||||||||||
Borrowings |
||||||||||||||||||||||||||||
Debentures |
||||||||||||||||||||||||||||
Lease liabilities |
||||||||||||||||||||||||||||
Other financial liabilities |
||||||||||||||||||||||||||||
Total |
||||||||||||||||||||||||||||
Remaining maturity |
||||||||||||||||||||||||||||||
Within 3 months |
4 to 6 months |
7 to 9 months |
10 to 12 months |
1 to 5 years |
Over 5 years |
Total |
||||||||||||||||||||||||
December 31, 2021 |
Cash flow risk hedge | ( |
) | ( |
) | ( |
) | ( |
) | ( |
) | ( |
) | |||||||||||||||||
| Fair value risk hedge | ( |
) | ( |
) | ||||||||||||||||||||||||||
| Trading purpose | ||||||||||||||||||||||||||||||
December 31, 2022 |
Cash flow risk hedge | |||||||||||||||||||||||||||||
| Fair value risk hedge | ( |
) | ||||||||||||||||||||||||||||
| Trading purpose | ||||||||||||||||||||||||||||||
December 31, 2021 |
December 31, 2022 |
|||||||
Payment guarantees |
||||||||
Loan commitments |
||||||||
Other commitments |
||||||||
| Details |
December 31, 2021 |
December 31, 2022 |
||||||
| Tier 1 capital |
||||||||
| Other Tier 1 capital |
||||||||
| Tier 2 capital |
||||||||
| |
|
|
|
|||||
| Total risk-adjusted capital |
||||||||
| |
|
|
|
|||||
| Risk-weighted assets for credit risk |
||||||||
| Risk-weighted assets for market risk |
||||||||
| Risk-weighted assets for operational risk |
||||||||
| |
|
|
|
|||||
| Total risk-weighted assets |
||||||||
| |
|
|
|
|||||
| Common Equity Tier 1 ratio |
% | % | ||||||
| |
|
|
|
|||||
| Tier 1 capital ratio |
% | % | ||||||
| |
|
|
|
|||||
| Total capital ratio |
% | % | ||||||
| |
|
|
|
|||||
| Operational scope | ||
| Banking | Loans/deposits and relevant services for customers of Woori Bank and its subsidiaries | |
| Credit card | Credit card, cash services, card loans and accompanying business of Woori Card Co., Ltd. | |
| Capital | Installments, loans including lease financing, and accompanying business of Woori Financial Capital Co., Ltd. | |
| Investment Banking | Securities operation, sale of financial instruments, project financing and other related activities for comprehensive financing of Woori Investment bank Co., Ltd. | |
| Others | Woori Financial Group Inc., Woori Asset Trust Co., Ltd., Woori Asset Management Corp., Ltd., Woori Financial F&I Co., Ltd., Woori Savings Bank., Woori Credit Information Co., Ltd., Woori Fund Services Inc., Woori Private Equity Asset Management Co., Ltd., Woori Global Asset Management Co., Ltd., Woori FIS Co., Ltd. and Woori Finance Research Institute, |
For the year ended December 31, 2020 |
||||||||||||||||||||||||||||||||||||||||
Banking |
Credit card |
Investment banking |
Others (*1) |
Sub-total |
Other adjustments (*2) |
Internal adjustments (*3) |
consolidated adjustments (*4) |
Total |
||||||||||||||||||||||||||||||||
| Net Interest income |
( |
) | ||||||||||||||||||||||||||||||||||||||
| Non-interest income (expense) |
( |
) | ( |
) | ( |
) | ||||||||||||||||||||||||||||||||||
| Impairment losses due to credit loss |
( |
) | ( |
) | ( |
) | ( |
) | ( |
) | ( |
) | ( |
) | ( |
) | ( |
) | ||||||||||||||||||||||
| General and administrative expense |
( |
) | ( |
) | ( |
) | ( |
) | ( |
) | ( |
) | ( |
) | ||||||||||||||||||||||||||
| |
|
|
|
|
|
|
|
|
|
|
|
|
|
|
|
|
|
|||||||||||||||||||||||
| Net operating income (expense) |
( |
) | ( |
) | ||||||||||||||||||||||||||||||||||||
| |
|
|
|
|
|
|
|
|
|
|
|
|
|
|
|
|
|
|||||||||||||||||||||||
| Share of gain (loss) of associates |
( |
) | ( |
) | ( |
) | ||||||||||||||||||||||||||||||||||
| Other non-operating expense |
( |
) | ( |
) | ( |
) | ( |
) | ( |
) | ( |
) | ( |
) | ||||||||||||||||||||||||||
| Non-operating income (expense) |
( |
) | ( |
) | ( |
) | ( |
) | ( |
) | ( |
) | ||||||||||||||||||||||||||||
| |
|
|
|
|
|
|
|
|
|
|
|
|
|
|
|
|
|
|||||||||||||||||||||||
| Net income (expense) before tax |
( |
) | ||||||||||||||||||||||||||||||||||||||
| Tax income (expense) |
( |
) | ( |
) | ( |
) | ( |
) | ( |
) | ( |
) | ||||||||||||||||||||||||||||
| |
|
|
|
|
|
|
|
|
|
|
|
|
|
|
|
|
|
|||||||||||||||||||||||
| Net income (loss) |
( |
) | ||||||||||||||||||||||||||||||||||||||
| |
|
|
|
|
|
|
|
|
|
|
|
|
|
|
|
|
|
|||||||||||||||||||||||
| Total assets |
( |
) | ||||||||||||||||||||||||||||||||||||||
| |
|
|
|
|
|
|
|
|
|
|
|
|
|
|
|
|
|
|||||||||||||||||||||||
| Investment in associate |
( |
) | ||||||||||||||||||||||||||||||||||||||
| Other assets |
( |
) | ||||||||||||||||||||||||||||||||||||||
| |
|
|
|
|
|
|
|
|
|
|
|
|
|
|
|
|
|
|||||||||||||||||||||||
| Total liabilities |
( |
) | ||||||||||||||||||||||||||||||||||||||
| |
|
|
|
|
|
|
|
|
|
|
|
|
|
|
|
|
|
|
|
|||||||||||||||||||||
| (*1) | Other segments include gains and losses from Woori Financial Group Inc., Woori Financial Capital Co., Ltd. (Profit or loss for 3 months after incorporation into subsidiary), Woori Asset Trust Co., Ltd., Woori Asset Management Corp., Woori Credit Information Co., Ltd., Woori Fund Service Inc., Woori Private Equity Asset Management Co., Ltd., Woori Global Asset Management Co., Ltd., Woori FIS Co., Ltd. and Woori Finance Research Co., Ltd. |
| (*2) | Other segments includes the funds subject to Group’s consolidated not included in the reporting segment. |
| (*3) | Internal reconciliation includes the adjustment of deposit insurance premiums of KRW non-interest income expenses in order to present the profit and loss adjustment between reporting divisions in accordance with management accounting standards as profit and loss in accordance with accounting standards |
| (*4) | Consolidation adjustments include the elimination of KRW |
For the year ended December 31, 2021 |
||||||||||||||||||||||||||||||||||||||||
Banking |
Credit card |
Capital |
Investment banking |
Others (*1) |
Sub-total |
Other adjustments (*2) |
Internal adjustments (*3) |
consolidated adjustments (*4) |
Total |
|||||||||||||||||||||||||||||||
| Net interest income |
( |
) | ||||||||||||||||||||||||||||||||||||||
| Non-interest income(expense) |
( |
) | ( |
) | ||||||||||||||||||||||||||||||||||||
| Impairment losses due to credit loss |
( |
) | ( |
) | ( |
) | ( |
) | ( |
) | ( |
) | ( |
) | ( |
) | ||||||||||||||||||||||||
| General and administrative expense |
( |
) | ( |
) | ( |
) | ( |
) | ( |
) | ( |
) | ( |
) | ( |
) | ||||||||||||||||||||||||
| |
|
|
|
|
|
|
|
|
|
|
|
|
|
|
|
|
|
|
|
|||||||||||||||||||||
| Net operating income(expense) |
( |
) | ( |
) | ||||||||||||||||||||||||||||||||||||
| |
|
|
|
|
|
|
|
|
|
|
|
|
|
|
|
|
|
|
|
|||||||||||||||||||||
| Share of gain of associates |
( |
) | ||||||||||||||||||||||||||||||||||||||
| Other non-operating expense |
( |
) | ( |
) | ( |
) | ( |
) | ( |
) | ( |
) | ( |
) | ||||||||||||||||||||||||||
| |
|
|
|
|
|
|
|
|
|
|
|
|
|
|
|
|
|
|
|
|||||||||||||||||||||
| Non-operating income(expense) |
( |
) | ( |
) | ||||||||||||||||||||||||||||||||||||
| |
|
|
|
|
|
|
|
|
|
|
|
|
|
|
|
|
|
|
|
|||||||||||||||||||||
| Net income(expense) before tax |
( |
) | ||||||||||||||||||||||||||||||||||||||
| Tax expense |
( |
) | ( |
) | ( |
) | ( |
) | ( |
) | ( |
) | ( |
) | ( |
) | ||||||||||||||||||||||||
| |
|
|
|
|
|
|
|
|
|
|
|
|
|
|
|
|
|
|
|
|||||||||||||||||||||
| Net income(loss) |
( |
) | ||||||||||||||||||||||||||||||||||||||
| |
|
|
|
|
|
|
|
|
|
|
|
|
|
|
|
|
|
|
|
|||||||||||||||||||||
| Total assets |
( |
) | ||||||||||||||||||||||||||||||||||||||
| |
|
|
|
|
|
|
|
|
|
|
|
|
|
|
|
|
|
|
|
|||||||||||||||||||||
| Investment in associate |
( |
) | ||||||||||||||||||||||||||||||||||||||
| Other assets |
( |
) | ||||||||||||||||||||||||||||||||||||||
| |
|
|
|
|
|
|
|
|
|
|
|
|
|
|
|
|
|
|
|
|||||||||||||||||||||
| Total liabilities |
( |
) | ||||||||||||||||||||||||||||||||||||||
| |
|
|
|
|
|
|
|
|
|
|
|
|
|
|
|
|
|
|
|
|||||||||||||||||||||
(*1) |
Other segments include gains and losses from Woori Financial Group Inc., Woori Asset Trust Co., Ltd., Woori Savings Bank, Woori Asset Management Corp., Woori Financial F&I Co., Ltd., Woori Credit Information Co., Ltd., Woori Fund Service Co., Ltd., Woori Private Equity Asset Management Co., Ltd., Woori Global Asset Management Co., Ltd., Woori FIS Co., Ltd. and Woori Finance Research Institute. |
(*2) |
Other segments includes the funds subject to Group’s consolidated not included in the reporting segment. |
| (*3) | Internal reconciliation includes the adjustment of deposit insurance premiums of KRW non-interest income expenses in order to present the profit and loss adjustment between reporting divisions in accordance with management accounting standards as profit and loss in accordance with accounting standards |
| (*4) | Consolidation adjustments include the elimination of KRW |
For the year ended December 31, 2022 |
||||||||||||||||||||||||||||||||||||||||
Banking |
Credit card |
Capital |
Investment banking |
Others (*1) |
Sub-total |
Other adjustments (*2) |
Internal adjustments (*3) |
Consolidated Adjustments (*4) |
Total |
|||||||||||||||||||||||||||||||
| Net interest income |
( |
) | ||||||||||||||||||||||||||||||||||||||
| Non-interest income(expense) |
( |
) | ( |
) | ||||||||||||||||||||||||||||||||||||
| Impairment losses due to credit loss |
( |
) | ( |
) | ( |
) | ( |
) | ( |
) | ( |
) | ( |
) | ( |
) | ||||||||||||||||||||||||
| General and administrative expense |
( |
) | ( |
) | ( |
) | ( |
) | ( |
) | ( |
) | ( |
) | ( |
) | ||||||||||||||||||||||||
| |
|
|
|
|
|
|
|
|
|
|
|
|
|
|
|
|
|
|
|
|||||||||||||||||||||
| Net operating income(expense) |
( |
) | ( |
) | ||||||||||||||||||||||||||||||||||||
| |
|
|
|
|
|
|
|
|
|
|
|
|
|
|
|
|
|
|
|
|||||||||||||||||||||
| Share of gain of associates |
( |
) | ( |
) | ||||||||||||||||||||||||||||||||||||
| Other non-operating expense |
( |
) | ( |
) | ( |
) | ( |
) | ( |
) | ||||||||||||||||||||||||||||||
| |
|
|
|
|
|
|
|
|
|
|
|
|
|
|
|
|
|
|
|
|||||||||||||||||||||
| Non-operating income(expense) |
( |
) | ( |
) | ( |
) | ( |
) | ( |
) | ||||||||||||||||||||||||||||||
| |
|
|
|
|
|
|
|
|
|
|
|
|
|
|
|
|
|
|
|
|||||||||||||||||||||
| Net income(expense) before tax |
( |
) | ||||||||||||||||||||||||||||||||||||||
| Tax expense |
( |
) | ( |
) | ( |
) | ( |
) | ( |
) | ( |
) | ( |
) | ( |
) | ||||||||||||||||||||||||
| |
|
|
|
|
|
|
|
|
|
|
|
|
|
|
|
|
|
|
|
|||||||||||||||||||||
| Net income(loss) |
( |
) | ||||||||||||||||||||||||||||||||||||||
| |
|
|
|
|
|
|
|
|
|
|
|
|
|
|
|
|
|
|
|
|||||||||||||||||||||
| Total assets |
( |
) | ||||||||||||||||||||||||||||||||||||||
| |
|
|
|
|
|
|
|
|
|
|
|
|
|
|
|
|
|
|
|
|||||||||||||||||||||
| Investment in associate |
( |
) | ||||||||||||||||||||||||||||||||||||||
| Other assets |
( |
) | ||||||||||||||||||||||||||||||||||||||
| |
|
|
|
|
|
|
|
|
|
|
|
|
|
|
|
|
|
|
|
|||||||||||||||||||||
| Total liabilities |
( |
) | ||||||||||||||||||||||||||||||||||||||
| |
|
|
|
|
|
|
|
|
|
|
|
|
|
|
|
|
|
|
|
|||||||||||||||||||||
(*1) |
Other segments include gains and losses from Woori Financial Group Inc., Woori Asset Trust Co., Ltd., Woori Savings Bank, Woori Asset Management Corp., Woori Financial F&I Co., Ltd., Woori Credit Information Co., Ltd., Woori Fund Service Co., Ltd., Woori Private Equity Asset Management Co., Ltd., Woori Global Asset Management Co., Ltd., Woori FIS Co., Ltd. and Woori Finance Research Institute. |
| (*2) | Other segments includes the funds subject to Group’s consolidated not included in the reporting segment. |
| (*3) | Internal reconciliation includes the adjustment of deposit insurance premiums of KRW non-interest income expenses in order to present the profit and loss adjustment between reporting divisions in accordance with management accounting standards as profit and loss in accordance with accounting standards |
| (*4) | Consolidation adjustments include the elimination of KRW |
For the years ended December 31 |
||||||||||||
| Details |
2020 |
2021 |
2022 |
|||||||||
| Domestic |
||||||||||||
| Foreign |
||||||||||||
| |
|
|
|
|
|
|||||||
| Total |
||||||||||||
| |
|
|
|
|
|
|||||||
| Details(*) |
December 31, 2021(*) |
December 31, 2022(*) |
||||||
| Domestic |
||||||||
| Foreign |
||||||||
| |
|
|
|
|||||
| Total |
||||||||
| |
|
|
|
|||||
| (*) | Major non-current assets included joint ventures and related business investments, investment properties, premises equipment, and intangible assets. |
December 31, 2021 |
December 31, 2022 |
|||||||
| Cash |
||||||||
| Foreign currencies |
||||||||
| Demand deposits |
||||||||
| Fixed deposits |
||||||||
| |
|
|
|
|||||
| Total |
||||||||
| |
|
|
|
|||||
| Counterparty |
December 31, 2021 |
Reason of restriction | ||||||
| Due from banks in local currency: |
||||||||
| Due from BOK on demand |
BOK |
Reserve deposits under the BOK Act | ||||||
| Due from banks in foreign currencies: |
||||||||
| Due from banks on demand |
BOK and others |
Reserve deposits under the BOK Act and others | ||||||
| |
|
|||||||
| Total |
||||||||
| |
|
|||||||
| Counterparty |
December 31, 2022 |
Reason of restriction | ||||||
| Due from banks in local currency: |
||||||||
| Due from BOK on demand |
BOK |
Reserve deposits under the BOK Act | ||||||
| Due from banks in foreign currencies: |
||||||||
| Due from banks on demand |
BOK and others |
Reserve deposits under the BOK Act and others | ||||||
| |
|
|||||||
| Total |
||||||||
| |
|
|||||||
For the years ended December 31 |
||||||||||||
2020 |
2021 |
2022 |
||||||||||
| Changes in other comprehensive income related to valuation of financial assets at FVTOCI |
( |
) | ( |
) | ||||||||
| Changes in other comprehensive income related to valuation of assets of associate |
( |
) | ||||||||||
| Changes in other comprehensive income related to valuation profit or loss on cash flow hedge |
( |
) | ||||||||||
| Changes in financial assets measure at FVTOCI due to debt-for-equity |
||||||||||||
| Changes in the investment assets of associates due to the transfer of assets held-for-sale |
( |
) | ( |
) | ||||||||
| Changes in financial assets at FVTPL and assets held-for-sale |
( |
) | ||||||||||
| Changes in the property, plant and equipment due to the transfer of assets held-for-sale |
( |
) | ( |
) | ||||||||
| Transfer of investment properties and premises and equipment |
||||||||||||
| Changes in account payables related to premises and equipment |
||||||||||||
| Changes in account payables related to intangible assets |
( |
) | ( |
) | ( |
) | ||||||
| Changes in right-of-use |
||||||||||||
| Comprehensive stock exchange |
||||||||||||
| Changes in other comprehensive income related to foreign operation translation |
( |
) | ||||||||||
For the year ended December 31, 2021 |
||||||||||||||||||||||||
Beginning balance |
Cash flow |
Not involving cash inflows and outflows |
Ending balance |
|||||||||||||||||||||
Foreign Exchange |
Variation of gains on valuation of hedged items |
Others(*) |
||||||||||||||||||||||
| Borrowings |
||||||||||||||||||||||||
| Debentures |
( |
) | ( |
) | ||||||||||||||||||||
| Lease liabilities |
( |
) | ||||||||||||||||||||||
| Other liabilities |
( |
) | ||||||||||||||||||||||
| |
|
|
|
|
|
|
|
|
|
|
|
|||||||||||||
| Total |
( |
) | ||||||||||||||||||||||
| |
|
|
|
|
|
|
|
|
|
|
|
|||||||||||||
| (*) | The change in lease liabilities due to the new contract includes W on. |
For the year ended December 31, 2022 |
||||||||||||||||||||||||
Beginning balance |
Cash flow |
Not involving cash inflows and outflows |
Ending balance |
|||||||||||||||||||||
Foreign Exchange |
Variation of gain(loss) on valuation of hedged items |
Others(*) |
||||||||||||||||||||||
| Borrowings |
||||||||||||||||||||||||
| Debentures |
( |
) | ( |
) | ( |
) | ||||||||||||||||||
| Lease liabilities |
( |
) | ||||||||||||||||||||||
| Other liabilities |
( |
) | ||||||||||||||||||||||
| |
|
|
|
|
|
|
|
|
|
|
|
|||||||||||||
| Total |
( |
) | ||||||||||||||||||||||
| |
|
|
|
|
|
|
|
|
|
|
|
|||||||||||||
| (*) | The change in lease liabilities due to the new contract includes W on. |
December 31, 2021 |
December 31, 2022 |
|||||||
| Financial assets at fair value through profit or loss measured at fair value |
||||||||
December 31, 2021 |
December 31, 2022 |
|||||||
| Deposits: |
||||||||
| Gold banking asset |
||||||||
| Securities: |
||||||||
| Debt securities |
||||||||
| Korean treasury and government agencies |
||||||||
| Financial institutions |
||||||||
| Corporates |
||||||||
| Others |
||||||||
| Equity securities |
||||||||
| Capital contributions |
||||||||
| Beneficiary certificates |
||||||||
| Others |
||||||||
| |
|
|
|
|||||
| Sub-total |
||||||||
| |
|
|
|
|||||
| Loans |
||||||||
| Derivatives assets |
||||||||
| Other financial assets |
||||||||
| |
|
|
|
|||||
| Total |
||||||||
| |
|
|
|
|||||
8. |
FINANCIAL ASSETS AT FVTOCI |
December 31, 2021 |
December 31, 2022 |
|||||||
| Debt securities: |
||||||||
| Korean treasury and government agencies |
||||||||
| Financial institutions |
||||||||
| Corporates |
||||||||
| Bond denominated in foreign currencies |
||||||||
| Securities loaned |
||||||||
| |
|
|
|
|||||
| Sub-total |
||||||||
| |
|
|
|
|||||
| Equity securities |
||||||||
| |
|
|
|
|||||
| Total |
||||||||
| |
|
|
|
|||||
| Purpose of acquisition |
December 31, 2021 |
December 31, 2022 |
Purpose of acquisition |
|||||||||
| |
||||||||||||
| |
||||||||||||
| |
||||||||||||
| |
|
|
|
|||||||||
| Total |
||||||||||||
| |
|
|
|
|||||||||
For the year ended December 31, 2020 |
||||||||||||||||
Stage 1 |
Stage 2 |
Stage 3 |
Total |
|||||||||||||
| Beginning balance |
( |
) | ( |
) | ||||||||||||
| Transfer to 12-month expected credit losses |
||||||||||||||||
| Transfer to lifetime expected credit losses |
||||||||||||||||
| Transfer to credit-impaired financial assets |
||||||||||||||||
| Net provision of loss allowance |
( |
) | ( |
) | ||||||||||||
| Disposal |
|
|
||||||||||||||
| Others (*) |
( |
) | ( |
) | ||||||||||||
| |
|
|
|
|
|
|
|
|||||||||
| Ending balance |
( |
) | ( |
) | ||||||||||||
| |
|
|
|
|
|
|
|
|||||||||
(*) |
Others consist of foreign currencies translation, etc. |
For the year ended December 31, 2021 |
||||||||||||||||
Stage 1 |
Stage 2 |
Stage 3 |
Total |
|||||||||||||
| Beginning balance |
( |
) | ( |
) | ||||||||||||
| Transfer to 12-month expected credit losses |
||||||||||||||||
| Transfer to lifetime expected credit losses |
||||||||||||||||
| Transfer to credit-impaired financial assets |
||||||||||||||||
| Net provision of loss allowance |
( |
) | ( |
) | ||||||||||||
| Disposal |
|
|||||||||||||||
| Others (*) |
|
|||||||||||||||
| |
|
|
|
|
|
|
|
|||||||||
| Ending balance |
( |
) | ( |
) | ||||||||||||
| |
|
|
|
|
|
|
|
|||||||||
(*) |
Others consist of foreign currencies translation, etc. |
For the year ended December 31, 2022 |
||||||||||||||||
Stage 1 |
Stage 2 |
Stage 3 |
Total |
|||||||||||||
| Beginning balance |
( |
) | ( |
) | ||||||||||||
| Transfer to 12-month expected credit losses |
||||||||||||||||
| Transfer to lifetime expected credit losses |
||||||||||||||||
| Transfer to credit-impaired financial assets |
||||||||||||||||
| Reversal of loss allowance |
||||||||||||||||
| Disposal |
|
|
||||||||||||||
| Others (*) |
( |
) | ( |
) | ||||||||||||
| |
|
|
|
|
|
|
|
|||||||||
| Ending balance |
( |
) | ( |
) | ||||||||||||
| |
|
|
|
|
|
|
|
|||||||||
(*) |
Others consist of foreign currencies translation, etc. |
For the year ended December 31, 2020 |
||||||||||||||||
Stage 1 |
Stage 2 |
Stage 3 |
Total |
|||||||||||||
| Beginning balance |
|
|||||||||||||||
| Transfer to 12-month expected credit losses |
|
|||||||||||||||
| Transfer to lifetime expected credit losses |
||||||||||||||||
| Transfer to credit-impaired financial assets |
||||||||||||||||
| Acquisition |
||||||||||||||||
| Disposal / Recovery |
( |
) | ( |
) | ||||||||||||
| Gain (loss) on valuation |
||||||||||||||||
| Amortization based on effective interest method |
( |
) | ( |
) | ||||||||||||
| Others (*) |
( |
) | ( |
) | ||||||||||||
| |
|
|
|
|
|
|
|
|||||||||
| Ending balance |
||||||||||||||||
| |
|
|
|
|
|
|
|
|||||||||
(*) |
Others consist of foreign currencies translation, etc. |
For the year ended December 31, 2021 |
||||||||||||||||
Stage 1 |
Stage 2 |
Stage 3 |
Total |
|||||||||||||
| Beginning balance |
||||||||||||||||
| Transfer to 12-month expected credit losses |
||||||||||||||||
| Transfer to lifetime expected credit losses |
||||||||||||||||
| Transfer to credit-impaired financial assets |
||||||||||||||||
| Acquisition |
|
|||||||||||||||
| Disposal / Recovery |
( |
) | ( |
) | ||||||||||||
| Gain (loss) on valuation |
( |
) | ( |
) | ||||||||||||
| Amortization based on effective interest method |
||||||||||||||||
| Others (*) |
|
|||||||||||||||
| |
|
|
|
|
|
|
|
|||||||||
| Ending balance |
||||||||||||||||
| |
|
|
|
|
|
|
|
|||||||||
| (*) | Others consist of foreign currencies translation, etc. |
For the year ended December 31, 2022 |
||||||||||||||||
Stage 1 |
Stage 2 |
Stage 3 |
Total |
|||||||||||||
| Beginning balance |
||||||||||||||||
| Transfer to 12-month expected credit losses |
||||||||||||||||
| Transfer to lifetime expected credit losses |
||||||||||||||||
| Transfer to credit-impaired financial assets |
||||||||||||||||
| Acquisition |
||||||||||||||||
| Disposal / Recovery |
( |
) | ( |
) | ||||||||||||
| Gain (loss) on valuation |
( |
) | ( |
) | ||||||||||||
| Amortization based on effective interest method |
||||||||||||||||
| Others (*) |
|
|
||||||||||||||
| |
|
|
|
|
|
|
|
|||||||||
| Ending balance |
||||||||||||||||
| |
|
|
|
|
|
|
|
|||||||||
| (*) | Others consist of foreign currencies translation, etc. |
December 31, 2021 |
December 31, 2022 |
|||||||
| Korean treasury and government agencies |
||||||||
| Financial institutions |
||||||||
| Corporates |
||||||||
| Bond denominated in foreign currencies |
||||||||
| Allowance for credit losses |
( |
) | ( |
) | ||||
| |
|
|
|
|||||
| Total |
||||||||
| |
|
|
|
|||||
For the year ended December 31, 2020 |
||||||||||||||||
Stage 1 |
Stage 2 |
Stage 3 |
Total |
|||||||||||||
| Beginning balance |
( |
) | ( |
) | ||||||||||||
| Transfer to 12-month expected credit losses |
||||||||||||||||
| Transfer to lifetime expected credit losses |
||||||||||||||||
| Transfer to credit-impaired financial assets |
|
|
||||||||||||||
| Net reversal of loss allowance |
||||||||||||||||
| Others (*) |
||||||||||||||||
| |
|
|
|
|
|
|
|
|||||||||
| Ending balance |
( |
) | ( |
) | ||||||||||||
| |
|
|
|
|
|
|
|
|||||||||
| (*) | Changes due to foreign currencies translation, etc. |
For the year ended December 31, 2021 |
||||||||||||||||
Stage 1 |
Stage 2 |
Stage 3 |
Total |
|||||||||||||
| Beginning balance |
( |
) | ( |
) | ||||||||||||
| Transfer to 12-month expected credit losses |
||||||||||||||||
| Transfer to lifetime expected credit losses |
||||||||||||||||
| Transfer to credit-impaired financial assets |
|
|
||||||||||||||
| Net reversal of loss allowance |
( |
) | ( |
) | ||||||||||||
| Others (*) |
( |
) | ( |
) | ||||||||||||
| |
|
|
|
|
|
|
|
|||||||||
| Ending balance |
( |
) | ( |
) | ||||||||||||
| |
|
|
|
|
|
|
|
|||||||||
| (*) | Changes due to foreign currencies translation, etc. |
For the year ended December 31, 2022 |
||||||||||||||||
Stage 1 |
Stage 2 |
Stage 3 |
Total |
|||||||||||||
| Beginning balance |
( |
) | ( |
) | ||||||||||||
| Transfer to 12-month expected credit losses |
||||||||||||||||
| Transfer to lifetime expected credit losses |
||||||||||||||||
| Transfer to credit-impaired financial assets |
|
|
||||||||||||||
| Net provision of loss allowance |
( |
) | ( |
) | ||||||||||||
| Others (*) |
||||||||||||||||
| |
|
|
|
|
|
|
|
|||||||||
| Ending balance |
( |
) | ( |
) | ||||||||||||
| |
|
|
|
|
|
|
|
|||||||||
| (*) | Changes due to foreign currencies translation, etc. |
For the year ended December 31, 2020 |
||||||||||||||||
Stage 1 |
Stage 2 |
Stage 3 |
Total |
|||||||||||||
| Beginning balance |
||||||||||||||||
| Transfer to 12-month expected credit losses |
||||||||||||||||
| Transfer to lifetime expected credit losses |
||||||||||||||||
| Transfer to credit-impaired financial assets |
||||||||||||||||
| Acquisition |
||||||||||||||||
| Disposal / Recovery |
( |
) | ( |
) | ||||||||||||
| Amortization based on effective interest method |
( |
) | ( |
) | ||||||||||||
| Others (*) |
( |
) | ( |
) | ||||||||||||
| |
|
|
|
|
|
|
|
|||||||||
| Ending balance |
||||||||||||||||
| |
|
|
|
|
|
|
|
|||||||||
| (*) | Changes due to foreign currencies translation, etc. |
For the year ended December 31, 2021 |
||||||||||||||||
Stage 1 |
Stage 2 |
Stage 3 |
Total |
|||||||||||||
| Beginning balance |
||||||||||||||||
| Transfer to 12-month expected credit losses |
||||||||||||||||
| Transfer to lifetime expected credit losses |
||||||||||||||||
| Transfer to credit-impaired financial assets |
||||||||||||||||
| Acquisition |
||||||||||||||||
| Disposal / Recovery |
( |
) | ( |
) | ||||||||||||
| Amortization based on effective interest method |
||||||||||||||||
| Others (*) |
||||||||||||||||
| |
|
|
|
|
|
|
|
|||||||||
| Ending balance |
||||||||||||||||
| |
|
|
|
|
|
|
|
|||||||||
| (*) | Changes due to foreign currencies translation, etc. |
For the year ended December 31, 2022 |
||||||||||||||||
Stage 1 |
Stage 2 |
Stage 3 |
Total |
|||||||||||||
| Beginning balance |
||||||||||||||||
| Transfer to 12-month expected credit losses |
||||||||||||||||
| Transfer to lifetime expected credit losses |
||||||||||||||||
| Transfer to credit-impaired financial assets |
||||||||||||||||
| Acquisition |
||||||||||||||||
| Disposal / Recovery |
( |
) | ( |
) | ||||||||||||
| Amortization based on effective interest method |
||||||||||||||||
| Others (*) |
||||||||||||||||
| |
|
|
|
|
|
|
|
|||||||||
| Ending balance |
||||||||||||||||
| |
|
|
|
|
|
|
|
|||||||||
| (*) | Changes due to foreign currencies translation, etc. |
10. |
LOANS AND OTHER FINANCIAL ASSETS AT AMORTIZED COST |
December 31, 2021 |
December 31, 2022 |
|||||||
| Due from banks |
||||||||
| Loans |
||||||||
| Other financial assets |
||||||||
| |
|
|
|
|||||
| Total |
||||||||
| |
|
|
|
|||||
| (2) | Details of due from banks are as follows (Unit: Korean Won in millions): |
December 31, 2021 |
December 31, 2022 |
|||||||
| Due from banks in local currency: |
||||||||
| Due from The Bank of Korea (“BOK”) |
||||||||
| Due from depository banks |
||||||||
| Due from non-depository institutions |
||||||||
| Due from the Korea Exchange |
||||||||
| Others |
||||||||
| Loss allowance |
( |
) | ( |
) | ||||
| |
|
|
|
|||||
| Sub-total |
||||||||
| |
|
|
|
|||||
| Due from banks in foreign currencies: |
||||||||
| Due from banks on demand |
||||||||
| Due from banks on time |
||||||||
| Others |
||||||||
| Loss allowance |
( |
) | ( |
) | ||||
| |
|
|
|
|||||
| Sub-total |
||||||||
| |
|
|
|
|||||
| Total |
|
|
||||||
| |
|
|
|
|||||
| (3) | Details of restricted due from banks are as follows (Unit: Korean Won in millions): |
| Counterparty |
December 31, 2021 |
Reason of restriction | ||||||
| Due from banks in local currency: |
||||||||
| Due from BOK |
|
under the BOK Act | ||||||
| Due from KSFC |
|
| ||||||
| Others |
|
| ||||||
| |
|
|||||||
Sub-total |
||||||||
| |
|
|||||||
| Due from banks in foreign currencies: |
||||||||
| Due from banks on demand |
| |||||||
| Foreign currency deposits on time |
| |||||||
| Others |
|
| ||||||
| |
|
|||||||
| Sub-total |
||||||||
| |
|
|||||||
| Total |
||||||||
| |
|
|||||||
| Counterparty |
December 31, 2022 |
Reason of restriction | ||||||
| Due from banks in local currency: |
||||||||
| Due from BOK |
|
| ||||||
| Due from KSFC |
|
| ||||||
| Others |
|
| ||||||
| |
|
|||||||
| Sub-total |
||||||||
| |
|
|||||||
| Due from banks in foreign currencies: |
||||||||
| Due from banks on demand |
|
| ||||||
| Due from banks on time |
|
| ||||||
| Others |
|
| ||||||
| |
|
|||||||
| Sub-total |
||||||||
| |
|
|||||||
| Total |
||||||||
| |
|
|||||||
For the year ended December 31, 2020 |
||||||||||||||||
Stage 1 |
Stage 2 |
Stage 3 |
Total |
|||||||||||||
| Beginning balance |
( |
) | ( |
) | ||||||||||||
| Transfer to 12-month expected credit losses |
||||||||||||||||
| Transfer to lifetime expected credit losses |
||||||||||||||||
| Transfer to credit-impaired financial assets |
|
|
||||||||||||||
| Reversal of allowance for credit losses |
||||||||||||||||
| Others (*) |
||||||||||||||||
| |
|
|
|
|
|
|
|
|||||||||
| Ending balance |
( |
) | ( |
) | ||||||||||||
| |
|
|
|
|
|
|
|
|||||||||
(*) |
Changes due to foreign currencies translation, etc |
For the year ended December 31, 2021 |
||||||||||||||||
Stage 1 |
Stage 2 |
Stage 3 |
Total |
|||||||||||||
| Beginning balance |
( |
) | ( |
) | ||||||||||||
| Transfer to 12-month expected credit losses |
||||||||||||||||
| Transfer to lifetime expected credit losses |
||||||||||||||||
| Transfer to credit-impaired financial assets |
|
|
||||||||||||||
| Provision of allowance for credit losses |
( |
) | ( |
) | ||||||||||||
| Others (*) |
( |
) | ( |
) | ||||||||||||
| |
|
|
|
|
|
|
|
|||||||||
| Ending balance |
( |
) | ( |
) | ||||||||||||
| |
|
|
|
|
|
|
|
|||||||||
| (*) | Changes due to foreign currencies translation, etc |
For the year ended December 31, 2022 |
||||||||||||||||
Stage 1 |
Stage 2 |
Stage 3 |
Total |
|||||||||||||
| Beginning balance |
( |
) | ( |
) | ||||||||||||
| Transfer to 12-month expected credit losses |
||||||||||||||||
| Transfer to lifetime expected credit losses |
||||||||||||||||
| Transfer to credit-impaired financial assets |
||||||||||||||||
| Provision of allowance for credit losses |
( |
) | ( |
) | ||||||||||||
| Others (*) |
||||||||||||||||
| |
|
|
|
|
|
|
|
|||||||||
| Ending balance |
( |
) | ( |
) | ||||||||||||
| |
|
|
|
|
|
|
|
|||||||||
| (*) | Changes due to foreign currencies translation, etc |
For the year ended December 31, 2020 |
||||||||||||||||
Stage 1 |
Stage 2 |
Stage 3 |
Total |
|||||||||||||
| Beginning balance |
||||||||||||||||
| Transfer to 12-month expected credit losses |
||||||||||||||||
| Transfer to lifetime expected credit losses |
||||||||||||||||
| Transfer to credit-impaired financial assets |
||||||||||||||||
| Net decrease |
( |
) | ( |
) | ||||||||||||
| Business combination |
||||||||||||||||
| Others (*) |
( |
) | ( |
) | ||||||||||||
| |
|
|
|
|
|
|
|
|||||||||
| Ending balance |
||||||||||||||||
| |
|
|
|
|
|
|
|
|||||||||
| (*) | Changes due to foreign currencies translation, etc |
For the year ended December 31, 2021 |
||||||||||||||||
Stage 1 |
Stage 2 |
Stage 3 |
Total |
|||||||||||||
| Beginning balance |
||||||||||||||||
| Transfer to 12-month expected credit losses |
||||||||||||||||
| Transfer to lifetime expected credit losses |
||||||||||||||||
| Transfer to credit-impaired financial assets |
||||||||||||||||
| Net increase |
||||||||||||||||
| Others (*) |
||||||||||||||||
| |
|
|
|
|
|
|
|
|||||||||
| Ending balance |
||||||||||||||||
| |
|
|
|
|
|
|
|
|||||||||
| (*) | Changes due to foreign currencies translation, etc |
For the year ended December 31, 2022 |
||||||||||||||||
Stage 1 |
Stage 2 |
Stage 3 |
Total |
|||||||||||||
| Beginning balance |
||||||||||||||||
| Transfer to 12-month expected credit losses |
||||||||||||||||
| Transfer to lifetime expected credit losses |
||||||||||||||||
| Transfer to credit-impaired financial assets |
||||||||||||||||
| Net increase |
||||||||||||||||
| Others (*) |
( |
) | ( |
) | ||||||||||||
| |
|
|
|
|
|
|
|
|||||||||
| Ending balance |
||||||||||||||||
| |
|
|
|
|
|
|
|
|||||||||
(*) |
Changes due to foreign currencies translation, etc |
| (5) | Details of loans are as follows (Unit: Korean Won in millions): |
December 31, 2021 |
December 31, 2022 |
|||||||
| Loans in local currency |
||||||||
| Loans in foreign currencies |
||||||||
| Domestic banker’s usance |
||||||||
| Credit card accounts |
||||||||
| Bills bought in foreign currencies |
||||||||
| Bills bought in local currency |
||||||||
| Factoring receivables |
||||||||
| Advances for customers on guarantees |
||||||||
| Private placement bonds |
||||||||
| Securitized loans |
||||||||
| Call loans |
||||||||
| Bonds purchased under resale agreements |
||||||||
| Financial lease receivables |
||||||||
| Installment financial bond |
||||||||
| Others |
||||||||
| Loan origination costs and fees |
||||||||
| Discounted present value |
( |
) | ( |
) | ||||
| Allowance for credit losses |
( |
) | ( |
) | ||||
| |
|
|
|
|||||
| Total |
||||||||
| |
|
|
|
|||||
For the year ended December 31, 2020 |
||||||||||||||||||||||||
Consumers |
Corporates |
|||||||||||||||||||||||
Stage 1 |
Stage 2 |
Stage 3 |
Stage 1 |
Stage 2 |
Stage 3 |
|||||||||||||||||||
| Beginning balance |
( |
) | ( |
) | ( |
) | ( |
) | ( |
) | ( |
) | ||||||||||||
| Transfer to 12-month expected credit losses |
( |
) | ( |
) | ||||||||||||||||||||
| Transfer to lifetime expected credit losses |
( |
) | ( |
) | ||||||||||||||||||||
| Transfer to credit-impaired financial assets |
( |
) | ( |
) | ||||||||||||||||||||
| Net reversal (provision) of allowance for credit losses |
( |
) | ( |
) | ( |
) | ( |
) | ||||||||||||||||
| Recovery |
( |
) | ( |
) | ||||||||||||||||||||
| Charge-off |
||||||||||||||||||||||||
| Disposal |
||||||||||||||||||||||||
| Interest income from impaired loans |
|
|
|
|
|
|||||||||||||||||||
| Changes due to business combinations |
( |
) | ( |
) | ( |
) | ( |
) | ( |
) | ( |
) | ||||||||||||
| Others |
( |
) | ( |
) | ||||||||||||||||||||
| |
|
|
|
|
|
|
|
|
|
|
|
|||||||||||||
| Ending balance |
( |
) | ( |
) | ( |
) | ( |
) | ( |
) | ( |
) | ||||||||||||
| |
|
|
|
|
|
|
|
|
|
|
|
|||||||||||||
For the year ended December 31, 2020 |
||||||||||||||||||||||||
Credit card accounts |
Total |
|||||||||||||||||||||||
Stage 1 |
Stage 2 |
Stage 3 |
Stage 1 |
Stage 2 |
Stage 3 |
|||||||||||||||||||
| Beginning balance |
( |
) | ( |
) | ( |
) | ( |
) | ( |
) | ( |
) | ||||||||||||
| Transfer to 12-month expected credit losses |
( |
) | ( |
) | ||||||||||||||||||||
| Transfer to lifetime expected credit losses |
( |
) | ( |
) | ||||||||||||||||||||
| Transfer to credit-impaired financial assets |
( |
) | ( |
) | ||||||||||||||||||||
| Net reversal (provision) of loss allowance |
( |
) | ( |
) | ( |
) | ( |
) | ||||||||||||||||
| Recovery |
( |
) | ( |
) | ||||||||||||||||||||
| Charge-off |
|
|||||||||||||||||||||||
| Disposal |
||||||||||||||||||||||||
| Interest income from impaired loans |
|
|
||||||||||||||||||||||
| Changes due to business combinations |
|
( |
) | ( |
) | ( |
) | |||||||||||||||||
| Others |
|
|||||||||||||||||||||||
| |
|
|
|
|
|
|
|
|
|
|
|
|||||||||||||
| Ending balance |
( |
) | ( |
) | ( |
) | ( |
) | ( |
) | ( |
) | ||||||||||||
| |
|
|
|
|
|
|
|
|
|
|
|
|||||||||||||
For the year ended December 31, 2021 |
||||||||||||||||||||||||
Consumers |
Corporates |
|||||||||||||||||||||||
Stage 1 |
Stage 2 |
Stage 3 |
Stage 1 |
Stage 2 |
Stage 3 |
|||||||||||||||||||
| Beginning balance |
( |
) | ( |
) | ( |
) | ( |
) | ( |
) | ( |
) | ||||||||||||
| Transfer to 12-month expected credit losses |
( |
) | ( |
) | ||||||||||||||||||||
| Transfer to lifetime expected credit losses |
( |
) | ( |
) | ||||||||||||||||||||
| Transfer to credit-impaired financial assets |
( |
) | ( |
) | ||||||||||||||||||||
| Net reversal (provision) of loss allowance |
( |
) | ( |
) | ( |
) | ( |
) | ( |
) | ||||||||||||||
| Recovery |
( |
) | ( |
) | ||||||||||||||||||||
| Charge-off |
|
|||||||||||||||||||||||
| Disposal |
||||||||||||||||||||||||
| Interest income from impaired loans |
|
|
|
|
||||||||||||||||||||
| Others |
( |
) | ||||||||||||||||||||||
| |
|
|
|
|
|
|
|
|
|
|
|
|||||||||||||
| Ending balance |
( |
) | ( |
) | ( |
) | ( |
) | ( |
) | ( |
) | ||||||||||||
| |
|
|
|
|
|
|
|
|
|
|
|
|||||||||||||
For the year ended December 31, 2021 |
||||||||||||||||||||||||
Credit card accounts |
Total |
|||||||||||||||||||||||
Stage 1 |
Stage 2 |
Stage 3 |
Stage 1 |
Stage 2 |
Stage 3 |
|||||||||||||||||||
| Beginning balance |
( |
) | ( |
) | ( |
) | ( |
) | ( |
) | ( |
) | ||||||||||||
| Transfer to 12-month expected credit losses |
( |
) | ( |
) | ||||||||||||||||||||
| Transfer to lifetime expected credit losses |
( |
) | ( |
) | ||||||||||||||||||||
| Transfer to credit-impaired financial assets |
( |
) | ( |
) | ||||||||||||||||||||
| Net reversal (provision) of loss allowance |
( |
) | ( |
) | ( |
) | ( |
) | ||||||||||||||||
| Recovery |
( |
) | ( |
) | ||||||||||||||||||||
| Charge-off |
||||||||||||||||||||||||
| Disposal |
||||||||||||||||||||||||
| Interest income from impaired loans |
|
|
|
|
|
|||||||||||||||||||
| Others |
( |
) | ( |
) | ||||||||||||||||||||
| |
|
|
|
|
|
|
|
|
|
|
|
|||||||||||||
| Ending balance |
( |
) | ( |
) | ( |
) | ( |
) | ( |
) | ( |
) | ||||||||||||
| |
|
|
|
|
|
|
|
|
|
|
|
|||||||||||||
For the year ended December 31, 2022 |
||||||||||||||||||||||||||||
Consumers |
Corporates |
|||||||||||||||||||||||||||
Stage 1 |
Stage 2 |
Stage 3 |
Stage 1 |
Stage 2 |
Stage 3 |
Credit impairment model |
||||||||||||||||||||||
| Beginning balance |
( |
) |
( |
) |
( |
) |
( |
) |
( |
) |
( |
) |
|
|
— |
| ||||||||||||
| Transfer to 12-month expected credit losses |
( |
) |
( |
) |
|
|
— |
| ||||||||||||||||||||
| Transfer to lifetime expected credit losses |
( |
) |
( |
) |
|
|
— |
| ||||||||||||||||||||
| Transfer to credit-impaired financial assets |
( |
) |
( |
) |
|
|
— |
| ||||||||||||||||||||
| Net reversal(provision) of allowance for credit losses |
( |
) |
( |
) |
( |
) |
( |
) |
( |
) |
( |
) |
|
|
( |
) | ||||||||||||
| Recovery |
( |
) |
( |
) |
|
|
— |
| ||||||||||||||||||||
| Charge-off |
|
|
— |
| ||||||||||||||||||||||||
| Disposal |
|
|
— |
| ||||||||||||||||||||||||
| Interest income from impaired loans |
|
|
— |
| ||||||||||||||||||||||||
| Others |
( |
) |
( |
) |
( |
) |
( |
) |
( |
) |
( |
) |
|
|
— |
| ||||||||||||
| Changes due to business combinations |
( |
) |
( |
) |
|
|
— |
| ||||||||||||||||||||
| Ending balance |
( |
) |
( |
) |
( |
) |
( |
) |
( |
) |
( |
) |
|
|
( |
) | ||||||||||||
| |
|
|
|
|
|
|
|
|
|
|
|
|
|
|
|
|
|
|
|
|
|
|
|
|
|
|
|
|
For the year ended December 31, 2022 |
||||||||||||||||||||||||||||
Credit card accounts |
Total |
|||||||||||||||||||||||||||
Stage 1 |
Stage 2 |
Stage 3 |
Stage 1 |
Stage 2 |
Stage 3 |
Credit impairment model |
||||||||||||||||||||||
| Beginning balance |
( |
) |
( |
) |
( |
) |
( |
) |
( |
) |
( |
) |
|
|
— |
| ||||||||||||
| Transfer to 12-month expected credit losses |
( |
) |
( |
) |
|
|
— |
| ||||||||||||||||||||
| Transfer to lifetime expected credit losses |
( |
) |
( |
) |
|
|
— |
| ||||||||||||||||||||
| Transfer to credit-impaired financial assets |
( |
) |
( |
) |
|
|
— |
| ||||||||||||||||||||
| Net reversal(provision) of allowance for credit losses |
( |
) |
( |
) |
( |
) |
( |
) |
( |
) |
|
|
( |
) | ||||||||||||||
| Recovery |
( |
) |
( |
) |
|
|
— |
| ||||||||||||||||||||
| Charge-off |
|
|
— |
| ||||||||||||||||||||||||
| Disposal |
|
|
— |
| ||||||||||||||||||||||||
| Interest income from impaired loans |
|
|
— |
| ||||||||||||||||||||||||
| Others |
( |
) |
( |
) |
( |
) |
|
|
— |
| ||||||||||||||||||
| Changes due to business combinations |
( |
) |
( |
) |
( |
) |
|
|
— |
| ||||||||||||||||||
| Ending balance |
( |
) |
( |
) |
( |
) |
( |
) |
( |
) |
( |
) |
|
|
( |
) | ||||||||||||
| |
|
|
|
|
|
|
|
|
|
|
|
|
|
|
|
|
|
|
|
|
|
|
|
|
|
|
|
|
For the year ended December 31, 2020 |
||||||||||||||||||||||||
Consumers |
Corporates |
|||||||||||||||||||||||
Stage 1 |
Stage 2 |
Stage 3 |
Stage 1 |
Stage 2 |
Stage 3 |
|||||||||||||||||||
| Beginning balance |
||||||||||||||||||||||||
| Transfer to 12-month expected credit losses |
( |
) | ( |
) | ( |
) | ( |
) | ||||||||||||||||
| Transfer to lifetime expected credit losses |
( |
) | ( |
) | ( |
) | ( |
) | ||||||||||||||||
| Transfer to credit-impaired financial assets |
( |
) | ( |
) | ( |
) | ( |
) | ||||||||||||||||
| Charge-off |
( |
) | ( |
) | ||||||||||||||||||||
| Disposal |
( |
) | ( |
) | ( |
) | ||||||||||||||||||
| Net increase (decrease) |
( |
) | ( |
) | ( |
) | ||||||||||||||||||
| Changes due to business combinations |
||||||||||||||||||||||||
| |
|
|
|
|
|
|
|
|
|
|
|
|||||||||||||
| Ending balance |
|
|
||||||||||||||||||||||
| |
|
|
|
|
|
|
|
|
|
|
|
|||||||||||||
For the year ended December 31, 2020 |
||||||||||||||||||||||||
Credit card accounts |
Total |
|||||||||||||||||||||||
Stage 1 |
Stage 2 |
Stage 3 |
Stage 1 |
Stage 2 |
Stage 3 |
|||||||||||||||||||
| Beginning balance |
||||||||||||||||||||||||
| Transfer to 12-month expected credit losses |
( |
) | ( |
) | ( |
) | ( |
) | ||||||||||||||||
| Transfer to lifetime expected credit losses |
( |
) | ( |
) | ( |
) | ( |
) | ||||||||||||||||
| Transfer to credit-impaired financial assets |
( |
) | ( |
) | ( |
) | ( |
) | ||||||||||||||||
| Charge-off |
( |
) | ( |
) | ||||||||||||||||||||
| Disposal |
( |
) | ( |
) | ( |
) | ||||||||||||||||||
| Net increase (decrease) |
( |
) | ||||||||||||||||||||||
| Changes due to business combinations |
||||||||||||||||||||||||
| |
|
|
|
|
|
|
|
|
|
|
|
|||||||||||||
| Ending balance |
|
|
||||||||||||||||||||||
| |
|
|
|
|
|
|
|
|
|
|
|
|||||||||||||
For the year ended December 31, 2021 |
||||||||||||||||||||||||
Consumers |
Corporates |
|||||||||||||||||||||||
Stage 1 |
Stage 2 |
Stage 3 |
Stage 1 |
Stage 2 |
Stage 3 |
|||||||||||||||||||
| Beginning balance |
||||||||||||||||||||||||
| Transfer to 12-month expected credit losses |
( |
) | ( |
) | ( |
) | ( |
) | ||||||||||||||||
| Transfer to lifetime expected credit losses |
( |
) | ( |
) | ( |
) | ( |
) | ||||||||||||||||
| Transfer to credit-impaired financial assets |
( |
) | ( |
) | ( |
) | ( |
) | ||||||||||||||||
| Charge-off |
( |
) | ( |
) | ||||||||||||||||||||
| Disposal |
( |
) | ( |
) | ||||||||||||||||||||
| Net increase (decrease) |
( |
) | ( |
) | ( |
) | ||||||||||||||||||
| |
|
|
|
|
|
|
|
|
|
|
|
|||||||||||||
| Ending balance |
|
|
||||||||||||||||||||||
| |
|
|
|
|
|
|
|
|
|
|
|
|||||||||||||
For the year ended December 31, 2021 |
||||||||||||||||||||||||
Credit card accounts |
Total |
|||||||||||||||||||||||
Stage 1 |
Stage 2 |
Stage 3 |
Stage 1 |
Stage 2 |
Stage 3 |
|||||||||||||||||||
| Beginning balance |
||||||||||||||||||||||||
| Transfer to 12-month expected credit losses |
( |
) | ( |
) | ( |
) | ( |
) | ||||||||||||||||
| Transfer to lifetime expected credit losses |
( |
) | ( |
) | ( |
) | ( |
) | ||||||||||||||||
| Transfer to credit-impaired financial assets |
( |
) | ( |
) | ( |
) | ( |
) | ||||||||||||||||
| Charge-off |
( |
) | ( |
) | ||||||||||||||||||||
| Disposal |
( |
) | ( |
) | ||||||||||||||||||||
| Net increase (decrease) |
( |
) | ||||||||||||||||||||||
| |
|
|
|
|
|
|
|
|
|
|
|
|||||||||||||
| Ending balance |
|
|
||||||||||||||||||||||
| |
|
|
|
|
|
|
|
|
|
|
|
|||||||||||||
For the year ended December 31, 2022 |
||||||||||||||||||||||||||||
Consumers |
Corporates |
|||||||||||||||||||||||||||
Stage 1 |
Stage 2 |
Stage 3 |
Stage 1 |
Stage 2 |
Stage 3 |
Credit impairment model |
||||||||||||||||||||||
| Beginning balance |
|
|
— |
| ||||||||||||||||||||||||
| Transfer to 12-month expected credit losses |
( |
) |
( |
) |
( |
) |
( |
) |
|
|
— |
| ||||||||||||||||
| Transfer to lifetime expected credit losses |
( |
) |
( |
) |
( |
) |
( |
) |
|
|
— |
| ||||||||||||||||
| Transfer to credit-impaired financial assets |
( |
) |
( |
) |
( |
) |
( |
) |
|
|
— |
| ||||||||||||||||
| Charge-off |
( |
) |
( |
) |
|
|
— |
| ||||||||||||||||||||
| Disposal |
( |
) |
( |
) |
( |
) |
( |
) |
( |
) |
|
|
— |
| ||||||||||||||
| Net increase (decrease) |
( |
) |
( |
) |
( |
) |
|
|
| |||||||||||||||||||
| Changes due to business combinations |
|
|
— |
| ||||||||||||||||||||||||
| Ending balance |
|
|
| |||||||||||||||||||||||||
| |
|
|
|
|
|
|
|
|
|
|
|
|
|
|
|
|
|
|
|
|
|
|
|
|
|
|
|
|
For the year ended December 31, 2022 |
||||||||||||||||||||||||||||
Credit card accounts |
Total |
|||||||||||||||||||||||||||
Stage 1 |
Stage 2 |
Stage 3 |
Stage 1 |
Stage 2 |
Stage 3 |
Credit impairment model |
||||||||||||||||||||||
| Beginning balance |
|
|
— |
| ||||||||||||||||||||||||
| Transfer to 12-month expected credit losses |
( |
) |
( |
) |
( |
) |
( |
) |
|
|
— |
| ||||||||||||||||
| Transfer to lifetime expected credit losses |
( |
) |
( |
) |
( |
) |
( |
) |
|
|
— |
| ||||||||||||||||
| Transfer to credit-impaired financial assets |
( |
) |
( |
) |
( |
) |
( |
) |
|
|
— |
| ||||||||||||||||
| Charge-off |
( |
) |
( |
) |
|
|
— |
| ||||||||||||||||||||
| Disposal |
( |
) |
( |
) |
( |
) |
( |
) |
|
|
— |
| ||||||||||||||||
| Net increase (decrease) |
( |
) |
( |
) |
|
|
|
| ||||||||||||||||||||
| Changes due to business combinations |
|
|
— |
| ||||||||||||||||||||||||
| Ending balance |
|
|
|
| ||||||||||||||||||||||||
| |
|
|
|
|
|
|
|
|
|
|
|
|
|
|
|
|
|
|
|
|
|
|
|
|
|
|
|
|
December 31, 2021 |
December 31, 2022 |
|||||||
| Cash Management Account asset (CMA asset) |
||||||||
| Receivables |
||||||||
| Accrued income |
||||||||
| Telex and telephone subscription rights and refundable deposits |
||||||||
| Domestic exchange settlement debit |
||||||||
| Other assets (*) |
||||||||
| Allowance for credit losses |
( |
) | ( |
) | ||||
| |
|
|
|
|||||
| Total |
||||||||
| |
|
|
|
|||||
(*) |
The Group became aware of employee embezzlement incidents that occurred before the end of April 2022, and the Financial Supervisory Service conducted on-site inspections from April 28 to May 30, 2022. An |
accusation of embezzlement and provisional seizure of found property were made . The related amount included in other assets amounted to |
For the year ended December 31, 2020 |
||||||||||||||||
Stage 1 |
Stage 2 |
Stage 3 |
Total |
|||||||||||||
| Beginning balance |
( |
) | ( |
) | ( |
) | ( |
) | ||||||||
| Transfer to 12-month expected credit losses |
( |
) | ||||||||||||||
| Transfer to lifetime expected credit losses |
|
( |
) | |||||||||||||
| Transfer to credit-impaired financial assets |
( |
) | ||||||||||||||
| Provision of allowance for credit losses |
( |
) | ( |
) | ( |
) | ( |
) | ||||||||
| Charge-off |
|
|||||||||||||||
| Disposal |
|
|||||||||||||||
| Changes due to business combination |
( |
) | ( |
) | ( |
) | ( |
) | ||||||||
| Others |
( |
) | |
|||||||||||||
| |
|
|
|
|
|
|
|
|||||||||
| Ending balance |
( |
) | ( |
) | ( |
) | ( |
) | ||||||||
| |
|
|
|
|
|
|
|
|||||||||
For the year ended December 31, 2021 |
||||||||||||||||
Stage 1 |
Stage 2 |
Stage 3 |
Total |
|||||||||||||
| Beginning balance |
( |
) | ( |
) | ( |
) | ( |
) | ||||||||
| Transfer to 12-month expected credit losses |
( |
) | ||||||||||||||
| Transfer to lifetime expected credit losses |
|
( |
) | |||||||||||||
| Transfer to credit-impaired financial assets |
( |
) | ||||||||||||||
| Reversal (provision) of loss allowance |
( |
) | |
|||||||||||||
| Charge-off |
|
|
||||||||||||||
| Disposal |
||||||||||||||||
| Others |
( |
) | |
|||||||||||||
| |
|
|
|
|
|
|
|
|||||||||
| Ending balance |
( |
) | ( |
) | ( |
) | ( |
) | ||||||||
| |
|
|
|
|
|
|
|
|||||||||
For the year ended December 31, 2022 |
||||||||||||||||
Stage 1 |
Stage 2 |
Stage 3 |
Total |
|||||||||||||
| Beginning balance |
( |
) | ( |
) | ( |
) | ( |
) | ||||||||
| Transfer to 12-month expected credit losses |
( |
) | ||||||||||||||
| Transfer to lifetime expected credit losses |
( |
) | ||||||||||||||
| Transfer to credit-impaired financial assets |
|
( |
) | |||||||||||||
| Reversal (provision) of loss allowance |
( |
) | ( |
) | ( |
) | ( |
) | ||||||||
| Charge-off |
|
|
||||||||||||||
| Disposal |
|
|||||||||||||||
| Others |
( |
) | ( |
) | ( |
) | ||||||||||
| |
|
|
|
|
|
|
|
|||||||||
| Ending balance |
( |
) | ( |
) | ( |
) | ( |
) | ||||||||
| |
|
|
|
|
|
|
|
|||||||||
For the year ended December 31, 2020 |
||||||||||||||||
Stage 1 |
Stage 2 |
Stage 3 |
Total |
|||||||||||||
| Beginning balance |
||||||||||||||||
| Transfer to 12-month expected credit losses |
( |
) | ( |
) | ||||||||||||
| Transfer to lifetime expected credit losses |
( |
) | ( |
) | ||||||||||||
| Transfer to credit-impaired financial assets |
( |
) | ( |
) | |
|||||||||||
| Charge-off |
( |
) | ( |
) | ||||||||||||
| Disposal |
|
|
( |
) | ( |
) | ||||||||||
| Net increase (decrease) |
( |
) | ( |
) | ( |
) | ||||||||||
| Changes due to business combination |
|
|||||||||||||||
| |
|
|
|
|
|
|
|
|||||||||
| Ending balance |
||||||||||||||||
| |
|
|
|
|
|
|
|
|||||||||
For the year ended December 31, 2021 |
||||||||||||||||
Stage 1 |
Stage 2 |
Stage 3 |
Total |
|||||||||||||
| Beginning balance |
||||||||||||||||
| Transfer to 12-month expected credit losses |
( |
) | ( |
) | ||||||||||||
| Transfer to lifetime expected credit losses |
( |
) | ( |
) | ||||||||||||
| Transfer to credit-impaired financial assets |
( |
) | ( |
) | |
|
||||||||||
| Charge-off |
|
|
( |
) | ( |
) | ||||||||||
| Disposal |
( |
) | ( |
) | ||||||||||||
| Net increase (decrease) |
( |
) | ||||||||||||||
| |
|
|
|
|
|
|
|
|||||||||
| Ending balance |
||||||||||||||||
| |
|
|
|
|
|
|
|
|||||||||
For the year ended December 31, 2022 |
||||||||||||||||
Stage 1 |
Stage 2 |
Stage 3 |
Total |
|||||||||||||
| Beginning balance |
||||||||||||||||
| Transfer to 12-month expected credit losses |
( |
) | ( |
) | ||||||||||||
| Transfer to lifetime expected credit losses |
( |
) | ( |
) | ||||||||||||
| Transfer to credit-impaired financial assets |
( |
) | ( |
) | |
|
||||||||||
| Charge-off |
|
|
||||||||||||||
| Disposal |
( |
) | ( |
) | ( |
) | ||||||||||
| Net increase (decrease) |
( |
) | ( |
) | ( |
) | ( |
) | ||||||||
| Changes due to business combinations |
||||||||||||||||
| |
|
|
|
|
|
|
|
|||||||||
| Ending balance |
||||||||||||||||
| |
|
|
|
|
|
|
|
|||||||||
| (1) | The fair value hierarchy |
| • | Level 1—fair value measurements are those derived from quoted prices (unadjusted) in active markets for identical assets or liabilities. The types of financial assets or liabilities generally included in Level 1 are publicly traded equity securities, derivatives, and debt securities issued by governmental bodies. |
| • | Level 2—fair value measurements are those derived from inputs other than quoted prices included within Level 1 that are observable for the asset or liability, either directly (i.e. prices) or indirectly (i.e. derived from prices). The types of financial assets or liabilities generally included in Level 2 are debt securities not traded in active markets and derivatives traded in OTC but not required significant judgment. |
| • | Level 3—fair value measurements are those derived from valuation technique that include inputs for the assets or liabilities that are not based on observable market data (unobservable inputs). The types of financial assets or liabilities generally included in Level 3 are non-public securities and derivatives and debt securities of which valuation techniques require significant judgments and subjectivity. |
December 31, 2021 |
||||||||||||||||
Level 1 (*) |
Level 2 (*) |
Level 3 |
Total |
|||||||||||||
| Financial assets: |
||||||||||||||||
| Financial assets at FVTPL |
||||||||||||||||
| Deposits |
||||||||||||||||
| Debt securities |
||||||||||||||||
| Equity securities |
||||||||||||||||
| Capital contributions |
||||||||||||||||
| Beneficiary certificates |
||||||||||||||||
| Loans |
||||||||||||||||
| Derivative assets |
||||||||||||||||
| Others |
||||||||||||||||
| |
|
|
|
|
|
|
|
|||||||||
| Sub-total |
||||||||||||||||
| |
|
|
|
|
|
|
|
|||||||||
| Financial assets at FVTOCI |
||||||||||||||||
| Debt securities |
||||||||||||||||
| Equity securities |
||||||||||||||||
| |
|
|
|
|
|
|
|
|||||||||
| Sub-total |
||||||||||||||||
| |
|
|
|
|
|
|
|
|||||||||
| Derivative assets (Designated for hedging) |
||||||||||||||||
| |
|
|
|
|
|
|
|
|||||||||
| Total |
||||||||||||||||
| |
|
|
|
|
|
|
|
|||||||||
| Financial liabilities: |
||||||||||||||||
| Financial liabilities at FVTPL |
||||||||||||||||
| Deposits due to customers |
||||||||||||||||
| Derivative liabilities |
||||||||||||||||
| Securities sold |
||||||||||||||||
| |
|
|
|
|
|
|
|
|||||||||
| Sub-total |
||||||||||||||||
| |
|
|
|
|
|
|
|
|||||||||
| Derivative liabilities (Designated for hedging) |
||||||||||||||||
| |
|
|
|
|
|
|
|
|||||||||
| Total |
||||||||||||||||
| |
|
|
|
|
|
|
|
|||||||||
| (*) | |
December 31, 2022 |
||||||||||||||||
Level 1 (*) |
Level 2 (*) |
Level 3 |
Total |
|||||||||||||
| Financial assets: |
||||||||||||||||
| Financial assets at FVTPL |
||||||||||||||||
| Deposits |
||||||||||||||||
| Debt securities |
||||||||||||||||
| Equity securities |
||||||||||||||||
| Capital contributions |
||||||||||||||||
| Beneficiary certificates |
||||||||||||||||
| Loans |
||||||||||||||||
| Derivative assets |
||||||||||||||||
| Other financial assets in foreign currency |
||||||||||||||||
| Others |
||||||||||||||||
| |
|
|
|
|
|
|
|
|||||||||
| Sub-total |
||||||||||||||||
| |
|
|
|
|
|
|
|
|||||||||
| Financial assets at FVTOCI |
||||||||||||||||
| Debt securities |
||||||||||||||||
| Equity securities |
||||||||||||||||
| |
|
|
|
|
|
|
|
|||||||||
| Sub-total |
||||||||||||||||
| |
|
|
|
|
|
|
|
|||||||||
| Derivative assets (designated for hedging) |
||||||||||||||||
| |
|
|
|
|
|
|
|
|||||||||
| Total |
||||||||||||||||
| |
|
|
|
|
|
|
|
|||||||||
| Financial liabilities: |
||||||||||||||||
| Financial liabilities at FVTPL |
||||||||||||||||
| Deposits due to customers |
||||||||||||||||
| Derivative liabilities |
||||||||||||||||
| Securities sold |
||||||||||||||||
| |
|
|
|
|
|
|
|
|||||||||
| Sub-total |
||||||||||||||||
| |
|
|
|
|
|
|
|
|||||||||
| Derivative liabilities (designated for hedging) |
||||||||||||||||
| |
|
|
|
|
|
|
|
|||||||||
| Total |
||||||||||||||||
| |
|
|
|
|
|
|
|
|||||||||
| (*) | 2,835,187 million Won. The Group recognizes transfers among levels at the end of reporting period in which events have occurred or conditions have changed. A change in the judgement of the active market where the financial product was traded resulted the transfer between levels. |
| Valuation methods |
Input variables | |||
| Debt securities | ||||
| Beneficiary certificates |
||||
| Derivatives |
||||
| Loans | ||||
| Valuation methods |
Input variables | |||
| Loans | , | |||
| Debt securities | ||||
| Equity securities, capital contributions and Beneficiary certificates | ||||
| Derivatives |
||||
| Others | ||||
Fair value measurement technique |
Type |
Significant unobservable inputs |
Range(%) |
Impact of changes in significant unobservable inputs on fair value measurement | ||||||
Loans |
Binomial Tree | Stock prices | ||||||||
| DCF model | Discount rate | |||||||||
Derivative assets |
Option valuation model and others | Equity related | Correlation coefficient | |||||||
Derivative liabilities |
Option valuation model and others | Equity related | Correlation coefficient | |||||||
| Volatility of underlying asset | ||||||||||
Equity securities, capital contributions, and beneficiary certificates |
Binomial Tree | Stock prices, Volatility of underlying asset | ||||||||
| DCF model and others | Discount rate | |||||||||
| Terminal growth rate | ||||||||||
| Liquidation value | ||||||||||
| Others | Binomial Tree | Stock prices, Volatility of underlying asset | ||||||||
For the year ended December 31, 2020 |
||||||||||||||||||||||||||||||||
Beginning balance |
Business combination |
Net income (loss) (*1) |
Other comprehensive income |
Purchases/ issuances |
Disposals / settlements |
Transfer to or out of Level 3 (*2) |
Ending balance |
|||||||||||||||||||||||||
Financial assets: |
||||||||||||||||||||||||||||||||
Financial assets at FVTPL |
||||||||||||||||||||||||||||||||
Debt securities |
( |
) | ( |
) | ||||||||||||||||||||||||||||
Equity securities |
( |
) | ( |
) | ||||||||||||||||||||||||||||
Capital contributions |
( |
) | ||||||||||||||||||||||||||||||
Beneficiary certificates |
( |
) | ( |
) | ||||||||||||||||||||||||||||
Loans |
( |
) | ||||||||||||||||||||||||||||||
Derivative assets |
( |
) | ( |
) | ||||||||||||||||||||||||||||
Others |
( |
) | ||||||||||||||||||||||||||||||
Sub-total |
( |
) | ( |
) | ||||||||||||||||||||||||||||
Financial assets at FVTOCI |
||||||||||||||||||||||||||||||||
Equity securities |
( |
) | ( |
) | ||||||||||||||||||||||||||||
Total |
( |
) | ( |
) | ( |
) | ||||||||||||||||||||||||||
Financial liabilities: |
||||||||||||||||||||||||||||||||
Financial liabilities at FVTPL |
||||||||||||||||||||||||||||||||
Derivative liabilities |
( |
) | ( |
) | ||||||||||||||||||||||||||||
Financial liabilities at FVTPL designated as upon initial recognition |
||||||||||||||||||||||||||||||||
Equity-linked securities |
( |
) | ||||||||||||||||||||||||||||||
Derivative liabilities (designated for hedging) |
( |
) | ||||||||||||||||||||||||||||||
Total |
( |
) | ( |
) | ||||||||||||||||||||||||||||
| (*1) |
| (*2) | There were transfers between levels as the availability of observable market data for these financial instruments changed. |
For the year ended December 31, 2021 |
||||||||||||||||||||||||||||
Beginning balance |
Net income (loss) (*1) |
Other comprehensive income |
Purchases/ issuances |
Disposals / settlements |
Transfer to or out of Level 3 (*2) |
Ending balance |
||||||||||||||||||||||
| Financial assets: |
||||||||||||||||||||||||||||
| Financial assets at FVTPL |
||||||||||||||||||||||||||||
| Debt securities |
( |
) | ( |
) | ||||||||||||||||||||||||
| Equity securities |
( |
) | ( |
) | ( |
) | ||||||||||||||||||||||
| Capital contributions |
( |
) | ||||||||||||||||||||||||||
| Beneficiary certificates |
( |
) | ||||||||||||||||||||||||||
| Loans |
( |
) | ||||||||||||||||||||||||||
| Derivative assets |
( |
) | ||||||||||||||||||||||||||
| Others |
( |
) | ||||||||||||||||||||||||||
| |
|
|
|
|
|
|
|
|
|
|
|
|
|
|||||||||||||||
| Sub-total |
( |
) | ( |
) | ||||||||||||||||||||||||
| |
|
|
|
|
|
|
|
|
|
|
|
|
|
|||||||||||||||
| Financial assets at FVTOCI |
||||||||||||||||||||||||||||
| Equity securities |
( |
) | ||||||||||||||||||||||||||
| |
|
|
|
|
|
|
|
|
|
|
|
|
|
|||||||||||||||
| Total |
( |
) | ( |
) | ||||||||||||||||||||||||
| |
|
|
|
|
|
|
|
|
|
|
|
|
|
|||||||||||||||
| Financial liabilities: |
||||||||||||||||||||||||||||
| Financial liabilities at FVTPL |
||||||||||||||||||||||||||||
| Derivative liabilities |
( |
) | ( |
) | ( |
) | ||||||||||||||||||||||
| Financial liabilities at FVTPL designated as upon initial recognition |
||||||||||||||||||||||||||||
| Equity-linked securities |
( |
) | ( |
) | ||||||||||||||||||||||||
| |
|
|
|
|
|
|
|
|
|
|
|
|
|
|||||||||||||||
| Total |
( |
) | ( |
) | ( |
) | ||||||||||||||||||||||
| |
|
|
|
|
|
|
|
|
|
|
|
|
|
|||||||||||||||
| (*1) | |
| (*2) | There were transfers between levels as the availability of observable market data for these financial instruments changed. The Group recognizes transfers among levels at the end of reporting period in which events have occurred or conditions have changed. |
For the year ended December 31, 2022 |
||||||||||||||||||||||||||||
Beginning balance |
Net income (loss) (*1) |
Other comprehensive income |
Purchases/ issuances |
Disposals / settlements |
Transfer to or out of Level 3 (*2) |
Ending balance |
||||||||||||||||||||||
| Financial assets: |
||||||||||||||||||||||||||||
| Financial assets at FVTPL |
||||||||||||||||||||||||||||
| Debt securities |
( |
) | ( |
) | ||||||||||||||||||||||||
| Equity securities |
( |
) | ( |
) | ||||||||||||||||||||||||
| Capital contributions |
( |
) | ||||||||||||||||||||||||||
| Beneficiary certificates |
( |
) | ||||||||||||||||||||||||||
| Loans |
( |
) | ||||||||||||||||||||||||||
| Derivative assets |
( |
) | ||||||||||||||||||||||||||
| Other foreign currency financial assets |
— |
|||||||||||||||||||||||||||
| Others |
— |
( |
) | |||||||||||||||||||||||||
| |
|
|
|
|
|
|
|
|
|
|
|
|
|
|||||||||||||||
| Sub-total |
( |
) | ( |
) | ||||||||||||||||||||||||
| |
|
|
|
|
|
|
|
|
|
|
|
|
|
|||||||||||||||
| Financial assets at FVTOCI |
||||||||||||||||||||||||||||
| Equity securities |
( |
) | ||||||||||||||||||||||||||
| |
|
|
|
|
|
|
|
|
|
|
|
|
|
|||||||||||||||
| Total |
( |
) | ( |
) | ||||||||||||||||||||||||
| |
|
|
|
|
|
|
|
|
|
|
|
|
|
|||||||||||||||
| Financial liabilities: |
||||||||||||||||||||||||||||
| Financial liabilities at FVTPL |
||||||||||||||||||||||||||||
| Derivative liabilities |
( |
) | ( |
) | ||||||||||||||||||||||||
| |
|
|
|
|
|
|
|
|
|
|
|
|
|
|||||||||||||||
| Total |
( |
) | ( |
) | ||||||||||||||||||||||||
| |
|
|
|
|
|
|
|
|
|
|
|
|
|
|||||||||||||||
| (*1) | |
| (*2) | |
December 31, 2020 |
||||||||||||||||
Net income (loss) |
Other comprehensive income (loss) |
|||||||||||||||
Favorable |
Unfavorable |
Favorable |
Unfavorable |
|||||||||||||
| Financial assets: |
||||||||||||||||
| Financial assets at FVTPL |
||||||||||||||||
| Derivative assets (*1) |
( |
) | ||||||||||||||
| Loans (*2) |
( |
) | ||||||||||||||
| Debt securities |
( |
) | ||||||||||||||
| Equity securities (*2)(*3)(*4) |
( |
) | ||||||||||||||
| Beneficiary certificates (*4) |
( |
) | ||||||||||||||
| Others (*2) |
( |
) | ||||||||||||||
| Financial assets at FVTOCI |
||||||||||||||||
| Equity securities (*3)(*4) |
( |
) | ||||||||||||||
| |
|
|
|
|
|
|
|
|||||||||
| Total |
( |
) | ( |
) | ||||||||||||
| |
|
|
|
|
|
|
|
|||||||||
| Financial liabilities: |
||||||||||||||||
| Financial liabilities at FVTPL |
||||||||||||||||
| Derivative liabilities (*1) |
( |
) | ||||||||||||||
| Financial liabilities at FVTPL designated as upon initial recognition |
||||||||||||||||
| Equity-linked securities (*1) |
( |
) | ||||||||||||||
| |
|
|
|
|
|
|
|
|||||||||
| Total |
( |
) | ||||||||||||||
| |
|
|
|
|
|
|
|
|||||||||
| (*1) | |
| (*2) | (-10%~10%) and volatility (-10~10%). The stock prices and volatility are major unobservable variables. |
| (*3) | (0~1%) and discount rate (-1~1%) or liquidation value (-1~1%). The growth rate, discount rate, and liquidation value are major unobservable variables. |
| (*4) | |
December 31, 2021 |
||||||||||||||||
Net income (loss) |
Other comprehensive income (loss) |
|||||||||||||||
Favorable |
Unfavorable |
Favorable |
Unfavorable |
|||||||||||||
| Financial assets: |
||||||||||||||||
| Financial assets at FVTPL |
||||||||||||||||
| Derivative assets (*1) |
( |
) | ||||||||||||||
| Loans (*2) |
( |
) | ||||||||||||||
| Debt securities |
( |
) | ||||||||||||||
| Equity securities (*2)(*3)(*4) |
( |
) | ||||||||||||||
| Beneficiary certificates (*4) |
( |
) | ||||||||||||||
| Others (*2) |
( |
) | ||||||||||||||
| Financial assets at FVTOCI |
||||||||||||||||
| Equity securities (*3)(*4) |
( |
) | ||||||||||||||
| |
|
|
|
|
|
|
|
|||||||||
| Total |
( |
) | ( |
) | ||||||||||||
| |
|
|
|
|
|
|
|
|||||||||
| Financial liabilities: |
||||||||||||||||
| Financial liabilities at FVTPL |
||||||||||||||||
| Derivative liabilities (*1) |
( |
) | ||||||||||||||
| |
|
|
|
|
|
|
|
|||||||||
| Total |
( |
) | ||||||||||||||
| |
|
|
|
|
|
|
|
|||||||||
| (*1) | |
| (*2) | (-10%~10%) and volatility (-10~10%). The stock prices and volatility are major unobservable variables. |
| (*3) | or decreasing terminal growth rate (-0.5%~0.5%) and discount rate (-1~1%) or liquidation value (-1~1%). The growth rate, discount rate, and liquidation value are major unobservable variables. |
| (*4) | |
December 31, 2022 |
||||||||||||||||
Net income (loss) |
Other comprehensive income (loss) |
|||||||||||||||
Favorable |
Unfavorable |
Favorable |
Unfavorable |
|||||||||||||
| Financial assets: |
||||||||||||||||
| Financial assets at FVTPL |
||||||||||||||||
| Derivative assets (*1) |
( |
) | ||||||||||||||
| Loans (*2) |
( |
) | ||||||||||||||
| Debt securities |
||||||||||||||||
| Equity securities (*2)(*3)(*4) |
( |
) | ||||||||||||||
| Beneficiary certificates (*4) |
( |
) | ||||||||||||||
| Others (*2) |
( |
) | ||||||||||||||
| Financial assets at FVTOCI |
— | — | — | — | ||||||||||||
| Equity securities (*3)(*4) |
( |
) | ||||||||||||||
| |
|
|
|
|
|
|
|
|||||||||
| Total |
( |
) | ( |
) | ||||||||||||
| |
|
|
|
|
|
|
|
|||||||||
| Financial liabilities: |
||||||||||||||||
| Financial liabilities at FVTPL |
||||||||||||||||
| Derivative liabilities (*1) |
( |
) | ||||||||||||||
| |
|
|
|
|
|
|
|
|||||||||
| Total |
( |
) | ||||||||||||||
| |
|
|
|
|
|
|
|
|||||||||
| (*1) | |
| (*2) | (-10%~10%) and volatility (-10~10%). The stock prices and volatility are major unobservable variables. |
| (*3) | Fair value changes of equity securities are calculated by increasing or decreasing terminal growth rate (-0.5%~0.5%) and discount rate (-1~1%) or liquidation value (-1~1%). The growth rate, discount rate, and liquidation value are major unobservable variables. |
| (*4) | |
December 31, 2021 |
||||||||||||||||||||
Fair value |
Carrying amount |
|||||||||||||||||||
Level 1 |
Level 2 |
Level 3 |
Total |
|||||||||||||||||
| Financial assets: |
||||||||||||||||||||
| Securities at amortized cost |
||||||||||||||||||||
| Loans and other financial assets at amortized cost |
||||||||||||||||||||
| Financial liabilities: |
||||||||||||||||||||
| Deposits due to customers |
||||||||||||||||||||
| Borrowings |
||||||||||||||||||||
| Debentures |
||||||||||||||||||||
| Other financial liabilities |
||||||||||||||||||||
December 31, 2022 |
||||||||||||||||||||
Fair value |
Carrying amount |
|||||||||||||||||||
Level 1 |
Level 2 |
Level 3 |
Total |
|||||||||||||||||
| Financial assets: |
||||||||||||||||||||
| Securities at amortized cost |
||||||||||||||||||||
| Loans and other financial assets at amortized cost |
||||||||||||||||||||
| Financial liabilities: |
||||||||||||||||||||
| Deposits due to customers |
||||||||||||||||||||
| Borrowings |
||||||||||||||||||||
| Debentures |
||||||||||||||||||||
| Other financial liabilities |
||||||||||||||||||||
| Valuation methods |
Input variables | |||
| Securities at amortized cost |
||||
| Loans and other financial assets at amortized cost |
||||
| Deposits due to customers, borrowings, debentures and other financial liabilities |
||||
December 31, 2021 |
||||||||||||||||||||
| Financial assets |
Financial asset at FVTPL |
Financial assets at FVTOCI |
Financial assets at amortized cost |
Derivatives assets (designated for hedging) |
Total |
|||||||||||||||
| Deposits |
||||||||||||||||||||
| Securities |
||||||||||||||||||||
| Loans |
||||||||||||||||||||
| Derivative assets |
||||||||||||||||||||
| Other financial assets |
||||||||||||||||||||
| |
|
|
|
|
|
|
|
|
|
|||||||||||
| Total |
||||||||||||||||||||
| |
|
|
|
|
|
|
|
|
|
|||||||||||
December 31, 2021 |
||||||||||||||||
| Financial liabilities |
Financial liabilities at FVTPL |
Financial liabilities at amortized cost |
Derivatives liabilities (designated for hedging) |
Total |
||||||||||||
| Deposits due to customers |
||||||||||||||||
| Borrowings |
||||||||||||||||
| Debentures |
||||||||||||||||
| Derivative liabilities |
||||||||||||||||
| Other financial liabilities |
||||||||||||||||
| |
|
|
|
|
|
|
|
|||||||||
| Total |
||||||||||||||||
| |
|
|
|
|
|
|
|
|||||||||
December 31, 2022 |
||||||||||||||||||||
| Financial assets |
Financial asset at FVTPL |
Financial assets at FVTOCI |
Financial assets at amortized cost |
Derivatives assets (designated for hedging) |
Total |
|||||||||||||||
| Deposits |
||||||||||||||||||||
| Securities |
||||||||||||||||||||
| Loans |
||||||||||||||||||||
| Derivative assets |
||||||||||||||||||||
| Other financial assets |
||||||||||||||||||||
| |
|
|
|
|
|
|
|
|
|
|||||||||||
| Total |
||||||||||||||||||||
| |
|
|
|
|
|
|
|
|
|
|||||||||||
December 31, 2022 |
||||||||||||||||
| Financial liabilities |
Financial liabilities at FVTPL |
Financial liabilities at amortized cost |
Derivatives liabilities (designated for hedging) |
Total |
||||||||||||
| Deposits due to customers |
||||||||||||||||
| Borrowings |
||||||||||||||||
| Debentures |
||||||||||||||||
| Derivative liabilities |
||||||||||||||||
| Other financial liabilities |
||||||||||||||||
| |
|
|
|
|
|
|
|
|||||||||
| Total |
||||||||||||||||
| |
|
|
|
|
|
|
|
|||||||||
For the year ended December 31, 2020 |
||||||||||||||||||||||||
Interest Income (expense) |
Fees and Commissions Income (expense) |
Reversal (provision) of credit loss |
Gain or loss on transactions and valuation |
Dividends, etc. |
Total |
|||||||||||||||||||
| Financial assets at FVTPL |
||||||||||||||||||||||||
| Financial assets at FVTOCI |
( |
) | ||||||||||||||||||||||
| Securities at amortized cost |
||||||||||||||||||||||||
| Loans and other financial assets at amortized cost |
( |
) | ||||||||||||||||||||||
| Financial liabilities at amortized cost |
( |
) | ( |
) | ||||||||||||||||||||
| Net derivatives (designated for hedging) |
( |
) | ( |
) | ||||||||||||||||||||
| |
|
|
|
|
|
|
|
|
|
|
|
|||||||||||||
| Total |
( |
) | ||||||||||||||||||||||
| |
|
|
|
|
|
|
|
|
|
|
|
|||||||||||||
For the year ended December 31, 2021 |
||||||||||||||||||||||||
Interest Income (expense) |
Fees and Commissions Income (expense) |
Reversal (provision) of credit loss |
Gain or loss on transactions and valuation |
Dividends, etc. |
Total |
|||||||||||||||||||
| Financial assets at FVTPL |
( |
) | ||||||||||||||||||||||
| Financial assets at FVTOCI |
( |
) | ||||||||||||||||||||||
| Securities at amortized cost |
( |
) | ||||||||||||||||||||||
| Loans and other financial assets at amortized cost |
( |
) | ||||||||||||||||||||||
| Financial liabilities at amortized cost |
( |
) | ( |
) | ||||||||||||||||||||
| Net derivatives (designated for hedging) |
||||||||||||||||||||||||
| |
|
|
|
|
|
|
|
|
|
|
|
|||||||||||||
| Total |
( |
) | ||||||||||||||||||||||
| |
|
|
|
|
|
|
|
|
|
|
|
|||||||||||||
For the year ended December 31, 2022 |
||||||||||||||||||||||||
Interest Income (expense) |
Fees and Commissions Income (expense) |
Reversal (provision) of credit loss |
Gain or loss on transactions and valuation |
Dividends, etc. |
Total |
|||||||||||||||||||
| Financial assets at FVTPL |
( |
) | ||||||||||||||||||||||
| Financial assets at FVTOCI |
( |
) | ||||||||||||||||||||||
| Securities at amortized cost |
( |
) | ||||||||||||||||||||||
| Loans and other financial assets at amortized cost |
( |
) | ||||||||||||||||||||||
| Financial liabilities at amortized cost |
( |
) | ( |
) | ||||||||||||||||||||
| Net derivatives (designated for hedging) |
||||||||||||||||||||||||
| |
|
|
|
|
|
|
|
|
|
|
|
|||||||||||||
| Total |
( |
) | ||||||||||||||||||||||
| |
|
|
|
|
|
|
|
|
|
|
|
|||||||||||||
December 31, 2021 |
December 31, 2022 |
|||||||||
| Assets transferred |
Financial assets at FVTPL | |||||||||
| Financial assets at FVTOCI | ||||||||||
| Securities at amortized cost |
||||||||||
| |
|
|
|
|||||||
| Total | ||||||||||
| |
|
|
|
|||||||
| Related liabilities |
Bonds sold under repurchase agreements | |||||||||
| |
|
|
|
|||||||
| 2) | Securities loaned |
December 31, 2021 |
December 31, 2022 |
Loaned to | ||||||||||
| Financial assets at FVTOCI |
Korean treasury and government bonds |
|||||||||||
| 3) | Liquidity of financial assets |
December 31, 2021 |
December 31, 2022 |
|||||||||
Carrying amount (*) |
Carrying amount (*) |
|||||||||
| Assets transferred |
Financial assets at FVPL | |||||||||
| Loans at amortized cost | ||||||||||
| Related liabilities |
Asset-backed borrowings | |||||||||
| Asset-backed bonds | ||||||||||
| (*) | The carrying amount is the amount before the allowance for bad debts. |
December 31, 2021 |
||||||||||||||||||||||||
Gross amounts of recognized financial assets |
Gross amounts of recognized financial assets setoff |
Net amounts of consolidated financial assets presented |
Related amounts not setoff in the consolidated statement of financial position |
Net amounts |
||||||||||||||||||||
Netting agreements and others |
Cash collateral received and others |
|||||||||||||||||||||||
| Financial assets: |
||||||||||||||||||||||||
| Derivative assets (*1) |
||||||||||||||||||||||||
| Receivable spot exchange (*2) |
||||||||||||||||||||||||
| Bonds purchased under resale agreements (*2) |
||||||||||||||||||||||||
| Domestic exchange settlement debits (*2)(*5) |
||||||||||||||||||||||||
| |
|
|
|
|
|
|
|
|
|
|
|
|||||||||||||
| Total |
||||||||||||||||||||||||
| |
|
|
|
|
|
|
|
|
|
|
|
|||||||||||||
| Financial liabilities: |
||||||||||||||||||||||||
| Derivative liabilities (*1) |
||||||||||||||||||||||||
| Payable spot exchange (*3) |
||||||||||||||||||||||||
| Bonds sold under repurchase agreements (*4) |
||||||||||||||||||||||||
| Domestic exchange settlement credits (*3)(*5) |
||||||||||||||||||||||||
| |
|
|
|
|
|
|
|
|
|
|
|
|||||||||||||
| Total |
||||||||||||||||||||||||
| |
|
|
|
|
|
|
|
|
|
|
|
|||||||||||||
| (*1) | The items include derivative assets and liabilities held for trading and designated for hedging. |
| (*2) | The items are included in loan at amortized cost and other financial assets. |
| (*3) | The items are included in other financial liabilities. |
| (*4) | The items are included in borrowings. |
| (*5) | Certain financial assets and liabilities are presented as net amounts. |
December 31, 2022 |
||||||||||||||||||||||||
Gross amounts of recognized financial assets |
Gross amounts of recognized financial assets setoff |
Net amounts of consolidated financial assets presented |
Related amounts not setoff in the consolidated statement of financial position |
Net amounts |
||||||||||||||||||||
Netting agreements and others |
Cash collateral received and others |
|||||||||||||||||||||||
| Financial assets: |
||||||||||||||||||||||||
| Derivative assets (*1) |
||||||||||||||||||||||||
| Receivable spot exchange (*2) |
||||||||||||||||||||||||
| Bonds purchased under resale agreements (*2) |
||||||||||||||||||||||||
| Domestic exchange settlement debits (*2)(*5) |
||||||||||||||||||||||||
| |
|
|
|
|
|
|
|
|
|
|
|
|||||||||||||
| Total |
||||||||||||||||||||||||
| |
|
|
|
|
|
|
|
|
|
|
|
|||||||||||||
| Financial liabilities: |
||||||||||||||||||||||||
| Derivative liabilities (*1) |
||||||||||||||||||||||||
| Payable spot exchange (*3) |
||||||||||||||||||||||||
| Bonds sold under repurchase agreements (*4) |
||||||||||||||||||||||||
| Domestic exchange settlement credits (*3)(*5) |
||||||||||||||||||||||||
| |
|
|
|
|
|
|
|
|
|
|
|
|||||||||||||
| Total |
||||||||||||||||||||||||
| |
|
|
|
|
|
|
|
|
|
|
|
|||||||||||||
| (*1) | The items include derivative assets and liabilities held for trading and designated for hedging. |
| (*2) | The items are included in loan at amortized cost and other financial assets. |
| (*3) | The items are included in other financial liabilities. |
| (*4) | The items are included in borrowings. |
| (*5) | Certain financial assets and liabilities are presented as net amounts. |
| (1) | Investments in associates accounted for using the equity method of accounting are as follows: |
Percentage of ownership (%) |
||||||||||||||||||
| Joint ventures and associates (*4) |
Main business |
December 31, 2021 |
December 31, 2022 |
Location |
Financial statements as of |
|||||||||||||
| |
||||||||||||||||||
| W Service Networks Co., Ltd. (*1) |
(*5) |
|||||||||||||||||
| Korea Credit Bureau Co., Ltd. (*2) |
||||||||||||||||||
| Korea Finance Security Co., Ltd. (*1) |
(*5) |
|||||||||||||||||
| Wongwang Co., Ltd. (*3) |
— | |||||||||||||||||
| Sejin Construction Co., Ltd. (*3) |
— | |||||||||||||||||
| ARES-TECH Co., Ltd. (*3) |
— | |||||||||||||||||
| Reading Doctors Co., Ltd. (*3)(*11) |
— | — | ||||||||||||||||
| Cultizm Korea LTD Co., Ltd. (*3)(*11) |
— | — | ||||||||||||||||
| NK Eng Co., Ltd. (*3) |
— | |||||||||||||||||
| Beomgyo.,Ltd. (*3) |
— | |||||||||||||||||
| Woori Growth Partnerships New Technology Private Equity Fund |
||||||||||||||||||
| 2016KIF-IMM Woori Bank Technology Venture Fund |
||||||||||||||||||
| K BANK Co., Ltd. (*2) |
||||||||||||||||||
| Woori Bank-Company K Korea Movie Asset Fund (*9) |
||||||||||||||||||
| Partner One Value Up I Private Equity Fund |
||||||||||||||||||
| IBK KIP Seongjang Dideemdol 1st Private Investment Limited Partnership |
||||||||||||||||||
| Crevisse Raim Impact 1st Startup Venture Specialist Private Equity Fund |
||||||||||||||||||
| LOTTE CARD Co., Ltd. |
(*5) |
|||||||||||||||||
| Together-Korea Government Private Pool Private Securities Investment Trust No. 3 |
||||||||||||||||||
| Genesis Environmental Energy Company 1st Private Equity Fund (*8) |
— | — |
||||||||||||||||
| Union Technology Finance Investment Association |
||||||||||||||||||
| Dicustody Co., Ltd. (*2) |
||||||||||||||||||
| Orient Shipyard Co., Ltd. (*3) |
— | |||||||||||||||||
| Joongang Network Solution Co.,Ltd. (*3) |
and computer operation related services |
— | — | |||||||||||||||
| BTS 2nd Private Equity Fund |
— | |||||||||||||||||
| STASSETS FUND III |
— | |||||||||||||||||
| (*6) |
||||||||||||||||||
| Japanese Hotel Real Estate Private Equity Fund No.2 |
||||||||||||||||||
| Woori Seoul Beltway Private Special Asset Fund No.1 |
||||||||||||||||||
| Woori Multi-Return Securities Investment Trust 3(Balanced Bond) (*8) |
— | — |
||||||||||||||||
Percentage of ownership (%) |
||||||||||||||||
| Joint ventures and associates (*4) |
Main business |
December 31, 2021 |
December 31, 2022 |
Location |
Financial statements as of | |||||||||||
| Woori Short-term Bond Securities Investment Trust(Bond) ClassC-F |
||||||||||||||||
| Woori Safe Plus General Type Private Investment Trust S-8(Bond) |
— | |||||||||||||||
| |
||||||||||||||||
| WOORI TAERIM 1st Fund |
||||||||||||||||
| Portone-Cape Fund No.1 |
||||||||||||||||
| KIWOOM WOORI Financial 1st Fund (*7) |
||||||||||||||||
| DeepDive WOORI 2021-1 Financial Investment Fund(*7) |
||||||||||||||||
| Darwin Green Packaging Private Equity Fund |
||||||||||||||||
| DS Power Semicon Private Equity Fund |
— | |||||||||||||||
| Koreawide partners 2nd Private Equity Fund |
— | |||||||||||||||
| (*6) |
||||||||||||||||
| Woori FirstValue Private Real Estate Fund No.2 |
||||||||||||||||
| WooriG Real Infrastructure Blind General Type Private Placement Investment Trust |
||||||||||||||||
| |
||||||||||||||||
| Woori BIG2 Plus Securities Investment Trust(Balanced Bond) (*12) |
— | |||||||||||||||
| Woori Together TDF 2025 (*12) |
— | |||||||||||||||
| Woori Together TDF 2030 (*12) |
— | |||||||||||||||
| Woori Star50 feeder fund(H) (*12) |
— | |||||||||||||||
| |
||||||||||||||||
| Woori Hanhwa Eureka Private Equity Fund (*10) |
— | — | ||||||||||||||
| Aarden Woori Apparel 1st Private Equity Fund (*2) |
||||||||||||||||
| Woori Dyno 1st Private Equity Fund (*2) |
— | |||||||||||||||
| Australia Green Energy 1st PEF (*2) |
— | |||||||||||||||
| |
||||||||||||||||
| Godo Kaisha Oceanos 1 |
(*5) | |||||||||||||||
| |
||||||||||||||||
| Woori Zip 1 |
(*5) | |||||||||||||||
| Woori Zip 2 |
(*5) | |||||||||||||||
| (*6) |
||||||||||||||||
| Dongwoo C & C Co., Ltd. (*3) |
— | |||||||||||||||
| SJCO Co., Ltd. (*3) |
— | |||||||||||||||
| G2 Collection Co., Ltd. (*3) |
— | |||||||||||||||
| The Base Enterprise Co., Ltd. (*3)(*11) |
— | — | ||||||||||||||
| Kyesan Engineering Co., Ltd. (*3) |
— | |||||||||||||||
| Good Software Lap Co., Ltd. (*3) |
— | |||||||||||||||
| QTS Shipping Co., Ltd. (*3)(*11) |
— | — | ||||||||||||||
| DAEA SNC Co., Ltd. (*3) |
— | |||||||||||||||
| Force TEC Co., Ltd. |
(*5) | |||||||||||||||
| PREXCO Co., Ltd. (*3) |
— | |||||||||||||||
| JiWon Plating Co., Ltd. (*3) |
— | |||||||||||||||
| Youngdong Sea Food Co., Ltd. (*3) |
— | |||||||||||||||
Percentage of ownership (%) |
||||||||||||||||
| Joint ventures and associates (*4) |
Main business |
December 31, 2021 |
December 31, 2022 |
Location |
Financial statements as of | |||||||||||
| KUM HWA Co., Ltd. |
(*5) | |||||||||||||||
| Jinmyung Plus Co., Ltd. |
(*5) | |||||||||||||||
| (*6) |
||||||||||||||||
| JC Assurance No.2 Private Equity Fund |
(*5) | |||||||||||||||
| Dream Company Growth no.1 PEF |
||||||||||||||||
| HMS-Oriens 1st Fund |
||||||||||||||||
| Woori G Senior Loan Private Placement Investment Trust No.1 |
||||||||||||||||
| Genesis Eco No.1 Private Equity Fund |
||||||||||||||||
| Paratus Woori Material Component Equipment joint venture company |
||||||||||||||||
| Midas No. 8 Private Equity Joint Venture Company |
||||||||||||||||
| Orchestra Private Equity Fund IV |
— | |||||||||||||||
| Synaptic Green No.1 PEF |
— | |||||||||||||||
| IGEN2022No. 1 Private Equity Fund |
— | |||||||||||||||
| (*6) |
||||||||||||||||
| PCC-Woori LP Secondary Fund |
||||||||||||||||
| (*6) |
||||||||||||||||
| Woori High Plus Short-term High Graded ESG Bond Sec Feeder Inv Trust 1 (*10) |
— | |||||||||||||||
| (*6) |
||||||||||||||||
| Woori-Q Corporate Restructuring Private Equity Fund |
||||||||||||||||
| ( *6) |
||||||||||||||||
| Woori-Shinyoung Growth-Cap Private Equity Fund I |
||||||||||||||||
| (*1) | |
| (*2) | |
| (*3) | |
| (*4) | |
| (*5) | |
| (*6) | |
| (*7) | co-operator to exert significant influence. |
| (*8) | |
| (*9) | |
| (*10) | It was excluded from associates during the period. |
| (*11) | It was excluded as Woori Bank sold its shares during the period. |
| (*12) | |
| (2) | Changes in the carrying value of investments in associates accounted for using the equity method of accounting are as follows (Unit: Korean Won in millions): |
For the year ended December 31, 2020 |
||||||||||||||||||||||||||||||||||||
Acquisition cost |
January 1, 2020 |
Share of profits (losses) |
Acquisition |
Disposal/ Reclassification |
Dividends |
Business combination |
Change in capital |
December 31, 2020 |
||||||||||||||||||||||||||||
| W Service Networks Co., Ltd. |
— | — | ( |
) | — | |||||||||||||||||||||||||||||||
| Korea Credit Bureau Co., Ltd. |
— | — | ( |
) | — | — | ||||||||||||||||||||||||||||||
| Korea Finance Security Co., Ltd. |
( |
) | — | — | — | — | — | |||||||||||||||||||||||||||||
| Chin Hung International Inc. |
— | ( |
) | — | ( |
) | — | — | ( |
) | — | |||||||||||||||||||||||||
| Saman Corporation |
— | ( |
) | — | ( |
) | — | — | — | |||||||||||||||||||||||||||
| Woori Growth Partnerships New Technology Private Equity Fund |
( |
) | — | ( |
) | ( |
) | — | — | |||||||||||||||||||||||||||
| 2016KIF-IMM Woori Bank Technology Venture Fund |
— | ( |
) | ( |
) | — | ( |
) | ||||||||||||||||||||||||||||
| K BANK Co., Ltd. |
( |
) | — | — | — | ( |
) | |||||||||||||||||||||||||||||
| Smart Private Equity Fund No.2 |
( |
) | — | — | — | — | — | |||||||||||||||||||||||||||||
| Woori Bank-Company K Korea Movie Asset Fund |
— | ( |
) | — | — | — | ||||||||||||||||||||||||||||||
| Well to Sea No.3 Private Equity Fund |
— | — | ( |
) | ( |
) | — | ( |
) | — | ||||||||||||||||||||||||||
| Partner One Value Up I Private Equity Fund |
( |
) | — | — | — | — | ( |
) | ||||||||||||||||||||||||||||
| IBK KIP Seongjang Dideemdol 1st Private Investment Limited Partnership |
— | ( |
) | — | — | — | ||||||||||||||||||||||||||||||
| Crevisse Raim Impact 1st Startup Venture Specialist Private Equity Fund |
— | ( |
) | — | — | — | ||||||||||||||||||||||||||||||
| Woori-Shinyoung Growth-Cap Private Equity Fund I |
( |
) | ( |
) | — | — | ||||||||||||||||||||||||||||||
| LOTTE CARD Co.,Ltd. |
— | ( |
) | — | ( |
) | ||||||||||||||||||||||||||||||
| Woori-Q Corporate Restructuring Private Equity Fund |
( |
) | — | — | — | — | ||||||||||||||||||||||||||||||
| PCC-Woori LP Secondary Fund |
— | — | — | — | ||||||||||||||||||||||||||||||||
| Force TEC Co., Ltd. |
— | — | — | — | — | — | ( |
) | ||||||||||||||||||||||||||||
| Together-Korea Government Private Pool Private Securities Investment Trust No.3 |
— | ( |
) | — | — | — | ||||||||||||||||||||||||||||||
| Genesis Environmental Energy Company 1st Private Equity Fund |
— | ( |
) | — | — | — | ||||||||||||||||||||||||||||||
| Union Technology Finance Investment Association |
— | ( |
) | — | — | — | — | |||||||||||||||||||||||||||||
| Woori Hanhwa Eureka Private Equity Fund |
— | — | — | — | — | |||||||||||||||||||||||||||||||
| Godo Kaisha Oceanos 1 |
— | — | ( |
) | — | |||||||||||||||||||||||||||||||
| Japanese Hotel Real Estate Private Equity Fund No.2 |
— | — | ( |
) | — | ( |
) | |||||||||||||||||||||||||||||
| Woori High plus G.B. Securities Feeder Fund1(G.B.) |
— | — | — | — | ( |
) | ||||||||||||||||||||||||||||||
| WooriG Senior Loan General Type Private Investment Trust No.1 |
— | — | ( |
) | — | — | ||||||||||||||||||||||||||||||
| Woori G Clean Energy No.1 |
— | — | — | — | — | |||||||||||||||||||||||||||||||
For the year ended December 31, 2020 |
||||||||||||||||||||||||||||||||||||
Acquisition cost |
January 1, 2020 |
Share of profits (losses) |
Acquisition |
Disposal/ Reclassification |
Dividends |
Business combination |
Change in capital |
December 31, 2020 |
||||||||||||||||||||||||||||
| Woori Goseong Power EBL Private Special Asset Fund |
— | — | ( |
) | — | — | ||||||||||||||||||||||||||||||
| Woori Seoul Beltway Private Special Asset Fund No.1 |
— | — | ( |
) | — | — | ||||||||||||||||||||||||||||||
| WOORI TAERIM 1st Fund |
— | ( |
) | — | — | — | — | |||||||||||||||||||||||||||||
| Portone-Cape Fund No.1 |
— | — | — | — | — | — | ||||||||||||||||||||||||||||||
| KIWOOM WOORI Financial 1st Investment Fund |
— | ( |
) | — | — | — | — | |||||||||||||||||||||||||||||
| Woori FirstValue Private Real Estate Fund No.2 |
— | — | — | — | — | |||||||||||||||||||||||||||||||
| Woori Star50 Master Fund ClassC-F |
— | ( |
) | — | — | — | — | |||||||||||||||||||||||||||||
| JC Assurance No.2 Private Equity Fund |
— | — | — | — | — | — | ||||||||||||||||||||||||||||||
| Dream Company Growth no.1 PEF |
— | — | — | — | — | — | ||||||||||||||||||||||||||||||
| HMS-Oriens 1st Fund |
— | — | — | — | — | — | ||||||||||||||||||||||||||||||
| Woori High Plus Short-term High Graded ESG Bond Sec Feeder Inv Trust 1 |
— | — | — | — | — | |||||||||||||||||||||||||||||||
| |
|
|
|
|
|
|
|
|
|
|
|
|
|
|
|
|
|
|||||||||||||||||||
| ( |
) | ( |
) | ( |
) | |||||||||||||||||||||||||||||||
| |
|
|
|
|
|
|
|
|
|
|
|
|
|
|
|
|
|
|||||||||||||||||||
For the year ended December 31, 2021 |
||||||||||||||||||||||||||||||||
Acquisition cost |
January 1, 2021 |
Share of profits (losses) |
Acquisition |
Disposal/ Reclassification |
Dividends |
Change in capital |
December 31, 2021 |
|||||||||||||||||||||||||
| W Service Networks Co., Ltd. |
( |
) | — | — | ( |
) | — | |||||||||||||||||||||||||
| Korea Credit Bureau Co., Ltd. |
— | — | ( |
) | — | |||||||||||||||||||||||||||
| Korea Finance Security Co., Ltd. |
— | — | — | — | ||||||||||||||||||||||||||||
| Woori Growth Partnerships New Technology Private Equity Fund |
( |
) | — | ( |
) | — | — | |||||||||||||||||||||||||
| 2016KIF-IMM Woori Bank Technology Venture Fund |
— | ( |
) | ( |
) | — | ||||||||||||||||||||||||||
| K BANK Co., Ltd. (*1) |
— | — | — | ( |
) | |||||||||||||||||||||||||||
| Smart Private Equity Fund No.2 |
— | ( |
) | — | ( |
) | — | — | — | |||||||||||||||||||||||
| Woori Bank-Company K Korea Movie Asset Fund |
— | — | ( |
) | ( |
) | — | |||||||||||||||||||||||||
| Partner One Value Up I Private Equity Fund |
— | ( |
) | ( |
) | — | ||||||||||||||||||||||||||
| IBK KIP Seongjang Dideemdol 1st Private Investment Limited Partnership |
( |
) | — | — | ||||||||||||||||||||||||||||
| Crevisse Raim Impact 1st Startup Venture Specialist Private Equity Fund |
— | — | — | — | ||||||||||||||||||||||||||||
| LOTTE CARD Co.,Ltd. |
— | — | ( |
) | ||||||||||||||||||||||||||||
| Together-Korea Government Private Pool Private Securities Investment Trust No. 3 |
— | — | — | — | ||||||||||||||||||||||||||||
| Genesis Environmental Energy Company 1st Private Equity Fund |
— | — | — | — | ||||||||||||||||||||||||||||
| Union Technology Finance Investment Association |
( |
) | — | — | — | |||||||||||||||||||||||||||
| Dicustody Co., Ltd. |
— | — | — | — | — | |||||||||||||||||||||||||||
| Japanese Hotel Real Estate Private Equity Fund No.2 |
— | — | ( |
) | ( |
) | ||||||||||||||||||||||||||
| Woori G Clean Energy No.1 |
— | — | ( |
) | ( |
) | — | — | ||||||||||||||||||||||||
| Woori Goseong Power EBL Private Special Asset Fund |
— | — | ( |
) | ( |
) | — | |||||||||||||||||||||||||
| Woori Seoul Beltway Private Special Asset Fund No.1 |
— | ( |
) | — | ||||||||||||||||||||||||||||
| Woori Corporate Private Securities Fund 1 (Bond) |
— | — | — | ( |
) | — | — | — | ||||||||||||||||||||||||
| Woori G Star Private Placement Investment Trust No.33 [FI] |
— | — | — | ( |
) | — | — | — | ||||||||||||||||||||||||
| Woori Multi-Return Securities Investment Trust 3 (Balanced Bond) |
— | — | — | — | ||||||||||||||||||||||||||||
| Woori Short-term Bond Securities Investment Trust(Bond) ClassC-F |
— | — | — | — | ||||||||||||||||||||||||||||
| WOORI TAERIM 1st Fund |
— | — | — | — | ||||||||||||||||||||||||||||
| Portone-Cape Fund No.1 |
— | ( |
) | — | — | |||||||||||||||||||||||||||
| KIWOOM WOORI Financial 1st Investment Fund |
( |
) | — | — | — | — | ||||||||||||||||||||||||||
| DeepDive WOORI 2021-1 Financial Investment Fund |
— | ( |
) | — | — | — | ||||||||||||||||||||||||||
| Darwin Green Packaging Private Equity Fund |
— | ( |
) | — | — | — | ||||||||||||||||||||||||||
| Woori FirstValue Private Real Estate Fund No.2 |
( |
) | — | — | ( |
) | — | |||||||||||||||||||||||||
| WooriG Real Infrastructure Blind General Type Private Placement Investment Trust |
— | — | — | — | — | |||||||||||||||||||||||||||
| Woori High plus G.B. Securities Feeder Fund1(G.B.) |
— | — | — | ( |
) | — | — | — | ||||||||||||||||||||||||
| Woori Star50 Master Fund ClassC-F |
— | ( |
) | — | ( |
) | — | — | — | |||||||||||||||||||||||
| Woori Hanhwa Eureka Private Equity Fund |
— | ( |
) | — | — | |||||||||||||||||||||||||||
| Aarden Woori Apparel 1st Private Equity Fund |
— | ( |
) | — | — | — | ||||||||||||||||||||||||||
| Godo Kaisha Oceanos 1 |
— | — | ( |
) | ( |
) | ||||||||||||||||||||||||||
For the year ended December 31, 2021 |
||||||||||||||||||||||||||||||||
Acquisition cost |
January 1, 2021 |
Share of profits (losses) |
Acquisition |
Disposal/ Reclassification |
Dividends |
Change in capital |
December 31, 2021 |
|||||||||||||||||||||||||
| Woori Zip 1 |
— | ( |
) | ( |
) | — | ||||||||||||||||||||||||||
| Woori Zip 2 |
— | ( |
) | ( |
) | — | ||||||||||||||||||||||||||
| Force TEC Co., Ltd. (*2) |
— | ( |
) | — | — | — | — | — | ||||||||||||||||||||||||
| KUM HWA Co., Ltd. (*2) |
— | — | — | — | — | — | — | — | ||||||||||||||||||||||||
| Jinmyung Plus Co., Ltd. |
— | — | — | — | — | — | — | — | ||||||||||||||||||||||||
| JC Assurance No.2 Private Equity Fund |
( |
) | — | — | — | |||||||||||||||||||||||||||
| Dream Company Growth no.1 PEF |
— | — | ( |
) | — | |||||||||||||||||||||||||||
| HMS-Oriens 1st Fund |
— | — | — | — | ||||||||||||||||||||||||||||
| WooriG Senior Loan General Type Private Investment Trust No.1 |
( |
) | ( |
) | — | |||||||||||||||||||||||||||
| Genesis Eco No.1 Private Equity Fund |
— | ( |
) | — | — | — | ||||||||||||||||||||||||||
| Paratus Woori Material Component Equipment joint venture company |
— | ( |
) | — | — | — | ||||||||||||||||||||||||||
| Midas No. 8 Private Equity Joint Venture Company |
— | ( |
) | — | — | — | ||||||||||||||||||||||||||
| PCC-Woori LP Secondary Fund |
— | — | — | |||||||||||||||||||||||||||||
| Woori High Plus Short-term High Graded ESG Bond Sec Feeder Inv Trust 1 |
( |
) | ( |
) | — | |||||||||||||||||||||||||||
| Woori-Q Corporate Restructuring Private Equity Fund |
( |
) | — | — | ||||||||||||||||||||||||||||
| Woori-Shinyoung Growth-Cap Private Equity Fund I |
( |
) | ( |
) | — | |||||||||||||||||||||||||||
| |
|
|
|
|
|
|
|
|
|
|
|
|
|
|
|
|||||||||||||||||
| ( |
) | ( |
) | |||||||||||||||||||||||||||||
| |
|
|
|
|
|
|
|
|
|
|
|
|
|
|
|
|||||||||||||||||
| (*1) | Included W on of deemed gain on disposal in accordance with the decrease in percentage of ownership from disproportionate contribution for the year ended December 31, 2021. |
| (*2) | As a result of discontinuation of the equity method, related companies’ losses amount not recognized is W on for KUM HWA Co., Ltd. |
For the year ended December 31, 2022 |
||||||||||||||||||||||||||||||||
Acquisition cost |
January 1, 2022 |
Share of profits (losses) and others |
Acquisition |
Disposal/ Reclassification |
Dividends |
Change in capital |
December 31, 2022 |
|||||||||||||||||||||||||
| W Service Networks Co., Ltd. |
— | — | ( |
) | — | |||||||||||||||||||||||||||
| Korea Credit Bureau Co., Ltd. |
( |
) | — | — | — | — | ||||||||||||||||||||||||||
| Korea Finance Security Co., Ltd. |
( |
) | — | — | — | — | ||||||||||||||||||||||||||
| Woori Growth Partnerships New Technology Private Equity Fund |
— | ( |
) | — | — | |||||||||||||||||||||||||||
| 2016KIF-IMM Woori Bank Technology Venture Fund |
( |
) | — | ( |
) | ( |
) | — | ||||||||||||||||||||||||
| K BANK Co., Ltd. |
— | — | — | ( |
) | |||||||||||||||||||||||||||
| Woori Bank-Company K Korea Movie Asset Fund |
— | — | — | ( |
) | — | ||||||||||||||||||||||||||
| Partner One Value Up I Private Equity Fund |
( |
) | — | — | — | — | ||||||||||||||||||||||||||
| IBK KIP Seongjang Dideemdol 1st Private Investment Limited Partnership |
— | ( |
) | — | — | |||||||||||||||||||||||||||
| Crevisse Raim Impact 1st Startup Venture Specialist Private Equity Fund |
— | — | — | |||||||||||||||||||||||||||||
| LOTTE CARD Co.,Ltd. |
— | — | ( |
) | ||||||||||||||||||||||||||||
| Together-Korea Government Private Pool Private Securities Investment Trust No. 3 |
— | — | — | — | ||||||||||||||||||||||||||||
| Genesis Environmental Energy Company 1st Private Equity Fund |
— | ( |
) | — | ( |
) | ( |
) | — | — | ||||||||||||||||||||||
| Union Technology Finance Investment Association |
( |
) | — | — | ||||||||||||||||||||||||||||
| Dicustody Co., Ltd. |
— | — | — | — | — | |||||||||||||||||||||||||||
| Orient Shipyard Co., Ltd. |
— | — | — | — | — | — | — | — | ||||||||||||||||||||||||
| BTS 2nd Private Equity Fund |
— | ( |
) | — | — | — | ||||||||||||||||||||||||||
| STASSETS FUND III |
— | ( |
) | — | — | — | ||||||||||||||||||||||||||
| Japanese Hotel Real Estate Private Equity Fund No.2 |
— | — | ( |
) | ( |
) | ||||||||||||||||||||||||||
| Woori Seoul Beltway Private Special Asset Fund No.1 |
— | ( |
) | — | ||||||||||||||||||||||||||||
| Woori Multi-Return Securities Investment Trust 3 (Balanced Bond) |
— | — | — | ( |
) | ( |
) | — | — | |||||||||||||||||||||||
| Woori Short-term Bond Securities Investment Trust(Bond) ClassC-F |
( |
) | ( |
) | — | |||||||||||||||||||||||||||
| Woori Safe Plus General Type Private Investment Trust S-8(Bond) |
— | — | ( |
) | — | |||||||||||||||||||||||||||
| WOORI TAERIM 1st Fund |
( |
) | — | — | — | — | ||||||||||||||||||||||||||
| Portone-Cape Fund No.1 |
( |
) | — | — | — | — | ||||||||||||||||||||||||||
| KIWOOM WOORI Financial 1st Investment Fund |
( |
) | — | — | — | — | ||||||||||||||||||||||||||
| DeepDive WOORI 2021-1 Financial Investment Fund |
( |
) | — | ( |
) | ( |
) | — | ||||||||||||||||||||||||
| Darwin Green Packaging Private Equity Fund |
— | — | ( |
) | — | |||||||||||||||||||||||||||
| DS Power Semicon Private Equity Fund |
— | — | ( |
) | — | |||||||||||||||||||||||||||
| Koreawide partners 2nd Private Equity Fund |
— | — | — | — | — | |||||||||||||||||||||||||||
| Woori FirstValue Private Real Estate Fund No.2 |
( |
) | — | ( |
) | — | — | |||||||||||||||||||||||||
For the year ended December 31, 2022 |
||||||||||||||||||||||||||||||||
Acquisition cost |
January 1, 2022 |
Share of profits (losses) and others |
Acquisition |
Disposal/ Reclassification |
Dividends |
Change in capital |
December 31, 2022 |
|||||||||||||||||||||||||
| WooriG Real Infrastructure Blind General Type Private Placement Investment Trust |
— | — | — | — | ||||||||||||||||||||||||||||
| Woori BIG2 Plus Securities Investment Trust(Balanced Bond) |
— | ( |
) | — | — | — | ||||||||||||||||||||||||||
| Woori Together TDF 2025 |
— | ( |
) | — | — | — | ||||||||||||||||||||||||||
| Woori Together TDF 2030 |
— | ( |
) | — | — | — | ||||||||||||||||||||||||||
| WOORI Star50 feeder fund(H) |
— | ( |
) | — | — | — | ||||||||||||||||||||||||||
| Woori Hanhwa Eureka Private Equity Fund |
— | ( |
) | — | ( |
) | ( |
) | — | — | ||||||||||||||||||||||
| Aarden Woori Apparel 1st Private Equity Fund |
( |
) | — | — | — | — | ||||||||||||||||||||||||||
| Woori Dyno 1st Private Equity Fund |
— | ( |
) | — | — | — | ||||||||||||||||||||||||||
| Australia Green Energy 1st PEF |
— | ( |
) | — | — | — | ||||||||||||||||||||||||||
| Godo Kaisha Oceanos 1 |
— | — | ( |
) | ( |
) | ||||||||||||||||||||||||||
| Woori Zip 1 |
( |
) | — | ( |
) | — | ( |
) | ||||||||||||||||||||||||
| Woori Zip 2 |
( |
) | — | ( |
) | — | ( |
) | ||||||||||||||||||||||||
| Force TEC Co., Ltd. (*) |
— | — | — | — | — | ( |
) | — | ||||||||||||||||||||||||
| KUM HWA Co., Ltd. (*) |
— | — | — | — | — | — | — | — | ||||||||||||||||||||||||
| Jinmyung Plus Co., Ltd. |
— | — | — | — | — | — | ||||||||||||||||||||||||||
| JC Assurance No.2 Private Equity Fund |
( |
) | — | — | — | — | — | |||||||||||||||||||||||||
| Dream Company Growth no.1 PEF |
— | — | ( |
) | — | |||||||||||||||||||||||||||
| HMS-Oriens 1st Fund |
— | — | — | — | ||||||||||||||||||||||||||||
| WooriG Senior Loan General Type Private Investment Trust No.1 |
( |
) | ( |
) | — | |||||||||||||||||||||||||||
| Genesis Eco No.1 Private Equity Fund |
( |
) | — | — | — | |||||||||||||||||||||||||||
| Paratus Woori Material Component Equipment joint venture company |
( |
) | — | — | — | — | ||||||||||||||||||||||||||
| Midas No. 8 Private Equity Joint Venture Company |
— | — | ( |
) | — | |||||||||||||||||||||||||||
| Orchestra Private Equity Fund IV |
— | ( |
) | ( |
) | — | ||||||||||||||||||||||||||
| Synaptic Green No.1 PEF |
— | ( |
) | — | — | — | ||||||||||||||||||||||||||
| IGEN2022No. 1 Private Equity Fund |
— | ( |
) | ( |
) | — | ||||||||||||||||||||||||||
| PCC-Woori LP Secondary Fund |
( |
) | — | — | ||||||||||||||||||||||||||||
| Woori High Plus Short-term High Graded ESG Bond Sec Feeder Inv Trust 1 |
— | — | — | ( |
) | ( |
) | — | — | |||||||||||||||||||||||
| Woori-Q Corporate Restructuring Private Equity Fund |
( |
) | ( |
) | — | — | ||||||||||||||||||||||||||
| Woori-Shinyoung Growth-Cap Private Equity Fund I |
— | — | — | — | ||||||||||||||||||||||||||||
| |
|
|
|
|
|
|
|
|
|
|
|
|
|
|
|
|||||||||||||||||
| ( |
) | ( |
) | |||||||||||||||||||||||||||||
| |
|
|
|
|
|
|
|
|
|
|
|
|
|
|
|
|||||||||||||||||
| (*) | As a result of discontinuation of the equity method, related companies’ losses amount not recognized is |
| (3) | Summary financial information relating to investments in associates accounted for using the equity method of accounting is as follows (Unit: Korean Won in millions): |
December 31, 2021 |
||||||||||||||||||||||||
Assets |
Liabilities |
Operating revenue |
Net income (loss) |
Other comprehensive income(loss) |
Total comprehensive income(loss) |
|||||||||||||||||||
| W Service Networks Co., Ltd. |
||||||||||||||||||||||||
| Korea Credit Bureau Co., Ltd. |
||||||||||||||||||||||||
| Korea Finance Security Co., Ltd. |
||||||||||||||||||||||||
| Woori Growth Partnerships New Technology Private Equity Fund |
( |
) | ( |
) | ||||||||||||||||||||
| 2016KIF-IMM Woori Bank Technology Venture Fund |
||||||||||||||||||||||||
| K BANK Co., Ltd. |
( |
) | ( |
) | ||||||||||||||||||||
| Woori Bank-Company K Korea Movie Asset Fund |
||||||||||||||||||||||||
| Partner One Value Up I Private Equity Fund |
||||||||||||||||||||||||
| IBK KIP Seongjang Dideemdol 1st Private Investment Limited Partnership |
||||||||||||||||||||||||
| Crevisse Raim Impact 1st Startup Venture Specialist Private Equity Fund |
( |
) | ( |
) | ||||||||||||||||||||
| LOTTE CARD Co.,Ltd. (*) |
||||||||||||||||||||||||
| Together-Korea Government Private Pool Private Securities Investment Trust No. 3 |
||||||||||||||||||||||||
| Genesis Environmental Energy Company 1st Private Equity Fund |
||||||||||||||||||||||||
| Union Technology Finance Investment Association |
( |
) | ( |
) | ||||||||||||||||||||
| Dicustody Co., Ltd. |
( |
) | ( |
) | ||||||||||||||||||||
| Japanese Hotel Real Estate Private Equity Fund 2 |
( |
) | ||||||||||||||||||||||
| Woori Seoul Beltway Private Special Asset Fund No.1 |
||||||||||||||||||||||||
| Woori Multi-Return Securities Investment Trust 3 (Balanced Bond) |
||||||||||||||||||||||||
| Woori Short-term Bond Securities Investment Trust(Bond) ClassC-F |
||||||||||||||||||||||||
| WOORI TAERIM 1st Fund |
||||||||||||||||||||||||
| Portone-Cape Fund No.1 |
||||||||||||||||||||||||
| KIWOOM WOORI Financial 1st Investment Fund |
( |
) | ( |
) | ||||||||||||||||||||
| DeepDive WOORI 2021-1 Financial Investment Fund |
( |
) | ( |
) | ||||||||||||||||||||
| Darwin Green Packaging Private Equity Fund |
( |
) | ( |
) | ||||||||||||||||||||
| Woori FirstValue Private Real Estate Fund No.2 |
( |
) | ( |
) | ||||||||||||||||||||
| WooriG Real Infrastructure Blind General Type Private Placement Investment Trust |
( |
) | ( |
) | ( |
) | ||||||||||||||||||
December 31, 2021 |
||||||||||||||||||||||||
Assets |
Liabilities |
Operating revenue |
Net income (loss) |
Other comprehensive income(loss) |
Total comprehensive income(loss) |
|||||||||||||||||||
| Woori Hanhwa Eureka Private Equity Fund |
||||||||||||||||||||||||
| Aarden Woori Apparel 1st Private Equity Fund |
( |
) | ( |
) | ||||||||||||||||||||
| Godo Kaisha Oceanos 1 |
||||||||||||||||||||||||
| Woori Zip 1 |
( |
) | ( |
) | ||||||||||||||||||||
| Woori Zip 2 |
( |
) | ( |
) | ||||||||||||||||||||
| Force TEC Co., Ltd. |
( |
) | ( |
) | ||||||||||||||||||||
| KUM HWA Co., Ltd. |
( |
) | ( |
) | ||||||||||||||||||||
| Jinmyung Plus Co.,Ltd. |
||||||||||||||||||||||||
| JC Assurance No.2 Private Equity Fund |
( |
) | ( |
) | ||||||||||||||||||||
| Dream Company Growth no.1 PEF |
||||||||||||||||||||||||
| HMS-Oriens 1st Fund |
||||||||||||||||||||||||
| Woori G Senior Loan Private Placement Investment Trust No.1 |
||||||||||||||||||||||||
| Genesis Eco No.1 Private Equity Fund |
( |
) | ( |
) | ||||||||||||||||||||
| Paratus Woori Material Component Equipment joint venture company |
( |
) | ( |
) | ||||||||||||||||||||
| Midas No. 8 Private Equity Joint Venture Company |
( |
) | ( |
) | ||||||||||||||||||||
| PCC-Woori LP Secondary Fund |
||||||||||||||||||||||||
| Woori High Plus Short-term High Graded ESG Bond Sec Feeder Inv Trust 1 |
||||||||||||||||||||||||
| Woori-Q Corporate Restructuring Private Equity Fund |
( |
) | ( |
) | ||||||||||||||||||||
| Woori-Shinyoung Growth-Cap Private Equity Fund I |
||||||||||||||||||||||||
| (*) | The amount is after reflecting the fair value adjustment that occurred when acquiring the shares and the adjustments that occurred by difference of accounting policies with the Group |
December 31, 2022 |
||||||||||||||||||||||||
Assets |
Liabilities |
Operating revenue |
Net income (loss) |
Other comprehensive income(loss) |
Total comprehensive income(loss) |
|||||||||||||||||||
| W Service Networks Co., Ltd. |
||||||||||||||||||||||||
| Korea Credit Bureau Co., Ltd. |
||||||||||||||||||||||||
| Korea Finance Security Co., Ltd. |
( |
) | ( |
) | ||||||||||||||||||||
| Woori Growth Partnerships New Technology Private Equity Fund |
||||||||||||||||||||||||
| 2016KIF-IMM Woori Bank Technology Venture Fund |
( |
) | ( |
) | ||||||||||||||||||||
| K BANK Co., Ltd. |
( |
) | ||||||||||||||||||||||
| Woori Bank-Company K Korea Movie Asset Fund (*1) |
||||||||||||||||||||||||
| Partner One Value Up I Private Equity Fund |
( |
) | ( |
) | ( |
) | ||||||||||||||||||
| IBK KIP Seongjang Dideemdol 1st Private Investment Limited Partnership |
||||||||||||||||||||||||
December 31, 2022 |
||||||||||||||||||||||||
Assets |
Liabilities |
Operating revenue |
Net income (loss) |
Other comprehensive income(loss) |
Total comprehensive income(loss) |
|||||||||||||||||||
| Crevisse Raim Impact 1st Startup Venture Specialist Private Equity Fund |
( |
) | ( |
) | ||||||||||||||||||||
| LOTTE CARD Co., Ltd. (*2) |
||||||||||||||||||||||||
| Together-Korea Government Private Pool Private Securities Investment Trust No. 3 |
||||||||||||||||||||||||
| Union Technology Finance Investment Association |
||||||||||||||||||||||||
| Dicustody Co., Ltd. |
( |
) | ( |
) | ||||||||||||||||||||
| Orient Shipyard Co., Ltd. |
( |
) | ( |
) | ||||||||||||||||||||
| BTS 2nd Private Equity Fund |
( |
) | ( |
) | ||||||||||||||||||||
| STASSETS FUND III |
( |
) | ( |
) | ||||||||||||||||||||
| Japanese Hotel Real Estate Private Equity Fund 2 |
( |
) | ( |
) | ||||||||||||||||||||
| Woori Seoul Beltway Private Special Asset Fund No.1 |
||||||||||||||||||||||||
| Woori Short-term Bond Securities Investment Trust(Bond) ClassC-F |
||||||||||||||||||||||||
| Woori Safe Plus General Type Private Investment Trust S-8(Bond) |
||||||||||||||||||||||||
| WOORI TAERIM 1st Fund |
( |
) | ( |
) | ||||||||||||||||||||
| Portone-Cape Fund No.1 |
( |
) | ( |
) | ||||||||||||||||||||
| KIWOOM WOORI Financial 1st Investment Fund |
( |
) | ( |
) | ||||||||||||||||||||
| DeepDive WOORI 2021-1 Financial Investment Fund |
( |
) | ( |
) | ||||||||||||||||||||
| Darwin Green Packaging Private Equity Fund |
||||||||||||||||||||||||
| DS Power Semicon Private Equity Fund |
||||||||||||||||||||||||
| Koreawide partners 2nd Private Equity Fund |
||||||||||||||||||||||||
| Woori FirstValue Private Real Estate Fund No.2 |
( |
) | ( |
) | ||||||||||||||||||||
| WooriG Real Infrastructure Blind General Type Private Placement Investment Trust |
||||||||||||||||||||||||
| Woori BIG2 Plus Securities Investment Trust(Balanced Bond) |
( |
) | ( |
) | ||||||||||||||||||||
| Woori Together TDF 2025 |
( |
) | ( |
) | ||||||||||||||||||||
| Woori Together TDF 2030 |
( |
) | ( |
) | ||||||||||||||||||||
| WOORI Star50 feeder fund(H) |
( |
) | ( |
) | ||||||||||||||||||||
| Aarden Woori Apparel 1st Private Equity Fund |
( |
) | ( |
) | ||||||||||||||||||||
| Woori Dyno 1st Private Equity Fund |
( |
) | ( |
) | ||||||||||||||||||||
| Australia Green Energy 1st PEF |
( |
) | ( |
) | ||||||||||||||||||||
| Godo Kaisha Oceanos 1 |
||||||||||||||||||||||||
| Woori Zip 1 |
( |
) | ( |
) | ||||||||||||||||||||
| Woori Zip 2 |
( |
) | ( |
) | ||||||||||||||||||||
| Force TEC Co., Ltd. |
( |
) | ( |
) | ||||||||||||||||||||
| KUM HWA Co., Ltd. |
( |
) | ( |
) | ||||||||||||||||||||
| Jinmyung Plus Co.,Ltd. |
( |
) | ( |
) | ||||||||||||||||||||
December 31, 2022 |
||||||||||||||||||||||||
Assets |
Liabilities |
Operating revenue |
Net income (loss) |
Other comprehensive income(loss) |
Total comprehensive income(loss) |
|||||||||||||||||||
| JC Assurance No.2 Private Equity Fund |
( |
) | ( |
) | ||||||||||||||||||||
| Dream Company Growth no.1 PEF |
||||||||||||||||||||||||
| HMS-Oriens 1st Fund |
||||||||||||||||||||||||
| Woori G Senior Loan Private Placement Investment Trust No.1 |
||||||||||||||||||||||||
| Genesis Eco No.1 Private Equity Fund |
( |
) | ( |
) | ||||||||||||||||||||
| Paratus Woori Material Component Equipment joint venture company |
( |
) | ( |
) | ||||||||||||||||||||
| Midas No. 8 Private Equity Joint Venture Company |
||||||||||||||||||||||||
| Orchestra Private Equity Fund IV |
||||||||||||||||||||||||
| Synaptic Green No.1 PEF |
( |
) | ( |
) | ||||||||||||||||||||
| IGEN2022No. 1 Private Equity Fund |
||||||||||||||||||||||||
| PCC-Woori LP Secondary Fund |
||||||||||||||||||||||||
| Woori-Q Corporate Restructuring Private Equity Fund |
( |
) | ( |
) | ||||||||||||||||||||
| Woori-Shinyoung Growth-Cap Private Equity Fund I |
||||||||||||||||||||||||
| (*1) | It was dissoluted for the year ended December 31,2021 and will be liquidated. |
| (*2) | The amount is after reflecting the fair value adjustment that occurred when acquiring the shares and the adjustments that occurred by difference of accounting policies with the Group. |
| (4) | The entities that the Group has not applied equity method of accounting although the Group’s ownership interest is more than 20 % as of December 31, 2021 and 2022 are as follows: |
December 31, 2021 |
||||||||
| Associate (*) |
Number of shares owned |
Ownership (%) |
||||||
| Orient Shipyard Co., Ltd. |
||||||||
| Yuil PESC Co., Ltd. |
||||||||
| CL Tech Co., Ltd. |
||||||||
| S.WIN Co., Ltd. |
||||||||
| (*) | work-out process under receivership, thus it is excluded from the investment in joint ventures and associates. |
December 31, 2022 |
||||||||
| Associate (*) |
Number of shares owned |
Ownership (%) |
||||||
| CL Tech Co., Ltd. |
||||||||
| (*) | work-out process under receivership, thus it is excluded from the investment in joint ventures and associates. |
| (5) | As of December 31, 2020, 2021 and 2022, the reconciliations from the net assets of the associates to the carrying amount of the shares of the investment in joint ventures and associates are as follows (Unit: Korean Won in millions except for ownership): |
December 31, 2020 |
||||||||||||||||||||||||||||
Total net asset |
Ownership (%) |
Ownership portion of net assets |
Basis difference |
Impairment |
Intercompany transaction |
Book value |
||||||||||||||||||||||
| W Service Networks Co., Ltd. |
||||||||||||||||||||||||||||
| Korea Credit Bureau Co., Ltd. |
||||||||||||||||||||||||||||
| Korea Finance Security Co., Ltd. |
||||||||||||||||||||||||||||
| Woori Growth Partnerships New Technology Private Equity Fund |
( |
) | ||||||||||||||||||||||||||
| 2016KIF-IMM Woori Bank Technology Venture Fund |
||||||||||||||||||||||||||||
| K BANK Co., Ltd. (*1)(*2) |
( |
) | ||||||||||||||||||||||||||
| Smart Private Equity Fund No.2 (*2) |
( |
) | ||||||||||||||||||||||||||
| Woori Bank-Company K Korea Movie Asset Fund |
||||||||||||||||||||||||||||
| Well to Sea No.3 Private Equity Fund (*3) |
— | |||||||||||||||||||||||||||
| Partner One Value Up Ist Private Equity Fund |
( |
) | ||||||||||||||||||||||||||
| IBK KIP Seongjang Dideemdol 1st Private Investment Limited Partnership |
||||||||||||||||||||||||||||
| Crevisse Raim Impact 1st Startup Venture Specialist Private Equity Fund |
||||||||||||||||||||||||||||
| Woori-Shinyoung Growth-Cap Private Equity Fund I |
||||||||||||||||||||||||||||
| LOTTE CARD Co., Ltd (*1) |
||||||||||||||||||||||||||||
| Woori-Q Corporate Restructuring Private Equity Fund |
||||||||||||||||||||||||||||
| PCC-Woori LP Secondary Fund |
||||||||||||||||||||||||||||
| Force TEC |
||||||||||||||||||||||||||||
| Together-Korea Government Private Pool Private Securities Investment Trust No.3 |
( |
) | ||||||||||||||||||||||||||
| Genesis Environmental Energy Company 1st Private Equity Fund |
||||||||||||||||||||||||||||
| Union Technology Finance Investment Association |
||||||||||||||||||||||||||||
| Woori Hanhwa Eureka Private Equity Fund |
||||||||||||||||||||||||||||
| Godo Kaisha Oceanos 1 |
||||||||||||||||||||||||||||
| Japanese Hotel Real Estate Private Equity Fund No.2 |
||||||||||||||||||||||||||||
| Woori High plus G.B. Securities Feeder Fund1(G.B.) |
||||||||||||||||||||||||||||
| Woori G Senior Loan General Type Private Investment Trust No.1 |
||||||||||||||||||||||||||||
| Woori G Clean Energy No.1 |
||||||||||||||||||||||||||||
| Woori Goseong Power EBL Private Special Asset Fund |
||||||||||||||||||||||||||||
| Woori Seoul Beltway Private Special Asset Fund No.1 |
||||||||||||||||||||||||||||
| WOORI TAERIM 1st Fund |
||||||||||||||||||||||||||||
| Portone-Cape Fund No.1 |
||||||||||||||||||||||||||||
| KIWOOM WOORI Financial 1st Investment Fund |
||||||||||||||||||||||||||||
December 31, 2020 |
||||||||||||||||||||||||||||
Total net asset |
Ownership (%) |
Ownership portion of net assets |
Basis difference |
Impairment |
Intercompany transaction |
Book value |
||||||||||||||||||||||
| Woori FirstValue Private Real Estate Fund No.2 |
||||||||||||||||||||||||||||
| Woori Star50 Master Fund ClassC-F |
||||||||||||||||||||||||||||
| JC Assurance No.2 Private Equity Fund |
||||||||||||||||||||||||||||
| Dream Company Growth no.1 PEF |
||||||||||||||||||||||||||||
| HMS-Oriens 1st Fund |
||||||||||||||||||||||||||||
| Woori High Plus Short-term High Graded ESG Bond Sec Feeder Inv Trust 1 |
||||||||||||||||||||||||||||
| (*1) | The net asset equity amount is after the debt-for-equity non-controlling etc. |
| (*2) | As a result of conducting an impairment test on the investment stocks of the related companies, the recoverable value was less than the carrying amount and thus the impairment loss was recognized. |
| (*3) | The estimated recoverable amount of |
December 31, 2021 |
||||||||||||||||||||||||||||
Total net asset |
Ownership (%) |
Ownership portion of net assets |
Basis difference |
Impairment |
Intercompany transaction |
Book value |
||||||||||||||||||||||
| W Service Networks Co., Ltd. |
||||||||||||||||||||||||||||
| Korea Credit Bureau Co., Ltd. |
||||||||||||||||||||||||||||
| Korea Finance Security Co., Ltd. |
||||||||||||||||||||||||||||
| Woori Growth Partnerships New Technology Private Equity Fund |
||||||||||||||||||||||||||||
| 2016KIF-IMM Woori Bank Technology Venture Fund |
||||||||||||||||||||||||||||
| K BANK Co., Ltd. (*) |
||||||||||||||||||||||||||||
| Woori Bank-Company K Korea Movie Asset Fund |
||||||||||||||||||||||||||||
| Partner One Value Up Ist Private Equity Fund |
||||||||||||||||||||||||||||
| IBK KIP Seongjang Dideemdol 1st Private Investment Limited Partnership |
||||||||||||||||||||||||||||
| Crevisse Raim Impact 1st Startup Venture Specialist Private Equity Fund |
||||||||||||||||||||||||||||
| LOTTE CARD Co., Ltd (*1) |
||||||||||||||||||||||||||||
| Together-Korea Government Private Pool Private Securities Investment Trust No.3 |
||||||||||||||||||||||||||||
| Genesis Environmental Energy Company 1st Private Equity Fund |
||||||||||||||||||||||||||||
| Union Technology Finance Investment Association |
||||||||||||||||||||||||||||
| Dicustody Co., Ltd. |
||||||||||||||||||||||||||||
| Japanese Hotel Real Estate Private Equity Fund No.2 |
||||||||||||||||||||||||||||
| Woori Seoul Beltway Private Special Asset Fund No.1 |
||||||||||||||||||||||||||||
| Woori Multi Return Private Securities Investment Trust 3(Balanced Bond) |
||||||||||||||||||||||||||||
| Woori Short-term Bond Securities Investment Trust (Bond) ClassC-F |
||||||||||||||||||||||||||||
December 31, 2021 |
||||||||||||||||||||||||||||
Total net asset |
Ownership (%) |
Ownership portion of net assets |
Basis difference |
Impairment |
Intercompany transaction |
Book value |
||||||||||||||||||||||
| WOORI TAERIM 1st Fund |
||||||||||||||||||||||||||||
| Portone-Cape Fund No.1 |
||||||||||||||||||||||||||||
| KIWOOM WOORI Financial 1st Investment Fund |
||||||||||||||||||||||||||||
| DeepDive WOORI 2021-1 Financial Investment Fund |
||||||||||||||||||||||||||||
| Darwin Green Packaging Private Equity Fund |
||||||||||||||||||||||||||||
| Woori FirstValue Private Real Estate Fund No.2 |
||||||||||||||||||||||||||||
| WooriG Real Infrastructure Blind General Type Private Placement Investment Trust |
||||||||||||||||||||||||||||
| Woori Hanhwa Eureka Private Equity Fund |
||||||||||||||||||||||||||||
| Aarden Woori Apparel 1st Private Equity Fund |
||||||||||||||||||||||||||||
| Godo Kaisha Oceanos 1 |
||||||||||||||||||||||||||||
| Woori Zip 1 |
||||||||||||||||||||||||||||
| Woori Zip 2 |
||||||||||||||||||||||||||||
| Force TEC |
( |
) | ( |
) | — | |||||||||||||||||||||||
| KUM HWA Co., Ltd. |
( |
) | ( |
) | — | |||||||||||||||||||||||
| Jinmyung Plus Co.,Ltd. |
( |
) | — | |||||||||||||||||||||||||
| JC Assurance No.2 Private Equity Fund |
( |
) | ||||||||||||||||||||||||||
| Dream Company Growth no.1 PEF |
||||||||||||||||||||||||||||
| HMS-Oriens 1st Fund |
||||||||||||||||||||||||||||
| WooriG Senior Loan General Type Private Investment Trust No.1 |
||||||||||||||||||||||||||||
| Genesis Eco No.1 Private Equity Fund |
||||||||||||||||||||||||||||
| Paratus Woori Material Component Equipment joint venture company |
||||||||||||||||||||||||||||
| Midas No. 8 Private Equity Joint Venture Company |
||||||||||||||||||||||||||||
| PCC-Woori LP Secondary Fund |
||||||||||||||||||||||||||||
| Woori High Plus Short-term High Graded ESG Bond Sec Feeder Inv Trust 1 |
||||||||||||||||||||||||||||
| Woori-Q Corporate Restructuring Private Equity Fund |
||||||||||||||||||||||||||||
| Woori-Shinyoung Growth-Cap Private Equity Fund I |
||||||||||||||||||||||||||||
| (*) | The net asset equity amount is after the debt-for-equity non-controlling etc. |
December 31, 2022 |
||||||||||||||||||||||||||||
Total net asset |
Ownership (%) |
Ownership portion of net assets |
Basis difference |
Impairment |
Intercompany transaction |
Book value |
||||||||||||||||||||||
| W Service Networks Co., Ltd. |
( |
) | ||||||||||||||||||||||||||
| Korea Credit Bureau Co., Ltd. |
||||||||||||||||||||||||||||
| Korea Finance Security Co., Ltd. |
||||||||||||||||||||||||||||
| Woori Growth Partnerships New Technology Private Equity Fund |
||||||||||||||||||||||||||||
| 2016KIF-IMM Woori Bank Technology Venture Fund |
||||||||||||||||||||||||||||
December 31, 2022 |
||||||||||||||||||||||||||||
Total net asset |
Ownership (%) |
Ownership portion of net assets |
Basis difference |
Impairment |
Intercompany transaction |
Book value |
||||||||||||||||||||||
| K BANK Co., Ltd. (*) |
||||||||||||||||||||||||||||
| Woori Bank-Company K Korea Movie Asset Fund |
||||||||||||||||||||||||||||
| Partner One Value Up Ist Private Equity Fund |
||||||||||||||||||||||||||||
| IBK KIP Seongjang Dideemdol 1st Private Investment Limited Partnership |
||||||||||||||||||||||||||||
| Crevisse Raim Impact 1st Startup Venture Specialist Private Equity Fund |
||||||||||||||||||||||||||||
| LOTTE CARD Co., Ltd. (*) |
||||||||||||||||||||||||||||
| Together-Korea Government Private Pool Private Securities Investment Trust No.3 |
( |
) | ||||||||||||||||||||||||||
| Union Technology Finance Investment Association |
( |
) | ||||||||||||||||||||||||||
| Dicustody Co., Ltd. |
||||||||||||||||||||||||||||
| Orient Shipyard Co., Ltd. |
( |
) | ( |
) | — | |||||||||||||||||||||||
| BTS 2nd Private Equity Fund |
||||||||||||||||||||||||||||
| STASSETS FUND III |
||||||||||||||||||||||||||||
| Japanese Hotel Real Estate Private Equity Fund No.2 |
||||||||||||||||||||||||||||
| Woori Seoul Beltway Private Special Asset Fund No.1 |
||||||||||||||||||||||||||||
| Woori Short-term Bond Securities Investment Trust (Bond) ClassC-F |
||||||||||||||||||||||||||||
| Woori Safe Plus General Type Private Investment Trust S-8(Bond) |
||||||||||||||||||||||||||||
| WOORI TAERIM 1st Fund |
||||||||||||||||||||||||||||
| Portone-Cape Fund No.1 |
||||||||||||||||||||||||||||
| KIWOOM WOORI Financial 1st Investment Fund |
||||||||||||||||||||||||||||
| DeepDive WOORI 2021-1 Financial Investment Fund |
||||||||||||||||||||||||||||
| Darwin Green Packaging Private Equity Fund |
||||||||||||||||||||||||||||
| DS Power Semicon Private Equity Fund |
||||||||||||||||||||||||||||
| Koreawide partners 2nd Private Equity Fund |
||||||||||||||||||||||||||||
| Woori FirstValue Private Real Estate Fund No.2 |
||||||||||||||||||||||||||||
| Woori G Real Infrastructure Blind General Type Private Placement Investment Trust |
||||||||||||||||||||||||||||
| Woori BIG2 Plus Securities Investment Trust(Balanced Bond) |
||||||||||||||||||||||||||||
| Woori Together TDF 2025 |
||||||||||||||||||||||||||||
| Woori Together TDF 2030 |
||||||||||||||||||||||||||||
| WOORI Star50 feeder fund(H) |
||||||||||||||||||||||||||||
| Aarden Woori Apparel 1st Private Equity Fund |
||||||||||||||||||||||||||||
| Woori Dyno 1st Private Equity Fund |
||||||||||||||||||||||||||||
| Australia Green Energy 1st PEF |
||||||||||||||||||||||||||||
| Godo Kaisha Oceanos 1 |
||||||||||||||||||||||||||||
| Woori Zip 1 |
||||||||||||||||||||||||||||
| Woori Zip 2 |
||||||||||||||||||||||||||||
December 31, 2022 |
||||||||||||||||||||||||||||
Total net asset |
Ownership (%) |
Ownership portion of net assets |
Basis difference |
Impairment |
Intercompany transaction |
Book value |
||||||||||||||||||||||
| Force TEC |
( |
) | ( |
) | — | |||||||||||||||||||||||
| KUM HWA Co., Ltd. |
( |
) | ( |
) | — | |||||||||||||||||||||||
| Jinmyung Plus Co.,Ltd. |
||||||||||||||||||||||||||||
| JC Assurance No.2 Private Equity Fund |
( |
) | — | |||||||||||||||||||||||||
| Dream Company Growth no.1 PEF |
||||||||||||||||||||||||||||
| HMS-Oriens 1st Fund |
||||||||||||||||||||||||||||
| Woori G Senior Loan General Type Private Investment Trust No.1 |
||||||||||||||||||||||||||||
| Genesis Eco No.1 Private Equity Fund |
||||||||||||||||||||||||||||
| Paratus Woori Material Component Equipment joint venture company |
||||||||||||||||||||||||||||
| Midas No. 8 Private Equity Joint Venture Company |
||||||||||||||||||||||||||||
| Orchestra Private Equity Fund IV |
||||||||||||||||||||||||||||
| Synaptic Green No.1 PEF |
||||||||||||||||||||||||||||
| IGEN2022No. 1 Private Equity Fund |
||||||||||||||||||||||||||||
| PCC-Woori LP Secondary Fund |
||||||||||||||||||||||||||||
| Woori-Q Corporate Restructuring Private Equity Fund |
||||||||||||||||||||||||||||
| Woori-Shinyoung Growth-Cap Private Equity Fund I |
||||||||||||||||||||||||||||
| (*) | The net asset equity amount is after the debt-for-equity non-controlling etc. |
14. |
INVESTMENT PROPERTIES |
| (1) | Details of investment properties are as follows (Unit: Korean Won in millions): |
December 31, 2021 |
December 31, 2022 |
|||||||
| Acquisition cost |
||||||||
| Accumulated depreciation |
( |
) | ( |
) | ||||
| Accumulated impairment losses |
( |
) | ( |
) | ||||
| |
|
|
|
|||||
| Net carrying value |
||||||||
| |
|
|
|
|||||
| (2) | Changes in investment properties are as follows (Unit: Korean Won in millions): |
For the years ended December 31 |
||||||||||||
2020 |
2021 |
2022 |
||||||||||
| Beginning balance |
||||||||||||
| Acquisition |
||||||||||||
| Disposal |
( |
) | ( |
) | ||||||||
| Depreciation |
( |
) | ( |
) | ( |
) | ||||||
| Transfer |
||||||||||||
| Foreign currencies translation adjustments |
( |
) | ( |
) | ||||||||
| Business combination |
||||||||||||
| Others |
( |
) | ||||||||||
| |
|
|
|
|
|
|||||||
| Ending balance |
||||||||||||
| |
|
|
|
|
|
|||||||
| (3) | Fair value of investment properties amounted to W on and W on and as of December 31, 2021 and 2022, respectively. |
| (4) | Rental fee earned from investment properties is amounting to W on and W on for the years ended December 31, 2021 and 2022, respectively. Operating expenses directly related to the investment properties where rental fee was earned is amounting to W on and W on. |
| (5) | The lease payments expected to be received in the future under lease contracts relating to investment properties as of December 31, 2021 and 2022 are as follows (Unit: Korean Won in millions): |
December 31, 2021 |
December 31, 2022 |
|||||||
| Lease payments: |
||||||||
| Within a year |
||||||||
| More than 1 year and within 2 years |
||||||||
| More than 2 years and within 3 years |
||||||||
| More than 3 years and within 4 years |
||||||||
| More than 4 years and within 5 years |
||||||||
| More than 5 years |
||||||||
| |
|
|
|
|||||
| Total |
||||||||
| |
|
|
|
|||||
15. |
PREMISES AND EQUIPMENT |
| (1) | Details of premises and equipment as of December 31, 2021 and 2022 are as follows (Unit: Korean Won in millions): |
December 31, 2021 |
||||||||||||||||||||||||||||
Land |
Building |
Equipment and vehicles |
Leasehold improvement |
Construction in progress |
Structures |
Total |
||||||||||||||||||||||
| Premises and equipment (owned) |
||||||||||||||||||||||||||||
| Right-of-use |
||||||||||||||||||||||||||||
| Carrying value |
||||||||||||||||||||||||||||
December 31, 2022 |
||||||||||||||||||||||||||||
Land |
Building |
Equipment and vehicles |
Leasehold improvement |
Construction in progress |
Structures |
Total |
||||||||||||||||||||||
| Premises and equipment (owned) |
||||||||||||||||||||||||||||
| Right-of-use |
||||||||||||||||||||||||||||
| Carrying value |
||||||||||||||||||||||||||||
| (2) | Details of premises and equipment (owned) as of December 31, 2021 and 2022 are as follows (Unit: Korean Won in millions): |
December 31, 2021 |
||||||||||||||||||||||||||||
Land |
Building |
Equipment and vehicles |
Leasehold improvement |
Construction in progress |
Structures |
Total |
||||||||||||||||||||||
| Acquisition cost |
||||||||||||||||||||||||||||
| Accumulated depreciation |
( |
) | ( |
) | ( |
) | ( |
) | ( |
) | ||||||||||||||||||
| Accumulated impairment losses |
( |
) | ( |
) | ||||||||||||||||||||||||
| |
|
|
|
|
|
|
|
|
|
|
|
|
|
|||||||||||||||
| Net carrying value |
||||||||||||||||||||||||||||
| |
|
|
|
|
|
|
|
|
|
|
|
|
|
|||||||||||||||
December 31, 2022 |
||||||||||||||||||||||||||||
Land |
Building |
Equipment and vehicles |
Leasehold improvement |
Construction in progress |
Structures |
Total |
||||||||||||||||||||||
| Acquisition cost |
||||||||||||||||||||||||||||
| Accumulated depreciation |
( |
) | ( |
) | ( |
) | ( |
) | ( |
) | ||||||||||||||||||
| Accumulated impairment losses |
( |
) | ( |
) | ||||||||||||||||||||||||
| |
|
|
|
|
|
|
|
|
|
|
|
|
|
|||||||||||||||
| Net carrying value |
||||||||||||||||||||||||||||
| |
|
|
|
|
|
|
|
|
|
|
|
|
|
|||||||||||||||
| (3) | Details of changes in premises and equipment (owned) are as follows (Unit: Korean Won in millions): |
For the year ended December 31, 2020 |
||||||||||||||||||||||||||||
Land |
Building |
Equipment and vehicles |
Leasehold improvement |
Construction in progress |
Structures |
Total |
||||||||||||||||||||||
| Beginning balance |
||||||||||||||||||||||||||||
| Acquisitions |
||||||||||||||||||||||||||||
| Disposals |
( |
) | ( |
) | ( |
) | ( |
) | ( |
) | ||||||||||||||||||
| Depreciation |
( |
) | ( |
) | ( |
) | ( |
) | ||||||||||||||||||||
| Transfer |
( |
) | ( |
) | ( |
) | ( |
) | ||||||||||||||||||||
| Foreign currencies translation adjustments |
( |
) | ( |
) | ( |
) | ( |
) | ( |
) | ( |
) | ||||||||||||||||
| Business combination |
||||||||||||||||||||||||||||
| Others |
( |
) | ( |
) | ( |
) | ( |
) | ||||||||||||||||||||
| |
|
|
|
|
|
|
|
|
|
|
|
|
|
|||||||||||||||
| Ending balance |
||||||||||||||||||||||||||||
| |
|
|
|
|
|
|
|
|
|
|
|
|
|
|||||||||||||||
For the year ended December 31, 2021 |
||||||||||||||||||||||||||||
Land |
Building |
Equipment and vehicles |
Leasehold improvement |
Construction in progress |
Structures |
Total |
||||||||||||||||||||||
| Beginning balance |
||||||||||||||||||||||||||||
| Acquisitions |
||||||||||||||||||||||||||||
| Disposals |
( |
) | ( |
) | ( |
) | ( |
) | ||||||||||||||||||||
| Depreciation |
( |
) | ( |
) | ( |
) | ( |
) | ( |
) | ||||||||||||||||||
| Classification of assets held for sale |
( |
) | ( |
) | ( |
) | ||||||||||||||||||||||
| Transfer |
( |
) | ( |
) | ( |
) | ( |
) | ||||||||||||||||||||
| Foreign currencies translation adjustments |
||||||||||||||||||||||||||||
| Others |
( |
) | ( |
) | ( |
) | ( |
) | ( |
) | ||||||||||||||||||
| |
|
|
|
|
|
|
|
|
|
|
|
|
|
|||||||||||||||
| Ending balance |
||||||||||||||||||||||||||||
| |
|
|
|
|
|
|
|
|
|
|
|
|
|
|||||||||||||||
For the year ended December 31, 2022 |
||||||||||||||||||||||||||||
Land |
Building |
Equipment and vehicles |
Leasehold improvement |
Construction in progress |
Structures |
Total |
||||||||||||||||||||||
| Beginning balance |
||||||||||||||||||||||||||||
| Acquisitions |
||||||||||||||||||||||||||||
| Disposals |
( |
) | ( |
) | ( |
) | ( |
) | ( |
) | ||||||||||||||||||
| Depreciation |
( |
) | ( |
) | ( |
) | ( |
) | ( |
) | ||||||||||||||||||
| Classification of assets held for sale |
( |
) | ( |
) | ( |
) | ||||||||||||||||||||||
| Transfer |
( |
) | ( |
) | ( |
) | ||||||||||||||||||||||
| Foreign currencies translation adjustments |
( |
) | ( |
) | ( |
) | ||||||||||||||||||||||
| Business combination |
||||||||||||||||||||||||||||
| Others |
( |
) | ( |
) | ( |
) | ( |
) | ||||||||||||||||||||
| |
|
|
|
|
|
|
|
|
|
|
|
|
|
|||||||||||||||
| Ending balance |
||||||||||||||||||||||||||||
| |
|
|
|
|
|
|
|
|
|
|
|
|
|
|||||||||||||||
| (4) | Details of right-of-use |
December 31, 2021 |
||||||||||||
Building |
Equipment and vehicles |
Total |
||||||||||
| Acquisition cost |
||||||||||||
| Accumulated depreciation |
( |
) | ( |
) | ( |
) | ||||||
| |
|
|
|
|
|
|||||||
| Net carrying value |
||||||||||||
| |
|
|
|
|
|
|||||||
December 31, 2022 |
||||||||||||
Building |
Equipment and vehicles |
Total |
||||||||||
| Acquisition cost |
||||||||||||
| Accumulated depreciation |
( |
) | ( |
) | ( |
) | ||||||
| |
|
|
|
|
|
|||||||
| Net carrying value |
||||||||||||
| |
|
|
|
|
|
|||||||
| (5) | Details of changes in right-of-use |
For the year ended December 31, 2021 |
||||||||||||
Building |
Equipment and vehicles |
Total |
||||||||||
| Beginning balance |
||||||||||||
| New contracts |
||||||||||||
| Changes in contract |
||||||||||||
| Termination |
( |
) | ( |
) | ( |
) | ||||||
| Depreciation |
( |
) | ( |
) | ( |
) | ||||||
| Business combination |
||||||||||||
| Others |
||||||||||||
| |
|
|
|
|
|
|||||||
| Ending balance |
||||||||||||
| |
|
|
|
|
|
|||||||
For the year ended December 31, 2022 |
||||||||||||
Building |
Equipment and vehicles |
Total |
||||||||||
| Beginning balance |
||||||||||||
| New contracts |
||||||||||||
| Changes in contract |
( |
) | ||||||||||
| Termination |
( |
) | ( |
) | ( |
) | ||||||
| Depreciation |
( |
) | ( |
) | ( |
) | ||||||
| Business combination |
||||||||||||
| Others |
||||||||||||
| |
|
|
|
|
|
|||||||
| Ending balance |
||||||||||||
| |
|
|
|
|
|
|||||||
16. |
INTANGIBLE ASSETS |
| (1) | Details of intangible assets are as follows (Unit: Korean Won in millions): |
December 31, 2021 |
||||||||||||||||||||||||||||
Goodwill |
Industrial property rights |
Development cost |
Other intangible assets |
Membership deposit |
Construction in progress |
Total |
||||||||||||||||||||||
| Acquisition cost |
||||||||||||||||||||||||||||
| Accumulated amortization |
( |
) | ( |
) | ( |
) | ( |
) | ||||||||||||||||||||
| Accumulated impairment losses |
( |
) | ( |
) | ( |
) | ||||||||||||||||||||||
| |
|
|
|
|
|
|
|
|
|
|
|
|
|
|||||||||||||||
| Net carrying value |
||||||||||||||||||||||||||||
| |
|
|
|
|
|
|
|
|
|
|
|
|
|
|||||||||||||||
December 31, 2022 |
||||||||||||||||||||||||||||
Goodwill |
Industrial property rights |
Development cost |
Other intangible assets |
Membership deposit |
Construction in progress |
Total |
||||||||||||||||||||||
| Acquisition cost |
||||||||||||||||||||||||||||
| Accumulated amortization |
( |
) | ( |
) | ( |
) | ( |
) | ||||||||||||||||||||
| Accumulated impairment losses |
( |
) | ( |
) | ( |
) | ||||||||||||||||||||||
| |
|
|
|
|
|
|
|
|
|
|
|
|
|
|||||||||||||||
| Net carrying value |
||||||||||||||||||||||||||||
| |
|
|
|
|
|
|
|
|
|
|
|
|
|
|||||||||||||||
| (2) | Details of changes in intangible assets are as follows (Unit: Korean Won in millions): |
For the year ended December 31, 2020 |
||||||||||||||||||||||||||||
Goodwill |
Industrial property rights |
Development cost |
Other intangible assets |
Membership deposit |
Construction in progress |
Total |
||||||||||||||||||||||
| Beginning balance |
||||||||||||||||||||||||||||
| Acquisitions |
||||||||||||||||||||||||||||
| Disposal |
( |
) | ( |
) | ||||||||||||||||||||||||
| Amortization (*) |
( |
) | ( |
) | ( |
) | ( |
) | ||||||||||||||||||||
| Impairment losses |
( |
) | ( |
) | ( |
) | ||||||||||||||||||||||
| Transfer |
( |
) | ||||||||||||||||||||||||||
| Foreign currencies translation adjustments |
( |
) | ( |
) | ( |
) | ( |
) | ( |
) | ||||||||||||||||||
| Business combination |
||||||||||||||||||||||||||||
| Others |
( |
) | ( |
) | ( |
) | ||||||||||||||||||||||
| |
|
|
|
|
|
|
|
|
|
|
|
|
|
|||||||||||||||
| Ending balance |
||||||||||||||||||||||||||||
| |
|
|
|
|
|
|
|
|
|
|
|
|
|
|||||||||||||||
| (*) | |
For the year ended December 31, 2021 |
||||||||||||||||||||||||||||
Goodwill |
Industrial property rights |
Development cost |
Other intangible assets |
Membership deposit |
Construction in progress |
Total |
||||||||||||||||||||||
| Beginning balance |
||||||||||||||||||||||||||||
| Acquisitions |
||||||||||||||||||||||||||||
| Disposal |
( |
) | ( |
) | ||||||||||||||||||||||||
| Amortization (*) |
( |
) | ( |
) | ( |
) | ( |
) | ||||||||||||||||||||
| Impairment losses |
( |
) | ( |
) | ( |
) | ||||||||||||||||||||||
| Transfer |
( |
) | ||||||||||||||||||||||||||
| Foreign currencies translation adjustments |
||||||||||||||||||||||||||||
| Others |
( |
) | ||||||||||||||||||||||||||
| |
|
|
|
|
|
|
|
|
|
|
|
|
|
|||||||||||||||
| Ending balance |
||||||||||||||||||||||||||||
| |
|
|
|
|
|
|
|
|
|
|
|
|
|
|||||||||||||||
| (*) | W on is included in other operating expenses. |
For the year ended December 31, 2022 |
||||||||||||||||||||||||||||
Goodwill |
Industrial property rights |
Development cost |
Other intangible assets |
Membership deposit |
Construction in progress |
Total |
||||||||||||||||||||||
| Beginning balance |
||||||||||||||||||||||||||||
| Acquisitions |
||||||||||||||||||||||||||||
| Disposal |
( |
) | ( |
) | ( |
) | ||||||||||||||||||||||
| Amortization (*) |
( |
) | ( |
) | ( |
) | ( |
) | ||||||||||||||||||||
| Impairment losses |
||||||||||||||||||||||||||||
| Transfer |
( |
) | ||||||||||||||||||||||||||
| Business combination |
||||||||||||||||||||||||||||
| Foreign currencies translation adjustments |
( |
) | ( |
) | ( |
) | ( |
) | ( |
) | ( |
) | ||||||||||||||||
| Others |
( |
) | ( |
) | ||||||||||||||||||||||||
| |
|
|
|
|
|
|
|
|
|
|
|
|
|
|||||||||||||||
| Ending balance |
||||||||||||||||||||||||||||
| |
|
|
|
|
|
|
|
|
|
|
|
|
|
|||||||||||||||
| (*) | W on is included in other operating expenses. |
| (3) | Goodwill |
| 1) | Details of allocated goodwill based on each cash-generating unit as of December 31, 2021 and 2022 are as follows (Unit: Korean W on in million): |
| Cash-generating unit (*1) |
December 31, 2021 |
December 31, 2022 |
||||||
| Woori Asset Management Corp. |
||||||||
| Woori Global Asset Management Co., Ltd. |
||||||||
| Woori Asset Trust Co., Ltd. |
||||||||
| PT Bank Woori Saudara Indonesia 1906 Tbk (*2) |
||||||||
| WOORI BANK (CAMBODIA) PLC (*3) |
||||||||
| PT Woori Finance Indonesia Tbk. |
||||||||
| Others |
||||||||
| |
|
|
|
|||||
| Total |
||||||||
| |
|
|
|
|||||
| (*1) | sub-sectors. |
| (*2) | |
| (*3) | |
| 2) | Impairment test |
| Category |
Woori Asset Trust Co., Ltd. |
Woori Asset Management Corp. |
Woori Global Asset Management Co., Ltd |
PT Bank Woori Saudara Indonesia 1906 Tbk |
WB Finance Co., Ltd |
|||||||||||||||
| Discount rate (%) |
||||||||||||||||||||
| Terminal growth rate (%) |
||||||||||||||||||||
| Recoverable amount |
||||||||||||||||||||
| Carrying amount |
||||||||||||||||||||
| 3) | Sensitivity analysis |
| Category |
Woori Asset Trust Co., Ltd. |
Woori Asset Management Corp. |
Woori Global Asset Management Co., Ltd |
PT Bank Woori Saudara Indonesia 1906 Tbk |
WB Finance Co., Ltd |
|||||||||||||||||
| Discount rate (%) |
Increase by 1.0% point |
( |
) | ( |
) | ( |
) | ( |
) | ( |
) | |||||||||||
| Decrease by 1.0% point |
||||||||||||||||||||||
| Terminal growth rate (%) |
Increase by 1.0% point |
|||||||||||||||||||||
| Decrease by 1.0% point (*) |
( |
) | ( |
) | ( |
) | ||||||||||||||||
| (*) | |
17. |
ASSETS HELD FOR SALE |
| Assets (*) |
December 31, 2021 |
December 31, 2022 |
||||||
| Premises and equipment |
||||||||
| Investments of associates |
||||||||
| Others |
||||||||
| |
|
|
|
|||||
| Total |
||||||||
| |
|
|
|
|||||
| (*) | The Group classifies assets as held for sale that are highly likely to be sold within one year from December 31, 202 1 and December 31, 2022 . |
18. |
ASSETS SUBJECT TO LIEN AND ASSETS ACQUIRED THROUGH FORECLOSURES |
| (1) | Assets subjected to lien are as follows (Unit: Korean Won in milli on s): |
| December 31, 2021 | ||||||||||
| Collateral given to |
Amount |
Reason for collateral | ||||||||
| Financial assets at FVTPL |
Korean treasury and government bonds, etc |
|
| |||||||
| Korean treasury and government bonds, etc |
|
| ||||||||
| Korean treasury and government bonds, etc |
|
| ||||||||
| Korean financial institutions’ debt securities, etc |
|
| ||||||||
| Korean financial institutions’ debt securities, etc |
|
| ||||||||
| Korean financial institutions’ debt securities, etc |
|
| ||||||||
| Korean corporate bonds |
|
| ||||||||
| Korean capital contributions |
|
| ||||||||
| Financial assets at FVTOCI |
Korean treasury and government bonds |
|
(*) | |||||||
| Korean financial institutions’ debt securities, etc |
|
| ||||||||
| Foreign financial institutions’ debt securities |
|
(*) | ||||||||
| Securities at amortized cost |
Korean treasury and government bonds |
|
| |||||||
| December 31, 2021 | ||||||||||
| Collateral given to |
Amount |
Reason for collateral | ||||||||
| Foreign financial institutions’ debt securities |
|
(*) | ||||||||
| Foreign financial institutions’ debt securities |
|
| ||||||||
| Loan at amortized cost and other financial assets |
Due from banks in local currency |
|
| |||||||
| Other due from banks in local currency |
|
| ||||||||
| Other due from banks in foreign currency |
|
| ||||||||
| Mortgage loan |
|
| ||||||||
| Premises and equipment |
Land and building |
| ||||||||
| Investment properties |
Land and building |
| ||||||||
| |
|
|||||||||
| Total |
||||||||||
| |
|
|||||||||
| (*) | |
| December 31, 2022 | ||||||||||
| Collateral given to |
Amount |
Reason for collateral | ||||||||
| Financial assets at FVTPL |
Korean treasury and government bonds, etc. |
|
(*1) | |||||||
| Korean treasury and government bonds, etc. |
|
| ||||||||
| Korean treasury and government bonds, etc. |
|
| ||||||||
| Korean financial institutions’ debt securities, etc. |
|
| ||||||||
| Korean financial institutions’ debt securities, etc. |
|
(*1) | ||||||||
| Korean capital contributions, etc. |
||||||||||
| December 31, 2022 | ||||||||||
| Collateral given to |
Amount |
Reason for collateral | ||||||||
| Financial assets at FVTOCI |
Korean treasury and government bonds |
|
(*1) | |||||||
| Korean financial institutions’ debt securities, etc. |
|
| ||||||||
| Debt securities in foreign currencies |
||||||||||
| Debt securities in foreign currencies |
(*1) | |||||||||
| Securities at amortized cost |
Korean treasury and government bonds |
|
(*1) | |||||||
| Korean treasury and government bonds |
||||||||||
| Debt securities in foreign currencies |
(*1) | |||||||||
| Debt securities in foreign currencies |
||||||||||
| Loan at amortized cost and other financial assets |
Due from banks in local currency |
|
| |||||||
| Other due from banks in local currency |
|
| ||||||||
| Other due from banks in foreign currency |
Korea Investment & Securities, etc. |
| ||||||||
| Mortgage loan |
|
| ||||||||
| Premises and equipment |
Land and building |
|
(*2) | |||||||
| Investment properties |
Land and building |
|
(*2) | |||||||
| |
|
|||||||||
| Total |
||||||||||
| |
|
|||||||||
| (*1) | The Group has the agreements to repurchase the sold assets at the predetermined price or the price that includes the rate of return and to provide the guarantee on the assets. The transferee has the right to sell or to provide as guarantee. Therefore, the Group does not derecognize the assets, but recognizes the relevant amounts as liability (bonds sold under repurchase agreements). The asset is equivalent to a mortgage-backed debt security. |
| (*2) | |
| (2) | As of December 31, 2021 and 2022 there is no asset acquired through foreclosures. |
December 31, 2021 |
December 31, 2022 |
|||||||
| Investment properties |
||||||||
| Land |
||||||||
| Building |
||||||||
| Sub-total |
||||||||
| Other assets |
||||||||
| Land for non-business use |
||||||||
| Building for non-business use(*1) |
||||||||
| Movables for non-business use(*2) |
||||||||
| Real estate assessment provision for non-business use |
( |
) | ( |
) | ||||
| Sub-total |
||||||||
| Assets held for sale |
||||||||
| Land |
||||||||
| Building |
||||||||
| Others |
||||||||
| Sub-total |
||||||||
| |
|
|
|
|||||
| Total |
||||||||
| |
|
|
|
|||||
| (*1) | |
| (*2) | |
| (3) | Securities loaned are as follows (Unit: Korean Won in millions): |
December 31, 2021 |
December 31, 2022 |
Loaned to | ||||||||||
| Financial assets at FVTOCI |
Korean treasury and government bonds |
| ||||||||||
| (4) | Collaterals held that can be disposed and re-subjected to lien regardless of defaults of counterparties |
| December 31, 2021 | ||||
| Fair values of collaterals |
Fair values of collaterals were disposed or re-subjected to lien | |||
| Securities |
||||
| December 31, 2022 | ||||
| Fair values of collaterals |
Fair values of collaterals were disposed or re-subjected to lien | |||
| Securities |
||||
December 31, 2021 |
December 31, 2022 |
|||||||
| Lease assets |
||||||||
| Prepaid expenses |
||||||||
| Advance payments |
||||||||
| Non-operational assets |
||||||||
| Others |
||||||||
| |
|
|
|
|||||
| Total |
||||||||
| |
|
|
|
|||||
| (1) | Financial liabilities at FVTPL are as follows (Unit: Korean Won in millions): |
December 31, 2021 |
December 31, 2022 |
|||||||
| Financial instruments at fair value through profit or loss measured at fair value |
||||||||
| |
|
|
|
|||||
| Total |
||||||||
| |
|
|
|
|||||
| (2) | Financial liabilities at fair value through profit or loss measured at fair value are as follows (Unit: Korean Won in millions): |
December 31, 2021 |
December 31, 2022 |
|||||||
| Deposits |
||||||||
| Gold banking liabilities |
||||||||
| Borrowings |
||||||||
| Securities sold |
||||||||
| Derivative liabilities |
||||||||
| |
|
|
|
|||||
| Total |
||||||||
| |
|
|
|
|||||
December 31, 2021 |
December 31, 2022 |
|||||||
| Deposits in local currency: |
||||||||
| Deposits on demand |
||||||||
| Deposits at termination |
||||||||
| Mutual installment |
||||||||
| Deposits on notes payables |
||||||||
| Deposits on CMA |
||||||||
| Certificate of deposits |
||||||||
| Other deposits |
||||||||
| |
|
|
|
|||||
| Sub-total |
||||||||
| |
|
|
|
|||||
| Deposits in foreign currencies: |
||||||||
| Deposits in foreign currencies |
||||||||
| Present value discount |
( |
) | ( |
) | ||||
| |
|
|
|
|||||
| Sub-total |
||||||||
| |
|
|
|
|||||
| Customers’ deposits for beneficiary |
||||||||
| |
|
|
|
|||||
| Total |
||||||||
| |
|
|
|
|||||
22. |
BORROWINGS AND DEBENTURES |
| (1) | Details of borrowings are as follows (Unit: Korean Won in millions): |
| December 31, 2021 |
||||||||||
| Lenders |
Interest rate (%) |
Amount |
||||||||
| Borrowings in local currency: |
||||||||||
| Borrowings from The BOK |
||||||||||
| Borrowings from government funds |
||||||||||
| Others |
||||||||||
| |
|
|||||||||
| Sub-total |
||||||||||
| |
|
|||||||||
| Borrowings in foreign currencies: |
||||||||||
| Borrowings in foreign currencies |
( |
|||||||||
| Bills sold |
||||||||||
| Call money |
( |
|||||||||
| Bonds sold under repurchase agreements |
( |
|||||||||
| Present value discount |
( |
) | ||||||||
| |
|
|||||||||
| Total |
||||||||||
| |
|
|||||||||
| (*) | As of December 31, 2021, foreign currency borrowings subject to fair value hedges were included in the amount of |
| December 31, 2022 |
||||||||||
| Lenders |
Interest rate (%) |
Amount |
||||||||
| Borrowings in local currency: |
||||||||||
| Borrowings from The BOK |
||||||||||
| Borrowings from government funds |
||||||||||
| Others |
||||||||||
| |
|
|||||||||
| Sub-total |
||||||||||
| |
|
|||||||||
| Borrowings in foreign currencies: |
||||||||||
| Borrowings in foreign currencies |
( |
|||||||||
| Bills sold |
||||||||||
| Call money |
||||||||||
| Bonds sold under repurchase agreements |
||||||||||
| Present value discount |
( |
) | ||||||||
| |
|
|||||||||
| Total |
||||||||||
| |
|
|||||||||
| (2) | Details of debentures are as follows (Unit: Korean Won in millions): |
December 31, 2021 |
December 31, 2022 |
|||||||||||||||
Interest rate (%) |
Amount |
Interest rate (%) |
Amount |
|||||||||||||
| Face value of bond (*) : |
||||||||||||||||
| Ordinary bonds |
||||||||||||||||
| Subordinated bonds |
||||||||||||||||
| Other bonds |
||||||||||||||||
| |
|
|
|
|||||||||||||
| Sub-total |
||||||||||||||||
| |
|
|
|
|||||||||||||
| Discounts on bonds |
( |
) | ( |
) | ||||||||||||
| |
|
|
|
|||||||||||||
| Total |
||||||||||||||||
| |
|
|
|
|||||||||||||
(*) |
W on and W on as of December 31, 2021 and 2022 respectively. Also, debentures under cash flow hedge amounting to W on and W on are included as of December 31, 2021 and 2022 respectively. |
| (1) | Details of provisions are as follows (Unit: Korean Won in millions): |
December 31, 2021 |
December 31, 2022 |
|||||||
| Asset retirement obligation |
||||||||
| Provisions for guarantees (*1) |
||||||||
| Provisions for unused loan commitments |
||||||||
| Other provisions (*2) |
||||||||
| |
|
|
|
|||||
| Total |
||||||||
| |
|
|
|
|||||
| (*1) | W on and W on as of December 31, 2021 and 2022, respectively. |
| (*2) | |
| (2) | Changes in provisions for guarantees and unused loan commitments are as follows (Unit: Korean Won in millions): |
| 1) | Provisions for guarantees |
For the year ended December 31, 2020 |
||||||||||||||||
Stage1 |
Stage2 |
Stage3 |
Total |
|||||||||||||
| Beginning balance |
||||||||||||||||
| Transfer to 12-month expected credit loss |
( |
) | ( |
) | ||||||||||||
| Transfer to expected credit loss for the entire period |
( |
) | ( |
) | ||||||||||||
| Transfer to credit-impaired financial assets |
( |
) | ( |
) | ||||||||||||
| Net provision (reversal) of unused amount |
( |
) | ( |
) | ( |
) | ( |
) | ||||||||
| Changes due to business combinations |
||||||||||||||||
| Others (*) |
||||||||||||||||
| |
|
|
|
|
|
|
|
|||||||||
| Ending balance |
||||||||||||||||
| |
|
|
|
|
|
|
|
|||||||||
| (*) | |
For the year ended December 31, 2021 |
||||||||||||||||
Stage1 |
Stage2 |
Stage3 |
Total |
|||||||||||||
| Beginning balance |
||||||||||||||||
| Transfer to 12-month expected credit loss |
( |
) | ( |
) | ||||||||||||
| Transfer to expected credit loss for the entire period |
( |
) | ( |
) | ||||||||||||
| Transfer to credit-impaired financial assets |
( |
) | ( |
) | ||||||||||||
| Provisions used |
( |
) | ( |
) | ||||||||||||
| Net provision (reversal) of unused amount |
( |
) | ( |
) | ( |
) | ||||||||||
| Others (*) |
||||||||||||||||
| |
|
|
|
|
|
|
|
|||||||||
| Ending balance |
||||||||||||||||
| |
|
|
|
|
|
|
|
|||||||||
| (*) | Recognized as a result of new financial guarantee contract valued at initial fair value. |
For the year ended December 31, 2022 |
||||||||||||||||
Stage1 |
Stage2 |
Stage3 |
Total |
|||||||||||||
| Beginning balance |
||||||||||||||||
| Transfer to 12-month expected credit loss |
( |
) | ||||||||||||||
| Transfer to expected credit loss for the entire period |
( |
) | ||||||||||||||
| Transfer to credit-impaired financial assets |
( |
) | ( |
) | ||||||||||||
| Provisions used |
||||||||||||||||
| Net provision (reversal) of unused amount |
( |
) | ||||||||||||||
| Others (*) |
( |
) | ( |
) | ||||||||||||
| |
|
|
|
|
|
|
|
|||||||||
| Ending balance |
|
|
||||||||||||||
| |
|
|
|
|
|
|
|
|||||||||
| (*) | Recognized as a result of new financial guarantee contract valued at initial fair value. |
| 2) | Provisions for unused loan commitment |
For the year ended December 31, 2020 |
||||||||||||||||
Stage1 |
Stage2 |
Stage3 |
Total |
|||||||||||||
| Beginning balance |
||||||||||||||||
| Transfer to 12-month expected credit loss |
( |
) | ( |
) | ||||||||||||
| Transfer to expected credit loss for the entire period |
( |
) | ( |
) | ||||||||||||
| Transfer to credit-impaired financial assets |
( |
) | ( |
) | ||||||||||||
| Net provision (reversal) of unused amount |
( |
) | ( |
) | ||||||||||||
| Changes due to business combinations |
||||||||||||||||
| Others |
( |
) | ( |
) | ||||||||||||
| |
|
|
|
|
|
|
|
|||||||||
| Ending balance |
|
|
|
|
||||||||||||
| |
|
|
|
|
|
|
|
|||||||||
For the year ended December 31, 2021 |
||||||||||||||||
Stage1 |
Stage2 |
Stage3 |
Total |
|||||||||||||
| Beginning balance |
||||||||||||||||
| Transfer to 12-month expected credit loss |
( |
) | ( |
) | ||||||||||||
| Transfer to expected credit loss for the entire period |
( |
) | ( |
) | ||||||||||||
| Transfer to credit-impaired financial assets |
( |
) | ( |
) | ||||||||||||
| Net provision (reversal) of unused amount |
( |
) | ( |
) | ( |
) | ||||||||||
| Others |
||||||||||||||||
| |
|
|
|
|
|
|
|
|||||||||
| Ending balance |
|
|
|
|
||||||||||||
| |
|
|
|
|
|
|
|
|||||||||
For the year ended December 31, 2022 |
||||||||||||||||
Stage1 |
Stage2 |
Stage3 |
Total |
|||||||||||||
| Beginning balance |
|
|
|
|||||||||||||
| Transfer to 12-month expected credit loss |
( |
) | ( |
) | ||||||||||||
| Transfer to expected credit loss for the entire period |
( |
) | ( |
) | ||||||||||||
| Transfer to credit-impaired financial assets |
( |
) | ( |
) | |
|||||||||||
| Net provision (reversal) of unused amount |
( |
) | |
( |
) | ( |
) | |||||||||
| Others |
||||||||||||||||
| Ending balance |
|
|
|
|||||||||||||
| |
|
|
|
|
|
|
|
|
|
|
|
|
|
|
|
|
| |
|
|
|
|
|
|
|
|||||||||
| (3) | Changes in asset retirement obligation for the years ended December 31, 2020, 2021 and 2022 are as follows (Unit: Korean Won in millions): |
For the years ended December 31 |
||||||||||||
2020 |
2021 |
2022 |
||||||||||
| Beginning balance |
||||||||||||
| Provisions provided |
||||||||||||
| Provisions used |
( |
) | ( |
) | ( |
) | ||||||
| Reversal of provisions unused |
( |
) | ( |
) | ( |
) | ||||||
| Unwinding of discount |
||||||||||||
| Business combination |
||||||||||||
| Increase (decrease) of restoration expense, etc. |
||||||||||||
| |
|
|
|
|
|
|||||||
| Ending balance |
||||||||||||
| |
|
|
|
|
|
|||||||
| (4) | Changes in other provisions for the years ended December 31, 2020, 2021 and 2022 are as follows (Unit: Korean Won in millions): |
For the years ended December 31 |
||||||||||||
2020 |
2021 |
2022 |
||||||||||
| Beginning balance |
||||||||||||
| Provisions provided |
||||||||||||
| Provisions used |
( |
) | ( |
) | ( |
) | ||||||
| Reversal of provisions unused (*) |
( |
) | ( |
) | ( |
) | ||||||
| Foreign currencies translation adjustments |
( |
) | ||||||||||
| Transfer |
( |
) | ||||||||||
| Others |
( |
) | ||||||||||
| |
|
|
|
|
|
|||||||
| Ending balance |
||||||||||||
| |
|
|
|
|
|
|||||||
(*) |
The Group provided Korean Won settlement services for trading transaction settlement between Korea and Iran, investigated by U.S. prosecutors (federal prosecutors, New York state prosecutors) and New York State Department of Financial Services for violations of U.S. sanctions against Iran, Sudan, Syria and Cuba. In this regard, the Office of Foreign Assets Control concluded its investigation in December 2020 urging the bank’s attention without taking any additional sanctions, and New York State Department of Financial Services concluded its investigation in February 2022 without taking any additional sanctions. Meanwhile, in June 2022, the Group reversed the provision related to the investigation of the U.S. Prosecutors, which have not been completed yet, in consideration of the opinion of an independent legal expert that the probability of sanctions by the U.S. Prosecutors in this case is low. |
| (5) | Others |
| 1) | The Group recognized the provision of the estimated compensation amount related to the miss-selling of the Derivative Linked Fund (DLF) incurred during 2019 and a fine expected to be imposed by the Financial Supervisory Service as the best estimate for the expenditure required to meet its obligations at the end of the reporting period. |
| 2) | For the year ended December 31, 2020, the Group recognized the provisions as the best estimate due to the expected losses of clients arising from the delay in the redemption of funds by Lime Asset Management and the dispute settlement by the Financial Supervisory Service. As of December 31, 2022, the provision for this case is W on. |
| 3) | On October 22, 2021, the Group made a resolution to pay in advance for Platform Asia funds, etc., which are delayed in redemption at the Board of Directors Meeting of Woori Bank, the subsidiary. Provisions for estimated compensation amounts related to the prepayment was recognized as the best estimate of the expenditure. As of December 31, 2022, the sales revenue for Platform Asia, Heritage DLS, and Gen2 DLS sold W on, W on, and W on, respectively, and provisions is W on, W on, and W on, respectively. |
24. |
NET DEFINED BENEFIT LIABILITY(ASSET) |
Volatility of asset |
The defined benefit obligation was estimated with an interest rate calculated based on blue chip corporate bonds earnings. A deficit may occur if the rate of return of plan assets falls short of the interest rate. | |
| Decrease in profitability of blue-chip bonds |
A decrease in profitability of blue-chip bonds will be offset by some increase in the value of debt securities that the employee benefit plan owns but will bring an increase in the defined benefit obligation. | |
| Risk of inflation |
Defined benefit obligations are related to inflation rate; the higher the inflation rate is, the higher the level of liabilities. Therefore, deficit occurs in the system if an inflation rate increases. | |
(1) |
Details of net defined benefit liability are as follows (Unit: Korean Won in millions): |
December 31, 2021 |
December 31, 2022 |
|||||||
| Present value of defined benefit obligation |
||||||||
| Fair value of plan assets |
( |
) | ( |
) | ||||
| |
|
|
|
|||||
| Net defined benefit liabilities (*) |
( |
) | ||||||
| |
|
|
|
|||||
| (*) | Net defined benefit liability of W on as of December 31, 2021 are the subtracted amount of the net defined benefit asset of W on from the net defined benefit liability of W on as of December 31, 2022 are the subtracted amount of the net defined benefit liability of W on from the net defined benefit assets of |
| (2) | Changes in the carrying value of defined benefit obligation are as follows (Unit: Korean Won in millions): |
For the years ended December 31 |
||||||||||||||
2020 |
2021 |
2022 |
||||||||||||
| Beginning balance |
||||||||||||||
| Current service cost |
||||||||||||||
| Interest cost |
||||||||||||||
| Remeasurements |
Financial assumption | ( |
) | ( |
) | ( |
) | |||||||
| Demographic assumptions |
( |
) | ( |
) | ||||||||||
| Experience adjustments |
( |
) | ( |
) | ( |
) | ||||||||
| Retirement benefit paid |
( |
) | ( |
) | ( |
) | ||||||||
| Foreign currencies translation adjustments |
( |
) | ( |
) | ||||||||||
| Changes due to business combinations |
||||||||||||||
| Others |
( |
) | ( |
) | ||||||||||
| |
|
|
|
|
|
|||||||||
| Ending balance |
||||||||||||||
| |
|
|
|
|
|
|||||||||
(3) |
Changes in the plan assets are as follows (Unit: Korean Won in millions): |
For the years ended December 31 |
||||||||||||
2020 |
2021 |
2022 |
||||||||||
Beginning balance |
||||||||||||
Interest income |
||||||||||||
Remeasurements |
( |
) |
( |
) |
( |
) | ||||||
Employer’s contributions |
||||||||||||
Retirement benefit paid |
( |
) |
( |
) |
( |
) | ||||||
Changes due to business combination |
||||||||||||
Others |
( |
) |
( |
) |
( |
) | ||||||
Ending balance |
||||||||||||
(4) |
The fair value of the plan assets by composition as of December 31, 2021 and 2022 are as follows (Unit: Korean Won in millions): |
December 31, 2021 |
December 31, 2022 |
|||||||
Cash and due from banks |
||||||||
(5) |
Amounts related to the defined benefit plan that are recognized in the consolidated statements of comprehensive income are as follows (Unit: Korean Won in millions): |
For the years ended December 31 |
||||||||||||
2020 |
2021 |
2022 |
||||||||||
Current service cost |
||||||||||||
Net interest income (expense) |
( |
) | ( |
) | ||||||||
Cost recognized in net income |
||||||||||||
Remeasurements (*) |
( |
) | ( |
) | ( |
) | ||||||
Cost recognized in total comprehensive income |
( |
) | ||||||||||
(*) |
Amount before tax |
| ( 6 ) |
Key actuarial assumptions used in net defined benefit liability measurement are as follows: |
December 31, 2020 |
December 31, 2021 |
December 31, 2022 | ||||
| Discount rate | ||||||
Future wage growth rate |
||||||
| Mortality rate | ||||||
Retirement rate |
| ( 7 ) |
The sensitivity to actuarial assumptions used in the assessment of defined benefit obligation is as follows (Unit: Korean Won in millions): |
December 31, 2021 |
December 31, 2022 |
|||||||||
Discount rate |
Increase by 1% point | ( |
) | ( |
) | |||||
| Decrease by 1% point | ||||||||||
Future wage growth rate |
Increase by 1% point | |||||||||
| Decrease by 1% point | ( |
) | ( |
) | ||||||
December 31, 2021 |
December 31, 2022 |
|||||||
Other financial liabilities: |
||||||||
Accounts payable |
||||||||
Accrued expenses |
||||||||
Borrowings from trust accounts |
||||||||
Agency business revenue |
||||||||
Foreign exchange payables |
||||||||
Domestic exchange settlement credits |
||||||||
Lease liabilities |
||||||||
Other miscellaneous financial liabilities |
||||||||
Present value discount |
( |
) | ( |
) | ||||
Sub-total |
||||||||
Other liabilities: |
||||||||
Unearned income |
||||||||
Other miscellaneous liabilities |
||||||||
Sub-total |
||||||||
Total |
||||||||
| (1) | Derivative assets and derivative liabilities are as follows (Unit: Korean Won in millions): |
December 31, 2021 |
||||||||||||||||||||||||||||
Assets |
Liabilities |
|||||||||||||||||||||||||||
Nominal amount |
For cash flow hedge |
For fair value hedge |
For trading |
For cash flow hedge |
For fair value hedge |
For trading |
||||||||||||||||||||||
Interest rate: |
||||||||||||||||||||||||||||
Futures |
||||||||||||||||||||||||||||
Forwards |
||||||||||||||||||||||||||||
Swaps |
||||||||||||||||||||||||||||
Purchase options |
||||||||||||||||||||||||||||
Written options |
||||||||||||||||||||||||||||
Currency: |
||||||||||||||||||||||||||||
Futures |
||||||||||||||||||||||||||||
Forwards |
||||||||||||||||||||||||||||
Swaps |
||||||||||||||||||||||||||||
Purchase options |
||||||||||||||||||||||||||||
Written options |
||||||||||||||||||||||||||||
Equity: |
||||||||||||||||||||||||||||
Futures |
||||||||||||||||||||||||||||
Forwards |
||||||||||||||||||||||||||||
Swaps |
||||||||||||||||||||||||||||
Purchase options |
||||||||||||||||||||||||||||
Written options |
||||||||||||||||||||||||||||
Total |
||||||||||||||||||||||||||||
December 31, 2022 |
||||||||||||||||||||||||||||
Assets |
Liabilities |
|||||||||||||||||||||||||||
Nominal amount |
For cash flow hedge |
For fair value hedge |
For trading |
For cash flow hedge |
For fair value hedge |
For trading |
||||||||||||||||||||||
| Interest rate: |
||||||||||||||||||||||||||||
| Futures |
||||||||||||||||||||||||||||
| Forwards |
||||||||||||||||||||||||||||
| Swaps |
||||||||||||||||||||||||||||
| Purchase options |
||||||||||||||||||||||||||||
| Written options |
||||||||||||||||||||||||||||
| Currency: |
||||||||||||||||||||||||||||
| Futures |
||||||||||||||||||||||||||||
| Forwards |
||||||||||||||||||||||||||||
| Swaps |
||||||||||||||||||||||||||||
| Purchase options |
||||||||||||||||||||||||||||
| Written options |
||||||||||||||||||||||||||||
— |
||||||||||||||||||||||||||||
| Equity: |
||||||||||||||||||||||||||||
| Futures |
||||||||||||||||||||||||||||
| Forwards |
||||||||||||||||||||||||||||
| Swaps |
||||||||||||||||||||||||||||
| Purchase options |
||||||||||||||||||||||||||||
| Written options |
||||||||||||||||||||||||||||
| |
|
|
|
|
|
|
|
|
|
|
|
|
|
|||||||||||||||
| Total |
|
|||||||||||||||||||||||||||
| |
|
|
|
|
|
|
|
|
|
|
|
|
|
|||||||||||||||
| (2) | Overview of the Group’s hedge accounting |
| (3) | The nominal amounts of the hedging instrument are as follows (Unit: USD, AUD, EUR, and Korean Won in millions): |
December 31, 2021 |
||||||||||||||||
1 year or less |
1 year to 5 years |
More than 5 years |
Total |
|||||||||||||
| Fair value hedge |
||||||||||||||||
| Interest rate risk |
||||||||||||||||
| Interest rate swap (USD) |
||||||||||||||||
| Interest rate swap (AUD) |
||||||||||||||||
| Interest rate swap (EUR) |
||||||||||||||||
| Cash flow hedge |
||||||||||||||||
| Interest rate risk |
||||||||||||||||
| Interest rate swap (KRW) |
||||||||||||||||
| Foreign currencies translation risk and interest rate risk |
||||||||||||||||
| Currency swap (USD) |
||||||||||||||||
| Foreign currencies translation risk |
||||||||||||||||
| Currency swap (USD) |
||||||||||||||||
December 31, 2022 |
||||||||||||||||
1 year or less |
1 year to 5 years |
More than 5 years |
Total |
|||||||||||||
| Fair value hedge |
| |||||||||||||||
| Interest rate risk |
||||||||||||||||
| Interest rate swap (USD) |
||||||||||||||||
| Interest rate swap (AUD) |
||||||||||||||||
| Interest rate swap (KRW) |
||||||||||||||||
| Cash flow hedge |
||||||||||||||||
| Interest rate risk |
||||||||||||||||
| Interest rate swap (KRW) |
||||||||||||||||
| Foreign currencies translation risk and interest rate risk |
||||||||||||||||
| Currency swap (USD) |
||||||||||||||||
| Foreign currencies translation risk |
||||||||||||||||
| Currency swap (USD) |
||||||||||||||||
| Currency swap (EUR) |
||||||||||||||||
| Hedges of net investment in foreign operations |
||||||||||||||||
| Exchange risk |
||||||||||||||||
| Foreign currency bond (USD) |
|
|||||||||||||||
(4) |
The average interest rate and average currency rate of the hedging instrument as of December 31, 2021 and 2022 are as follows: |
| December 31, 2021 | ||
| Average interest rate and average exchange rate | ||
| Fair value hedge |
||
| Interest rate risk |
||
| Interest rate swap (USD) |
||
| Interest rate swap (AUD) |
||
| Interest rate swap (EUR) |
||
| Cash flow hedge |
||
| Interest rate risk |
||
| Interest rate swap (KRW) |
||
| Foreign currencies translation risk and interest rate risk |
||
| Currency swap (USD) |
||
| Foreign currencies translation risk |
||
| Currency swap (USD) |
| December 31, 2022 | ||
| Average interest rate and average exchange rate | ||
| Fair value hedge |
||
| Interest rate risk |
||
| Interest rate swap (USD) |
||
| Interest rate swap (USD) |
Fixed 2.05% receipt and (C.SOFR)+0.65% paid | |
| Interest rate swap (AUD) |
||
| Interest rate swap (KRW) |
||
| Cash flow hedge |
||
| Interest rate risk |
||
| Interest rate swap (KRW) |
||
| Interest rate swap (KRW) |
KRW CD+0.33% receipt, 1.68% paid | |
| Foreign currencies translation risk and interest rate risk |
||
| Currency swap (USD) |
||
| Foreign currencies translation risk |
||
| Currency swap (USD) |
||
| Currency swap (EUR) |
||
| Hedges of net investment |
||
| Exchanging rate risk |
||
| Foreign currency denominated debentures (KRW/USD) |
(5) |
The amounts related to items designated as hedging instruments are as follows (Unit: USD, AUD, EUR, and Korean Won in millions): |
December 31, 2021 |
||||||||||||||||||
Nominal amounts of the hedging instrument |
Carrying amount of the hedging instrument |
Line item in the statement of financial position where the hedging instrument is located |
Changing in fair value used for calculating hedge ineffectiveness |
|||||||||||||||
Assets |
Liabilities |
|||||||||||||||||
| Fair value hedge |
||||||||||||||||||
| Interest rate risk |
||||||||||||||||||
| Interest rate swap (USD) |
|
Derivative assets (designated for hedging) |
( |
) | ||||||||||||||
| Interest rate swap (AUD) |
Derivative liabilities (designated for hedging) |
|||||||||||||||||
| Interest rate swap (EUR) |
||||||||||||||||||
| Cash flow hedge |
||||||||||||||||||
| Interest rate risk |
||||||||||||||||||
| Interest rate swap (KRW) |
— | Derivative liabilities (designated for hedging) |
||||||||||||||||
| Foreign currency translation risk and interest rate risk |
||||||||||||||||||
| Currency swap (USD) |
Derivative liabilities (designated for hedging) |
|||||||||||||||||
| Foreign currency translation risk |
||||||||||||||||||
| Currency swap (USD) |
Derivative liabilities (designated for hedging) |
|||||||||||||||||
December 31, 2022 |
||||||||||||||||||
Nominal amounts of the hedging instrument |
Carrying amount of the hedging instrument |
Line item in the statement of financial position where the hedging instrument is located |
Changing in fair value used for calculating hedge ineffectiveness |
|||||||||||||||
Assets |
Liabilities |
|||||||||||||||||
| Fair value hedge |
||||||||||||||||||
| Interest rate risk |
||||||||||||||||||
| Interest rate Swap (USD) |
Derivative assets (designated for hedging) Derivative liabilities (designated for hedging) |
( |
) | |||||||||||||||
| Interest rate Swap (AUD) |
||||||||||||||||||
| Interest rate Swap (KRW) |
||||||||||||||||||
| Cash flow hedge |
||||||||||||||||||
| Interest rate risk |
||||||||||||||||||
| Interest rate swap (KRW) |
Derivative liabilities (designated for hedging) |
|||||||||||||||||
| Foreign currency translation risk and interest rate risk |
||||||||||||||||||
| Currency swap (USD) |
Derivative liabilities (designated for hedging) |
|||||||||||||||||
| Foreign currency translation risk |
||||||||||||||||||
| Currency swap (USD) |
Derivative liabilities (designated for hedging) |
|||||||||||||||||
| Currency swap (EUR) |
Derivative liabilities (designated for hedging) |
( |
) | |||||||||||||||
| Hedges of net investment in foreign operations Exchange rate risk |
||||||||||||||||||
| Foreign currency bond (USD) |
( |
) | ||||||||||||||||
(6) |
Details of carrying amount to hedge and amount due to hedge accounting are as follows (Unit: Korean Won in millions): |
December 31, 2021 |
||||||||||||||||||||||||||||
Carrying amount of the hedged item |
Accumulated amount of fair value hedge adjustments on the hedged item included in the carrying amount of the hedged item |
Line item in the statement of financial position in which the hedged item is included |
Changing in fair value used for calculating hedge ineffectiveness |
Cash flow hedge reserve (*) |
||||||||||||||||||||||||
Assets |
Liabilities |
Assets |
Liabilities |
|||||||||||||||||||||||||
| Fair value hedge |
||||||||||||||||||||||||||||
| Interest rate risk |
||||||||||||||||||||||||||||
| Debentures |
||||||||||||||||||||||||||||
| Foreign currency borrowing |
|
currency borrowings |
|
( |
) | ( |
) | |||||||||||||||||||||
| Cash flow hedge |
||||||||||||||||||||||||||||
| Interest rate risk |
||||||||||||||||||||||||||||
| Debentures |
( |
) | ||||||||||||||||||||||||||
| Foreign currencies translation risk and interest rate risk |
||||||||||||||||||||||||||||
| Debentures |
( |
) | ||||||||||||||||||||||||||
| Foreign currencies translation risk |
||||||||||||||||||||||||||||
| Debentures |
( |
) | ( |
) | ||||||||||||||||||||||||
| (*) | After tax amount |
December 31, 2022 |
||||||||||||||||||||||||||||
Carrying amount of the hedged item |
Accumulated amount of fair value hedge adjustments on the hedged item included in the carrying amount of the hedged item |
Line item in the statement of financial position in which the hedged item is included |
Changing in fair value used for calculating hedge ineffectiveness |
Cash flow hedge reserve (*) |
||||||||||||||||||||||||
Assets |
Liabilities |
Assets |
Liabilities |
|||||||||||||||||||||||||
| Fair value hedge |
||||||||||||||||||||||||||||
| Interest rate risk |
||||||||||||||||||||||||||||
| Debentures |
( |
) | ||||||||||||||||||||||||||
| Cash flow hedge |
||||||||||||||||||||||||||||
| Interest rate risk |
||||||||||||||||||||||||||||
| Debentures |
( |
) | ||||||||||||||||||||||||||
| Foreign currencies translation risk and interest rate risk |
||||||||||||||||||||||||||||
| Debentures |
( |
) | ||||||||||||||||||||||||||
| Foreign currencies translation risk |
||||||||||||||||||||||||||||
| Debentures |
( |
) | ||||||||||||||||||||||||||
| Hedges of net investment in foreign operations Exchange rate risk |
||||||||||||||||||||||||||||
| Foreign operations net asset |
|
operations net asset |
|
( |
) | |||||||||||||||||||||||
| (*) | After tax amount |
(7) |
Amounts recognized in profit or loss due to the ineffective portion of fair value hedges during the current period are as follows (Unit: Korean Won in millions): |
For the year ended December 31, 2020 | ||||||||
Hedge ineffectiveness recognized in profit or loss |
Line item in the profit or loss that includes hedge ineffectiveness | |||||||
| Fair value hedge |
Interest rate risk | ( |
) | |||||
For the year ended December 31, 2021 | ||||||||
Hedge ineffectiveness recognized in profit or loss |
Line item in the profit or loss that includes hedge ineffectiveness | |||||||
| Fair value hedge |
Interest rate risk | Other net operating income (expense) | ||||||
For the year ended December 31, 2022 | ||||||||
Hedge ineffectiveness recognized in profit or loss |
Line item in the profit or loss that includes hedge ineffectiveness | |||||||
| Fair value hedge |
Interest rate risk | Other net operating income (expense) | ||||||
| (8) | Reclassification of profit or loss from other comprehensive income and equity related to cash flow hedges are as follows (Unit: Korean Won in millions): |
For the year ended December 31, 2020 | ||||||||||||||||||||||
Changes in the value of hedging instruments recognized in OCI |
Hedge ineffectiveness recognized in profit or loss |
Changes in the value of foreign basis spread recognized in OCI |
Line item recognized in the profit or loss |
Amounts reclassified from cash flow hedge reserve to profit or loss |
Line item affected in profit or loss due to reclassification | |||||||||||||||||
| Cash flow hedge |
Interest rate risk |
( |
) | ( |
) | |||||||||||||||||
| Foreign currencies translation risk and interest rate risk |
( |
) | ( |
) | ||||||||||||||||||
| Foreign currencies translation risk |
( |
) | ( |
) | ||||||||||||||||||
For the year ended December 31, 2021 | ||||||||||||||||||||||
Changes in the value of hedging instruments recognized in OCI |
Hedge ineffectiveness recognized in profit or loss |
Changes in the value of foreign basis spread recognized in OCI |
Line item recognized in the profit or loss |
Amounts reclassified from cash flow hedge reserve to profit or loss |
Line item affected in profit or loss due to reclassification | |||||||||||||||||
| Cash flow hedge |
Interest rate risk |
|||||||||||||||||||||
| Foreign currencies translation risk and interest rate risk |
( |
) | ( |
) | ||||||||||||||||||
| Foreign currencies translation risk |
( |
) | ( |
) | ||||||||||||||||||
For the year ended December 31, 2022 | ||||||||||||||||||||||
Changes in the value of hedging instruments recognized in OCI |
Hedge ineffectiveness recognized in profit or loss |
Changes in the value of foreign basis spread recognized in OCI |
Line item recognized in the profit or loss |
Amounts reclassified from cash flow hedge reserve to profit or loss |
Line item affected in profit or loss due to reclassification | |||||||||||||||||
Cash flow hedge |
Interest rate risk |
|||||||||||||||||||||
Foreign currencies translation risk and interest rate risk |
( |
) | ( |
) | ||||||||||||||||||
Foreign currencies translation risk |
( |
) | ( |
) | ||||||||||||||||||
| (9) | The amounts recognized in profit or loss and other comprehensive income related to the hedging of net investments in foreign operations are as follows (Unit: Korean Won in millions): |
For the year ended December 31, 2022 |
||||||||||||||||
Profit or loss recognized in OCI |
Hedge ineffectiveness recognized in profit or loss |
Line item which recognized the hedge ineffectiveness |
||||||||||||||
Hedges of net investment in foreign operation |
Exchange rate risk |
|
( |
) | — | |||||||||||
For the years ended December 31 |
||||||||||||
2020 |
2021 |
2022 |
||||||||||
Beginning balance |
||||||||||||
New transactions |
||||||||||||
Amounts recognized in losses |
( |
) | ( |
) | ( |
) | ||||||
Ending balance |
||||||||||||
28. |
EQUITY |
| (1) | Details of equity as of December 31, 2021 and 2022 are as follows (Unit: Korean Won in millions): |
December 31, 2021 |
December 31, 2022 |
|||||||
Capital |
||||||||
Common stock capital |
||||||||
Hybrid securities |
||||||||
Capital surplus |
||||||||
Paid in capital in excess of par |
||||||||
Others |
||||||||
Sub-total |
||||||||
Capital adjustments |
||||||||
Treasury stocks |
( |
) | ( |
) | ||||
Other adjustments (*1) |
( |
) | ( |
) | ||||
Sub-total |
( |
) | ( |
) | ||||
Accumulated other comprehensive income |
||||||||
Financial assets at FVTOCI |
( |
) | ( |
) | ||||
Changes in capital due to equity method |
( |
) | ||||||
Gain (loss) on foreign currency translation of foreign operations |
( |
) | ( |
) | ||||
Gain (loss) on hedges of net investment in foreign operations |
— |
( |
) | |||||
Remeasurements of defined benefit plan |
( |
) | ||||||
Gain (loss) on valuation of cash flow hedge |
( |
) | ||||||
Capital related to non-current assets held for sale |
||||||||
Sub-total |
( |
) | ( |
) | ||||
Retained earnings (*2) (*3) |
||||||||
Non-controlling interest (*4) |
||||||||
Total |
||||||||
| (*1) |
| (*2) |
| (*3) | The earned surplus reserve in retained earnings amounted to W on and W on as of December 31, 2021 and 2022 in accordance with the Article 53 of the Financial Holding Company Act. |
| (*4) |
| (2) | The number of authorized shares and others of the Group are as follows: |
December 31, 2021 |
December 31, 2022 | |||
Shares of common stock authorized |
||||
Par value |
||||
Shares of common stock issued |
||||
Capital stock |
| (3) | Hybrid securities |
Issue date |
Maturity |
Interest rate (%) |
December 31, 2021 |
December 31, 2022 |
||||||||||||||||
Securities in local currency |
||||||||||||||||||||
Securities in local currency |
||||||||||||||||||||
Securities in local currency |
||||||||||||||||||||
Securities in local currency |
||||||||||||||||||||
Securities in local currency |
||||||||||||||||||||
Securities in local currency |
||||||||||||||||||||
Securities in local currency |
||||||||||||||||||||
Securities in local currency |
||||||||||||||||||||
Securities in local currency |
||||||||||||||||||||
Securities in local currency |
||||||||||||||||||||
Issuance cost |
( |
) | ( |
) | ||||||||||||||||
Total |
||||||||||||||||||||
(4) |
Accumulated other comprehensive income |
For the year ended December 31, 2020 |
||||||||||||||||||||||||
Beginning balance |
Increase (decrease) (*) |
Reclassification adjustments |
Classified as held for sale |
Income tax effect |
Ending balance |
|||||||||||||||||||
Net gain (loss) on valuation of financial assets at FVTOCI |
( |
) | ( |
) | ( |
) | ( |
) | ||||||||||||||||
Changes in capital due to equity method |
( |
) | ( |
) | ( |
) | ||||||||||||||||||
Gain (loss) on foreign currency translation of foreign operations |
( |
) | ( |
) | ( |
) | ||||||||||||||||||
Remeasurement gain (loss) related to defined benefit plan |
( |
) | ( |
) | ( |
) | ||||||||||||||||||
Gain (loss) on valuation of derivatives designated as cash flow hedges |
( |
) | ( |
) | ( |
) | ||||||||||||||||||
Capital related to noncurrent assets held for sale |
( |
) | ||||||||||||||||||||||
Total |
( |
) | ( |
) | ( |
) | ( |
) | ( |
) | ||||||||||||||
| (*) |
For the year ended December 31, 2021 |
||||||||||||||||||||
Beginning balance |
Increase (decrease) (*) |
Reclassification adjustments |
Income tax effect |
Ending balance |
||||||||||||||||
Net gain (loss) on valuation of financial assets at FVTOCI |
( |
) | ( |
) | ( |
) | ( |
) | ||||||||||||
Changes in capital due to equity method |
( |
) | ( |
) | ( |
) | ||||||||||||||
Gain (loss) on foreign currency translation of foreign operations |
( |
) | ( |
) | ( |
) | ||||||||||||||
Remeasurement gain (loss) related to defined benefit plan |
( |
) | ( |
) | ( |
) | ||||||||||||||
Gain (loss) on valuation of derivatives designated as cash flow hedges |
( |
) | ( |
) | ||||||||||||||||
Capital related to noncurrent assets held for sale |
( |
) | ||||||||||||||||||
Total |
( |
) | ( |
) | ( |
) | ||||||||||||||
| (*) | non-current assets held for sale are changes due to the period evaluation, and the reclassification adjustments amounting to (2,220) million Won, 946 million Won and (947) million Won are due to disposal of equity securities, equity method investments and non-current assets held for sale, respectively during the period. |
For the year ended December 31, 2022 |
||||||||||||||||||||
Beginning balance |
Increase (decrease) (*) |
Reclassification adjustments |
Income tax effect |
Ending balance |
||||||||||||||||
Net gain (loss) on valuation of financial assets at FVTOCI |
( |
) | ( |
) | ( |
) | ||||||||||||||
Changes in capital due to equity method |
( |
) | ( |
) | ||||||||||||||||
Gain (loss) on foreign currency translation of foreign operations |
( |
) | ( |
) | ||||||||||||||||
Gain (loss) on hedges of net investment in foreign operations |
( |
) | ( |
) | ||||||||||||||||
Remeasurement gain (loss) related to defined benefit plan |
( |
) | ( |
) | ||||||||||||||||
Gain (loss) on valuation of cash flow hedge |
( |
) | ( |
) | ( |
) | ||||||||||||||
Capital related to non-current assets held for sale |
( |
) | ||||||||||||||||||
Total |
( |
) | ( |
) | ( |
) | ||||||||||||||
| (*) | non-current assets held for sale are changes due to the period evaluation, and the reclassification adjustments amounting to (10,254) million Won and 279 million Won are due to disposal of equity securities and non-current assets held for sale, respectively during the period. |
(5) |
Treasury stock |
December 31, 2021 |
December 31, 2022 |
|||||||||||||||
Number of shares |
Carrying amount |
Number of shares |
Carrying amount |
|||||||||||||
| Beginning balance |
||||||||||||||||
| Acquisition |
||||||||||||||||
| |
|
|
|
|
|
|
|
|||||||||
| Ending balance |
||||||||||||||||
| |
|
|
|
|
|
|
|
|||||||||
29. |
DIVIDENDS |
(1) |
Dividends per share and the total dividends for the fiscal year ending December 31, 2021 were |
| ( 2 ) |
On July 22, 2022, in accordance with a resolution of the Board of Directors, the Group declared the interim dividend of |
| ( 3 ) |
A dividend in respect of the year ended December 31, 2022, of Won per share, amounting to a total dividend of W on,was approved by shareholders at the annual general meeting on March 24, 2023. These financial statements do not include this dividend payable. |
| (1) | Interest income recognized is as follows (Unit: Korean Won in millions): |
For the years ended December 31 |
||||||||||||
2020 |
2021 |
2022 |
||||||||||
| Financial assets at FVTPL |
||||||||||||
| Financial assets at FVTOCI |
||||||||||||
| Financial assets at amortized cost |
||||||||||||
| Loans and other financial assets at amortized cost |
|
|
|
|
|
|
|
|
|
|
|
|
| Interest on due from banks |
||||||||||||
| Interest on loans |
||||||||||||
| Interest of other receivables |
||||||||||||
| |
|
|
|
|
|
|||||||
| Sub-total |
||||||||||||
| |
|
|
|
|
|
|||||||
| Securities at amortized cost |
||||||||||||
| Sub-total |
||||||||||||
| |
|
|
|
|
|
|||||||
| Total |
||||||||||||
| |
|
|
|
|
|
|||||||
| (2) | Details of interest expense recognized are as follows (Unit: Korean Won in millions): |
For the years ended December 31 |
||||||||||||
2020 |
2021 |
2022 |
||||||||||
| Interest on deposits due to customers |
||||||||||||
| Interest on borrowings |
||||||||||||
| Interest on debentures |
||||||||||||
| Other interest expense |
||||||||||||
| Interest on lease liabilities |
||||||||||||
| |
|
|
|
|
|
|||||||
| Total |
||||||||||||
| |
|
|
|
|
|
|||||||
31. |
NET FEES AND COMMISSIONS INCOME |
| (1) | Details of fees and commissions income recognized are as follows (Unit: Korean Won in millions): |
For the years ended December 31 |
||||||||||||
2020 |
2021 |
2022 |
||||||||||
| Fees and commission received for brokerage |
||||||||||||
| Fees and commission received related to credit |
||||||||||||
| Fees and commission received for electronic finance |
||||||||||||
| Fees and commission received on foreign exchange handling |
||||||||||||
| Fees and commission received on foreign exchange |
||||||||||||
| Fees and commission received for guarantee |
||||||||||||
| Fees and commission received on credit card |
||||||||||||
| Fees and commission received on securities business |
||||||||||||
| Fees and commission from trust management |
||||||||||||
| Fees and commission received on credit information |
||||||||||||
| Fees and commission received related to lease |
||||||||||||
| Other fees |
||||||||||||
| |
|
|
|
|
|
|||||||
| Total |
||||||||||||
| |
|
|
|
|
|
|||||||
(2) |
Details of fees and commissions expense incurred are as follows (Unit: Korean Won in millions): |
For the years ended December 31 |
||||||||||||
2020 |
2021 |
2022 |
||||||||||
| Fees and commissions paid |
||||||||||||
| Credit card commission |
||||||||||||
| Securities business commission |
||||||||||||
| Others |
||||||||||||
| |
|
|
|
|
|
|||||||
| Total |
||||||||||||
| |
|
|
|
|
|
|||||||
| (1) | Details of dividend income recognized are as follows (Unit: Korean Won in millions): |
For the years ended December 31 |
||||||||||||
2020 |
2021 |
2022 |
||||||||||
| Dividend income related to financial assets at FVTPL |
||||||||||||
| Dividend income related to financial assets at FVTOCI |
||||||||||||
| |
|
|
|
|
|
|||||||
| Total |
||||||||||||
| |
|
|
|
|
|
|||||||
| (2) | Details of dividends related to financial assets at FVTOCI are as follows (Unit: Korean Won in millions): |
For the years ended December 31 |
||||||||||||
2020 |
2021 |
2022 |
||||||||||
| Dividend income recognized from assets held: |
||||||||||||
| Equity securities |
||||||||||||
| (1) | Details of gains or losses related to net gain or loss on financial instruments at FVTPL are as follows (Unit: Korean Won in millions): |
For the years ended December 31 |
||||||||||||
2020 |
2021 |
2022 |
||||||||||
| Gain on financial instruments at fair value through profit or loss measured at fair value |
||||||||||||
| Gain (loss) on financial instruments at fair value through profit or loss designated as upon initial recognition |
( |
) | ||||||||||
| |
|
|
|
|
|
|||||||
| Total |
||||||||||||
| |
|
|
|
|
|
|||||||
For the years ended December 31 |
||||||||||||||||
2020 |
2021 |
2022 |
||||||||||||||
| Financial assets at FVTPL |
Securities |
Gain on transactions and valuation |
||||||||||||||
| Loss on transactions and valuation |
( |
) | ( |
) | ( |
) | ||||||||||
| |
|
|
|
|
|
|||||||||||
| Sub-total |
( |
) | ||||||||||||||
| |
|
|
|
|
|
|||||||||||
| Loans |
Gain on transactions and valuation |
|||||||||||||||
| Loss on transactions and valuation |
( |
) | ( |
) | ( |
) | ||||||||||
| |
|
|
|
|
|
|||||||||||
| Sub-total |
||||||||||||||||
| |
|
|
|
|
|
|||||||||||
| Other financial assets |
Gain on transactions and valuation |
|||||||||||||||
| Loss on transactions and valuation |
( |
) | ( |
) | ( |
) | ||||||||||
| |
|
|
|
|
|
|||||||||||
| Sub-total |
||||||||||||||||
| |
|
|
|
|
|
|||||||||||
| Sub-total |
( |
) | ||||||||||||||
| |
|
|
|
|
|
|||||||||||
| Derivatives (Held for trading) |
Interest rates derivatives |
Gain on transactions and valuation |
||||||||||||||
| Loss on transactions and valuation |
( |
) | ( |
) | ( |
) | ||||||||||
| |
|
|
|
|
|
|||||||||||
| Sub-total |
( |
) | ||||||||||||||
| |
|
|
|
|
|
|||||||||||
| Currency derivatives |
Gain on transactions and valuation |
|||||||||||||||
| Loss on transactions and valuation |
( |
) | ( |
) | ( |
) | ||||||||||
| |
|
|
|
|
|
|||||||||||
| Sub-total |
( |
) | ( |
) | ||||||||||||
| |
|
|
|
|
|
|||||||||||
| Equity derivatives |
Gain on transactions and valuation |
|||||||||||||||
| Loss on transactions and valuation |
( |
) | ( |
) | ( |
) | ||||||||||
| |
|
|
|
|
|
|||||||||||
| Sub-total |
( |
) | ||||||||||||||
| |
|
|
|
|
|
|||||||||||
| Other derivatives |
Gain on transactions and valuation |
|||||||||||||||
| Loss on transactions and valuation |
( |
) | ( |
) | ( |
) | ||||||||||
| |
|
|
|
|
|
|||||||||||
| Sub-total |
( |
) | ( |
) | ||||||||||||
| |
|
|
|
|
|
|||||||||||
| Sub-total |
||||||||||||||||
| |
|
|
|
|
|
|||||||||||
| Net, Total |
||||||||||||||||
| |
|
|
|
|
|
|||||||||||
| (3) | Details of net gain (loss) on financial instruments at fair value through profit or loss designated as upon initial recognition are as follows (Unit: Korean Won in millions): |
For the years ended December 31 |
||||||||||||
2020 |
2021 |
2022 |
||||||||||
| Gain (loss) on equity-linked securities |
( |
) | ||||||||||
For the years ended December 31 |
||||||||||||
2020 |
2021 |
2022 |
||||||||||
| Loss on redemption of securities |
( |
) | ( |
) | ( |
) | ||||||
| Gain (Loss) on transaction of securities |
( |
) | ||||||||||
| |
|
|
|
|
|
|||||||
| Total |
|
|
( |
) | ||||||||
| |
|
|
|
|
|
|||||||
For the years ended December 31 |
||||||||||||
2020 |
2021 |
2022 |
||||||||||
| Reversal(provision) due to credit loss on financial assets measured at FVTOCI |
( |
) | ( |
) | ||||||||
| Provision for impairment loss due to credit loss on securities at amortized cost |
( |
) | ( |
) | ||||||||
| Provision for impairment loss due to credit loss on loan and other financial assets at amortized cost |
( |
) | ( |
) | ( |
) | ||||||
| Provision for(reversal of) provision on guarantee |
( |
) | ||||||||||
| Reversal of(provision for) unused loan commitment |
( |
) | ||||||||||
| |
|
|
|
|
|
|||||||
| Total |
( |
) | ( |
) | ( |
) | ||||||
| |
|
|
|
|
|
|||||||
| (1) | Details of general and administrative expenses recognized are as follows (Unit: Korean Won in millions): |
For the years ended December 31 |
||||||||||||||||
2020 |
2021 |
2022 |
||||||||||||||
| Employee benefits |
Short-term employee benefits | Salaries | ||||||||||||||
| Employee fringe benefits |
||||||||||||||||
| Share based payment | ||||||||||||||||
| Retirement benefit service costs | ||||||||||||||||
| Termination | ||||||||||||||||
| |
|
|
|
|
|
|||||||||||
| Sub-total |
||||||||||||||||
| |
|
|
|
|
|
|||||||||||
| Depreciation and amortization |
||||||||||||||||
| Other general and administrative expenses |
Rent | |||||||||||||||
| Taxes and public dues | ||||||||||||||||
| Service charges | ||||||||||||||||
| Computer and IT related | ||||||||||||||||
| Telephone and communication | ||||||||||||||||
| Operating promotion | ||||||||||||||||
| Advertising | ||||||||||||||||
| Printing | ||||||||||||||||
| Traveling | ||||||||||||||||
| Supplies | ||||||||||||||||
| Insurance premium | ||||||||||||||||
| Maintenance | ||||||||||||||||
| Water, light, and heating | ||||||||||||||||
| Vehicle maintenance | ||||||||||||||||
| Others | ||||||||||||||||
| |
|
|
|
|
|
|||||||||||
| Sub-total |
||||||||||||||||
| |
|
|
|
|
|
|||||||||||
| Total |
||||||||||||||||
| |
|
|
|
|
|
|||||||||||
| (2) | Details of other operating income recognized are as follows (Unit: Korean Won in millions): |
For the years ended December 31 |
||||||||||||
2020 |
2021 |
2022 |
||||||||||
| Gain on transactions of foreign exchange |
||||||||||||
| Gain related to derivatives (Designated for hedging) |
||||||||||||
| Gain on fair value hedged items |
||||||||||||
| Others |
||||||||||||
| |
|
|
|
|
|
|||||||
| Total |
||||||||||||
| |
|
|
|
|
|
|||||||
(3) |
Details of other operating expenses recognized are as follows (Unit: Korean Won in millions): |
For the years ended December 31 |
||||||||||||
2020 |
2021 |
2022 |
||||||||||
| Losses on transactions of foreign exchange |
||||||||||||
| KDIC deposit insurance premium |
||||||||||||
| Contribution to miscellaneous funds |
||||||||||||
| Losses related to derivatives (Designated for hedging) |
||||||||||||
| Losses on fair value hedged items |
||||||||||||
| Others (*) |
||||||||||||
| |
|
|
|
|
|
|||||||
| Total |
||||||||||||
| |
|
|
|
|
|
|||||||
| (*) | Other expense includes |
| (4) | Share-based payment |
| 1) | Performance condition share-based payment |
| Subject to |
||||
| Type of payment |
||||
| Vesting period |
||||
| Date of payment |
||||
| Fair value (*1) |
||||
| Valuation method |
||||
| Expected dividend rate |
||||
| Expected maturity date |
||||
| Number of shares remaining |
As of December 31, 2021 | |||
| As of December 31, 2022 | ||||
| Number of shares granted (*2) |
As of December 31, 2021 | |||
| As of December 31, 2022 | ||||
| (*1) | |
| (*2) | pre-set performance target. Performance is evaluated by long-term performance indicators such as relative shareholder return, net profit, return on equity (ROE), non-performing loan ratio, and job performance. |
| 2) | re-measuring every closing period.W on and W on, respectively, including the carrying amount of liabilities related to key management of W on and W on, respectively. |
| (1) | Details of gains or losses on valuation of investments in joint ventures and associates are as follows (Unit: Korean Won in millions): |
For the years ended December 31 |
||||||||||||
2020 |
2021 |
2022 |
||||||||||
| Gains on valuation of investments in joint ventures and associates |
||||||||||||
| Reversal of impairment losses of investments in joint ventures and associates |
||||||||||||
| Losses on valuation of investments in joint ventures and associates |
( |
) | ( |
) | ( |
) | ||||||
| Impairment losses of investments in joint ventures and associates |
( |
) | ( |
) | ( |
) | ||||||
| |
|
|
|
|
|
|||||||
| Total |
||||||||||||
| |
|
|
|
|
|
|||||||
| (2) | Details of other non-operating income and expenses recognized are as follows (Unit: Korean Won in millions): |
For the years ended December 31 |
||||||||||||
2020 |
2021 |
2022 |
||||||||||
| Other non-operating incomes |
||||||||||||
| Other non-operating expenses |
( |
) | ( |
) | ( |
) | ||||||
| |
|
|
|
|
|
|||||||
| Total |
( |
) | ( |
) | ||||||||
| |
|
|
|
|
|
|||||||
| (3) | Details of other non-operating income recognized are as follows (Unit: Korean Won in millions): |
For the years ended December 31 |
||||||||||||
2020 |
2021 |
2022 |
||||||||||
| Rental fee income |
||||||||||||
| Gains on disposal of investments in joint ventures and associates |
||||||||||||
| Gains on disposal of premises and equipment, intangible assets and other assets |
||||||||||||
| Reversal of impairment loss of premises and equipment, intangible assets and other assets |
||||||||||||
| Others (*) |
||||||||||||
| |
|
|
|
|
|
|||||||
| Total |
||||||||||||
| |
|
|
|
|
|
|||||||
| (*) | Others include Won of profit from bargain purchase and |
| (4) | Details of other non-operating expenses recognized are as follows (Unit: Korean Won in millions): |
For the years ended December 31 |
||||||||||||
2020 |
2021 |
2022 |
||||||||||
| Depreciation on investment properties |
||||||||||||
| Operating expenses on investment properties |
||||||||||||
| Losses on disposal of investment in joint ventures and associates |
||||||||||||
| Losses on disposal of premises and equipment, intangible assets and other assets |
||||||||||||
| Impairment losses of premises and equipment, intangible assets and other assets |
||||||||||||
| Donation |
||||||||||||
| Others (*) |
||||||||||||
| |
|
|
|
|
|
|||||||
| Total |
||||||||||||
| |
|
|
|
|
|
|||||||
| (*) | Others include W on and million Won of other extraordinary losses related to other provisions for the years ended December 31, 2020 and 2021, respectively. And they include million Won of other extraordinary loss related to embezzlement accidents for the years ended December 31, 2021. Also, they include million Won of other extraordinary loss related to other provisions for the year ended December 31, 2022. |
| (1) | Details of income tax expenses are as follows (Unit: Korean Won in millions): |
For the years ended December 31 |
||||||||||||
2020 |
2021 |
2022 |
||||||||||
| Current tax expense |
||||||||||||
| Current tax expense with respect to the current period |
||||||||||||
| Adjustments recognized in the current period in relation to the tax expense of prior periods |
( |
) | ||||||||||
| Income tax expense directly attributable to other equity |
— | — | ||||||||||
| |
|
|
|
|
|
|||||||
| Sub-total |
||||||||||||
| |
|
|
|
|
|
|||||||
| Deferred tax expense |
||||||||||||
| Change in deferred tax assets (liabilities) due to temporary differences |
( |
) | ( |
) | ||||||||
| Income tax expense (income) directly attributable to equity |
( |
) | ||||||||||
| Others |
— | — | ||||||||||
| |
|
|
|
|
|
|||||||
| Sub-total |
( |
) | ( |
) | ||||||||
| |
|
|
|
|
|
|||||||
| Income tax expense |
||||||||||||
| |
|
|
|
|
|
|||||||
| (2) | Income tax expense reconciled to net income before income tax expense is as follows (Unit: Korean Won in millions): |
For the years ended December 31 |
||||||||||||
2020 |
2021 |
2022 |
||||||||||
| Net income before income tax expense |
||||||||||||
| Tax calculated at statutory tax rate (*) |
||||||||||||
| Adjustments: |
||||||||||||
| Effect of income that is exempt from taxation |
( |
) | ( |
) | ( |
) | ||||||
| Effect of expenses that are not deductible in determining taxable income |
||||||||||||
| Adjustments recognized in the current period in relation to the current tax of prior periods |
( |
) | ||||||||||
| Others |
( |
) | ||||||||||
| |
|
|
|
|
|
|||||||
| Sub-total |
( |
) | ( |
) | ||||||||
| |
|
|
|
|
|
|||||||
| Income tax expense |
||||||||||||
| |
|
|
|
|
|
|||||||
| Effective tax rate |
% | % | % | |||||||||
| (*) | |
| (3) | Changes in deferred tax assets and liabilities for the years ended December 31, 2020, 2021 and 2022, are as follows (Unit: Korean Won in millions): |
For the year ended December 31, 2020 |
||||||||||||||||||||
Beginning balance |
Business combination |
Recognized as income (expense) |
Recognized as other comprehensive income (expense) |
Ending Balance |
||||||||||||||||
| Gain (loss) on financial assets |
( |
) | ||||||||||||||||||
| Gain on valuation using the equity method of accounting |
||||||||||||||||||||
| Gain (loss) on valuation of derivatives |
( |
) | ( |
) | ( |
) | ( |
) | ||||||||||||
| Accrued income |
( |
) | ( |
) | ( |
) | ||||||||||||||
| Provision for loan losses |
( |
) | ( |
) | ||||||||||||||||
| Loan and receivables written off |
||||||||||||||||||||
| Loan origination costs and fees |
( |
) | ( |
) | ( |
) | ||||||||||||||
| Defined benefit liability |
( |
) | ||||||||||||||||||
| Deposits with employee retirement insurance trust |
( |
) | ( |
) | ( |
) | ( |
) | ||||||||||||
| Provision for guarantee |
( |
) | ||||||||||||||||||
| Other provision |
( |
) | ||||||||||||||||||
| Others (*) |
( |
) | ( |
) | ( |
) | ||||||||||||||
| |
|
|
|
|
|
|
|
|
|
|||||||||||
| Net deferred tax assets |
( |
) | ( |
) | ( |
) | ( |
) | ||||||||||||
| |
|
|
|
|
|
|
|
|
|
|||||||||||
| (*) | |
For the year ended December 31, 2021 |
||||||||||||||||
Beginning balance |
Recognized as income (expense) |
Recognized as other comprehensive income (expense) |
Ending Balance |
|||||||||||||
| Gain (loss) on financial assets |
( |
) | ||||||||||||||
| Gain on valuation using the equity method of accounting |
( |
) | ( |
) | ||||||||||||
| Gain (loss) on valuation of derivatives |
( |
) | ( |
) | ( |
) | ( |
) | ||||||||
| Accrued income |
( |
) | ( |
) | ( |
) | ||||||||||
| Provision for loan losses |
( |
) | ( |
) | ||||||||||||
| Loan and receivables written off |
||||||||||||||||
| Loan origination costs and fees |
( |
) | ( |
) | ( |
) | ||||||||||
| Defined benefit liability |
( |
) | ||||||||||||||
| Deposits with employee retirement insurance trust |
( |
) | ( |
) | ( |
) | ||||||||||
| Provision for guarantee |
( |
) | ||||||||||||||
| Other provision |
||||||||||||||||
| Others (*) |
( |
) | ( |
) | ( |
) | ||||||||||
| |
|
|
|
|
|
|
|
|||||||||
| Net deferred tax assets |
( |
) | ( |
) | ( |
) | ||||||||||
| |
|
|
|
|
|
|
|
|||||||||
| (*) | |
For the year ended December 31, 2022 |
||||||||||||||||||||
Beginning balance |
Business combination |
Recognized as income (expense) |
Recognized as other comprehensive income (expense) |
Ending Balance |
||||||||||||||||
| Gain (loss) on financial assets |
( |
) | ||||||||||||||||||
| Gain on valuation using the equity method of accounting |
( |
) | ||||||||||||||||||
| Gain (loss) on valuation of derivatives |
( |
) | ||||||||||||||||||
| Accrued income |
( |
) | ( |
) | ( |
) | ||||||||||||||
| Provision for loan losses |
( |
) | ( |
) | ||||||||||||||||
| Loan and receivables written off |
( |
) | ||||||||||||||||||
| Loan origination costs and fees |
( |
) | ( |
) | ||||||||||||||||
| Defined benefit liability |
( |
) | ||||||||||||||||||
| Deposits with employee retirement insurance trust |
( |
) | ( |
) | ( |
) | ||||||||||||||
| Provision for guarantee |
||||||||||||||||||||
| Other provision |
( |
) | ||||||||||||||||||
| Others (*) |
( |
) | ( |
) | ( |
) | ||||||||||||||
| |
|
|
|
|
|
|
|
|
|
|||||||||||
| Net deferred tax assets |
( |
) | ( |
) | ||||||||||||||||
| |
|
|
|
|
|
|
|
|
|
|||||||||||
| (*) | |
| (4) | Unrealizable temporary differences are as follows (Unit: Korean Won in millions): |
December 31, 2021 |
December 31, 2022 |
|||||||
| Deductible temporary differences |
||||||||
| Tax loss carry forward |
||||||||
| Taxable temporary differences |
( |
) | ( |
) | ||||
| |
|
|
|
|||||
| Total |
( |
) | ( |
) | ||||
| |
|
|
|
|||||
| • | The Group is able to control the timing of the reversal of the temporary difference. |
| • | It is probable that the temporary difference will |
1 year or less |
1 –2 years |
2 –3 years |
More than 3 years |
|||||||||||||
| Tax loss carry forward |
||||||||||||||||
| (5) | Details of accumulated deferred tax charged directly to other equity are as follows (Unit: Korean Won in millions): |
December 31, 2021 |
December 31, 2022 |
|||||||
| Gain on valuation of financial assets at FVTOCI |
||||||||
| Gain on valuation of equity method investments |
( |
) | ||||||
| Gain on foreign currency translation of foreign operations |
||||||||
| Gain on valuation of hedge accounting of the net investment in foreign operations |
— | |||||||
| Remeasurements of the net defined benefit liability |
( |
) | ||||||
| Gain on derivatives designated as cash flow hedge |
( |
) | ( |
) | ||||
| |
|
|
|
|||||
| Total |
||||||||
| |
|
|
|
|||||
| (6) | Current tax assets and liabilities are as follows (Unit: Korean Won in millions): |
December 31, 2021 |
December 31, 2022 |
|||||||
| Current tax assets |
||||||||
| Current tax liabilities |
||||||||
| (1) | Basic EPS is calculated by dividing net income attributable to common shareholders by weighted-average number of common shares outstanding (Unit: Korean Won in millions, except for EPS and number of shares): |
For the years ended December 31 |
||||||||||||
2020 |
2021 |
2022 |
||||||||||
| Net income attributable to common shareholders |
||||||||||||
| Dividends to hybrid securities |
( |
) | ( |
) | ( |
) | ||||||
| Net income attributable to common shareholders |
||||||||||||
| Weighted average number of common shares outstanding (Unit: million shares) |
||||||||||||
| Basic EPS (Unit: Korean Won) |
||||||||||||
| (2) | The weighted average number of common shares outstanding is as follows (Unit: number of shares, days): |
| For the year ended December 31, 2021 |
||||||||||||||
| Period |
Number of shares |
Dates (Unit: Day) |
Accumulated number of shares outstanding during period |
|||||||||||
| Common shares issued at the beginning of the period |
2021-01-01 2021-12-31 |
|||||||||||||
| Treasury stocks |
2021-01-01 2021-12-31 |
( |
) | ( |
) | |||||||||
| Issuance of new shares (comprehensive share exchange) |
2021-08-10 2021-12-31 |
|||||||||||||
| Acquisition of treasury stocks |
2021-08-10 2021-12-31 |
( |
) | ( |
) | |||||||||
| |
|
|
|
|
|
|
||||||||
| Sub-total (①) |
|
|||||||||||||
| |
|
|||||||||||||
| Weighted average number of common shares outstanding (②=(①/365) |
|
|||||||||||||
| |
|
|||||||||||||
| For the year ended December 31, 2022 |
||||||||||||||
| Period |
Number of shares |
Dates (Unit: Day) |
Accumulated number of shares outstanding during period |
|||||||||||
| Common shares issued at the beginning of the period |
2022-01-01 2022-12-31 |
|||||||||||||
| Treasury stocks |
2022-01-01 2022-12-31 |
( |
) | ( |
) | |||||||||
| |
|
|
|
|
|
|
||||||||
| Sub-total (①) |
|
|||||||||||||
| |
|
|||||||||||||
| Weighted average number of common shares outstanding (②=(①/365) |
|
|||||||||||||
| |
|
|||||||||||||
| (1) | Details of guarantees are as follows (Unit: Korean Won in millions): |
December 31, 2021 |
December 31, 2022 |
|||||||
| Confirmed guarantees |
||||||||
| Guarantee for loans |
||||||||
| Acceptances |
||||||||
| Guarantees in acceptances of imported goods |
||||||||
| Other confirmed guarantees |
||||||||
| |
|
|
|
|||||
| Sub-total |
||||||||
| |
|
|
|
|||||
| Unconfirmed guarantees |
||||||||
| Local letters of credit |
||||||||
| Letters of credit |
||||||||
| Other unconfirmed guarantees |
||||||||
| |
|
|
|
|||||
| Sub-total |
||||||||
| |
|
|
|
|||||
| Commercial paper purchase commitments and others |
||||||||
| |
|
|
|
|||||
| Total |
||||||||
| |
|
|
|
|||||
| (*) | Includes financial guarantees of |
| (2) | Details of unused loan commitments and others are as follows (Unit: Korean Won in millions): |
December 31, 2021 |
December 31, 2022 |
|||||||
| Loan commitments |
||||||||
| Other commitments (*) |
||||||||
| (*) | As of December 31, 2021 and 2022, the amount of unsecured bills (purchase note sales) and discounts on electronic short-term bond sales (purchase) are |
| (3) | Litigation case |
| (4) | Other commitments |
| 1) | |
2) |
, has agreed to carry out construction completion obligations for 87 constructions, which includes the construction of residential and commercial complexes in Busan (U-dong, Haeundae-gu). Land Trust responsible for Construction |
and Management is a trust that bears the obligation to fulfill the responsibility of the constructor and to compensate the loan financial institution for damages if the Group fails to fulfill the construction completion obligation. As of December 31, 2022, the total PF loan amount of PF loan institutions invested in the project of the Land Trust responsible for Construction and Management is 3,607,592 million Won. Although additional losses may occur in relation to the construction completion obligations, the financial statements as of December 31, 2022 do not reflect these effects since losses are unlikely and the amount cannot be estimated reliably. |
| 3) | Pursuant to some contracts related to asset securitization, the Group utilizes various prerequisites as triggering events causing early redemption, limiting risks that investors bear due to change in asset quality. Breach of such triggering clause leads to an early redemption of the securitized bonds. |
| 4) | As of December 31, 2022, Woori Asset Trust Co., Ltd, a subsidiary, is able to borrow part of its total business expense related to its 13 development trust contracts including Boutique Terrace Haeundae Hotel from trust accounts, and the maximum amount of additional loan amount (unused loan commitment) is s . |
41. |
RELATED PARTY TRANSACTIONS |
| (1) | Assets and liabilities from transactions with related parties are as follows (Unit: Korean Won in millions): |
| Related parties |
Account title |
December 31, 2021 |
December 31, 2022 |
|||||||||
| |
W Service Networks Co., Ltd. |
Loans | ||||||||||
| Deposits due to customers | ||||||||||||
| Accrued expenses | ||||||||||||
| Other liabilities | ||||||||||||
| Korea Credit Bureau Co., Ltd. |
Loans | |||||||||||
| Deposits due to customers | ||||||||||||
| Other liabilities | ||||||||||||
| Korea Finance Security Co., Ltd. |
Loans | |||||||||||
| Loss allowance | ( |
) | ( |
) | ||||||||
| Deposits due to customers | ||||||||||||
| Other liabilities | ||||||||||||
| LOTTE CARD Co. Ltd. |
Loans | |||||||||||
| Account receivables | ||||||||||||
| Loss allowance | ( |
) | ( |
) | ||||||||
| Other assets | ||||||||||||
| Deposits due to customers | ||||||||||||
| Other liabilities | ||||||||||||
| K BANK Co., Ltd. |
Loans | |||||||||||
| Account receivables | ||||||||||||
| Other liabilities | ||||||||||||
| Related parties |
Account title |
December 31, 2021 |
December 31, 2022 |
|||||||||
| Others (*1) |
Loans | |||||||||||
| Loss allowance | ( |
) | ( |
) | ||||||||
| Other assets | ||||||||||||
| Deposits due to customers | ||||||||||||
| Other liabilities | ||||||||||||
| (*1) | |
| (2) | Gain or loss from transactions with related parties are as follows (Unit: Korean Won in millions): |
For the years ended December 31 |
||||||||||||||||
| Related parties |
Account title |
2020 |
2021 |
2022 |
||||||||||||
| |
W Service Network Co., Ltd. |
Other income |
||||||||||||||
| Interest expenses |
||||||||||||||||
| Fees expenses |
||||||||||||||||
| Reversal of allowance for credit losses |
( |
) | ||||||||||||||
| Other expenses |
||||||||||||||||
| Korea Credit Bureau Co., Ltd. |
Interest expenses |
|||||||||||||||
| Fees expenses |
||||||||||||||||
| Other expenses |
||||||||||||||||
| Korea Finance Security Co., Ltd. |
Interest income |
|||||||||||||||
| Interest expenses |
||||||||||||||||
| Provision of allowance for credit losses |
||||||||||||||||
| Other expenses |
||||||||||||||||
| Chin Hung International Inc. |
Interest expenses |
|||||||||||||||
| Reversal of allowance for credit losses |
( |
) | ||||||||||||||
| LOTTE CARD Co., Ltd. |
Interest income |
|||||||||||||||
| Fees income |
||||||||||||||||
| Interest expenses |
||||||||||||||||
| Provision (Reversal) of allowance for credit losses |
( |
) | ( |
) | ||||||||||||
| K BANK Co., Ltd. |
Fees income |
|||||||||||||||
| Fees expenses |
||||||||||||||||
| Well to Sea No.3 Private Equity Fund |
Interest income |
|||||||||||||||
| Interest expenses |
||||||||||||||||
| Reversal of allowance for credit loss |
( |
) | ||||||||||||||
| Others (*1) |
Interest income |
|||||||||||||||
| Fees income |
||||||||||||||||
| Dividends income |
||||||||||||||||
| Other income |
||||||||||||||||
| Interest expenses |
||||||||||||||||
| Provision of allowance for credit loss |
||||||||||||||||
| Provision of impairment losses due to credit loss |
||||||||||||||||
| (*1) | |
| (3) | Major loan transactions with related parties for the years ended December 31, 2020, 2021 and 2022 are as follows (Unit: Korean Won in millions): |
For the year ended December 31, 2020 |
||||||||||||||||||
| Related parties |
Beginning balance |
Loan |
Collection |
Ending balance (*) |
||||||||||||||
| Associates |
W Service Network Co., Ltd. | |||||||||||||||||
| Korea Credit Bureau Co., Ltd. | ||||||||||||||||||
| Korea Finance Security Co., Ltd. | ||||||||||||||||||
| LOTTE CARD Co., Ltd. | ||||||||||||||||||
| K BANK Co., Ltd. | ||||||||||||||||||
| Well to Sea No. 3 Private Equity Fund | ||||||||||||||||||
(*) |
Payments that occurred for business reasons among related parties are excluded and net increase or decrease was used for limited credit loan |
For the year ended December 31, 2021 |
||||||||||||||||||||||
| Related parties |
Beginning balance |
Loan |
Collection |
Others |
Ending balance (*) |
|||||||||||||||||
| Associates |
W Service Network Co., Ltd. | |||||||||||||||||||||
| Korea Credit Bureau Co., Ltd. | ||||||||||||||||||||||
| Korea Finance Security Co., Ltd. | ||||||||||||||||||||||
| LOTTE CARD Co., Ltd. | ||||||||||||||||||||||
| K BANK Co., Ltd. | ||||||||||||||||||||||
| Godo Kaisha Oceanos 1 | ( |
) | ||||||||||||||||||||
| Woori Zip 1 | ( |
) | ||||||||||||||||||||
| Woori Zip 2 | ( |
) | ||||||||||||||||||||
(*) |
Payments that occurred for business reasons among related parties are excluded and net increase or decrease was used for limited credit loan. |
For the year ended December 31, 2022 |
||||||||||||||||||||||
| Related parties |
Beginning balance |
Loan |
Collection |
Others |
Ending balance (*) |
|||||||||||||||||
| Associates |
W Service Network Co., Ltd. | |||||||||||||||||||||
| Korea Credit Bureau Co., Ltd. | ||||||||||||||||||||||
| Korea Finance Security Co., Ltd. | ||||||||||||||||||||||
| LOTTE CARD Co., Ltd. | ||||||||||||||||||||||
| K BANK Co., Ltd. | ||||||||||||||||||||||
| Godo Kaisha Oceanos 1 | ( |
) | ||||||||||||||||||||
| Woori Zip 1 | ( |
) | ||||||||||||||||||||
| Woori Zip 2 | ( |
) | ||||||||||||||||||||
| Central Network Solutions Co., Ltd. | ||||||||||||||||||||||
(*) |
Payments that occurred for business reasons among related parties are excluded and net increase or decrease was used for limited credit loan. |
| (4) | Details of changes in major deposits due to customers with related parties for the years ended December 31, 2020, 2021 and 2022 are as follows (Unit: Korean Won in millions): |
For the year ended December 31, 2020 |
||||||||||||||||||
| Related parties |
Beginning balance |
Increase |
Decrease |
Ending balance (*) |
||||||||||||||
| Associates |
W Service Networks Co., Ltd | |||||||||||||||||
| Chin Hung International Inc | ||||||||||||||||||
| Partner One Value Up I Private Equity Fund | ||||||||||||||||||
| Korea Credit Bureau Co., Ltd. | ||||||||||||||||||
For the year ended December 31, 2021 |
||||||||||||||||||
| Related parties |
Beginning balance |
Increase |
Decrease |
Ending balance (*) |
||||||||||||||
| Associates |
W Service Networks Co., Ltd | |||||||||||||||||
| Partner One Value Up I Private Equity Fund | ||||||||||||||||||
| Korea Credit Bureau Co., Ltd. | ||||||||||||||||||
| (*) | Details of payment between related parties, demand deposit due to customers and etc. are excluded. |
For the year ended December 31, 2022 |
||||||||||||||||||
| Related parties |
Beginning balance |
Increase |
Decrease |
Ending balance (*) |
||||||||||||||
| Associates |
W Service Networks Co., Ltd | |||||||||||||||||
| Partner One Value Up I Private Equity Fund | ||||||||||||||||||
| Korea Credit Bureau Co., Ltd. | ||||||||||||||||||
(*) |
Details of payment between related parties, demand deposit due to customers and etc. are excluded. |
(5) |
There are no major borrowing transactions with related parties for the years ended December 31, 2021 and 2022. |
| (6) | Guarantees provided to the related parties are as follows (Unit: Korean Won in millions): |
| Warrantee |
December 31, 2021 |
December 31, 2022 |
Warranty |
|||||||||
| Korea Finance Security Co., Ltd. |
Unused loan commitment | |||||||||||
| Korea Credit Bureau Co., Ltd. |
Unused loan commitment | |||||||||||
| W Service Network Co., Ltd. |
Unused loan commitment | |||||||||||
| K BANK Co., Ltd. |
Unused loan commitment | |||||||||||
| LOTTE CARD Co. Ltd. |
Unused loan commitment | |||||||||||
| D-Custody Co., Ltd. |
Unused loan commitment | |||||||||||
| (7) | Amount of commitments with the related parties |
| Warrantee |
December 31, 2021 |
December 31, 2022 |
Warranty | |||||||
| IBK KIP Seongjang Dideemdol 1st Private Investment Limited Partnership |
Securities purchase commitment | |||||||||
| WooriG Senior Loan General Type Private Investment Trust No.1 |
Securities purchase commitment | |||||||||
| Woori Seoul Beltway Private Special Asset Fund No.1 |
Securities purchase commitment | |||||||||
| Woori-Q Corporate Restructuring Private Equity Fund |
Securities purchase commitment | |||||||||
| Union Technology Finance Investment Association |
Securities purchase commitment | |||||||||
| Genesis Eco No.1 Private Equity Fund |
Securities purchase commitment | |||||||||
| Genesis Environmental Energy Company 1st Private Equity Fund |
Securities purchase commitment | |||||||||
| JC Assurance No.2 Private Equity Fund |
Securities purchase commitment | |||||||||
| Crevisse Raim Impact 1st Startup Venture Specialist Private Equity Fund |
Securities purchase commitment | |||||||||
| WooriG Oncorp Corporate support of Major Industry General Type Private Investment Trust (Type 2) |
Securities purchase commitment | |||||||||
| BTS 2nd Private Equity Fund |
Securities purchase commitment | |||||||||
| STASSETS FUND III |
Securities purchase commitment | |||||||||
| Together Korea Government Private Securities Investment Trust No.3 |
Securities purchase commitment | |||||||||
| (8) | Major investment and Recovery transactions |
For the year ended December 31, 2021 |
||||||||
| Related parties |
Investment and others (*) |
Recovery and others (*) |
||||||
| Woori China Mainland Stock Securities Investment Trust |
— | |||||||
| Woori Long-term government bond securities Investment Trust No.1 |
— | |||||||
| Woori New MMF No.3 |
— | |||||||
| Woori Multi-Return Securities Investment Trust 1 |
— | |||||||
| Woori Multi-Return Securities Investment Trust 2 (Balanced Bond) |
— | |||||||
| Woori Short term Plus Securities Investment Trust |
— | |||||||
| Woori Smart New Deal 30 Target Conversion Securities Investment trust No.3 |
— | |||||||
| Woori Smart Balance Securities Investment Trust (Stock) |
— | |||||||
| Woori ACE Public Offering stock Alpha Securities Investment Trust (Bond Mixed) |
— |
|||||||
| WooriG Oncorp Corporate support of Major Industry General Type Private Investment Trust (Type 2) |
— |
|||||||
| WooriG Public Offering stock 10 securities Investment Trust [Bond mixed] C(F) |
— |
|||||||
| WooriG IGIS Securities Investment Trust [Bond] C(F) |
— |
|||||||
(*) |
Investment and recovery transactions of associates are described in Note 13.(2) |
For the year ended December 31, 2022 |
||||||||
| Related parties |
Investment and others (*) |
Recovery and others (*) |
||||||
| Woori High Plus Short-term High Graded ESG Bond Sec Feeder Inv Trust 1 |
||||||||
| Woori High Plus Bond Sec Feeder Inv Trust 3(USD) |
||||||||
| Woori BANKPLUS IPO 10 FEEDER FUND 2(BALANCED BOND) |
||||||||
| Woori Two-year Bond Securities Investment Trust 2(Bond) |
||||||||
| Woori China Mainland Stock Securities Investment Trust H(Securities) |
||||||||
| Woori Long-term government bond securities Investment Trust No.1 |
||||||||
| Woori Republic of Korea Treasury Bond Active ETF(Bond) |
||||||||
| Woori K-New Opening Target Return Securities Investment Trust(Equity) |
||||||||
| Woori 2023 Maturity Securities Investment Trust(Bond) |
||||||||
| Woori 2024 Maturity Securities Investment Trust 1(Bond) |
||||||||
| Woori BIG SATISFACTION SHINJONG MMF 3RD |
||||||||
| Woori MULTI RETURN PRIVATE EQUITY 1 |
||||||||
| Woori 2024 December Maturity Securities Investment Trust 1(Bond) |
||||||||
| Woori Two-year Bond Securities Investment Trust 3(Bond) |
||||||||
| Woori G Oncorp Corporate support of Major Industry General Type Private Investment Trust (Type 2) |
||||||||
(*) |
Investment and recovery transactions of associates are described in Note 13.(2) |
| (9) | Compensation for key management is as follows (Unit: Korean Won in millions): |
For the years ended December 31 |
||||||||||||
2020 |
2021 |
2022 |
||||||||||
| Short-term employee salaries |
||||||||||||
| Retirement benefit service costs |
||||||||||||
| Share-based compensation |
||||||||||||
| |
|
|
|
|
|
|||||||
| Total |
||||||||||||
| |
|
|
|
|
|
|||||||
42. |
LEASES |
| (1) | Lessor |
| 1) | Finance lease |
| ① | The total investment in finance lease and the present value of the minimum lease payments to be recovered are as follows (Unit: Korean Won in millions): |
December 31, 2021 |
||||||||
Total investment in lease |
Net investment in lease |
|||||||
| Within one year |
||||||||
| After one year but within two years |
||||||||
| After two years but within three years |
||||||||
| After three years but within four years |
||||||||
| After four years but within five years |
||||||||
| After five years |
||||||||
| |
|
|
|
|||||
| Total |
||||||||
| |
|
|
|
|||||
December 31, 2022 |
||||||||
Total investment in lease |
Net investment in lease |
|||||||
| Within one year |
||||||||
| After one year but within two years |
||||||||
| After two years but within three years |
||||||||
| After three years but within four years |
||||||||
| After four years but within five years |
||||||||
| After five years |
||||||||
| |
|
|
|
|||||
| Total |
||||||||
| |
|
|
|
|||||
| ② | The unrealized interest income of the finance lease is as follows (Unit: Korean Won in millions): |
December 31, 2021 |
December 31, 2022 |
|||||||
| Total investment in lease |
||||||||
| Net investment in lease |
||||||||
| Present value of minimum lease payments |
||||||||
| Present value of unguaranteed residual value |
||||||||
| |
|
|
|
|||||
| Unearned interest income |
||||||||
| |
|
|
|
|||||
| 2) | Operating lease |
| ① | The details of operating lease assets are as follows (Unit: Korean Won in millions): |
December 31, 2021 |
December 31, 2022 |
|||||||
| Prepaid lease assets |
||||||||
| Operating lease assets |
||||||||
| Acquisition cost |
||||||||
| Accumulated depreciation |
( |
) | ( |
) | ||||
| Net carrying value |
||||||||
| |
|
|
|
|||||
| Total |
||||||||
| |
|
|
|
|||||
| ② | The details of changes in operating lease assets as of December 31, 2022 are as follows and there is no details of changes in operating lease assets as of December 31, 2021 (Unit: Korean Won in millions) |
December 31, 2021 |
December 31, 2022 |
|||||||
| Beginning balance |
||||||||
| Acquisition |
||||||||
| Disposal |
( |
) | ( |
) | ||||
| Depreciation |
( |
) | ( |
) | ||||
| Others |
||||||||
| |
|
|
|
|||||
| Ending balance |
||||||||
| |
|
|
|
|||||
| ③ | The future lease payments to be received under the lease contracts are as follows (Unit: Korean Won in millions): |
December 31, 2021 |
December 31, 2022 |
|||||||
| Within one year |
||||||||
| After one year but within two years |
||||||||
| After two years but within three years |
||||||||
| After three years but within four years |
||||||||
| After four years but within five years |
||||||||
| |
|
|
|
|||||
| Total |
||||||||
| |
|
|
|
|||||
| ④ | There is no adjusted lease payments recognized as profit or loss for the years ended December 31, 2021 and 2022. |
| (2) | Lessee |
| 1) | The future lease payments under the lease contracts are as follows (Unit: Korean Won in millions): |
December 31, 2021 |
December 31, 2022 |
|||||||
| Lease payments |
||||||||
| Within one year |
||||||||
| After one year but within five years |
||||||||
| After five years |
||||||||
| |
|
|
|
|||||
| Total |
||||||||
| |
|
|
|
|||||
| 2) | Total cash outflows from lease are as follows (Unit: Korean Won in millions): |
For the years ended December 31 |
||||||||
2021 |
2022 |
|||||||
| Total cash outflows from lease |
||||||||
3) |
Details of lease payments that are not included in the measurement of lease liabilities due to the fact that they are short-term leases or leases for which the underlying asset is low value are as follows (Unit: Korean Won in millions): |
For the years ended December 31 |
||||||||
2021 |
2022 |
|||||||
| Lease payments for short-term leases |
||||||||
| Lease payments for which the underlying asset is of low value |
||||||||
| |
|
|
|
|||||
| Total |
||||||||
| |
|
|
|
|||||
| (3) | The Group uses a practical expedient that does not assess whether it is a lease change to the rend discount incurred directly as a result of COVID-19. Accordingly, the amount recognized in profit or loss during the reporting period is W on, to reflect changes in lease payments arising from the rent concession. |
43. |
BUSINESS COMBINATION |
| 1) | As of the acquisition date, the transfer price, acquisition assets, liabilities, and non-controlling interests related to the business combination are as follows (Unit: Korean Won in millions): |
Amount |
||||
| Fair value of transfer price |
||||
| Cash |
||||
| Amount recognized as assets and liabilities |
||||
| Cash and cash equivalents |
||||
| Financial assets at amortized cost |
||||
| Other assets |
||||
| Borrowings |
||||
| Other liabilities |
||||
| Fair value of identifiable net assets |
||||
| Non-controlling interests (*1) |
||||
| Goodwill |
||||
(*1) |
Represents amount of a proportionate interest of the fair value of indentifiable net assets. |
| 2) | Assuming that the acquisition date of PT Woori Finance Indonesia Tbk by the Group is the commencement date of the financial statements, the consolidated income and consolidated net income are KRW |
44. |
EVENTS AFTER THE REPORTING PERIOD |