UNITED STATES
SECURITIES AND EXCHANGE COMMISSION
Washington, D.C. 20549
FORM
(Mark One) | |
ANNUAL REPORT PURSUANT TO SECTION 13 OR 15(d) OF THE SECURITIES EXCHANGE ACT OF 1934 | |
For the Fiscal Year Ended | |
Or | |
TRANSITION REPORT PURSUANT TO SECTION 13 OR 15(d) OF THE SECURITIES EXCHANGE ACT OF 1934 | |
For the Transition Period from to . | |
Commission File Number
(Exact name of registrant as specified in its charter)
|
|
(Address of principal executive offices) (Zip Code)
(
(Registrant’s telephone number, including area code)
Securities registered pursuant to Section 12(b) of the Act:
Title of each class | Trading Symbol(s) | Name of Exchange |
(Nasdaq Global Market) |
Securities registered pursuant to Section 12(g) of the Act: None
Indicate by check mark if the registrant is a well-known seasoned issuer, as defined in Rule 405 of the Securities Act. Yes ◻
Indicate by check mark if the registrant is not required to file reports pursuant to Section 13 or 15(d) of the Securities Exchange Act of 1934. Yes ◻
Indicate by check mark whether the registrant: (1) has filed all reports required to be filed by Section 13 or 15(d) of the Securities Exchange Act of 1934 during the preceding 12 months (or for such shorter period that the registrant was required to file such reports), and (2) has been subject to such filing requirements for the past 90 days.
Indicate by check mark whether the registrant has submitted electronically every Interactive Data File required to be submitted pursuant to Rule 405 of Regulation S-T (§ 232.405 of this chapter) during the preceding 12 months (or for such shorter period that the registrant was required to submit such files).
Indicate by check mark whether the registrant is a large accelerated filer, an accelerated filer, a non-accelerated filer, a smaller reporting company, or an emerging growth company. See definitions of “large accelerated filer,” “accelerated filer,” “smaller reporting company,” and “emerging growth company” in Rule 12b-2 of the Exchange Act.
Large accelerated filer ◻ | Non-accelerated filer ◻ | Smaller reporting company | Emerging growth company |
If an emerging growth company, indicate by check mark if the Registrant has elected not to use the extended transition period for complying with any new or revised financial accounting standards provided pursuant to Section 13(a) of the Exchange Act. ☐
Indicate by check mark whether the registrant has filed a report on and attestation to its management’s assessment of the effectiveness of its internal control over financial reporting under Section 404(b) of the Sarbanes-Oxley Act (15 U.S.C. 7262(b)) by the registered public accounting firm that prepared or issued its audit report.
If securities are registered pursuant to Section 12(b) of the Act, indicate by check mark whether the financial statements of the registrant included in the filing reflect the correction of an error to previously issued financial statements.
Indicate by check mark whether any of those error corrections are restatements that required a recovery analysis of incentive-based compensation received by any of the registrant’s executive officers during the relevant recovery period pursuant to § 240.10D-1(b). ☐
Indicate by check mark whether the registrant is a shell company (as defined in Rule 12b-2 of the Exchange Act). Yes
The aggregate market value of the voting and non-voting common equity held by non-affiliates computed by reference to the price at which the common equity was last sold, as reported on the Nasdaq Global Market, as of the last business day of the registrant’s most recently completed second fiscal quarter was $
On March 6, 2024 there were
DOCUMENTS INCORPORATED BY REFERENCE
None.
TABLE OF CONTENTS
i
CAUTIONARY STATEMENT REGARDING FORWARD-LOOKING INFORMATION
This Annual Report on Form 10-K (this “10-K”) contains statements that constitute forward-looking statements as that term is defined by the Private Securities Litigation Reform Act of 1995, as amended. These statements concern our business, operations and financial performance and condition as well as our plans, objectives and expectations for our business operations and financial performance and condition, which are subject to risks and uncertainties. All statements other than statements of historical fact included in this 10-K are forward-looking statements. These statements may include words such as “aim,” “anticipate,” “assume,” “believe,” “can have,” “could,” “due,” “estimate,” “expect,” “goal,” “intend,” “likely,” “may,” “objective,” “plan,” “potential,” “positioned,” “predict,” “should,” “target,” “will,” “would” and other words and terms of similar meaning in connection with any discussion of the timing or nature of future operating or financial performance or other events or trends. For example, all statements we make relating to our plans and objectives for future operations, growth or initiatives and strategies are forward-looking statements.
These forward-looking statements are based on current expectations, estimates, forecasts and projections about our business and the industry in which we operate and our management’s beliefs and assumptions. We derive many of our forward-looking statements from our own operating budgets and forecasts, which are based upon many detailed assumptions. While we believe that our assumptions are reasonable, we caution that predicting the impact of known factors is very difficult, and we cannot anticipate all factors that could affect our actual results.
All of our forward-looking statements are subject to risks and uncertainties that may cause our actual results to differ materially from our expectations. Important factors that could cause actual results to differ materially from our expectations include, but are not limited to:
| ● | our ability to adequately complete projects in a timely manner; |
| ● | our ability to compete successfully in the highly competitive energy services market; |
| ● | our reliance on work from our top ten clients; |
| ● | changes in state, local and regional economies and government budgets; |
| ● | our ability to win new contracts, to renew existing contracts and to compete effectively for contracts awarded through bidding processes; |
| ● | our ability to make principal and interest payments on our outstanding debt as they come due and to comply with the financial covenants contained in our debt agreements; |
| ● | our ability to manage supply chain constraints, labor shortages, rising interest rates, and rising inflation; |
| ● | our ability to obtain financing and to refinance our outstanding debt as it matures; |
| ● | our ability to successfully integrate our acquisitions and execute on our growth strategy; and |
| ● | our ability to attract and retain managerial, technical, and administrative talent. |
The above is not a complete list of factors or events that could cause actual results to differ from our expectations, and we cannot predict all of them. All written and oral forward-looking statements attributable to us, or persons acting on our behalf, are expressly qualified in their entirety by the cautionary statements disclosed under “Risk Factors,” “Management’s Discussion and Analysis of Financial Condition and Results of Operations” and elsewhere in this Annual Report on Form 10-K, as such disclosures may be amended, supplemented or superseded from time to time by other reports we file with the Securities and Exchange Commission, including subsequent Annual Reports on Form 10-K and Quarterly Reports on Form 10-Q, Current Reports on Form 8-K, and public communications. You should evaluate all forward-looking statements made in this Annual Report on Form 10-K and otherwise in the context of these risks and uncertainties.
1
Potential investors and other readers are urged to consider these factors carefully in evaluating the forward-looking statements and are cautioned not to place undue reliance on any forward-looking statements we make. These forward-looking statements speak only as of the date of this Annual Report on Form 10-K and are not guarantees of future performance or developments and involve known and unknown risks, uncertainties and other factors that are in many cases beyond our control. Except as required by law, we undertake no obligation to update or revise any forward-looking statements publicly, whether as a result of new information, future developments or otherwise.
2
PART I
ITEM 1. BUSINESS
Overview
Willdan Group, Inc. (“Willdan”) is a provider of professional, technical and consulting services to utilities, private industry, and public agencies at all levels of government. As resource and infrastructure needs undergo continuous change, we help organizations and their communities evolve and thrive by providing a wide range of technical services for energy solutions, greenhouse gas reduction, and government infrastructure. Through engineering, program management, policy advisory, and software and data management, we plan, design and deliver trusted, comprehensive, innovative, and proven solutions to improve efficiency, resiliency, and sustainability in energy and infrastructure to our clients.
The company was founded in 1964 to serve public agencies in communities with populations ranging from 10,000 to 300,000 people. Willdan, a Delaware corporation, was formed in 2006 to serve as our holding company for the expanding subsidiary operations. We commenced providing energy efficiency services in 2008 and since then, through organic growth and acquisitions, our client base has grown to include investor-owned and other public utilities, as well as substantial energy users in government and business.
Our overall growth strategy revolves around a combination of strong organic expansion and strategic acquisitions which provides us the ability to expand the breadth and depth of the services we provide to new and existing clients. We believe that we are well positioned to capitalize on the ongoing expansion and transformation of the energy and infrastructure environments as they adapt to climate change, electrification, and technology advancements.
We operate our business through a nationwide network of offices spread across 22 states, the District of Columbia, the Canadian province of Alberta, and the Commonwealth of Puerto Rico. We serve a majority of the largest investor-owned electric utilities and over half of the largest municipal utilities in the United States (“U.S.”). Our business with public and private utilities has concentrations in California and New York, but includes numerous other utilities in the Midwest, Southeast and Mountain states and additional acquisitions may continue to expand our geographic footprint. Our business with public agencies is concentrated in California, New York, and Arizona. We also serve special districts, school districts, and a large range of public agencies and private industry throughout the U.S.
Our broad portfolio of services operates within two financial reporting segments: (i) Energy and (ii) Engineering and Consulting. The interfaces and synergies between these segments are important elements of our strategy to design and deliver trusted, comprehensive, innovative, and proven solutions and services for our customers.
Our Markets
We operate in the energy services market and the engineering and consulting market. We provide a wide variety of services related to energy planning and analysis, energy efficiency and sustainability, engineering, construction management, and economic and financial consulting services primarily to public agencies, utilities, and commercial/industrial firms.
We believe the energy services market will continue to expand in response to the increasing awareness of global warming, climate change issues, and the advent of new technologies in renewable energy generation and the electrification of the nation’s economy. Private industry and public agencies increasingly seek out cost-effective, turnkey solutions that provide innovative plans, tools, and solutions to address energy efficiency, renewable energy, water conservation and sustainability. State and local governments frequently turn to specialized resource conservation firms to help strike the balance between environmental responsibility and economic competitiveness. The use of energy services, including audits, program design, benchmark analysis, metering and incentivized sale and installation of energy efficiency measures provides public agencies, utilities, and commercial/industrial firms with the ability to realize long-term energy savings and greenhouse gas reductions.
3
The engineering and consulting market has grown as public agencies and utilities, as well as private utilities and commercial/industrial firms, find it more efficient to outsource design, construction oversight, advisory, and training services to contract providers, rather than maintain the necessary staff and resources to provide such services themselves. For example, we serve as municipal engineers and building and safety departments for local governments. We also design and provide construction oversight of various infrastructure projects for state and local governments to address environmental goals and mandates, population shifts, changes in local and state funding and aging infrastructure. We also provide consulting services to public agencies as they raise the necessary funds to develop such infrastructure projects and provide other services. Relatedly, we provide local government staffing, traffic and transportation engineering, studies, plan reviews, grant support, and inspections.
We are a professional services firm focused on transformational growth and value creation for our clients, employees and shareholders. We seek to establish long-term close working relationships with our clients and expand the breadth and depth of the services we provide to them over time. We believe the market for these services is, and will be, driven by a number of factors, including:
| ● | Demand for services and solutions that provide energy efficiency, greenhouse gas reduction, sustainability, electrification, water conservation, infrastructure development and renewable energy in the public and private sectors; |
| ● | Changes in technology that affect the generation, distribution and consumption of energy; |
| ● | Ongoing efforts to upgrade aging energy infrastructure to meet power, transmission, and environmental goals and requirements; |
| ● | The increasing challenge to balance energy demand from electrification and trends toward electric vehicles with the changing sources of energy from wind, solar, and distributed energy resources; |
| ● | The need for small and medium sized communities to obtain highly specialized services without incurring the costs of hiring permanent staffing and the associated support structure; |
| ● | Financial assistance from utilities, government-funded programs and state legislation for local communities to provide services to constituents; and |
| ● | Changes in government policy. |
Our Services
We offer services in two financial reporting segments: (i) Energy and (ii) Engineering and Consulting. Management established these segments based upon the services provided, the different marketing strategies associated with these services, and the specialized needs of their respective clients.
The following table presents the approximate percentage of our consolidated contract revenue attributable to each financial reporting segment.
Fiscal Year | |||||||
| 2023 |
| 2022 |
| 2021 |
| |
Energy | 84 | % | 83 | % | 81 | % | |
Engineering and Consulting |
| 16 | % | 17 | % | 19 | % |
During fiscal year 2023, we derived 22.7% of our Energy segment contract revenues from two customers, the Los Angeles Department of Water and Power (“LADWP”) and the Dormitory Authority State of New York (“DASNY”). During fiscal year 2023, we had no individual customers that accounted for more than 10% of our Engineering and Consulting segment contract revenues.
4
For further information related to our financial reporting segments, see Part II, Item 8, Note 9, Segment and Geographical Information, of the Notes to Consolidated Financial Statements included in this Annual Report on Form 10-K.
Energy Services
Our Energy segment provides specialized, innovative, and comprehensive energy solutions to businesses, utilities, state agencies, municipalities, and non-profit organizations. Our experienced engineers, consultants, and staff help our clients realize cost and energy savings by tailoring efficient and cost-effective solutions to assist in optimizing energy spend. Our energy services include comprehensive audit and surveys, program design, master planning, demand reduction, grid optimization, benchmarking analyses, design engineering, construction management, performance contracting, installation, alternative financing, measurement and verification services, and advances in software and data analytics for long term planning.
Our energy services include the following:
Energy Efficiency. We provide complete energy efficiency consulting and engineering services, including program design, management and administration; marketing, customer outreach and project origination; energy audits and feasibility analyses; implementation; training; management; retro-commissioning; data management and reporting; measurement and verification services; and construction management.
Program Design and Implementation. We assist utilities and governmental clients with the design, development and implementation of energy efficiency plans and programs. These plans include the design, outreach, and implementation of strategies to reduce peak energy demand and greenhouse gas emissions through energy efficiency, water conservation, and renewable energy planning.
Direct Customer Support. We assist clients (including hospitals, hotels, government offices, schools, and private industry) in developing and managing facilities and related infrastructures through a holistic, practical approach to facility management. Our services cover audits, local compliance, operations and maintenance review, renewable energy planning, master plan development, infrastructure analyses, Leadership in Energy and Environmental Design (“LEED”) certification for buildings, and strategies for energy spend and greenhouse gas reduction.
Turnkey Facility and Infrastructure Projects. We provide turnkey/design-build facility and infrastructure improvement projects to a wide array of private and public clients including municipalities, county governments, public and private K-12 schools, and higher education institutions. Our services cover preliminary planning, project design, construction management, commissioning, post-project support and measurement and verification.
Project Examples. The following are examples of typical projects in the Energy segment:
| ● | Consolidated Edison, New York. We serve as Consolidated Edison’s program manager and implementer for its Small Business Direct Install (“SMB”) program across the utility’s New York City and Westchester County service areas. The SMB program, Consolidated Edison’s largest energy efficiency program, helps customers save energy, lower their bills, and protect the environment by providing financial incentives to identify and install certain energy efficiency measures. To support this effort, we provide full-service program implementation, including outreach and direct sales to potential commercial customers, on-site energy efficiency assessments, direct implementation of energy-savings measures, and subcontractor and trade-ally management. |
| ● | Dormitory Authority-State New York (“DASNY”), New York. In connection with our acquisition of substantially all of the assets of Genesys Engineering, P.C. (“Genesys”) in March 2016, we entered into an administrative services agreement with Genesys pursuant to which we, through our subsidiary Willdan Energy Solutions (“WES”), provide Genesys with ongoing administrative, operational and other non-professional support services in its performance of rehabilitation, construction management, architectural, and engineering services at various college and university sites within New York State. Services for |
5
| DASNY under these contracts also include energy efficient design, utility cost evaluation, and various regulatory compliance services. Specific project descriptions are set out by DASNY in work authorizations, which are issued under the terms of the master contracts. |
| ● | Marshak Science Building Rehabilitation, The City University of New York. Performed under the DASNY master contract, the Marshak Science Building is a mid-rise, 750,000 square-foot science building, which consists of a 350,000 square-foot, 13-story tower and a 300,000 square-foot plaza level and underground. The science building houses research and teaching labs, a vivarium, a morgue, office areas, a library, an auditorium, a gymnasium and a pool. We were responsible for the study, design, and construction management that included the retrofit of 200 standard-flow fume hoods to low-flow, high-efficiency hoods and the installation of high-entrainment fume hood exhaust systems, new lab make-up air units with heat recovery, liquid desiccant dehumidification systems, new supply air risers and general exhaust risers throughout the tower, new hot water and chilled water risers, new central station air handling equipment, new high-temperature hot water to low-temperature hot water heat exchangers, and a lab fit-out with chilled beam secondary heating and cooling. |
| ● | Pueblo School District 70 Infrastructure Improvement, Colorado. Pueblo School District 70 has 25+ schools and support facilities covering approximately 1.5 million square-feet. We were responsible for development, design, and construction management of nearly 150 energy efficiency and infrastructure improvement projects district wide. These projects included multiple building additions, several major interior renovations, district-wide LED upgrade, 10 building-wide HVAC and controls projects, 11 roof replacements, a dozen major parking lot improvements and replacements, and multiple CCTV and public address system replacements. |
| ● | San Diego Gas and Electric (“SDG&E”), California. We provided peak-load reduction and energy capacity to SDG&E by coordinating the installation of proven energy efficiency measures, including chiller retrofits, chiller variable-frequency drives (“VFDs”), HVAC VFDs, evaporative cooling, demand control ventilation, two-way valves, and chilled water pump VFDs. These measures produced both peak-load reductions and energy savings. |
| ● | Entergy Corporation, Louisiana. We supported Entergy’s investments in grid data and analytics capabilities across its electric distribution footprint through a software license for LoadSEER. LoadSEER was developed to provide unique insights and modeling capability for distributed energy resources and the evolving distribution grid. The application is used in short- and long-term circuit-level planning and to proactively integrate renewables, energy storage, and efficiency investments. LoadSEER combines multi-layer risk, geospatial, and scenario modeling; utilities’ existing tools; engineering efforts; and multiple data sources in order to deliver dynamic, granular load profiles and perform valuation analyses. |
| ● | Commercial Energy Efficiency Programs. Southern California Edison has contracted with us to develop, implement, and offer these programs to SCE customers. We are the implementer of the Commercial Program, which is targeted to help SCE customers lower their energy bills and reduce demand and energy usage by providing technical services, connection to financing, and financial incentives to identify and install energy efficiency measures. To support this effort, we provide full-service program implementation, including customer outreach, performing energy audits, and facilitating installation and verifying savings of approved energy efficiency measures. |
| ● | City of New York – LL97 Implementation Action Plan. We developed a plan for New York City that identifies the most feasible route to achieving the City’s deep decarbonization, energy efficiency, and clean and renewable electricity goals. The plan is designed to balance policy compliance, technical and practical feasibility, and cost considerations, and will result in more than 50% greenhouse gas emissions reductions from City government infrastructure and energy system upgrades in City buildings by 2030. Each City agency now has actionable targets and an initial pathway to meeting them under the plan. The effort included the virtual survey of more than 4,000 publicly owned facilities in the city, detailed building energy modeling of prototypical city facilities, and transformation of these analyses into a comprehensive |
6
| plan for the implementation of new renewable electricity sources, a heat electrification initiative, improved building energy efficiency and changes in wastewater, transportation, and other processes to meet the established goals. |
Engineering and Consulting Services
Our Engineering and Consulting segment provides civil engineering-related construction management, building and safety, city engineering office management, city planning, civil design, geotechnical, material testing and other engineering consulting services to our clients. Our engineering services include traffic, bridges, rail, port, water, mining and other civil engineering projects. We also provide economic and financial consulting to public agencies. Lastly, we supplement the engineering services that we offer our clients by offering expertise and support for the various financing techniques public agencies utilize to finance their operations and infrastructure. We also support the mandated reporting and other requirements associated with these financings. We provide financial advisory services for municipal securities but do not provide underwriting services.
In general, contracts for engineering and consulting services are awarded by public agencies based primarily upon the qualifications of the engineering or consulting professional, rather than the proposed fees. We have longstanding relationships with many of these agencies and are recognized as having relevant expertise and customer focused services. A substantial percentage of our work is for existing clients that we have served for many years.
Our Engineering and Consulting services include the following:
Building and Safety. Our building and safety services range from managing and staffing an entire municipal building department to providing specific outsourced services, such as plan review and field inspections for code compliance. Other related services under this umbrella include performing accessibility compliance and providing disaster recovery teams, energy compliance evaluations, permit processing and issuance, seismic retrofitting programs, and structural plan review. Many of our building and safety services contracts are with municipalities and counties where we supplement the capacity of in-house staff.
City Engineering and Code Enforcement. We provide municipalities with city engineering services related to the public works department needs and assist with the development, implementation and enforcement of building and development codes. These services are tailored to the unique needs of each municipality, ranging from staffing an entire engineering department to carrying out specific projects within a municipality.
Development Review. We offer development plan review and inspection services including Americans with Disabilities Act (“ADA”) compliance, preliminary and final plats (maps), grading and drainage, complete infrastructure improvements for residential site plans, commercial site plans, industrial development and subdivision, and major master plan development services. We have reviewed grading plans, street lighting and traffic signal plans, erosion control plans, storm drain plans, street improvement plans, and sewer water and utility plans.
Disaster Recovery. We provide disaster recovery services to cities, counties and local government. Our experience in disaster recovery includes assisting communities in the disaster recovery process following earthquakes, firestorms, mudslides and other natural disasters. We typically organize and staff several local disaster recovery centers which function as “one-stop permit centers” that guarantee turn-around performance for fast-track plan checking and inspection services. Additionally, we have performed street and storm drain clean-up, replacement or repair of damaged storm drains, streets, and bridges, debris management and preparation and implementation of a near-term erosion and sediment control program.
Geotechnical. Our geotechnical and earthquake engineering services include soil engineering, earthquake and seismic hazard studies, geology and hydrogeology engineering, and construction inspection. We operate a licensed, full-service geotechnical laboratory at our headquarters in Anaheim, California, which offers an array of testing services, including construction materials testing and inspection.
7
Planning and Surveying. We assist communities with a full range of planning services, from the preparation of long-range policy plans to assistance with the day-to-day operations of a planning department. For several cities, we provide contract staff support, which ranges from staffing entire departments to providing interim or long-term services to entities that have determined that it is not cost-effective to have a full-time engineer on staff, to relieve peak workload situations or to fill vacant positions during a job search. Typical assignments include land use studies, development of specific plans or general plan elements, design guidelines, and zoning ordinances. We also provide surveying and mapping services, including major construction layout, design survey, topographic survey, aerial mapping, Geographic Information Systems, and right-of-way engineering.
Program and Construction Management. We provide comprehensive program and construction management services to our public sector clients. These services include construction administration, inspection, observation, labor compliance, and community relations, depending on the client’s needs and the scope of the specific project. Our construction management experience encompasses projects such as streets, bridges, sewers and storm drains, water systems, parks, pools, public buildings, and utilities.
Structures. Our structural engineering services include bridge design, bridge evaluation and inspection, highway and railroad bridge planning and design, highway interchange design, railroad grade separation design, bridge seismic retrofitting, building design and retrofit, sound wall and retaining wall design, and planning and design for bridge rehabilitation and replacement.
Transportation and Traffic. We provide a wide range of services relating to transportation, traffic and other infrastructure projects. For example, our transportation engineering services cover a full spectrum of support functions, including right of way, utility relocation, landscape, survey and mapping, geographic information systems, public outreach, and interagency coordination. Our traffic engineering services include serving as the contract city traffic engineer in communities, as well as performing design and traffic planning projects for our clients.
Water Resources. We assist clients in addressing the many facets of water development, treatment, distribution and conservation, including energy savings, technical, financial, legal, political, and regulatory requirements. Our core competencies include hydraulic modeling, master planning, rate studies and design and construction services. Our design experience includes reservoirs, pressure reducing stations, pump and lift stations, and pipeline alignment studies, as well as water/wastewater collection, distribution, and treatment facilities. We also provide a complete analysis and projection of storm flows for use in drainage master plans and for individual storm drain systems to reduce flooding in streets and adjacent properties. We design open and closed storm drain systems and detention basin facilities, for cities, counties and the Army Corp of Engineers.
District Administration. We administer special districts on behalf of public agencies. The types of special districts administered include community facilities districts (in California, Mello-Roos districts), assessment districts, landscape and lighting districts, school facilities improvement districts, benefit assessment districts, fire suppression districts, and business improvement districts. Our district administration services include calculating the annual levy for each parcel in the district; billing charges directly or through a county tax roll; preparing the annual Engineer’s Report, budget and resolutions; reporting on collections and payment status; calculating prepayment quotes; and providing financial analyses, modeling and budget forecasting.
Financial Consulting. We perform economic analyses and financial projects for public agencies, including fee and rate studies; utility rate analysis; utility system appraisals and asset acquisitions; economic development and redevelopment planning; Community Choice Aggregation feasibility studies, in which local entities contemplate aggregating buying power in order to secure alternative energy supply contracts; real estate and market analysis associated with planning efforts, and development fee studies; special district formation and other special projects.
Federal Compliance. We offer several services that support bonded debt compliance reporting for cities, counties, states, school districts, water districts, housing authorities, 501(c)(3) and other municipal entities. We provide federal compliance services to approximately 760 issuers in 43 states and the District of Columbia managing approximately $68 billion in municipal debt.
8
The following are examples of typical projects we have performed in the Engineering and Consulting segment:
| ● | City of Elk Grove, California, City Engineering, Capital Improvement, and Infrastructure Services. We provided comprehensive technical support to the Public Works and Development Services Departments for the over 170,000-resident community of Elk Grove, California. Our services have included public counter service, drainage/stormwater/NPDES, traffic engineering, permitting, land development review and inspection, CIP design and construction support. Serving the two City departments was a team of full-time engineers, scientists, managers, observers/inspectors, project managers, administrative support staff, and a team of subconsultants. All work was accomplished through a task order process that defined the scope of work, time of performance, and cost of services. |
| ● | City of Long Beach, California, Engineering and Construction Management Services. We provided construction management and public works inspection services for the City’s capital improvement and street maintenance programs. The projects involve building tenet improvements, landscaping, asphalt overlays, ADA compliance ramps, sidewalks, storm drains, water lines, sewer installations, underground utility improvements and other appurtenant work. We acted as the Owner’s Representative and Construction Manager responsible for coordinating all aspects of the construction, including coordination with the City’s Building Inspection Staff. |
| ● | County of Los Angeles, California, Traffic Design and Operational Support Services. We provide professional traffic engineering services for Traffic Signal Synchronization Project. The services include meetings and project coordination with Los Angeles County and various municipalities as well as field review, equipment inventory, reporting for recommended improvements, traffic signal base plans, traffic signal improvement plans, traffic signal utility plans and engineering estimates for multiple signalized intersections along various street corridors. |
| ● | County of Orange, California, Code Enforcement Services. Our code enforcement team is responsible for responding to citizen concerns and investigations of a variety of code violations throughout the unincorporated areas of Orange County in support of its Neighborhood Preservation Program, including the reviewing, processing, and closing of code enforcement cases related to land use, zoning, building, grading, nuisance, and property maintenance violations. Our staff performs review of all case files, inspection of properties, filing notices and complaints against violators, documenting, and preparing violation cases for the district attorney’s office and/or County counsel and testifying in court. We assist in the entitlement/development process consisting of general land use, zoning and building violations. |
| ● | City of Phoenix, Building and Safety Services. We have provided Building Safety, Building Inspection and Building and Fire plan review services to the City of Phoenix Building and Fire Departments since 2001. Willdan Building Inspectors and Reviewers report to the City of Phoenix where the city provides assignments. Inspectors are assigned residential new construction, additions, and remodel inspections. Fire plan reviewers are assigned commercial fire protection systems and Fire Code reviews. Plan reviewers are assigned residential new construction, additions and remodels reviews. |
| ● | Contra Costa County, California, Financial Services. We provided finance review, financial analysis, and contract administration services for the Contra Costa County Public Works Department. Willdan provided municipal services in a variety of professional and technical administrative and finance measures. |
| ● | Property Assessed Clean Energy (“PACE”). PACE is a financing mechanism that enables low-cost, long-term funding for energy efficiency, renewable energy and water conservation projects. PACE financing is repaid as an assessment on the property owner’s regular tax bill, and is processed the same way as other local public benefit assessments that have been utilized for decades. Depending on local legislation, PACE can be used to pay for new heating and cooling systems, solar panels, insulation and more for commercial, nonprofit and residential properties. This allows property owners to implement improvements without a large up-front cash payment. We have partnered with Ygrene Energy Fund to provide a national PACE program. |
9
Clients
Our clients primarily consist of investor and municipal owned energy utilities, public and governmental agencies including cities, counties, redevelopment agencies, water districts, school districts and universities, state agencies, federal agencies and a variety of other special districts and agencies. We also provide services to private industry, hospitals, hotels, and a wide variety of other commercial enterprises.
We are organized to profitably manage numerous small and large contracts at the same time. The majority of our contracts typically range from $1,000 to $10,000,000 in contract revenue; however, several of our construction management service contracts exceed $20,000,000 and can range up to $130,000,000 in construction value. In addition, many of our multi-year utility program management contracts exceed $10,000,000 and, two of our largest contracts have provided contract limits in excess of $100,000,000 in revenue over a period of five years for the management of utility incentive programs for the implementation of energy efficiency measures. Our contracts typically have a duration of between two and thirty-six months, although we have city services contracts that have been renewed or re-awarded and in effect for over 30 years. Most of our contracts include a provision allowing for termination for convenience after reimbursement of any unbilled effort under the contract. As of December 29, 2023, we had approximately 2,300 open projects.
During fiscal year 2023, we had no individual customers that accounted for more than 10% of our consolidated contract revenues and our top 10 customers accounted for 52.7% of our consolidated contract revenues.
Our largest clients are based in California and New York. In fiscal year 2023, services provided to clients in California accounted for 45.1% of our consolidated contract revenue and services provided to clients in New York accounted for 24.7% of our consolidated contract revenue.
We collaborate with the LADWP through the Commercial Direct Install Program, which is a small business lighting energy efficiency program that serves all commercial customers in LADWP territory with demand up to 250kW. On average, this program typically implements approximately 8,000 energy efficiency projects a year and has implemented over 103,000 projects since program inception in 2008. Over that time, we have saved the LADWP and its customers over half a million MWh per year and almost one hundred MW of peak demand and also provided lead generation identifying over 5,000 water efficiency upgrades.
We also collaborate with Duke Energy - Progress to manage the small business direct install program in North Carolina and South Carolina. Since its launch in 2013, the program has grown to encompass all eligible Duke Energy customers in North Carolina, South Carolina, Indiana, and Kentucky. The Small Business Energy Saver Program offers eligible commercial customers the opportunity to retrofit a comprehensive list of existing inefficient equipment with more energy-efficient measures. The program provides integrated turn-key services including program marketing, energy assessments, installation by local contractors, up to 80 percent incentives to offset the cost of projects, and education to encourage the replacement of existing equipment with improvements in lighting, refrigeration, and HVAC. We continue to implement programs across these four states and have completed over 30,000 projects for Duke Energy resulting in over 890,000 MWh in savings to small businesses.
10
We implement Consolidated Edison’s Small and Medium Business Program across the utility's New York City and Westchester County service area. After giving effect to renewals and extensions, this Consolidated Edison contract continues through the end of 2025. We also implement the Consolidated Edison Multifamily program, their largest energy efficiency program. After giving effect to renewals and extensions, that contract continues through the end of 2024. Both programs help customers save energy, lower their bills and protect the environment by providing financial incentives to identify and buy down the cost of energy efficiency measures. To support this effort, we provide full-service program implementation including outreach and direct sales to potential commercial customers, on-site energy efficiency assessments, direct implementation of energy savings measures and participating contractor management. The administration of incentive payments to other contractors providing services through the program is included in our scope, but the structure of the contract is such that these payments are not included in revenue or expenses. Consolidated Edison may terminate the contract at any time for any reason. Consolidated Edison has been a customer of ours since 2009.
In connection with our acquisition of substantially all of the assets of Genesys in March 2016, we entered into an administrative services agreement with Genesys pursuant to which our subsidiary, WES, provides Genesys with ongoing administrative, operational and other non-professional support services. Under such administrative services agreement, WES provides administrative services for a series of Genesys’s DASNY and other contracts. WES provides administrative services to Genesys in its performance of rehabilitation and construction work and architectural and engineering services at various sites within New York State. Services for DASNY under these contracts also include energy efficient design, utility cost evaluation and review, and various regulatory compliance services. Specific project descriptions are set out by DASNY in work authorizations, which are issued under the terms of the contracts. The termination dates of the DASNY contracts vary; the latest of which is November 2026. Work authorized but not yet completed under this contract continues to be bound by the terms of the agreement beyond the termination date until completion of the projects. Genesys expects to continue to receive amendments from DASNY to the master contract extending the termination date under DASNY’s option to extend this contract term twice, one year at a time. DASNY may at any time terminate any of the contracts or suspend all projects, for its convenience and without cause. DASNY has been a customer of Genesys since 1983.
Contract Structure
We generally provide our services under contracts, purchase orders, licensing agreements or retainer letters. The agreements we enter into with our clients typically incorporate one of three principal types of pricing provisions:
| ● | Time-and-materials provisions provide for reimbursement of costs and overhead plus a fee for labor based on the time expended on a project multiplied by a negotiated hourly billing rate. The profitability achievable on a time-and-materials basis is driven by billable headcount, staff utilization, and cost control. |
| ● | Unit-based provisions require the delivery of specific units of work, such as energy efficiency savings goals measured in kWh or Therms, arbitrage rebate calculations, software access terms, dissemination of municipal securities continuing disclosure reports, or building plan checks, at an agreed price per unit, with the total payment under the contract determined by the actual number of units performed. |
| ● | Fixed price provisions require all work under a contract to be performed for a specified lump sum, which may be subject to adjustment if the scope of the project changes. Contracts with fixed price provisions carry certain inherent risks, including risks of losses from underestimating costs, delays in project completion, problems with new technologies, price increases for materials, and economic and other changes that may occur over the contract period. Consequently, the profitability, if any, of fixed price contracts can vary substantially. We typically mitigate some of these risks through the use of fixed price subcontracts for services, material, and equipment. |
11
The following table presents, for the periods indicated, the approximate percentage of our contract revenue subject to each type of pricing provision:
Fiscal Year | |||||||
| 2023 |
| 2022 |
| 2021 |
| |
Time-and-materials |
| 19 | % | 20 | % | 24 | % |
Unit-based |
| 42 | % | 45 | % | 54 | % |
Fixed price |
| 39 | % | 35 | % | 22 | % |
Total |
| 100 | % | 100 | % | 100 | % |
In relation to the pricing provisions, our service-related contracts, including operations and maintenance services and a variety of technical assistance services, are accounted for over the period of performance, in proportion to the cost of performance. Award and incentive fees are recorded when they are fixed and determinable and consider customer contract terms.
For time-and-materials and fixed price contracts, we bill our clients periodically in accordance with the contract terms, based on costs incurred on either an hourly fee basis or on a percentage of completion basis or upon the achievement of certain prescribed milestones, as the project progresses. For unit-based contracts, we bill our clients upon delivery and completion of the contracted item or service, and in some cases, in advance of delivery.
Our contracts come up for renewal periodically and, at the time of renewal, may be subject to renegotiation or recompetition, which could impact the profitability on that contract. In addition, during the term of a contract, public agencies may request additional or revised services which may impact the economics of the transaction. Most of our contracts permit our clients, with prior notice, to terminate the contracts at any time without cause. While we have a large volume of transactions and generally low customer concentration, the renewal, termination, or modification of a contract may have a material effect on our consolidated operations.
Competition
The markets for energy efficiency and sustainability, engineering, construction management, economic and financial consulting, design planning and national preparedness services are competitive and highly fragmented. Our competition varies by type of client, type of service and geography. The range of competitors for any one project can vary depending upon technical specialties, the relative value of the project, geographic location, financial terms, risks associated with the work, and any client-imposed restrictions. We often compete with many other firms ranging from small local firms to large international firms. Contract awards are based primarily on qualifications, relevant experience, staffing capabilities, geographic presence, financial stability, customer service, and price. We face strong competition primarily from other regional, national, and international providers of energy efficiency and sustainability consulting services, local electrical and mechanical contractors and engineering firms, lighting and lighting fixture manufacturers and distributors. In addition to our existing competitors, new competitors such as large national or international engineering and/or construction companies could enter our markets.
Doing business with utilities and governmental agencies is complex and requires the ability to understand and comply with intricate regulations and to satisfy periodic audits. We have been serving cities, counties, special districts and other public agencies for over half a century. We believe that the ability to understand these requirements and to successfully conduct business with utilities, governmental entities and agencies is a barrier to entry for potential competitors.
Unlike some of our competitors, we focus our services on utilities and public sector clients and generally exclude residential services. Utility and public sector clients generally choose among competing firms by weighing the quality, experience, innovation and timeliness of the firm’s services. When selecting consultants for engineering projects, many utilities and government agencies are required to, and others choose to, employ Qualifications Based Selection (“QBS”). QBS requires the selection of the most technically qualified firms for a project, while the financial and legal terms of the engagement are generally secondary.
12
Our competition varies geographically. Although we provide services in several states, we may be stronger in certain service lines in some geographical areas than in other regions. Similarly, some of our larger competitors are stronger in some service lines in certain localities but are not as competitive in others. Our smaller competitors generally are limited both geographically as well as by the depth and breadth of services they are able to provide.
We consider our principal competitive advantages to be our reputation for dependability, technical knowledge and industry expertise of employees, quality of services and solutions, and the scope and scale of our service offerings. We believe that no single competitor has sufficient market share to influence the markets in which we operate.
Insurance
To address the hazards inherent in our business, we maintain insurance coverage through the following policies: commercial general liability, automobile liability, workers’ compensation and employer’s liability, cyber liability, professional liability and umbrella/excess liability. However, if any claims, settlements, or judgements, individually or in the aggregate, exceed our policy limits, we are liable to pay these claims from our assets. We believe our coverage limits reasonably protect us from any material adverse impact that may arise from these insured risks.
Government Regulation, Licensing, and Enforcement
A significant portion of our revenues is derived from services provided to public utilities which are generally overseen by state or local public utility commissions who provide and administer a regulatory framework governing the sourcing, distribution, pricing and general management of electricity and natural gas. Our services are often mandated by these regulatory frameworks requiring utilities to meet certain goals for energy efficiency, renewable energy and other metrics which impact demand for our services. This framework of regulatory mandates is updated by state and local ordinance and some federal regulatory action as well. Demand for our services can be impacted from year to year by changes in these regulatory acts regarding energy management, utility budgets and the allowable financial parameters imposed by these regulatory agencies.
Human Capital Resources
As a professional services company, our continuing success relies on attracting, developing, and retaining a workforce that is both technically excellent and responsive to the needs of our clients and customers. An integral part of our ability to attract and retain qualified talent depends on our ability to maintain a culture reflective of the diverse communities that we serve.
Our Workforce
As of December 29, 2023, we employed a total of 1,616 employees, excluding contractors. Our employees include, among others, licensed electrical, mechanical, structural, geotechnical and civil engineers; land surveyors; certified building officials; certified inspectors and plans examiners; licensed architects and landscape architects; certified planners; energy sales and audit specialists; installation technicians; program managers; policy advisors and information technology specialists. We believe that we attract and retain highly skilled personnel with significant industry experience and strong client relationships by offering them challenging assignments in a dynamic work environment that recognizes, supports, and encourages diverse backgrounds and inter-cultural cooperation combined with compensation and employee benefit programs that are competitive with those offered by our competitors. See Part I, Item 1A, "Risk Factors" included in this Annual Report on Form 10-K for a discussion of the risks related to the loss of key personnel or our inability to attract and retain qualified personnel.
13
The following table sets forth the number of our employees in each of our business segments and our holding company:
Fiscal Year | |||||||
| 2023 |
| 2022 |
| 2021 |
| |
Energy |
| 814 |
| 781 |
| 860 |
|
Engineering and Consulting |
| 714 |
| 623 |
| 619 |
|
Holding Company Employees (Willdan Group, Inc.) |
| 88 |
| 87 |
| 81 |
|
Total |
| 1,616 |
| 1,491 |
| 1,560 |
|
Diversity, Equity and Inclusion
Willdan has a culture of acceptance and individuality, where all employees feel respected, included, and encouraged to contribute their unique perspectives, develop innovative ideas, and bring their best skills to work each day. We value the richness that diversity and inclusion bring to our workforce and are proud that our employees represent various races, genders, ages, national origins, and points of view. Our culture is focused on hiring, empowering, and retaining highly talented employees and professionals with the diverse background and expertise required to develop solutions for the current and future energy and infrastructure challenges and to help us consistently raise the bar and drive innovation forward.
To encourage more diverse and talented people to join our team, we partner with professional organizations that represent and support a diverse pool of applicants. We actively seek out and hire minority-owned subcontractors on our projects and, in conjunction with our clients, we regularly propose and achieve specific percentage content goals for the use of minority-owned and disadvantaged businesses in our projects. These partnerships offer economic opportunity to local, minority-owned, and disadvantaged business enterprises. At Willdan, we believe that we can better serve all communities by utilizing qualified employees, suppliers, and subcontractors that mirror the culture and demographics of the communities where we live and work.
We take pride in, and celebrate, our employees. In 2020, we established Willdan’s Diversity, Equity, and Inclusion Working Group (“DEI Working Group”). The DEI Working Group is designed to increase overall employee engagement and collaboration. Among other things, the DEI Working Group focuses on recruiting, development and community outreach, and developing and tracking progress toward DE&I objectives.
The DEI Working Group is comprised of four employee-led subgroups: (i) Business Partnerships, (ii) Community Outreach and Engagement, (iii) Inclusive Culture, and (iv) Recruitment. Each subgroup is led by a chair or co- chairpersons championing the needs and well-being of stakeholders, including employees. Collectively, the subgroups positively impact professional development, community outreach and business by creating and embracing cultural initiatives.
Our employees are highly engaged in the formation of Employee Resource Groups (“ERGs”). We believe that ERGs foster a greater sense of community while increasing employee engagement, inclusiveness, representation, and collaboration. All employees have the opportunity to initiate, join, and lead ERGs.
Employee Engagement and Development
Sustaining long-term growth requires continued investment in people, innovation, and new opportunities. We continuously strive to improve upon our engagement between employees and management teams to drive our company goals and enhance the employee experience. At all locations, we provide our employees with performance assessments and evaluations and professional development opportunities including access to job specific training. We also provide our employees with training on workplace culture and enrichment through our learning platform, which covers topics such as anti-harassment, creating healthy work environments, inclusion, ethics and compliance.
To measure our human capital objectives, we continuously engage with our employees. We provide several mechanisms for our employees to provide their feedback, including direct discussions with managers, company-wide employee surveys, and leadership meetings. We review the company-wide employee survey results and implement
14
action plans aimed at enhancing employee satisfaction and alignment with our overall human capital strategy. In 2021, we began collecting additional human capital metrics, such as employee gender ratios and other demographic information, and we have expanded the roster of universities at which we conduct recruiting activities. We continue to invest in our employee development strategy by expanding our employee training and professional development programs. In fiscal 2023, we expanded our online learning and development platform and launched a new intra-net employee communication platform.
Community Training
In 2020, we established and financed the Willdan Clean Energy Academy (“WCEA”), which offers free training and career services to disadvantaged workers in the New York City area. In 2021, we increased the funding for this outreach effort, expanding WCEA to the Los Angeles City area. In 2022, WCEA celebrated 500+ graduates and achieved a 73%+ successful employment outcome rate for unemployed and under-employed students/participants.
The WCEA supports a diverse workforce and collaborates with community-based organizations and workforce centers to support energy efficiency workforce development.
Workplace Safety
The health and safety of our employees is a core value and we continuously strive to provide a working environment that is reflective of that belief. At Willdan, our leadership embraces and supports the efforts required to drive the proactive management of risk and the elevation of our safety culture.
We recognize the important role that every employee plays in preventing work-related injuries. Training is an integral part of our Health and Safety Program and all employees receive the relevant safety training for their assigned tasks. For those working on project sites, this includes a project-safety orientation prior to beginning work on the site, participation in weekly tailgate meetings, and additional in-depth safety training for those supervising or conducting job site observations. Safety orientations also extend to our subcontractors and visitors who must access our project sites.
We track and report all safety incidents and use metrics such as recordable case rate (“RCR”) and lost-time incident rate (“LTIR”). For context, lost-time injuries are those occurring in the workplace and resulting in an employee’s inability to work the next full workday. A RCR describes the number of employees per 100 full-time employees that have been involved in an OSHA recordable injury or illness. The LTIR is the number of lost-time injuries that occurred in a given period, relative to the total number of hours worked in the same period.
In 2023, we launched a more robust cloud-based environmental, health, and safety (“EH&S”) platform in support of our risk management efforts. This enhanced system allows us to report incidents, document investigations, perform pre-mobilization inspections, conduct safety observations, record corrective actions, and publish dashboard management information for use in real-time. The system also includes a learning management system module that administers a broad library of safety-related material, tracks assigned training, and verifies course completion, as well as an oversight module to monitor key requirements of our subcontractors’ safety compliance efforts. This system helps us support safe and compliant working environments.
In addition, to better communicate and market our safety objectives, our corporate safety council meets monthly and engages member representatives across the organization, bringing practical and timely information forward to share with our workforce.
Environmental Stewardship
As a leading energy solutions provider and sustainability consultant, climate change mitigation is at the core of our identity. We deliver comprehensive sustainable solutions to our clients to reduce their carbon intensity and facilitate their transition to a net-zero carbon future. We provide planning and policy analysis for governments, regulators, and utilities, as well as innovative financing programs that bring the benefit of clean energy to underserved neighborhoods and disadvantaged customers.
15
We help clients reduce carbon intensity to become cleaner, more sustainable organizations through measurement and goal setting, sustainable engineering designs, installation of more efficient lighting, heating and cooling measures and the development and implementation of master plans for environmental sustainability, carbon reduction and energy efficiency to meet specific goals. This has led to energy-efficient upgrades at over 370,000 commercial buildings, schools, hospitals, and other public buildings. Our program management activities for various utilities have yielded more than 8.8 billion kWh savings, and 110 million therms reductions over the past 16 years.
We are committed to measuring, disclosing, and reducing our greenhouse gas (“GHG”) emissions, and continue to incorporate sustainable practices in our operations. Based on our most recent analyses, our primary emissions sources are leased office space, business travel, technology, and waste. In addition, we are committed to minimizing our footprint and to achieving carbon neutrality. Our greenhouse gas target is for a 50% reduction in our Scope 1 and Scope 2 emissions by the year 2030. With our target set, we plan to more accurately measure, reduce, and then offset our remaining carbon emissions. As a professional services firm focused on the clean energy transition, we see clear actions that can improve the energy efficiency and sustainability of our operations.
Governance
At Willdan, strong and effective corporate governance is the foundation of a well-run, sustainable business. Our corporate governance practices set clear expectations and responsibilities for leaders, employees, and partners to create long-term, competitive returns for shareholders and lasting value for all stakeholders.
We are committed to conducting business in a legal, ethical, and trustworthy manner; strictly upholding our regulatory obligations everywhere we operate; and complying with both the letter and spirit of our business policies and values. We are committed to accountability for our actions and goals.
With our commitment to corporate governance principles, we have adopted, among other measures, a Code of Ethical Conduct, as well charters for each of the four standing committees of our Board of Directors (“Board”). These governance measures promote effective functioning of our Board and its committees, protecting our interests as a whole. The measures articulate shared expectations for how the Board, its committees, and our management should perform their respective functions.
Annually, the Board works with our senior management team on a detailed, multi-year strategic plan, reviewing goal progress each quarter. The Board also oversees efforts by Willdan’s senior management team in managing mitigation of environmental and social risks.
We are managed under the direction of the Board, which is currently composed of eight directors. As of the start of fiscal year 2024, the role of Chairman of the Board is separate from the role of CEO. The Board has determined that our directors, except for Mr. Bieber, our President and CEO, and Dr. Brisbin, our former CEO, are independent under the rules of the listing standards for the Nasdaq Global Market and the Securities Exchange Act of 1934, as amended. As the director most familiar with our business and industry, we believe that our former CEO is best suited to serve as Chairman of our Board. Our Chairman and our CEO work in collaboration with our Lead Independent Director, who is appointed biannually by the Board. Our Board is comprised of a diverse group of academics, financial advisors and industry practitioners with extensive experience in the governance and direction of publicly-traded enterprises. At any time, shareholders and other interested parties may communicate by writing to the Board generally, with the non-employee directors as a group, or to a specific director.
Intellectual Property
We believe we have strong name recognition and that this provides us with a competitive advantage in obtaining new business. Consequently, we believe it is important to protect our brand identity through trademark registrations. The Willdan, Willdan Group, Inc., Willdan Engineering, Willdan Energy Company, Willdan Financial Services, and Willdan Energy Solutions names are service marks of ours, and we have obtained a service mark for the Willdan and “W” logo. We have also obtained federal service mark registration with the United States Patent and Trademark Office for the “Willdan” name and “Willdan Group, Inc.” name. The name and logo of our proprietary
16
software, MuniMagic+SM, our California energy efficiency CEDA, as well as our proprietary platform as a service VIEWPOINT are also registered marks, and we have registered a federal copyright for the source code for the MuniMagic+SM software. In connection with our acquisitions, we have obtained the trademark for our “LoadSEER” software, have obtained the patent for “Optimization of Microgrid Energy Use and Distribution”, have obtained the service marks for the Enerpath, Enerworks and Lime/Green Dial Design, and have obtained the registered copyright of Lime, Lime Energy, and Main Street Efficiency, NEO, Net Energy Optimizer, Collaboration Analysis Research, and several Weidt Group designs.
Available Information
We maintain an Internet website at http://www.willdan.com. Through our website, in the “Investors” section under the heading “SEC Filings”, we make available, free of charge, our annual reports on Form 10-K, quarterly reports on Form 10-Q, current reports on Form 8-K, proxy statements, and amendments to those reports, as soon as reasonably practicable after we electronically file or furnish such materials to the SEC. We also make available on this website our prior earnings calls under the heading “Events and Presentations” and our Code of Ethical Conduct under the heading “Corporate Governance.” The information on our website is not a part of or incorporated by reference into this filing. The SEC maintains an Internet site that contains reports, proxy, and information statements and other information regarding our filings at http://www.sec.gov.
17
ITEM 1A. RISK FACTORS
Risks Relating to Our Business and Industry
We operate in a changing environment that involves numerous known and unknown risks and uncertainties that could materially adversely affect our operations. Set forth below and elsewhere in this report and in other documents we file with the SEC are descriptions of risks and uncertainties that could cause our actual results to differ materially from the results and expectations contained in this report. Additional risks we do not yet know of or that we currently think are immaterial may also affect our business operations. If any of the events or circumstances described in the following risks actually occurs, our business, financial condition or results of operations could be materially adversely affected.
Risks Related to Operations
If we fail to complete a project in a timely manner, miss a required performance standard, or otherwise fail to adequately perform on a project, then we may incur a loss on that project, which may reduce or eliminate our overall profitability.
Our engagements often involve large-scale, complex projects. The quality of our performance on such projects depends in large part upon our ability to manage the relationship with our clients and our ability to effectively manage the project and deploy appropriate resources, including third-party contractors and our own personnel, in a timely manner. We may commit to a client that we will complete a project by a scheduled date or that, when completed, a project will achieve specified performance standards (e.g., some of our contracts stipulate certain energy savings requirements). If the project is not completed by the scheduled date or fails to meet required performance standards, we may either incur significant additional costs or be held responsible for the costs incurred by the client to rectify damages due to late completion or failure to achieve the required performance standards. The uncertainty of the timing of a project can present difficulties in planning the amount of personnel needed for the project. If the project is delayed or canceled, we may bear the cost of an underutilized workforce that was dedicated to fulfilling the project. In addition, performance of projects can be affected by a number of factors beyond our control, including, among other things, unavoidable delays from government inaction, public opposition, inability to obtain financing, weather conditions, unavailability of vendor materials (including but not limited to import restrictions or pandemics or other public health emergencies such as the Covid-19 pandemic), changes in the project scope of services requested by our clients, industrial accidents, environmental hazards, and labor disruptions. To the extent these events occur, the total costs of the project could exceed our estimates, and we could experience reduced profits or, in some cases, incur a loss on a project, which may reduce or eliminate our overall profitability. Further, any defects or errors, or failures to meet our clients’ expectations, could result in claims for damages against us. Failure to meet performance standards or complete performance on a timely basis could also adversely affect our reputation and client base.
Our revenues are primarily derived from the energy services industry and, therefore, we are highly susceptible to risks relating to such industry.
A loss of customers, inability to procure or maintain contracts, a downturn in demand, or a change in the energy regulatory environment in the energy services industry could have a material adverse impact on our business, results of operations and financial condition. If we are unable to maintain and expand our current utility relationships and develop new relationships, maintain and enhance our existing energy services, execute our business and marketing strategies successfully and achieve the energy savings that are specified in our contracts, we may not be able to supplement the loss of revenue from our other services and it may result in lower revenues and have an adverse impact on our business, results of operations and financial condition.
The demand and terms for Energy efficiency services and utility programs in general are highly regulated and driven by various state regulatory commissions. Changes in those regulations or the standards and goals imposed by the regulatory commissions could adversely affect the demand for or the terms under which those utility programs may be conducted and adversely affect the company’s profitability.
Most states have an independent energy regulatory commission or body to oversee the operations of the utilities providing electricity and gas to consumers. Those regulatory commissions often set the goals, standards, prices and other specific terms under which the utilities are required to operate. Those regulatory mandates, including mandates for greenhouse gas reductions, the composition of energy generation sources, the amount of energy consumption reductions,
18
the cost effectiveness of those reductions and the various terms under which those mandates are to be delivered set firm boundaries within which the utilities may contract with third parties such as Willdan. Changes in those regulatory mandates, goals and terms impact existing and future contracts under which we work with the utilities and can have a significant impact on the company’s ability to generate revenue or the level of effort and cost required to deliver required savings, or both. Those changes could have the effect of making our utility contracts more or less profitable and increase or decrease the demand for our services.
Demand for our services is cyclical and vulnerable to economic downturns. If economic growth slows, government fiscal conditions worsen, public and private construction/renovation activity slows, or client spending declines, it may have a material adverse effect on our business, results of operations and financial condition.
Demand for our services is cyclical, and vulnerable to economic downturns and reductions in government and private industry spending. Such downturns or reductions may result in clients delaying, curtailing or canceling proposed and existing projects. Our business traditionally lags the overall recovery in the economy; therefore, our business may not recover immediately when the economy improves. If economic growth slows, including as a result of rising inflation and rising interest rates, government fiscal conditions worsen, or client spending declines, it may have a material adverse effect on our business, results of operations and financial condition. Our government clients may face budget deficits that prohibit them from funding new or existing projects. In addition, our existing and potential clients may either postpone entering into new contracts or request price concessions. Difficult financing and economic conditions may cause some of our clients to demand better pricing terms or delay payments for services we perform, thereby increasing the average number of days our receivables are outstanding, and the potential of increased credit losses of uncollectible invoices. Further, these conditions may result in the inability of some of our clients to pay us for services that we have already performed. If we are not able to reduce our costs quickly enough to respond to the revenue decline from these clients, our operating results may be adversely affected. Accordingly, these factors affect our ability to forecast our future revenue and earnings from business areas that may be adversely impacted by market conditions. Any of these factors could adversely affect the demand for our services, which could have a material adverse effect on our business, results of operations and financial condition.
The quality of our service and our ability to perform under some of our contracts would be adversely affected if qualified subcontractors are unavailable for us to engage, if our subcontractors fail to satisfy their obligations to us or other parties, or if we are unable to maintain these relationships which, in each case, could adversely affect our business, results of operations and financial condition.
Under some of our contracts, we rely on the efforts and skills of subcontractors for the performance of some of the tasks. Our use of subcontractors has increased in recent years as a result of the increase in the percentage of our revenues derived from the direct installation of energy efficiency measures, including performance contracting and construction management services for more complex projects. Our Energy segment generally utilizes a higher percentage of subcontractors than the Engineering and Consulting segment. The absence of qualified subcontractors with whom we have a satisfactory relationship could adversely affect the quality of our service offerings and therefore, adversely affect our business, results of operations and financial condition.
There is a risk that we may have disputes with our subcontractors arising from, among other things, the quality and timeliness of work performed by the subcontractor, client concerns about the subcontractor, or our failure to extend existing task orders or issue new task orders under a subcontract. In addition, if a subcontractor fails to deliver on a timely basis the agreed-upon supplies, fails to perform the agreed-upon services, or goes out of business, then we may be required to purchase the services or supplies from another source at a higher price, and our ability to fulfill our obligations as a prime contractor may be jeopardized. This may reduce the profit to be realized or result in a loss on a project for which the services or supplies are needed.
We also rely on relationships with other contractors when we act as their subcontractor or joint venture partner. The absence of qualified subcontractors with which we have a satisfactory relationship could adversely affect the quality of our service and our ability to perform under some of our contracts. Our future revenue and growth prospects could be adversely affected if other contractors eliminate or reduce their subcontracts or teaming arrangement relationships with us, or if a government agency terminates or reduces these other contractors’ programs, does not award them new contracts, or refuses to pay under a contract.
19
Supply chain constraints and labor shortages could negatively impact our business, financial condition and results of operations.
The global economy has been experiencing supply chain constraints and labor shortages. These conditions, in addition to rising inflation, have increased the costs for materials, other goods, and labor, and have caused delivery and project performance schedules to be extended. These conditions, combined with tightening labor markets resulting from elevated resignation rates among U.S. workers, could increase the cost and difficulty of recruiting and retaining employees, or could result in project delays or cancellations which could negatively impact our operations and financial results.
Our profitability could suffer if we are not able to maintain adequate utilization of our workforce.
The cost of providing our services, including the extent to which we utilize our workforce, affects our profitability. The rate at which we utilize our workforce is affected by a number of factors, including our ability to transition employees from completed projects to new assignments and to hire and assimilate new employees, our ability to forecast demand for our services and thereby maintain an appropriate headcount in each of our geographies and workforces, our ability to manage attrition, our need to devote time and resources to training, business development, professional development, and other non-chargeable activities, and our ability to match the skill sets of our employees to the needs of the marketplace. If we over-utilize our workforce, our employees may become disengaged, which could impact employee attrition. If we under-utilize our workforce, our profit margin and profitability could suffer.
If we are unable to accurately estimate and control our contract costs, then we may incur losses on our contracts, which could decrease our operating margins and reduce our profits. In particular, our fixed-price contracts could increase the unpredictability of our earnings.
Under fixed-price contracts, we receive a fixed price irrespective of the actual costs we incur (which protects clients) and, consequently, we are exposed to a number of risks that are generally not included under time-and-materials and unit-based contracts. We realize a profit on fixed price contracts only if we can control our costs and prevent cost overruns on our contracts. Fixed price contracts require cost and scheduling estimates that are based on a number of assumptions, including those about future economic conditions, costs, and availability of labor, equipment and materials, and other exigencies. We could experience cost overruns if these estimates were initially inaccurate as a result of errors or ambiguities in the contract specifications, or become inaccurate as a result of a change in circumstances following the submission of the estimate due to, among other things, unanticipated technical or equipment problems, difficulties in obtaining permits or approvals, changes in local laws or labor conditions, weather delays, changes in costs of raw materials as a result of rising inflation, supply chain shortages or otherwise, or the inability of our vendors or subcontractors to perform their obligations. If cost overruns occur, we could experience reduced profits or, in some cases, a loss for that project. If a project is significant, or if there are one or more common issues that impact multiple projects, costs overruns could increase the unpredictability of our earnings, as well as have a material adverse impact on our business, results of operations and financial condition.
Under our time-and-material contracts, we are generally paid for our efforts at negotiated hourly billing rates for our staff, plus reimbursement for subcontractors and other direct costs. Profitability on these contracts is driven by control over the number of hours required to execute the tasks, the mix of staff utilized and the percentage of staff time expended on directly billable activities. Many of our time-and-materials contracts are subject to maximum contract values. In the event that we estimate the potential to exceed those maximum contract values at the contracted rates, revenue relating to these contracts is recognized as if these contracts were fixed-price contracts.
If we are unable to accurately estimate and manage our costs, we may incur losses on our contracts, which could decrease our operating margins and significantly reduce or eliminate our profits. Certain of our contracts require us to satisfy specific design, engineering, procurement, or construction milestones in order to receive payment for the work completed or equipment or supplies procured prior to achievement of the applicable milestone. As a result, under these types of arrangements, we may incur significant costs or perform significant amounts of services prior to receipt of payment. If a client determines not to proceed with the completion of the project or if the client defaults on its payment obligations, we may face difficulties in collecting payment of amounts due to us for the costs previously incurred or for the amounts previously expended to purchase equipment or supplies.
20
Our use of the percentage-of-completion method of revenue recognition on our fixed price contracts could result in a reduction or reversal of previously recorded revenue and profits.
We account for our fixed price contracts on the percentage-of-completion method of revenue recognition. Generally, our use of this method results in recognition of revenue and profit ratably over the life of the contract, based on the proportion of costs incurred to date to total costs expected to be incurred for the entire project. The effects of revisions to revenue and estimated costs, including the achievement of award fees and the impact of change orders and claims, are recorded when the amounts are known and can be reasonably estimated. Such revisions could occur in any period and their effects could be material. While we have historically made reasonably reliable estimates of the progress towards completion of long-term contracts, the uncertainties inherent in the estimating process make it possible for actual costs to vary materially from initial estimates, which could result in reductions or reversals of previously recorded revenue and profit.
The loss of key personnel or our inability to attract and retain qualified personnel could impair our ability to provide services to our clients and otherwise conduct our business effectively.
As primarily a professional and technical services company, we are labor-intensive and, therefore, our ability to attract, retain, and expand our senior management and our professional and technical staff, including management and staff acquired in connection with our business acquisitions, is an important factor in determining our future success. We believe there are only a limited number of available qualified executives in the energy efficiency services industry, and we therefore have encountered, and will likely continue to encounter, intense competition for qualified employees from other companies in the industry. In addition, the market for qualified engineers is competitive and, from time to time, it may be difficult to attract and retain qualified individuals with the required expertise within the timeframe demanded by our clients. Further, we rely heavily upon the expertise and leadership of our senior management. If we are unable to retain executives and other key personnel, the roles and responsibilities of those employees will need to be filled, which may require that we devote time and resources to identify, hire, and integrate new employees. The loss of the services of any of these key personnel could adversely affect our business, results of operations and financial condition.
Unavailability or cancellation of third-party insurance coverage would increase our overall risk exposure as well as disrupt the management of our business operations.
Our services involve significant risks of professional and other liabilities, which may substantially exceed the fees we derive from our services. We maintain insurance coverage from third-party insurers as part of our overall risk management strategy and because some of our contracts require us to maintain specific insurance coverage limits. From time to time, we assume liabilities as a result of indemnification provisions contained in our service contracts. We cannot predict the magnitude of these potential liabilities.
We are liable to pay such liabilities from our assets if and when the aggregate settlement or judgment amount exceeds our insurance policy limits. Further, our insurance may not protect us against liability because our policies typically have various exceptions to the claims covered and also require us to assume some costs of the claim even though a portion of the claim may be covered. A partially or completely uninsured claim, if successful and of significant magnitude, could have a material adverse effect on our liquidity.
If any of our third-party insurers fail, suddenly cancel our coverage, or otherwise are unable to provide us with adequate insurance coverage, then our overall risk exposure and our operational expenses would increase and the management of our business operations would be disrupted. In addition, if we expand into new markets, we may not be able to obtain insurance coverage for these new activities or, if insurance is obtained, the dollar amount of any liabilities incurred could exceed our insurance coverage. There can be no assurance that any of our existing insurance coverage will be renewable upon the expiration of the coverage period or that future coverage will be affordable at the required limits.
Product liability and personal injury claims could have a material adverse effect on our business, results of operations and financial condition.
We face exposure to product liability and personal injury claims in the event that our services cause bodily injury or property damage. Since the majority of our products use electricity, it is possible that the products we use could result in property damage or personal injury, whether due to product malfunctions, defects, improper installation or other causes. Further, we face exposure to personal injury claims in the event that an individual is injured because of
21
our negligence or the negligence of one of our subcontractors. Moreover, we may not have adequate resources in the event of a successful claim against us. A successful product liability or personal injury claim against us that is not covered by insurance or is in excess of our available insurance limits could require us to make significant payments of damages which could materially adversely affect our business, results of operations and financial condition.
Events outside our control, including natural and man-made disasters, could negatively impact the economies in which we operate or disrupt our operations, which may adversely affect our business, results of operations and financial condition.
Events outside our control, such as natural and man-made disasters, as well as terrorist actions, war or armed hostilities between countries or non-state actors, pandemics, resurgences of pandemics, or other public health emergencies, could negatively impact the economies in which we operate by causing the closure of offices, interrupting projects, and forcing the relocation of employees. We typically remain obligated to perform our services after a terrorist action or natural disaster unless the contract contains a force majeure clause that relieves us of our contractual obligations in such an extraordinary event. If we are not able to react quickly to force majeure, our operations may be affected significantly, which would have a negative impact on our business, results of operations and financial condition.
We have only a limited ability to protect our intellectual property rights, and our failure to protect our intellectual property rights could adversely affect our competitive position.
Our success depends, in part, upon our ability to protect our proprietary information and other intellectual property. We rely principally on trade secrets to protect much of our intellectual property where we do not believe that patent or copyright protection is appropriate or obtainable. However, trade secrets are difficult to protect. Although our employees are subject to confidentiality obligations, this protection may be inadequate to deter or prevent misappropriation of our confidential information. In addition, we may be unable to detect unauthorized use of our intellectual property or otherwise take appropriate steps to enforce our rights. Failure to obtain or maintain trade secret protection could adversely affect our competitive business position. In addition, if we are unable to prevent third parties from infringing or misappropriating our trademarks or other proprietary information, our competitive position could be adversely affected.
Assertions by third parties of infringement, misappropriation or other violations by us of their intellectual property rights could result in significant costs and substantially harm our business, financial condition and operating results.
We may face from time to time, allegations that we or a supplier or customer have violated the rights of third parties, including patent, trademark and other intellectual property rights. If, with respect to any claim against us for violation of third-party intellectual property rights, we are unable to prevail in the litigation or retain or obtain sufficient rights or develop non-infringing intellectual property or otherwise alter our business practices on a timely or cost-efficient basis, our business, financial condition or results of operations may be adversely affected.
Any infringement, misappropriation or related claims, whether or not meritorious, are time consuming, divert technical and management personnel and are costly to resolve. As a result of any such dispute, we may have to develop non-infringing technology, pay damages, enter into royalty or licensing agreements, cease utilizing products or services or take other actions to resolve the claims. These actions, if required, may be costly or unavailable on terms acceptable to us.
Employee, agent, or partner misconduct, or our failure to comply with anti-bribery and other laws or regulations, could harm our reputation, reduce our revenue and profits, and subject us to criminal and civil enforcement actions.
Misconduct, fraud, non-compliance with applicable laws and regulations, or other improper activities by one of our employees, agents, or partners could have a significant negative impact on our business and reputation. Such misconduct could include the failure to comply with government procurement regulations, regulations regarding the protection of classified information, regulations prohibiting bribery and other foreign corrupt practices, regulations regarding the pricing of labor and other costs in government contracts, regulations on lobbying or similar activities, regulations pertaining to the internal controls over financial reporting, environmental laws, and any other applicable laws or regulations. Since our internal controls are subject to inherent limitations, including human error, it is possible that these controls could be intentionally circumvented or become inadequate because of changed conditions. As a result, we cannot assure that our controls will protect us from reckless or criminal acts committed by our employees or agents. Our
22
failure to comply with applicable laws or regulations, or acts of misconduct could subject us to fines and penalties, loss of security clearances, and suspension or debarment from contracting, any or all of which could harm our reputation, reduce our revenue and profits, and subject us to criminal and civil enforcement actions.
Our failure to implement and comply with our safety program could adversely affect our operating results or financial condition.
Our safety program is a fundamental element of our overall approach to risk management, and the implementation of the safety program is a significant issue in our dealings with our clients. We maintain an enterprise-wide group of health and safety professionals to help ensure that the services we provide are delivered safely and in accordance with standard work processes. Unsafe job sites and office environments have the potential to increase employee turnover, increase the cost of a project to our clients, expose us to types and levels of risk that are fundamentally unacceptable, and raise our operating costs. The implementation of our safety processes and procedures are monitored by various agencies and rating bureaus and may be evaluated by certain clients in cases in which safety requirements have been established in our contracts. Our failure to meet these requirements or our failure to properly implement and comply with our safety program could result in reduced profitability or the loss of projects or clients or potential litigation and could have a material adverse effect on our business, results of operations and financial condition.
The diversity of the services we provide, and the clients we serve, may create actual, potential, and perceived conflicts of interest and conflicts of business that limit our growth and could lead to potential liabilities for us.
Because we provide services to a wide array of both government and commercial clients, occasions arise where, due to actual, potential, or perceived conflicts of interest or business conflicts, we cannot perform work for which we are qualified. A number of our contracts contain limitations on the work we can perform for others, such as, for example, when we are assisting a government agency or department in developing regulations or enforcement strategies. Actual, potential, and perceived conflicts limit the work we can do and, consequently, can limit our growth and adversely affect our operating results. In addition, if we fail to address actual or potential conflicts properly, or even if we simply fail to recognize a perceived conflict, we may be in violation of our existing contracts, may otherwise incur liability, and may lose future business for not preventing the conflict from arising, and our reputation may suffer.
Risks Related to Liquidity and Indebtedness
Our leverage and debt service obligations due to debt incurred in connection with our acquisitions could adversely affect our business, results of operations and financial condition.
Our financial performance could be adversely affected by our debt leverage. We may also incur significant additional indebtedness in the future, subject to various conditions including increased working capital requirements. An increase in the level of indebtedness could have important negative consequences to us, including making it more difficult to satisfy our obligations on outstanding debt obligations; making it more difficult to obtain additional financing in the future for working capital, capital expenditures, acquisitions or other general corporate purposes; requiring us to use more of our excess cash flow to pay interest and principal on our debt, which will reduce the amount of money available to finance our operations and other business activities; increasing our vulnerability to general economic downturns and adverse industry conditions; potentially limiting our flexibility in planning for, or reacting to, changes in our business and in our industry in general; exposing us to the risk of increased interest rates because the debt outstanding under our term loan and revolving credit facility bear interest at variable rates; placing us at a competitive disadvantage compared to our competitors that have less debt; and potentially limiting our ability to comply with the financial and other restrictive covenants in our debt instruments which, among other things, require us to maintain specified financial ratios, and could result in an event of default that, if not cured or waived, could have a material adverse effect on our business or prospects.
Our ability to make scheduled payments on or refinance our debt obligations depends on our financial condition and operating performance, which are subject to prevailing economic and competitive conditions and to certain financial, business, legislative, regulatory and other factors beyond our control. We may be unable to maintain a level of cash flows from operating activities sufficient to permit us to pay the amounts due on our indebtedness. If our cash flows and capital resources are insufficient to fund our debt service obligations, we could face substantial liquidity problems and could be forced to reduce or delay investments and capital expenditures or to dispose of material assets or operations, seek additional debt or equity capital or restructure or refinance our indebtedness. We may not be able to effect any such
23
alternative measures, if necessary, on commercially reasonable terms or at all and, even if successful, those alternative actions may not allow us to meet our scheduled debt service obligations. Our inability to generate sufficient cash flows to satisfy our debt obligations, or to refinance our indebtedness on commercially reasonable terms or at all, would materially adversely affect our financial position and results of operations. If we cannot make scheduled payments on our debt or comply with the other covenants under our Credit Agreement (as defined in Part II, Item 8, Note 5, “Debt Obligations” of the Notes to Consolidated Financial Statements included in this Annual Report on Form 10-K), we will be in default and the lenders under our Credit Agreement could terminate their commitments to loan money and could foreclose against the assets securing their borrowings and we could be forced into bankruptcy or liquidation.
We may not be able to obtain capital when desired on favorable terms, if at all, or without dilution to our stockholders, which may impact our ability to execute on our current or future business strategies.
If we do not generate sufficient cash flow from operations or otherwise, we may need additional financing to execute on our current or future business strategies, including developing new or enhancing existing service lines, expanding our business geographically, enhancing our operating infrastructure, acquiring complementary businesses, or otherwise responding to competitive pressures. We cannot assure you that additional financing will be available to us on favorable terms, or at all. Furthermore, if we raise additional funds through the issuance of convertible debt or equity securities, the percentage ownership of our stockholders could be significantly diluted, and these newly issued securities may have rights, preferences or privileges senior to those of existing stockholders. If adequate funds are not available or are not available on acceptable terms, if and when needed, our ability to fund our operations, meet obligations in the normal course of business, take advantage of strategic business opportunities, or otherwise respond to competitive pressures would be significantly limited.
Restrictive covenants in our Credit Agreement may restrict our ability to pursue certain business strategies.
Our Credit Agreement limits or restricts our and our subsidiaries’ ability to, among other things, incur, create or assume additional indebtedness; incur, create or assume liens securing debt or other encumbrances on our assets; purchase, hold or acquire unpermitted acquisitions or investments; make loans or advances; pay dividends or make distributions to our stockholders; purchase or redeem our stock; repay indebtedness that is junior to indebtedness under our Credit Agreement; acquire the assets of, or merge or consolidate with, other companies; and sell, lease, or otherwise dispose of assets.
Our Credit Agreement also requires that we maintain a maximum total net leverage ratio and a minimum fixed charge coverage ratio, tested on a quarterly basis, which we may not be able to achieve. The covenants may additionally impair our ability to finance future operations or capital needs or to engage in other favorable business activities. Failing to comply with these covenants could result in an event of default under the Credit Agreement, which could result in us being required to repay the amounts outstanding prior to maturity. These prepayment obligations could have an adverse effect on our business, results of operations and financial condition.
Furthermore, if we are unable to repay the amounts due and payable under the Credit Agreement, the lenders could proceed against the collateral granted to them to secure that indebtedness. In the event the lenders accelerate the repayment of our borrowings, we and our subsidiaries may not have sufficient assets to repay that indebtedness.
Risks Related to Our Clients and Our Projects
If we have a loss or reduction of business from a key customer or key utility programs, it could result in significant harm to our revenue, profitability and financial condition.
Most of our clients are not committed to purchase any minimum amount of our services, as our agreements with them are based on a “purchase order” model. As a result, they may discontinue utilizing some or all of our services with little or no notice, or we may not generate the amount of contract revenue or achieve the level of profitability we expect under such arrangements. As well, certain of our contracts are with other entities that are periodically funded by the applicable utility. Such funding is subject to periodic renewal and is outside our control or its contract counterparty and may, at times, be delayed or inhibited.
The loss of key utility programs or key clients (or financial difficulties at this utility program or these clients, which result in nonpayment or nonperformance) could have a significant and adverse effect on our business, results of
24
operations and financial condition. If these clients or utility programs significantly reduce their business or orders with us, default on their agreements with us or fail to renew or terminate their agreements with us, our business, results of operations and financial condition could be materially and adversely affected. We may not be able to win new contracts to replace these contracts if they are terminated early or expire as planned without being renewed.
In addition, the potential for requests from certain clients to significantly increase the services we provide them requires us to have sufficient resource capacity available in the regions where they are located. If we are unable to maintain such resource capacity, these clients or utility program may reduce or stop purchasing certain services from us. If such clients or utility program reduce or stop purchasing certain services from us, we may have substantial capacity available in regions where we do not have corresponding clients to service.
Our failure to win new contracts and renew existing contracts with private and public sector clients could adversely affect our business, results of operations and financial condition.
Our business depends on our ability to win new contracts and renew existing contracts with private and public sector clients. Contract proposals, negotiations, and software licenses are complex and frequently involve a lengthy bidding and selection process. If we are not able to replace the revenue from expiring contracts, either through follow-on contracts or new contracts, or secure new software licenses, our business, results of operations and financial condition may be adversely affected. A number of factors affect our ability to win new contracts and renew existing contracts, including, among other things, market conditions, financing arrangements, required governmental approvals, our client relationships and professional reputation. For example, a client may require us to provide a bond or letter of credit to protect the client should we fail to perform under the terms of the contract. If negative market conditions arise, or if we fail to secure adequate financial arrangements or the required government approval, we may not be able to pursue particular projects, which could adversely affect our business, results of operations and financial condition. Any factor that diminishes our reputation or client relationships with federal, state and local governments, as well as commercial clients, could make it substantially more difficult for us to compete successfully for both new engagements and qualified employees. To the extent our reputation and/or client relationships deteriorate, our business, results of operations and financial condition could be adversely affected.
Our contracts may contain provisions that are unfavorable to us and permit our clients to, among other things, terminate our contracts partially or completely at any time prior to completion.
Certain of our contracts contain provisions that allow our clients or utility programs to terminate or modify the contract at their convenience upon short notice. For example, our largest clients and utility programs may terminate their contracts with us at any time for any reason. If one of these clients or utility programs terminates their contract for convenience, we may only bill the client or utility program, as applicable, for work completed prior to the termination, plus any commitments and settlement expenses such client or utility program agrees to pay, but not for any work not yet performed.
In addition, many of our government contracts and task and delivery orders are incrementally funded as appropriated funds become available. The reduction or elimination of such funding can result in contract options not being exercised and further work on existing contracts and orders being curtailed. In any such event, we would have no right to seek lost fees or other damages. If a client were to terminate, decline to exercise options under, or curtail further performance under one or more of our major contracts, it could have a material adverse effect on our business, results of operations and financial condition.
Changes to tax laws and regulations, including changes to the energy efficient building deduction, could adversely affect our business, results of operations and financial condition.
Tax laws and regulations are highly complex and subject to interpretation, and the tax laws and regulations to which we are subject to change over time. Our tax filings are based upon our interpretation of the tax laws in effect in various jurisdictions for the periods for which the filings are made. As our business grows, we are required to comply with increasingly complex taxation rules and practices. We are subject to tax in multiple U.S. tax jurisdictions. Changes in federal, state and local tax laws and regulations could adversely affect our business, results of operations and financial condition.
25
Because we primarily provide services to municipalities, public utilities and other public agencies, we are more susceptible to the unique risks associated with government contracts.
We primarily work for utilities, municipalities and other public agencies. Consequently, we are exposed to certain risks associated with public agency and government contracting, any one of which can have a material adverse effect on our business, results of operations and financial condition. These risks include the ability of the public agency to terminate the contract with 30 days’ prior notice or less; changes in public agency spending and fiscal policies which can have an adverse effect on demand for our services; contracts that are subject to public agency budget cycles, and often are subject to renewal on an annual basis; the often wide variation of the types and pricing terms of contracts from agency to agency; the difficulty of obtaining change orders and additions to contracts; and the requirement to perform periodic audits as a condition of certain contract arrangements.
Each year, client funding for some of our government contracts rely on government appropriations or public-supported financing. If adequate public funding is delayed or is not available, then we may not be able to realize all of our anticipated revenue and profits from such contracts, which could adversely affect our business, results of operations and financial condition.
A substantial portion of our revenue is derived from contracts with agencies and departments of state and local governments. Each year, client funding for some of our government contracts may directly or indirectly rely on government appropriations or public-supported financing. Legislatures may appropriate funds for a given project on a year-by-year basis, even though the project may take more than one year to perform. In addition, public-supported financing such as state and local municipal bonds may be only partially raised to support existing projects. Similarly, the impact of the economic downturn on state and local governments may make it more difficult for them to fund projects. In addition to the state of the economy and competing political priorities, public funds and the timing of payment of these funds may be influenced by, among other things, curtailments in the use of government contracting firms, increases in raw material costs, delays associated with insufficient numbers of government staff to oversee contracts, budget constraints, the timing and amount of tax receipts, and the overall level of government expenditures. If adequate public funding is not available or is delayed, then our profits and revenue could decline and we will not realize all of our potential revenue and profit from that contract.
We derive significant revenue and profit from contracts awarded through a competitive bidding process, which can impose substantial costs on us, and we will lose revenue and profit if we fail to compete effectively.
We derive significant revenue and profit from contracts that are awarded through a competitive bidding process. Competitive bidding imposes substantial costs and presents a number of risks, including the substantial cost and managerial time and effort that we spend to prepare bids and proposals; the need to estimate accurately the resources and costs that will be required to service any contracts we are awarded, sometimes in advance of the final determination of their full scope; the expense and delay that may arise if our competitors protest or challenge awards made to us pursuant to competitive bidding, as discussed below; and the opportunity cost of not bidding on and winning other contracts we may have otherwise pursued.
To the extent we engage in competitive bidding and are unable to win particular contracts, we not only incur substantial costs in the bidding process that negatively affect our operating results, but we may lose the opportunity to operate in the market for the services provided under those contracts for a number of years. Even if we win a particular contract through competitive bidding, our profit margins may be depressed or we may even suffer losses as a result of the costs incurred through the bidding process and the need to lower our prices to overcome competition.
Changes in elected or appointed officials could have a material adverse effect on our ability to retain an existing contract with or obtain additional contracts from a public agency.
Since the decision to retain our services is made by individuals, such as city managers, city councils and other elected or appointed officials, our business and financial results or condition could be adversely affected by the results of local and regional elections. A change in the individuals responsible for selecting consultants for and awarding contracts on behalf of a public agency (for example, due to an election) could adversely affect our ability to retain an existing contract with or obtain additional contracts from such public agency.
26
If our business partners fail to perform their contractual obligations on a project, we could be exposed to legal liability, loss of reputation and profit reduction or loss on the project.
We routinely enter into subcontracts and, occasionally, joint ventures, teaming arrangements, and other contractual arrangements so that we can jointly bid and perform on a particular project. Success under these arrangements depends in large part on whether our business partners fulfill their contractual obligations satisfactorily. In addition, when we operate through a joint venture in which we are a minority holder, we have limited control over many project decisions, including decisions related to the joint venture’s internal controls, which may not be subject to the same internal control procedures that we employ. If these unaffiliated third parties do not fulfill their contract obligations, the partnerships or joint ventures may be unable to adequately perform and deliver their contracted services. Under these circumstances, we may be obligated to pay financial penalties, provide additional services to ensure the adequate performance and delivery of the contracted services, and may be jointly and severally liable for the other’s actions or contract performance. These additional obligations could result in reduced profits and revenues or, in some cases, significant losses for us with respect to the joint venture, which could also affect our reputation in the industries we serve.
If our reports and opinions are not in compliance with professional standards and other regulations or without the appropriate disclaimers or in a misleading or incomplete manner, we could be subject to monetary damages and penalties.
We issue reports and opinions to clients based on our professional engineering expertise, as well as our other professional credentials. Our reports and opinions may need to comply with professional standards, licensing requirements, securities regulations, and other laws and rules governing the performance of professional services in the jurisdiction in which the services are performed. In addition, the reports and other work product we produce for clients sometimes include projections, forecasts and other forward-looking statements. Such information by its nature is subject to numerous risks and uncertainties, any of which could cause the information produced by us to ultimately prove inaccurate. Once we produce written reports for our clients, we do not always have the ability to control the manner in which our clients use such information, even if we include appropriate disclaimers in such written work product. As a result, if our clients reproduce such information to solicit funds from investors for projects without appropriate disclaimers or the information proves to be incorrect, or if our clients reproduce such information for potential investors in a misleading or incomplete manner, our clients or such investors may threaten to or file suit against us for, among other things, securities law violations.
We may be required to pay liquidated damages if we fail to meet milestone requirements in our contracts.
We may be required to pay liquidated damages if we fail to meet milestone requirements in our contracts. Failure to meet any of the milestone requirements could result in additional costs, and the amount of such additional costs could exceed the projected profits on the project. These additional costs include liquidated damages paid under contractual penalty provisions, which can be substantial and can accrue on a regular basis.
Risks Related to Growth and Acquisitions
Acquisitions could disrupt our operations and adversely impact our business, results of operations and financial condition as a result of our failure to conduct due diligence effectively, or our inability to successfully integrate the acquiree. This could impede us from realizing all of the benefits of the acquisitions, which could weaken our results of operations.
A key part of our growth strategy is to acquire other companies that complement our lines of business, broaden our technical capabilities and/or expand our geographic presence. We expect to continue to acquire companies as an element of our growth strategy; however, our ability to make acquisitions may be restricted by our inability to incur additional indebtedness and/or make unpermitted acquisitions or investments under our Credit Agreement. Our acquisition strategy may divert management’s attention away from our existing businesses, resulting in the loss of key clients or key employees, and expose us to unanticipated problems or legal liabilities, including responsibility as a successor-in-interest for undisclosed or contingent liabilities of acquired businesses or assets.
Acquisitions involve certain known and unknown risks that could cause our actual growth or operating results to differ from our expectations or the expectations of securities analysts. If we fail to conduct due diligence on our potential targets effectively, we may, for example, not identify problems at target companies, or fail to recognize
27
incompatibilities or other obstacles to successful integration. Our inability to successfully integrate future acquisitions within the intended timeframes or at all could impede us from realizing all of the benefits of those acquisitions and could severely weaken our business operations. The integration process may disrupt our business and, if implemented ineffectively, may preclude realization of the full benefits expected by us and could harm our results of operations. In addition, the overall integration of the combining companies may result in unanticipated problems, expenses, liabilities and competitive responses and may cause our stock price to decline.
Even if the operations of an acquisition are integrated successfully, we may not realize the full benefits of the acquisition, including the synergies, cost savings or growth opportunities that we expect. These benefits may not be achieved within the anticipated time frame, or at all.
Further, acquisitions may cause us to issue common stock that would dilute our current stockholders’ ownership percentage; use a substantial portion of our cash resources; increase our interest expense, leverage and debt service requirements (if we incur additional debt to pay for an acquisition); and assume liabilities, including environmental liabilities, for which we do not have indemnification from the former owners.
If we are not able to successfully manage our growth strategy, our business, results of operations and financial condition may be adversely affected.
Our expected future growth presents numerous managerial, administrative, operational, and other challenges. Our ability to manage the growth of our operations will require us to continue to improve our management information systems and our other internal systems and controls. In addition, our growth will increase our need to attract, develop, motivate, and retain both our management and professional employees. The inability to effectively manage our growth or the inability of our employees to achieve anticipated performance could have a material adverse effect on our business, results of operations and financial condition.
Moreover, our continued expansion into new states will increase our legal and regulatory risk. Our failure, or alleged failure, to comply with applicable laws and regulations in any new jurisdiction in which we operate, and ensuing inquiries or investigations by regulatory and enforcement authorities, may result in regulatory action, including suspension or revocation of one or more of our licenses, civil or criminal penalties or other disciplinary actions and restrictions on or suspension of some or all of our business operations. As a result, our business could suffer, our reputation could be harmed, one or more of our contracts with governmental or non-governmental entities could be terminated and we could be subject to additional legal risk. This could, in turn, increase the size and number of claims and damages asserted against us, subject us to additional regulatory investigations, enforcement actions or other proceedings or lead to increased regulatory or supervisory concerns. We cannot predict the timing or form of any current or future regulatory or law enforcement initiatives, and any such initiatives could have a material adverse effect on our business, results of operations and financial condition.
Our acquired businesses may underperform relative to our expectations.
We may not be able to maintain the levels of growth, revenue, earnings or operating efficiency that we and our acquired businesses have historically achieved or might achieve separately. The business and financial performance of an acquired business is subject to certain risks and uncertainties, including the risk of the loss of, or changes to, the acquired business’s client relationships; the dependence of its business on a limited number of customers to generate substantially all of its revenue; the acquired business’s reliance on subcontractors to meet its contractual obligations and the failure by such subcontractors to effectively perform their services in a timely manner; negative publicity or reputation from any prior investigations and settlements involving the acquired business; and reliance on the key personnel of the acquired business.
If our goodwill or other intangible assets become impaired, then our profits may be significantly reduced.
Because we have completed a number of acquisitions, goodwill and other intangible assets represent a substantial portion of our assets. Under Generally Accepted Accounting Principles in the United States, we are required to perform a goodwill impairment test for potential impairment at least on an annual basis. We also assess the recoverability of the unamortized balance of our intangible assets when indications of impairment are present based on expected future profitability and undiscounted expected cash flows and their contribution to our overall operations. The goodwill impairment test requires us to determine the fair value of our reporting units, which are the components at or
28
one level below our reportable segments. In determining fair value, we make significant judgments and estimates, including assumptions about our strategic plans with regard to our operations. We also analyze current economic indicators and market valuations to help determine fair value. To the extent economic conditions that would impact the future operations of our reporting units change, our goodwill may be deemed to be impaired, and we would be required to record a non-cash charge that could result in a material adverse effect on our business, results of operations and financial condition. We had no goodwill impairment in fiscal years 2023, 2022, or 2021.
Risks Related to Our Regulatory Environment
We are subject to various routine and non-routine governmental reviews, audits and investigations, and unfavorable government audit results could force us to adjust previously reported operating results, could affect future operating results, could subject us to a variety of penalties and sanctions, and could result in harm to our reputation.
Government departments and agencies and their representatives may audit and review our contract performance, pricing practices, cost structure, financial capability and compliance with applicable laws, rules and regulations. Audits could raise issues that have significant adverse effects, including, among other things, substantial adjustments to our previously reported operating results and substantial effects on future operating results. Historically, we have not experienced significant disallowed costs as a result of government audits. However, we can provide no assurance that government audits will not result in material disallowances for incurred costs in the future. In addition, we must also comply with other government regulations related to employment practices, environmental protection, health and safety, tax, accounting, and anti-fraud measures, as well as many other regulations in order to maintain our government contractor status. These laws and regulations affect how we do business with our clients and, in some instances, impose additional costs on our business operations. Although we take precautions to prevent and deter fraud, misconduct, and non-compliance, we face the risk that our employees or outside partners may engage in misconduct, fraud, or other improper activities. If a government audit, review or investigation uncovers improper or illegal activities, we may be subject to civil and criminal penalties and administrative sanctions, including termination of contracts, repayment of amounts already received under contracts, forfeiture of profits, suspension of payments, fines and suspension or debarment from doing business with federal and state and local government agencies and departments, any of which could adversely affect our reputation, our business, results of operations and financial condition, and/or the value of our stock. We may also lose business if we are found not to be sufficiently able to meet ongoing cash flow and financial obligations on a timely basis. In addition, we could suffer serious harm to our reputation and our stock price could decline if allegations of impropriety are made against us, whether true or not.
Legislation, policy, rules or regulations may be enacted that limit or change the ability of state, regional or local agencies to contract for our privatized services. Such changes would affect our ability to obtain new contracts and may decrease the demand for our services.
Legislation is proposed periodically, particularly in the states of California and New York, that attempts to limit the ability of governmental agencies to contract with private consultants to provide services. Should such changes occur and be upheld, demand for our services may be materially adversely affected. While attempts at such legislation have failed in the past, such measures could be adopted in the future.
Changes in energy, environmental, or infrastructure industry laws, regulations, and programs could directly or indirectly reduce the demand for our services, which could in turn negatively impact our revenue.
Some of our services are directly or indirectly impacted by changes in U.S. federal, state, or local laws and regulations pertaining to the energy, environmental, and infrastructure industries. Accordingly, a relaxation or repeal of these laws and regulations, or changes in governmental policies regarding the funding, implementation or enforcement of these programs, could result in a decline in demand for our services, which could in turn negatively impact our revenue.
Corporate responsibility, specifically related to environmental, social and governance (“ESG”) matters, may impose additional costs and expose us to new risks.
Public ESG and sustainability reporting is becoming more broadly expected by investors, shareholders, and other stakeholders. Certain organizations that provide corporate governance and other corporate risk information to investors and shareholders have developed, and others may in the future develop, scores and ratings to evaluate
29
companies and investment funds based upon ESG or “sustainability” metrics. Many investment funds focus on positive ESG business practices and sustainability scores when making investments and may consider a company’s ESG or sustainability scores as a reputational or other factor in making an investment decision. In addition, investors, particularly institutional investors, use these scores to benchmark companies against their peers and if a company is perceived as lagging, these investors may engage with such company to improve ESG disclosure or performance and may also make voting decisions, or take other actions, to hold these companies and their boards of directors accountable. We may also face reputational damage in the event our corporate responsibility initiatives, objectives, reporting, or disclosure controls, including with respect matters such as to board diversity and climate change, do not meet the expectations of our investors, shareholders, lawmakers, listing exchange or other constituencies, or if we are unable to achieve an acceptable ESG or sustainability rating from third party rating services. A low ESG or sustainability rating by a third-party rating service could also result in the exclusion of our common stock from consideration by certain investors who may elect to invest with our competition instead. Ongoing focus on corporate responsibility matters by investors and other parties as described above, as well as disclosure regulations, may impose additional costs or expose us to new risks.
General Risk Factors
Our bylaws, our certificate of incorporation and Delaware law contain provisions that could discourage another company from acquiring us and may prevent attempts by our stockholders to replace or remove our current management.
Provisions of our bylaws, our certificate of incorporation and Delaware law may discourage, delay or prevent a merger or acquisition that stockholders may consider favorable, including transactions in which our stockholders might otherwise receive a premium for their shares. In addition, these provisions may frustrate or prevent any attempts by our stockholders to replace or remove our current management by making it more difficult for stockholders to replace or remove our board of directors. These provisions include eliminating the ability of stockholders to call special meetings of stockholders; requiring at least a supermajority vote of the outstanding shares of our common stock for stockholders to amend our bylaws or certain provisions of our certificate of incorporation; not providing for cumulative voting in the election of directors, prohibiting stockholder action by written consent; establishing advance notice procedure for stockholders to make nominations of candidates for election as directors, or bring other business before an annual or special meeting of the stockholders; and authorizing the Board of Directors to issue “blank check” preferred stock or authorized but unissued shares of common stock without stockholder approval.
In addition, we are subject to Section 203 of the Delaware General Corporation Law. In general, subject to some exceptions, Section 203 prohibits a Delaware corporation from engaging in any business combination with any “interested stockholder” (which is generally defined as an entity or person who, together with the person’s affiliates and associates, beneficially owns, or within three years prior to the time of determination of interested stockholder status did own, 15% or more of the outstanding voting stock of the corporation), for a three-year period following the date that the stockholder became an interested stockholder. Section 203 could have the effect of delaying, deferring or preventing a change in control that our stockholders might consider to be in their best interests.
Together, these charter and statutory provisions could make the removal of management more difficult and may discourage transactions that otherwise could involve payment of a premium over prevailing market prices for our common stock. The existence of the foregoing provisions and anti-takeover measures could limit the price that investors might be willing to pay in the future for shares of our common stock. They could also deter potential acquirers of our company, thereby potentially reducing the likelihood that our stockholders could receive a premium for their common stock in an acquisition.
Cyber security breaches or other systems and information technology interruptions could result in liability, harm our reputation and impact our ability to operate.
We rely on computer, information, and communications technology and systems to operate. We store and process large amounts of confidential information concerning our employees, customers, contractors, and vendors. We also rely in part on third-party software and information technology vendors to run certain parts of our information technology systems and our business. If our third-party service providers experience a cyber security breach or other interruption, we could experience adverse consequences.
30
In the ordinary course of business, we have been targeted by malicious cyber-attacks. Cybersecurity attacks in particular are evolving, and we and the third parties upon which we rely face the constant risk of cybersecurity threats, including, among other things, computer viruses, malicious code, attacks by computer hackers, organized cyber-attacks, ransomware attacks, and other electronic security breaches that could lead to disruptions in critical systems, unauthorized, unlawful, or accidental acquisition, modification, destruction, loss, encryption, access to, release or other compromise of confidential or sensitive information.
While we have implemented security measures designed to protect against cyber security breaches, there can be no assurance that these measures will be effective. We take steps designed to detect, mitigate, and remediate vulnerabilities in our information systems (such as our hardware and/or software, including that of third parties upon which we rely). We may not, however, detect and remediate all such vulnerabilities including on a timely basis. Further, we may experience delays in developing and deploying remedial measures and patches designed to address identified vulnerabilities. Vulnerabilities could be exploited and result in a cyber security breach or other interruption.
If we experience system interruptions and delays from cybersecurity attacks or otherwise, it could suspend or stop our operations, and could have a material adverse effect on our business, results of operations and financial condition, and could negatively impact our clients. Further, improper disclosure of confidential, proprietary or sensitive information of our employees, customers, contractors and vendors could harm our reputation and subject us to liability and other harms.
Data privacy risks, including evolving laws, regulations, and other obligations, may result in business interruption and increased costs and liabilities.
Laws, regulations and other obligations (including without limitation applicable guidance, industry standards, external and internal privacy and security policies and statements, and contractual requirements) relating to personal data and data privacy are constantly evolving, as federal, state, local and foreign governments adopt new measures addressing data privacy. These laws impose stringent obligations. For example, the California Consumer Privacy Act, as amended (“CCPA”), which applies to business representative and other types of personal data of California residents, provides for fines of up to $7,500 per intentional violation and allows private litigants affected by certain data breaches to recover significant statutory damages. Our privacy obligations, including applicable laws and regulations, may be interpreted or applied in a manner that is inconsistent with each other and may complicate our existing data privacy practices. Evolving compliance and operational requirements under the privacy laws of the jurisdictions in which we operate, regulations, and other obligations have become increasingly burdensome and complex. Our failure to comply (or perceived failure to comply) with these obligations could result in costly enforcement actions (including regulatory proceedings, investigations, fines, penalties, audits, and inspections), litigation (including class action claims) or mass arbitration demands, penalties and fines, require us to change our business practices or cause business interruptions, and may lead to liabilities and other harms.
31
ITEM 1B. UNRESOLVED STAFF COMMENTS
None.
ITEM 1C. CYBERSECURITY
Risk management and strategy
The Company has incorporated evaluation of cybersecurity threats into its overall risk management strategy. As such, Willdan has established a cybersecurity program designed to address applicable legal requirements. Through its internally dedicated cybersecurity team, combined with cybersecurity-specific technologies and external cybersecurity service professionals, the Company assesses, identifies, and manages material risks from cybersecurity threats to its critical computer networks, hardware and software, and data.
The Company’s cybersecurity team helps identify and assess risks from cybersecurity threats by monitoring and evaluating the Company’s threat environment using various methods. Through the use of internal and external risk assessment audits of certain environments aimed at identifying potential areas of cybersecurity risk, external and internal monitoring alerts, and other external and internal tools (such as next generation endpoint security (EDR/XDR), SASE framework, next-gen firewalls, and external-party monitoring of endpoint and cloud security environments), the Company performs ongoing assessments of its cybersecurity risks that are designed to take into account the rapidly evolving cybersecurity threat landscape. Further, in conjunction with its ISO 27001 and SOC2 certifications, the Company undergoes annual external audits that include reviews of its cybersecurity risk assessment processes and policies.
In an attempt to manage and mitigate material risks from cybersecurity threats, the Company’s cybersecurity risk management process includes certain preventive measures, detective controls, and incident response procedures, depending on the environment and systems. This includes implementing security controls in certain environments and systems, ongoing monitoring of certain environments and systems, adopting response protocols for security incidents, and maintaining cybersecurity insurance. The Company’s cybersecurity risk management approach is periodically reviewed by management and certain external service professionals to assess whether any changes are needed to reflect changing threats.
In addition, assessment and management of material risks from cybersecurity threats are integrated into the Company’s risk management strategy. For example, our cybersecurity team works with management to prioritize our risk management processes and mitigate cybersecurity threats that are more likely to lead to a material impact to our business.
For a description of the risks from cybersecurity threats that may materially affect the Company and how they may do so, see our risk factors under Part 1. Item 1A. Risk Factors in this Annual Report on Form 10-K, Cyber security breaches or other systems and information technology interruptions could result in liability, harm our reputation and impact our ability to operate.
The Company engages third-party cybersecurity consultants and auditors who help the cybersecurity team in identifying, assessing, and managing material risks from cybersecurity threats, including by evaluating and enhancing the Company’s cybersecurity posture. The Company also engages third-party service providers to perform a variety of functions throughout its business. The Company performs due diligence before engaging with certain third-party service providers designed to evaluate the service providers’ cybersecurity practices, including their security policies, incident response capabilities, and data protection measures (as evidenced by third party certifications including ISO 27001 and SOC II reports); including specific cybersecurity requirements in contracts with certain third-party service providers, such as regarding security standards, data protection, and incident reporting as applicable; and monitoring and auditing certain third-party service providers’ cybersecurity practices and compliance with contractual obligations. Depending on the nature of the services provided, the sensitivity of the information systems and data at issue, and the identity of the provider, the Company’s vendor management process may involve different levels of assessment designed to help
32
identify cybersecurity risks associated with a provider and impose contractual obligations related to cybersecurity on the provider.
Governance
The Board addresses the Company’s cybersecurity risk management as part of its general oversight function. The Board is responsible for overseeing Company’s cybersecurity risk management processes, including oversight and mitigation of risks from cybersecurity threats.
Our cybersecurity risk assessment and management processes are implemented and maintained by the certain members of Company management, including those who are part of the Company’s cybersecurity team. The Company’s cybersecurity team is comprised of individuals with expertise in cybersecurity, information technology, risk management, and Company operations. Our cybersecurity team has decades-long experience in cybersecurity and holds industry-standard certifications including Certified Information Systems Security Professional (“CISSP”), Certified Cloud Security Professional (“CCSP”), among others.
Management is responsible for hiring appropriate personnel, helping to integrate cybersecurity risk considerations into the Company’s overall risk management strategy, and communicating key priorities to relevant personnel. Management is responsible for approving budgets, helping prepare for cybersecurity incidents, approving cybersecurity processes, and reviewing security assessments and other security-related reports.
The Company’s cybersecurity incident response plan is designed to escalate certain cybersecurity incidents to members of management depending on the circumstances, including the Company’s President and Chief Executive Officer, Chief Financial Officer, and General Counsel (collectively, “Executive Management”). Executive Management works with the Company’s incident response team to help the Company mitigate and remediate cybersecurity incidents of which they are notified. In addition, the Company’s incident response plan includes reporting to the Board for certain cybersecurity incidents.
The Company’s Board provides oversight of cybersecurity risk and regularly receives updates from the Company’s cybersecurity team. These updates cover topics that include cybersecurity team member updates, cybersecurity infrastructure updates, improvement in cyber-security tools and technologies, cybersecurity framework compliance, cyber-risk hardware/software enhancement updates, cybersecurity threats and mitigation measures, and more. The Board also has access to various reports, summaries or presentations related to cybersecurity threats, risk and mitigation.
ITEM 2. PROPERTIES
Our corporate headquarters is located at 2401 East Katella Avenue, Anaheim, California, where we lease approximately 18,000 square feet of office space. In addition, we lease office space in 44 other locations nationwide, principally in California and New York. In addition to the U.S. locations, we also have one office in Canada and one office in the Commonwealth of Puerto Rico. In total, our facilities contain approximately 243,000 square feet of office space and are subject to leases that expire through 2029. We rent a small portion of this total space on a month-to-month basis. We believe that our existing facilities are adequate to meet current requirements and that suitable additional or substitute space will be available as needed to accommodate any expansion of operations and for additional offices.
ITEM 3. LEGAL PROCEEDINGS
We are subject to claims and lawsuits from time to time, including those alleging professional errors or omissions that arise in the ordinary course of business against firms that operate in the engineering and consulting professions. We carry professional liability insurance, subject to certain deductibles and policy limits, for such claims as they arise and may from time to time establish reserves for litigation that is considered probable of a loss.
In accordance with accounting standards regarding loss contingencies, we accrue an undiscounted liability for those contingencies where the incurrence of a loss is probable and the amount can be reasonably estimated, and we
33
disclose the amount accrued and an estimate of any reasonably possible loss in excess of the amount accrued, if such disclosure is necessary for our financial statements not to be misleading. We do not accrue liabilities when the likelihood that the liability has been incurred is probable but the amount cannot be reasonably estimated, or when the liability is believed to be only reasonably possible or remote.
Because litigation outcomes are inherently unpredictable, our evaluation of legal proceedings often involves a series of complex assessments by management about future events and can rely heavily on estimates and assumptions. If the assessments indicate that loss contingencies that could be material to any one of our financial statements are not probable, but are reasonably possible, or are probable, but cannot be estimated, then we disclose the nature of the loss contingencies, together with an estimate of the possible loss or a statement that such loss is not reasonably estimable. While the consequences of certain unresolved proceedings are not presently determinable, and a reasonable estimate of the probable and reasonably possible loss or range of loss in excess of amounts accrued for such proceedings cannot be made, an adverse outcome from such proceedings could have a material adverse effect on our earnings in any given reporting period. However, in the opinion of our management, after consulting with legal counsel, and taking into account insurance coverage, the ultimate liability related to current outstanding claims and lawsuits is not expected to have a material adverse effect on our financial statements.
ITEM 4. MINE SAFETY DISCLOSURES
Not applicable.
34
PART II
ITEM 5. MARKET FOR REGISTRANT’S COMMON EQUITY, RELATED STOCKHOLDER MATTERS AND ISSUER PURCHASES OF EQUITY SECURITIES
Market Information for Common Stock
Since November 21, 2006, the common stock of Willdan Group, Inc. has been listed and traded on the Nasdaq Global Market under the symbol “WLDN”.
Stockholders
As of March 6, 2024, there were 171 stockholders of record of our common stock. This number does not include persons who hold our common stock in nominee or “street name” accounts through brokers or banks.
Dividends
We did not declare or pay cash dividends on our common stock in fiscal years 2023, 2022, or 2021.
We currently expect to retain all available funds and future earnings, if any, for use in the operation and growth of our business and do not anticipate paying any cash dividends in the foreseeable future. Any future determination to pay dividends will be at the discretion of our board of directors, subject to compliance with applicable law and any contractual provisions, including under the Credit Agreement and agreements governing any additional indebtedness we may incur in the future, that restrict or limit our ability to pay dividends, and will depend upon, among other factors, our results of operations, financial condition, earnings, capital requirements and other factors that our board of directors deems relevant. Because we are a holding company, our ability to pay dividends depends on our receipt of cash dividends from our operating subsidiaries, which may further restrict our ability to pay dividends as a result of the laws of their jurisdiction of organization, agreements of our subsidiaries or covenants under our existing or future indebtedness.
Performance Graph
The following graph compares the 5-year cumulative total stockholder return of our common stock with the cumulative total return of the Nasdaq Composite and a customized peer group. The companies included in our customized peer group represent our definitive Proxy peer group which is reviewed annually and revised as necessary. In the event that a peer group company is acquired and/or delisted, we remove that company from our peer group on such corresponding acquisition date and/or delisting date. The customized peer group consists of American Superconductor Corporation, Atlas Technical Consultants, Inc., Bowman Consulting Group Ltd., C3.ai, Inc., Charah Solutions, Inc., Exponent, Inc., FTC Solar, Inc., ICF International, Inc., Limbach Holdings, Inc., Montrose Environmental Group, Inc., NV5 Global, Inc., Orion Energy Systems, Inc., RCM Technologies, Inc., Resource Connection, Inc., and Stem, Inc.
The peer group investment is weighted by market capitalization as of December 28, 2018 and is adjusted monthly. An investment of $100, with reinvestment of all dividends, is assumed to have been made in our common stock, in the peer group, and in the Nasdaq Composite on December 28, 2018, and the relative performance of each is tracked through and including December 29, 2023. The stock price performance shown in the graph is not necessarily indicative of future stock price performance.
35
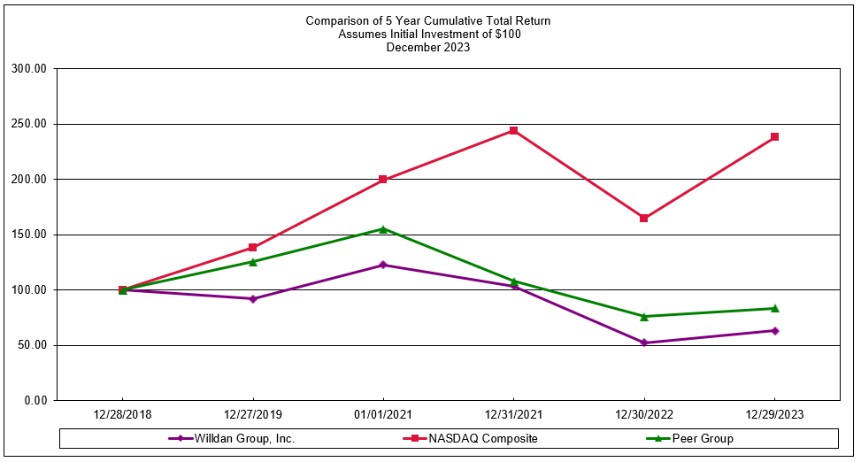
Recent Sales of Unregistered Securities
None.
Issuer Repurchases of Equity Securities
None.
36
ITEM 7. MANAGEMENT’S DISCUSSION AND ANALYSIS OF FINANCIAL CONDITION AND RESULTS OF OPERATIONS
Our Company
We are a provider of professional, technical and consulting services to utilities, private industry, and public agencies at all levels of government. As resource and infrastructure needs undergo continuous change, we help organizations and their communities evolve and thrive by providing a wide range of technical services for energy solutions, greenhouse gas reduction, and government infrastructure. Through engineering, program management, policy advisory, and software and data management, we plan, design and deliver trusted, comprehensive, innovative, and proven solutions to improve efficiency, resiliency, and sustainability in energy and infrastructure to our clients.
Our broad portfolio of services operates within two financial reporting segments: (1) Energy and (2) Engineering and Consulting. The interfaces and synergies between these segments are important elements of our strategy to design and deliver trusted, comprehensive, innovative, and proven solutions and services for our customers.
Our Energy segment provides specialized, innovative, comprehensive energy solutions to businesses, utilities, state agencies, municipalities, and non-profit organizations in the U.S. Our experienced engineers, consultants, and staff help our clients realize cost and energy savings by tailoring efficient and cost-effective solutions to assist in optimizing energy spend. Our energy efficiency services include comprehensive audit and surveys, program design, master planning, demand reduction, grid optimization, benchmarking analyses, design engineering, construction management, performance contracting, installation, alternative financing, measurement and verification services, and advances in software and data analytics for long-term planning.
Our Engineering and Consulting segment provides civil engineering-related construction management, building and safety, city engineering office management, city planning, civil design, geotechnical, material testing and other engineering consulting services to our clients. Our engineering services include traffic, bridges, rail, port, water, mining and other civil engineering projects. We also provide economic and financial consulting to public agencies. Lastly, we supplement the engineering services that we offer our clients by offering expertise and support for the various financing techniques public agencies utilize to finance their operations and infrastructure. We also support the mandated reporting and other requirements associated with these financings. We provide financial advisory services for municipal securities but do not provide underwriting services.
38
Results of Operations
Summary Comparison of 2023, 2022, and 2021
The following table sets forth, for the periods indicated, certain information derived from our consolidated statements of comprehensive income(1):
Fiscal Year | ||||||||||||||||||
2023 | 2022 | 2021 | ||||||||||||||||
(in thousands, except percentages) | ||||||||||||||||||
Contract revenue | $ | 510,095 | 100.0 | % | $ | 429,138 | 100.0 | % | $ | 353,755 | 100.0 | % | ||||||
Direct costs of contract revenue: | ||||||||||||||||||
Salaries and wages | 89,915 | 17.6 | 82,972 | 19.3 | 65,648 | 18.6 | ||||||||||||
Subcontractor services and other direct costs | 240,413 | 47.1 | 202,587 | 47.2 | 152,233 | 43.0 | ||||||||||||
Total direct costs of contract revenue | 330,328 | 64.8 | 285,559 | 66.5 | 217,881 | 61.6 | ||||||||||||
Gross profit | 179,767 | 35.2 | 143,579 | 33.5 | 135,874 | 38.4 | ||||||||||||
General and administrative expenses: | ||||||||||||||||||
Salaries and wages, payroll taxes and employee benefits | 95,556 | 18.7 | 81,801 | 19.1 | 73,812 | 20.9 | ||||||||||||
Facilities and facilities related | 9,565 | 1.9 | 9,287 | 2.2 | 9,896 | 2.8 | ||||||||||||
Stock-based compensation | 5,323 | 1.0 | 8,373 | 2.0 | 16,563 | 4.7 | ||||||||||||
Depreciation and amortization | 16,431 | 3.2 | 17,489 | 4.1 | 17,146 | 4.8 | ||||||||||||
Other | 30,818 | 6.0 | 33,692 | 7.9 | 27,148 | 7.7 | ||||||||||||
Total general and administrative expenses | 157,693 | 30.9 | 150,642 | 35.1 | 144,565 | 40.9 | ||||||||||||
Income (loss) from operations | 22,074 | 4.3 | (7,063) | (1.6) | (8,691) | (2.5) | ||||||||||||
Other income (expense): | ||||||||||||||||||
Interest expense | (9,413) | (1.8) | (5,328) | (1.2) | (3,869) | (1.1) | ||||||||||||
Other, net | 1,930 | 0.4 | 939 | 0.2 | 156 | 0.0 | ||||||||||||
Total other income (expense) | (7,483) | (1.5) | (4,389) | (1.0) | (3,713) | (1.0) | ||||||||||||
Income (Loss) before income tax expense | 14,591 | 2.9 | (11,452) | (2.7) | (12,404) | (3.5) | ||||||||||||
Income tax expense (benefit) | 3,665 | 0.7 | (3,004) | (0.7) | (3,987) | (1.1) | ||||||||||||
Net income (loss) | $ | 10,926 | 2.1 | $ | (8,448) | (2.0) | $ | (8,417) | (2.4) | |||||||||
| (1) | Percentages are expressed as a percentage of contract revenue and may not total due to rounding. |
39
The following tables provides information about disaggregated revenue of our two segments, Energy and Engineering and Consulting by contract type, client type, and geographical region:
| 2023 | ||||||||
| Energy |
| Engineering and |
| Total | ||||
| (in thousands) | ||||||||
Contract Type | |||||||||
Time-and-materials | $ | 35,582 | $ | 63,530 | $ | 99,112 | |||
Unit-based | 199,040 | 15,753 | 214,793 | ||||||
Fixed price | 192,354 | 3,836 | 196,190 | ||||||
Total (1) | $ | 426,976 | $ | 83,119 | $ | 510,095 | |||
Client Type | |||||||||
Commercial | $ | 31,162 | $ | 5,866 | $ | 37,028 | |||
Government | 159,935 | 76,972 | 236,907 | ||||||
Utilities (2) | 235,879 | 281 | 236,160 | ||||||
Total (1) | $ | 426,976 | $ | 83,119 | $ | 510,095 | |||
Geography (3) | |||||||||
Domestic | $ | 426,976 | $ | 83,119 | $ | 510,095 | |||
| 2022 | ||||||||
| Energy |
| Engineering and |
| Total | ||||
| (in thousands) | ||||||||
Contract Type | |||||||||
Time-and-materials | $ | 32,491 | $ | 53,584 | $ | 86,075 | |||
Unit-based | 180,509 | 14,296 | 194,805 | ||||||
Fixed price | 144,460 | 3,798 | 148,258 | ||||||
Total (1) | $ | 357,460 | $ | 71,678 | $ | 429,138 | |||
Client Type | |||||||||
Commercial | $ | 29,782 | $ | 5,566 | $ | 35,348 | |||
Government | 126,494 | 65,969 | 192,463 | ||||||
Utilities (2) | 201,184 | 143 | 201,327 | ||||||
Total (1) | $ | 357,460 | $ | 71,678 | $ | 429,138 | |||
Geography (3) | |||||||||
Domestic | $ | 357,460 | $ | 71,678 | $ | 429,138 | |||
| 2021 | ||||||||
| Energy |
| Engineering and |
| Total | ||||
| (in thousands) | ||||||||
Contract Type | |||||||||
Time-and-materials | $ | 34,004 | $ | 52,209 | $ | 86,213 | |||
Unit-based | 180,311 | 10,688 | 190,999 | ||||||
Fixed price | 72,069 | 4,474 | 76,543 | ||||||
Total (1) | $ | 286,384 | $ | 67,371 | $ | 353,755 | |||
Client Type | |||||||||
Commercial | $ | 24,541 | $ | 5,323 | $ | 29,864 | |||
Government | 65,249 | 61,899 | 127,148 | ||||||
Utilities (2) | 196,594 | 149 | 196,743 | ||||||
Total (1) | $ | 286,384 | $ | 67,371 | $ | 353,755 | |||
Geography (3) | |||||||||
Domestic | $ | 286,384 | $ | 67,371 | $ | 353,755 | |||
| (1) | Amounts may not add to the totals due to rounding. |
| (2) | Includes the portion of revenue related to small business programs paid by the end user/customer. |
| (3) | Revenue from our foreign operations were not material for fiscal years 2023, 2022 and 2021. |
40
Fiscal Year 2023 Compared to Fiscal Year 2022
Contract revenue. Consolidated contract revenue increased $81.0 million, or 18.9%, in fiscal year 2023 compared to fiscal year 2022, primarily due to incremental revenues in both our Energy segment and in our Engineering and Consulting segment.
Contract revenue in our Energy segment increased $69.6 million, or 19.4%, in fiscal year 2023 compared to fiscal year 2022, primarily as a result of higher demand across the full spectrum of our energy services including increases in software licensing revenue. Contract revenue in our Engineering and Consulting segment increased $11.4 million, or 16.0%, in fiscal year 2023 compared to fiscal year 2022, primarily due to increased demand for services provided to our clients.
Direct costs of contract revenue. Direct costs of consolidated contract revenue increased $44.8 million, or 15.7%, in fiscal year 2023 compared to fiscal year 2022, primarily as a result of the increase, and change of mix, in contract revenues as described above. As a percentage of contract revenue, direct salaries and wages decreased to 17.6% in fiscal year 2023, from 19.3% in the fiscal 2022, while subcontractor services and other direct costs was relatively flat for the fiscal year 2023 compared to fiscal year 2022.
Direct costs of contract revenue in our Energy segment increased $39.4 million, or 15.6%, in fiscal year 2023 compared to fiscal year 2022. Direct costs of contract revenue for the Engineering and Consulting segment increased $5.4 million, or 16.0%, for the fiscal year 2023 compared to fiscal year 2022.
Subcontractor services and other direct costs increased $37.8 million, or 18.7%, and salaries and wages increased by $7.0 million, or 8.4%, in fiscal year 2023 compared to fiscal year 2022, primarily as a result of the increases in contract revenue.
Gross Profit. Gross profit increased 25.2% to $179.8 million, or a 35.2% gross margin, for fiscal year 2023 compared to $143.6 million, or a 33.5% gross margin for fiscal year 2022. The increase in gross margin was primarily driven by higher software licensing revenue and changes in the mix of revenues as described above combined with the absence of project startup costs for new utility programs that were incurred during fiscal year 2022 but did not recur in the in fiscal year 2023.
General and administrative expenses. General and administrative (“G&A”) expenses increased by $7.1 million, or 4.7%, in fiscal year 2023 compared to fiscal year 2022. The increase in G&A expenses consisted of an increase of $3.8 million in the Energy segment combined with an increase of $6.5 million in the Engineering and Consulting segment, partially offset by a decrease of $3.2 million in unallocated corporate expenses.
Within G&A expenses, the increase of $13.8 million in salaries and wages, payroll taxes and employee benefits was partially offset by a decrease of $3.1 million in stock-based compensation, a decrease of $2.9 million in other general and administrative expenses, and a decrease of $1.1 million in depreciation and amortization. The increase in salaries and wages, payroll taxes and employee benefits was primarily due to an increase in incentive compensation, consistent with the improvement in operating profit, increased costs related to employee benefits, and increases in employee compensation as a result of additional employee headcount as well as employee compensation increases. The decrease in stock-based compensation expenses was primarily related to previously awarded stock grants reaching the end of their corresponding vesting periods, partially offset by new equity awards being issued at lower stock prices. The decrease in other general and administrative expenses was primarily due to contingent consideration expense related to prior acquisitions that occurred during fiscal year 2022 that did not recur in fiscal year 2023. The decrease in depreciation and amortization was primarily related to lower amortization of intangible assets from prior acquisitions.
Income (loss) from operations. Operating income was $22.1 million for fiscal year 2023, compared to an operating loss of $7.1 million for fiscal year 2022, as a result of the factors noted above.
Total other expense, net. Total other expense, net, increased $3.1 million, or 70.5%, in fiscal year 2023 compared to fiscal year 2022. The increase in total other expense, net is primarily due to higher interest expense as a
41
result of the increase in market interest rates which directly affected our variable interest rates under our credit facilities, combined with a one-time charge of $0.5 million for unamortized debt issuance costs related to our prior credit facilities, partially offset by interest income related to bank deposits.
Income tax expense (benefit). We recorded an income tax expense of $3.7 million for fiscal year 2023 compared to a tax benefit of $3.0 million for fiscal year 2022. The tax expense is primarily attributable to the income before income tax combined with the non-recurrence of a one-time tax benefit recognized during fiscal year 2022 related to additional energy efficiency building deductions.
Net income (loss). Our net income was $10.9 million for fiscal year 2023, as compared to a net loss of $8.4 million for fiscal year 2022. The increase in net income was primarily attributable to the increase in revenue and gross profit, partially offset by higher interest expense and income tax expense.
Fiscal Year 2022 Compared to Fiscal Year 2021
Contract revenue. Consolidated contract revenue increased $75.4 million, or 21.3%, in fiscal year 2022 compared to fiscal year 2021, primarily due to incremental revenues in our Energy segment generated from new governmental construction-management and design-build projects, combined with incremental revenues from the resumption of projects that had been suspended in fiscal year 2021 due to the Covid-19 pandemic, and increased governmental revenues in our Engineering and Consulting segment, partially offset by lower software licensing revenue.
Contract revenue in our Energy segment increased $71.1 million, or 24.8%, in fiscal year 2022 compared to fiscal year 2021, primarily as a result of incremental revenues from new governmental construction-management and design-build projects, combined with incremental revenues from the resumption of projects that had been suspended in fiscal year 2021 due to the Covid-19 pandemic, partially offset by lower software licensing revenue.
Contract revenue in our Engineering and Consulting segment increased $4.3 million, or 6.4%, in fiscal year 2022 compared to fiscal year 2021, primarily due to increased demand for services provided to our governmental clients.
Direct costs of contract revenue. Direct costs of consolidated contract revenue increased $67.7 million, or 31.1%, in fiscal year 2022 compared to fiscal year 2021, primarily due to increases in our contract revenues in our Energy segment as described above as well as the ramping up of new projects for which we saw higher project startup costs relative to the revenue recognized.
Direct costs of contract revenue in our Energy segment increased $67.3 million, or 36.5%, in fiscal year 2022 compared to fiscal year 2021, primarily as a result of the reasons described above. Direct costs of contract revenue for the Engineering and Consulting segment increased $0.4 million, or 1.2%, for the fiscal year 2022 compared to fiscal year 2021.
Subcontractor services and other direct costs increased by $50.4 million, or 33.1%, and salaries and wages increased by $17.3 million, or 26.4%, in fiscal year 2022 compared to fiscal year 2021, primarily due to the increases in contract revenues as described above combined with changes in the mix of those contract revenues to those which contain a higher percentage of material costs and installation subcontracting and lower percentage of labor costs, as well as the ramping up of new projects for which we saw higher project startup costs relative to the revenue recognized.
Gross Profit. Gross profit increased 5.7% to $143.6 million, or a 33.5% gross margin, for fiscal year 2022 compared to $135.9 million, or a 38.4% gross margin for fiscal year 2021. The decrease in gross margin percentage was primarily driven by changes in the mix of revenues as described above, combined with a reduction in software licensing revenues and the ramping up of new projects for which we saw higher project startup costs relative to the revenue recognized.
General and administrative expenses. General and administrative (“G&A”) expenses increased by $6.1 million, or 4.2%, in fiscal year 2022 compared to fiscal year 2021. The increase in G&A expenses consisted of an increase of $9.2 million in the Energy segment combined with an increase of $2.3 million in the Engineering and Consulting
42
segment, partially offset by a decrease of $5.4 million in unallocated corporate expenses. The increase in G&A expenses was primarily attributed to higher salaries and wages, payroll taxes and employee benefits, increased contingent consideration expense related to prior acquisitions, and higher computer-related expenses, partially offset by lower stock-based compensation expenses.
Within G&A expenses, the increase of $8.0 million in salaries and wages, payroll taxes and employee benefits combined with the increase of $6.5 million in other general and administrative expenses was partially offset by a decrease of $8.2 million in stock-based compensation and a decrease of $0.6 million in facilities and facility related expenses. The increase in salaries and wages, payroll taxes and employee benefits was primarily due to increases in personnel. The increase in other general and administrative expenses was primarily due to increased contingent consideration expense related to prior acquisitions, higher computer-related expenses and higher professional service fees. The decrease in stock-based compensation expenses was primarily related to previously awarded stock grants reaching the end of their corresponding vesting periods. The decrease in facilities and facility related expenses was due to satisfied facility leases that were not renewed. Depreciation and amortization was relatively flat for the fiscal year 2022 compared to fiscal year 2021.
Income (loss) from operations. Operating loss was $7.1 million for fiscal year 2022, compared to an operating loss of $8.7 million for fiscal year 2021, as a result of the factors noted above. As a percentage of contract revenue, the operating loss improved to 1.6% for fiscal year 2022 from an operating loss of 2.5% for fiscal year 2021.
Total other expense, net. Total other expense, net, was $4.4 million for fiscal year 2022 compared to $3.7 million for fiscal year 2021. The increase in total other expense, net is primarily due to higher interest expense as a result of higher variable interest rates under our credit facilities, partially offset by income from indemnification agreements.
Income tax expense (benefit). We recorded an income tax benefit of $3.0 million for fiscal year 2022 compared to a tax benefit of $4.0 million for fiscal year 2021. The decrease in the income tax benefit is primarily attributable to the lower loss before income tax expense, the non-recurrence tax benefits provided by the Coronavirus Aid, Relief, and Economic Security Act of 2020 (“CARES Act”), and various tax deductions and tax credits.
Net income (loss). Our net loss was relatively flat for fiscal year 2022, compared to fiscal year 2021, as a result of the factors described above.
Liquidity and Capital Resources
Fiscal Year | |||||||||
2023 | 2022 | 2021 | |||||||
(in thousands) | |||||||||
Net cash provided by (used in): | |||||||||
Operating activities | $ | 39,214 | $ | 9,433 | $ | 9,804 | |||
Investing activities | (11,457) | (9,527) | (8,454) | ||||||
Financing activities | (23,845) | 8,358 | (18,534) | ||||||
Net increase (decrease) in cash and cash equivalents | $ | 3,912 | $ | 8,264 | $ | (17,184) | |||
Sources of Cash
Our primary sources of liquidity for the next 12 months and beyond are cash generated from operations, cash and cash equivalents, and available borrowings under our revolving credit facility under the Credit Agreement (the “Revolving Credit Facility”). We believe that our cash and cash equivalents, cash generated by operating activities, and available borrowings under our Revolving Credit Facility will be sufficient to finance our operating activities for at least the next 12 months.
As described in Part II, Item 8, Note 5, “Debt Obligations,” of the Notes to Consolidated Financial Statements included in this Annual Report on Form 10-K, on September 29, 2023, we and certain of our subsidiaries entered into the Credit Agreement with a syndicate of financial institutions as lenders and BMO, as administrative agent. As of
43
December 29, 2023, we had a fully drawn $100 million term loan with $98.1 million outstanding (the “Term Loan”), and a $50.0 million Revolving Credit Facility with no borrowed amounts and $4.1 million in letters of credit issued, each scheduled to mature on September 29, 2026. In addition, as of December 29, 2023, we had $23.4 million of unrestricted cash and cash equivalents.
As of December 29, 2023, we were in compliance with the covenants contained in the Credit Agreement and borrowings under our Credit Facilities, exclusive of the effects of upfront fees, undrawn fees and issuance cost amortization, bore interest at an annual rate of 8.5%. See Part II, Item 8, Note 5, “Debt Obligations”, of the Notes to Consolidated Financial Statements included in this Annual Report on Form 10-K, for information regarding our indebtedness, including information about new borrowings and repayments, principal repayment terms, interest rates, covenants, and other key terms of our outstanding indebtedness.
Cash Flows from Operating Activities
Cash flows provided by operating activities were $39.2 million, $9.4 million, and $9.8 million for fiscal years 2023, 2022, and 2021, respectively. Cash flows from operating activities primarily consists of net income, adjusted for non-cash charges, such as depreciation and amortization and stock-based compensation, plus or minus changes in current operating assets and liabilities. Cash flows provided by operating activities for fiscal year 2023 resulted primarily from the increase in earnings, combined with lower working capital requirements. Cash flows provided by operating activities for fiscal year 2022 were unfavorably impacted by higher working capital requirements required to support the increase in contract revenues. Cash flows provided by operating activities for fiscal year 2021 resulted primarily from the changing mix of revenues, partially offset by increased demand for working capital related to the resumption of our utility programs that were suspended in 2020 and start-up costs associated with certain new contract awards.
Cash Flows from Investing Activities
Cash flows used in investing activities were $11.5 million, $9.5 million, and $8.5 million for fiscal years 2023, 2022, and 2021, respectively. Cash flows used in investing activities for fiscal years 2023, 2022, and 2021 were primarily due to cash paid for the development of software and the purchase of computers and other equipment.
Cash Flows from Financing Activities
Cash flows used in financing activities were $23.8 million for fiscal year 2023 compared to cash flows provided by financing activities of $8.4 million for fiscal year 2022 and cash flows used in financing activities of $18.5 million in fiscal year 2021. Cash flows used in financing activities for fiscal year 2023 were primarily attributable to the disbursement of $10.7 million in restricted cash for utility rebate incentives, payments of $4.0 million for contingent consideration related to prior acquisitions, combined with repayments and borrowings of $112.9 million and $105.0 million, respectively, under our term loan facility and line of credit, which resulted primarily from refinancing our Prior Credit Facility. Cash flows provided by financing activities for fiscal year 2022 were primarily attributable to borrowings of $20.0 million under our Delayed Draw Term Loan, $10.7 million in receipt of restricted cash, $3.0 million in proceeds from sales of common stock under our employee stock purchase plan, and $1.7 million proceeds from notes payable, partially offset by repayments of $13.0 million under our Term A Loan, combined with payments of $10.2 million for contingent consideration related to prior acquisitions, $1.9 million payments on notes payable, and $1.1 million principal payments on finance leases. Cash flows used in financing activities for fiscal year 2021 were primarily attributable to principal repayments of $13.0 million under our Term A Loan and Revolving Credit Facility, increases of $6.6 million for contingent consideration related to prior acquisitions, payments of taxes on stock grants of $3.1 million, payments on notes payable of $1.9 million, partially offset by $2.7 million in proceeds from sales of common stock under our employee stock purchase plan and $1.9 million in proceeds from stock option exercise.
Under certain utility contracts, we periodically receive cash deposits to be held in trust for the payment of energy incentive rebates to be sent directly to the utility’s end-customer on behalf of the utility. We act solely as the utility’s agent to distribute these funds to the end-customer and, accordingly, we classify these contractually restricted funds as restricted cash. Because these funds are held in trust for pass through to the utility’s customers and have no impact on our working capital or operating cash flows, these cash receipts are presented in the consolidated statement of
44
cash flows as financing cash inflows, “Receipt of restricted cash”, with the subsequent payments classified as financing cash outflows, “Payment of restricted cash”.
Off-Balance Sheet Arrangements
We do not have any off-balance sheet financing arrangements or liabilities. In addition, our policy is not to enter into futures or forward contracts. Finally, we do not have any majority-owned subsidiaries or any interests in, or relationships with, any special-purpose entities that are not included in the consolidated financial statements. We have, however, an administrative services agreement with Genesys in which we provide Genesys with ongoing administrative, operational and other non-professional support services. We manage Genesys and have the power to direct the activities that most significantly impact Genesys’ performance, in addition to being obligated to absorb expected losses from Genesys. Accordingly, we are the primary beneficiary of Genesys and consolidate Genesys as a variable interest entity.
Short and Long-term Uses of Cash
General
Our principal uses of cash are to fund operating expenses, support working capital requirements, finance capital expenditures, and pay down outstanding debt. From time to time, we also use cash to help fund business acquisitions. Our cash and cash equivalents are impacted by the timing of when we are paid by our customers for services rendered and when we pay expenses as reflected in the change in our outstanding accounts payable and accrued expenses.
Contractual Obligations
The following table sets forth our known contractual obligations as of December 29, 2023:
|
| Less than |
|
|
| More than |
| |||||||||
Contractual Obligations | Total | 1 Year | 1 - 3 Years | 3 - 5 Years | 5 Years |
| ||||||||||
(in thousands) | ||||||||||||||||
Debt (1) | $ | 97,431 | $ | 8,452 | $ | 88,979 | $ | — | $ | — | ||||||
Interest payments on debt outstanding (2) | 19,946 | 7,976 | 11,970 | — | — | |||||||||||
Operating leases |
| 14,295 |
| 4,537 |
| 7,189 |
| 2,465 |
| 104 | ||||||
Finance leases |
| 2,370 |
| 1,186 |
| 1,074 |
| 110 |
| — | ||||||
Total contractual cash obligations | $ | 134,042 | $ | 22,151 | $ | 109,212 | $ | 2,575 | $ | 104 | ||||||
| (1) | Debt includes $98.1million outstanding on our Term Loan, net of issuance costs, and no borrowed amounts outstanding on our Revolving Credit Facility as of December 29, 2023. We have assumed no future borrowings or repayments (other than at maturity) for purposes of this table. Our Term Loan is scheduled to mature on September 29, 2026. |
| (2) | Borrowings under our Term Loan and Revolving Credit Facility bear interest at a variable rate. Future interest payments on our Credit Facility are estimated using floating rates in effect as of December 29, 2023. |
As of December 29, 2023, we did not have any remaining contingent consideration payable related to any prior acquisitions. In addition, as of December 29, 2023, we did not have any arrangements involving the potential incurrence of future contingent consideration.
Outstanding Indebtedness
See Part II, Item 8, Note 5, “Debt Obligations”, of the Notes to Consolidated Financial Statements included in this Annual Report on Form 10-K for information regarding our indebtedness, including information about new borrowings and repayments, principal repayment terms, interest rates, covenants, and other key terms of our outstanding indebtedness.
45
Insurance Premiums
We have also financed, from time to time, insurance premiums by entering into unsecured notes payable with insurance companies. See part II, Item 8, Note 5, “Debt Obligations”, of the Notes to Consolidated Financial Statements included in this Annual Report on Form 10-K for information regarding our financing arrangements related to our insurance premiums.
Interest Rate Swap
From time to time, we enter into interest rate swap agreements to moderate our exposure to fluctuations in interest rates underlying our variable rate debt. For more information, see Part I, Item 7A, “Quantitative and Qualitative Disclosures About Market Risk”, and Note 4, “Derivatives”, to the Notes of Consolidated Financial Statements included in this Annual Report on Form 10-K.
Impact of Inflation
Due to the average duration of our projects and our ability to negotiate prices as contracts end and new contracts begin, historically, our operations have not been materially impacted by inflation. While immaterial to our results of operations and financial condition, we have experienced higher cost of materials and delays in our supply chain for equipment. The prices of finished products from manufacturers are subject to fluctuation and increases. It is difficult to accurately measure the impact of inflation, tariffs, price escalation, raw material costs, and other factors that impact the cost of finished goods due to the imprecise nature of the estimates required.
We are often able to mitigate the impact of future price increases by entering into fixed price purchase orders for materials and equipment, and subcontracts on our projects, as well as, when appropriate, including cost escalation factors into our proposals. Despite our best mitigation efforts, significant price increases in equipment and disruptions to our supply chain could materially impact our results of operations and financial condition. In addition, inflationary pressures, including expectations of future inflation, may impact the customers of our utility clients, which may lead to delayed or deferred decisions regarding expenditures to improve energy efficiency, and therefore potentially impact our future revenues.
Components of Revenue and Expense
Contract Revenue
We generally provide our services under contracts, purchase orders or retainer letters. The agreements we enter into with our clients typically incorporate one of three principal types of pricing provisions: time-and-materials, unit-based, and fixed price. Revenue on our time-and-materials and unit-based contracts are recognized as the work is performed in accordance with specific terms of the contract. As of December 29, 2023, 19% of our contracts are time-and-materials contracts, 42% are unit-based contracts, and 39% are fixed price contracts, compared to 20% for time-and-materials contracts, 45% for unit-based contracts, and 35% for fixed price contracts, as of December 30, 2022.
Some of these contracts include maximum contract prices, but contract maximums are often adjusted to reflect the level of effort to achieve client objectives and thus the majority of these contracts are not expected to exceed the maximum. Contract revenue on our fixed price contracts is determined on the percentage of completion method based generally on the ratio of direct costs incurred to date to estimated total direct costs at completion. Many of our fixed price contracts involve a high degree of subcontracted fixed price effort and are relatively short in duration, thereby lowering the risks of not properly estimating the percent complete.
Adjustments to contract cost estimates are made in the periods in which the facts requiring such revisions become known. When the revised estimate indicates a loss, such loss is recognized in the current period in its entirety. Claims and change orders that have not been finalized are evaluated to determine whether or not a change has occurred in the enforceable rights and obligations of the original contract. If these non-finalized changes qualify as a contract modification, a determination is made whether to account for the change in contract value as a modification to the
46
existing contract, or a separate contract and revenue under the claims or change orders is recognized accordingly. Costs related to un-priced change orders are expensed when incurred, and recognition of the related revenue is based on the assessment above of whether or not a contract modification has occurred. Estimated profit for un-priced change orders is recognized only if collection is probable.
Our contracts come up for renewal periodically and at the time of renewal may be subject to renegotiation, which could impact the profitability on that contract. In addition, during the term of a contract, public agencies may request additional or revised services which may impact the economics of the transaction. Most of our contracts permit our clients, with prior notice, to terminate the contracts at any time without cause. While we have a large volume of contracts, the renewal, termination or modification of a contract, in particular contracts with Consolidated Edison, the Dormitory Authority-State of New York, the New York City Housing Authority, and utility programs associated with Los Angeles Department of Water and Power, and Duke Energy Corp., may have a material effect on our consolidated operations.
Some of our contracts include certain performance guarantees, such as a guaranteed energy saving quantity. Such guarantees are generally measured upon completion of a project. In the event that the measured performance level is less than the guaranteed level, any resulting financial penalty, including any additional work that may be required to fulfill the guarantee, is estimated and charged to direct expenses in the current period. We have not experienced any significant costs under such guarantees.
Direct Costs of Contract Revenue
Direct costs of contract revenue consist primarily of that portion of salaries and wages that have been incurred in connection with revenue producing projects. Direct costs of contract revenue also include material costs, subcontractor services, equipment and other expenses that are incurred in connection with revenue producing projects. Direct costs of contract revenue exclude that portion of salaries and wages related to marketing efforts, vacations, holidays and other time not spent directly generating revenue under existing contracts. Such costs are included in general and administrative expenses. Additionally, payroll taxes, bonuses and employee benefit costs for all of our personnel are included in general and administrative expenses since no allocation of these costs is made to direct costs of contract revenue.
Other companies may classify as direct costs of contract revenue some of the costs that we classify as general and administrative costs. We expense direct costs of contract revenue when incurred.
General and Administrative Expenses
G&A expenses include the costs of the marketing and support staff, other marketing expenses, management and administrative personnel costs, payroll taxes, bonuses and employee benefits for all of our employees and the portion of salaries and wages not allocated to direct costs of contract revenue for those employees who provide our services. G&A expenses also include facility costs, depreciation and amortization, professional services, legal and accounting fees and administrative operating costs. Within G&A expenses, “Other” includes expenses such as professional services, legal and accounting, computer costs, travel and entertainment, marketing costs and acquisition costs. We expense general and administrative costs when incurred.
47
Critical Accounting Policies
This discussion and analysis of financial condition and results of operations is based upon our consolidated financial statements, which have been prepared in accordance with generally accepted accounting principles in the U.S. (“GAAP”). To prepare these financial statements in conformity with GAAP, we must make estimates and assumptions that affect the reported amounts of assets and liabilities at the date of the financial statements and the reported amount of revenue and expenses in the reporting period. Our actual results may differ from these estimates. We have provided a summary of our significant accounting policies in Part II, Item 8, Note 1, “Organization and Operations of the Company”, of the Notes to Consolidated Financial Statements included in this Annual Report on Form 10-K. We describe below those accounting policies that require material subjective or complex judgments and that have the most significant impact on our financial condition and results of operations. Our management evaluates these estimates on an ongoing basis, based upon information currently available and on various assumptions management believes are reasonable as of the date of this report.
Contract Assets and Liabilities
Billing practices are governed by the contract terms of each project based upon costs incurred, achievement of milestones or pre-agreed schedules. Billings in any given fiscal period do not necessarily correlate with revenue recognized for that period. Contract assets include unbilled amounts typically resulting from revenue under contracts where the percentage-of-completion method of revenue recognition is utilized and revenue recognized exceeds the amount billed to the customer and right to repayment is not unconditional. Contract assets also include retainage amounts withheld from billings to our clients pursuant to provisions in our contracts and other revenues earned but not billed in the current period. Contract liabilities consist of advance payments and billings in excess of revenue recognized and deferred revenue.
Contract Accounting
We enter into contracts with our clients that contain various types of pricing provisions, including fixed price, time-and-materials, and unit-based provisions. We recognize revenues in accordance with ASU 2014-09, Revenue from Contracts with Customer, codified as ASC Topic 606 and the related amendments (collectively, “ASC 606”). As such, we identify a contract with a customer, identify the performance obligations in the contract, determine the transaction price, allocate the transaction price to each performance obligation in the contract and recognize revenue when (or as) we satisfy a performance obligation.
The following table reflects our two reportable segments and the types of contracts that each most commonly enters into for revenue generating activities.
Segment | Contract Type | Revenue Recognition Method |
Time-and-materials | Time-and-materials | |
Energy | Unit-based | Unit-based |
Software license | Unit-based | |
Fixed price | Percentage-of-completion | |
Time-and-materials | Time-and-materials | |
Engineering and Consulting | Unit-based | Unit-based |
Fixed price | Percentage-of-completion |
Revenue on the vast majority of our contracts will continue to be recognized over time because of the continuous transfer of control to the customer. Revenue on fixed price contracts is recognized on the percentage-of-completion method based generally on the ratio of direct costs incurred-to-date to estimated total direct costs at completion. We use the percentage-of-completion method to better match the level of work performed at a certain point in time in relation to our effort that will be required to complete a project. In addition, the percentage-of-completion method is a common method of revenue recognition in our industry.
48
Many of our fixed price contracts involve a high degree of subcontracted fixed price effort and are relatively short in duration, thereby lowering the risks of not properly estimating the percent complete. Revenue on time-and-materials and unit-based contracts is recognized as the work is performed in accordance with the specific rates and terms of the contract. We recognize revenues for time-and-materials contracts based upon the actual hours incurred during a reporting period at contractually agreed upon rates per hour and also includes in revenue all reimbursable costs incurred during a reporting period. Certain of our time-and-materials contracts are subject to maximum contract values and, accordingly, when revenue is expected to exceed the maximum contract value, these contracts are generally recognized under the percentage-of-completion method, consistent with fixed price contracts. For unit-based contracts, we recognize the contract price of units of a basic production product as revenue when the production product is delivered during a period. Revenue for amounts that have been billed but not earned is deferred, and such deferred revenue is referred to as contract liabilities in the accompanying consolidated balance sheets. We also derive revenue from software licenses and professional services and maintenance fees. In accordance with ASC 606, we perform an assessment of each contract to identify the performance obligations, determine the overall transaction price for the contract, allocate the transaction price to the performance obligations, and recognize the revenue when the performance obligations are satisfied. We utilize the residual approach by which we estimate the standalone selling price by reference to the total transaction price less the sum of the observable standalone selling prices of other goods or services promised in the contract. The software license revenue is typically recognized at a point in time when control is transferred to the client, which is defined as the point in time when the client can use and benefit from the license. The software license is delivered before related services are provided and is functional without services, updates, or technical support. Related professional services include training and support services in which the standalone selling price is determined based on an input measure of hours incurred to total estimated hours and is recognized over time, usually which is the life of the contract.
To determine the proper revenue recognition method for contracts, we evaluate whether two or more contracts should be combined and accounted for as one single contract and whether the combined contract should be accounted for as one performance obligation. With respect to our contracts, it is rare that multiple contracts should be combined into a single performance obligation. This evaluation requires significant judgment and the decision to combine a group of contracts or separate a single contract into multiple performance obligations could change the amount of revenue and profit recorded in a given period. Contracts are considered to have a single performance obligation if the promise to transfer the individual goods or services is not separately identifiable from other promises in the contracts, which is mainly because we provide a significant service of integrating a complex set of tasks and components into a single project or capability.
We may enter into contracts that include separate phases or elements. If each phase or element is negotiated separately based on the technical resources required and/or the supply and demand for the services being provided, we evaluate if the contracts should be segmented. If certain criteria are met, the contracts would be segmented which could result in revenues being assigned to the different elements or phases with different rates of profitability based on the relative value of each element or phase to the estimated total contract revenue. Segmented contracts may comprise up to approximately 2.0% to 3.0% of our consolidated contract revenue.
Contracts that cover multiple phases or elements of the project or service lifecycle (development, design, construction and maintenance and support) may be considered to have multiple performance obligations even when they are part of a single contract. For contracts with multiple performance obligations, we allocate the transaction price to each performance obligation using the best estimate of the standalone selling price of each distinct good or service in the contract. For the periods presented, the value of the separate performance obligations under contracts with multiple performance obligations (generally measurement and verification tasks under certain energy performance contracts) were not material. In cases where we do not provide the distinct good or service on a standalone basis, the primary method used to estimate standalone selling price is the expected cost plus a margin approach, under which we forecast our expected costs of satisfying a performance obligation and then adds an appropriate margin for the distinct good or service.
We provide quality of workmanship warranties to customers that are included in the sale and are not priced or sold separately or do not provide customers with a service in addition to assurance of compliance with agreed-upon specifications and industry standards. We do not consider these types of warranties to be separate performance obligations.
49
In some cases, we have a master service or blanket agreement with a customer under which each task order releases us to perform specific portions of the overall scope in the service contract. Each task order is typically accounted for as a separate contract because the task order establishes the enforceable rights and obligations, and payment terms.
Under ASC 606, variable consideration should be considered when determining the transaction price and estimates should be made for the variable consideration component of the transaction price, as well as assessing whether an estimate of variable consideration is constrained. For certain of our contracts, variable consideration can arise from modifications to the scope of services resulting from unapproved change orders or customer claims. Variable consideration is included in the transaction price to the extent it is probable that a significant reversal of cumulative revenue recognized will not occur when the uncertainty associated with the variable consideration is resolved. Our estimates of variable consideration and determination of whether to include estimated amounts in the transaction price are based largely on assessments of legal enforceability, our performance, and all information (historical, current and forecasted) that is reasonably available to us.
Due to the nature of the work required to be performed on many of our performance obligations, the estimation of total revenue and cost at completion is complex, subject to many variables and requires significant judgment. As a significant change in one or more of these estimates could affect the profitability of our contracts, we review and update our contract-related estimates regularly through a company-wide disciplined project review process in which management reviews the progress and execution of our performance obligations and the estimate at completion (“EAC”). As part of this process, management reviews information including, but not limited to, any outstanding key contract matters, progress towards completion and the related program schedule and the related changes in estimates of revenues and costs. Management must make assumptions and estimates regarding labor productivity and availability, the complexity of the work to be performed, the cost and availability of materials, the performance of subcontractors, and the availability and timing of funding from the customer, among other variables.
We recognize adjustments in estimated profit on contracts under the cumulative catch-up method. Under this method, the impact of the adjustment on profit recorded to date is recognized in the period the adjustment is identified. Revenue and profit in future periods of contract performance is recognized using the adjusted estimate. If at any time the estimate of contract profitability indicates an anticipated loss on the contract, we recognize the total loss in the period it is identified.
Contracts are often modified to account for changes in contract specifications and requirements. We consider contract modifications to exist when the modification either creates new rights or obligations or changes the existing enforceable rights or obligations. Most of our contract modifications are for goods or services that are not distinct from existing contracts due to the significant integration provided in the context of the contract and are accounted for as if they were part of the original contract. The effect of a contract modification that is not distinct from the existing contract on the transaction price and our measure of progress for the performance obligation to which it relates is recognized as an adjustment to revenue (either as an increase in or a reduction of revenue) on a cumulative catch-up basis.
For contract modifications that result in the promise to deliver goods or services that are distinct from the existing contract and the increase in price of the contract is for the same amount as the standalone selling price of the additional goods or services included in the modification, we account for such contract modifications as a separate contract.
We include claims to vendors, subcontractors and others as a receivable and a reduction in recognized costs when enforceability of the claim is established by the contract and the amounts are reasonably estimable and probable of being recovered. The amounts are recorded up to the extent of the lesser of the amounts management expects to recover or to costs incurred.
Billing practices are governed by the contract terms of each project based upon costs incurred, achievement of milestones or pre-agreed schedules. Billings do not necessarily correlate with revenue recognized using the percentage-of-completion method of revenue recognition.
50
Accounts receivable are carried at original invoice amount less an estimate made for doubtful accounts based upon our review of all outstanding amounts on a quarterly basis. Management determines allowances for doubtful accounts through specific identification of amounts considered to be uncollectible and potential write-offs, plus a non-specific allowance for other amounts for which some potential loss has been determined to be probable based on current and past experience. Historical credit losses have been minimal with governmental entities and large public utilities, but disputes may arise related to these receivable amounts. Accounts receivable are written off when deemed uncollectible. Recoveries of accounts receivable previously written off are recorded when received.
For further information on the types of contracts under which we perform our services, see Part II, Item 8, Note 1, “Organization and Operations of the Company”, of the Notes to consolidated financial statements included in this Annual Report on Form 10-K.
Goodwill
We test our goodwill at least annually for possible impairment. We complete our annual testing of goodwill as of the last day of the first month of our fourth fiscal quarter each year to determine whether there is impairment. In addition to our annual test, we regularly evaluate whether events and circumstances have occurred that may indicate a potential impairment of goodwill. We did not recognize any goodwill impairment charges in fiscal years 2023, 2022, or 2021.
We test our goodwill for impairment at the level of our reporting units, which are components of our operating segments. In January 2017, the Financial Accounting Standards Board (the “FASB”) issued Accounting Standards Update (“ASU”) Update No. 2017-04 (“ASU 2017-04”), Intangibles—Goodwill and Other (Topic 350): Testing Goodwill for Impairment. This accounting guidance eliminates the requirement to compare the implied fair value of reporting unit goodwill with the carrying amount of that goodwill (commonly referred to as Step 2) from the goodwill impairment test. The new standard does not change how a goodwill impairment is identified. We will continue to perform our quantitative and qualitative goodwill impairment test by comparing the fair value of each reporting unit to its carrying amount, but if we are required to recognize a goodwill impairment charge, under the new standard the amount of the charge will be calculated by subtracting the reporting unit’s fair value from its carrying amount. Under the prior standard, if we were required to recognize a goodwill impairment charge, Step 2 required us to calculate the implied value of goodwill by assigning the fair value of a reporting unit to all of its assets and liabilities as if that reporting unit had been acquired in a business combination and the amount of the charge was calculated by subtracting the reporting unit’s implied fair value of goodwill from its actual goodwill balance.
To estimate the fair value of our reporting units, we use both an income approach based on management’s estimates of future cash flows and other market data and a market approach based upon multiples of earnings before interest, taxes, depreciation and amortization, or EBITDA, earned by similar public companies. Once the fair value is determined, we then compare the fair value of the reporting unit to its carrying value, including goodwill. If the fair value of the reporting unit is determined to be less than the carrying value, we perform an additional assessment to determine the extent of the impairment based on the implied fair value of goodwill compared with the carrying amount of the goodwill. In the event that the current implied fair value of the goodwill is less than the carrying value, an impairment charge is recognized.
Inherent in such fair value determinations are significant judgments and estimates, including but not limited to assumptions about our future revenue, profitability and cash flows, our operational plans and our interpretation of current economic indicators and market valuations. To the extent these assumptions are incorrect or economic conditions that would impact the future operations of our reporting units change, any goodwill may be deemed to be impaired, and an impairment charge could have in a material impact on our financial position or results of operation. Almost all of our goodwill is contained in our Energy segment, with the remainder in our Engineering and Consulting segment. At our measurement date, the estimated fair value of our Energy segment exceeded its carrying value. Any reduction in the estimated fair value of our Energy segment could result in an impairment charge of goodwill associated with this segment in future periods.
51
Business Combinations
The acquisition method of accounting for business combinations requires us to use significant estimates and assumptions, including fair value estimates, as of the business combination date. For reporting periods prior to the completion of our procedures to value assets and liabilities, the acquisition method requires us to refine those estimates as necessary during the measurement period (defined as the period, not to exceed one year, in which we may adjust the provisional amounts recognized for a business combination) based upon new information about facts that existed on the business combination date.
Under the acquisition method of accounting, we recognize separately from goodwill the identifiable assets acquired, the liabilities assumed, and any non-controlling interests in an acquiree, at the acquisition date fair value. We measure goodwill as of the acquisition date as the excess of consideration transferred over the net of the acquisition date amounts of the identifiable assets acquired and liabilities assumed. Costs that we incur to complete the business combination such as investment banking, legal and other professional fees are not considered part of consideration. We charge these acquisition costs to other general and administrative expense as they are incurred.
Should the initial accounting for a business combination be incomplete by the end of a reporting period that falls within the measurement period, we report provisional amounts in our financial statements. During the measurement period, we adjust the provisional amounts recognized at the acquisition date to reflect new information obtained about facts and circumstances that existed as of the acquisition date that, if known, would have affected the measurement of the amounts recognized as of that date and we record those adjustments to our financial statements. We recognize adjustments to provisional amounts that are identified during the measurement period in the reporting period in which the adjustment amounts are determined, including the effect on earnings of changes in depreciation, amortization or other income effects, if any, as a result of the change to the provisional amounts, calculated as if the accounting had been completed at the acquisition date.
During fiscal years 2023, 2022 and 2021, we did not have any material acquisitions.
Income Taxes
Income taxes are accounted for under the asset and liability method. Deferred tax assets and liabilities are recognized for the future tax consequences of temporary differences between the financial reporting basis and tax basis of our assets and liabilities, subject to a judgmental assessment of the recoverability of deferred tax assets. Deferred tax assets and liabilities are measured using enacted tax rates expected to apply to taxable income in the years in which those temporary differences are expected to be recovered or settled. The effect on deferred tax assets and liabilities of a change in tax rates is recognized in income in the period that includes the enactment date. A valuation allowance is recorded when it is more-likely-than-not that some of the deferred tax assets may not be realized. Significant judgment is applied when assessing the need for valuation allowances and includes the evaluation of historical income (loss) adjusted for the effects of non-recurring items and the impact of recent business combinations. Areas of estimation include our consideration of future taxable income which is driven by verifiable signed contracts and ongoing prudent and feasible tax planning strategies. Should a change in circumstances lead to a change in judgment about the utilization of deferred tax assets in future years, we would adjust the related valuation allowances in the period that the change in circumstances occurs, along with a corresponding increase or charge to income.
For acquired business entities, if we identify changes to acquired deferred tax asset valuation allowances or liabilities related to uncertain tax positions during the measurement period and they relate to new information obtained about facts and circumstances that existed as of the acquisition date, those changes are considered a measurement period adjustment and we record the offset to goodwill. We record all other changes to deferred tax asset valuation allowances and liabilities related to uncertain tax positions in current period income tax expense.
We recognize the tax benefit from uncertain tax positions if it is more-likely-than-not that the tax positions will be sustained on examination by the tax authorities, based on the technical merits of the position. The tax benefit is measured based on the largest benefit that has a greater than 50% likelihood of being realized upon ultimate settlement. We recognize interest and penalties related to unrecognized tax benefits in income tax expense.
52
For further discussion of our income taxes, see Part II, Item 8, Note 11, “Income Taxes” of the Notes to Consolidated Financial Statements included in this Annual Report on Form 10-K.
Recent Accounting Standards
For a description of recently issued and adopted accounting pronouncements, including adoption dates and expected effects on our results of operations and financial condition, see Part II, Item 8, Note 2, “Recent Accounting Pronouncements”, of the Notes to Consolidated Financial Statements included in this Annual Report on Form 10-K.
53
ITEM 7A. QUANTITATIVE AND QUALITATIVE DISCLOSURES ABOUT MARKET RISK
Interest Rate Risk
Market risk is the risk of loss to future earnings, to fair values or to future cash flows that may result from changes in the price of a financial instrument. The value of a financial instrument may change as a result of changes in interest rates, exchange rates, commodity prices, equity prices and other market changes. Market risk is attributed to all market risk sensitive financial instruments, including long-term debt.
As of December 29, 2023, we had cash and cash equivalents of $23.4 million. This amount represents cash on hand in business checking accounts with BMO Bank, N.A. We do not engage in trading activities and do not participate in foreign currency transactions.
We are subject to interest rate risk in connection with our Term Loan and borrowings, if any, under our Revolving Credit Facility, each of which bears interest at variable rates. As of December 29, 2023, $98.1 million was outstanding under our Term Loan, and we had no borrowed amounts outstanding and $4.1 million in letters of credit were issued under our Revolving Credit Facility. Each of our Term Loan and Revolving Credit Facility mature on September 29, 2026 and are governed by our Credit Agreement.
Pursuant to the Credit Agreement, (as described in Part II, Item 8, Note 5, “Debt Obligations,” of the Notes to Consolidated Financial Statements included in this Annual Report on Form 10-K), borrowings under the Credit Agreement bear interest at either a Base Rate (as defined in the Credit Agreement) or the adjusted Secured Overnight Financing Rate (“SOFR”), at the Company’s option, and in each case, plus an applicable margin, which applicable margin ranges from 0.75% to 2.00% with respect to Base Rate borrowings and 1.75% to 3.00% with respect to SOFR borrowings, depending on the Company’s Total Net Leverage Ratio (as defined in the Credit Agreement); provided, that SOFR and the Base Rate cannot be less than 0.00%, with the specific pricing reset on each date on which the Administrative Agent receives the required financial statements under the Credit Agreement for the fiscal quarter then ended. The Company must also pay a commitment fee for the unused portion of the Revolving Credit Facility, which ranges from 0.20% to 0.40% per annum depending on the Company’s Total Net Leverage Ratio, and fees on the face amount of any letters of credit outstanding under the Revolving Credit Facility, which range from 1.3125% to 2.25% per annum, in each case, depending on the Company’s Total Net Leverage Ratio, as well as customary fronting fees payable to BMO as letter of credit issuer. Based upon the amount of our outstanding indebtedness as of December 29, 2023, a one percentage point increase in the effective interest rate would change our annual interest expense by approximately $1.0 million in fiscal year 2023.
The Term Loan will amortize quarterly in an amount equal to (i) 7.5% per annum for the first year ending after the Closing Date and (ii) 10.0% per annum for the second and third years ending after the Closing Date, with a final payment of all then remaining principal and interest due on the maturity date of September 29, 2026. The amounts outstanding under the Credit Facilities may be prepaid in whole or in part at any time without penalty (other than customary breakage costs).
On November 30, 2023, we entered into an interest rate swap agreement for $50.0 million notional amount. The interest swap agreement was designated as a cash flow hedge to fix the variable interest rate on a portion of the outstanding principal amount under our Term Loan. The interest rate swap fixed rate is 4.77% and expires on September 29, 2026.
54
ITEM 8. FINANCIAL STATEMENTS AND SUPPLEMENTARY DATA
Index to Consolidated Financial Statements
Page | |
Report of Independent Registered Public Accounting Firm (PCAOB ID | 56 |
Consolidated Balance Sheets as of December 29, 2023 and December 30, 2022 | 59 |
60 | |
61 | |
62 | |
63 |
55
Report of Independent Registered Public Accounting Firm
Stockholders and the Board of Directors of Willdan Group, Inc.
Anaheim, California
Opinions on the Financial Statements and Internal Control over Financial Reporting
We have audited the accompanying consolidated balance sheets of Willdan Group, Inc. (the "Company") as of December 29, 2023 and December 30, 2022, the related consolidated statements of comprehensive income (loss), stockholders’ equity, and cash flows for each of the years in the three-year period ended December 29, 2023, and the related notes (collectively referred to as the "financial statements"). We also have audited the Company’s internal control over financial reporting as of December 29, 2023, based on criteria established in Internal Control – Integrated Framework: (2013) issued by the Committee of Sponsoring Organizations of the Treadway Commission (COSO).
In our opinion, the financial statements referred to above present fairly, in all material respects, the financial position of the Company as of December 29, 2023 and December 30, 2022, and the results of its operations and its cash flows for each of the years in the three-year period ended December 29, 2023 in conformity with accounting principles generally accepted in the United States of America. Also in our opinion, the Company maintained, in all material respects, effective internal control over financial reporting as of December 29, 2023, based on criteria established in Internal Control – Integrated Framework: (2013) issued by COSO.
Basis for Opinions
The Company’s management is responsible for these financial statements, for maintaining effective internal control over financial reporting, and for its assessment of the effectiveness of internal control over financial reporting, included in the accompanying Management’s Report on Internal Controls Over Financial Reporting. Our responsibility is to express an opinion on the Company’s financial statements and an opinion on the Company’s internal control over financial reporting based on our audits. We are a public accounting firm registered with the Public Company Accounting Oversight Board (United States) ("PCAOB") and are required to be independent with respect to the Company in accordance with the U.S. federal securities laws and the applicable rules and regulations of the Securities and Exchange Commission and the PCAOB.
We conducted our audits in accordance with the standards of the PCAOB. Those standards require that we plan and perform the audits to obtain reasonable assurance about whether the financial statements are free of material misstatement, whether due to error or fraud, and whether effective internal control over financial reporting was maintained in all material respects.
Our audits of the financial statements included performing procedures to assess the risks of material misstatement of the financial statements, whether due to error or fraud, and performing procedures that respond to those risks. Such procedures included examining, on a test basis, evidence regarding the amounts and disclosures in the financial statements. Our audits also included evaluating the accounting principles used and significant estimates made by management, as well as evaluating the overall presentation of the financial statements. Our audit of internal control over financial reporting included obtaining an understanding of internal control over financial reporting, assessing the risk that a material weakness exists, and testing and evaluating the design and operating effectiveness of internal control based on the assessed risk. Our audits also included performing such other procedures as we considered necessary in the circumstances. We believe that our audits provide a reasonable basis for our opinions.
Definition and Limitations of Internal Control Over Financial Reporting
A company’s internal control over financial reporting is a process designed to provide reasonable assurance regarding the reliability of financial reporting and the preparation of financial statements for external purposes in accordance with generally accepted accounting principles. A company’s internal control over financial reporting includes those policies and procedures that (1) pertain to the maintenance of records that, in reasonable detail, accurately and fairly reflect the transactions and dispositions of the assets of the company; (2) provide reasonable assurance that transactions are recorded as necessary to permit preparation of financial statements in accordance with generally accepted accounting principles,
56
and that receipts and expenditures of the company are being made only in accordance with authorizations of management and directors of the company; and (3) provide reasonable assurance regarding prevention or timely detection of unauthorized acquisition, use, or disposition of the company’s assets that could have a material effect on the financial statements.
Because of its inherent limitations, internal control over financial reporting may not prevent or detect misstatements. Also, projections of any evaluation of effectiveness to future periods are subject to the risk that controls may become inadequate because of changes in conditions, or that the degree of compliance with the policies or procedures may deteriorate.
Critical Audit Matters
The critical audit matters communicated below are matters arising from the current period audit of the consolidated financial statements that were communicated or required to be communicated to the audit committee and that: (1) relate to accounts or disclosures that are material to the consolidated financial statements and (2) involved our especially challenging, subjective, or complex judgments. The communication of critical audit matters does not alter in any way our opinion on the consolidated financial statements, taken as a whole, and we are not, by communicating the critical audit matters below, providing separate opinions on the critical audit matters or on the accounts or disclosures to which they relate.
Estimated costs to complete on fixed price contracts
As discussed in Note 1 to the consolidated financial statements, revenues from fixed price contracts are recognized over time since control of the services is transferred continuously to the client. Generally, revenue is recognized using costs incurred to date relative to total estimated costs at completion to measure progress toward satisfying the Company’s performance obligations.
We identified auditing management’s estimates of costs to complete on select fixed price contracts to be a critical audit matter. The critical audit matter relates to select long-term fixed price construction contracts, based on magnitude of estimated costs to complete and the stage of completion of the contract. These estimates require management to make assumptions about future events and, as a result, a high degree of auditor judgment is involved in auditing these estimates. Due to the factors above, auditing management’s estimates of costs to complete required extensive audit procedures.
Our audit procedures related to the evaluation of estimated costs at completion for fixed price contracts included the following:
| ● | Tested the design, implementation, and operating effectiveness of controls that are designed to address the reasonableness of estimates of costs to complete fixed price contracts. |
| ● | Evaluated the reasonableness of management’s estimates related to the cost to complete for fixed price contracts through testing of the key components of the estimated costs to complete, including, labor, materials, and subcontractor costs. |
| ● | Agreed a sample of contract costs incurred to supporting documentation. |
| ● | Performed inquiries of management and project personnel regarding facts and circumstances relevant to the accounting for a sample of such contracts. |
| ● | Recalculated revenue recognition based on the percentage of completion. |
| ● | Performed a retrospective review procedures to assess management’s historical ability to accurately estimate the transaction price and cost to complete of fixed price contracts. |
Estimated realization of deferred income tax assets for net operating losses
As described in Notes 1 and 11 to the consolidated financial statements, the Company’s consolidated net deferred tax assets includes the value of net operating losses that management expects to realize before the net operating losses expire. In assessing the need for a valuation allowance, management estimates future taxable income by jurisdiction. Significant estimates are required in estimating future taxable income, the reversal of income tax liabilities, leading to significant judgment from management.
57
The principal considerations for our determination that performing procedures relating to the income tax valuation allowances on deferred tax assets is a critical audit matter are there was significant judgment by management when estimating future taxable income and reversal of income tax liabilities. This in turn led to a high degree of auditor judgment, subjectivity and effort in performing procedures and in evaluating audit evidence relating to the realization of deferred income tax assets. In addition, the audit effort involved the use of professionals with specialized skill and knowledge to assist in performing these procedures and evaluating the audit evidence obtained.
Our audit procedures related to the evaluation of management's estimates over the realization of deferred income tax assets included the following:
| ● | Tested the design, implementation, and operating effectiveness of controls relating to the valuation allowances on deferred tax assets. |
| ● | Tested underlying historical data used in calculating the cumulative book income (loss) subject to tax. |
| ● | Assessed the reasonableness of management’s estimate of future book income, as adjusted for permanent income tax items, which included evaluating historical book income (loss) subject to tax, and the Company's sources of future taxable income, including verifiable signed contracts. |
| ● | Used professionals with specialized skill and knowledge to assist in evaluating management’s analysis, including cumulative book income (loss) subject to tax. |
/s/
We have served as the Company's auditor since 2018.
March 7, 2024
58
WILLDAN GROUP, INC. AND SUBSIDIARIES
CONSOLIDATED BALANCE SHEETS
(in thousands, except par value)
December 29, | December 30, | |||||
2023 |
| 2022 | ||||
Assets | ||||||
Current assets: | ||||||
Cash and cash equivalents | $ | | $ | | ||
Restricted cash | — | | ||||
Accounts receivable, net of allowance for doubtful accounts of $ |
| |
| | ||
Contract assets |
| |
| | ||
Other receivables |
| |
| | ||
Prepaid expenses and other current assets |
| |
| | ||
Total current assets |
| |
| | ||
Equipment and leasehold improvements, net |
| |
| | ||
Goodwill | | | ||||
Right-of-use assets | | | ||||
Other intangible assets, net | | | ||||
Other assets |
| |
| | ||
Deferred income taxes, net | | | ||||
Total assets | $ | | $ | | ||
Liabilities and Stockholders’ Equity | ||||||
Current liabilities: | ||||||
Accounts payable | $ | | $ | | ||
Accrued liabilities |
| |
| | ||
Contingent consideration payable | — | | ||||
Contract liabilities |
| |
| | ||
Notes payable |
| |
| | ||
Finance lease obligations |
| | | |||
Lease liability | | | ||||
Total current liabilities |
| |
| | ||
Notes payable | | | ||||
Finance lease obligations, less current portion |
| |
| | ||
Lease liability, less current portion | | | ||||
Other noncurrent liabilities | | | ||||
Total liabilities | | | ||||
Commitments and contingencies | ||||||
Stockholders’ equity: | ||||||
Preferred stock, $ |
|
| ||||
Common stock, $ |
| |
| | ||
Additional paid-in capital |
| |
| | ||
Accumulated other comprehensive loss | ( | — | ||||
Retained earnings |
| |
| | ||
Total stockholders’ equity |
| |
| | ||
Total liabilities and stockholders’ equity | $ | | $ | | ||
See accompanying notes to consolidated financial statements.
59
WILLDAN GROUP, INC. AND SUBSIDIARIES
CONSOLIDATED STATEMENTS OF COMPREHENSIVE INCOME (LOSS)
(in thousands, except per share amounts)
Fiscal Year | |||||||||
2023 |
| 2022 |
| 2021 | |||||
Contract revenue | $ | | $ | | $ | | |||
Direct costs of contract revenue (inclusive of directly related depreciation and amortization): | |||||||||
Salaries and wages |
| |
| |
| | |||
Subcontractor services and other direct costs |
| |
| |
| | |||
Total direct costs of contract revenue |
| |
| |
| | |||
Gross profit |
| |
| |
| | |||
General and administrative expenses: | |||||||||
Salaries and wages, payroll taxes and employee benefits |
| |
| |
| | |||
Facilities and facility related |
| |
| |
| | |||
Stock-based compensation |
| |
| |
| | |||
Depreciation and amortization |
| |
| |
| | |||
Other |
| |
| |
| | |||
Total general and administrative expenses |
| |
| |
| | |||
Income (Loss) from operations |
| |
| ( |
| ( | |||
Other income (expense): | |||||||||
Interest expense, net |
| ( |
| ( |
| ( | |||
Other, net |
| |
| |
| | |||
Total other expense, net |
| ( |
| ( |
| ( | |||
Income (Loss) before income taxes |
| |
| ( |
| ( | |||
Income tax (benefit) expense |
| |
| ( |
| ( | |||
Net income (loss) | | ( | ( | ||||||
Other comprehensive income (loss): | |||||||||
Unrealized gain (loss) on derivative contracts, net of tax | ( | | | ||||||
Comprehensive income (loss) | $ | | $ | ( | $ | ( | |||
Earnings (Loss) per share: | |||||||||
Basic | $ | | $ | ( | $ | ( | |||
Diluted | $ | | $ | ( | $ | ( | |||
Weighted-average shares outstanding: | |||||||||
Basic |
| |
| |
| | |||
Diluted |
| |
| |
| | |||
See accompanying notes to consolidated financial statements.
60
WILLDAN GROUP, INC. AND SUBSIDIARIES
CONSOLIDATED STATEMENTS OF STOCKHOLDERS’ EQUITY
(in thousands)
Accumulated | |||||||||||||||||
Additional | Other | ||||||||||||||||
Common Stock | Paid-in | Comprehensive | Retained | ||||||||||||||
| Shares |
| Amount |
| Capital |
| Income (Loss) |
| Earnings |
| Total | ||||||
Balance at January 1, 2021 |
| $ | $ | $ | ( | $ | $ | ||||||||||
Shares of common stock issued in connection with employee stock purchase plan |
| | | | — | — | | ||||||||||
Shares of common stock issued in connection with incentive stock plan | | | | — | — | | |||||||||||
Shares used to pay taxes on stock grants |
| ( | ( | ( | — | — | ( | ||||||||||
Issuance of restricted stock award and units | | | ( | — | — | ( | |||||||||||
Stock-based compensation expense |
| — | — | | — | — | | ||||||||||
Net income (loss) |
| — | — | — | — | ( | ( | ||||||||||
Net unrealized gain (loss) on derivative contracts | — | — | — | | — | | |||||||||||
Balance at December 31, 2021 |
| $ | $ | $ | ( | $ | $ | ||||||||||
Shares of common stock issued in connection with employee stock purchase plan |
| | | | — | — | | ||||||||||
Shares of common stock issued in connection with incentive stock plan | | — | | — | — | | |||||||||||
Shares used to pay taxes on stock grants |
| ( | — | ( | — | — | ( | ||||||||||
Issuance of restricted stock award and units | | | ( | — | — | — | |||||||||||
Stock-based compensation expense |
| — | — | | — | — | | ||||||||||
Net income (loss) |
| — | — | — | — | ( | ( | ||||||||||
Net unrealized gain (loss) on derivative contracts | — | — | — | | — | | |||||||||||
Balance at December 30, 2022 |
| $ | $ | $ | ( | $ | $ | ||||||||||
Shares of common stock issued in connection with employee stock purchase plan |
| | | | — | — | | ||||||||||
Shares of common stock issued in connection with incentive stock plan | | — | | — | — | | |||||||||||
Shares used to pay taxes on stock grants |
| ( | — | ( | — | — | ( | ||||||||||
Issuance of restricted stock award and units | | | ( | — | — | — | |||||||||||
Stock-based compensation expense |
| — | — | | — | — | | ||||||||||
Net income (loss) |
| — | — | — | — | | | ||||||||||
Net unrealized gain (loss) on derivative contracts | — | — | — | ( | — | ( | |||||||||||
Balance at December 29, 2023 |
| $ | $ | $ | ( | $ | $ | ||||||||||
See accompanying notes to consolidated financial statements.
61
WILLDAN GROUP, INC. AND SUBSIDIARIES
CONSOLIDATED STATEMENTS OF CASH FLOWS
(in thousands)
Fiscal Year | ||||||||||
| 2023 |
| 2022 |
| 2021 |
| ||||
Cash flows from operating activities: | ||||||||||
Net income (loss) | $ | | $ | ( | $ | ( | ||||
Adjustments to reconcile net income to net cash provided by (used in) operating activities: | ||||||||||
Depreciation and amortization |
| |
| | | |||||
Deferred income taxes, net |
| |
| ( | ( | |||||
(Gain) loss on sale/disposal of equipment |
| ( |
| ( | ( | |||||
Provision for doubtful accounts |
| |
| | | |||||
Stock-based compensation |
| |
| | | |||||
Accretion and fair value adjustments of contingent consideration | — | | | |||||||
Changes in operating assets and liabilities, net of effects from business acquisitions: | ||||||||||
Accounts receivable |
| ( |
| | ( | |||||
Contract assets |
| ( |
| ( | | |||||
Other receivables |
| |
| | | |||||
Prepaid expenses and other current assets |
| |
| ( | | |||||
Other assets |
| |
| | ( | |||||
Accounts payable |
| |
| ( | ( | |||||
Accrued liabilities |
| |
| | | |||||
Contract liabilities |
| |
| ( | | |||||
Right-of-use assets |
| |
| ( | ( | |||||
Net cash provided by operating activities |
| |
| |
| | ||||
Cash flows from investing activities: | ||||||||||
Purchase of equipment and leasehold improvements |
| ( |
| ( | ( | |||||
Proceeds from sale of equipment | | | | |||||||
Cash paid for acquisitions, net of cash acquired | ( | — | — | |||||||
Net cash used in investing activities |
| ( |
| ( |
| ( | ||||
Cash flows from financing activities: | ||||||||||
Payments on contingent consideration |
| ( |
| ( | ( | |||||
Receipt of restricted cash | — | | — | |||||||
Payment on restricted cash | ( | — | — | |||||||
Payments on notes payable | ( | ( | ( | |||||||
Payments on debt issuance costs | ( | ( | — | |||||||
Proceeds from notes payable |
| — |
| | | |||||
Borrowings under term loan facility and line of credit | | | — | |||||||
Repayments under term loan facility and line of credit | ( | ( | ( | |||||||
Principal payments on finance leases |
| ( |
| ( | ( | |||||
Proceeds from stock option exercise |
| |
| | | |||||
Proceeds from sales of common stock under employee stock purchase plan |
| |
| | | |||||
Cash used to pay taxes on stock grants | ( | ( | ( | |||||||
Restricted Stock Award and Units | — | — | ( | |||||||
Net cash provided by (used in) financing activities |
| ( |
| |
| ( | ||||
Net increase (decrease) in cash, cash equivalents and restricted cash |
| |
| |
| ( | ||||
Cash, cash equivalents and restricted cash at beginning of period |
| |
| |
| | ||||
Cash, cash equivalents and restricted cash at end of period | $ | | $ | | $ | | ||||
Supplemental disclosures of cash flow information: | ||||||||||
Cash paid (received) during the period for: | ||||||||||
Interest | $ | | $ | | $ | | ||||
Income taxes |
| ( |
| ( |
| ( | ||||
Supplemental disclosures of noncash investing and financing activities: | ||||||||||
Equipment acquired under finance leases | | | | |||||||
See accompanying notes to consolidated financial statements.
62
1. ORGANIZATION AND OPERATIONS OF THE COMPANY
Willdan Group, Inc. (“Willdan” or the “Company”) is a provider of professional, technical and consulting services to utilities, private industry, and public agencies at all levels of government. As resources and infrastructures undergo continuous change, the Company helps organizations and their communities evolve and thrive by providing a wide range of technical services for energy solutions and government infrastructure. Through engineering, program management, policy advisory, and software and data management, the Company designs and delivers trusted, comprehensive, innovative, and proven solutions to improve efficiency, resiliency, and sustainability in energy and infrastructure.
Basis of Presentation
The Company has prepared its Consolidated Financial Statements in accordance with accounting principles generally accepted in the United States (“U.S. GAAP”).
The consolidated statement of stockholders' equity includes repurchases of shares of the Company’s common stock from employees to satisfy tax withholding obligations incurred in connection with the vesting of restricted stock or performance stock units, which amount is presented as a reduction of additional paid-in capital and common stock.
Fiscal Years
The Company operates and reports its annual financial results based on
Principles of Consolidation
The consolidated financial statements include the accounts of Willdan Group, Inc. and its wholly-owned subsidiaries and their respective subsidiaries. All significant intercompany balances and transactions have been eliminated in consolidation.
Reclassifications
Certain prior year amounts have been reclassified in the consolidated financial statements to conform to the current year presentation.
Use of Estimates
The preparation of consolidated financial statements in conformity with generally accepted accounting principles in the U.S. requires management to make estimates and assumptions that affect the reported amounts of assets and liabilities and disclosure of contingent assets and liabilities at the date of the consolidated financial statements. Estimates also affect the reported amounts of revenue and expenses during the reporting period. Actual results could differ from those estimates.
Cash and Cash Equivalents
All highly liquid investments purchased with a remaining maturity of three months or less are considered to be cash equivalents. The Company from time to time may be exposed to credit risk with its bank deposits in excess of the FDIC insurance limits and with uninsured money market investments. The Company has not experienced any losses in such accounts and believes it is not exposed to any significant credit risk on cash and cash equivalents.
63
Restricted Cash
The Company, from time to time, has restricted cash that represents amounts not readily available for current operations due to contractual restrictions which designate these restricted cash balances for specific purposes.
Fair Value of Financial Instruments
The Company uses the three-tier hierarchy of fair value measurement, which prioritizes the inputs. These tiers include: Level 1 (the highest priority), defined as observable inputs, such as quoted prices in active markets, Level 2, defined as inputs other than quoted prices in active markets that are either directly or indirectly observable; and Level 3 (the lowest priority), defined as unobservable inputs in which little or no market data exists, therefore requiring an entity to develop its own assumptions.
The Company’s financial instruments consist primarily of cash, cash equivalents, accounts receivable, contract assets, other receivables, prepaid expenses and other current assets, accounts payable, accrued liabilities and contract liabilities. The carrying amounts of certain other assets and contingent consideration are discounted to their present value because the time between the origination of these instruments and their expected realization or payment is greater than one year.
As of December 29, 2023 and December 30, 2022, the carrying amounts of the Company's cash and cash equivalents, accounts receivable, contract assets, other receivables, prepaid expenses and other current assets, accounts payable, accrued liabilities and contract liabilities, approximate their fair values because of the relatively short period of time between the origination of these instruments and their expected realization or payment. The carrying amounts of debt obligations approximate their fair values since the terms are comparable to terms currently offered by local lending institutions for loans of similar terms to companies with comparable credit risk.
The carrying amounts of the derivative financial instrument is valued based on Level 2 inputs.
Variable Interest Entities
The Company accounts for variable interest entities in accordance with Accounting Standards Codification (“ASC”) 810, Consolidation. Under ASC 810, a variable interest entity (“VIE”) is created when any of the following criteria are present: (a) the equity investment at risk in the entity is not sufficient to permit the entity to finance its activities without additional subordinated financial support provided by other parties, including the equity holders; (b) the entity’s equity holders as a group either (i) lack the direct or indirect ability to make decisions about the entity, (ii) are not obligated to absorb expected losses of the entity or (iii) do not have the right to receive expected residual returns of the entity; or (c) the entity’s equity holders have voting rights that are not proportionate to their economic interests, and the activities of the entity involve or are conducted on behalf of the equity holder with disproportionately few voting rights. If an entity is deemed to be a VIE pursuant to ASC 810, the enterprise that has both (i) the power to direct the activities of a VIE that most significantly impact the entity’s economic performance and (ii) the obligation to absorb the expected losses of the entity or right to receive benefits from the entity that could be potentially significant to the VIE is considered the primary beneficiary and must consolidate the VIE. In accordance with ASC 810, the Company performs ongoing reassessments of whether an enterprise is the primary beneficiary of a VIE.
As of December 29, 2023, the Company had
64
Management also concluded there is no noncontrolling interest related to the consolidation of Genesys because management determined that (i) the shareholder of Genesys does not have more than a nominal amount of equity investment at risk, (ii) WES absorbs the expected losses of Genesys through its deferral of Genesys’s service fees owed to WES and the Company has, since entering into the administrative services agreement, had to continuously defer service fees for Genesys, and (iii) the Company believes Genesys will continue to have a shortfall on payment of its service fees for the foreseeable future, leaving no expected residual returns for the shareholder. For more information regarding Genesys, see Note 8 “Commitments and Variable Interest Entities.”
Segment Information
The Company presents segment information externally consistent with the manner in which the Company’s chief operating decision maker reviews information to assess performance and allocate resources. The Company’s
Willdan Group, Inc. (“WGI”) is a holding company and performs administrative functions on behalf of its subsidiaries, such as treasury, legal, accounting, information systems, human resources and certain business development activities, and earns revenue that is only incidental to the activities of the enterprise. As a result, WGI does not meet the definition of an operating segment.
Contract Assets and Liabilities
Billing practices are governed by the contract terms of each project based upon costs incurred, achievement of milestones or pre-agreed schedules. Billings do not necessarily correlate with revenue recognized using the percentage-of-completion method of revenue recognition. Contract assets include unbilled amounts typically resulting from revenue under contracts where the percentage-of-completion method of revenue recognition is utilized and revenue recognized exceeds the amount billed to the customer. In addition, contract assets include retainage amounts withheld from billings to the Company’s clients pursuant to provisions in our contracts. Contract liabilities consist of advance payments and billings in excess of revenue recognized and deferred revenue.
Contract Accounting
The Company enters into contracts with its clients that contain various types of pricing provisions, including fixed price, time-and-materials, and unit-based provisions. The Company recognizes revenues in accordance with ASU 2014-09, Revenue from Contracts with Customer, codified as ASC Topic 606 and the related amendments (collectively “ASC 606”). As such, the Company identifies a contract with a customer, identifies the performance obligations in the contract, determines the transaction price, allocates the transaction price to each performance obligation in the contract and recognizes revenues when (or as) the Company satisfies a performance obligation.
The following table reflects the Company’s
Segment | Contract Type | Revenue Recognition Method |
Time-and-materials | Time-and-materials | |
Energy | Unit-based | Unit-based |
Software license | Unit-based | |
Fixed price | Percentage-of-completion | |
Time-and-materials | Time-and-materials | |
Engineering and Consulting | Unit-based | Unit-based |
Fixed price | Percentage-of-completion |
Revenue on the vast majority of the Company’s contracts is recognized over time because of the continuous transfer of control to the customer. Revenue on fixed price contracts is recognized on the percentage-of-completion
65
method based generally on the ratio of direct costs incurred-to-date to estimated total direct costs at completion. The Company uses the percentage-of-completion method to better match the level of work performed at a certain point in time in relation to the effort that will be required to complete a project. In addition, the percentage-of-completion method is a common method of revenue recognition in the Company’s industry.
Many of the Company’s fixed price contracts involve a high degree of subcontracted fixed price effort and are relatively short in duration, thereby lowering the risks of not properly estimating the percent complete. Revenue on time-and-materials and unit-based contracts is recognized as the work is performed in accordance with the specific rates and terms of the contract. The Company recognizes revenues for time-and-materials contracts based upon the actual hours incurred during a reporting period at contractually agreed upon rates per hour and also includes in revenue all reimbursable costs incurred during a reporting period. Certain of the Company’s time-and-materials contracts are subject to maximum contract values and, accordingly, when revenue is expected to exceed the maximum contract value, these contracts are generally recognized under the percentage-of-completion method, consistent with fixed price contracts. For unit-based contracts, the Company recognizes the contract price of units of a basic production product as revenue when the production product is delivered during a period. Revenue for amounts that have been billed but not earned is deferred, and such deferred revenue is referred to as contract liabilities in the accompanying consolidated balance sheets. The Company also derives revenue from software licenses and professional services and maintenance fees. In accordance with ASC 606, the Company performs an assessment of each contract to identify the performance obligations, determine the overall transaction price for the contract, allocate the transaction price to the performance obligations, and recognize the revenue when the performance obligations are satisfied. The Company utilizes the residual approach by which it estimates the standalone selling price by reference to the total transaction price less the sum of the observable standalone selling prices of other goods or services promised in the contract. The software license revenue is typically recognized at a point in time when control is transferred to the client, which is defined as the point in time when the client can use and benefit from the license. The software license is delivered before related services are provided and is functional without services, updates, or technical support. Related professional services include training and support services in which the standalone selling price is determined based on an input measure of hours incurred to total estimated hours and is recognized over time, usually which is the life of the contract.
To determine the proper revenue recognition method for contracts, the Company evaluates whether two or more contracts should be combined and accounted for as one single contract and whether the combined contract should be accounted for as one performance obligation. With respect to the Company’s contracts, it is rare that multiple contracts should be combined into a single performance obligation. This evaluation requires significant judgment and the decision to combine a group of contracts or separate a single contract into multiple performance obligations could change the amount of revenue and profit recorded in a given period. Contracts are considered to have a single performance obligation if the promise to transfer the individual goods or services is not separately identifiable from other promises in the contracts, which is mainly because the Company provides a significant service of integrating a complex set of tasks and components into a single project or capability.
The Company may enter into contracts that include separate phases or elements. If each phase or element is negotiated separately based on the technical resources required and/or the supply and demand for the services being provided, the Company evaluates if the contracts should be segmented. If certain criteria are met, the contracts would be segmented which could result in revenues being assigned to the different elements or phases with different rates of profitability based on the relative value of each element or phase to the estimated total contract revenue. Segmented contracts may comprise up to approximately
Contracts that cover multiple phases or elements of the project or service lifecycle (development, construction and maintenance and support) may be considered to have multiple performance obligations even when they are part of a single contract. For contracts with multiple performance obligations, the Company allocates the transaction price to each performance obligation using the best estimate of the standalone selling price of each distinct good or service in the contract. For the periods presented, the value of the separate performance obligations under contracts with multiple performance obligations (generally measurement and verification tasks under certain energy performance contracts) were not material. In cases where the Company does not provide the distinct good or service on a standalone basis, the primary method used to estimate standalone selling price is the expected cost plus a margin approach, under which the
66
Company forecasts the Company’s expected costs of satisfying a performance obligation and then adds an appropriate margin for the distinct good or service.
The Company provides quality of workmanship warranties to customers that are included in the sale and are not priced or sold separately or do not provide customers with a service in addition to assurance of compliance with agreed-upon specifications and industry standards. The Company does not consider these types of warranties to be separate performance obligations.
In some cases, the Company has a master service or blanket agreement with a customer under which each task order releases the Company to perform specific portions of the overall scope in the service contract. Each task order is typically accounted for as a separate contract because the task order establishes the enforceable rights and obligations, and payment terms.
Under ASC 606, variable consideration should be considered when determining the transaction price and estimates should be made for the variable consideration component of the transaction price, as well as assessing whether an estimate of variable consideration is constrained. For certain of the Company’s contracts, variable consideration can arise from modifications to the scope of services resulting from unapproved change orders or customer claims. Variable consideration is included in the transaction price to the extent it is probable that a significant reversal of cumulative revenue recognized will not occur when the uncertainty associated with the variable consideration is resolved. The Company estimates of variable consideration and determination of whether to include estimated amounts in the transaction price are based largely on assessments of legal enforceability, the Company’s performance, and all information (historical, current and forecasted) that is reasonably available to the Company.
Due to the nature of the work required to be performed on many of the Company’s performance obligations, the estimation of total revenue and cost at completion is complex, subject to many variables and requires significant judgment. As a significant change in one or more of these estimates could affect the profitability of the Company’s contracts, the Company reviews and updates the Company’s contract-related estimates regularly through a company-wide disciplined project review process in which management reviews the progress and execution of the Company’s performance obligations and the estimate at completion (“EAC”). As part of this process, management reviews information including, but not limited to, any outstanding key contract matters, progress towards completion and the related program schedule and the related changes in estimates of revenues and costs. Management must make assumptions and estimates regarding labor productivity and availability, the complexity of the work to be performed, the cost and availability of materials, the performance of subcontractors, and the availability and timing of funding from the customer, among other variables.
The Company recognizes adjustments in estimated profit on contracts under the cumulative catch-up method. Under this method, the impact of the adjustment on profit recorded to date is recognized in the period the adjustment is identified. Revenue and profit in future periods of contract performance is recognized using the adjusted estimate. If at any time the estimate of contract profitability indicates an anticipated loss on the contract, the Company recognizes the full amount of estimated loss in the period it is identified.
Contracts are often modified to account for changes in contract specifications and requirements. The Company considers contract modifications to exist when the modification either creates new rights or obligations or changes the existing enforceable rights or obligations. Most of the Company’s contract modifications are for goods or services that are not distinct from existing contracts due to the significant integration provided in the context of the contract and are accounted for as if they were part of the original contract. The effect of a contract modification that is not distinct from the existing contract on the transaction price and the Company’s measure of progress for the performance obligation to which it relates is recognized as an adjustment to revenue (either as an increase in or a reduction of revenue) on a cumulative catch-up basis.
For contract modifications that result in the promise to deliver goods or services that are distinct from the existing contract and the increase in price of the contract is for the same amount as the standalone selling price of the
67
additional goods or services included in the modification, the Company accounts for such contract modifications as a separate contract.
The Company includes claims to vendors, subcontractors and others as a receivable and a reduction in recognized costs when enforceability of the claim is established by the contract and the amounts are reasonably estimable and probable of being recovered. The amounts are recorded up to the extent of the lesser of the amounts management expects to recover or to costs incurred.
Billing practices are governed by the contract terms of each project based upon costs incurred, achievement of milestones or pre-agreed schedules. Billings do not necessarily correlate with revenue recognized using the percentage-of-completion method of revenue recognition.
Direct costs of contract revenue consist primarily of that portion of technical and nontechnical salaries and wages that has been incurred in connection with revenue producing projects. Direct costs of contract revenue also include production expenses, subcontractor services and other expenses that are incurred in connection with revenue producing projects.
Direct costs of contract revenue exclude that portion of technical and nontechnical salaries and wages related to marketing efforts, vacations, holidays and other time not spent directly generating revenue under existing contracts. Such costs are included in general and administrative expenses. Additionally, payroll taxes, bonuses and employee benefit costs for all Company personnel are included in general and administrative expenses in the accompanying consolidated statements of comprehensive income since no allocation of these costs is made to direct costs of contract revenue. No allocation of facilities costs is made to direct costs of contract revenue. Other companies may classify as direct costs of contract revenue some of the costs that the Company classifies as general and administrative costs. The Company expenses direct costs of contract revenue when incurred.
Included in revenue and costs are all reimbursable costs for which the Company has the risk or on which the fee was based at the time of bid or negotiation. No revenue or cost is recorded for costs in which the Company acts solely in the capacity of an agent and has no risks associated with such costs.
Accounts receivable are carried at original invoice amount less an estimate made for doubtful accounts based upon a review of all outstanding amounts on a quarterly basis. Management determines allowances for doubtful accounts through specific identification of amounts considered to be uncollectible and potential write-offs, plus a non-specific allowance for other amounts for which some potential loss has been determined to be probable based on current and past experience. The Company’s historical credit losses have been minimal with governmental entities and large public utilities, but disputes may arise related to these receivable amounts. Accounts receivable are written off when deemed uncollectible. Recoveries of accounts receivable previously written off are recorded when received.
Retainage, included in contract assets, represents amounts withheld from billings to the Company’s clients pursuant to provisions in the contracts and may not be paid to the Company until specific tasks are completed or the project is completed and, in some instances, for even longer periods. As of December 29, 2023 and December 30, 2022, contract assets included retainage of $
General and Administrative Expenses
General and administrative expenses include the costs of the marketing and support staff, other marketing expenses, management and administrative personnel costs, payroll taxes, bonuses and employee benefits for all of the Company’s employees and the portion of salaries and wages not allocated to direct costs of contract revenue for those employees who provide the Company’s services. General and administrative expenses also include facility costs, depreciation and amortization, professional services, legal and accounting fees and administrative operating costs. Within general and administrative expenses, “Other” includes expenses such as provision for billed or unbilled
68
receivables, professional services, legal and accounting, computer costs, travel and entertainment, marketing costs and acquisition costs. The Company expenses general and administrative costs when incurred.
Leases
In February 2016, the Financial Accounting Standards Board (“FASB”) issued Accounting Standards Update (“ASU”) No. 2016-02, Leases (Topic 842) (“ASU 2016-02”). ASU 2016-02 require, among other things, that lessees recognize the following for all leases (unless a policy election is made by class of underlying asset to exclude short-term leases) at the commencement date: (1) a lease liability, which is a lessee’s obligation to make lease payments arising from a lease, measured on a discounted basis; and (2) a right-of-use asset, which is an asset that represents the lessee’s right to use, or the direct use of, a specified asset for the lease term. The FASB issued ASU 2018-11 on July 30, 2018, which allows entities to apply the provisions of ASC 842 at the effective date without adjusting comparative periods.
Under this guidance, the net present value of future lease payments is recorded as right-of-use assets and lease liabilities. In addition, the Company elected the ‘package of practical expedients’ permitted under the transition guidance within the new standard, which among other things, allowed the Company to carry forward the historical lease classification. In addition, the Company elected not to utilize the hindsight practical expedient to determine the lease term for existing leases. The Company also elected the practical expedient to not separate lease and non-lease components for its facilities leases. Previously, all of the Company’s office leases were classified as operating leases and rent expense was included in facilities expense in the consolidated statements of comprehensive income.
In addition, the Company leases certain equipment under financing leases. The economic substance of the leases is a financing transaction for acquisition of equipment and leasehold improvements. Accordingly, the right-of-use assets for these leases are included in the balance sheets in equipment and leasehold improvements, net of accumulated depreciation, with a corresponding amount recorded in current portion of financing lease obligations or noncurrent portion of financing lease obligations, as appropriate. The financing lease assets are amortized over the life of the lease or, if shorter, the life of the leased asset, on a straight-line basis and included in depreciation expense in the statements of comprehensive income. The interest associated with financing lease obligations is included in interest expense in the statements of comprehensive income. For more information, see Note 7, “Leases”.
Equipment and Leasehold Improvements
Equipment and leasehold improvements are stated at cost less accumulated depreciation and amortization. Equipment under finance leases is stated at the present value of the minimum lease payments as of the acquisition date. Depreciation and amortization on equipment are calculated using the straight-line method over estimated useful lives of to
Following are the estimated useful lives used to calculate depreciation and amortization:
Category |
| Estimated Useful Life | |
Furniture and fixtures |
| years | |
Computer hardware |
| years | |
Computer software |
| years | |
Automobiles and trucks |
| years | |
Field equipment |
| years | |
69
Goodwill
Goodwill represents the excess of costs over fair value of the assets acquired. The Company completes its annual testing of goodwill as of the last day of the first month of its fourth fiscal quarter each year to determine whether there is impairment. Goodwill, which has an indefinite useful life, is not amortized, but instead tested for impairment at least annually or more frequently if events and circumstances indicate that the asset might be impaired. Impairment losses for reporting units are recognized to the extent that a reporting unit’s carrying amount exceeds its fair value.
Long-lived assets
Long-lived assets, such as equipment, leasehold improvements and purchased intangible assets subject to amortization are reviewed for impairment whenever events or changes in circumstances indicate that the carrying amount of an asset may not be recoverable. Recoverability of assets to be held and used is measured by a comparison of the carrying amount of an asset to estimated undiscounted future cash flows expected to be generated by the asset. If the carrying amount of an asset exceeds its estimated future cash flows, an impairment charge is recognized by the amount by which the carrying amount of the asset exceeds the fair value of the asset.
Accounting for Claims against the Company
The Company accrues an undiscounted liability related to claims against it for which the incurrence of a loss is probable and the amount can be reasonably estimated. The Company discloses the amount accrued and an estimate of any reasonably possible loss in excess of the amount accrued, if such disclosure is necessary for its financial statements not to be misleading. The Company does not accrue liabilities related to claims when the likelihood that a loss has been incurred is probable but the amount cannot be reasonably estimated, or when the liability is believed to be only reasonably possible or remote. Losses related to recorded claims are included in general and administrative expenses.
Determining probability and estimating claim amounts is highly judgmental. Initial accruals and any subsequent changes in the Company’s estimates could have a material effect on its consolidated financial statements.
Stock-based Compensation
The Company accounts for all stock-based compensation under the fair value recognition provisions of the accounting standard entitled “Compensation—Stock Compensation.” Stock-based compensation cost is measured at the grant date based on the fair value of the award and is recognized as expense over the requisite vesting period. The fair values of all stock options granted and the fair values of all Employee Stock Purchase Plan (“ESPP”) purchase rights are estimated using the Black-Scholes option-valuation model. The Black-Scholes option-valuation model requires the input of highly subjective assumptions. Performance-based restricted stock unit awards (“PBRSUs”) are granted to certain employees and vest only after the achievement of pre-determined performance metrics. Once the performance metrics are met, vesting of PBRSUs is subject to continued service by the employee. At the end of each reporting period, the Company evaluates the probability that PBRSUs will be earned. The Company records stock-based compensation expense based on the probability that the performance metrics will be achieved over the vesting period.
Business Combinations
The acquisition method of accounting for business combinations requires the Company to use significant estimates and assumptions, including fair value estimates, as of the business combination date and to refine those estimates as necessary during the measurement period (defined as the period, not to exceed one year, in which the Company may adjust the provisional amounts recognized for a business combination based upon new information about facts that existed on the business combination date).
Under the acquisition method of accounting, the Company recognizes separately from goodwill the identifiable assets acquired, the liabilities assumed, and any non-controlling interests in an acquiree, at the acquisition date fair value.
70
The Company measures goodwill as of the acquisition date as the excess of consideration transferred over the net of the acquisition date amounts of the identifiable assets acquired and liabilities assumed. Costs that the Company incurs to complete the business combination such as investment banking, legal and other professional fees are not considered part of consideration. The Company charges these acquisition costs to general and administrative expense as they are incurred.
During fiscal years 2023, 2022, and 2021, the Company did not have any material acquisitions.
Income Taxes
Income taxes are accounted for under the asset and liability method. Deferred tax assets and liabilities are recognized for the future tax consequences of temporary differences between the financial reporting basis and tax basis of the Company’s assets and liabilities, subject to a judgmental assessment of the recoverability of deferred tax assets. Deferred tax assets and liabilities are measured using enacted tax rates expected to apply to taxable income in the years in which those temporary differences are expected to be recovered or settled. The effect on deferred tax assets and liabilities of a change in tax rates is recognized in income in the period that includes the enactment date. A valuation allowance is recorded when it is more-likely-than-not that some of the deferred tax assets may not be realized. Significant judgment is applied when assessing the need for valuation allowances. Areas of estimation include the Company’s consideration of future taxable income and ongoing prudent and feasible tax planning strategies. Should a change in circumstances lead to a change in judgment about the utilization of deferred tax assets in future years, the Company would adjust the related valuation allowances in the period that the change in circumstances occurs, along with a corresponding increase or charge to income.
During each fiscal year, management assesses the available positive and negative evidence to estimate if sufficient future taxable income will be generated to utilize existing deferred tax assets. During fiscal year 2023 and fiscal year 2022, the Company had no change in its valuation allowance on its deferred tax assets. During fiscal year 2021, the Company determined that it was more-likely-than-not that a portion of the New Jersey net operating losses would not be utilized prior to expiration and, accordingly, recorded a valuation allowance of $
For acquired business entities, if the Company identifies changes to acquired deferred tax asset valuation allowances or liabilities related to uncertain tax positions during the measurement period and they relate to new information obtained about facts and circumstances that existed as of the acquisition date, those changes are considered a measurement period adjustment and the Company records the offset to goodwill. The Company records all other changes to deferred tax asset valuation allowances and liabilities related to uncertain tax positions in current period income tax expense.
The Company recognizes the tax benefit from uncertain tax positions if it is more likely than not that the tax positions will be sustained on examination by the tax authorities, based on the technical merits of the position. The tax benefit is measured based on the largest benefit that has a greater than 50% likelihood of being realized upon ultimate settlement. The Company recognizes interest and penalties related to unrecognized tax benefits in income tax expense. For further information, see Note 11, “Income Taxes”, of the Notes to consolidated financial statements included in this Annual Report on Form 10-K.
Earnings (loss) per Share
The Company computes basic income per common share using net income and the weighted average number of common shares outstanding during the period. Diluted income per common share is computed using net income and the weighted average number of common shares and potentially dilutive common shares outstanding during the period.
71
Potentially dilutive common shares include dilutive outstanding employee stock options, restricted stock awards (“RSA”), PBRSUs, and rights to purchase shares of common stock under the Company’s ESPP.
Other Comprehensive Income (loss), Net of Tax
Other comprehensive income (loss), net of tax refers to revenue, expenses, gains and losses that are recorded as an element of shareholders’ equity but are excluded from net income (loss). The Company’s other comprehensive income (loss), net of tax is comprised of unrealized gains or losses on its interest rate swap agreement designated as cash flow hedges.
Derivatives
From time to time, the Company uses certain interest rate derivatives contracts to hedge interest rate exposures on its variable rate debt. The Company recognizes derivative instruments as either assets or liabilities on its consolidated balance sheets at fair value. The Company records changes in the fair value (i.e., gains or losses) of the derivatives that have been designated as cash flow hedges in its consolidated balance sheets as accumulated other comprehensive income (loss) and in its consolidated statements of comprehensive (loss) income as a loss or gain on cash flow hedge valuation.
Operating Cycle
In accordance with industry practice, amounts realizable and payable under contracts that extend beyond one year are included in current assets (included in contract assets) and current liabilities.
72
2. RECENT ACCOUNTING PRONOUNCEMENTS
Accounting Pronouncements Recently Issued
In December 2023, the FASB issued ASU No. 2023-09, “Income Taxes (Topic 740): Improvements to Income Tax Disclosures” (“ASU 2023-09”). ASU 2023-09 amends the rules on income tax disclosures to require entities to disclose specific categories in the rate reconciliation, the income or loss from continuing operations before income tax expense or benefit (separated between domestic and foreign) and income tax expense or benefit from continuing operations (separated by federal, state, and foreign). In addition, ASU 2023-09 requires entities to disclose their income tax payments to international, federal, state, and local jurisdictions, among other changes. The amendments can be applied on a prospective basis although retrospective application is permitted. The amendments are effective for the fiscal years beginning after December 15, 2024, with early adoption permitted. The Company is currently evaluating the impact this update will have on its Consolidated Financial Statements.
In November 2023, the Financial Accounting Standards Board (“FASB”) issued Accounting Standards Update (“ASU”) No. 2023-07, “Segment Reporting (Topic 280): Improvements to Reportable Segment Disclosures” (“ASU 2023-07”). ASU 2023-07 expands segment disclosure requirements through enhanced disclosures related to significant segment expenses that are regularly provided to the chief operating decision maker (“CODM”), a description of other segment items by reportable segment, and any additional measures of a segment's profit or loss used by the CODM when deciding how to allocate resources. All disclosure requirements under ASU 2023-07 are also required for public entities with a single reportable segment. The amendments are effective for the fiscal years beginning after December 15, 2023, and interim periods within fiscal years beginning after December 15, 2024. The Company is currently evaluating the impact this update will have on its Consolidated Financial Statements.
In October 2023, the FASB issued ASU No. 2023-06, “Disclosure Improvements: Codification Amendments in Response to the SEC’s Disclosure Update and Simplification Initiative” (“ASU 2023-06”). ASU 2023-06 amends U.S. GAAP to reflect updates and simplifications to certain disclosure and presentation requirements referred to FASB by the Securities and Exchange Commission (“SEC”). The targeted amendments incorporate 14 of the 27 disclosures referred by the SEC into Codification. Each amendment in ASU 2023-06 is effective on either the date on which the SEC’s removal of the related disclosure requirement from Regulation S-X or Regulation S-K becomes effective, or on June 30, 2027, if the SEC has not removed the requirements by that date. No amendments were effective at December 29, 2023. The Company is currently evaluating the impact this update will have on its Consolidated Financial Statements.
73
3. SUPPLEMENTAL FINANCIAL STATEMENT DATA
Restricted Cash
The following table provides a reconciliation of cash and cash equivalents, and restricted cash reported within the consolidated balance sheets for fiscal years 2023, 2022 and 2021, to the total cash, cash equivalents, and restricted cash shown in the consolidated statements of cash flows for fiscal years 2023, 2022, and 2021:
December 29, | December 30, | January 1, | |||||||
| 2023 |
| 2022 |
| 2022 | ||||
(in thousands) | |||||||||
Cash and cash equivalents | $ | | $ | | $ | | |||
| — |
| |
| — | ||||
Total cash, cash equivalents, and restricted cash shown in the consolidated statement of cash flows | $ | | $ | | $ | | |||
Under certain utility contracts, the Company periodically receives cash deposits to be held in trust for the payment of energy incentive rebates to be sent directly to the utility’s end-customer on behalf of the utility. The Company acts solely as the utility’s agent to distribute these funds to the end-customer and, accordingly, the Company classifies these contractually restricted funds as restricted cash. Because these funds are held in trust for pass through to the utility’s customers and have no impact on the Company’s working capital or operating cash flows, these cash receipts are presented in the consolidated statement of cash flows as financing cash inflows, “Receipt of restricted cash”, with the subsequent payments classified as financing cash outflows, “Payment of restricted cash.”
Accounts Receivable
Accounts receivable consisted of the following:
December 29, | December 30, | |||||
| 2023 |
| 2022 | |||
(in thousands) | ||||||
Billed | $ | | $ | | ||
Allowance for doubtful accounts | ( | ( | ||||
Accounts receivable, net | $ | | $ | | ||
The movements in the allowance for doubtful accounts consisted of the following:
Fiscal Year | |||||||||
| 2023 |
| 2022 |
| 2021 | ||||
(in thousands) | |||||||||
Balance as of the beginning of the year | $ | | $ | | $ | | |||
(Recovery of) provision for doubtful accounts |
| |
| |
| | |||
Write-offs of uncollectible accounts |
| ( |
| ( |
| ( | |||
Fair value adjustment |
| — |
| — |
| | |||
Balance as of the end of the year | $ | | $ | | $ | | |||
Allowances for doubtful accounts have been determined through specific identification of amounts considered to be uncollectible and potential write-offs, plus a non-specific allowance for other amounts for which some potential loss has been determined to be probable based on current and past experience.
As of December 29, 2023, two of the Company’s customers, Consolidated Edison of New York and LADWP, accounted for
74
Contract Assets
Contract assets consisted of the following:
December 29, | December 30, | |||||
| 2023 |
| 2022 | |||
(in thousands) | ||||||
Unbilled short-term | $ | | $ | | ||
Contract retentions | | | ||||
Contract assets | | | ||||
Unbilled long-term (1) | | | ||||
Total contract assets | $ | | $ | | ||
| (1) | Included in Other assets in the consolidated financial statements. |
Unbilled accounts receivable represent revenue recognized, but not yet billed, pursuant to contract terms or accounts billed after the period end. Contract retentions represent amounts invoiced to clients where payments have been withheld pending the completion of certain milestones, other contractual conditions or upon the completion of the project. These retention agreements vary from project to project and could be outstanding for several months.
Equipment and Leasehold Improvements
Equipment and leasehold improvements were as follows:
December 29, | December 30, | |||||
2023 |
| 2022 | ||||
(in thousands) | ||||||
Furniture and fixtures | $ | | $ | | ||
Computer hardware and software |
| |
| | ||
Leasehold improvements |
| |
| | ||
Equipment under finance leases |
| |
| | ||
Automobiles, trucks, and field equipment |
| |
| | ||
Subtotal |
| |
| | ||
Accumulated depreciation and amortization |
| ( |
| ( | ||
Equipment and leasehold improvements, net | $ | | $ | | ||
Depreciation expense of equipment and leasehold improvements totaled $
Included in accumulated depreciation and amortization is $
75
Accrued Liabilities
Accrued liabilities were as follows:
December 29, | December 30, | |||||
| 2023 |
| 2022 | |||
(in thousands) | ||||||
Accrued subcontractor costs | $ | | $ | | ||
Accrued bonuses | | | ||||
Employee withholdings |
| |
| | ||
Compensation and payroll taxes |
| |
| | ||
Rebate and other | | | ||||
Accrued accounting costs and taxes |
| |
| | ||
Total accrued liabilities | $ | | $ | | ||
76
4. DERIVATIVE FINANCIAL INSTRUMENTS
The Company uses certain interest rate derivative contracts to hedge interest rate exposures on its variable rate debt. The Company’s hedging program is not designated for trading or speculative purposes.
The Company recognizes derivative instruments as either assets or liabilities on the accompanying consolidated balance sheets at fair value. The Company records changes in the fair value (i.e., gains or losses) of the derivatives that have been designated as cash flow hedges in its consolidated balance sheets as accumulated other comprehensive income (loss) and in its consolidated statements of comprehensive income (loss) as a loss or gain on cash flow hedge valuation.
On
The fair values of the Company’s outstanding derivatives designated as hedging instruments were as follows:
|
| Fair Value of Derivative | ||||||
|
| Instruments as of | ||||||
Balance Sheet Location | December 29, 2023 | December 30, 2022 | ||||||
(in thousands) | ||||||||
Interest rate swap agreement | $ | | $ | — | ||||
Interest rate swap agreement | ( | — | ||||||
The impact of the effective portions of derivative instruments in cash flow hedging relationships and fair value relationships on other comprehensive loss was $
The accumulated balances and reporting period activities for the year ended December 29, 2023 related to reclassifications out of accumulated other comprehensive income (loss) are summarized as follows:
Gain (Loss) on | Accumulated Other | |||||
| Derivative Instruments |
| Comprehensive Loss | |||
(in thousands) | ||||||
Balances at December 30, 2022 | $ | | $ | | ||
Other comprehensive loss before reclassifications | ( | ( | ||||
Amounts reclassified from accumulated other comprehensive income: | — | — | ||||
Income tax benefit (expense) related to derivative instruments | | | ||||
Net current-period other comprehensive loss | ( | ( | ||||
Balances at December 29, 2023 | $ | ( | $ | ( | ||
77
5. DEBT OBLIGATIONS
Debt obligations, excluding obligations under finance leases (see Note 7, Leases, below), consisted of the following:
| December 29, |
| December 30, | |||
2023 | 2022 | |||||
(in thousands) | ||||||
New Credit Facilities | ||||||
Outstanding borrowings on Term Loan | $ | | $ | — | ||
Outstanding borrowings on Revolving Credit Facility | — | — | ||||
Prior Credit Facilities | ||||||
Outstanding borrowings on Term A Loan | — | | ||||
Outstanding borrowings on Revolving Credit Facility | — | — | ||||
Outstanding borrowings on Delayed Draw Term Loan | — | | ||||
Other debt agreements | | | ||||
Total debt | | | ||||
Issuance costs and debt discounts | ( | ( | ||||
Subtotal | | | ||||
Less current portion of long-term debt |
| |
| | ||
Long-term debt portion | $ | | $ | | ||
New Credit Facilities
On September 29, 2023 (the “Closing Date”), the Company and certain of its subsidiaries entered into a credit agreement (the “Credit Agreement”) with a syndicate of financial institutions as lenders and BMO Bank, N.A. (“BMO”), as administrative agent. The Credit Agreement replaced the Company’s Amended and Restated Credit Agreement, dated as of June 26, 2019, (as amended, the “Prior Credit Agreement”), by and among the Company, the guarantors party thereto, BMO as administrative agent and lender and the lenders party thereto.
The Credit Agreement provides for (i) a $
Borrowings under the Credit Facilities bear interest at either a Base Rate (as defined in the Credit Agreement) or the adjusted Secured Overnight Financing Rate (“SOFR”), at the Company’s option, and in each case, plus an applicable margin, which applicable margin ranges from
The Term Loan will amortize quarterly in an amount equal to (i)
78
outstanding under the Credit Facilities may be prepaid in whole or in part at any time without penalty (other than customary breakage costs).
The Term Loan issuance costs are amortized to interest expense over the term of the loan, and as of December 29, 2023, issuance costs of $
Willdan Group, Inc. is the borrower under the Credit Agreement and its obligations under the Credit Agreement are guaranteed by its present and future domestic subsidiaries (other than inactive subsidiaries). In addition, subject to certain exceptions, all such obligations are secured by substantially all of the assets of Willdan Group, Inc. and the subsidiary guarantors (other than inactive subsidiaries).
The Credit Agreement requires compliance with financial covenants, including a maximum Net Leverage Ratio and a minimum Fixed Charge Coverage Ratio (as defined in the Credit Agreement). The Credit Agreement also contains customary restrictive covenants, including (i) restrictions on the incurrence of additional indebtedness and additional liens on property, (ii) restrictions on permitted acquisitions and other investments and (iii) limitations on asset sales, mergers and acquisitions. Further, the Credit Agreement limits the Company’s payment of future dividends and distributions and share repurchases by the Company. Subject to certain exceptions, the borrowings under the Credit Agreement are also subject to mandatory prepayment from (a) any issuances of debt or equity securities, (b) any sale or disposition of assets, (c) insurance and condemnation proceeds, and (d) a percentage of excess cash flow. The Credit Agreement includes customary events of default.
The Company believes that, as of December 29, 2023, it was in compliance with all covenants contained in the Credit Agreement. As of December 29, 2023, the Company’s composite annual interest rate, exclusive of the effects of upfront fees, undrawn fees and issuance cost amortization, was
Prior Credit Facilities
On June 26, 2019, the Company and certain of its subsidiaries entered into the Prior Credit Agreement with a syndicate of financial institutions as lenders and BMO Harris Bank, N.A., as administrative agent (the “Administrative Agent”). The Prior Credit Agreement provided for (i) a $
Pursuant to the terms of the Seventh Amendment to the Prior Credit Agreement (the “Seventh Amendment”), among other things, (A) aggregate borrowings under the Revolving Credit Facility were restricted to no more than $
On April 28, 2023, the Company delivered to the Administrative Agent the required financial statements and compliance documents for the fiscal quarter ending March 31, 2023, reflecting full compliance with the restrictive covenants under the Prior Credit Agreement, and thus effectively terminating the limitations on borrowing capacity and other restrictions imposed under the terms set by the Seventh Amendment.
Effective April 28, 2023, borrowings under the Prior Credit Agreement bore interest at either a Base Rate (as defined in the Prior Credit Agreement) or SOFR, at the Company’s option, and in each case, plus an applicable margin, which applicable margin ranged from
79
with the specific pricing reset on each date on which the Administrative Agent received the required financial statements under the Prior Credit Agreement for the fiscal quarter then ended. The Company was obligated to also pay a commitment fee for the unused portion of the Revolving Credit Facility and the Delayed Draw Term Loan under the Prior Credit Agreement, which ranged from
The Prior Credit Agreement required the Company to comply with certain financial covenants, including requiring that the Company maintain a (i) Total Leverage Ratio of at least
Other Debt Agreements
The Company’s other debt agreements are related to financed insurance premiums, a financed software agreement, and a utility customer agreement and are immaterial to the Company’s Consolidated Financial Statements.
Future Debt Payments
The following table summarizes the combined principal installments for the Company’s debt obligations, excluding capital leases, over the next five years and beyond, as of December 29, 2023 (in thousands):
Fiscal Year: | |||
2024 | $ | | |
2025 | | ||
2026 | | ||
2027 | — | ||
2028 | — | ||
Total debt maturities | | ||
Issuance costs and debt discounts | ( | ||
Net carrying value | $ | |
80
6. GOODWILL AND OTHER INTANGIBLE ASSETS
The Company’s goodwill primarily relates to the Energy segment and the acquisitions within this segment of E3, Inc., Lime Energy, NAM, Integral Analytics and Abacus Resource Management Company (“Abacus”) and substantially all of the assets of Onsite Energy, The Weidt Group, Genesys and 360 Energy Engineers, LLC (“360 Energy”). The remaining goodwill relates to the Engineering and Consulting reporting segment and the acquisition within this segment of Economists LLC.
The changes in the carrying value of goodwill by reporting unit were as follows:
December 30, | Additional | Additions / | December 29, | |||||||||
| 2022 |
| Purchase Cost |
| Adjustments |
| 2023 | |||||
(in thousands) | ||||||||||||
Reporting Unit: | ||||||||||||
Energy | $ | | $ | | $ | | $ | | ||||
Engineering and Consulting | | | | | ||||||||
$ | | $ | | $ | | $ | | |||||
December 31, | Additional | Additions / | December 30, | |||||||||
| 2021 |
| Purchase Cost |
| Adjustments |
| 2022 | |||||
(in thousands) | ||||||||||||
Reporting Unit: | ||||||||||||
Energy | $ | | $ | | $ | | $ | | ||||
Engineering and Consulting | | | | | ||||||||
$ | | $ | | $ | | $ | | |||||
The Company tests its goodwill at least annually for possible impairment. The Company completes its annual testing of goodwill as of the last day of the first month of its fourth fiscal quarter each year to determine whether there is impairment. In addition to the Company’s annual test, it regularly evaluates whether events and circumstances have occurred that may indicate a potential impairment of goodwill.
The gross amounts and accumulated amortization of the Company’s acquired identifiable intangible assets with finite useful lives, included in other intangible assets, net in the accompanying consolidated balance sheets, were as follows:
December 29, 2023 | December 30, 2022 | |||||||||||||||||
Gross | Accumulated | Gross | Accumulated | Amortization | ||||||||||||||
| Amount |
| Amortization |
| Amount |
| Amortization |
| Period | |||||||||
(in thousands) | (in years) | |||||||||||||||||
Finite: | ||||||||||||||||||
Backlog | $ | | $ | | $ | | $ | | ||||||||||
Tradename | | | | |
| - | ||||||||||||
Non-compete agreements | | | | | - | |||||||||||||
Developed technology | | | | | ||||||||||||||
Customer relationships | | | | | - | |||||||||||||
Total intangible assets | $ | | $ | | $ | | $ | | ||||||||||
At the time of acquisition, the Company estimates the fair value of the acquired identifiable intangible assets based upon the facts and circumstances related to the particular intangible asset. Inherent in such estimates are judgments and estimates of future revenue, profitability, cash flows and appropriate discount rates for any present value calculations. The Company preliminarily estimates the value of the acquired identifiable intangible assets and then finalizes the
81
estimated fair values during the purchase allocation period, which does not extend beyond 12 months from the date of acquisition.
The Company’s amortization expense for acquired identifiable intangible assets with finite useful lives was $
Estimated amortization expense for acquired identifiable intangible assets for fiscal year 2024 and the succeeding years is as follows:
Future Intangible Asset | |||
Amortization expense | |||
(in thousands) | |||
Fiscal year: | |||
2024 | $ | | |
2025 |
| | |
2026 |
| | |
2027 | | ||
2028 | | ||
Thereafter | | ||
$ | |
82
7. LEASES
The Company leases certain office facilities under long-term, non-cancellable operating leases that expire at various dates through the year 2029. In addition, the Company is obligated under finance leases for certain furniture and office equipment that expire at various dates through the year 2028.
On December 29, 2018, the Company adopted ASU No. 2016-02, Leases (Topic 842) using the modified retrospective method. Under this guidance, the net present value of future lease payments is recorded as right-of-use assets and lease liabilities. In addition, the Company elected the ‘package of
From time to time, the Company enters into non-cancelable leases for some of its facility and equipment needs. These leases allow the Company to conserve cash by paying a monthly lease rental fee for the use of facilities and equipment rather than purchasing them. The Company’s leases typically have remaining terms ranging from to
Financing Leases
The Company leases certain equipment under financing leases. The economic substance of the leases is a financing transaction for acquisition of equipment and leasehold improvements. Accordingly, the right-of-use assets for these leases are included in the balance sheets in equipment and leasehold improvements, net of accumulated depreciation, with a corresponding amount recorded in current portion of financing lease obligations or noncurrent portion of financing lease obligations, as appropriate. The financing lease assets are amortized over the life of the lease or, if shorter, the life of the leased asset, on a straight-line basis and included in depreciation expense. The interest associated with financing lease obligations is included in interest expense.
Right-of-use assets
Operating leases are included in right-of-use assets, and current portion of lease liability and noncurrent portion of lease liability, as appropriate. Right-of-use assets and lease liabilities are recognized based on the present value of the future minimum lease payments over the lease term at commencement date. As most of the Company’s leases do not provide an implicit rate to calculate present value, the Company determines this rate by estimating the Company’s incremental borrowing rate at the lease commencement date. The right-of-use asset also includes any lease payments made and initial direct costs incurred at lease commencement and excludes lease incentives. The Company’s lease terms
83
may include options to extend or terminate the lease when it is reasonably certain that the Company will exercise that option. Lease expense for minimum lease payments is recognized on a straight-line basis over the lease term.
The following is a summary of the Company’s lease expense:
Fiscal Year | |||||||||
2023 |
| 2022 |
| 2021 | |||||
(in thousands) | |||||||||
Operating lease cost | $ | | $ | | $ | | |||
Sublease Income | ( | — | — | ||||||
Finance lease cost: | |||||||||
Amortization of assets | | | | ||||||
Interest on lease liabilities | | | | ||||||
Total net lease cost | $ | | $ | | $ | | |||
The following is a summary of lease information presented on the Company’s consolidated balance sheet:
December 29, | December 30, | |||||
2023 |
| 2022 | ||||
(in thousands, except years and percentages) | ||||||
Operating leases: | ||||||
Right-of-use assets | $ | | $ | | ||
|
| |||||
Lease liability | $ | | $ | | ||
Lease liability, less current portion |
| |
| | ||
Total lease liabilities | $ | | $ | | ||
|
| |||||
Finance leases (included in equipment and leasehold improvements, net): | ||||||
Equipment and leasehold improvements, net | $ | | $ | | ||
Accumulated depreciation |
| ( |
| ( | ||
$ | | $ | | |||
|
| |||||
Finance lease obligations | $ | | $ | | ||
Finance lease obligations, less current portion | | | ||||
Total finance lease obligations | $ | | $ | | ||
Weighted average remaining lease term (in years): | ||||||
Operating Leases | ||||||
Finance Leases | ||||||
Weighted average discount rate: | ||||||
Operating Leases | | % | | % | ||
Finance Leases | | % | | % | ||
Rent expense for fiscal years 2023, 2022 and 2021 was $
84
The following is a summary of other information and supplemental cash flow information related to finance and operating leases:
Fiscal Year | |||||||||
| 2023 |
| 2022 |
| 2021 | ||||
(in thousands) | |||||||||
Cash paid for amounts included in the measurement of lease liabilities: | |||||||||
Operating cash flow from operating leases | $ | | $ | | $ | | |||
Operating cash flow from finance leases | | | | ||||||
Financing cash flow from finance leases | | | | ||||||
Right-of-use assets obtained in exchange for lease liabilities: | |||||||||
Operating leases | $ | | $ | | $ | | |||
The following is a summary of the Company’s maturities of lease liabilities as of December 29, 2023:
| Operating |
| Finance |
| |||
(in thousands) | |||||||
Fiscal year: | |||||||
2024 | $ | | $ | | |||
2025 |
| |
| | |||
2026 |
| | | ||||
2027 | | | |||||
2028 | |
| | ||||
2029 and thereafter |
| |
| — | |||
Total lease payments | | | |||||
Less: Imputed interest |
| ( | ( | ||||
Total lease obligations |
| | | ||||
Less: Current obligations |
| | | ||||
Noncurrent lease obligations | $ | | $ | | |||
The imputed interest for finance lease obligations represents the interest component of finance leases that will be recognized as interest expense in future periods. The financing component for operating lease obligations represents the effect of discounting the operating lease payments to their present value.
85
8. COMMITMENTS AND VARIABLE INTEREST ENTITIES
Employee Benefit Plans
The Company has a profit sharing plan pursuant to Code Section 401(a) and qualified cash or deferred arrangement pursuant to Code Section 401(k) covering all employees. Employees may elect to contribute up to
The Company’s defined contribution plan (the “Plan”) covers employees who have completed
The Company made matching contributions of $
Variable Interest Entities
On March 4, 2016, the Company and the Company’s wholly-owned subsidiary, WES, acquired substantially all of the assets of Genesys and assumed certain specified liabilities of Genesys (collectively, the “Purchase”) pursuant to an Asset Purchase and Merger Agreement, dated as of February 26, 2016 (the “Agreement”), by and among Willdan Group, Inc., WES, WESGEN (as defined below), Genesys and Ronald W. Mineo (“Mineo”) and Robert J. Braun (“Braun” and, together with Mineo, the “Genesys Shareholders”). On March 5, 2016, pursuant to the terms of the Agreement, WESGEN, Inc., a non-affiliated corporation (“WESGEN”), merged (the “Merger” and, together with the Purchase, the “Acquisition”) with Genesys, with Genesys remaining as the surviving corporation. Genesys was acquired to strengthen the Company’s power engineering capability in the northeastern U.S., and also to increase client exposure and experience with universities.
Genesys continues to be a professional corporation organized under the laws of the State of New York, wholly-owned by one or more licensed engineers. Pursuant to New York law, the Company does not own capital stock of Genesys. The Company has entered into an agreement with the Shareholder of Genesys pursuant to which the Shareholder will be prohibited from selling, transferring or encumbering the Shareholder’s ownership interest in Genesys without the Company’s consent. Notwithstanding the Company’s rights regarding the transfer of Genesys’s stock, the Company does not have control over the professional decision making of Genesys’s engineering services. The Company has entered into an administrative services agreement with Genesys pursuant to which WES will provide Genesys with ongoing administrative, operational and other non-professional support services. Genesys pays WES a service fee, which consists of all of the costs incurred by WES to provide the administrative services to Genesys plus
The Company manages Genesys and has the power to direct the activities that most significantly impact Genesys’s performance, in addition to being obligated to absorb expected losses from Genesys. Accordingly, the Company is the primary beneficiary of Genesys and consolidates Genesys as a VIE. In addition, the Company concluded there is no noncontrolling interest related to the consolidation of Genesys because the Company determined that (i) the shareholder of Genesys does not have more than a nominal amount of equity investment at risk, (ii) WES absorbs the expected losses of Genesys through its deferral of Genesys’s service fees owed to WES and the Company has, since entering into the administrative services agreement, had to continuously defer service fees for Genesys, and (iii) the Company believes Genesys will continue to have a shortfall on payment of its service fees for the foreseeable future, leaving no expected residual returns for the shareholder.
As of December 29, 2023, the Company had
86
9. SEGMENT AND GEOGRAPHICAL INFORMATION
Segment Information
The Company’s
There were no intersegment sales during the fiscal years 2023, 2022, or 2021. The Company’s chief operating decision maker evaluates the performance of each segment based upon income or loss from operations before income taxes. Certain segment asset information including expenditures for long-lived assets has not been presented as it is not reported to or reviewed by the chief operating decision maker. In addition, enterprise-wide service line contract revenue is not included as it is impracticable to report this information for each group of similar services.
Financial information with respect to the reportable segments and reconciliation to the amounts reported in the Company’s consolidated financial statements follows:
Engineering | Unallocated | Consolidated | |||||||||||||
Energy |
| & Consulting |
| Corporate |
| Intersegment |
| Total | |||||||
(in thousands) | |||||||||||||||
Fiscal Year 2023 | |||||||||||||||
Contract revenue | $ | | $ | | $ | — | $ | — | $ | | |||||
Depreciation and amortization |
| | | — | — | | |||||||||
Interest expense |
| | — | | — | | |||||||||
Segment profit (loss) before income tax expense |
| | | ( | — | | |||||||||
Income tax (benefit) expense |
| | | ( | — | | |||||||||
Net income (loss) |
| | | ( | — | | |||||||||
Segment assets (1) |
| | | | ( | | |||||||||
Fiscal Year 2022 | |||||||||||||||
Contract revenue | $ | | $ | | $ | — | $ | — | $ | | |||||
Depreciation and amortization |
| |
| | — | — | | ||||||||
Interest expense |
| |
| — | | — | | ||||||||
Segment profit (loss) before income tax expense |
| ( |
| | ( |
| — |
| ( | ||||||
Income tax (benefit) expense |
| ( |
| | ( |
| — | ( | |||||||
Net income (loss) |
| ( |
| | ( |
| — |
| ( | ||||||
Segment assets (1) |
| |
| | |
| ( |
| | ||||||
Fiscal Year 2021 | |||||||||||||||
Contract revenue | $ | $ | $ | — | $ | — | $ | | |||||||
Depreciation and amortization |
| |
| | — | — | | ||||||||
Interest expense |
| |
| — | | — | | ||||||||
Segment profit (loss) before income tax expense |
| ( |
| | ( |
| — |
| ( | ||||||
Income tax (benefit) expense |
| ( |
| | ( |
| — | ( | |||||||
Net income (loss) |
| ( |
| | ( |
| — |
| ( | ||||||
Segment assets (1) |
| |
| | |
| ( |
| | ||||||
| (1) | Segment assets are presented net of intercompany receivables. |
87
The following tables provide information about disaggregated revenue by contract type, client type and geographical region:
| 2023 | ||||||||
| Energy |
| Engineering and |
| Total | ||||
| (in thousands) | ||||||||
Contract Type | |||||||||
Time-and-materials | $ | $ | $ | ||||||
Unit-based | |||||||||
Fixed price | |||||||||
Total (1) | $ | $ | $ | ||||||
Client Type | |||||||||
Commercial | $ | $ | $ | ||||||
Government | |||||||||
Utilities (2) | |||||||||
Total (1) | $ | $ | $ | ||||||
Geography (3) | |||||||||
Domestic | $ | | $ | | $ | | |||
| 2022 | ||||||||
| Energy |
| Engineering and |
| Total | ||||
| (in thousands) | ||||||||
Contract Type | |||||||||
Time-and-materials | $ | $ | $ | ||||||
Unit-based | |||||||||
Fixed price | |||||||||
Total (1) | $ | $ | $ | ||||||
Client Type | |||||||||
Commercial | $ | $ | $ | ||||||
Government | |||||||||
Utilities (2) | |||||||||
Total (1) | $ | $ | $ | ||||||
Geography (3) | |||||||||
Domestic | $ | | $ | | $ | | |||
| 2021 | ||||||||
| Energy |
| Engineering and |
| Total | ||||
| (in thousands) | ||||||||
Contract Type | |||||||||
Time-and-materials | $ | $ | $ | ||||||
Unit-based | |||||||||
Fixed price | |||||||||
Total (1) | $ | $ | $ | ||||||
Client Type | |||||||||
Commercial | $ | $ | $ | ||||||
Government | |||||||||
Utilities (2) | |||||||||
Total (1) | $ | $ | $ | ||||||
Geography (3) | |||||||||
Domestic | $ | | $ | | $ | | |||
| (1) | Amounts may not add to the totals due to rounding. |
| (2) | Includes the portion of revenue related to small business programs paid by the end user/customer. |
| (3) | Revenue from the Company’s foreign operations were immaterial for fiscal years 2023, 2022, and 2021. |
88
The following sets forth the assets that are included in Unallocated Corporate as of December 29, 2023 and December 30, 2022.
| 2023 |
| 2022 | |||
(in thousands) | ||||||
Assets: | ||||||
Cash and cash equivalents | $ | | $ | | ||
Restricted cash | — | | ||||
Accounts Receivable, net | ( | ( | ||||
Prepaid expenses |
| |
| | ||
Intercompany receivables |
| |
| | ||
Goodwill | | | ||||
Other receivables |
| |
| | ||
Equipment and leasehold improvements, net |
| |
| | ||
Investments in subsidiaries |
| |
| | ||
ROU Assets | | | ||||
Other |
| |
| | ||
Deferred income taxes | | | ||||
$ | | $ | | |||
Geographical Information
Substantially all of the Company’s consolidated revenue was derived from its operations in the U.S.
The Company operates through a network of offices spread across
Customer Concentration
For fiscal years 2023, 2022, and 2021, the Company’s top 10 customers accounted for
On a segment basis, the Company also had individual customers that accounted for more than 10% of its segment contract revenues. For fiscal year 2023, the Company derived
The Company’s largest clients are based in California and New York. In fiscal years 2023, 2022, and 2021, services provided to clients in California accounted for
89
10. SHAREHOLDERS’ EQUITY
Stock Incentive Plans
2006 Stock Incentive Plan
In June 2006, the Company’s board of directors adopted the 2006 Stock Incentive Plan (“2006 Plan”) and it received stockholder approval. The Company re-submitted the 2006 Plan to its stockholders for post-IPO approval at the 2007 annual meeting of the stockholders and it was approved. After the Company’s shareholders approved the 2008 Plan (as defined below) in June 2008, no additional awards were granted under the 2006 Plan. The 2006 Plan had
Amended and Restated 2008 Performance Incentive Plan
In March 2008, the Company’s board of directors adopted the 2008 Performance Incentive Plan (“2008 Plan”), and it received stockholder approval at the 2008 annual meeting of the stockholders in June 2008. The 2008 Plan was originally set to terminate on April 17, 2027 but received a ten-year, a three-year, and a one-year extension at the 2019, 2022, and 2023 annual meetings of the stockholders, respectively. The 2008 Plan is currently scheduled to expire on April 16, 2033. The 2008 Plan initially had
Through December 29, 2023, outstanding awards granted, net of forfeitures and exercises, under the 2008 Plan consisted of
90
Employee Stock Purchase Plan
Amended and Restated 2006 Employee Stock Purchase Plan
The Company adopted its Amended and Restated 2006 Employee Stock Purchase Plan (“ESPP”) to allow eligible employees the right to purchase shares of common stock, at semi-annual intervals, with their accumulated payroll deductions. The ESPP received stockholder approval in June 2006. The Company re-submitted the ESPP to its stockholders for post-IPO approval at the 2007 annual stockholders’ meeting where approval was obtained. The ESPP initially had
The ESPP has semi-annual periods beginning on each January 1 and ending on each June 30 and beginning on each July 1 and ending on each December 31. The first offering period commenced on February 10, 2007 and ended on June 30, 2007. Participants make contributions under the ESPP only by means of payroll deductions each payroll period. The rate of payroll contributions elected by a Participant may not be less than one percent (
As of December 29, 2023, there were
Stock-based Compensation Expense
The compensation expense that has been recognized for stock options, RSAs, performance-based restricted stock units (“PBRSU”), and ESPP issued under these plans was $
The Company did
The total unrecognized compensation expense related to RSAs was $
The total unrecognized compensation expense related to PBRSUs was $
There were
91
Summary of Stock Option Activity
A summary of option activity under the 2006 Plan and 2008 Plan as of December 29, 2023 and changes during the fiscal years ended December 29, 2023, December 30, 2022 and December 31, 2021 is presented below. The intrinsic value of the fully-vested options is $
Weighted- |
| |||||||
Weighted- | Average |
| ||||||
Average | Remaining |
| ||||||
Exercise | Contractual |
| ||||||
| Options |
| Price |
| Term |
| ||
(in thousands) | (in years) | |||||||
Outstanding at December 30, 2022 |
| | $ | |
| |||
Granted |
| — |
| — |
| — | ||
Exercised |
| ( |
| |
| — | ||
Forfeited or expired |
| ( |
| |
| — | ||
Outstanding at December 29, 2023 |
| | $ | |
| |||
Vested and expected to vest at December 29, 2023 |
| | $ | |
| |||
Exercisable at December 29, 2023 |
| | $ | |
| |||
Weighted- | ||||||||
Weighted- | Average |
| ||||||
Average | Remaining |
| ||||||
Exercise | Contractual |
| ||||||
| Options |
| Price |
| Term |
| ||
(in thousands) | (in years) | |||||||
Outstanding at December 31, 2021 |
| | $ | |
| |||
Granted |
| — |
| — |
| — | ||
Exercised |
| ( |
| |
| — | ||
Forfeited or expired |
| — |
| — |
| — | ||
Outstanding at December 30, 2022 |
| | $ | |
| |||
Vested and expected to vest at December 30, 2022 |
| | $ | |
| |||
Exercisable at December 30, 2022 |
| | $ | |
| |||
Weighted- |
| |||||||
Weighted- | Average |
| ||||||
Average | Remaining |
| ||||||
Exercise | Contractual |
| ||||||
| Options |
| Price |
| Term |
| ||
(in thousands) | (in years) | |||||||
Outstanding at January 1, 2021 |
| | $ | |
| |||
Granted |
| — |
| — |
| — | ||
Exercised |
| ( |
| |
| — | ||
Forfeited or expired |
| ( |
| |
| — | ||
Outstanding at December 31, 2021 |
| | $ | |
| |||
Vested and expected to vest at December 31, 2021 |
| | $ | |
| |||
Exercisable at December 31, 2021 |
| | $ | |
| |||
92
A summary of the status of the Company’s nonvested options and changes in nonvested options is presented below:
Weighted- |
| |||||
Average |
| |||||
Grant-Date |
| |||||
| Options |
| Fair Value |
| ||
(in thousands) | ||||||
Nonvested at December 30, 2022 |
| | $ | | ||
Granted |
| — |
| — | ||
Vested |
| |
| | ||
Forfeited |
| — |
| — | ||
Nonvested at December 29, 2023 |
| |
| | ||
Weighted- | ||||||
Average |
| |||||
Grant-Date |
| |||||
| Options |
| Fair Value |
| ||
(in thousands) | ||||||
Nonvested at December 31, 2021 |
| | $ | | ||
Granted |
| — |
| — | ||
Vested |
| — |
| — | ||
Forfeited |
| — |
| — | ||
Nonvested at December 30, 2022 |
| |
| | ||
Weighted- | ||||||
Average |
| |||||
Grant-Date |
| |||||
| Options |
| Fair Value |
| ||
(in thousands) | ||||||
Nonvested at January 1, 2021 |
| | $ | | ||
Granted |
| — |
| — | ||
Vested |
| ( |
| | ||
Forfeited |
| — |
| — | ||
Nonvested at December 31, 2021 |
| |
| | ||
93
Summary of Restricted Stock Activity
A summary of restricted stock activity under the 2008 Plan as of December 29, 2023 is presented below:
Weighted- |
| |||||
Average |
| |||||
| Restricted Stock |
| Grant Date |
| ||
(in thousands) | ||||||
Outstanding at December 30, 2022 | | $ |
| |||
Awarded | | | ||||
Vested | ( | | ||||
Forfeited | ( | | ||||
Outstanding at December 29, 2023 | | $ | | |||
Outstanding at December 31, 2021 | | $ |
| |||
Awarded | | | ||||
Vested | ( | | ||||
Forfeited | ( | | ||||
Outstanding at December 30, 2022 | | $ | | |||
Outstanding at January 1, 2021 | | $ |
| |||
Awarded | |
| | |||
Vested | ( |
| | |||
Forfeited | ( |
| | |||
Outstanding at December 31, 2021 | | $ | | |||
94
Summary of Performance-Based Restricted Stock Unit Activity
A summary of performance-based restricted stock unit activity under the 2008 Plan as of December 29, 2023 is presented below:
Performance-Based | Weighted-Average | ||||
| Restricted Stock Unit |
| Grant Date Fair Value | ||
(in thousands) | |||||
Outstanding at December 30, 2022 | | $ | | ||
Awarded | | | |||
Released | ( | | |||
Forfeited | ( | | |||
Outstanding at December 29, 2023 | | $ | | ||
Outstanding at December 31, 2021 | | $ | | ||
Awarded | | | |||
Released | ( | | |||
Forfeited | ( | | |||
Outstanding at December 30, 2022 | | $ | | ||
Outstanding at January 1, 2021 | | $ | | ||
Awarded | |
| | ||
Released | ( |
| | ||
Forfeited | ( |
| | ||
Outstanding at December 31, 2021 | | $ | | ||
Fair Value Valuation Assumptions
Stock Option Grants
The fair value of each option is calculated using the Black-Scholes option valuation model that uses the assumptions noted in the following table. Expected volatility is based upon historical volatility of “guideline companies” since the length of time the Company’s shares have been publicly traded is equal to the contractual term of the options. The expected term of the option, taking into account both the contractual term of the option and the effects of employees’ expected exercise and expected post-vesting termination behavior is estimated based upon the simplified method. Under this approach, the expected term is presumed to be the mid-point between the vesting date and the end of the contractual term. The risk-free rate for periods within the contractual life of the option is based on the U.S. Treasury yield curve in effect at the time of grant.
RSA and PBRSU Grants
The Company’s restricted stock awards are valued on the closing price of the Company’s common stock on the date of grant and typically vest over a to
The Company’s performance-based restricted stock unit awards are valued on the closing price of the Company’s common stock on the date of grant and vest over a performance period. Under the Company’s PBRSU design, awards vest based on
95
period, and the remaining
ESPP
The fair value of ESPP purchase rights issued is calculated using the Black-Scholes valuation model that uses the assumptions noted in the following table. Purchase right under the ESPP are generally granted on either January 1 or July 1 of each year. The assumptions are as follows:
| 2023 | 2022 | 2021 | |||||||||
Weighted-average expected term (in years) |
|
|
| |||||||||
Risk-Free interest Rate |
| % |
| % |
| % | ||||||
Stock Price Volatility |
| % |
| % |
| % | ||||||
Dividend yield |
| % |
| % |
| % | ||||||
Fair Value | $ | $ | $ | |||||||||
96
11. INCOME TAXES
The provision for income taxes is comprised of (1):
Fiscal Year |
| |||||||||
| 2023 |
| 2022 |
| 2021 |
| ||||
(in thousands) | ||||||||||
Current federal taxes | $ | | $ | ( | $ | ( | ||||
Current state taxes |
| |
| ( |
| | ||||
Current foreign taxes | — | — | — | |||||||
Deferred federal taxes |
| |
| ( |
| ( | ||||
Deferred state taxes |
| |
| ( |
| ( | ||||
$ | | $ | ( | $ | ( | |||||
| (1) | Revenue from the Company’s foreign operations was immaterial for fiscal years 2023, 2022 and 2021. |
The provision for income taxes reconciles to the amounts computed by applying the statutory federal tax rate of
| 2023 |
| 2022 |
| 2021 |
| ||||
(in thousands) | ||||||||||
Computed “expected” federal income tax expense | $ | | $ | ( | $ | ( | ||||
Permanent differences |
| |
| |
| | ||||
Nondeductible executive compensation | | | | |||||||
Stock options and disqualifying dispositions | | | ( | |||||||
Energy efficient building deduction | ( | ( | ( | |||||||
Current and deferred state income tax expense, net of federal benefit |
| |
| ( |
| ( | ||||
Research and development tax credit | ( | ( | ( | |||||||
Federal rate differential on NOL carryback | — | — | ( | |||||||
Change in valuation allowance | — | — | | |||||||
Other |
| |
| |
| ( | ||||
$ | | $ | ( | $ | ( | |||||
97
The tax effects of temporary differences that give rise to significant portions of the net deferred tax assets and liabilities are as follows:
December 29, | December 30, | |||||
| 2023 |
| 2022 | |||
(in thousands) | ||||||
Deferred tax assets: | ||||||
Other accrued liabilities | $ | | $ | | ||
Federal and state net operating losses | | | ||||
Lease liability | | | ||||
Stock compensation | | | ||||
Capitalized research and development | | | ||||
Credit carryforwards | | | ||||
Excess business interest limitation | | | ||||
Other |
| |
| | ||
Total deferred tax assets |
| |
| | ||
Valuation allowance |
| ( |
| ( | ||
Net deferred tax assets | $ | | $ | | ||
Deferred tax liabilities: | ||||||
Deferred revenue | $ | ( | $ | ( | ||
Fixed assets | ( | ( | ||||
Intangible assets | ( | ( | ||||
Lease right-of-use assets | ( | ( | ||||
Total deferred tax liabilities |
| ( |
| ( | ||
Net deferred tax asset | $ | | $ | | ||
As of December 29, 2023, the Company had federal and state operating loss carryovers of $
During each fiscal year, management assesses the available positive and negative evidence to estimate if sufficient future taxable income will be generated to utilize existing deferred tax assets. During fiscal year 2023 and 2022,
As of December 29, 2023 and December 30, 2022, the Company’s liabilities related to uncertain tax positions were immaterial to the consolidated financial statements. The Company may be subject to examination by the Internal Revenue Service (“IRS”) for calendar . The Company may also be subject to examination on certain state and local jurisdictions for the .
The Company's policy is to recognize interest and penalties related to unrecognized tax benefits in income tax expense. As of December 29, 2023 and December 30, 2022, the Company did
98
12. EARNINGS PER SHARE (“EPS”)
Basic EPS is computed by dividing net income available to common stockholders by the weighted-average number of common shares outstanding. Diluted EPS is computed by dividing net income by the weighted-average number of common shares outstanding and dilutive potential common shares for the period. Potential common shares include the weighted-average dilutive effects of outstanding stock options and restricted stock awards using the treasury stock method.
The following table sets forth the number of weighted-average common shares outstanding used to compute basic and diluted EPS:
Fiscal Year | |||||||||
2023 |
| 2022 |
| 2021 | |||||
(in thousands, except per share amounts) | |||||||||
Net income (loss) | $ | | $ | ( | $ | ( | |||
Weighted-average common shares outstanding |
| |
| |
| | |||
Effect of dilutive stock options and restricted stock awards |
| |
| — |
| — | |||
Weighted-average common shares outstanding-diluted |
| |
| |
| | |||
Earnings (Loss) per share: | |||||||||
Basic | $ | | $ | ( | $ | ( | |||
Diluted | $ | | $ | ( | $ | ( | |||
For the fiscal year 2023, the Company excluded
99
13. CONTINGENCIES
Claims and Lawsuits
The Company is subject to claims and lawsuits from time to time, including those alleging professional errors or omissions that arise in the ordinary course of business against firms that operate in the engineering and consulting professions. The Company carries professional liability insurance, subject to certain deductibles and policy limits, for such claims as they arise and may from time to time establish reserves for litigation that is considered probable of a loss.
In accordance with accounting standards regarding loss contingencies, the Company accrues an undiscounted liability for those contingencies where the incurrence of a loss is probable and the amount can be reasonably estimated, and discloses the amount accrued and an estimate of any reasonably possible loss in excess of the amount accrued, if such disclosure is necessary for the Company’s financial statements not to be misleading. The Company does not accrue liabilities when the likelihood that the liability has been incurred is probable but the amount cannot be reasonably estimated, or when the liability is believed to be only reasonably possible or remote.
Because litigation outcomes are inherently unpredictable, the Company’s evaluation of legal proceedings often involves a series of complex assessments by management about future events and can rely heavily on estimates and assumptions. If the assessments indicate that loss contingencies that could be material to any one of the Company’s financial statements are not probable, but are reasonably possible, or are probable, but cannot be estimated, then the Company will disclose the nature of the loss contingencies, together with an estimate of the possible loss or a statement that such loss is not reasonably estimable. While the consequences of certain unresolved proceedings are not presently determinable, and a reasonable estimate of the probable and reasonably possible loss or range of loss in excess of amounts accrued for such proceedings cannot be made, an adverse outcome from such proceedings could have a material adverse effect on the Company’s earnings in any given reporting period. However, in the opinion of the Company’s management, after consulting with legal counsel, and taking into account insurance coverage, the ultimate liability related to current outstanding claims and lawsuits is not expected to have a material adverse effect on the Company’s financial statements.
100
14. QUARTERLY FINANCIAL INFORMATION (UNAUDITED)
The tables below reflect selected quarterly information for the fiscal years ended December 29, 2023 and December 30, 2022.
Fiscal Three Months Ended |
| ||||||||||||
March 31, | June 30, | September 29, | December 29, |
| |||||||||
| 2023 |
| 2023 |
| 2023 |
| 2023 |
| |||||
(in thousands except per share amounts) |
| ||||||||||||
Contract revenue | $ | | $ | | $ | | $ | | |||||
Income (loss) from operations |
| |
| |
| |
| | |||||
Income tax expense (benefit) |
| |
| |
| |
| | |||||
Net income (loss) |
| |
| |
| |
| | |||||
Earnings (loss) per share: | |||||||||||||
Basic | $ | $ | $ | $ | |||||||||
Diluted | $ | $ | $ | $ | |||||||||
Weighted-average shares outstanding: | |||||||||||||
Basic |
| |
| |
| |
| | |||||
Diluted |
| |
| |
| |
| | |||||
Fiscal Three Months Ended |
| ||||||||||||
April 1, | July 1, | September 30, | December 30, |
| |||||||||
| 2022 |
| 2022 |
| 2022 |
| 2022 |
| |||||
(in thousands except per share amounts) |
| ||||||||||||
Contract revenue | $ | | $ | | $ | | $ | | |||||
Income (loss) from operations |
| ( |
| ( |
| ( |
| | |||||
Income tax expense (benefit) |
| ( |
| ( |
| ( |
| | |||||
Net income (loss) |
| ( |
| ( |
| |
| ( | |||||
Earnings (loss) per share: | |||||||||||||
Basic | $ | ( | $ | ( | $ | $ | ( | ||||||
Diluted | $ | ( | $ | ( | $ | $ | ( | ||||||
Weighted-average shares outstanding: | |||||||||||||
Basic |
| |
| |
| |
| | |||||
Diluted |
| |
| |
| |
| | |||||
101
15. SUBSEQUENT EVENTS
In accordance with ASC Topic 855, Subsequent Events, the Company evaluates subsequent events up until the date the consolidated financial statements are issued. As of March 7, 2024, there were no subsequent events required to be reported.
102
ITEM 9. CHANGES IN AND DISAGREEMENTS WITH ACCOUNTANTS ON ACCOUNTING AND FINANCIAL DISCLOSURE
There were no changes in and/or disagreements with accountants on accounting and financial disclosure during the fiscal year ended December 29, 2023.
ITEM 9A. CONTROLS AND PROCEDURES
Evaluation of Disclosure Controls and Procedures
We maintain disclosure controls and procedures defined in Rule 13a-15(e) under the Exchange Act, as controls and other procedures that are designed to ensure that information required to be disclosed by the issuer in the reports that it files or submits under the Exchange Act is recorded, processed, summarized and reported, within the time periods specified in the SEC’s rules and forms. Disclosure controls and procedures include, without limitation, controls and procedures designed to ensure that information required to be disclosed in the reports that we file or submit under the Securities Exchange Act is accumulated and communicated to our management, including our President and Chief Executive Officer, Michael A. Bieber, and our Chief Financial Officer, Creighton K. Early, as appropriate to allow timely decisions regarding required disclosure.
In connection with the preparation of this Annual Report, an evaluation was performed under the supervision and with the participation of our management, including our Chief Executive Officer and Chief Financial Officer, of the effectiveness of our disclosure controls and procedures as of December 29, 2023. Based on that evaluation, our Chief Executive Officer and Chief Financial Officer concluded that our disclosure controls and procedures were effective, at a reasonable assurance level, as of December 29, 2023.
Management’s Report on Internal Control Over Financial Reporting
Our management is responsible for establishing and maintaining adequate internal control over financial reporting (as defined in Rule 13a-15(f) under the Securities Exchange Act of 1934, as amended). Internal control over financial reporting is a process to provide reasonable assurance regarding the reliability of our financial reporting for external purposes in accordance with accounting principles generally accepted in the United States. Because of its inherent limitations, internal control over financial reporting is not intended to provide absolute assurance that a misstatement of our financial statements would be prevented or detected. Our management, with the participation of our Chief Executive Officer and Chief Financial Officer, assessed the effectiveness of our internal control over financial reporting as of December 29, 2023. In making this assessment, our management used the criteria set forth by the Committee of Sponsoring Organizations of the Treadway Commission (COSO) in Internal Control—Integrated Framework (2013 Framework). Our management concluded that, as of December 29, 2023, our internal control over financial reporting was effective based on these criteria.
Report of Independent Registered Public Accounting Firm
Crowe LLP, the independent registered public accounting firm that audited the fiscal year 2023 consolidated financial statements included in this Annual Report on Form 10-K, has issued an attestation report on the effectiveness of our internal control over financial reporting as of December 29, 2023, which is included herein.
Changes in Internal Controls
There have been no changes in our internal control over financial reporting during the quarter ended December 29, 2023 that have materially affected, or are reasonably likely to materially affect, our internal control over financial reporting.
103
ITEM 9B. OTHER INFORMATION
ITEM 9C. DISCLOSURE REGARDING FOREIGN JURISDICTIONS THAT PREVENT INSPECTIONS
None.
104
PART III
ITEM 10. DIRECTORS, EXECUTIVE OFFICERS AND CORPORATE GOVERNANCE
Directors
The following provides information about each of our directors, including his or her age, Board leadership roles held, and business experience during at least the past five years, including the skills and qualifications that led to our conclusion that each such person should serve as one of our directors. We also indicate the name of any other public company for which each director currently serves as a director or served as a director during the past five years. Each of our directors will hold office until the 2024 annual meeting of stockholders and until his or her successor has been elected and qualified, or until his or her earlier resignation or removal.
Dr. Thomas D. Brisbin | Chairman | Director Since 2007 | ||
Experiences ◾ Director since 2007. Chairman since November 2016. CEO from April 2007 to December 2023. President from April 2007 to November 2016 ◾ Vice President and Consultant of AECOM Technology Corporation from 2004 to 2007 ◾ Chief Operating Officer and Executive VP at Tetra Tech, Inc. from 1999 to 2004 ◾ Co-founder and President of PRC Environmental Management, Inc. from 1978 to 1995 ◾ Research Associate at Argonne National Laboratory and Adjunct Professor - Illinois Institute of Technology (IIT) prior to PRC | |||
| |||
Age: 71 Board Committees: None. | Skills and Qualifications Senior leadership; industry & technical experience; business development and M&A; financial sophistication; talent management & compensation; governance & risk oversight ◾ B.S. Northern Illinois University. Ph.D. Environmental Engineering Illinois State Technology ◾ Completed Harvard Business School's Advanced Management Program | ||

105
Michael A. Bieber | President and Chief Executive Officer | Director Since 2023 | ||
Experiences ◾ CEO and Director since December 2023. President since November 2016. Senior Vice President, Corporate Development from 2014 to 2016 ◾ Vice President and other leadership roles at Tetra Tech, Inc. including managing mergers & acquisitions, investor relations, business development, and communications from 1996 to 2014 ◾ Strategic business consultant at CRC, Inc. to large defense, infrastructure, and environmental firms from 1995 to 1996 ◾ Project manager and engineer on government nuclear and commercial environmental projects at IT Corporation (now CB&I) from 1990 to 1995 | |||
| |||
Age: 55 | Skills and Qualifications | ||
Senior leadership; industry & technical experience; business development and M&A; financial sophistication; talent management & compensation; governance & risk oversight ◾ B.S. Civil Engineering from the Tennessee Technological University | |||
Board Committees: | |||

Steven A. Cohen | Independent | Director Since 2015 | ||
Experiences ◾ Senior Vice Dean and Chief Operating Officer of the School of Professional Studies at Columbia University (CU). Directs CU's Master of Sustainability Management Program. Professor in the Practice of Public Affairs at CU's School of International and Public Affairs. Director of CU's Master of Public Administration Program in Environmental Science and Policy ◾ Consultant to U.S. Environmental Protection Agency for past three decades, most recently from 2005-2010 ◾ Served on the U.S. Environmental Protection Agency’s Advisory Council on environmental Policy and Technology from 2001-2004 ◾ Director of Columbia's Graduate Program in Public Policy and Administration from 1985 to 1998 ◾ Former policy analyst for U.S. Environmental Protection Agency before joining CU in 1981 | |||
| |||
Age: 70 | Skills and Qualifications | ||
Senior leadership; industry & technical expertise; client regulatory; business development and M&A; financial sophistication; governance & risk oversight ◾ B.A. Political Science from Franklin College; M.A. Political Science from University of New York at Buffalo (SUNY-Buffalo) ◾ Ph.D. Political Science from SUNY-Buffalo | |||
Board Committees: | |||

106
Cynthia A. Downes | Independent | Director Since 2021 | ||
Experiences ◾ President and CEO of Fide Professional Services, which she founded in 2017 ◾ Chief Financial Officer of Constant and Associates, Inc. from 2020 to 2022 ◾ Accounting & Finance leadership consulting services for Guidehouse, a $1B+ consulting firm, from 2018 to 2019 ◾ Executive Vice President, Chief Financial Officer and Treasurer at Versar, Inc. (NYSE:VSR) from 2011 to 2017 ◾ Vice President and Chief Financial Officer of Environmental Design International Inc. from 2009 to 2011 and Vice President of Finance of GDI Advanced Protection Solutions from 2008 to 2009 ◾ Previously spent 15 years at Tetra Tech, Inc. (Nasdaq:TTEK), ultimately serving as Vice President and Chief Financial Officer of its subsidiary, Tetra Tech, EM Inc. ◾ Current member of the Board of Trustees and Chair of the Audit Committee of Riverside Research | |||
| |||
Age: 63 | Skills and Qualifications | ||
Senior leadership; industry & technical expertise; business development and M&A; financial sophistication; governance & risk oversight ◾ Active CPA and member of the American Institute of Certified Public Accountants ◾ B.S. Accounting and Business Management Purdue University ◾ M.B.A. Northwestern University | |||
Board Committees: Chairperson, Audit Committee; Member, Compensation Committee | |||

Vice Admiral Dennis V. McGinn | Independent | Director Since 2017 | ||
Experiences ◾ Retired as Vice Admiral of United States Navy after 35 years. Deputy Chief of Naval Operations for Warfare Requirements and Programs. Previously commanded United States Third Fleet ◾ Assistant Secretary of the Navy for Energy, Installations, and Environment from September 2013 – January 2017 ◾ Former President of the American Council on Renewable Energy ◾ Past member of the Steering Committee of the Energy Future Coalition, past member of the U.S. Energy Security Council; and past member of the Bipartisan Center Energy Board ◾ Past Co-Chairman of the CAN Military Advisory Board ◾ Prior International Senior Fellow at the Rocky Mountain Institute ◾ Member of the Board of Directors at Electric Power Research Institute ◾ Member of the Board of Directors at Customer First Renewables | |||
| |||
Age: 78 | Skills and Qualifications | ||
Senior leadership; industry & technical expertise; client regulatory; business development and M&A; talent management & compensation; governance & risk oversight; innovation & technology ◾ B.S. Naval Engineering from the U.S. Naval Academy ◾ Participant, National Security Program at Harvard University's Kennedy School | |||
Board Committees: Chairperson, Compensation Committee; Member, Nominating & Corporate Governance Committee; Member, Strategy, Mergers and Acquisitions Committee | |||

107
Wanda K. Reder | Independent | Director Since 2021 | ||
Experiences ◾ President and Chief Executive Officer of Grid-X Partners, LLC since 2018 ◾ Chair of the Electricity Advisory Committee of the U.S. Department of Energy, member of the Finance Committee of the National Academy of Engineering and member of the board of directors and the Strategy Committee of TechPro Power Group Inc. ◾ Previously spent 14 years, from 2004 to 2018, at S&C Electric Company, ultimately serving as Chief Strategy Officer ◾ Vice President of Asset Management from 2003 to 2004 and Vice President of Engineering & System Planning from 2001 to 2003 of Exelon Energy Delivery ◾ Prior Vice President, Energy Sector of Davies Consulting, Inc. | |||
| |||
Age: 59 | Skills and Qualifications | ||
Senior leadership; industry & technical expertise; client regulatory; business development and M&A; financial sophistication; talent management & compensation; innovation & technology ◾ Member of the National Academy of Engineering and Fellow of the Institute of Electrical and Electronics Engineers (IEEE) ◾ B.S. Engineering South Dakota State University ◾ M.B.A. University of St. Thomas | |||
Board Committees: Member, Audit Committee; Member, Compensation Committee; Member, Nominating & Corporate Governance Committee | |||

Mohammad Shahidehpour | Independent | Director Since 2015 | ||
Experiences ◾ Bodine Chair Professor in the Electrical and Computer Engineering Department at IIT. Director of Robert W. Galvin Center for Electricity Innovation. University professor for over 40 years, including faculty member at IIT since 1983 and recipient of IIT's Excellence in Teaching Award ◾ Former IIT Research Vice-President overseeing $80M in annual budget and over 200 technical projects ◾ Principal investigator of over $60 million in grants and contracts related to electricity and modernization technological advances, mostly funded by government agencies such as the U.S. Department of Energy and U.S. Department of Defense ◾ Founding chair of the IEEE Great Lakes Symposium on Smart Grid and the New Energy Economy ◾ Editor-in-Chief of IEEE Transactions on Smart Grid Journal since 2009 ◾ Elected Member of National Academy of Engineering in the U.S. ◾ Keynote speaker in 20 International Conferences since 2007 and counseled governments on electricity and grid modernization bills globally | |||
| |||
Age: 68 | Skills and Qualifications | ||
Senior leadership; industry & technical expertise; business development and M&A; talent management & compensation; governance & risk oversight, innovation & technology ◾ IEEE Distinguished Lecturer; Delivered over 100 invited lectures on electricity restructuring and smart grid issues ◾ Author of six books and 400 technical papers on electric power systems ◾ B.S. Electrical Engineering from Iran's Sharif University of Technology; M.S. in Electrical in Engineering; Ph.D. from the University of Missouri | |||
Board Committees: | |||

108
Board Committees
The Board has four standing committees: the Audit Committee (“AC”), the Compensation Committee (“CC”), the Nominating & Corporate Governance Committee (“NCGC”), and the Strategy, Mergers & Acquisitions Committee (“SMAC”). Each of our Board committees has a separate written charter that describes its purposes, membership, meeting structure, authority, and responsibilities. These charters, which may be found in the Corporate Governance section of our website at ir.willdangroup.com/corporate-governance, are reviewed annually by the respective committee, with any recommended changes adopted upon approval by our Board.
Each of these committees regularly reports to the Board as a whole. The following summaries identify the members of each committee as of March 7, 2024. The composition of each committee may change from time to time.
Audit Committee | ||||
Meetings in FY 2023: | 5 | Average Attendance in FY 2023: | 100% | |
Chair: | ||
Cynthia A. Downes | ◾ Oversee the integrity of the Company’s financial statements and financial reporting | |
Members: | ◾ Oversee compliance with legal and regulatory requirements | |
Steven A. Cohen | ||
◾ Discuss policies with respect to risk assessment, monitoring and mitigation with management and independent auditor | ||
All members satisfy the audit committee experience and independence standards required by the Nasdaq Rules and the Exchange Act and have been determined to be financially literate in accordance with the Nasdaq Rules. | ◾ Review qualifications and independence of the Company’s independent registered public accounting firm | |
◾ Review performance of the Company’s internal reporting and audit functions | ||
Under applicable SEC regulations, Ms. Downes has been determined to be an "audit committee financial expert". | ◾ Oversee the Company’s disclosures controls and procedures and system of internal controls regarding finance, accounting, legal compliance and ethics | |
◾ Retain and oversee the independent auditor and review and approve the scope of the audit conducted by the independent auditor |
109
Compensation Committee | ||||
Meetings in FY 2023: | 6 | Average Attendance in FY 2023: | 96% | |
Chair: | ||
Vice Admiral Dennis V. McGinn | ◾ Produce an annual report on executive compensation for inclusion in the Company’s proxy statement, if and as required by applicable rules and regulations ◾ Review, evaluate and make recommendations to the full Board with respect to management’s proposals regarding the Company’s overall compensation policies, and recommend performance-based incentives that support and reinforce the Company’s long-term strategic goals, organization objectives and stockholder interests ◾ Annually review and approve objectives relevant to the Chief Executive Officer’s compensation, evaluate the Chief Executive Officer’s performance in light of those objectives and set the Chief Executive Officer’s compensation level based on this evaluation | |
Members: | ◾ Consider and approve the selection, retention and remuneration arrangements for senior executive officers and establish, review and approve compensation plans in which any executive officer is eligible to participate | |
All members satisfy the independence standards required by the Nasdaq Rules and Exchange Act. | ◾ Make recommendations to the Board with respect to the Company’s incentive-compensation plans and equity-based compensation plans and approve for submission to stockholders all new stock option and equity compensation plans, including amendments or supplements thereto | |
◾ Administer the Company’s 2008 Plan, 2006 Stock Incentive Plan (the “2006 Plan”) and the ESPP | ||
All members qualify as "nonemployee directors" under Rule 16b-3 of the Securities Exchange Act of 1934, as amended. | ||
◾ Authorized to retain and terminate any compensation consultant engaged to assist in the evaluation of the compensation of our senior executive officers including all NEOs (as defined below) | ||
Nominating & Corporate Governance Committee | ||||
Meetings in FY 2023: | 6 | Average Attendance in FY 2023: | 96% | |
Chair: | ||
Mohammad Shahidehpour | ◾ Evaluate the size and composition of the Board, review and develop criteria for Board membership, and evaluate the independence of existing and prospective directors | |
Members: Vice Admiral Dennis V. McGinn Wanda K. Reder | ◾ Actively seek and evaluate qualified individuals to become new directors as needed, establish procedures to solicit, review and recommend to the Board potential director nominees proposed by stockholders and recommend to the Board the director nominees for the annual meeting of stockholders and any special meeting at which directors are elected ◾ Review the suitability of each Board member for continued service when his or her term expires and when he or she has a significant change in status ◾ Take diversity considerations into account when identifing director candidates | |
All members satisfy the independence standards required by the Nasdaq Rules and Exchange Act | ◾ Evaluate the nature, structure and operations (including authority to delegate to subcommittees) of other Board committees | |
◾ Periodically review and, in the NCGC’s discretion, recommend to the Board changes to, the Company’s certificate of incorporation, bylaws, corporate governance policies and practices, and other present or future policies of the Company as they relate to corporate governance matters | ||
110
Strategy, Mergers and Acquisitions Committee | ||||
Meetings in FY 2023: | 4 | Average Attendance in FY 2023: | 100% | |
Chair: | ||
Steven A. Cohen | ◾ Review with management, on a timely basis, significant financial matters of the Company and its subsidiaries, including matters relating to the Company’s capitalization, dividend policy and practices, credit ratings, cash flows, borrowing activities, and investments including mergers and acquisitions | |
◾ Review and recommend to the Board or take actions on behalf of the Board relating to the Company’s financial and strategic plans | ||
Members: | ||
◾ In consultation with the AC, as appropriate, review periodically the Company’s risk management strategies | ||
◾ Be available to management as needed regarding various matters such as reviewing the relationships with the Company’s principal lending institutions and investment and strategic advisors |
Management
The following table sets forth the names, ages, and positions of our current executive officers, as of March 7, 2024:
|
|
| Years in |
| Years at | |||
Name | Age | Title | Position @ | Willdan @ | ||||
FYE 2023 | FYE 2023 | |||||||
Michael A. Bieber |
| 55 |
| President and Chief Executive Officer |
| 7 (a) |
| 9 |
Creighton K. Early |
| 71 |
| Executive Vice President and Chief Financial Officer |
| 3 |
| 8 |
Micah H. Chen |
| 52 |
| Executive Vice President and General Counsel |
| 6 |
| 7 |
| (a) | Mr. Bieber became Chief Executive Officer and a Director on December 30, 2023. |
Biographical information concerning Mr. Bieber is set forth above under the caption “Directors”.
Creighton K. Early was appointed Vice President and Chief Financial Officer, in April 2021, and was appointed Executive Vice President and Chief Financial Officer in December 2023. Mr. Early previously served as Executive Vice President of Willdan Energy Solutions, a subsidiary of the Company, and as Chief Financial Officer of various subsidiaries of the Company from December 2015 until his appointment to Vice President and Chief Financial Officer of the Company. Mr. Early also served as a member of the Board of Directors of H.W. Lochner, Inc., a private company, from April 2016 until H.W. Lochner, Inc. was sold in July 2021, and served as the Chairman of its audit committee from February 2021 to July 2021. Prior to joining us, Mr. Early served as Chief Financial Officer of both public and privately held companies, including three years with Infrastructure & Energy Alternatives LLC, a renewable energy construction company. He also previously spent 14 years at Earth Tech, Inc., a multinational infrastructure company, including serving as its Chief Financial Officer and as the President of its Global Water Management Division. Mr. Early holds a B.S. in Business Administration from Ohio State University and an M.B.A. from the University of Michigan.
Micah H. Chen was appointed our General Counsel in March 2018, and was appointed Executive Vice President and General counsel in December 2023. Previously, Mr. Chen was our Legal Counsel from July 2017 to March 2018. Prior to joining us, Mr. Chen held various management positions at Aon Corporation’s Construction Services Group for nearly 10 years. From January 2016 to July 2017, Mr. Chen served as Managing Director and Senior Vice President of Aon Corporation. In this role, Mr. Chen was responsible for the group’s Account Executive practice for the West Region. From November 2008 to January 2016, Mr. Chen served as Senior Vice President of Aon Corporation. In this role, he provided risk management consultation and assisted in the evaluation and development of comprehensive risk management programs to many Top 100 Engineering-News Record clients, general contractors and multibillion-dollar
111
commercial construction projects. Mr. Chen received his B.A. in International Economics from the University of California, Los Angeles and his J.D. from Western State University, School of Law.
Material Litigation
There are currently no ongoing material proceedings in which any director or executive officer is a party adverse to the Company or any of its subsidiaries, or in which any director or executive officer has a material interest adverse to the Company or any of its subsidiaries, and no such event that would be material to an evaluation of the ability or integrity of any director or executive officer has occurred in the past ten years.
Code of Ethics
The Company expects that all of its directors, officers and employees will maintain a high level of integrity in their dealings with and on behalf of the Company and will act in the best interests of the Company. The Company has adopted a Code of Ethical Conduct, which provides principles of conduct and ethics for the Company’s directors, officers and employees, including employees of the Company’s subsidiaries. This Code complies with the requirements of the Sarbanes-Oxley Act of 2002 and the Nasdaq Rules. This Code of Ethical Conduct is available on the Company’s website at www.willdan.com under “Investors—Corporate Governance—Governance Documents” and is also available in print, without charge, to any stockholder who requests a copy by writing to our Secretary at 2401 East Katella Avenue, Suite 300, Anaheim, California 92806. To the extent required by rules adopted by the SEC and the Nasdaq Stock Market, we intend to promptly disclose future amendments to certain provisions of the code, or waivers of such provisions granted to executive officers and directors on our website at www.willdan.com under “Investors—Corporate Governance.” In 2021, we updated our Code of Ethical Conduct whereby all employees must review and sign on an annual basis.
Section 16(a) Reports
Section 16(a) of the Exchange Act requires our executive officers and directors, and persons who own more than 10% of a registered class of our equity securities, to file reports of ownership and changes in ownership with the SEC and the Nasdaq Global Market. Officers, directors and greater than 10% stockholders are required by the SEC’s regulations to furnish us with copies of all Section 16(a) forms they file. Based solely on our review of the copies of such reports furnished to us, all Section 16(a) filing requirements applicable to our executive officers, directors, and greater than 10% beneficial owners were timely satisfied in fiscal 2023.
112
ITEM 11. EXECUTIVE COMPENSATION
Executive Officer Compensation
Our CC designs our executive compensation program to motivate our executives to execute our business strategies and deliver long-term stockholder value. We pay for performance with compensation dependent on our achievement of financial and business performance objectives while aligning our executive leadership team’s interests to create value for our stockholders.
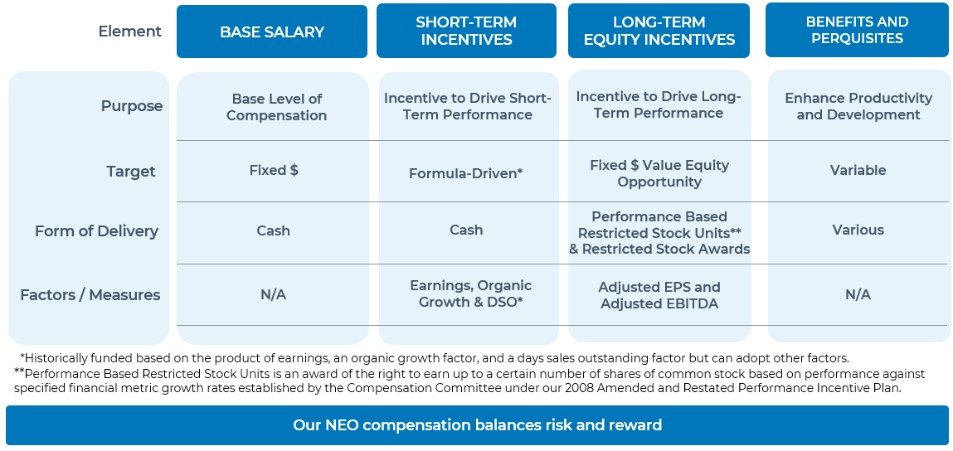
Executive Officer Group Compensation Components(1)
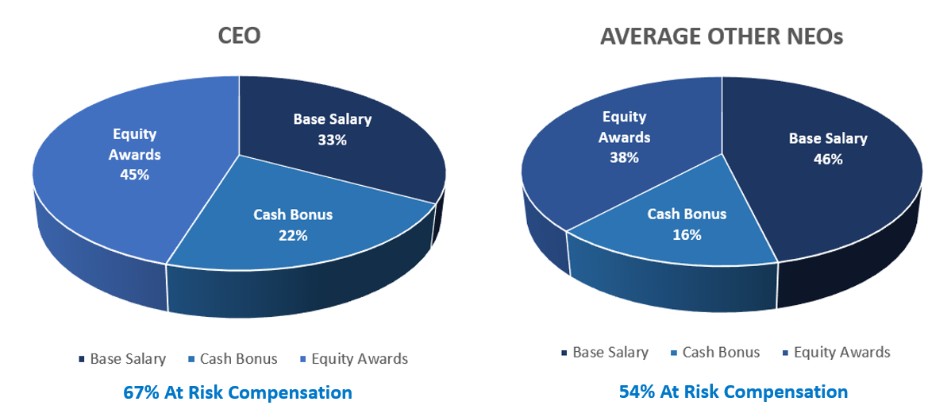
| (1) | Based on active NEOs as of fiscal year-end 2023. See the Compensation Discussion and Analysis (“CD&A”) section below for a description of the manner in which these amounts are determined. |
113
Compensation Highlights
Underlying our compensation program is an emphasis on sound governance practices. These practices are summarized below and described in further detail in the CD&A section below.
We Do | |||
| Structure a significant portion of compensation to be at risk and tied to Company performance |
| Include clawback provisions for cash bonuses, and PBRSUs |
| Perform annual say-on-pay advisory vote for stockholders |
| Minimum vesting requirements |
| Review officer compensation against our peer group |
| Deliver pay that is aligned with performance (below target for performance below target and above target for performance above target) |
| Maintain stock ownership goals for management and all officers and non-employee directors |
| Solicit feedback on executive compensation through stockholder engagement |
| Utilize an independent external compensation consultant every two years whose independence is reviewed by CC | ||


We Do Not | |||
| Accelerate outstanding equity awards due to voluntary termination, other than retirement |
| Re-price or exchange outstanding options and PBRSUs |
| Provide gross-ups to cover tax liabilities associated with executive perquisites |
| Grant stock options with an exercise price less than fair market value on the date of grant |
| Allow directors, officers or employees to hedge or pledge company stock |
| Promise multiyear guarantees for bonus payouts or salary increases |
| Pay out dividends or dividend equivalents on unvested equity awards |
| Provide excise tax gross-up payments in connection with change in control severance benefits |


Director Compensation
The following table provides information concerning the compensation for services of our nonemployee directors during FY 2023. Dr. Brisbin is a Named Executive Officer for FY 2023 and his compensation is presented below under “Executive Compensation” in the Summary Compensation Table and related explanatory tables. Dr. Brisbin was not entitled to additional compensation for his services as a director for FY 2023.
On December 8, 2023, Dr. Brisbin informed the Board of his intention to retire and resign as Chief Executive Officer of the Company, effective December 29, 2023. Dr. Brisbin continued his service as Chairman of the Board after December 29, 2023.
114
In general, the majority of the compensation provided to nonemployee directors is delivered in equity to align director interests with those of our stockholders.
Fees Earned or | Stock | Option | All Other | |||||||
Name |
| Paid in Cash ($) |
| Awards (1), (2) ($) |
| Awards ($) |
| Compensation ($) |
| Totals ($) |
Steven A. Cohen |
| 85,000 |
| 70,015 |
| — |
| — |
| 155,015 |
Cynthia A. Downes |
| 68,500 |
| 70,015 |
| — |
| — |
| 138,515 |
Dennis V. McGinn | 70,000 |
| 70,015 |
| — |
| — | 140,015 | ||
Wanda K. Reder |
| 58,000 |
| 70,015 |
| — |
| — | 128,015 | |
Keith W. Renken(3) |
| 52,000 |
| 70,015 |
| — |
| — | 122,015 | |
Mohammad Shahidehpour |
| 70,000 |
| 70,015 |
| — |
| — | 140,015 |
| (1) | The amounts reported under “Stock Awards” above represent the aggregate grant date fair value of restricted stock awards granted to Non-Employee Directors during fiscal 2023 (disregarding any estimate of forfeitures related to service-based vesting conditions). For a discussion of the assumptions and methodologies used to calculate the amounts reported in this column, please see the discussion of restricted stock awards contained in Part II, Item 8, Note 10, “Shareholders’ Equity”, to the Notes of Consolidated Financial Statements included in this Annual Report on Form 10-K. |
| (2) | As of December 29, 2023, all Non-Employee Directors each held 4,880 shares of restricted stock, of which (i) 1,295 shares of restricted stock vest on June 9, 2024 and (ii) 3,585 shares of restricted stock vest in two substantially equal installments on each of June 7, 2024 and June 7, 2025. |
| (3) | Mr. Renken retired from his position as Director effective March 5, 2024. |
Annual Retainer and Meeting Fees
The following table sets forth the schedule of annual retainers and meeting fees for each Non-Employee Director in effect during FY 2023.
| Fiscal Year | ||
Type of Fee |
| 2023 | |
Annual Board Retainer | $ | 46,000 | |
Additional Annual Retainer to Lead Independent Director | $ | 15,000 | |
Additional Annual Retainer to Chair of Audit Committee | $ | 16,500 | |
Additional Annual Retainer to Chair of Compensation Committee | $ | 12,000 | |
Additional Annual Retainer to Chair of Strategy, Mergers and Acquisitions Committee | $ | 12,000 | |
Additional Annual Retainer to Chair of Nominating and Governance Committee | $ | 12,000 | |
Additional Annual Retainer to Member of Audit Committee | $ | 6,000 | |
Additional Annual Retainer to Member of Compensation Committee | $ | 6,000 | |
Additional Annual Retainer to Member of Strategy, Mergers and Acquisitions Committee | $ | 6,000 | |
Additional Annual Retainer to Member of Nominating and Governance Committee | $ | 6,000 | |
Compensation for Non-Employee Directors during FY 2023 generally consisted of an annual retainer, fees for work related to board committees and a restricted stock grant award. All Non-Employee Directors are also reimbursed for out-of-pocket expenses they incur serving as directors.
Restricted Stock Awards
In June 2023, Messrs. Cohen, McGinn, Renken, and Shahidehpour and Mss. Downes and Reder were granted a restricted stock award of 3,585 shares under the 2008 Plan. Each restricted stock award granted to our Non-Employee Directors in FY 2023 is subject to a two year vesting schedule, with 50% of the award vesting on each of the first and second anniversaries of the grant date, subject in each case to the Non-Employee Director’s continued service through the applicable vesting date.
115
Executive Compensation
Compensation Discussion and Analysis
This CD&A and compensation tables and disclosures that follow focus primarily on compensation awarded to, earned by, or paid to our Named Executive Officers identified in the “Summary Compensation Table,” whom we refer to in this section as our “NEOs.” This section also describes the role and involvement of various parties in our executive compensation analysis and decisions, and provides a discussion of the process and rationale for the decisions of our CC to compensate our NEOs with specific types and amounts of compensation.
Chief Executive Officer Compensation Components
The following comparisons, derived from our compensation consultant’s analysis of compensation of similarly situated executives at our peer group companies (described in the Compensation Peer Group section below), show the various elements of compensation our CEO compensation mix achieved during fiscal 2023 compared to the average compensation mix achieved by the peer group:
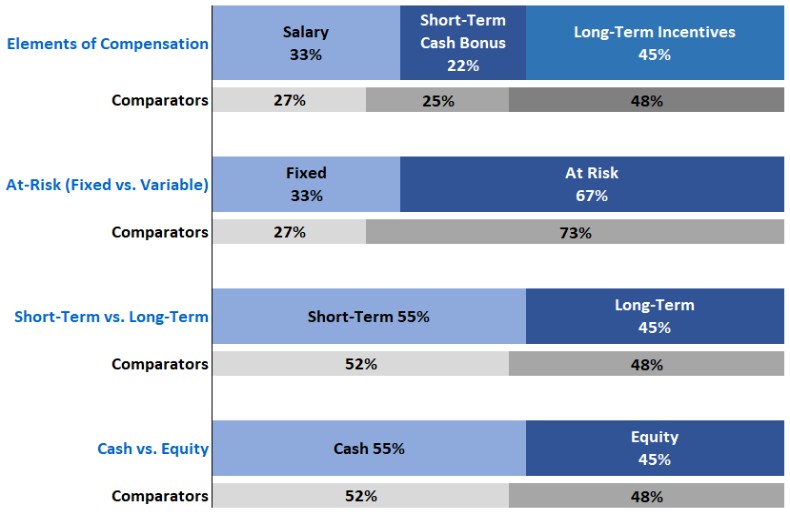
116
2023 Named Executive Officers
Our NEOs include our principal executive officer during fiscal 2023, our principal financial officer during fiscal 2023, and our three other most highly compensated executive officers at the end of fiscal 2023:
Name |
| Age |
| Title |
Thomas D. Brisbin(1) |
| 71 |
| Chairman of the Board and Chief Executive Officer |
Michael A. Bieber(2) |
| 55 |
| President |
Creighton K. Early |
| 71 |
| Vice President and Chief Financial Officer |
Micah H. Chen | 52 | General Counsel | ||
Paul M. Whitelaw(3) | 52 | Former Senior Vice President, Business Development |
| (1) | Dr. Brisbin retired from his position as Chief Executive Officer effective December 29, 2023, but continues to serve as Chairman of the Board. |
| (2) | Mr. Bieber was appointed Chief Executive Officer on December 30, 2023. |
| (3) | Mr. Whitelaw resigned from his position as Senior Vice President, Business Development, effective February 1, 2023. |
Fiscal 2023 Performance Highlights
Gross Revenue - $510.1 Million Net Income (Loss) - $10.9 Million Adjusted EBITDA $45.7 Million Cash from Operations - $39.2 Million | ||
Willdan’s record-setting success in fiscal 2023 was driven by the growth in the energy transition market and expanding revenue in municipal engineering and financial services. In fiscal 2023, we delivered organic year over year revenue growth of 18.9% and our common stock closed at $21.50 per share at the end of fiscal 2023, an increase of 20.4% compared to $17.85 at the end of fiscal 2022.
Willdan serves one of the most dynamic market segments in the world at one of the most exciting times. Demand for a cleaner, low carbon energy cycle is transforming the electric grid, building design and management, industrial production and transportation networks. Willdan helps its clients evaluate new technical advances and implement sustainable cost-effective solutions to advance and transform the delivery and consumption of energy and other government infrastructure. Willdan also has a long history of serving municipal governments in planning and managing the energy transition and other infrastructure management changes.
2023 Say-on-Pay Vote and Executive Compensation Program
Who We Engaged During 2023 Overall, we contacted 39 investors, representing over 65% of our shares of common stock outstanding as of the end of fiscal year 2023. | ||
117
We value our stockholders’ opinions about our governance policies and practices and actively solicit input from our stockholders. Through regular ongoing dialogue with stockholders and potential investors throughout the year, the proxy season, and sustainability reporting, we proactively engage in stockholder outreach. In addition to senior management, members of our Compensation Committee are available for consultation with our major shareholders. We recognize the value that stockholders’ feedback provides, and we continue regular stockholder engagement activities to gain their perspective.
Throughout 2023, our CEO, President, CFO, and VP of Investor Relations contacted 40 investors, representing over 65% of our shares of common stock outstanding as of the end of fiscal year 2023, as well as potential holders of our equity. In addition to senior management, members of our CC engaged with stockholders.
TOPICS WE COVERED Corporate Governance Executive Compensation Board Composition Financial Performance ESG/Sustainability | ||
At the 2023 Annual Meeting, approximately 44% of the votes cast supported our fiscal year 2022 executive compensation. As a result of such vote on our fiscal 2022 executive compensation and other stockholder feedback received in 2023, among other changes, we discontinued accelerating the vesting of all outstanding time-vesting equity awards and performance-based equity awards upon voluntary resignation, other than retirement. We also implemented a three-year vesting period for time-based equity awards, we amended our clawback policy, and we amended our Company bylaws to provide for, among other things, additional advance notice for information and disclosure requirements, other information requirements, adopt an exclusive forum, and adopted other updates.
The table below provides a recap of the actions taken as well as enhancements and additional disclosures implemented in direct response to stockholder concerns over the past several years.
Issue | Proxy Advisor and /or Stockholder Concerns | Stockholder Feedback | Actions Implemented |
|---|---|---|---|
Clawback Policies | No clawback policy disclosed; clawback was not applicable to both cash and equity bonus compensation | Governance best practices include disclosure of policy and clawback policy that gives company ability to claw back both cash and equity | In 2020, disclosed rigorous equity clawback policy and adopted cash bonus clawback policy due to shareholder feedback |
Annual Incentive Plan | Company is silent on metrics, goals and payout formula related to incentive plan and reasoning for changes to payout levels | Provide additional disclosure on the short-term compensation metrics to explain inconsistent payouts and reasoning for changes in annual payout levels | Disclosed metrics, goals, bonus pool payout formula in 2020 to provide rigor linking pay with performance |
118
Issue | Proxy Advisor and /or Stockholder Concerns | Stockholder Feedback | Actions Implemented |
|---|---|---|---|
Annual Incentive Plan | No stock-holding policy for CEO | Implement a stock-holding policy for CEO | Adopted a Stock Holding Policy in 2021 that requires our CEO to hold 100% of net shares (i.e. shares remaining after payment of taxes) of our common stock acquired pursuant to the exercise of stock options or vesting of restricted stock until the earlier of twelve months following the exercise of stock options or vesting of restricted shares or the CEO’s termination of employment |
Change in Control | No rigorous change in control policy disclosed | Improve change in control disclosures | Disclosed our change in control policies and practices in 2020 |
Stock Ownership Guidelines | No stock ownership requirements, including executive and non-employee directors | Encourage the Company to require stock ownership guidelines for executive management and non-employee directors of the Company | In 2020, the CC adopted management and non-employee director stock ownership guidelines with compliance to be within three years. Guideline includes 5x of base salary CEO; 3x base salary President; 1x base salary remaining Section 16 Officers; and $115,000 minimum value in stock holdings for non-employee directors |
Peer Group Disclosure | No compensation peer group disclosed | Enhance disclosure around compensation peer group selected for compensation and the factors considered in their selection | In 2020, disclosed our compensation peer group which has been provided every two years by a third-party consultant hired by the CC |
Sustainability and Impact Reporting | No annual sustainability or impact report provided by the Company despite its core focus on providing energy savings and carbon mitigating measures | Provide sustainability metrics focused on environmental, social, and governance (“ESG”) factors | Published 2022 Sustainability Report in early 2023. See www.willdan.com under “Investors—Sustainability Report” |
119
Issue | Proxy Advisor and /or Stockholder Concerns | Stockholder Feedback | Actions Implemented |
|---|---|---|---|
PBRSU Metrics | No performance metric in PBRSU program related to benchmarking peer companies | Introduce an additional metric related to Company performance in relation to peer group | In 2022, introduced a new performance metric to the PBRSU program - Relative Total Shareholder Return which benchmarks peer group performance |
Acceleration of Equity Vesting for NEOs Upon Voluntary Resignation | Recent history of accelerated vesting of all outstanding time-vested awards and performance-based awards at target of a NEO upon a resignation that was not clearly involuntary | Discontinue the practice of accelerating equity due to voluntary termination | In 2023, we discontinued accelerating the vesting of all outstanding time-vesting equity awards and performance-based equity awards upon voluntary resignation |
Single-Year Time-Based Equity Vesting Period | Time-based equity awards vest on a one-year period | Lengthen the vesting period of time-based equity awards to three years | In 2023, we implemented a three-year vesting period for time-based equity awards |
Company Bylaws | Update bylaws to reflect latest developments in Delaware corporate law and SEC rulemaking (e.g., universal proxy rules) | None | In 2023, we amended our bylaws to, among other things, update requirements under our advance notice provisions, add exclusive forum provisions and revise certain provisions for recent legislative and regulatory updates |
Clawback Policy | Clawback policy compliance with Nasdaq and Exchange Act standards | Adopt a more comprehensive clawback policy | In 2023, we adopted a new comprehensive clawback policy which complies with Section 10D of the Exchange Act, Rule 10D-1, and Nasdaq Listing Rule 5608 |
Combined Roles of Board Chairman and Chief Executive Officer | Board Chairman and Chief Executive Officer should preferably be separate individuals | Separate the roles | Effective December 2023, Board Chairman and Chief Executive Officer are separate individuals |
Incentive Compensation Recovery (Clawback) Policy
The Company has a comprehensive clawback policy applicable to both short-term cash-based performance bonuses and long-term equity-based compensation. On October 2, 2023, the Company amended and restated the existing clawback policy to comply with Section 10D of the Exchange Act, Rule 10D-1 promulgated thereunder, and Nasdaq Listing Rule 5608.
Our clawback policy states that, if there is an accounting restatement due to the material noncompliance of the Company with any financial reporting requirement under the securities laws, including any required accounting restatement to correct an error in previously issued financial statements that is material to the previously issued financial statements, or
120
that would result in a material misstatement if the error were corrected in the current period or left uncorrected in the current period, the Company must reasonably promptly recoup the full amount of any compensation that is granted, earned or vested based wholly or in part upon the attainment of a financial reporting measure received by a covered officer during the three completed fiscal years immediately preceding the accounting restatement date that exceeds the amount of incentive compensation that would have been received had such amount been determined based on the accounting restatement, computed without regard to any taxes paid (i.e., on a gross basis without regard to tax withholdings and other deductions). For any compensation plans or programs that take into account incentive compensation, the amount of recoverable incentive compensation includes, without limitation, the amount contributed to any notional account based on recoverable incentive compensation and any earnings to date on that notional amount. For any incentive compensation that is based on stock price or total stockholder return, where the recoverable incentive compensation is not subject to mathematical recalculation directly from the information in an accounting restatement, the administrator will determine the amount of recoverable incentive compensation based on a reasonable estimate of the effect of the accounting restatement on the stock price or total stockholder return upon which the incentive compensation was received.
The Company has not had any actions related to recovery of any erroneously awarded compensation during or after our last completed fiscal year.
Stock Ownership Guidelines and Holding Policy
In 2020, the CC adopted stock ownership guidelines for executives and non-employee directors to further align the interests of executives and directors with those of stockholders. All officers and non-employee directors have three years from taking their positions to comply with these guidelines. All executive officers and directors are currently in compliance with these guidelines as of March 7, 2024.
Position | Unit Measure | Factor | Years to Achieve Compliance | In Compliance as of 3/7/2024 |
CEO | Base Salary | 5x | 3 | Yes |
President | Base Salary | 3x | 3 | Yes |
Section 16 Officers | Base Salary | 1x | 3 | Yes |
Non-employee Directors | Minimum holding $115,000 in stock value | Not Applicable | By end of 3 years of service | Yes(1) |
| (1) | Excludes Ms. Downes and Ms. Reder, who have not yet reached three years of Board service |
Our Stock Holding Policy requires our CEO to hold 100% of net shares (i.e. shares remaining after payment of taxes) of our common stock acquired pursuant to the exercise of stock options or vesting of restricted stock until the earlier of twelve months following the exercise of stock options or vesting of restricted shares or the CEO’s termination of employment.
Executive Compensation Program Objectives and Philosophy
Executive pay leveraged more to performance Align executive’s pay with long term interests of | ||
Our executive compensation program’s primary objective is aligning our executives’ pay with the long-term interests of our stockholders. Cash bonuses and long-term equity incentives are the elements of our executive compensation program that are “at risk”, and are designed to reward performance and align with stockholders in creating long-term value.
121
Overall, we target to reward short and long-term financial, strategic and operational performance, while facilitating the Company’s need to attract, motivate, develop and retain highly-qualified executives who are critical to our long-term success.
Our executive compensation philosophy is to:
| ■ | Align the long-term interests of our executives with those of the stockholders; |
| ■ | Attract, motivate, reward, and retain the top contributors upon whom, in large part, our success depends; |
| ■ | Be competitive with compensation programs for companies of similar size and complexity with whom we compete for talent, including direct competitors; |
| ■ | Provide compensation based upon the short-term and long-term performance of both the individual executive and the Company; and |
| ■ | Strengthen the relationship between pay and performance by emphasizing variable, at-risk compensation that is dependent upon the successful achievement of specified corporate and individual goals. |
In structuring our executive compensation arrangements, our CC considers how each compensation element fits within our overall philosophy of long-term shareholder value. Our compensation program is comprised of three elements:
| ■ | Base Salary – primarily intended to attract and retain top contributors. We believe that in order to attract and retain top executives, we need to provide our executive officers with compensation levels that reward their continued service and are competitive; |
| ■ | Annual Cash Bonus – primarily intended to motivate the NEOs to achieve our short-term performance objectives; and |
| ■ | Long-Term Equity-Based Incentive Compensation – primarily intended to align our NEOs’ long-term interests with stockholders’ long-term interests. |
Our Annual Cash Bonus pool is generally formula-driven and has historically been funded based on the product of earnings, an organic growth factor, and a days sales outstanding factor. From time to time, the formula can adopt other qualitative factors to recognize changing goals and conditions. Certain of our business units may have unit-specific bonus pools based on earnings-related metrics for their unit only.
Bonus Pool = (25% of earnings > 6% of revenue) x (Organic Growth Factor) x (DSO Factor)
| ◾ | Earnings – expressed as the Company’s operating earnings before interest, taxes, depreciation and amortization, other non-cash or non-operating expenses, and bonus. |
| ◾ | Organic Growth Factor – expressed as organic revenue growth year-over-year. The organic growth factor is defined as one plus/minus 2x the organic growth rate. |
| ● | For example, if organic revenue growth is 20%, the organic growth factor would be 1+(2 x 0.2) = 1.40. If organic revenue growth rate was negative 20%, the organic growth rate factor would be 1+(2 x -0.2) = 0.60 |
| ◾ | Days Sales Outstanding (DSO) Factor – is calculated based on a mid-point of 70 days and is expressed as one minus the percentage lower or higher than 70 days. |
| ● | For example, if the DSO was 65 days, the DSO would be 1-((65-70)/70) = 1.07. If the DSO was 85 days, the DSO factor would be 1-((85-70)/70) = 0.79. |
Our long-term equity-based incentive plan permits us to award various types of incentive awards, including incentive or nonqualified options, stock appreciation rights, stock bonuses, restricted stock, stock units, performance stock, phantom stock, dividend equivalents and other forms of awards. Our CC determined to move away from its historical practice of granting only time-based equity awards and introduced the performance-based restricted stock units (“PBRSUs”) in 2018 in order to further align the interests of our executives with those of stockholders by strengthening the relationship between executive pay and our performance against critical performance metrics that we believe will drive value creation for our stockholders.
122
Starting with fiscal 2019, nearly all of the long-term equity incentive awards granted to our NEOs were granted in the form of PBRSUs, other than to Dr. Brisbin and Mr. Chen, who were also granted time-based long-term incentive awards in fiscal 2021. In fiscal 2022, in conjunction with Pearl Meyer’s 2022 study, we adopted Pearl Meyer’s recommendation that long-term equity awards should be comprised of a combination of performance-based and time-based equity awards in order to motivate and retain our key executives.
Consistent with prior years, the performance goals, which are established for purposes of measuring performance and dictate the vesting thresholds for performance-based equity awards, were pre-established and approved by the Board prior to the beginning of the performance period – that is, the goals for the performance-based equity awards granted in fiscal 2023 were based on a previously approved business plan. These goals are fixed and are not changed over the performance period of the award.
While they are employed with us, we provide our NEOs with retirement benefits under our 401(k) Plan, participation in our medical, dental and insurance programs and vacation and other holiday pay, all in accordance with the terms of such plans and programs in effect from time to time and substantially on the same terms as those generally offered to our other employees.
We also provide, in some cases, automobile allowances to our executive officers, including the NEOs.
Role of the Compensation Committee
Pursuant to its charter, the CC of our Board has the authority to determine the amount of compensation given to each of the NEOs. The CC implements our executive compensation philosophy, and is responsible for administering our equity compensation plans, including approving grants of awards under the plans. In performing its duties, the CC is authorized to consider the recommendations of our CEO when determining the compensation of the other NEOs. All of the members of the CC are independent directors.
The elements of our executive compensation program were each approved by the CC. None of the NEOs is a member of the CC or, except for recommendations made by our CEO with respect to the compensation of the other NEOs, had any role in determining the compensation of the NEOs.
The CC is authorized to retain and terminate any compensation consultant engaged to assist in the evaluation of the compensation of our senior executive officers (including all of the NEOs). In 2022, the CC hired Pearl Meyer to evaluate and compare the compensation practices for executive management and the Board. The CC was directly responsible for the appointment, compensation and oversight of Pearl Meyer and, at the time of their appointment, assessed the independence of Pearl Meyer pursuant to applicable SEC and Nasdaq Rules and concluded that no conflict of interest existed with respect to such consultant’s services to the CC. Pearl Meyer reported only to the CC and did not perform any other services for us.
Compensation Peer Group
In conjunction with their 2022 study, Pearl Meyer advised the CC regarding the construction of our customized compensation peer group. Our 2023 customized compensation peer group is provided in the table below.
COMPENSATION PEER GROUP | |
◾ American Superconductor Corporation ◾ Atlas Technical Consultants, Inc.* ◾ Bowman Consulting Group Ltd. ◾ C3.ai, Inc. ◾ Charah Solutions, Inc.* ◾ Exponent, Inc. ◾ FTC Solar, Inc. ◾ ICF International, Inc. | ◾ Limbach Holdings, Inc. ◾ Montrose Environmental Group, Inc. ◾ NV5 Global, Inc. ◾ Orion Energy Systems, Inc. ◾ RCM Technologies, Inc. ◾ Resources Connection, Inc. ◾ Stem, Inc. |
* Removed from our Compensation Peer Group at the time of their respective acquisition dates and delisting.
123
The CC then compared the compensation of Willdan’s executive management with similarly situated executives of those companies and used this comparative compensation information as a reference point when setting compensation levels for 2023. In setting compensation levels for 2023, our CC also considered each executive’s level of responsibility and performance for the overall operations of the Company, historical Company practices, long-term market trends, internal pay equity, expectations regarding the individual’s future contributions, our own performance and budget considerations.
Role of Shareholder Say-on-Pay Votes
Responsive to Stockholder Concerns and Feedback | ||
The Company annually offers stockholders the opportunity to cast an advisory vote on our executive compensation program. This annual vote is known as the “say-on-pay” proposal. At the 2023 Annual Meeting, approximately 44% of the votes cast supported our fiscal year 2022 executive compensation. We value our stockholders' opinions about our governance policies and practices, and we actively solicit input through our stockholder engagement activities that are described in detail above. As a direct result of stockholder feedback, we implemented several enhancements to our corporate governance and executive compensation program. We welcome feedback on our corporate governance program that this active and ongoing engagement with stockholders provides.
In 2019, our stockholders included their approval of the Board and management recommendation that we solicit a say-on-pay vote on an annual basis. Our Board has adopted a policy that is consistent with that preference and, accordingly, we are holding a say-on-pay vote at this annual general meeting. A “say-on-frequency” vote is required every six years, and as such, our next say-on-frequency vote will be in 2025.
Executive Compensation Program Elements
Base Salaries
We pay each NEO a base salary to provide each executive with a minimum, fixed level of cash compensation. Decisions regarding increases to base salaries are made at the discretion of our CC. In reviewing base salary levels for our NEOs, our CC primarily considers and assesses the following factors: the base salaries paid by our peer group companies to their similarly situated executives, each NEOs’ current base salary, their job responsibilities, leadership and experience, value to our Company and the recommendations of our CEO (other than with respect to his own compensation) and our President.
Named Executive Officer |
| Base Salary at end of FY 2023 |
|
| Base Salary at end of FY 2022 | |||
Thomas D. Brisbin(1) | $ | 505,003 | $ | 505,003 | ||||
Michael A. Bieber | $ | 440,003 | $ | 440,003 | ||||
Creighton K. Early | $ | 374,725 | $ | 325,000 | ||||
Micah H. Chen | $ | 341,074 | $ | 315,016 | ||||
Paul Whitelaw | $ | (2) | $ | 248,778 | ||||
| (1) | Dr. Brisbin retired from his position as Chief Executive Officer, effective December 29, 2023. |
| (2) | Mr. Whitelaw resigned from his position as Senior Vice President, Business Development, effective February 1, 2023. |
2023 Annual Bonuses
With the exception of Mr. Whitelaw, who resigned from his position as Senior Vice President, Business Development, effective February 1, 2023, we awarded performance-based cash bonuses to all of our NEO’s in 2023. The compensation bonus pool is generally formula-driven and is outlined above. The CC determined the amount of each executive’s bonus at its discretion, based on peer group comparable data available, past practices and individual performance.
In determining the amount of each executive’s 2023 bonus, the CC used third-party benchmarking studies and primarily considered bonus pool size limitations, each executive’s level of responsibility and performance, contribution to the success of the business, strategic impact, retention risk, internal pay equity, and the recommendations of our CEO (other than with respect to his own compensation) in allocating the bonus pool. The CC also evaluated each executive’s individual performance during 2023 (with input from our CEO for the other NEOs).
124
2023 Long-Term Equity Awards
In determining the level of awards granted to each of the NEOs, our CC primarily took into account the executive’s level of responsibility and performance for the overall operations of the Company, internal pay equity, historical Company practices, each executive’s performance, and budget considerations. Furthermore, in conjunction with Pearl Meyer’s 2022 study, the Company adopted Pearl Meyer’s recommendation that long-term equity awards should be comprised of a combination of performance-based and time-based equity awards. The CC also considered the compensation paid by our peer group companies described above to similarly situated executives.
Our 2023 long-term equity design is comprised of 55% performance-based equity awards and 45% time-based equity awards. Our 2023 PBRSU design is a three-year plan where (i) 50% of each award will be earned based upon our Adjusted EBITDA performance with respect to three one-year performance periods (“Adjusted EBITDA Units”), and (ii) the remaining 50% of each award will be earned based upon our Adjusted Diluted Earnings per Share performance with respect to three one-year performance periods (“Adjusted Diluted EPS Units”), generally subject to the executive’s continued employment through the end of the three-year period (each such one-year period, a “Performance Period”, and collectively, the “Performance Periods”). The number of PBRSUs that become earned for any Performance Period under these two metrics may range from 0% to 210% of the target number of PBRSUs eligible to vest during the Performance Period, based on actual performance during the applicable Performance Periods in relation to the pre-established targets for the same Performance Period for each of the two metrics. We believe the Adjusted EBITDA and Adjusted Diluted EPS metrics are critical to measuring the performance of our business, and we believe that successful management of Adjusted EBITDA and Adjusted Diluted EPS growth lead to the creation of long-term value for our stockholders.
At the end of the full three-year vesting period for the grant, the number of PBRSUs that are earned based on the achievement of Adjusted EBITDA and Adjusted Diluted EPS in relation to the pre-established targets described below is then multiplied by a percentage ranging from 100% to 120% based on the Company’s Relative Total Shareholder Return for the three year period, which comprises the three Performance Periods, (the “Relative TSR Modifier”) to determine the number of PBRSUs that will vest. The final number of PBRSUs that become vested under this award may range from 0% to a maximum of 250% of the Adjusted EBITDA Units and the Adjusted Diluted EPS Units eligible to vest during the three Performance Periods.
As noted above, the performance goals, which are established for purposes of measuring performance and dictate the vesting thresholds for performance-based equity awards, were pre-established and approved by the CC prior to the beginning of the Performance Periods – that is, the goals for the performance-based equity awards granted in fiscal 2023 were based on historical performance and future growth goals. These goals are fixed and are not changed over the Performance Period of the award.
The chart below shows the Adjusted EBITDA growth rate goals that we must achieve in order to satisfy the threshold, target and maximum performance levels in the Performance Periods and the corresponding percentage of the target number of Adjusted EBITDA Units related to the Performance Periods eligible to vest. Results between the performance levels in the chart will be interpolated on a linear basis. If the threshold performance level is not achieved for the performance period, all of the Adjusted EBITDA Units will be forfeited.
Growth | Growth | Growth | ||
% of Target EBITDA | Performance | Performance | Performance | |
Performance | Units Earned | Period 1 | Period 2 | Period 3 |
Threshold | 0% | 15% | 10% | 10% |
Target | 100% | 20% | 15% | 15% |
Maximum | 210% | 25% | 20% | 20% |
Growth rate achieved between performance levels is interpolated on a linear basis for Adjusted EBITDA Unit vesting.
For purposes of the Adjusted EBITDA Units, Adjusted EBITDA means the Company’s net income (loss) for the applicable Performance Period as determined in accordance with GAAP, plus (1) interest expense, (2) income tax expense (benefit), (3) stock-based compensation, (4) interest accretion, (5) depreciation and amortization, (6) transaction costs, (7) (gain) loss on sale of equipment, and (8) plus or minus the effect of any extraordinary item or extraordinary transaction.
The chart below shows the Adjusted Diluted EPS growth rate goals that we must achieve in order to satisfy the threshold, target and maximum performance levels for the Performance Periods, and the corresponding percentage of the
125
target number of Adjusted Diluted EPS Units related to the Performance Periods eligible to vest. Results between the performance levels in the chart will be interpolated on a linear basis. If the threshold performance level is not achieved, all of the Adjusted Diluted EPS Units related to the Performance Period will be forfeited.
% of Target Adjusted | Growth | Growth | Growth | |
Diluted EPS | Performance | Performance | Performance | |
Performance | Units Earned | Period 1 | Period 2 | Period 3 |
Threshold | 0% | 15% | 10% | 10% |
Target | 100% | 20% | 15% | 15% |
Maximum | 210% | 25% | 20% | 20% |
Growth rate achieved between performance levels is interpolated on a linear basis for Adjusted Diluted EPS Unit vesting.
For purposes of the Adjusted Diluted EPS Units, Adjusted Diluted EPS means the Company’s diluted earnings per share for the applicable Performance Period as determined in accordance with GAAP, before stock compensation expense, intangible amortization and interest accretion, all net of tax, plus or minus the effect of any extraordinary item or extraordinary transaction.
In 2022, the Company adopted the recommendation of its compensation consultant, Pearl Meyer, and introduced a time-based equity award into the long-term equity compensation program. The 2023 time-based equity awards vest in substantially equal installments over a three-year vesting period.
As described above, the 2023 long-term equity awards are comprised of a combination of 55% performance-based and 45% time-based equity awards, each vesting over a three-year period.
Rigorous Change in Control Definition
For purposes of long-term equity incentive and PBRSUs, a “Change in Control” of the Company shall be deemed to have occurred if a consummation of any of the following events occurs:
| (i) | Any “person” or “group” (within the meaning of Sections 13(d) and 14(d)(2) of the Exchange Act), other than a trustee or other fiduciary holding securities under an employee benefit plan of the Company (an “Acquiring Person”), is or becomes the “beneficial owner” (as defined in Rule 13d-3 under the Exchange Act), directly or indirectly, of more than 33 1/3% of the then outstanding voting stock of the Company; |
| (ii) | Consummation of a merger or consolidation of the Company with any other corporation, other than a merger or consolidation which would result in the voting securities of the Company outstanding immediately prior thereto continuing to represent (either by remaining outstanding or by being converted into voting securities of the surviving entity) at least 51% of the combined voting power of the voting securities of the Company or surviving entity outstanding immediately after such merger or consolidation; |
| (iii) | Consummation of a sale or other disposition by the Company of all or substantially all of the Company’s assets; |
| (iv) | During any period of two consecutive years (beginning on or after the date of grant), individuals who at the beginning of such period constitute the Board and any new director (other than a director who is a representative or nominee of an Acquiring Person) whose election by the Board or nomination for election by the Company’s stockholders was approved by a vote of at least a majority of the directors then still in office who either were directors at the beginning of the period or whose election or nomination was previously so approved, no longer constitute a majority of the Board; provided, however, in no event shall any acquisition of securities, a change in the composition of the Board or a merger or other consolidation pursuant to a plan of reorganization under chapter 11 of the Bankruptcy Code with respect to the Company, or a liquidation under the Bankruptcy Code, constitute a Change in Control. In addition, a Change in Control shall not be deemed to have occurred in the event of a sale or conveyance in which the Company continues as a holding company of an entity or entities that conduct the business or businesses formerly conducted by the Company, or any transaction undertaken for the purpose of reincorporating the Company under the laws of another jurisdiction, if such transaction does not materially affect the beneficial ownership of the Company’s capital stock. |
Potential Vesting Upon Change in Control
If a Change in Control occurs after the date of grant and prior to the end of any Performance Period, on the date of the consummation of such Change in Control, the number of PBRSUs that shall be eligible to vest (the “Contingently
126
Vested Units”) shall be calculated as follows: (i) with respect to the pending Performance Period in-progress at the time of the Change in Control, the greater of (with the Adjusted Diluted EPS Units, and Adjusted EBITDA Units being evaluated separately and not in the aggregate) (A) the target number of Adjusted Diluted EPS Units or Adjusted EBITDA Units associated with such Performance Period and (B) the number of Adjusted Diluted EPS Units or Adjusted EBITDA Units that become earned based on actual performance (assuming the last day of such performance period is the date of the consummation of such Change in Control, with the CC to make such appropriate pro-rating adjustments to the performance metrics as shall be necessary to reflect the shortened Performance Period), plus (ii) with respect to any Performance Period(s) remaining that have not commenced, the greater of (with the Adjusted Diluted EPS Units and Adjusted EBITDA Units being evaluated separately and not in the aggregate) (X) the target number of Adjusted Diluted EPS Units or Adjusted EBITDA Units associated with such Performance Period(s) and (Y) the average number (measured as a percentage of target) of Adjusted Diluted EPS Units, or Adjusted EBITDA Units that have become earned based on actual performance for all Performance Periods that have been completed (and are not in-progress) as of the date of the Change in Control. Any PBRSUs that are not Contingently Vested Units as of the date of the consummation of such Change in Control shall automatically terminate without consideration as of such date.
The Contingently Vested Units shall become earned and vested on the first anniversary date of the consummation of such Change in Control, subject to the employee’s continued employment or service with us (or any successor) through such date; provided, however, that if the employee’s employment or service is terminated (i) by us (or any successor) without “cause”, (ii) by the employee for “good reason”, or (iii) due to the employee’s death or “disability”, in each case, prior to such first anniversary of the Change in Control, the Contingently Vested Units shall become earned and vested on such termination date. Any Contingently Vested Units that do not vest pursuant to the preceding sentence shall automatically terminate without consideration on such termination date.
Severance
On December 29, 2023, Dr. Brisbin retired and resigned as Chief Executive Officer of the Company but continued his service as Chairman of the Board after December 29, 2023. Previously, Dr. Brisbin was employed pursuant to an employment agreement that provided specified levels of severance benefits if his employment was terminated by us without “cause” or by Dr. Brisbin for a “good reason.” The level of Dr. Brisbin’s severance benefit was negotiated and established in connection with Dr. Brisbin’s entry into his employment agreement and had been determined to be appropriate by the CC based on Dr. Brisbin’s level of responsibility and performance for the overall operations of the Company, long-term market trends, and budget considerations. Severance benefits for Dr. Brisbin were based on a multiple of “2x” his base salary. Severance benefits for Dr. Brisbin also included payment of Dr. Brisbin’s target bonus for the year of termination of employment.
In connection with the management transition due to Dr. Brisbin’s retirement as CEO effective December 29, 2023, we entered into a consulting agreement on February 28, 2024 with Dr. Brisbin that superseded his employment agreement. With the exception of Dr. Brisbin’s target bonus of $950,000 for the 2023 performance year, Dr. Brisbin did not receive any other severance benefits. Pursuant to Dr. Brisbin’s consulting agreement, Dr. Brisbin will be paid a monthly fee of $25,250 and the reimbursement of reasonable and necessary costs and expenses incurred in connection with providing services to the Company, commencing on February 28, 2024, for services related to management transition, business development, technology development, and other sales-related activities.
The Company has not entered into an employment agreement or offer letter that provides for the payment of severance benefits for any type of termination of employment with Mr. Bieber, Mr. Early, or Mr. Chen.
We entered into a separation agreement with Mr. Whitelaw in connection with his resignation, effective February 1, 2023 (the “Separation Agreement”). Pursuant to the Separation Agreement, in consideration of Mr. Whitelaw’s release of claims in favor of the Company, the Company provided Mr. Whitelaw the following benefits: (i) $233,342 (subject to tax withholding and other authorized deductions), payable over ten (10) months in equal installments in accordance with the Company’s standard payroll processes; (ii) acceleration of the vesting of Mr. Whitelaw’s outstanding restricted stock and outstanding performance-based restricted stock units at target levels, such that all of Mr. Whitelaw’s outstanding and unvested restricted stock and performance-based restricted stock units were fully vested as of February 1, 2023; and (iii) extension of the exercise period for Mr. Whitelaw’s vested options through December 31, 2023. We believe it appropriate to have entered into the above separation agreement in connection Mr. Whitelaw’s voluntary resignation given his years of service to the Company and the release of claims in favor of the Company.
127
None of our NEOs are entitled to receive any automatic “single trigger” equity acceleration, as our equity awards will only vest in connection with a change in control of the Company if they are not substituted or assumed in connection with the change in control. Please see the introductory section above for the definition of a change in control that applies to our equity awards, which we believe is a rigorous change in control definition. The treatment of PBRSUs in a change in control is also described above.
No NEO is entitled to receive a “gross-up” or similar payment for any excise taxes that may become payable in connection with a change in control pursuant to Sections 280G and 4999 of the Code. Instead, our 2008 Plan generally provides that awards or payments under the 2008 Plan are automatically “cut back” in such circumstances in order to avoid triggering these excise taxes.
Policy with Respect to Section 162(m)
Section 162(m) of the Code generally prohibits a publicly-held company from deducting compensation paid to a current or former NEO that exceeds $1.0 million during the tax year. Certain awards granted before November 2, 2017 that were based upon attaining pre-established performance measures that were set by the CC under a plan approved by our stockholders, as well as amounts payable to former executives pursuant to a written binding contract that was in effect on November 2, 2017, may qualify for an exception to the $1.0 million deductibility limit.
As one of the factors in its consideration of compensation matters, our CC notes this deductibility limitation. However, our CC has the flexibility to take any compensation-related actions that it determines are in the best interests of the Company and our stockholders, including awarding compensation that may not be deductible for tax purposes. There can be no assurance that any compensation will in fact be deductible as a result of the limitations under Section 162(m).
Compensation Committee Interlocks and Insider Participation
The Board’s CC consists of Mss. Downes and Reder, and Messrs. McGinn and Shahidehpour. None of the members of our CC has at any time been one of our officers or employees, nor has any member of our CC had any relationship requiring disclosure under Item 404 of Regulation S-K. None of our executive officers serves, or in the past year has served, as a member of the board of directors or the CC of any entity that has one or more executive officers who serve on our Board or CC.
Compensation Committee Report
The CC of the Board has reviewed and discussed with management the disclosures contained in the CD&A section of this Proxy Statement. Based upon this review and discussion, the CC recommended to the Board that the CD&A section be included in this Annual Report.
Compensation Committee of the Board | |
Dennis V. McGinn (Chair) | |
Cynthia A. Downes Wanda K. Reder Mohammad Shahidehpour |
The foregoing Report of the Compensation Committee of the Board of Directors does not constitute soliciting material and shall not be deemed filed, incorporated by reference into or a part of any other filing by the Company (including any future filings) under the Securities Act of 1933, as amended, or the Exchange Act, except to the extent the Company specifically incorporates such report by reference therein.
128
Compensation of Named Executive Officers
Summary Compensation Table – Fiscal 2023, Fiscal 2022, and Fiscal 2021
The following table presents information regarding compensation during FY 2023, FY 2022, and FY 2021 of our NEOs.
|
|
|
| Stock |
| Option |
| All Other |
| |||||
Name and | Salary | Bonus | Awards | Awards | Compensation | Total | ||||||||
Principal Position |
| Year |
| ($) |
| ($)(1) |
| ($)(2) |
| ($)(3) |
| ($)(4) |
| ($) |
Thomas D. Brisbin (5) |
| 2023 | 505,003 | 345,000 | 713,200 | — | 13,800 | 1,577,003 | ||||||
Chairman of the Board |
| 2022 | 505,003 | 575,000 | 992,230 | — | 13,800 | 2,086,033 | ||||||
and Chief Executive Officer |
| 2021 | 505,003 | 230,000 | 2,242,045 | — | 13,800 | 2,990,848 | ||||||
Michael A. Bieber |
| 2023 | 440,003 | 285,000 | 542,032 | — | 3,750 | 1,270,785 | ||||||
President |
| 2022 | 440,003 | 475,000 | 916,575 | — | 3,750 | 1,835,328 | ||||||
| 2021 | 440,003 | 190,000 | 852,005 | — | 3,750 | 1,485,758 | |||||||
Creighton K. Early | 2023 | 374,725 | 75,000 | 470,712 | — | 4,250 | 924,687 | |||||||
Vice President and | 2022 | 325,000 | 100,000 | 192,956 | — | 4,250 | 622,206 | |||||||
Chief Financial Officer | 2021 | 325,000 | 28,000 | 269,040 | — | 4,250 | 626,290 | |||||||
Micah H. Chen | 2023 | 341,074 | 90,000 | 114,112 | — | 4,750 | 549,936 | |||||||
General Counsel | 2022 | 315,016 | 90,000 | 192,956 | — | 4,750 | 602,722 | |||||||
2021 | 315,016 | 30,000 | 346,340 | — | 4,750 | 696,106 | ||||||||
Paul M. Whitelaw (6) | 2023 | — | — | — | — | 254,142 | (7) | 254,142 | ||||||
Former Senior Vice President | 2022 | 248,778 | 75,000 | 192,656 | — | 4,615 | 521,049 | |||||||
Business Development | 2021 | 280,010 | 170,000 | 246,620 | — | 4,750 | 701,380 |
| (1) | The amounts reported under “Bonus” for fiscal 2023, 2022, and 2021 represent bonuses paid for performance related to fiscal 2022, 2021 and 2020, respectively. |
| (2) | The amounts reported under “Stock Awards” for fiscal 2023, 2022, and 2021 represent the aggregate grant date fair value of restricted stock awards and performance based restricted stock units granted to NEOs during fiscal 2023, 2022, and 2021 (disregarding any estimate of forfeitures related to service-based vesting conditions). For a discussion of the assumptions and methodologies used to calculate the amounts reported in this column, please see the discussion of restricted stock awards and performance-based restricted stock units contained in Note 10 (Stockholders’ Equity) to our consolidated financial statements, included in this 2023 Annual Report filed on Form 10-K. The EPS Units, EBITDA Units and Relative TSR Units are valued based on the probable outcome of the applicable performance conditions as determined on the grant date. If we achieved the highest level of performance under the EPS Units, EBITDA Units and Relative TSR Units, the total grant date fair value for the EPS Units, EBITDA Units and Relative TSR Units would increase to the following amounts: Dr. Brisbin $1,002,937; Mr. Bieber $762,232; Mr. Early $160,470, and Mr. Chen $160,470. |
| (3) | The amounts reported under “Option Awards” represent the aggregate grant date fair value of option awards granted to our NEOs (disregarding any estimate of forfeitures related to service-based vesting conditions). For a discussion of the assumptions and methodologies used to calculate the amounts reported in this column, please see the discussion of stock option awards contained in Part II, Item 8, Note 10, “Shareholders’ Equity”, to the Notes to our Consolidated Financial Statements, included in this Annual Report on Form 10-K. |
| (4) | With the exception of Mr. Whitelaw, the amounts reported under “All Other Compensation” for each of fiscal 2023, 2022, and 2021 include $3,000 in 401K matching contributions made by us for each of our NEOs and, only for Dr. Brisbin, automobile allowances paid to him or use of a company vehicle. The remaining balance of the amounts under “All Other Compensation” for Mr. Bieber, Mr. Early, and Mr. Chen represents Health Saving Account contributions. |
| (5) | Dr. Brisbin served on the Board during each of fiscal 2023, 2022, and 2021. As an employee-director, Dr. Brisbin did not receive additional compensation for his services as a director. |
| (6) | Mr. Whitelaw resigned from his position as Senior Vice President, Business development, effective February 1, 2023. |
| (7) | Represents amounts paid, including $20,800 in connection with the vesting acceleration value of stock awards, in connection with Mr. Whitelaw’s separation agreement, effective February 1, 2023. |
129
Compensation of Named Executive Officers
The Summary Compensation Table above quantifies the value of the different forms of compensation earned by or awarded to our NEOs in each applicable fiscal year. As described in the “Compensation Discussion and Analysis” section above, the primary elements of each NEOs total compensation reported in the table for 2023 are base salary, performance bonus and a long-term equity incentive awards. NEOs also received the other benefits listed in the “All Other Compensation” column of the Summary Compensation Table, as further described in the footnotes above.
The Summary Compensation Table should be read in conjunction with the “Compensation Discussion and Analysis” section above and the tables and narrative descriptions that follow. A description of the material terms of each Named Executive Officer’s employment agreement, if any, is provided immediately following this paragraph.
Description of Employment Agreements, Salary and Bonus Amounts
On May 3, 2011, we entered into an amended and restated employment agreement with Dr. Brisbin that provided for Dr. Brisbin to receive a base salary and an annual incentive bonus as determined by the CC. The annual target bonus for Dr. Brisbin under this agreement was 100% of his annual base salary. Dr. Brisbin was also entitled to participate in benefit plans made available to our employees generally. On December 29, 2023, Dr. Brisbin retired and resigned as Chief Executive Officer of the Company but continued his service as Chairman of the Board after December 29, 2023. In connection with the management transition due to Dr. Brisbin’s retirement as CEO, we entered into a consulting agreement on February 28, 2024 with Dr. Brisbin that superseded his employment agreement. With the exception of Dr. Brisbin’s target bonus of $950,000 for the 2023 performance year, Dr. Brisbin did not receive any other severance benefits. Pursuant to Dr. Brisbin’s consulting agreement, Dr. Brisbin will be paid a monthly fee of $25,250 and the reimbursement of reasonable and necessary costs and expenses incurred in connection with providing services to the Company, commencing on February 28, 2024, for services related to management transition, business development, technology development, and other sales-related activities.
On December 17, 2014, we entered into an offer letter with Mr. Bieber. The letter provides that Mr. Bieber’s employment is on an “at-will” basis and for his initial base salary to be $270,000 per year. In conjunction with Mr. Bieber’s promotion to CEO on December 30, 2023, his salary was increased to $525,000 per year.
The Company has not entered into an employment agreement or offer letter with Mr. Early, Mr. Chen, or Mr. Whitelaw. The Company entered into a separation agreement with Mr. Whitelaw upon his resignation, as described above under “Severance”.
The provisions of these agreements relating to severance benefits following a termination of the Named Executive Officer’s employment are described below under “Potential Payments Upon Termination or Change in Control.”
130
Grants of Plan-Based Awards in Fiscal 2023
The following table provides additional information regarding the equity incentive awards granted to NEOs during fiscal 2023 under the 2008 Plan. See the “Compensation Discussion and Analysis” section above for a description of the material terms of the awards.
Estimated Future Payouts Under Equity | All Other Stock | |||||||||||
Incentive Plan Awards | Awards | Grant Date Fair Value | ||||||||||
Number of Shares | of Options Awards | |||||||||||
Grant | Threshold | Target | Maximum | of Stock or Units | and Stock Awards | |||||||
Name |
| Date |
| (#) | (#) |
| (#) |
| (#) |
| ($) | |
Thomas D. Brisbin | 3/7/2023 | — | — | 17,500 | (1) | 312,025 | ||||||
3/7/2023 | 1 | 22,500 | (2) | 56,250 | — | 401,175 | ||||||
Michael A. Bieber | 3/7/2023 | — | — | 13,300 | (1) | 237,139 | ||||||
3/7/2023 | 1 | 17,100 | (2) | 42,750 | — | 304,893 | ||||||
Creighton K. Early | 3/7/2023 | — | — | 22,800 | (1) | 406,524 | ||||||
3/7/2023 | 1 | 3,600 | (2) | 9,000 | — | 64,188 | ||||||
Micah H. Chen | 3/7/2023 | — | — | 2,800 | (1) | 49,924 | ||||||
3/7/2023 | 1 | 3,600 | (2) | 9,000 | — | 64,188 | ||||||
Paul M. Whitelaw(3) | — | — | — | — | — | — | ||||||
| (1) | Represents shares of restricted stock awarded to the Reporting Person by the Issuer on March 7, 2023, which vest in three substantially equal installments on each of March 7, 2024, March 7, 2025 and March 7, 2026, subject to the Reporting Person's continued service to the Issuer through the applicable vesting date. |
| (2) | These stock awards vest in annual installments over three years from their grant date based on performance metrics. Performance metrics consists of 50% of the target number of EPS Units and 50% of the target number of EBITDA Units. These two metrics may range from 0% to 210% of the target number of Performance-Based Restricted Stock Units eligible to vest. At the end of the three year vesting period, the Performance-Based Restricted Stock Units that are earned and vested based on the achievement of EPS Units and EBITDA Units is then multiplied by a percentage ranging from 100% to 120% based on the Corporation’s Relative TSR to the Company’s peer group. Total combined maximum vesting may not exceed 250% of target award. |
| (3) | Mr. Whitelaw resigned from his position as Senior Vice President, Business Development, effective February 1, 2023. |
131
Outstanding Equity Awards at Fiscal 2023 Year-End
The following table provides information regarding the outstanding option and restricted stock or unit awards held by each NEO as of December 29, 2023.
Options Awards | Stock Awards | |||||||||||||||
Equity | Equity | |||||||||||||||
Incentive | Incentive | |||||||||||||||
Plan Awards: | Plan Awards: | |||||||||||||||
Market or | ||||||||||||||||
Number of | Payout Value | |||||||||||||||
Numbers of | Number of | Unearned | of Unearned | |||||||||||||
Securities | Securities | Number of | Market Value | Shares, Units | Shares, Units | |||||||||||
Underlying | Underlying | Shares or Units | of Shares or | or Other | or Other | |||||||||||
Unexercised | Unexercised | Option | of Stock that | Units of Stock | Rights That | Rights That | ||||||||||
Options | Options | Exercise | Option | Have Not | That Have Not | Have Not | Have Not | |||||||||
Exercisable | Unexercisable | Price | Expiration | Vested | Vested | Vested | Vested | |||||||||
Name |
| (#) |
| (#) |
| ($) |
| Date |
| (#) |
| ($) |
| (#) |
| ($) |
Thomas D. Brisbin |
| 50,000 | — | 7.13 | 6/6/2024 | 12,500 | (1) | 560,500 | 35,102 | (2) | 980,399 | |||||
| 50,000 | — | 13.91 | 6/5/2025 | 17,500 | (3) | 312,025 | 56,250 | (4) | 1,002,938 | ||||||
| 100,000 | — | 16.27 | 11/3/2026 | — | — | — | — | ||||||||
| 125,000 | — | 31.73 | 9/4/2028 | — | — | — | — | ||||||||
Michael A. Bieber | 77,764 | — | 13.49 | 12/31/2024 | 13,300 | (3) | 237,139 | 21,204 | (2) | 592,228 | ||||||
| 25,000 | — | 13.91 | 6/5/2025 | — | — | 42,750 | (4) | 762,233 | |||||||
50,000 | — | 16.27 | 11/3/2026 | — | — | — | — | |||||||||
16,667 | — | 28.19 | 3/8/2027 | — | — | — | — | |||||||||
25,000 | — | 31.73 | 9/4/2028 | — | — | — | — | |||||||||
Creighton K. Early | 27,347 | — | 9.08 | 12/7/2025 | 22,800 | (3) | 406,524 | 4,464 | (2) | 124,680 | ||||||
13,333 | — | 30.06 | 10/31/2027 | — | — | 9,000 | (4) | 160,470 | ||||||||
Micah H. Chen | 70,000 | — | 32.79 | 7/17/2027 | 2,800 | (3) | 49,924 | 4,464 | (2) | 124,680 | ||||||
— | — | — | — | — | — | 9,000 | (4) | 160,470 | ||||||||
Paul M. Whitelaw(5) | 6,670 | — | 28.19 | 12/31/2023 | — | — | — | — | ||||||||
6,667 | — | 30.06 | 12/31/2023 | — | — | — | — | |||||||||
| (1) | These restricted stock awards were granted on March 9, 2021 and vest in substantially equal annual installments over four years from their grant date. |
| (2) | These performance-based restricted stock units were granted on August 2, 2022 and vest in substantially equal installments over three years from their grant date. |
| (3) | These restricted stock awards were granted on March 7, 2023 and vest in substantially equal installments over three years from their grant date. |
| (4) | These performance-based restricted stock units were granted on March 7, 2023 and vest in substantially equal installments over three years from their grant date. |
| (5) | Mr. Whitelaw’s resigned from his position as Senior Vice President, Business Development, effective February 1, 2023. |
132
Option Exercises and Stock Vested in Fiscal 2023
The following table provides information regarding the options exercised by each NEO and stock awards vested during fiscal 2023.
Option Awards | Stock Awards | |||||||
Numbers of | Numbers of | |||||||
Shares Acquired | Value Realized | Shares Acquired | Value Realized | |||||
Name | on Exercise | on Exercise | on Vesting | on Vesting | ||||
| (#) |
| ($) (1) |
| (#) |
| ($) (2) | |
Thomas D. Brisbin | — | — | 33,649 | 656,714 | ||||
Michael A. Bieber | — | — | 26,297 | 500,264 | ||||
Creighton K. Early | — | — | 5,536 | 105,315 | ||||
Micah H. Chen | — | — | 8,036 | 141,190 | ||||
Paul M. Whitelaw(3) | — | — | — | — | ||||
| (1) | The amounts reported as the “Value Realized on Exercise” (if any) are determined by multiplying (i) the number of shares of common stock to which the exercise of the option related by (ii) the difference between the per-share price of the common stock on the exercise date and exercise price of the options. |
| (2) | The amounts reported as the “Value Realized on Vesting” (if any) are determined by multiplying (i) the number of shares of common stock that vested by (ii) the per-share price of the common stock on the vesting date. |
| (3) | Mr. Whitelaw resigned from his position as Senior Vice President, Business Development, effective February 1, 2023. |
Potential Payments Upon Termination or Change in Control
Outstanding options and restricted stock and unit awards issued under our 2008 Plan will vest immediately and become fully exercisable upon a change in control of us to the extent such outstanding awards are not substituted or assumed in connection with the transaction.
In addition, the terms of PBRSUs granted to our NEOs provide that in the event of a change in control, the PBRSUs will vest as described above under “Potential Vesting Upon a Change in Control”. Upon a NEO’s death or disability at any time (whether or not in connection with a change in control), the NEO will become vested in the greater of the target number of each type of units subject to the PBRSU award or the number of each type of units earned based on actual performance for the then in-progress Performance Period, and in the target number of each type of units for all Performance Periods that have yet to begin.
Previously, the employment agreement we entered into with Dr. Brisbin provided for severance benefits upon certain terminations of his employment with us. If Dr. Brisbin’s employment had been terminated by us without cause or by him for good reason (as such terms are defined in his employment agreement), he would have been entitled to a severance benefit equal to two times his base salary at the annualized rate then in effect, paid in 24 equal installments. In addition, Dr. Brisbin would have been entitled to payment of his target bonus for the year in which such a termination of employment occurred. In connection with the management transition due to Dr. Brisbin’s retirement as CEO effective December 29, 2023, we entered into a consulting agreement on February 28, 2024 with Dr. Brisbin that superseded his employment agreement. Pursuant to Dr. Brisbin’s consulting agreement, Dr. Brisbin will be paid a monthly fee of $25,250 and the reimbursement of reasonable and necessary costs and expenses incurred in connection with providing services to the Company, commencing on February 28, 2024, for services related to management transition, business development, technology development, and other sales-related activities. With the exception of Dr. Brisbin’s target bonus of $950,000 for the 2023 performance year, Dr. Brisbin did not receive any other severance benefits.
Mr. Bieber’s offer letter does not provide for any additional severance benefits. As noted above, we have not entered into an employment agreement or offer letter that provides for the payment of severance benefits for any type of termination of employment with Mr. Bieber, Mr. Early, Mr. Chen, or Mr. Whitelaw. The Company did enter into a separation agreement with Mr. Whitelaw upon his resignation.
133
The following table sets forth the estimated payments and benefits that would be provided to each NEO employed at the end of fiscal 2023 in the event the Named Executive Officer’s employment is terminated as described above. In accordance with applicable SEC disclosure rules, these estimates assume a termination date of December 29, 2023.
Continued Health | Equity | |||||||
| Severance |
| Coverage |
| Acceleration(1) |
| Total | |
Name | ($) | ($) | ($) | ($) | ||||
Thomas D. Brisbin | — | — | — | — | ||||
Michael A. Bieber | — | — | — | — | ||||
Creighton K. Early | — | — | — | — | ||||
Micah H. Chen | — | — | — | — | ||||
Paul M. Whitelaw(2) | — | — | — | — |
| (1) | Based on the closing price of our common stock on December 29, 2023. |
| (2) | Mr. Whitelaw resigned from his position as Senior Vice President, Business Development, effective February 1, 2023. |
Pay Ratio Disclosure
The 2023 annual total compensation of the Company’s CEO was $1,577,003. The 2023 annual total compensation of our median employee (excluding our CEO) was $71,454. The ratio between the two amounts is 22.1.
To determine the pay ratio, we took the following steps:
| ■ | We identified the median employee using our employee population consisting of 1,615 employees on December 29, 2023 (excluding our CEO). We identified the median employee based on gross wages paid in 2023 as reported on Form W-2. We did not make any assumptions, adjustments or estimates with respect to gross wages paid in 2023 despite the fact that approximately 32% of our employee population works less than full time. |
| ■ | As required under the SEC rules, after identifying our median employee, we calculated annual total compensation for both our median employee and our CEO using the same methodology that we used to determine our NEOs’ annual compensation for the Summary Compensation Table above. |
The Company believes that the ratio of pay included above is a reasonable estimate calculated in a manner consistent with applicable SEC rules and this information is being provided for compliance purposes. Neither the CC nor management of the Company used the pay ratio measure in making compensation decisions. Given the different methodologies that companies use to determine an estimate of their pay ratio, the estimated ratio reported above should not be used as a basis for comparison between companies.
134
ITEM 12. SECURITY OWNERSHIP OF CERTAIN BENEFICIAL OWNERS AND MANAGEMENT AND RELATED SHAREHOLDER MATTERS
Equity Compensation Plan Information
The following table sets forth, for each of our equity compensation plans, the number of shares of common stock subject to outstanding awards, the weighted-average exercise price of outstanding options, and the number of shares remaining available for future award grants as of December 29, 2023. Our equity compensation plans consist of our 2006 Plan, our 2008 Plan and our ESPP.
|
|
| Number of | ||||
securities | |||||||
remaining available | |||||||
Number of securities | for future issuance | ||||||
to be issued upon | under equity | ||||||
exercise of | compensation | ||||||
outstanding options, | Weighted-average | plans | |||||
restricted stock | exercise price of | (excluding | |||||
units, warrants | outstanding options, | securities reflected | |||||
and rights | warrants and rights | in column (a)) | |||||
Plan Category |
| (a)(1)(2) |
| (b)(3) |
| (c)(4) | |
Equity compensation plans approved by security holders |
| 1,119,957 | $ | 20.64 |
| 1,768,255 | |
Equity compensation plans not approved by security holders |
| — |
| — |
| — | |
Totals |
| 1,119,957 | $ | 20.64 |
| 1,768,255 | |
| (1) | Represents 787,105 underlying of shares of common stock related to outstanding options and 332,852 shares of common stock related to outstanding PBRSUs. |
| (2) | Excludes 170,955 shares subject to outstanding restricted stock awards. |
| (3) | Excludes PBRSUs from the weighted-average price calculation. |
| (4) | Represents 787,329 shares available for future issuance under our 2008 Plan, and 980,926 shares available for future issuance under our ESPP. Shares available under our 2008 Plan may be used for any type of award authorized in that plan (subject to certain limitations of the plan), including stock options, stock appreciation rights, stock units, restricted stock, performance-based awards, stock bonuses and other awards payable in shares of Company common stock. |
Security Ownership Information
Except as otherwise noted, the following table sets forth information as of March 6, 2024 with respect to: (i) each person known by us to own beneficially more than 5% of the outstanding shares of our common stock, based upon Schedule 13G and Schedule 13D reports filed with the SEC, (ii) each of our directors and director nominees, (iii) each of our NEOs (as defined in Item 11. Executive Compensation) and (iv) our directors and executive officers as a group.
Unless otherwise noted below, the address of the persons listed in the table is c/o Willdan Group, Inc., 2401 East Katella Avenue, Suite 300, Anaheim, California 92806. The amounts and percentages of common stock beneficially owned are reported on the basis of regulations of the SEC governing the determination of beneficial ownership of securities. Under the rules of the SEC, a person is deemed to be a “beneficial owner” of a security if that person has or shares “voting power,” which includes the power to vote or to direct the voting of such security, or “investment power,” which includes the power to dispose of or to direct the disposition of such security or has the right to acquire such powers within 60 days. Under SEC rules, more than one person may be deemed a beneficial owner of the same securities and a person may be deemed a beneficial owner of securities as to which that person has no economic interest. Except as otherwise noted, we believe, based on the information furnished to us, that the persons named in the table below have sole voting and investment power with respect to all shares of common stock reflected as beneficially owned, subject to applicable community property laws. All percentages in the following table are based on a total of 13,770,106 shares of common stock outstanding on March 6, 2024.
135
Amount of | Percent of |
| |||
Beneficial | Common |
| |||
Name and Address of Stockholder |
| Ownership |
| Stock |
|
5% Stockholders | |||||
Forager Capital Management, LLC (1) | 1,922,186 | 14.0 | % | ||
Amundi Asset Management (2) | 1,834,235 | 13.3 | % | ||
BlackRock, Inc. (3) | 889,208 | 6.5 | % | ||
Named Executive Officers, Directors and Director Nominees | |||||
Thomas D. Brisbin (4) |
| 722,620 |
| 5.2 | % |
Michael A. Bieber (5) |
| 335,107 |
| 2.4 | % |
Micah H. Chen (6) |
| 94,175 |
| * | |
Steven A. Cohen (7) | 25,320 | * | |||
Cynthia A. Downes (8) | 7,643 | * | |||
Creighton K. Early (9) | 106,722 | * | |||
Dennis V. McGinn (10) | 14,599 | * | |||
Wanda K. Reder (11) | 7,497 | * | |||
Keith W. Renken (12) |
| 141,720 |
| 1.0 | % |
Mohammad Shahidehpour (13) |
| 15,792 |
| * | |
Paul M. Whitelaw (14) | 48,219 | * | |||
All current Directors, Director Nominees and Executive Officers as a group (11 persons) |
| 1,519,414 |
| 11.0 | % |
* The percentage of shares beneficially owned by this executive officer or director does not exceed one percent of the Company’s outstanding stock.
| (1) | Beneficial ownership information is given as of June 6, 2023 and was obtained from a Schedule 13D filed with the SEC on June 6, 2023 by Forager Fund, L.P., a Delaware limited partnership (“Fund”), Forager Capital Management, LLC, a Delaware limited liability company (“GP” or the “Investment Adviser”), Edward Kissel and Robert MacArthur. The Schedule 13D states that the Fund owns 1,524,976 shares of common stock, (ii) the Investment Adviser, as the sole general partner of the Fund and as the investment adviser of a separate account, beneficially owns 1,910,513 shares of common stock, (iii) Mr. Kissel, as the managing partner of the Investment Adviser, beneficially owns 1,921,915 shares of common stock and (iv) Mr. MacArthur, as the managing partner of the Investment Adviser, beneficially owns 1,910,784 shares of common stock. Each of the Fund and the Investment Adviser has the sole power to vote and dispose of the shares of common stock beneficially owned by such entity (as described above). Mr. Kissel has the sole power to vote and dispose of 11,402. The principal office or business address of Forager Fund, L.P. is 2025 3rd Ave. N, Suite 350, Birmingham, AL 35203. |
| (2) | Beneficial ownership information is given as of December 31, 2023 and was obtained from a Schedule 13G* filed with the SEC on February 14, 2024 by Amundi Asset Management. The Schedule 13G* states that Amundi Asset Management has shared voting power over 1,573,547 shares and shared dispositive power over 1,834,235 shares. The principal office or business address of Amundi Asset Management is 90 Boulevard Pasteur, 75015 Paris, France. |
| (3) | Beneficial ownership information is given as of December 31, 2023 and was obtained from a Schedule 13G filed with the SEC on January 29, 2024 by BlackRock, Inc. The Schedule 13G states that BlackRock, Inc. has sole voting power over 871,611 shares and sole dispositive power over 889,208 shares. The principal office or business address of BlackRock, Inc. is 50 Hudson Yards, New York, NY 10001. |
| (4) | The 722,620 shares of common stock held directly by Dr. Brisbin consist of 397,620 shares of common stock and 325,000 shares of common stock subject to options exercisable on or before June 16, 2024. The 397,620 shares of common stock held directly by Dr. Brisbin, of which (i) 17,500 shares of restricted stock that vest in three substantially equal installments on each of March 7, 2024, March 7, 2025 and March 7, 2026 and (ii) 12,500 shares of restricted stock that vest in two substantially equal installments on each of March 9, 2024 and March 9, 2025. Dr. Brisbin resigned as our Chief Executive Officer, effective December 29, 2023. |
| (5) | The 335,107 shares of common stock held directly by Mr. Bieber consist of 140,676 shares of common stock and 194,431 shares of common stock subject to options exercisable on or before June 16, 2024. The 140,676 shares of common stock held directly by Mr. Bieber, of which 13,300 shares of restricted stock that vest in three substantially equal installments on each of March 7, 2024, March 7, 2025 and March 7, 2026. |
| (6) | The 94,175 shares of common stock held directly by Mr. Chen consist of 24,175 shares of common stock and 70,000 shares of common stock subject to options exercisable on or before June 16, 2024. The 24,175 shares of common stock held directly by Mr. Chen, of which (i) 2,800 shares of restricted stock that vest in three substantially equal installments on each of March 7, 2024, March 7, 2025 and March 7, 2026 . |
| (7) | The 25,320 shares of common stock held directly by Mr. Cohen include 4,880 shares of restricted stock, of which (i) 1,295 shares of restricted stock vest on June 9, 2024 and (ii) 3,585 shares of restricted stock vest in two substantially equal installments on each of June 7, 2024 and June 7, 2025. |
| (8) | The 7,643 shares of common stock held directly by Ms. Downes includes 4,880 shares of restricted stock, of which (i) 1,295 shares of restricted stock vest on June 9, 2024 and (ii) 3,585 shares of restricted stock vest in two substantially equal installments on each of June 7, 2024 and June 7, 2025. |
| (9) | The 106,722 shares of common stock held directly by Mr. Early consist of 66,042 shares of common stock and 40,680 shares of common stock subject to options exercisable on or before June 16, 2024. The 66,042 shares of common stock held directly by Mr. Early, of which 22,800 shares of restricted stock that vest in three substantially equal installments on each of March 7, 2024, March 7, 2025 and March 7, 2026. |
136
| (10) | The 14,599 shares of common stock held directly by Vice Admiral McGinn include 4,880 shares of restricted stock, of which (i) 1,295 shares of restricted stock vest on June 9, 2024 and (ii) 3,585 shares of restricted stock vest in two substantially equal installments on each of June 7, 2024 and June 7, 2025. |
| (11) | The 7,497 shares of common stock held directly by Ms. Reder include 4,880 shares of restricted stock, of which (i) 1,295 shares of restricted stock vest on June 9, 2024 and (ii) 3,585 shares of restricted stock vest in two substantially equal installments on each of June 7, 2024 and June 7, 2025. |
| (12) | The 141,720 shares of common stock held by Mr. Renken consist of 61,320 shares of common stock held directly by Mr. Renken and 80,400 shares of common stock held by the LVRJC Partnership. Mr. Renken is the managing partner of the LVRJC Partnership and has sole voting and investment control over our shares of common stock held therein. The 61,320 shares of common stock held directly by Mr. Renken include 4,880 shares of restricted stock, of which (i) 1,295 shares of restricted stock vest on June 9, 2024 and (ii) 3,585 shares of restricted stock vest in two substantially equal installments on each of June 7, 2024 and June 7, 2025. Mr. Renken retired from his position as Director effective March 5, 2024. |
| (13) | The 15,792 shares of common stock held directly by Dr. Shahidehpour include 4,880 shares of restricted stock, of which (i) 1,295 shares of restricted stock vest on June 9, 2024 and (ii) 3,585 shares of restricted stock vest in two substantially equal installments on each of June 7, 2024 and June 7, 2025. |
| (14) | The 48,219 shares of common stock held directly by Mr. Whitelaw consist of 25,882 shares of common stock and 22,337 shares of common stock subject to options exercisable on or before June 17, 2023. Mr. Whitelaw resigned as our Senior Vice President, Business Development, effective February 1, 2023. Beneficial ownership information is based on information contained in the last Form 4 filed by Mr. Whitelaw with the SEC prior to February 1, 2023, adjusted to give effect to subsequent transactions through April 18, 2023 of which we are aware in connection with employment-related equity. |
137
ITEM 13. CERTAIN RELATIONSHIPS AND RELATED TRANSACTIONS, AND DIRECTOR INDEPENDENCE
Certain Relationships and Related Person Transactions
Related Person Transaction Policy
In March 2007, the Board adopted a policy addressing the Company’s procedures with respect to the review, approval and ratification of “related person transactions” that are required to be disclosed pursuant to Item 404(a) of Regulation S-K. The policy provides that any transaction, arrangement or relationship, or any series of similar transactions, in which the Company was, is or will be a participant, the amount involved exceeds $120,000, and a “related person” (as defined in the policy) has or will have a direct or indirect material interest (each such transaction, a “Related Person Transaction”) shall be subject to review and approval or ratification by the AC. In its review of Related Person Transactions, the AC shall review the material facts and circumstances of the transaction and shall take into account certain factors, where appropriate, based on the particular facts and circumstances, including (i) the nature of the “related person’s” interest in the transaction, (ii) the approximate dollar value of the amount involved in the Related Person Transaction, (iii) whether the transaction was taken in the Company’s ordinary course of business, (iv) whether the transaction with the “related person” is proposed to be, or was, entered into on terms no less favorable to the Company than terms that could have been reached with an unrelated third party and (v) the purpose of, and the potential benefits to the Company of, the Related Person Transaction.
No member of the AC may participate in the review, approval or ratification of a transaction with respect to which he or she is a “related person” provided that such member can be counted for purposes of a quorum and shall provide such information with respect to the transaction as may be reasonably requested by other members of the AC or the Board.
Related Person Transactions
The following provides a description of certain relationships and related transactions since the beginning of fiscal 2023 between some of our directors, executive officers and holders of 5% or more of our common stock and us or our subsidiaries and affiliates involving an amount that exceeded or may exceed $120,000 in the aggregate.
Indemnification of Officers and Directors. We have entered into indemnification agreements with all of our current executive officers and directors. These agreements require us to indemnify these individuals to the fullest extent permitted under Delaware law against liabilities that may arise by reason of their service to us and to advance expenses reasonably incurred as a result of any proceeding against them as to which they could be indemnified. Additionally, we may enter into indemnification agreements with any future directors or executive officers. In fiscal 2023, we did not incur any indemnification related expenses as a result of indemnification agreements with our current executive officers and directors.
Consulting Agreements. On December 8, 2023, Thomas D. Brisbin informed the Board of his intention to retire and resign as Chief Executive Officer of the Company, effective December 29, 2023. Dr. Brisbin continued his service as Chairman of the Board after December 29, 2023. In connection with the management transition, we entered into a consulting agreement on February 28, 2024 with Dr. Brisbin which superseded Dr. Brisbin’s employment agreement. Pursuant to Dr. Brisbin’s consulting agreement, Dr. Brisbin will be paid a monthly fee of $25,250 and the reimbursement of reasonable and necessary costs and expenses incurred in connection with providing services to the Company, commencing on February 28, 2024, for services related to management transition, business development, technology development, and other sales-related activities.
Director Independence
The Board has determined that each of Messrs. Cohen, McGinn, Renken and Shahidehpour and Mss. Downes and Reder are independent pursuant to the applicable independence requirements set forth in the rules of the listing standards for the Nasdaq Stock Market (the “Nasdaq Rules”) and by the SEC because they either have no relationship with the Company (other than as a director and stockholder) or because any relationship they have with the Company is immaterial. Under these standards of independence, for a director to be considered independent, the director must, among other things, not be an executive officer or employee of the Company or its subsidiaries and the director must not have a relationship which, in the opinion of the Board, would interfere with the exercise of independent judgment in carrying out the responsibilities of a director. Dr. Brisbin, as a result of being the Company’s former CEO and having
138
retired from this position in December 2023, does not qualify as independent. In addition, Mr. Bieber, due to his employment as our CEO, does not qualify as independent.
139
ITEM 14. PRINCIPAL ACCOUNTING FEES AND SERVICES
Audit and Other Fees
Crowe LLP
The following is a summary of the Crowe LLP (“Crowe”) fees for professional services for the fiscal years ended December 29, 2023 and December 30, 2022.
Fee Category |
| Crowe 2023 |
| Crowe 2022 | ||
Audit Fees | $ | 935,000 | $ | 915,000 | ||
Audit-Related Fees |
| — |
| — | ||
Tax Fees |
| — |
| — | ||
All Other Fees |
| — |
| — | ||
Total Fees | $ | 935,000 | $ | 915,000 | ||
Audit Fees. Fees for audit services provided by Crowe for fiscal 2023 and 2022 consisted of professional services for the annual audit of our consolidated financial statements and for the review of our interim condensed consolidated financial statements including quarterly reports.
The Company has been advised by Crowe that neither Crowe nor any member of Crowe has any financial interest, direct or indirect, in any capacity in the Company or its subsidiaries.
Audit Committee Pre-Approval Policy
Consistent with SEC policies regarding independence, the AC has responsibility for appointing, setting compensation and overseeing the work of the Company’s independent registered public accounting firm. In recognition of this responsibility, the AC has established a policy to pre-approve all audit and permissible non-audit services provided by the independent registered public accounting firm, including audit services, audit-related services, tax services and other services. In some cases, the full AC provides pre-approval for up to a year, related to a particular defined task or scope of work and subject to a specific budget. During the year, circumstances may arise when it becomes necessary to engage the independent registered public accounting firm for additional services not contemplated in the original pre-approval categories. In those instances, the AC requires specific pre-approval before engaging the Company’s independent registered public accounting firm. The AC may delegate pre-approval authority to one or more of its members. The member to whom such authority is delegated must report, for informational purposes only, any pre-approval decisions to the AC at its next regularly scheduled meeting.
The AC has considered whether the provision of the services described above is compatible with maintaining the Company’s independent public accounting firm’s independence and has determined that such services have not adversely affected Crowe’s independence. Crowe did not provide any services for fiscal 2023 and fiscal 2022 that required pre-approval by the AC.
140
APPENDIX A
Willdan Group, Inc. and Subsidiaries
Reconciliation of GAAP Net Income to Adjusted EBITDA
(in thousands)
(Non-GAAP Measure)
Year Ended | ||||||
December 29, |
| December 30, | ||||
| 2023 | 2022 | ||||
Net income (loss) |
| $ | 10,926 | $ | (8,448) | |
Interest expense | 9,413 | 5,328 | ||||
Income tax expense (benefit) | 3,665 | (3,004) | ||||
Stock-based compensation | 5,323 | 8,373 | ||||
Interest accretion(1) | — | 3,168 | ||||
Depreciation and amortization | 16,431 | 17,489 | ||||
(Gain) Loss on sale of equipment | (63) | (64) | ||||
Tax benefit distribution | — | 434 | ||||
Adjusted EBITDA | $ | 45,695 | $ | 23,276 | ||
| (1) | Interest accretion represents the imputed interest and fair value adjustments to estimated contingent consideration. |
141
PART IV
ITEM 15. EXHIBITS, FINANCIAL STATEMENT SCHEDULES
(a) The following documents are filed as part of this report:
1.Financial Statements
The financial statements included in Part II, Item 8 of this document are filed as part of this Annual Report on Form 10-K.
2.Financial Statements Schedules
All required schedules are omitted because they are not applicable or the required information is shown in the financial statements or the accompanying notes.
3.Exhibits
The exhibits filed as part of this annual report are listed in Item 15(b).
(b) Exhibits.
The following exhibits are filed as a part of this report:
Exhibit | Exhibit Description | |
|---|---|---|
3.1 | ||
3.2 | ||
4.1 | ||
4.2* | ||
4.3 | The Company agrees to furnish to the Securities and Exchange Commission upon request a copy of each instrument with respect to issues of long-term debt of Willdan Group, Inc. and its subsidiaries, the authorized principal amount of which does not exceed 10% of the consolidated assets of Willdan Group, Inc. and its subsidiaries. | |
10.1 | ||
10.2 |
142
Exhibit | Exhibit Description | |
|---|---|---|
10.3 | ||
10.4 | ||
10.5 | ||
10.6 | ||
10.7 | ||
10.8 | ||
10.9 | ||
10.10 | ||
10.11 | ||
10.12 | ||
10.13† | ||
10.14† |
143
Exhibit | Exhibit Description | |
|---|---|---|
10.15† | ||
10.16† | ||
10.17† | ||
10.18* | Form of Performance Based Restricted Stock Unit Award Agreement. | |
10.19* | ||
10.20† | ||
10.21† | ||
10.22† | ||
10.23† | ||
10.24† | ||
10.25† | ||
10.26† | ||
10.27† | ||
21.1* | ||
23.1* | ||
24.1* | ||
31.1* | ||
31.2* | ||
32.1** | ||
97* | Policy Relating to Recovery of Erroneously Awarded Compensation. | |
101.INS* | Inline XBRL Instance Document (the instance document does not appear in the Interactive Data File because its XBRL tags are embedded within the Inline XBRL document). | |
101.SCH* | Inline XBRL Taxonomy Extension Schema Document |
144
Exhibit | Exhibit Description | |
|---|---|---|
101.CAL* | Inline XBRL Taxonomy Extension Calculation Linkbase Document | |
101.LAB* | Inline XBRL Taxonomy Extension Definition Linkbase Document | |
101.PRE* | Inline XBRL Taxonomy Extension Label Linkbase Document | |
101.DEF* | Inline XBRL Taxonomy Extension Presentation Linkbase Document | |
104* | Cover Page Interactive Data File (formatted as inline XBRL and contained in Exhibit 101) |
* | Filed herewith. |
** | Furnished herewith. |
‡ | Portions of the referenced exhibit have been omitted pursuant to Item 601(b) of Regulation S-K because it (i) is not material and (ii) would be competitively harmful if publicly disclosed. |
† | Indicates a management contract or compensating plan or arrangement. |
ITEM 16. FORM 10-K SUMMARY
None.
145
SIGNATURES
Pursuant to the requirements of Section 13 or 15(d) of the Securities Exchange Act of 1934, the registrant has duly caused this report to be signed on its behalf by the undersigned, thereunto duly authorized.
WILLDAN GROUP, INC. | ||
/s/ Creighton K. Early | ||
Creighton K. Early | ||
Chief Financial Officer and Executive Vice President | ||
March 7, 2024 | ||
KNOW ALL PERSONS BY THESE PRESENT, that each person whose signature appears below constitutes and appoints Creighton K. Early his/her attorney-in-fact, with the power of substitution, for him/her in any and all capacities, to sign any amendments to this Report on Form 10-K and to file the same, with Exhibits thereto and other documents in connection therewith with the SEC, hereby ratifying and confirming all that said attorney-in-fact, or substitute or substitutes may do or cause to be done by virtue hereof.
Pursuant to the requirements of the Securities Exchange Act of 1934, this report has been signed by the following persons on behalf of the registrant and in the capacities and on the dates indicated.
Signature | Title | Date | ||
/s/ Michael A. Bieber | President, Chief Executive Officer and Director (principal executive officer) | March 7, 2024 | ||
Michael A. Bieber | ||||
/s/ Creighton K. Early | Chief Financial Officer and Executive Vice President (principal financial officer and principal accounting officer) | March 7, 2024 | ||
Creighton K. Early | ||||
/s/ Thomas D. Brisbin | Chairman of the Board and Director | March 7, 2024 | ||
Thomas D. Brisbin | ||||
/s/ Steven A. Cohen | Director | March 7, 2024 | ||
Steven A. Cohen | ||||
/s/ Cynthia A. Downes | Director | March 7, 2024 | ||
Cynthia A. Downes | ||||
/s/ Dennis V. McGinn | Director | March 7, 2024 | ||
Dennis V. McGinn | ||||
/s/ Wanda K. Reder | Director | March 7, 2024 | ||
Wanda K. Reder | ||||
/s/ Mohammad Shahidehpour | Director | March 7, 2024 | ||
Mohammad Shahidehpour |
146