UNITED STATES
SECURITIES AND EXCHANGE COMMISSION
WASHINGTON, DC 20549
FORM
(Mark One)
ANNUAL REPORT PURSUANT TO SECTION 13 OR 15(d) OF THE SECURITIES EXCHANGE ACT OF 1934 |
For the fiscal year ended
TRANSITION REPORT PURSUANT TO SECTION 13 OR 15(d) OF THE SECURITIES EXCHANGE ACT OF 1934 |
For the transition period from to
Commission File Number
(Exact name of Registrant as specified in its charter)
WEST VIRGINIA |
|
|
(State or other jurisdiction of incorporation or organization) |
|
(IRS Employer Identification No.) |
|
|
|
|
||
(Address of principal executive offices) |
|
(Zip Code) |
Registrant’s telephone number, including area code:
Securities registered pursuant to Section 12(b) of the Act:
Title of each class |
|
Trading Symbol |
|
Name of each Exchange on which registered |
|
|
|||
|
|
Securities registered pursuant to Section 12(g) of the Act: None
Indicate by check mark if the registrant is a well-known seasoned issuer, as defined in Rule 405 of the Securities Act.
Indicate by check mark if the registrant is not required to file reports pursuant to Section 13 or 15 (d) of the Act. Yes ☐
Indicate by check mark whether the registrant (1) has filed all reports required to be filed by Section 13 or 15 (d) of the Securities Exchange Act of 1934 during the preceding 12 months (or for such shorter period that the registrant was required to file such reports), and (2) has been subject to such filing requirements for the past 90 days.
Indicate by check mark whether the registrant has submitted electronically every Interactive Data File required to be submitted pursuant to Rule 405 of Regulation S-T (section 232.405 of this chapter) during the preceding 12 months (or for such shorter period that the registrant was required to submit such files).
Indicate by check mark whether the registrant is a large accelerated filer, an accelerated filer, a non-accelerated filer or a smaller reporting company. See definitions of “large accelerated filer,” “accelerated filer,” “smaller reporting company,” and “emerging growth company” in Rule 12b-2 of the Exchange Act:
☑ |
Accelerated filer |
☐ |
Emerging growth company |
||
Non-accelerated filer |
☐ |
Smaller reporting company |
|
|
If an emerging growth company, indicate by check mark if the registrant has elected not to use the extended transition period for complying with any new or revised financial accounting standards provided pursuant to Section 13(a) of the Exchange Act. ☐
Indicate by check mark whether the registrant has filed a report on and attestation to its management’s assessment of the effectiveness of its internal control over financial reporting under Section 404(b) of the Sarbanes-Oxley Act (15 U.S.C. 7262(b)) by the registered public accounting firm that prepared or issued its audit report.
If securities are registered pursuant to Section 12(b) of the Act, indicate by check mark whether the financial statements of the registrant included in the filing reflect the correction of an error to previously issued financial statements.
Indicate by check mark whether any of those error corrections are restatements that required a recovery analysis of incentive-based compensation received by any of the registrant’s executive officers during the relevant recovery period pursuant to §240.10D-1(b). ☐
Indicate by check mark whether the registrant is a shell company (as defined in Rule 12b-2 of the Act.) Yes ☐ No
The aggregate market value of the registrant’s outstanding voting and non-voting common stock held by non-affiliates on June 30, 2023, determined using a per share closing price on that date of $25.77, was $
As of February 14, 2024, there were
DOCUMENTS INCORPORATED BY REFERENCE
Certain specifically designated portions of Wesbanco, Inc.’s definitive proxy statement which will be filed by April 30, 2024 for its Annual Meeting of Shareholders (the “Proxy Statement”) to be held in 2024 are incorporated by reference into Part III of this Form 10-K.
WESBANCO, INC.
ANNUAL REPORT ON FORM 10-K
TABLE OF CONTENTS
ITEM # |
|
ITEM |
|
Page No. |
|
|
|
|
|
|
|
Part I |
|
|
|
|
|
|
|
1 |
|
|
3-12 |
|
1A |
|
|
13-22 |
|
1B |
|
|
22 |
|
1C |
|
|
22 |
|
2 |
|
|
23 |
|
3 |
|
|
24 |
|
4 |
|
|
24 |
|
|
|
|
|
|
|
|
Part II |
|
|
|
|
|
|
|
5 |
|
|
25-26 |
|
6 |
|
|
26 |
|
7 |
|
Management’s Discussion and Analysis of Financial Condition and Results of Operations |
|
27-63 |
7A |
|
|
64-65 |
|
8 |
|
|
66-134 |
|
9 |
|
Changes in and Disagreements with Accountants on Accounting and Financial Disclosure |
|
135 |
9A |
|
|
135 |
|
9B |
|
|
135 |
|
9C |
|
Disclosure Regarding Foreign Jurisdictions that Prevent Inspections |
|
135 |
|
|
|
|
|
|
|
Part III |
|
|
|
|
|
|
|
10 |
|
|
136 |
|
11 |
|
|
136 |
|
12 |
|
Security Ownership of Certain Beneficial Owners and Management and Related Stockholder Matters |
|
136 |
13 |
|
Certain Relationships and Related Transactions, and Director Independence |
|
136 |
14 |
|
|
136 |
|
|
|
|
|
|
|
|
Part IV |
|
|
|
|
|
|
|
15 |
|
|
137 |
|
16 |
|
|
137 |
|
|
|
|
142 |
2
PART I
ITEM 1. BUSINESS
GENERAL
Wesbanco, Inc. (“Wesbanco” or the “Company”), a bank holding company incorporated in 1968 and headquartered in Wheeling, West Virginia, offers a full range of financial services including retail banking, corporate banking, personal and corporate trust services, brokerage services, mortgage banking and insurance. Wesbanco offers these services through two reportable segments, community banking and trust and investment services. For additional information regarding Wesbanco’s business segments, please refer to Note 23, “Business Segments” in the Consolidated Financial Statements.
As of December 31, 2023, Wesbanco operated one commercial bank: Wesbanco Bank, Inc. (“Wesbanco Bank” or the “Bank”). The Bank has 192 branches and 183 ATM machines located in West Virginia, Ohio, western Pennsylvania, Kentucky, southern Indiana and Maryland. Total assets of Wesbanco as of December 31, 2023 approximated $17.7 billion. Wesbanco Bank also offers trust and investment services and various alternative investment products including mutual funds and annuities. The market value of assets under management of the trust and investment services segment is approximately $5.4 billion as of December 31, 2023. These assets are held by Wesbanco Bank in fiduciary or agency capacities for its customers and therefore are not included as assets on Wesbanco’s Consolidated Balance Sheets.
Wesbanco also offers additional services through its non-banking subsidiaries:
Wesbanco Insurance Services, Inc. (“Wesbanco Insurance”), a wholly-owned subsidiary of Wesbanco Bank, is a multi-line insurance agency specializing in property, casualty, life and title insurance, with benefit plan sales and administration for personal and commercial clients.
Wesbanco Securities, Inc. (“Wesbanco Securities”) is a full service broker-dealer, which also offers discount brokerage services.
Wesbanco Asset Management, Inc., a wholly-owned subsidiary of Wesbanco Bank, holds certain investment securities and loans in a Delaware-based subsidiary.
Wesbanco Properties, Inc. holds certain commercial real estate properties. The commercial property is leased to Wesbanco Bank and to certain non-related third parties.
FAH, LLC and Flagship Acquisitions Trust, which were acquired in the Old Line Bancshares, Inc. ("OLBK") acquisition and are Maryland limited liability corporations, hold certain real estate properties located in the Maryland area. Each of these entities is a wholly owned subsidiary of Wesbanco Bank.
Wesbanco has eleven capital trusts, which are all wholly-owned trust subsidiaries formed for the purpose of issuing trust preferred securities (“Trust Preferred Securities”) and lending the proceeds to Wesbanco. For more information regarding Wesbanco’s issuance of Trust Preferred Securities, please refer to Note 10, “Subordinated Debt and Junior Subordinated Debt” in the Consolidated Financial Statements.
AMSCO, Inc. (“AMSCO”) is a wholly-owned subsidiary of Wesbanco Bank, which formerly engaged in the management of certain real estate development and construction of 1-4 family residential units. It is in the process of winding up its business activities and will be dissolved.
Wesbanco Bank’s Investment Department also serves as investment adviser to a family of mutual funds, namely the “WesMark Funds.” The fund family is comprised of the WesMark Large Company Fund, the WesMark Balanced Fund, the WesMark Small Company Fund, the WesMark Government Bond Fund, the WesMark West Virginia Municipal Bond Fund, and the WesMark Tactical Opportunity Fund.
As of December 31, 2023, none of Wesbanco’s subsidiaries were engaged in any operations in foreign countries, and only one had any transactions with customers in foreign countries. The Bank also provides letters of credit internationally for certain domestic customers and provides international wire services through a third-party correspondent bank.
WEBSITE ACCESS TO WESBANCO’S FILINGS WITH THE SECURITIES AND EXCHANGE COMMISSION
Wesbanco’s electronic filings with the Securities and Exchange Commission (the “SEC”), including its Annual Reports on Form 10-K, Quarterly Reports on Form 10-Q, Current Reports on Form 8-K, and amendments to these reports filed or furnished pursuant to Section 13(a) or 15(d) of the Securities Exchange Act of 1934, are made available at no cost on Wesbanco’s website, www.wesbanco.com, through the “Investors” link as soon as reasonably practicable after Wesbanco files such material with, or furnishes it to, the SEC. Wesbanco’s SEC filings are also available through the SEC’s website at www.sec.gov. Wesbanco routinely posts important information on the Company's website in the "Investors" section. Wesbanco may also use its website as a means of disclosing material, non-public information and for complying with our disclosure obligations under Regulation FD. Accordingly, investors should monitor the Investors section of the website in addition to following Wesbanco's press releases, SEC filings, public conference calls,
3
presentations and webcasts. The information contained on, or that may be accessed through, Wesbanco's website is not incorporated by reference into, and is not a part of, this Annual Report on Form 10-K.
Upon written request of any shareholder of record on December 31, 2023, Wesbanco will provide, without charge, a printed copy of this 2023 Annual Report on Form 10-K, including financial statements and schedules, as required to be filed with the SEC. To obtain a copy of this report, contact: John Iannone, Wesbanco, Inc., 1 Bank Plaza, Wheeling, West Virginia 26003 (304) 905-7021.
HUMAN CAPITAL RESOURCES
At December 31, 2023, we employed 2,321 full-time equivalent employees. At that date, the average tenure of all of our full-time employees was approximately 10 years while the average tenure of our executive officers was over 16 years. None of our employees are represented by collective bargaining agreements. We believe our relations with our employees are very good. The safety and care of our employees and their families as well as their communities is paramount for us.
Of our total employees, 10% or 235 were minorities with 80 or 34% of those officers. Of our 1,105 total officers, 603 or 55% were women. Our turnover rate for 2023 was 19%. Our turnover rate for officers was 15% for 2023.
Our corporate culture has been established by senior management and overseen by our board of directors. Built upon our ‘Better Banking Pledge’ and our ‘Service & Support Pledge’, our culture, which is both customer and employee-centric, is focused on growing long-term relationships by pledging to serve all personal and business customer needs efficiently and effectively while treating our employees with dignity and respect. Wesbanco completed its first employee engagement survey which focused on employee satisfaction. We were pleased with the number of participants and their feedback. Wesbanco is in the process of rolling out its second survey in the first quarter of 2024 with a focus on Wesbanco culture.
Wesbanco has been a leader in its communities for over 150 years, and we want to continue to take a leadership role by noting our stance for equality. We are a group with diverse backgrounds and ethnicities, and share the same values of dignity and respect for our co-workers, customers, and fellow community members. We have been able to enhance our diversification through the retention of many of the employees we have acquired through our acquisition strategy who bring a strong skill set and a diverse background. Wesbanco ensures diversity in our workforce representation by reflecting the makeup of the communities it serves.
Wesbanco has held a Women’s Symposium for over 6 years and in past years, added a Diversity and Inclusion Forum. In 2023, the first, combined and in-person, Wesbanco Diversity, Equity and Inclusion Symposium event was held. This event focused on women, multi-cultural, and LGBTQ+ leadership initiatives as well as allies and sponsors involved in the formation of Employee Resource Groups ("ERGs"). The two-day event included educational information and activities geared toward diversity in leadership and participating in future ERGs. Mentoring, allyship and sponsorship were important focuses in these learning sessions.
In addition, we have engaged in leadership training for senior and middle management supervisors. We annually assess talent through a specific Talent Development Program to identify, promote and build development plans among multiple levels of management. These efforts have resulted in Wesbanco being designated as one of the best workplaces in several markets, including Columbus and Western Pennsylvania.
Our hope is that this not only helps us evolve and grow as a company but that it also spreads to all of our other community efforts. In 2023, Wesbanco provided philanthropic donations totaling $0.9 million in support of worthwhile organizations serving communities across our footprint. Further, our employees provided technical assistance services and financial education to non-profit organizations and area schools that resulted in 11,500 volunteer hours in 2023.
COMPETITION
Competition in the form of price and service from other banks, including local, regional and national banks and financial companies such as savings and loan companies, internet banks, payday lenders, money services businesses, credit unions, finance companies, brokerage firms and other non-banking companies providing various regulated and non-regulated financial services and products, is intense in most of the markets served by Wesbanco and its subsidiaries. Wesbanco’s trust and investment services segment receives competition from commercial banks, trust companies, mutual fund companies, investment advisory firms, law firms, brokerage firms, and other financial services companies. As a result of consolidation within the financial services industry, mergers between, and the expansion of, financial institutions both within and outside of Wesbanco’s major markets have provided significant competitive pressure in those markets. Many of Wesbanco’s competitors have greater resources and, as such, may have higher lending limits and may offer other products and services that are not provided by Wesbanco. Wesbanco generally competes on the basis of superior customer service and responsiveness to customer needs, available loan and deposit products, rates of interest charged on loans, rates of interest paid for deposits, and the availability and pricing of trust, brokerage and insurance services. As a result of Wesbanco’s expansion into certain larger metropolitan markets, it has faced entrenched larger bank competitors with an already existing customer base that may far exceed Wesbanco’s initial entry position into those markets. As a result, Wesbanco may be forced to compete more aggressively for loans, deposits, trust and insurance products to grow its market share, potentially reducing its current and future profit potential from such markets.
4
SUPERVISION AND REGULATION
As a bank holding company and a financial holding company under federal law, Wesbanco is subject to supervision and examination by the Board of Governors of the Federal Reserve System (“Federal Reserve Board”) under the Bank Holding Company Act of 1956, as amended (the “BHCA”), and is required to file with the Federal Reserve Board reports and other information regarding its business operations and the business operations of its subsidiaries. Since Wesbanco is both a bank holding company and a financial holding company, Wesbanco can offer customers virtually any type of service that is financial in nature or incidental thereto, including banking and activities closely related to banking, securities underwriting, insurance (both underwriting and agency) and merchant banking. Wesbanco is subject to additional supervision from the Federal Reserve Board and its primary banking regulators due to its exceeding the $10 billion asset threshold and seeks to ensure that sufficient resources are allocated to safety and soundness compliance with applicable laws, such as the Bank Secrecy Act, anti-money laundering regulations, and the Community Reinvestment Act (“CRA”), among others, and risk management and internal audit, among other functions, so that the enhanced requirements of the Federal Reserve Board and its primary banking regulators are met.
As indicated above, Wesbanco presently operates one bank subsidiary, Wesbanco Bank, which is a West Virginia-chartered banking corporation which is not a member bank of the Federal Reserve System. It is subject to examination and supervision by the Federal Deposit Insurance Corporation (the “FDIC”), the West Virginia Division of Financial Institutions (“WVDFI”), and the Consumer Financial Protection Bureau (“CFPB”) because its assets exceed $10 billion. The deposits of Wesbanco Bank are insured by the Deposit Insurance Fund of the FDIC. Wesbanco’s non-bank subsidiaries are subject to examination and supervision by the Federal Reserve Board and specifically, the Federal Reserve Bank of Cleveland, Ohio (“Federal Reserve”) and examination by other federal and state agencies, including, in the case of certain securities activities, regulation by the SEC, the Financial Institution Regulatory Authority, Inc. (“FINRA”), the Municipal Securities Rulemaking Board and the Securities Investors Protection Corporation (“SIPC”). Wesbanco Bank maintains one designated financial subsidiary, Wesbanco Insurance, which, as indicated above, is a multi-line insurance agency specializing in property, casualty, life and title insurance, with benefit plan sales and administration for personal and commercial clients. As a result of exceeding the $10 billion asset threshold, Wesbanco Bank is subject to enhanced prudential supervision from both the FDIC and WVDFI as part of their large bank supervision program.
Wesbanco is also under the jurisdiction of the SEC and certain state securities commissions for matters relating to the offering and sale of its securities. Wesbanco is subject to the disclosure and regulatory requirements of the Securities Act of 1933, as amended, and the Securities Exchange Act of 1934, as amended, as administered by the SEC. Wesbanco is listed on the Nasdaq Global Select Market (the “Nasdaq”) under the trading symbol “WSBC” and is subject to the rules of the Nasdaq for listed companies.
Under the Riegle-Neal Interstate Banking and Branching Efficiency Act of 1994, as amended (the “Riegle-Neal Act”), a bank holding company may acquire banks in states other than its home state, subject to certain limitations. The Riegle-Neal Act also authorizes banks to merge across state lines, thereby creating interstate banking. Under the Dodd-Frank Wall Street Reform and Consumer Protection Act (the “Dodd-Frank Act”), banks are also permitted to establish de novo branches across state lines to the same extent that a state-chartered bank in each host state would be permitted to open branches.
Under the BHCA, prior Federal Reserve Board approval is required for Wesbanco to acquire more than 5% of the voting stock of any bank. In determining whether to approve a proposed bank acquisition, federal banking regulators will consider, among other factors, the effect of the acquisition on competition, the public benefits expected to be received from the acquisition, the projected capital ratios and levels on a post-acquisition basis, and the acquiring institution’s record of addressing the credit needs of the communities it serves, including the needs of low- and moderate-income neighborhoods, consistent with safe and sound operation of the bank under the CRA.
HOLDING COMPANY REGULATIONS
As indicated in “Item 1. Business-General”, Wesbanco has one state-chartered bank subsidiary, Wesbanco Bank, as well as four non-bank subsidiaries (excluding capital trusts). The subsidiary bank is subject to affiliate transaction restrictions under federal law, which limit “covered transactions” by the subsidiary bank with the parent and any non-bank subsidiaries of the parent, which are referred to in the aggregate in this paragraph as “affiliates” of the subsidiary bank. “Covered transactions” include loans or extensions of credit to an affiliate (including repurchase agreements), purchases of or investments in securities issued by an affiliate, purchases of assets from an affiliate, the acceptance of securities issued by an affiliate as collateral for a loan or extension of credit, the issuance of a guarantee, acceptance or letter of credit on behalf of an affiliate, certain transactions that involve borrowing or lending securities, and certain derivative transactions with an affiliate. Such covered transactions between the subsidiary bank and any single affiliate are limited in amount to 10% of the subsidiary bank’s capital and surplus, and, with respect to covered transactions with all affiliates in the aggregate, are limited in amount to 20% of the subsidiary bank’s capital and surplus. Furthermore, such loans or extensions of credit, guarantees, acceptances and letters of credit, and any credit exposure resulting from securities borrowing or lending transactions or derivatives transactions, are required to be secured by collateral at all times in amounts specified by law. In addition, all covered transactions must be conducted on terms and conditions that are consistent with safe and sound banking practices.
The Dodd-Frank Act requires a bank holding company to act as a source of financial strength to its subsidiary bank. Under this source of strength requirement, the Federal Reserve Board may require a bank holding company to make capital infusions into a troubled subsidiary bank, and may charge the bank holding company with engaging in unsafe and unsound practices for failure to commit resources to such a subsidiary bank. A capital infusion conceivably could be required at a time when Wesbanco may not have the resources to provide it.
5
PAYMENT OF DIVIDENDS
Dividends from the subsidiary bank are a significant source of funds for payment of dividends to Wesbanco’s shareholders. For the year ended December 31, 2023, Wesbanco declared cash dividends to its preferred and common shareholders of approximately $10.1 million and $82.9 million, respectively.
As of December 31, 2023, Wesbanco Bank was “well capitalized” under the definition in Section 324.403 of the FDIC Regulations. Therefore, as long as the Bank remains “well capitalized” or even becomes “adequately capitalized,” there would be no basis under Section 324.403 to limit the ability of the Bank to pay dividends because it had not become undercapitalized, significantly undercapitalized or critically undercapitalized. Effective January 1, 2016, Wesbanco Bank and Wesbanco became subject to “capital conservation buffer” rules, phased in over a four year period which ended in 2019, which requires Wesbanco and Wesbanco Bank to have capital levels above the regulatory minimums to pay dividends (discussed below in connection with the Basel III initiative under “Item 1. Business—Capital Requirements”).
All financial institutions are subject to the prompt corrective action provisions set forth in Section 38 of the Federal Deposit Insurance Act (the “FDI Act”) and the provisions set forth in Section 308.201 of the FDIC Regulations. Immediately upon a state non-member bank receiving notice, or being deemed to have notice, that the bank is undercapitalized, significantly undercapitalized, or critically undercapitalized, as defined in Section 324.403 of the FDIC Regulations, the bank is precluded from being able to pay dividends to its shareholders based upon the requirements in Section 38(d) of the FDI Act, 12 U.S.C. § 1831o(d).
In addition, with respect to possible dividends by the Bank, under Section 31A-4-25 of the West Virginia Code, the prior approval of the West Virginia Commissioner of Financial Institutions would be required if the total of all dividends declared by the Bank in any calendar year would exceed the total of the Bank’s net profits for that year combined with its retained net profits of the preceding two years. Further, Section 31A-4-25 limits the ability of a West Virginia banking institution to pay dividends until the surplus fund of the banking institution equals the common stock of the banking institution and if certain specified amounts of recent profits of the banking institution have not been carried to the surplus fund.
If, in the opinion of the applicable regulatory authority, a bank under its jurisdiction is engaged in or is about to engage in an unsafe or unsound practice which, depending on the financial condition of the bank, could include the payment of dividends, such authority may require, after notice and hearing, that such bank cease and desist from such practice. The Federal Reserve Board has issued policy statements, which provide that insured banks and bank holding companies should generally only pay dividends out of current operating earnings. Under applicable law, bank regulatory agency approval is required if the total of all dividends declared by a bank in any calendar year exceeds the available retained earnings or exceeds the aggregate of the bank’s net profits (as defined by regulatory agencies) for that year and its retained net profits for the preceding two years. As of December 31, 2023, under West Virginia and FDIC regulations, Wesbanco could receive, without prior regulatory approval, a dividend of up to $135.5 million from Wesbanco Bank. Additional information regarding dividend restrictions is set forth in Note 21, “Regulatory Matters,” in the Consolidated Financial Statements.
On February 24, 2009, the Federal Reserve Division of Banking Supervision and Regulation issued Supervisory Letter SR 09-4, “Applying Supervisory Guidance and Regulations on the Payment of Dividends, Stock Redemptions, and Stock Repurchases at Bank Holding Companies,” providing direction to bank holding companies on the payment of dividends, capital repurchases and capital redemptions. Although the letter largely reiterates longstanding Federal Reserve supervisory policies, it emphasizes the need for a bank holding company to review various factors when considering the declaration of a dividend or taking action that would reduce regulatory capital provided by outstanding financial instruments. These factors include the potential need to increase loan loss reserves, write down assets and reflect declines in asset values in equity. In addition, the bank holding company should consider its past and anticipated future earnings, the dividend payout ratio in relation to earnings, and adequacy of regulatory capital before any action is taken. The consideration of capital adequacy should include a review of all known factors that may affect capital in the future. On July 24, 2020, Attachment C was added to SR 09-4 to provide greater clarity regarding the situations in which holding companies may expect an expedited consultation under the process described in SR 09-4. Generally, a holding company considering paying a dividend in excess of earnings for the period (1) must have net income available over the past year sufficient to fully fund dividends, (2) is not considering stock repurchases or redemptions in the current quarter, (3) does not have any concentrations in commercial real estate lending that exceed supervisory thresholds, and (4) is in good supervisory condition, to receive this expedited consultation.
In certain circumstances, defined by regulation relating to levels of earnings and capital, advance notification to, and in some circumstances, approval by the regulator could be required to declare a dividend or repurchase or redeem capital instruments.
FDIC INSURANCE
FDIC insurance premiums are assessed by the FDIC using a risk-based approach that places insured institutions into categories based on capital and risk profiles. Beginning in 2019, Wesbanco Bank is considered to be a large bank for the purposes of the premium calculation because its total assets exceed $10 billion, and it is therefore subject to more continuous oversight by the FDIC. Large banks are subject to a more complex insurance premium calculation with additional loan-related and other risk factors involved which leads to an overall higher rate as compared to that of smaller banks. In 2023, Wesbanco Bank paid deposit insurance premiums of $11.2 million, compared to $7.2 million and $4.5 million in 2022 and 2021, respectively. The increase in 2023's premiums was due primarily to an increase in initial base deposit insurance assessment rate schedules uniformly by two basis points, beginning in the first quarterly
6
assessment period of 2023. The increase in assessment rate schedules was intended to increase the likelihood that the reserve ratio of the Deposit Insurance Fund reaches the statutory minimum of 1.35% by the statutory deadline of September 30, 2028.
CAPITAL REQUIREMENTS
The Federal Reserve Board had historically issued risk-based capital ratio and leverage ratio guidelines for bank holding companies. The risk-based capital ratio guidelines establish a systematic analytical framework that makes regulatory capital requirements more sensitive to differences in risk profiles among banking organizations, takes off-balance sheet exposures into explicit account in assessing capital adequacy, and minimizes disincentives to holding liquid, low-risk assets. Under the guidelines and related policies, bank holding companies must maintain capital sufficient to meet both a risk-based asset ratio test and a leverage ratio test on a consolidated basis. The risk-based ratio is determined by allocating assets and specified off-balance sheet commitments into several weighted categories, with higher weightings being assigned to categories perceived as representing greater risk. A bank holding company’s capital is then divided by total risk-weighted assets to yield the risk-based ratio. The leverage ratio is determined by relating core capital to total assets adjusted as specified in the guidelines. The Bank is subject to substantially similar capital requirements.
The federal regulatory authorities’ risk-based capital guidelines are currently based upon agreements reached by the Basel Committee on Banking Supervision (the “Basel Committee”). The Basel Committee is a committee of central banks and bank supervisors and regulators from the major industrialized countries that develops broad policy guidelines for use by each country’s supervisors in determining the supervisory policies they apply. In December 2010, the Basel Committee issued a strengthened set of international capital and liquidity standards for banks and bank holding companies, known as “Basel III.” In July 2013, the U.S. federal banking agencies issued a joint final rule that implements the Basel III capital standards and establishes the minimum capital levels required under the Dodd-Frank Act. The rule was effective January 1, 2015, subject to a transition period providing for full implementation on January 1, 2019. The Economic Growth, Regulatory Relief, and Consumer Protection Act (the "EGRRCPA"), enacted into law in May 2018, exempts banks with total consolidated assets of less than $10 billion that exceed the community bank leverage ratio from the capital requirements under Basel III. Wesbanco Bank’s assets are in excess of $10 billion, however, so the exemption is not applicable.
Generally, under the applicable guidelines, a financial institution’s capital is divided into common equity Tier 1 (“CET1”), total Tier 1 and Tier 2. CET1 includes common shares and retained earnings less goodwill, intangible assets subject to limitation and certain deferred tax assets subject to limitation. In addition, under the final capital rule, an institution may make a one-time, permanent election to continue to exclude accumulated other comprehensive income from capital. If an institution does not make this election, unrealized gains and losses will be included in the calculation of its CET1. Total Tier 1 is comprised of CET1 and certain restricted capital instruments, including qualifying cumulative perpetual preferred stock and qualifying trust preferred securities, in their Tier 1 capital, up to a limit of 25% of Tier 1 capital. (See below within this section for more information regarding the capital treatment of trust preferred securities.)
Tier 2, or supplementary capital, includes, among other things, portions of trust preferred securities and cumulative perpetual preferred stock not otherwise counted in Tier 1 capital, as well as perpetual preferred stock, intermediate-term preferred stock, hybrid capital instruments, perpetual debt, mandatory convertible debt securities, term subordinated debt, unrealized holding gains on equity securities, and the allowance for loan and lease losses, all subject to certain limitations. “Total capital” is the sum of Tier 1 and Tier 2 capital.
The Federal Reserve Board has established the following minimum capital levels banks and bank holding companies are required to maintain as a percentage of risk-weighted assets (including various off-balance sheet items): (i) CET1 of at least 4.5%, (ii) Tier 1 capital ratio of at least 6%, (iii) total capital ratio (Tier 1 and Tier 2 capital) of at least 8%; and (iv) a non-risk-based leverage ratio (Tier 1 capital to average consolidated assets) of 4%. The risk-based capital standards are designed to make regulatory capital requirements more sensitive to differences in credit and market risk profiles among banks and financial holding companies, to account for off-balance sheet exposure, and to minimize disincentives for holding liquid assets. Balance sheet and off-balance sheet exposures are assigned to one of several risk-weights primarily based on relative credit risk. The capital amounts and classifications are also subject to qualitative judgments by the regulators about components, risk-weightings, and other factors. Additionally, with the final capital rule fully implemented as of January 1, 2019, an institution is required to maintain a 2.5% common equity Tier 1 capital conservation buffer over the minimum risk-based capital requirements to avoid restrictions on the ability to pay dividends, discretionary bonuses to executive officers, and engage in share repurchases.
Failure to meet applicable capital guidelines could subject a financial institution to a variety of enforcement remedies available to the federal regulatory authorities, including limitations on the ability to pay dividends, the issuance by the regulatory authority of a capital directive to increase capital, and the termination of deposit insurance by the FDIC, as well as to the measures described below under “Prompt Corrective Action” as applicable to undercapitalized institutions.
As of December 31, 2023, Wesbanco’s CET1, Tier 1 and total capital to risk-adjusted assets ratios were 10.99%, 12.05% and 14.91%, respectively. Wesbanco made a timely permanent election to exclude accumulated other comprehensive income from regulatory capital. As of December 31, 2023, Wesbanco Bank’s CET1, Tier 1 and total capital to risk-adjusted assets ratios were 12.13%, 12.13% and 12.97%, respectively, all in excess of the minimum requirements. Neither Wesbanco nor the Bank had been advised by the
7
appropriate federal banking regulator of any specific leverage ratio applicable to it. As of December 31, 2023, Wesbanco’s leverage ratio was 9.87% and the Bank’s leverage ratio was 9.93%.
As of December 31, 2023, Wesbanco had $131.0 million in junior subordinated debt on its Consolidated Balance Sheets. For regulatory purposes, Trust Preferred Securities totaling $126.9 million underlying such junior subordinated debt were included in Tier 2 capital as of December 31, 2023, in accordance with regulatory reporting requirements. In 2013, the federal banking agencies amended capital requirements to generally exclude trust preferred securities from Tier 1 capital. A grandfather provision, however, permits bank holding companies with consolidated assets of less than $15 billion, which Wesbanco was through September 30, 2019, to continue counting existing trust preferred securities as Tier 1 capital until they mature. The final Basel III capital rule permanently grandfathers trust preferred securities issued before May 19, 2010 for institutions of less than $15 billion in size, subject to a 25% limit of Tier 1 capital. The amount of trust preferred securities and certain other elements in excess of the 25% limit may be included in Tier 2 capital, subject to restrictions. As of December 31, 2023, Wesbanco’s total assets were above $15 billion; therefore, all such securities are no longer counted as Tier 1 capital but instead are counted as Tier 2 capital subject to limits. For more information regarding trust preferred securities, please refer to Note 10, “Subordinated and Junior Subordinated Debt” in the Consolidated Financial Statements.
The risk-based capital standards of the Federal Reserve and the FDIC specify that evaluations by the banking agencies of a bank’s capital adequacy will include an assessment of the exposure to declines in the economic value of the bank’s capital due to changes in interest rates. These banking agencies have issued a joint policy statement on interest rate risk describing prudent methods for monitoring such risk that rely principally on internal measures of exposure and active oversight of risk management activities by senior management.
PROMPT CORRECTIVE ACTION
The Federal Deposit Insurance Corporation Improvement Act of 1991 (“FDICIA”) requires federal banking regulatory authorities to take “prompt corrective action” with respect to depository institutions that do not meet minimum capital requirements. For these purposes, FDICIA establishes five capital tiers: well-capitalized, adequately capitalized, undercapitalized, significantly undercapitalized, and critically undercapitalized.
An institution is deemed to be “well-capitalized” if it has a total risk-based capital ratio of 10% or greater, a Tier 1 risk-based capital ratio of 8% or greater, a Tier 1 leverage ratio of 5% or greater, and a common equity Tier 1 ratio of 6.5% or greater, and is not subject to a regulatory order, agreement, or directive to meet and maintain a specific capital level for any capital measure. An institution is deemed to be “adequately capitalized” if it has a total risk-based capital ratio of 8% or greater, a Tier 1 risk-based capital ratio of 6% or greater, generally a Tier 1 leverage ratio of 4% or greater, and a common equity Tier 1 ratio of 4.5% or greater, and the institution does not meet the definition of a “well-capitalized” institution. An institution that does not meet one or more of the “adequately capitalized” tests is deemed to be “undercapitalized.” If the institution has a total risk-based capital ratio that is less than 6%, a Tier 1 risk-based capital ratio that is less than 4%, or a Tier 1 leverage ratio or common equity Tier 1 ratio that is less than 3%, it is deemed to be “significantly undercapitalized.” Finally, an institution is deemed to be “critically undercapitalized” if it has a ratio of tangible equity (as defined in the regulations) to total assets that is equal to or less than 2%. As of December 31, 2023, as noted above in “Capital Requirements,” Wesbanco Bank had capital levels that met the “well-capitalized” standards under FDICIA and its implementing regulations.
FDICIA generally prohibits a depository institution from making any capital distribution, including payment of a cash dividend, or paying any management fee to its holding company, if the depository institution would thereafter be undercapitalized. Undercapitalized institutions are subject to growth limitations and are required to submit a capital restoration plan. If any depository institution subsidiary of a holding company is required to submit a capital restoration plan, the holding company would be required to provide a limited guarantee regarding compliance with the plan as a condition of approval of such plan by the appropriate federal banking agency. If an undercapitalized institution fails to submit an acceptable plan, it is treated as if it is significantly undercapitalized. Significantly undercapitalized institutions may be subject to a number of requirements and restrictions, including orders to sell sufficient voting stock to become adequately capitalized, requirements to reduce total assets, and cessation of receipt of deposits from correspondent banks. Critically undercapitalized institutions may not, beginning 60 days after becoming critically undercapitalized, make any payment of principal or interest on their subordinated debt and/or trust preferred securities. In addition, critically undercapitalized institutions are subject to appointment of a receiver or conservator within 90 days of becoming critically undercapitalized.
GRAMM-LEACH-BLILEY ACT
Under the Gramm-Leach-Bliley Act (the “GLB Act”), banks are no longer prohibited from associating with, or having management interlocks with, a business organization engaged principally in securities activities. By qualifying as a “financial holding company,” as authorized under the GLB Act, a bank holding company acquires new powers not otherwise available to it. Wesbanco has elected to become a financial holding company under the GLB Act. It also has qualified a subsidiary of the Bank as a financial subsidiary under the GLB Act.
8
Financial holding company powers relate to “financial activities” that are determined by the Federal Reserve Board, in coordination with the Secretary of the Treasury, to be financial in nature, incidental to an activity that is financial in nature, or complementary to a financial activity, provided that the complementary activity does not pose a safety and soundness risk. The GLB Act itself defines certain activities as financial in nature, including but not limited to: underwriting insurance or annuities; providing financial or investment advice; underwriting, dealing in, or making markets in securities; merchant banking, subject to significant limitations; insurance company portfolio investing, subject to significant limitations; and any activities previously found by the Federal Reserve Board to be closely related to banking.
National and state banks are permitted under the GLB Act, subject to capital, management, size, debt rating, and CRA qualification factors, to have “financial subsidiaries” that are permitted to engage in financial activities not otherwise permissible. However, unlike financial holding companies, financial subsidiaries may not engage in insurance or annuity underwriting; developing or investing in real estate; merchant banking (for at least five years); or insurance company portfolio investing.
DODD-FRANK ACT
The Dodd-Frank Act, enacted on July 21, 2010, and the rules implementing its provisions have resulted in numerous and wide-ranging reforms to the structure of the U.S. financial system. This includes, among other things, rules to promote financial stability and prevent or mitigate the risks that may arise from the material distress or failure of a large bank holding company; enhance consumer protections; prohibit proprietary trading; and implement enhanced prudential requirements for large bank holding companies regarding risk-based capital and leverage, risk and liquidity management, stress testing, and recovery and resolution planning. The Dodd-Frank Act, including current and future rules implementing its provisions and the interpretation of those rules, have affected, and management expects will continue to affect, most of Wesbanco’s businesses in some way, either directly through regulation of specific activities or indirectly through regulation of concentration risks, capital or liquidity.
Certain bank holding companies are subjected to increased capital requirements (discussed above under “Item 1. Business—Capital Requirements”).
The Volcker Rule and the final rules jointly issued by federal banking agencies implementing the rule’s provisions limit Wesbanco’s ability to engage in proprietary trading, as well as its ability to sponsor or invest in hedge funds or private equity funds. The Volcker Rule also includes certain compliance program requirements that apply to banking entities that engage in permissible proprietary trading or permitted covered fund activities. The federal banking agencies recently revised the Volcker Rule compliance requirements, effective January 1, 2020. Under the new rule, banking entities that, together with their affiliates and subsidiaries, have an average gross sum of trading assets and liabilities (excluding obligations of or guaranteed by the United States or an agency of the United States) of less than $1 billion for four (4) consecutive quarters are presumed to be in compliance with the Volcker Rule’s restrictions on proprietary trading and acquisition or retention of ownership interests in covered funds. Consequently such banking entities do not have an affirmative obligation to demonstrate compliance with such restrictions (“limited trading compliance presumption”). Wesbanco meets the limited trading compliance presumption because its gross consolidated trading assets and liabilities have been below $1 billion for four consecutive quarters.
An interim final rule was issued in January 2014 that exempts investments in certain collateralized debt obligations backed primarily by trust preferred securities from the provisions of the Volcker Rule. This interim final rule was effective April 1, 2014 and did not have a material impact on Wesbanco for the year ended December 31, 2023.
The Federal Reserve Board revised the Volcker Rule, issuing a final rule in November 2019. Under the new rule, banking entities with gross consolidated trading assets and liabilities between $1 billion and $20 billion are subject to a simplified compliance program because they are considered to have “moderate” trading assets. The new rule was effective January 1, 2020; however, Wesbanco is not subject to the moderate trading compliance program because Wesbanco has gross consolidated trading assets and liabilities below $1 billion.
Passed in 2011, the Durbin Amendment requires the Federal Reserve to limit fee charges to retailers for debit card processing. The Federal Reserve Board promulgated Regulation II (Debit Card Interchange Fees and Routing) that limits the interchange fees paid by merchants to issuers when their debit cards are used as payment. An issuer is defined as “any person that authorizes the use of the debit card to perform an electronic debit transaction.” The application of the Durbin Amendment is determined by whether the issuer, together with its affiliates, has $10 billion in assets as of the end of the calendar year preceding the date of the electronic debit transaction. An affiliate is defined as “any company that controls, or is controlled by, or is under common control with another company.” Therefore, if an insured institution issues a debit card and it, together with its affiliates, has assets exceeding $10 billion, it is subject to this rule. The rule caps debit card interchange fees (also known as swipe fees) at $0.21 plus an additional 0.05% of the value of the transaction. Previously, the average interchange fee was approximately $0.44 per transaction for an insured institution. Financial institutions with more than $10 billion in assets by the year-end assessment deadline are subject to the cap on interchange income in July of the following year. Wesbanco and the Bank were subject to the requirements imposed by the Durbin Amendment because, for purposes of determining whether an issuer has $10 billion in assets, the assets of the institution and its affiliates are combined, effective for transactions beginning in July 2019.
9
Additionally, section 165(i)(2) of the Dodd-Frank Act, as amended by the EGRRCPA, requires annual company-run stress tests for bank holding companies with total consolidated assets greater than $100 billion.
The Federal Reserve Board regulates bank holding companies, and therefore, if a bank holding company has total consolidated assets of $100 billion or more, it will be required to conduct the Federal Reserve Board stress-tests. Wesbanco Bank, a subsidiary state nonmember bank, is governed by the FDIC. Under the FDIC rule, a covered bank includes “any state nonmember bank . . . with average total consolidated assets . . . that are greater than $10 billion but less than $50 billion.” However, the FDIC proposed a rule in December 2018 to conform this definition to Section 165 of the Dodd-Frank Act, as amended by the EGRRCPA, to state that a “covered bank” is a nonmember bank or state savings association with average total consolidated assets that are greater than $250 billion. Wesbanco Bank has less than $100 billion in average total consolidated assets, and therefore, is not subject to the Federal Reserve Board’s or the FDIC’s stress-test rules.
If the Dodd-Frank Act stress test rules were to apply at some point in the future, Wesbanco would have to assess the potential impact of a minimum of three macroeconomic scenarios—baseline, adverse, and severely adverse—on its consolidated losses, revenues, balance sheets (including risk-weighted assets) and capital. Each scenario includes economic variables, including macroeconomic activity, unemployment, exchange rates, prices, incomes and interest rates. The adverse and severely adverse scenarios are not forecasts, but rather hypothetical scenarios designed to assess the strength and resilience of financial institutions. Additionally, Wesbanco would have to publicly disclose these test results on an annual basis. The required summary of results could be published on Wesbanco’s web site or in any other forum that is reasonably accessible to the public.
As required by Section 165 of the Dodd-Frank Act, the Federal Reserve issued a rule that strengthens the supervision and regulation of large U.S. bank holding companies and foreign banking organizations by establishing a number of enhanced prudential standards. These standards include liquidity, risk management, and capital. Under the rule, a publicly traded bank holding company with $10 billion or more in consolidated assets is required to establish an enterprise-wide risk committee. However, the EGRRCPA raised the threshold to $50 billion. To conform the rule to the EGRRCPA, the Federal Reserve Board proposed a rule in November 2018 to increase the threshold to $50 billion. Wesbanco is therefore, currently not subject to the Federal Reserve Enhanced Prudential Standards.
The Dodd-Frank Act made several changes affecting the securitization markets, which may affect a bank’s ability or desire to use those markets to meet funding or liquidity needs. One of these changes calls for federal regulators to adopt regulations requiring the sponsor of a securitization to retain at least 5% of the credit risk, with exceptions for “qualified residential mortgages.”
Publicly traded companies are required by the Dodd-Frank Act to give shareholders an advisory vote on executive compensation, and, in some cases, golden parachute arrangements. Further, SEC and Nasdaq rulemaking under the Dodd-Frank Act requires Nasdaq-listed companies to have a compensation committee composed entirely of independent directors. Wesbanco’s Compensation Committee members currently satisfy the independence criteria. The Dodd-Frank Act also called for regulators to issue new rules relating to incentive-based compensation arrangements deemed excessive, and authorized the SEC to adopt rules related to proxy access by shareholders. The SEC has issued proposed rules relating to excessive compensation arrangements that have not been finalized.
All banks and other insured depository institutions now have increased authority to open new branches across state lines (discussed above under “Item 1. Business—Supervision and Regulation”). A provision authorizing insured depository institutions to pay interest on certain business checking accounts may increase Wesbanco’s interest expense. The Consumer Financial Protection Bureau, a federal agency created by the Dodd-Frank Act, has the authority to write rules implementing numerous consumer protection laws applicable to all banks (discussed below under “Item 1. Business—Consumer Protection Laws”).
CONSUMER PROTECTION LAWS
In connection with its lending and leasing activities, all banks are subject to a number of federal and state laws designed to protect consumers and promote lending and other financial services to various sectors of the economy and population. These laws include the Equal Credit Opportunity Act, the Fair Credit Reporting Act, the Truth in Lending Act (“TILA”), the Truth in Savings Act, the Home Mortgage Disclosure Act, the Real Estate Settlement Procedures Act (“RESPA”), the Electronic Fund Transfer Act, and, in some cases, their respective state law counterparts. The CFPB has consolidated the authority to write regulations implementing these and other laws. Wesbanco’s other subsidiaries that provide services relating to consumer financial products and services are subject to the CFPB’s regulations. As an institution formerly with assets of less than $10 billion, Wesbanco Bank historically had been examined by the FDIC for compliance with these rules. Through its acquisitions, the Bank’s assets exceeded $10 billion for four consecutive quarters, and in 2019 it came under CFPB supervision and examination. Relating to mortgage lending, the Dodd-Frank Act authorized the CFPB to issue new regulations governing the ability to repay, qualified mortgages, mortgage servicing, appraisals and compensation of mortgage lenders, all of which have been issued and have taken effect. They limit the mortgage products offered by the Bank and have an impact on timely enforcement of delinquent mortgage loans.
The Dodd-Frank Act also directed the CFPB to integrate the mortgage loan disclosures under TILA and RESPA. The CFPB issued new integrated disclosures rules (“TRID”), which became effective October 3, 2015 and have combined the prior good faith estimate and truth in lending disclosure form into a new form, the loan estimate. They have also combined the HUD-1 and final truth in lending disclosure forms into a new form, the closing disclosure. The rule is extremely complex, contains significant uncertainties as to penalties, some of which can be quite material, contains prohibitions against correcting even technical mistakes, creates uncertainty regarding last
10
minute changes in the transaction and has triggered significant ambiguity in compliance. Thus for covered transactions and most closed-end consumer credit transactions secured by real property, the TRID rules have presented significant and ongoing challenges to real estate lenders. The CFPB issued an interpretive rule in August 2021 providing greater flexibility under the TRID rules, which helped ease some of the challenges that real estate lenders like the Bank face. The rule, however, relates only to the on-going COVID pandemic.
Federal law currently contains extensive customer privacy protection provisions. Under these provisions, a financial institution must provide to its customers, at the inception of the customer relationship and annually thereafter, the institution’s policies and procedures regarding the handling of customers’ nonpublic personal financial information. These provisions also provide that, except for certain limited exceptions, an institution may not provide such personal information to unaffiliated third parties unless the institution discloses to the customer that such information may be so provided and the customer is given the opportunity to opt out of such disclosure. Federal law makes it a criminal offense, except in limited circumstances, to obtain or attempt to obtain customer information of a financial nature by fraudulent or deceptive means.
COMMUNITY DEVELOPMENT
Wesbanco strives to be a leader in community development by positively impacting the communities it serves. We have developed responsible strategies to provide targeted investment, deployment of capital, financial education, technical assistance, and innovative products and solutions that will achieve financial inclusion for all. Our vision is to create greater economic opportunities that provide the dignity of affordable housing, the empowerment of financial inclusion, the strength of successful businesses, and the sustainability of vibrant communities.
Wesbanco has proven to be a leader in its communities by providing loans, deposits and other banking services that are responsive to financial needs. The CRA requires Wesbanco Bank’s primary federal bank regulatory agency, the Federal Deposit Insurance Corporation (FDIC), to assess the Bank’s record in meeting the credit needs of the communities served by the Bank, including low and moderate-income neighborhoods and persons. Institutions are assigned one of four ratings: “Outstanding,” “Satisfactory,” “Needs to Improve” or “Substantial Noncompliance.” This assessment is reviewed when a bank applies to merge or consolidate with or acquire the assets or assume the liabilities of an insured depository institution, or to open or relocate a branch office. On November 14, 2022, the FDIC assigned a rating of “Outstanding” for Wesbanco Bank’s community development performance for the period of July 2019 through November 2022. The 2022 exam represented the Bank’s eighth consecutive “Outstanding” CRA rating, spanning a period of more than twenty years.
Wesbanco Bank received the “America Saves Designation of Savings Excellence for Banks,” a designation from the national America Saves initiative that recognizes banks that went above and beyond to encourage people to save money during America Saves Week 2023. Wesbanco has been an active participant in America Saves Week since its inception in 2007 and this was Wesbanco’s eighth consecutive designation for savings excellence. The Wesbanco Bank Community Development Corporation (“Wesbanco CDC”), an affiliate of Wesbanco Inc., was nationally recognized by the American Bankers Association Foundation ("ABA Foundation") with a Community Commitment Award for its New Markets Loan Program, an innovative revolving loan fund for small businesses. The Wesbanco CDC has received four allocations of New Markets Tax Credits to fund the New Markets Loan Program, and has leveraged those funds to make over 231 loans totaling over $178 million for the benefit of businesses located in low-income, economically distressed communities, and creating over 6,800 jobs.
To achieve this level of success, in addition to providing a wide variety of conventional loan and deposit products, the Bank partners with a number of governmental and non-profit agencies to provide special programs to assist customers, especially low- and moderate-income consumers and small businesses, achieve their financial goals. For example, Wesbanco Bank leverages its membership in the Federal Home Loan Bank to sponsor Affordable Housing Program grant applications for non-profit organizations and housing developers, to provide down payment assistance for home mortgage borrowers through the First Front Door program, and to provide flexible financing options for small businesses, including women- and minority-owned businesses, through the Banking on Business and Banking on Business Inclusion and Equity loan programs. Additionally, Wesbanco has developed its own loan and deposit products to provide financing and savings options with innovative and flexible terms to meet identified needs for underserved persons and in underserved communities. Wesbanco has also been recognized as a leader in community development lending. In the past five years, Wesbanco originated over $2 billion in community development loans, returning credit and capital to communities throughout its footprint. At the heart of the Bank’s successful community development program is its commitment of time and resources to the communities it serves. Employees provide thousands of hours of technical assistance and financial education to organizations and agencies that promote community development and Wesbanco has deployed hundreds of thousands of dollars in philanthropic donations to worthy organizations serving local communities in Wesbanco’s service area.
In October 2023, the federal banking agencies, the Office of the Comptroller of the Currency, the Federal Reserve Board, and the FDIC, released an interagency final rule amending the Community Reinvestment Act. The new rule seeks to adapt to changes in the banking industry, such as the digital delivery of financial products and services, and to enhance economic opportunities for low- and moderate-income persons and communities. The amendments have tiered implementation dates, with the majority of the changes effective January 1, 2026. Wesbanco Bank continues to be categorized as a “large bank” under the amended CRA rules.
11
SECURITIES REGULATION
Wesbanco’s full service broker-dealer subsidiary, Wesbanco Securities, is registered as a broker-dealer with the SEC and in the states in which it does business. Wesbanco Securities also is a member of FINRA. Wesbanco Securities is subject to regulation by the SEC, FINRA and the securities administrators of the states in which it is registered. Wesbanco Securities is a member of the SIPC, which in the event of the liquidation of a broker-dealer, provides protection for customers’ securities accounts held by Wesbanco Securities of up to $500,000 for each eligible customer, subject to a limitation of $250,000 for claims for cash balances.
In addition, Wesbanco Bank’s Investment Department serves as an investment adviser to a family of mutual funds and is registered as an investment adviser with the SEC and in some states.
On September 10, 2019, the SEC adopted a new rule, Regulation Best Interest, which establishes a standard of conduct for broker-dealers when they make a recommendation to a retail customer of any securities transaction or investment strategy involving securities. Regulation Best Interest enhances the broker-dealer standard of conduct beyond existing suitability obligations, and aligns the standard of conduct with retail customers’ reasonable expectations by requiring broker-dealers, among other things, to: act in the best interest of the retail customer at the time the recommendation is made, without placing the financial or other interest of the broker-dealer ahead of the interests of the retail customer; and address conflicts of interest by establishing, maintaining, and enforcing policies and procedures reasonably designed to identify and fully and fairly disclose material facts about conflicts of interest, and in instances where we have determined that disclosure is insufficient to reasonably address the conflict, to mitigate or, in certain instances, eliminate the conflict. The effective date for implementation of the new rule was June 30, 2020.
On December 22, 2020, the SEC adopted a new rule to govern investment adviser advertisements and payments to solicitors. The rule replaces the current advertising rule’s broadly drawn limitations with principles-based provisions designed to accommodate the continual evolution and interplay of technology and advice, and includes tailored requirements for certain types of advertisements. For example, the rule requires advisers to standardize certain parts of a performance presentation in order to help investors evaluate and compare investment opportunities, and includes tailored requirements for certain types of performance presentations. Advertisements that include third-party ratings are required to include specific disclosures to prevent them from being misleading. The rule also permits the use of testimonials and endorsements, which include traditional referral and solicitation activity, subject to certain conditions.
THE USA PATRIOT AND BANK SECRECY ACT
The USA PATRIOT Act of 2001 (the “USA Patriot Act”) imposes significant compliance and due diligence obligations, material penalties, and provides for extra-territorial jurisdiction of the United States. The U.S. Treasury Department has issued various implementing regulations, which apply certain requirements of the USA Patriot Act to financial institutions, such as Wesbanco Bank and Wesbanco’s broker-dealer subsidiary. These regulations impose obligations on financial institutions to maintain appropriate policies, procedures and controls to detect, prevent and report money laundering and terrorist financing, to verify the identity of their customers, including beneficial owners, and to report suspicious activities and currency transactions of a certain size. Failure of Wesbanco and its subsidiaries to maintain and implement adequate programs to combat money laundering and terrorist financing, or to comply with all of the relevant laws or regulations, could have serious legal and reputational consequences for Wesbanco and its subsidiaries.
12
ITEM 1A. RISK FACTORS
The risks described below are not the only ones we face in our business. Additional risks and uncertainties not presently known to us or that we currently believe to be immaterial may also impair our business operations. If any of the following risks occur, our business, financial condition or operating results could be materially harmed.
RISKS RELATED TO THE ECONOMY AND OTHER EXTERNAL FACTORS, INCLUDING REGULATION
Climate change manifesting as physical or transition risks could adversely affect our operations, businesses and customers.
There is an increasing concern over the risks of climate change and related environmental sustainability matters. The physical risks of climate change include discrete events, such as flooding and wildfires, and longer-term shifts in climate patterns, such as extreme heat, sea level rise, and more frequent and prolonged drought. Such events could disrupt our operations or those of our customers or third parties on which we rely, including through direct damage to assets and indirect impacts from supply chain disruption and market volatility. Additionally, transitioning to a low-carbon economy may entail extensive policy, legal, technology and market initiatives. Transition risks, including changes in consumer preferences and additional regulatory requirements or taxes, could increase our expenses and undermine our strategies. In addition, our reputation and client relationships may be damaged as a result of our practices related to climate change, including our involvement, or our clients’ involvement, in certain industries or projects associated with causing or exacerbating climate change, as well as any decisions we make to continue to conduct or change our activities in response to considerations relating to climate change. As climate risk is interconnected with many key risk types, we have developed and continue to enhance processes to embed climate risk considerations into our risk management strategies established for risks such as market, credit and operational risks; however, because the timing and severity of climate change may not be predictable, our risk management strategies may not be effective in mitigating climate risk exposure.
We are in the process of enhancing our climate and environmental, social and corporate governance ("ESG") risk considerations into our risk framework and risk management programs established for strategic, credit, market, compliance, operational and reputational risks. The potential of climate risk is monitored through our risk identification process. Once identified, climate risks are assessed for potential impacts on us and our customers. These future enhancements to our risk framework are in development and will continue to be refined as new climate trends and risks arise.
GLOBAL pandemics COULD adversely affect THE OPERATIONS OF us and our customers.
The spread of global pandemics could create a global public-health crisis, as previously seen with that of the COVID-19 pandemic, that can result in widespread volatility and deteriorations in household, business, economic, and market conditions. Pandemics can cause many state governments to enact social distancing requirements, which could adversely impact the economy due to the vast restrictions and forced closures of non-essential businesses during the quarantine periods. As a result, many of our customers would be adversely affected by business closures, staffing issues and/or other business restrictions. Accordingly, global pandemics may result in a significant decrease in our customers’ business and/or cause our customers to be unable to meet existing payment or other obligations to us. These adverse impacts on the businesses of our customers could cause a material adverse effect to our business, financial condition, and results of operations.
ECONOMIC CONDITIONS IN WESBANCO’S MARKET AREAS COULD NEGATIVELY IMPACT EARNINGS.
Wesbanco Bank serves both individuals and business customers primarily throughout West Virginia, Ohio, western Pennsylvania, Kentucky, Indiana, Maryland, northern Virginia and Tennessee. The substantial majority of Wesbanco’s loan portfolio is to individuals and businesses in these markets. As a result, the financial condition, results of operations and cash flows of Wesbanco are affected by local and regional economic conditions, as well as national economic conditions. A downturn in these economies could have a negative impact on Wesbanco and the ability of the Bank’s customers to repay their loans. The value of the collateral securing loans to borrowers may also decline as the economy declines. As a result, deteriorating economic conditions in these markets could cause a decline in the overall quality of Wesbanco’s loan portfolio requiring Wesbanco to charge-off a higher percentage of loans and/or increase its allowance for credit losses. A decline in economic conditions in these markets may also force customers to utilize deposits held by Wesbanco Bank in order to pay current expenses causing the Bank’s deposit base to shrink. As a result, the Bank may have to borrow funds at higher rates in order to meet liquidity needs. Volatility in oil and gas prices may impact shale gas activity in West Virginia, Ohio and Pennsylvania, which may somewhat negatively impact local and regional economic conditions, affecting both commercial and retail customers, resulting in potentially lower oil and gas related royalty deposits and potential credit deterioration in the loan portfolio.
WESBANCO COULD BE ADVERSELY AFFECTED BY CHANGES TO THE FISCAL, POLITICAL AND OTHER FEDERAL POLICIES.
Changes in general economic or political policies in the United States or other regions could adversely impact Wesbanco’s business as well as the Bank’s customers. The current United States administration has indicated that it may propose significant changes with respect to a variety of issues, including international trade agreements, import and export regulations, tariffs and customs duties,
13
foreign relations, tax laws, corporate governance laws and corporate fuel economy standards, that could have a positive or negative impact on Wesbanco’s business and the Bank’s customers including those in the wholesale and distribution, manufacturing and retail industries.
WESBANCO IS SUBJECT TO EXTENSIVE GOVERNMENT REGULATION AND SUPERVISION.
Wesbanco is subject to extensive federal and state regulation, supervision and examination. Banking regulations are primarily intended to protect depositors’ funds, federal deposit insurance funds and the banking system as a whole, rather than corporate shareholders. These regulations affect Wesbanco’s lending practices, capital structure, investment practices, dividend policy, operations and growth, among other things. These regulations also impose obligations to maintain appropriate policies, procedure and controls. Congress and federal regulatory agencies continually review banking laws, regulations and policies for possible changes. Changes to statutes, regulations or regulatory policies, including changes in interpretation or implementation of statutes, regulations or policies, could affect Wesbanco in substantial and unpredictable ways. Such changes could subject Wesbanco to additional costs, limit the types of financial services and products that could be offered, and/or increase the ability of non-banks to offer competing financial services and products, among other things. Failure to comply with laws, regulations or policies could result in sanctions by regulatory agencies, civil penalties and/or reputation damage, which could have a material adverse effect on Wesbanco’s business, financial condition and result of operations.
As of December 31, 2023, Wesbanco had $131.0 million in junior subordinated debt presented as a separate category of long-term debt on its Consolidated Balance Sheets. For regulatory purposes, Trust Preferred Securities totaling $126.9 million underlying such junior subordinated debt were previously included in Tier 1 capital in accordance with regulatory reporting requirements prior to December 31, 2019. Rules issued in 2013 generally exclude trust preferred securities from Tier 1 capital beginning in 2015. A grandfather provision permitted bank holding companies with consolidated assets of less than $15 billion to continue counting existing trust preferred securities as Tier 1 capital until maturity. As of December 31, 2019, Wesbanco’s assets were greater than $15 billion; therefore, all such securities are no longer counted as Tier 1 capital but instead are counted as Tier 2 capital subject to limits.
In addition, international capital standards known as Basel III, which were implemented by a U.S. federal banking agencies’ joint final rule issued in July 2013, and effective January 1, 2015, further increase the minimum capital requirements applicable to Wesbanco and the Bank, which may negatively impact both entities. Additional information about these changes in capital requirements are described above in “Item 1. Business—Capital Requirements.”
Regulation of Wesbanco and its subsidiaries is expected to continue to expand in scope and complexity in the future. These laws are expected to have the effect of increasing Wesbanco’s costs of operating and reducing its revenues, and may limit its ability to pursue business opportunities or otherwise adversely affect its business and financial condition. The Dodd-Frank Act and other laws, as well as rules implementing or related to them, may adversely affect Wesbanco. Specifically, any governmental or regulatory action having the effect of requiring Wesbanco to obtain additional capital or increase short-term liquidity could reduce earnings and have a material dilutive effect on current shareholders, including the Dodd-Frank Act source of strength requirement that bank holding companies make capital infusions into a troubled subsidiary bank. Legislation and regulation of overdraft fees and charges, debit card fees, credit cards and other bank services, as well as changes in Wesbanco’s practices relating to those and other bank services, may affect Wesbanco’s revenue and other financial results. Additional information about increased regulation is provided in “Item 1. Business” under the headings “Supervision and Regulation,” “Holding Company Regulations,” “Capital Requirements,” “Dodd-Frank Act,” and “Consumer Protection Laws.”
SEVERE WEATHER, NATURAL DISASTERS, DISEASE PANDEMICS, ACTS OF WAR OR TERRORISM, INTERNATIONAL HOSTILITIES, DOMESTIC CIVIL UNREST AND OTHER EXTERNAL EVENTS COULD SIGNIFICANTLY ADVERSELY IMPACT WESBANCO’S BUSINESS.
The unpredictable nature of events such as severe weather, natural disasters, disease pandemics, acts of war or terrorism, international hostilities, domestic civil unrest and other adverse external events could have a significant impact on Wesbanco’s ability to conduct business. If any of our financial, accounting, network or other information processing systems fail or have other significant shortcomings due to external events, Wesbanco could be materially adversely affected. Third parties with which Wesbanco does business could also be sources of operational risk to Wesbanco, including the risk that the third parties’ own network and information processing systems could fail. Any of these occurrences could materially diminish Wesbanco’s ability to operate or result in potential liability to customers, reputational damage, and regulatory intervention, any of which could materially adversely affect Wesbanco. Such events could affect the stability of Wesbanco’s deposit base, impair the ability of borrowers to repay outstanding loans, impair the value of collateral securing loans, impair Wesbanco’s liquidity, result in loss of revenue, and/or cause Wesbanco to incur additional expenses.
14
THE SOUNDNESS OF OTHER FINANCIAL INSTITUTIONS COULD ADVERSELY IMPACT WESBANCO.
Financial service institutions are interrelated as a result of trading, clearing, counterparty, or other relationships. Wesbanco has exposure to various industries and counterparties, and Wesbanco routinely executes transactions with counterparties in the financial industry, including brokers and dealers, commercial banks, investment banks, mutual and hedge funds and other institutions. As a result, a default by, or potential default by, a financial institution could result in market-wide liquidity problems, losses or other financial institution defaults. Many of these transactions could expose Wesbanco to credit risk in the event of default of our counterparty or client. These losses or defaults could adversely affect our business, financial condition, and results of operations.
CURRENT MARKET INTEREST RATES AND COST OF FUNDS MAY NEGATIVELY IMPACT WESBANCO’S BANKING BUSINESS.
Fluctuations in interest rates may negatively impact the business of the Bank. The Bank’s main source of income from operations is net interest income, which is equal to the difference between the interest income received on interest-bearing assets (usually loans and investment securities) and the interest expense incurred in connection with interest-bearing liabilities (usually deposits and borrowings). These rates are highly sensitive to many factors beyond Wesbanco’s control, including general economic conditions, both domestic and foreign, and the monetary and fiscal policies of various governmental and regulatory authorities. Wesbanco Bank’s net interest income can be affected significantly by changes in market interest rates and the shape of the yield curve. Changes in relative interest rates may reduce the Bank’s net interest income as the difference between interest income and interest expense decreases. As a result, the Bank has adopted asset and liability management policies to minimize the potential adverse effects of changes in interest rates on net interest income, primarily by altering the mix and maturity of loans, investments and funding sources. However, even with these policies in place and with an asset-sensitive balance sheet at year-end that should benefit net interest income as interest rates increase, Wesbanco cannot be certain that changes in interest rates or the shape of the interest rate yield curve will not negatively impact its results of operations or financial position. The increase in interest rates in 2023 caused a decrease in the fair value of securities within our investment portfolio of which the unrealized losses were recorded in other comprehensive income.
In a period of rising rates with a relatively flat or inverted yield curve environment, Wesbanco’s cost of funds for banking operations may increase at a faster pace than loan and investment yields. The cost of funds may also increase as a result of future general economic conditions, interest rates and competitive pressures. The Bank has traditionally obtained funds principally through deposits and borrowings from the Federal Home Loan Bank (FHLB), correspondent banks, and other wholesale borrowing sources. As a general matter, deposits are a cheaper source of funds than borrowings because interest rates paid for deposits are typically less than interest rates charged for borrowings. If, as a result of general economic conditions, market interest rates, competitive pressures or higher deposit betas in relation to increases in federal funds rate increases, the value of deposits at the Bank decreases relative to its overall banking operations, the Bank may have to rely more heavily on borrowings as a source of funds in the future.
SIGNIFICANT DECLINES IN U.S. AND GLOBAL MARKETS COULD HAVE A NEGATIVE IMPACT ON WESBANCO’S EARNINGS.
The capital and credit markets could experience extreme disruption. These conditions result in less liquidity, greater volatility, widening of credit spreads and a lack of price transparency in certain asset types. In many cases, markets could exert downward pressure on stock prices, security prices and credit capacity for certain issuers without regard to those issuers’ underlying financial strength. Sustained weakness in business and economic conditions in any or all of the domestic or foreign financial markets could result in credit deterioration in investment securities held by us, rating agency downgrades for such securities or other market factors that (such as lack of liquidity for re-sales, absence of reliable pricing information or unanticipated changes in the competitive market) could result in us having to recognize other-than-temporary impairment in the value of such investment securities, with a corresponding charge against earnings. Furthermore, our pension assets are primarily invested in equity and debt securities, and weakness in capital and credit markets could result in deterioration of these assets, and changes in certain key pension assumptions based on current interest rates, long-term rates of return and other economic or actuarial assumptions may increase minimum funding contributions and future pension expense. If these markets were to deteriorate further, these conditions may be material to Wesbanco’s ability to access capital and may adversely impact results of operations.
Further, Wesbanco’s trust and investment services income could be impacted by fluctuations in the securities market. A portion of this revenue is based on the value of the underlying investment portfolios. If the values of those investment portfolios decline, the Bank’s revenue could be negatively impacted.
Inflation can also have a significant effect upon interest rates and ultimately upon financial performance. Wesbanco’s ability to cope with inflation and to respond to changing market interest rates, as well as its ability to manage the various elements of non-interest income and expense during periods of increasing or decreasing inflation could have a significant impact on profitability. Wesbanco monitors the level and mix of interest-rate sensitive assets and liabilities through its Asset/Liability Committee ("ALCO") in order to reduce the impact of inflation on net interest income. Management may not be able to control the effects of inflation as needed and the results may adversely impact results of operations.
15
A HIGH PERCENTAGE OF WESBANCO’S LOAN PORTFOLIO IS IN WEST VIRGINIA, OHIO, PENNSYLVANIA, KENTUCKY, INDIANA, MARYLAND, VIRGINIA AND TENNESSEE AND IN COMMERCIAL AND RESIDENTIAL REAL ESTATE. DETERIORATIONS IN ECONOMIC CONDITIONS IN THIS AREA OR IN THE REAL ESTATE MARKET GENERALLY COULD BE MORE HARMFUL TO THE COMPANY COMPARED TO MORE DIVERSIFIED INSTITUTIONS.
As of December 31, 2023, approximately 21% of Wesbanco’s loan portfolio was comprised of residential real estate loans, and 56% was comprised of commercial real estate loans.
Inherent risks of commercial real estate (“CRE”) lending include the cyclical nature of the real estate market, construction risk and interest rate risk. The cyclical nature of real estate markets can cause CRE loans to suffer considerable distress. During these times of distress, a property’s performance can be negatively affected by tenants’ deteriorating credit strength and lease expirations in times of softening demand caused by economic deterioration or over-supply conditions. Even if borrowers are able to meet their payment obligations, they may find it difficult to refinance their full loan amounts at maturity due to declines in property value. Other risks associated with CRE lending include regulatory changes and environmental liability. Regulatory changes in tax legislation, zoning or similar external conditions including environmental liability may affect property values and the economic feasibility of existing and proposed real estate projects.
The Company’s CRE loan portfolio is concentrated predominantly in West Virginia, Ohio, Pennsylvania, Kentucky, Indiana, Maryland, northern Virginia and Tennessee. There are a wide variety of economic conditions within the local markets of the eight states in which most of the company’s CRE loan portfolio is situated. Rates of employment, consumer loan demand, household formation, and the level of economic activity can vary widely from state to state and among metropolitan areas, cities and towns. Metropolitan markets comprise various submarkets where property values and demand can be affected by many factors, such as demographic makeup, geographic features, transportation, recreation, local government, school systems, utility infrastructure, tax burden, building-stock age, zoning and building codes, and available land for development. As a result of the high concentration of the company’s loan portfolio, it may be more sensitive, as compared to more diversified institutions, to future disruptions in and deterioration of this market, which could lead to losses, which could have a material adverse effect on the business, financial condition and results of operations of the company.
RISKS INHERENT IN MUNICIPAL BONDS COULD HAVE A NEGATIVE IMPACT ON WESBANCO’S EARNINGS.
As of December 31, 2023, approximately 36% of Wesbanco’s total securities portfolio was invested in municipal bonds. Although Wesbanco’s municipal portfolio is broadly spread across the U.S., any downturn in the economy of a state or municipality in which Wesbanco holds municipal obligations could increase the default risk of the respective debt. In addition, a portion of Wesbanco’s municipal portfolio is comprised of Build America bonds. Due to the government sequester reducing the interest subsidy that the government provides to the issuing municipalities, extraordinary redemption provisions ("ERP") may be executed by the municipality if it is in their favor to do so. There is a risk that when an ERP is executed, Wesbanco may not recover its amortized cost in the bond if it was purchased at a premium. Credit risks are also prevalent when downgrades of credit ratings are issued by major credit rating agencies, which are caused by creditworthiness issues of both bond insurers and the municipality itself. Credit rating downgrades to a non-investment grade level may force Wesbanco to sell a municipal bond at a price where amortized cost may not be recovered. Rising interest rates could also cause the current market values of our municipal bond portfolio to decline as they all have a fixed interest component. Any of the above default risks, early redemption risks and credit risks could cause Wesbanco to take impairment charges, which could be significant, that would negatively impact earnings.
RISKS RELATED TO THE BUSINESS OF BANKING
CUSTOMERS MAY DEFAULT ON THE REPAYMENT OF LOANS, WHICH COULD SIGNIFICANTLY IMPACT RESULTS OF OPERATIONS THROUGH INCREASES IN THE PROVISION AND ALLOWANCE FOR CREDIT LOSSES.
The Bank’s customers may default on the repayment of loans, which may negatively impact Wesbanco’s earnings due to loss of principal and interest income. Increased operating expenses may result from the allocation of management time and resources to the collection and work-out of the loan. Collection efforts may or may not be successful causing Wesbanco to write off the loan or repossess the collateral securing the loan, which may or may not exceed the balance of the loan.
HIGHER FDIC DEPOSIT INSURANCE PREMIUMS AND ASSESSMENTS COULD ADVERSELY AFFECT WESBANCO’S FINANCIAL CONDITION.
The insurance premium is based on an assessment rate that utilizes a complex calculation that includes Wesbanco Bank’s CAMELS ratings, its ability to withstand asset-related and funding-related stress and potential loss severity of its assets. The FDIC periodically raises the base rate to ensure the Deposit Insurance Fund ("DIF") is at an appropriate level. If premium assessment rates were to further increase, it would negatively impact Wesbanco’s earnings.
16
RISKS RELATED TO ESTIMATES AND ASSUMPTIONS
THE CURRENT EXPECTED CREDIT LOSSES ACCOUNTING STANDARD ("CECL") COULD RESULT IN SIGNIFICANT VOLATILITY OF THE ESTIMATION OF CREDIT LOSSES AND MAY HAVE A MATERIAL IMPACT ON OUR FINANCIAL CONDITION OR RESULTS OF OPERATIONS.
In September 2016, the Financial Accounting Standards Board (“FASB”) issued an accounting standard update, ASU 2016-13 (Topic 326), “Measurement of Credit Losses on Financial Instruments,” which was adopted by Wesbanco as of January 1, 2020 and replaced the former “incurred loss” model for recognizing credit losses with an “expected loss” model referred to as the CECL model. Under the CECL model, we are required to present certain financial assets carried at amortized cost, such as loans held for investment and held-to-maturity debt securities, at the net amount expected to be collected. The allowance for credit losses under CECL is calculated utilizing the PD / LGD, which is then discounted to net present value. PD is the probability the asset will default within a given time frame and LGD is the percentage of the asset not expected to be collected due to default. The primary macroeconomic drivers of the quantitative model include forecasts of national unemployment and interest rates, as well as modeling adjustments for changes in prepayment speeds, loan risk grades, portfolio mix, concentrations and loan growth. Any changes in the model inputs may create more volatility in the level of our allowance for credit losses. Any material increase in our level of allowance for credit losses or expenses incurred to determine the appropriate level of the allowance for credit losses could adversely affect our business, financial condition and results of operations.
Wesbanco’s regulatory agencies (FDIC and WVDFI for the Bank and the Federal Reserve for Wesbanco) periodically review the allowance for credit losses. The regulatory agencies’ interpretations may differ from Wesbanco’s interpretations. These differences could negatively impact Wesbanco’s results of operations or financial position.
WESBANCO MAY BE REQUIRED TO WRITE DOWN GOODWILL AND OTHER INTANGIBLE ASSETS, CAUSING ITS FINANCIAL CONDITION AND RESULTS TO BE NEGATIVELY AFFECTED.
When Wesbanco acquires a business, a portion of the purchase price of the acquisition is allocated to goodwill and other identifiable intangible assets. The amount of the purchase price which is allocated to goodwill and other intangible assets is determined by the excess of the purchase price over the net identifiable assets acquired. Wesbanco’s goodwill was approximately $1.1 billion or 43% and $1.1 billion or 45% of stockholders’ equity as of December 31, 2023 and 2022, respectively. Under current accounting standards, if Wesbanco determines that goodwill or intangible assets are impaired, it is required to write down the carrying value of these assets. Wesbanco conducts an annual review to determine whether goodwill and other identifiable intangible assets are impaired. Wesbanco completed such an impairment analysis in late 2023 and concluded that no impairment charge was necessary for the year ended December 31, 2023. Wesbanco cannot provide assurance that it will not be required to take an impairment charge in the future. Any impairment charge would have a negative effect on its shareholders’ equity and financial results and may cause a decline in our stock price.
OPERATIONAL RISKS
DUE TO INCREASED COMPETITION, WESBANCO MAY NOT BE ABLE TO ATTRACT AND RETAIN BANKING CUSTOMERS AT CURRENT LEVELS.
Wesbanco operates in a highly competitive banking and financial industry that could become even more competitive as a result of legislative, regulatory and technological changes. Wesbanco faces banking competition in all the markets it serves from the following:
In particular, Wesbanco’s competitors include several major national financial companies whose greater resources may afford them a marketplace advantage by enabling them to maintain numerous banking locations and mount extensive promotional and advertising campaigns. Additionally, banks and other financial institutions may have products and services not offered by Wesbanco such as new payment system technologies and cryptocurrency, which may cause current and potential customers to choose those institutions. Areas of competition include interest rates for loans and deposits, efforts to obtain deposits and range and quality of services
17
provided. Competitively priced deposits from other banks may cause a loss of deposits to be replaced by more expensive wholesale funding. Wesbanco also faces competition from financial technology (“FinTech”) companies, who may more efficiently underwrite and close small business and consumer loans as well as more quickly and efficiently open deposit accounts. In addition to providing products and services traditionally offered by banks, some FinTech companies allow customers to complete financial transactions without the need for bank intermediaries. This could result in the loss of revenue from transaction fees and fewer customer accounts. If Wesbanco is unable to attract new and retain current customers, loan and deposit growth could decrease, causing Wesbanco’s results of operations and financial condition to be negatively impacted.
WESBANCO MAY NOT BE ABLE TO EXPAND ITS TRUST AND INVESTMENT SERVICES SEGMENT AND RETAIN ITS CURRENT CUSTOMERS.
Wesbanco may not be able to attract new and retain current investment management clients due to competition from the following:
Its ability to successfully attract and retain investment management clients is dependent upon its ability to compete with competitors’ investment products, level of investment performance, client services and marketing and distribution capabilities. Due to changes in economic conditions, the performance of the trust and investment services segment may be negatively impacted by the financial markets in which investment clients’ assets are invested, causing clients to seek other alternative investment options. If Wesbanco is not successful, its results from operations and financial position may be negatively impacted.
FUTURE EXPANSION BY WESBANCO MAY ADVERSELY AFFECT OUR FINANCIAL CONDITION AND RESULTS OF OPERATIONS AS WELL AS DILUTE THE INTERESTS OF OUR SHAREHOLDERS AND NEGATIVELY AFFECT THE PRICE OF OUR COMMON STOCK.
Wesbanco may acquire other financial institutions, or branches or assets of other financial institutions, in the future. Wesbanco may also open new branches and enter into new lines of business or offer new products or services. Any such expansion of our business will involve a number of expenses and risks, which may include:
We can give no assurance that integration efforts for any future acquisitions will be successful. Our inability to successfully integrate future acquisitions could have a material adverse effect on our business, financial condition or results of operations. In addition,
18
we may issue equity securities in connection with acquisitions, which could dilute the economic and voting interests of our existing shareholders.
No assurance can be given that Wesbanco will be successful overcoming the risks as disclosed above. The risks associated with entering into a new market and any inability to overcome these risks could have a material adverse effect on our business, financial condition or results of operations.
SUITABLE ACQUISITION OPPORTUNITIES MAY NOT BE AVAILABLE TO WESBANCO IN THE FUTURE.
Wesbanco continually evaluates opportunities to acquire other businesses. However, Wesbanco may not have the opportunity to make suitable acquisitions on favorable terms in the future, which could negatively impact the growth of its business. Wesbanco expects that other banking and financial companies, many of which have significantly greater resources, will compete to acquire compatible businesses. This competition could increase prices for acquisitions that Wesbanco would likely pursue, and its competitors may have greater resources than it does. Also, acquisitions of regulated businesses such as banks are subject to various regulatory approvals. If Wesbanco fails to receive the appropriate regulatory approvals, it will not be able to consummate an acquisition that it believes is in its best interests.
WESBANCO IS EXPOSED TO OPERATIONAL RISK THAT COULD ADVERSELY IMPACT THE COMPANY.
Wesbanco is exposed to multiple types of operational risk, including reputational risk, legal and compliance risk, the risk of fraud or theft by employees or outsiders, clerical or record-keeping errors and computer or telecommunications systems malfunctions. Wesbanco’s business is dependent on the ability to process a large number of increasingly complex transactions. Wesbanco could be materially and adversely affected if employees, clients, counterparties or other third parties caused an operational breakdown or failure, as a result of either human error, fraudulent manipulation or purposeful damage to any of our operations or systems.
LOSS OF KEY EMPLOYEES COULD IMPACT GROWTH AND EARNINGS AND MAY HAVE AN ADVERSE IMPACT ON BUSINESS.
Our operating results and ability to adequately manage our growth are highly dependent on the services, managerial abilities and performance of our key employees, including executive officers and senior management. Our success depends upon our ability to attract and retain highly skilled and qualified management, loan origination, finance, administrative, marketing and technical personnel and upon the continued contributions of management personnel. The loss of services, or the inability to successfully complete planned or unplanned transitions of key personnel approaching normal retirement age, could have an adverse impact on Wesbanco’s business, operating results and financial condition because of their skills, knowledge of the local markets, years of industry experience and the difficulty of promptly finding qualified replacement personnel. In addition, the transition to increased work-from-home (remote or hybrid work environments) may exacerbate the challenges of attracting and retaining talented and diverse employees as job markets may be less constrained by physical geography. Filling open positions is also challenging in this environment and may adversely impact our business segments.
LIMITED AVAILABILITY OF BORROWINGS AND LIQUIDITY FROM THE FEDERAL HOME LOAN BANK SYSTEM AND OTHER SOURCES COULD NEGATIVELY IMPACT EARNINGS.
Wesbanco Bank is currently a member bank of the Federal Home Loan Bank (“FHLB”) of Pittsburgh. Membership in this system of quasi-governmental, regional home-loan oriented agency banks allows us to participate in various programs offered by the FHLB. We borrow funds from the FHLB, which are secured by a blanket lien on certain residential and commercial mortgage loans, and if applicable, investment securities with collateral values in excess of the outstanding balances. Future earnings shortfalls and minimum capital requirements of the FHLB may impact the collateral necessary to secure borrowings and limit the borrowings extended to their member banks, as well as require additional capital contributions by member banks. The FHLB’s rating assigned to Wesbanco Bank may also negatively impact the amount of term collateral and other conditions imposed by the FHLB upon Wesbanco Bank. Should these situations occur, Wesbanco’s short-term liquidity needs could be negatively impacted. If Wesbanco was restricted from using FHLB advances due to weakness in the system or with the FHLB of Pittsburgh, Wesbanco may be forced to find alternative funding sources. If Wesbanco is required to rely more heavily on higher cost funding sources, revenues may not increase proportionately to cover these costs, which would adversely affect Wesbanco’s results of operations and financial position.
WESBANCO’S FINANCIAL CONDITION AND RESULTS OF OPERATIONS DEPEND ON THE SUCCESSFUL GROWTH OF ITS SUBSIDIARIES.
Wesbanco’s primary business activity for the foreseeable future will be to act as the holding company of its banking and other subsidiaries. Therefore, Wesbanco’s future profitability will depend on the success and growth of these subsidiaries. In the future, part of Wesbanco’s growth may come from buying other banks and buying or establishing other companies. Such entities may not be profitable after they are purchased or established, and they may lose money or be dilutive to earnings per share, particularly for the first few years. A new bank or company may bring with it unexpected liabilities, bad loans, or poor employee relations, or the new bank or
19
company may lose customers and the associated revenue. Dilution of book and tangible book value may occur as a result of an acquisition that may not be earned back for several years, if at all.
WESBANCO MAY NEED TO RAISE CAPITAL IN THE FUTURE, BUT CAPITAL MAY NOT BE AVAILABLE WHEN NEEDED OR AT ACCEPTABLE TERMS.
Federal and state banking regulators require Wesbanco and its banking subsidiary, Wesbanco Bank, to maintain adequate levels of capital to support its operations. In addition, in the future Wesbanco may need to raise additional capital to support its business or to finance acquisitions, if any, or Wesbanco may otherwise elect to raise additional capital in anticipation of future growth opportunities. Since Wesbanco’s total assets increased above $15 billion due to recent acquisitions, certain trust preferred securities are no longer included in the Tier 1 capital of the risk-based capital guidelines; however, they are counted as Tier 2 capital.
Although Wesbanco successfully raised $150 million of Series A preferred stock in 2020 and also issued $150 million of fixed-to-floating subordinated debentures in 2022, Wesbanco’s ability to raise additional Tier 1 or Tier 2 capital for parent company or banking subsidiary needs will depend on conditions and interest rates at that time in the capital markets, overall economic conditions, Wesbanco’s financial performance and condition, and other factors, many of which are outside our control. There is no assurance that, if needed, Wesbanco will be able to raise additional equity or secured /unsecured debt that may count as Tier 1 or Tier 2 capital on favorable terms or at all. An inability to raise additional capital may have a material adverse effect on our ability to expand operations, and on our financial condition, results of operations and future prospects.
WESBANCO’S ABILITY TO MITIGATE RISK DEPENDS ON OUR ENTERPRISE RISK MANAGEMENT FRAMEWORK.
Wesbanco has implemented a risk appetite statement and an enterprise risk management framework to identify and manage our risk exposures while maintaining a safe and sound banking organization. This framework is comprised of various processes, systems and strategies, and is designed to manage the types of risk to which we are subject, including, among others, credit, legal and compliance, liquidity, market, operational, reputational and strategic risks. Included in this framework are three independent lines of defense, which allows Wesbanco to effectively govern and manage risk. If our risk management framework is not effective, Wesbanco could be exposed to unexpected losses and become subject to regulatory consequences, as a result of which our business, financial condition, results of operations or prospects could be materially adversely affected.
RISKS RELATED TO THE USE OF TECHNOLOGY
INTERRUPTION TO OUR INFORMATION SYSTEMS OR BREACHES IN SECURITY COULD ADVERSELY AFFECT WESBANCO’S OPERATIONS.
Wesbanco relies on information systems and communications for operating and monitoring all major aspects of business, as well as internal management functions. Any failure, interruption, intrusion or breach in security of these systems could result in failures or disruptions in the Wesbanco customer relationship, management, general ledger, deposit, loan and other systems. While Wesbanco has policies, procedures and technical safeguards designed to prevent or limit the effect of any failure, interruption, intrusion or security breach of its information systems, and also performs testing of business continuity and disaster recovery plans, there can be no absolute assurance that the above-noted issues will not occur or, if they do occur, that they will be adequately addressed.
There have been efforts on the part of third parties to breach data security at various financial institutions. The ability of our customers to bank remotely, including online and through mobile devices, requires secure transmission of confidential information and increases the risk of data security breaches. Because the techniques used to attack financial services company communications and information systems change frequently (and generally increase in sophistication), often attacks are not recognized until launched against a target, may be supported by foreign governments or other well-financed entities, and may originate from less regulated and remote areas around the world, we may be unable to address these techniques in advance of attacks, including by implementing adequate preventative measures. Certain financial institutions in the United States have also experienced attacks from technically sophisticated and well-resourced third parties that were intended to disrupt normal business activities by making internet banking systems inaccessible to customers for extended periods. These “denial-of-service” attacks, if attempted, would require substantial resources to defend, and may affect customer satisfaction and behavior. Moreover, the development and maintenance of preventative and detective measures is costly and requires ongoing monitoring and updating as technologies change and efforts to overcome security measures become more sophisticated. Despite our efforts, the possibility of these events occurring cannot be eliminated.
Cyber-attacks on third party retailers or other business establishments that widely accept debit card or check payments could compromise sensitive bank customer information, such as debit card and account numbers. Such an attack could result in significant costs to the bank, such as costs to reimburse customers, reissue debit cards and open new customer accounts.
20
The occurrence of any such failure, disruption or security breach of Wesbanco’s information systems, particularly if widespread or resulting in financial losses to our customers, could damage Wesbanco’s reputation, result in a loss of customer business, subject Wesbanco to additional regulatory scrutiny, and expose Wesbanco to civil litigation and possible financial liability. In addition, the prevalence of cyber-attacks and other efforts to breach or disrupt our systems has led, and will continue to lead, to costs to Wesbanco with respect to prevention and mitigation of these risks, as well as costs reimbursing customers for losses suffered as a result of these actions. Successful attacks or systems failures at other large financial institutions, whether or not Wesbanco is included, could lead to a general loss of customer confidence in financial institutions with a potential negative impact on Wesbanco’s business, additional demands on the part of our regulators, and increased costs to deal with risks identified as a result of the problems affecting others. The risks described above could have a material effect on Wesbanco’s business, results of operations and financial condition.
WESBANCO DEPENDS ON THIRD PARTIES FOR PROCESSING AND HANDLING OF COMPANY RECORDS AND DATA.
Wesbanco relies on software developed by third party vendors to process various transactions. These transactions include, but are not limited to, general ledger, payroll, employee benefits, trust record keeping, loan and deposit processing, merchant processing, and securities portfolio management. While Wesbanco performs a review of controls instituted by the vendors over these programs in accordance with industry standards and performs its own testing of user controls, Wesbanco must rely on the continued maintenance and improvement of these controls by the third party, including safeguards over the security of customer data. In addition, Wesbanco maintains backups of key processing output daily in the event of a failure on the part of any of these systems. Nonetheless, Wesbanco may incur a temporary disruption in its ability to conduct its business or process its transactions or incur damage to its reputation if the third party vendor, or the third party vendor’s subcontractor, fails to adequately maintain internal controls or institute necessary changes to systems. Such disruption or breach of security may have a material adverse effect on Wesbanco’s business, financial condition, and results of operations.
FAILURE TO KEEP PACE WITH TECHNOLOGICAL CHANGE COULD ADVERSELY AFFECT WESBANCO’S RESULTS OF OPERATIONS AND FINANCIAL CONDITION.
The financial services industry is continually undergoing rapid technological change with frequent introductions of new technology-driven products and services. The effective use of technology increases efficiency and enables financial institutions to better serve customers and to reduce costs. Wesbanco’s future success depends, in part, upon its ability to address customer needs by using technology to provide products and services that will satisfy customer demands, as well as to create additional efficiencies in Wesbanco’s operations, which was done in 2021 as Wesbanco completed its core banking software conversion. The adoption of new technologies by competitors, including internet banking services, mobile applications, advanced ATM functionality and cryptocurrencies could require Wesbanco to make additional substantial investments to modify or adapt the existing products and services or even radically alter the way Wesbanco conducts business. These and other capital investments in the Company's business may not produce expected growth in earnings anticipated at the time of the expenditure. Wesbanco also may not be able to effectively implement new technology-driven products and services or be successful in marketing these products and services to its customers. Failure to successfully keep pace with technological change affecting the financial services industry could negatively affect Wesbanco’s growth, revenue, and profit.
LIQUIDITY AND CAPITAL RISKS
WESBANCO HAS OUTSTANDING SECURITIES SENIOR TO OUR COMMON STOCK WHICH COULD LIMIT OUR ABILITY TO PAY DIVIDENDS ON THE COMMON STOCK.
Wesbanco has outstanding Series A Preferred Stock that is senior to our common stock and could adversely affect our ability to declare or pay dividends or distributions on our common stock. The terms of the preferred stock offering prohibits us from declaring or paying dividends or making distributions on our common stock unless the full dividends for the most recently completed dividend period have been declared and paid, or set aside for payment, on all outstanding shares of Series A Preferred Stock. Whenever dividends on any shares of Series A Preferred Stock have not been declared and paid for the equivalent of six or more dividend payments, whether or not for consecutive dividend periods (a “Nonpayment Event”), the holders of Series A Preferred Stock, voting together as a class with holders of any and all other series of voting preferred stock then outstanding would be entitled to vote for the election of a total of two additional members of our board of directors (the “Preferred Stock Directors”), provided that our board of directors shall at no time include more than two Preferred Stock Directors and that the election of any Preferred Stock Directors shall not cause us to violate the corporate governance requirements of the Nasdaq Stock Market (or any other exchange on which our securities may be listed) including the requirements that listed companies must have a majority of independent directors. In the event that the holders of the Series A Preferred Stock and other holders of voting preferred stock are entitled to vote for the election of the Preferred Stock Directors following a Nonpayment Event, the number of directors on our board of directors shall automatically increase by two, and the new directors shall be elected at a special meeting called at the request of the holders of record of at least 20% of the Series A Preferred Stock or of any other series of voting preferred stock (unless such request is received less than 90 days before the date fixed for the next annual or special meeting of the shareholders, in which event such election shall be held only at such next annual or special meeting of shareholders), and at each subsequent annual meeting. These voting rights will continue until dividends on the shares of Series A Preferred Stock and any
21
such series of voting preferred stock for at least four consecutive dividend periods following the Nonpayment Event shall have been fully paid (or declared and a sum sufficient for the payment of such dividends shall have been set aside for payment).
WESBANCO’S ABILITY TO PAY DIVIDENDS IS LIMITED, AND COMMON STOCK DIVIDENDS MAY HAVE TO BE REDUCED OR ELIMINATED.
Subject to restrictions described in the previous risk factor, holders of shares of Wesbanco’s common stock are entitled to dividends if, when, and as declared by Wesbanco’s Board of Directors out of funds legally available for that purpose. Although the Board of Directors has declared and increased shareholder dividends in the past, the current ability to pay such dividends is largely dependent upon the receipt of dividends from the Bank. Federal and state laws impose restrictions on the ability of the Bank to pay dividends, which restrictions are more fully described in “Item 1. Business—Payment of Dividends.” In general, future dividend policy is subject to the discretion of the Board of Directors and will depend upon a number of factors, including Wesbanco’s and the Bank’s future earnings, liquidity and capital requirements, regulatory constraints and financial condition.
Volatility in the price and volume of our stock may be unfavorable.
The market price of our common stock can be volatile and could be subject to wide fluctuations in price in response to various factors, some of which are beyond our control. Some of these factors include, without limitation:
At times, the stock markets, including the Nasdaq Stock Market, on which our common stock is listed, may experience significant price and volume fluctuations. As a result, the market price of our common stock is likely to be similarly volatile and investors in our common stock may experience a decrease in the value of their shares, including decreases unrelated to our operating performance or prospects.
In addition, following periods of volatility in the overall market and the market price of a company’s securities, securities class action litigation has often been instituted against companies. This litigation, if instituted against us, could result in substantial costs and a diversion of our management’s attention and resources.
ITEM 1B. UNRESOLVED STAFF COMMENTS
None.
ITEM 1C. CYBERSECURITY
Wesbanco maintains an Information Security and Cybersecurity program that is responsive to statutory and regulatory requirements, which includes policies, standards, rigorous testing by internal and external parties pursuant to those standards and policies and operating procedures. Wesbanco generally approaches cybersecurity threats through a cross-functional, multi-layered approach, with the specific goals of: (i) identifying, preventing and mitigating cybersecurity threats to Wesbanco; (ii) maintaining the confidence of its customers and business partners; and (iii) preserving the confidentiality of its customers’ and employees’ information. Wesbanco’s Information Security and Cybersecurity program is integrated into its overall enterprise risk management program and shares common methodologies, reporting channels and governance processes that apply across the enterprise risk management program to other legal, compliance, strategic, operational and financial risk areas. The bank also partners with trusted security vendors to help ensure that the security control infrastructure adequately addresses current and emerging technical threats with appropriate countermeasures. This oftentimes includes the engagement of consultative assistance for each of the three lines of defense to ensure appropriate technical expertise exists in the control area that is being evaluated and to maintain best practices.
22
As detailed in the risks related to the use of technology, third-party technology relationships pose a risk to the organization. As such, third-party risk management processes are aligned with regulatory requirements and are another key focus area within the bank's enterprise risk management framework. Wesbanco employs a third-party risk management program that includes a systematic evaluation of potential risks associated with engaging third-party vendors, suppliers or partners that may have access to Wesbanco’s sensitive information, systems or networks. This process is also intended to provide for the security and integrity of Wesbanco’s data that may be stored on third-party systems. The process identifies and addresses potential security vulnerabilities, safeguarding Wesbanco’s information assets and reducing the overall risk of cyber threats. Third-party providers are evaluated during onboarding and throughout the ongoing relationship based on the level of risk that the service being provided presents to the organization. The evaluation process includes a thorough review of operational practices related to cybersecurity and considers factors that impact the protection of bank and customer data.
Cybersecurity risks continue to evolve with certain risks leading the way. Risks experienced in the last year involved third party service providers, with no material impact to Wesbanco related to these incidents. Wesbanco continues to foster a risk averse focus and leverages various threat intelligence sources to continually evaluate current and future risks to the organization. The bank's cybersecurity strategy and roadmap is frequently evaluated and updated according to multiple inputs including any tangible cybersecurity incidents.
Cybersecurity threats, a security strategy roadmap, and key risk indicators are shared with management and the board of directors through both committee reporting structures and periodic reports of the Chief Security Officer. In addition, management updates our Enterprise Risk Management Committee, as necessary, regarding significant cybersecurity incidents. Our Enterprise Risk Management Committee regularly reports to the full Board of Directors regarding its activities, including those related to cybersecurity. As part of the Enterprise Risk Management Framework, cybersecurity oversight also utilizes the concept of three lines of defense which allows for multiple challenge response processes to continually mature the cybersecurity program. Cybersecurity best practices from the National Institute of Standards and Technology ("NIST") and the Center for Internet Security ("CIS") are used to establish, operate, and validate security controls.
The Enterprise Risk Management Committee is a board-level committee that focuses on enterprise risk which is inclusive of cybersecurity risks. Multiple directors have decades of experience, not only in the banking sector, but also have been responsible for cybersecurity and technology departments at larger organizations. The Chief Security Officer is responsible for providing the Information Security strategy and operational planning for the overall Information Security program. The Chief Security Officer has multiple decades of experience in the industry, advanced education degrees, and holds industry standard technical and security certifications. Several members of the Information Security leadership team also hold multiple security certifications that tie directly to their job responsibilities.
While Wesbanco and its third-party providers have in the past experienced cybersecurity incidents, Wesbanco is not aware of any current incidents or new types of threats which have materially affected or are reasonably likely to materially affect Wesbanco, including its business strategy, results of operations, or financial condition. We face ongoing risks from certain cybersecurity threats that, if realized, are reasonably likely to materially affect us, including our operations, business strategy, results of operations, or financial condition. See Item 1A, “Risk Factors – Interruption to Our Information Systems or Breaches in Security Could Adversely Affect Wesbanco’s Operations.”
ITEM 2. PROPERTIES
Wesbanco’s subsidiaries generally own their respective offices, related facilities and any unimproved real property held for future expansion. At December 31, 2023, Wesbanco operated 192 banking offices in West Virginia, Ohio, western Pennsylvania, Kentucky, southern Indiana and Maryland, of which 141 were owned and 51 were leased. Wesbanco also operated ten loan production offices leased in West Virginia, Ohio, western Pennsylvania, Maryland, Indiana, Tennessee and northern Virginia. These leases expire at various dates through January 2062 and generally include options to renew. The Bank also owns several regional headquarters buildings in various markets, most of which also house a banking office and/or certain back office functions.
The main office of Wesbanco is located at 1 Bank Plaza, Wheeling, West Virginia, in a building owned by the Bank. The building contains approximately 100,000 square feet and serves as the main office for both Wesbanco’s community banking segment and its trust and investment services segment, as well as its executive offices. The Bank’s major back office operations currently occupy approximately 90% of the space available in an office building connected via sky-bridge to the main office. This adjacent back office building is owned by Wesbanco Properties, Inc., a subsidiary of Wesbanco, with the remainder of the building leased to unrelated businesses.
At various building locations, Wesbanco rents or makes available commercial office space to unrelated businesses. Rental income totaled $1.6 million, $1.7 million and $1.8 million in 2023, 2022 and 2021, respectively. For additional disclosures related to Wesbanco’s properties, other fixed assets and leases, please refer to Note 5, “Premises and Equipment” in the Consolidated Financial Statements.
23
ITEM 3. LEGAL PROCEEDINGS
Wesbanco is also involved in lawsuits, claims, investigations and proceedings, which arise in the ordinary course of business. While any litigation contains an element of uncertainty, Wesbanco does not believe that a material loss related to such proceedings or claims pending or known to be threatened is reasonably possible.
ITEM 4. MINE SAFETY DISCLOSURES
Not Applicable.
24
PART II
ITEM 5. MARKET FOR REGISTRANT’S COMMON EQUITY, RELATED STOCKHOLDER MATTERS AND ISSUER PURCHASES OF EQUITY SECURITIES
Wesbanco’s common stock is quoted on the Nasdaq Global Select Stock Market under the symbol WSBC. The approximate number of record holders of Wesbanco’s $2.0833 par value common stock as of February 14, 2024 was 6,887. The number of holders does not include Wesbanco employees who have purchased stock or had stock allocated to them through Wesbanco’s Employee Stock Ownership and 401(k) plan (the “401(k)”). All Wesbanco employees who meet the eligibility requirements of the 401(k) are included in this retirement plan.
As of December 31, 2023, Wesbanco had one active stock repurchase plan which was approved by the Board of Directors on February 24, 2022 for 3.2 million shares. This plan provides for shares to be repurchased for general corporate purposes, which may include a subsequent resource for potential acquisitions, shareholder dividend reinvestment and/or employee benefit plans. The timing, price and quantity of purchases are at the discretion of Wesbanco, and the plan may be discontinued or suspended at any time. The plan has 1,021,901 shares remaining for repurchase.
Repurchases in the fourth quarter included open market purchases and those for the 401(k) and dividend reinvestment plans.
Certain information relating to securities authorized for issuance under equity compensation plans is set forth under the heading “Equity Compensation Plan Information” in Part III, “Item 12. Security Ownership of Certain Beneficial Owners and Management and Related Stockholder Matters.”
The following table shows the activity in Wesbanco's stock repurchase plan and other purchases for the quarter ended December 31, 2023:
Period |
|
Total Number |
|
|
Average Price |
|
|
Total Number of |
|
|
Maximum Number |
|
||||
Balance at September 30, 2023 |
|
|
|
|
|
|
|
|
|
|
|
1,021,901 |
|
|||
|
|
|
|
|
|
|
|
|
|
|
|
|
||||
October 1, 2023 to October 31, 2023 |
|
|
37,129 |
|
|
$ |
24.49 |
|
|
|
— |
|
|
|
1,021,901 |
|
November 1, 2023 to November 30, 2023 |
|
|
1,239 |
|
|
|
26.88 |
|
|
|
— |
|
|
|
1,021,901 |
|
December 1, 2023 to December 31, 2023 |
|
|
1,308 |
|
|
|
29.76 |
|
|
|
— |
|
|
|
1,021,901 |
|
Total |
|
|
39,676 |
|
|
$ |
24.74 |
|
|
|
— |
|
|
|
1,021,901 |
|
______
(1) Total shares purchased consist of open market purchases transacted in the 401(k) for employee benefit and dividend reinvestment plans.
(2) Consists of open market purchases and shares purchased from employees for the payment of withholding taxes to facilitate a stock compensation transaction.
25
The following graph shows a comparison of cumulative total shareholder returns for Wesbanco, the Russell 2000 Index and the S&P Regional Banks Select Industry Index. The total shareholder return assumes a $100 investment in the common stock of Wesbanco and each index since December 31, 2018 with reinvestment of dividends.
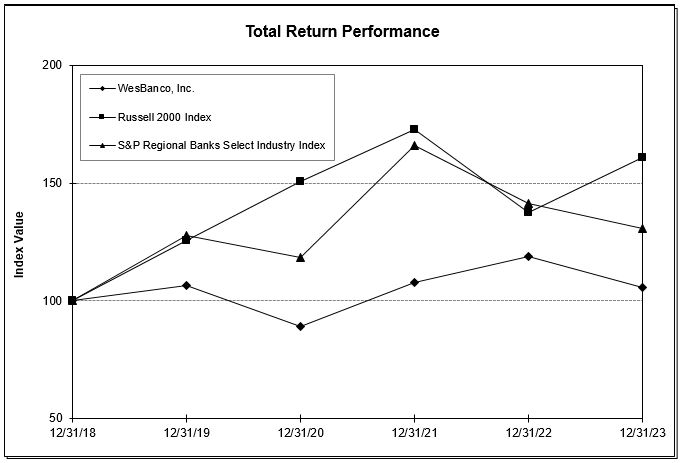
|
|
Period Ending |
|
|||||||||||||||||||||
|
|
December 31, |
|
|
December 31, |
|
|
December 31, |
|
|
December 31, |
|
|
December 31, |
|
|
December 31, |
|
||||||
Index |
|
2018 |
|
|
2019 |
|
|
2020 |
|
|
2021 |
|
|
2022 |
|
|
2023 |
|
||||||
Wesbanco, Inc. |
|
|
100.00 |
|
|
|
106.54 |
|
|
|
89.01 |
|
|
|
107.95 |
|
|
|
118.62 |
|
|
|
105.70 |
|
Russell 2000 |
|
|
100.00 |
|
|
|
125.53 |
|
|
|
150.58 |
|
|
|
172.90 |
|
|
|
137.56 |
|
|
|
160.85 |
|
S&P Regional Banks Select Industry Index |
|
|
100.00 |
|
|
|
127.64 |
|
|
|
118.58 |
|
|
|
165.90 |
|
|
|
141.42 |
|
|
|
130.91 |
|
ITEM 6. [RESERVED]
26
ITEM 7. MANAGEMENT’S DISCUSSION AND ANALYSIS OF FINANCIAL CONDITION AND RESULTS OF OPERATIONS
Management’s Discussion and Analysis ("MD&A") represents an overview of the results of operations and financial condition of Wesbanco. This discussion and analysis should be read in conjunction with the Consolidated Financial Statements and Notes thereto. This section generally discusses 2023 and 2022 items and year-to-year comparisons between 2023 and 2022. Discussions of 2021 items and year-to-year comparisons between 2022 and 2021 that are not included in this Form 10-K can be found in “Management’s Discussion and Analysis of Financial Condition and Results of Operations” in Part II, Item 7 of Wesbanco’s Annual Report on Form 10-K for the fiscal year ended December 31, 2022, as filed with the SEC on February 27, 2023.
FORWARD-LOOKING STATEMENTS
Forward-looking statements in this report relating to Wesbanco’s plans, strategies, objectives, expectations, intentions and adequacy of resources, are made pursuant to the safe harbor provisions of the Private Securities Litigation Reform Act of 1995. The information contained in this report should be read in conjunction with Wesbanco’s Form 10-Qs for the prior quarters ended March 31, June 30 and September 30, 2023, respectively, and documents subsequently filed by Wesbanco which are available at the SEC’s website, www.sec.gov or at Wesbanco’s website, www.wesbanco.com. Investors are cautioned that forward-looking statements, which are not historical fact, involve risks and uncertainties, including those detailed under “Risk Factors” in Part I, Item 1A of this Annual Report on Form 10-K. Such statements are subject to important factors that could cause actual results to differ materially from those contemplated by such statements, including, without limitation, the effects of changing regional and national economic conditions, changes in interest rates, spreads on earning assets and interest-bearing liabilities, and associated interest rate sensitivity; sources of liquidity available to Wesbanco and its related subsidiary operations; potential future credit losses and the credit risk of commercial, real estate, and consumer loan customers and their borrowing activities; actions of the Federal Reserve, the FDIC, the SEC, FINRA, the Municipal Securities Rulemaking Board, the SIPC, and other regulatory bodies; potential legislative and federal and state regulatory actions and reform, including, without limitation, the impact of the implementation of the Dodd-Frank Act; adverse decisions of federal and state courts; fraud, scams and schemes of third parties; cyber security breaches; competitive conditions in the financial services industry; rapidly changing technology affecting financial services; marketability of debt instruments and corresponding impact on fair value adjustments; and/or other external developments materially impacting Wesbanco’s operational and financial performance. Wesbanco does not assume any duty to update forward-looking statements.
APPLICATION OF CRITICAL ACCOUNTING POLICIES AND ESTIMATES
Wesbanco’s Consolidated Financial Statements are prepared in accordance with U.S. GAAP and follow general practices within the industries in which it operates. Application of these principles requires management to make estimates, assumptions and judgments that affect the amounts reported in the financial statements and accompanying notes. These estimates, assumptions and judgments are based on information available as of the date of the financial statements; accordingly, as this information changes, the financial statements could reflect different estimates, assumptions and judgments. Certain policies inherently have a greater reliance on the use of estimates, assumptions and judgments and as such have a greater possibility of producing results that could be materially different than originally reported.
The most significant accounting policies followed by Wesbanco are included in Note 1, “Summary of Significant Accounting Policies,” of the Consolidated Financial Statements. These policies, along with other Notes to the Consolidated Financial Statements and this MD&A, provide information on how significant assets and liabilities are valued in the financial statements and how those values are determined. Management has identified the allowance for credit losses, the evaluation of goodwill and other intangible assets for impairment and business combinations to be the accounting estimates that require the most subjective or complex judgments, and as such could be most subject to revision as new information becomes available.
Allowance for Credit Losses— Under CECL, acquired loans or pools of loans that have experienced more-than-insignificant credit deterioration are deemed to be purchased credit-deteriorated (“PCD”) loans, and are grossed-up on day 1 by the initial credit estimate through the allowance as opposed to a reduction in the loan’s amortized cost. The credit mark on acquired loans deemed not to be PCD loans are reflected as a reduction in the loan’s amortized cost, with an allowance and corresponding provision for credit losses recorded in the first reporting period after acquisition through current period earnings, while the loan mark will accrete through interest income over the life of such loans. At acquisition, Wesbanco will consider several factors as indicators that an acquired loan or pool of loans has experienced more-than-insignificant credit deterioration. These factors may include, but are not limited to, loans 30 days or more past due, loans with an internal risk grade of below average or lower, loans classified as non-accrual by the acquired institution, materiality of the credit and loans that have been previously modified. Upon adoption of this standard, acquired loans from prior acquisitions that met the guidelines under ASC 310-30 (formerly known as “purchased credit-impaired”) were reclassified as PCD loans. The accretable portion of the loan mark as of adoption date continues to accrete into interest income. However, the non-accretable portion of the loan mark was added to the allowance upon adoption, and any reversals of such mark will flow through the allowance in future periods. The loan mark on ASC 310-20 loans (“non-purchased credit-impaired”) from prior acquisitions continues to accrete through interest income over the life of such loans.
27
After the forecast period, Wesbanco reverts back to historical loss rates for a period of up to three years, adjusting for prepayments and curtailments, to estimate losses over the remaining life of loans. The most sensitive assumptions include the length of the forecast and reversion periods, forecast of unemployment and interest rate spreads and prepayment speeds. See Note 4, “Loans and Allowance for Credit Losses” for further detail.
The allowance for credit losses specific to loans reduces the loan portfolio to the net amount expected to be collected, representing the lifetime expected credit losses at the initial origination date. Similarly, an allowance for unfunded loan commitments, which is recorded in other liabilities, represents expected losses on unfunded commitments. Fluctuations in the allowance for credit losses specific to loans, the allowance for unfunded loan commitments, and the allowance for held-to-maturity debt securities are recognized in the provision for credit losses on the consolidated statement of operations. The allowance incorporates forward-looking information and applies a reversion methodology beyond the reasonable and supportable forecast. The allowance is increased by a provision charged to operating expense and reduced by charge-offs, net of recoveries. Management evaluates the appropriateness of the allowance at least quarterly. This evaluation is inherently subjective as it requires material estimates that may be susceptible to significant change from period to period.
The allowance for credit loss calculation specific to loans is based on the loan’s amortized cost basis, which is comprised of the unpaid principal balance of the loan, deferred loan fees (costs) and acquired premium (discount) minus any write-downs. Wesbanco made an accounting policy election to exclude accrued interest from the measurement of the allowance for credit losses, because the Company has a robust policy in place to reverse or write-off accrued interest when the loan is placed on non-accrual, and also made an accounting policy election to reverse accrued interest deemed uncollectible as a reversal of interest income. However, Wesbanco is reserving, as part of the allowance for credit losses, for accrued interest on loan modifications under the CARES Act due to the nature and timing of these deferrals.
The allowance for credit losses specific to loans reflects the risk of loss in the loan portfolio. To appropriately measure expected credit losses, management disaggregates the loan portfolio into pools of similar risk characteristics. The Company utilizes the PD / LGD approach to calculate the expected loss for each segment, which is then discounted to net present value. PD is the probability the asset will default within a given timeframe and LGD is the percentage of the assets not expected to be collected due to default. The primary macroeconomic drivers of the quantitative model include forecasts of national unemployment and interest rate spreads. Management relies on macroeconomic forecasts obtained from various reputable sources, which may include the Federal Open Market Committee forecast and other third party forecasts from well recognized, leading economists. These forecasts can range from one to two years, depending upon the facts and circumstances of the current state of the economy, portfolio segment and management’s judgment of what can be reasonably supported. The model reversion period can range from immediate to up to three years.
The allowance for credit losses specific to loans is calculated over the loan’s contractual life. For term loans, the contractual life is calculated based on the maturity date. For commercial and industrial (“C&I”) revolving loans with no stated maturity date, the contractual life is calculated based on the internal review date. For all other revolving loans, the contractual life is based on either the estimated maturity date or a default date. The contractual term does not include expected extensions, renewals or modifications.
Contractual terms are adjusted for estimated prepayments to arrive at expected cash flows. Wesbanco models term loans with an annualized “prepayment” rate. When Wesbanco has a specific expectation of differing payment behavior for a given loan, the loan may be evaluated individually. For revolving loans that do not have a principal payment schedule, a curtailment rate is factored into the cash flow.
The evaluation also considers qualitative factors such as economic trends and conditions, which includes levels of regional unemployment, real estate values and the impact on specific industries and geographical markets, changes in lending policies and underwriting standards, delinquency and other credit quality trends, concentrations of credit risk, if any, volume of activity, changes in lending staff, type of collateral and the results of internal loan reviews and examinations by bank regulatory agencies. Management relies on observable data from internal and external sources to the extent it is available to evaluate each of these factors and adjusts the actual historical loss rates to reflect the impact these factors may have on probable losses in the portfolio.
Commercial loans, including CRE and C&I that have unique characteristics, are tested individually for estimated credit losses. Specific reserves are established when appropriate for such loans based on the net present value of expected future cash flows of the loan or the estimated realizable value of the collateral, if any. The present value of expected future cash flows are discounted at the loan’s effective interest rate. The effective interest rate on a loan is the rate of return implicit in the loan, the loan’s observable market price, or the fair value of the collateral discounted by the estimated selling expenses, if the loan is collateral dependent. Wesbanco chooses the appropriate measurement method on a loan by loan basis for an individually evaluated loan, except for collateral dependent loans for which foreclosure of the collateral is probable. A loan is collateral dependent if repayment of the loan is to be provided solely by the underlying collateral. If the Bank determines that foreclosure of the collateral is probable, ASC 326-20 requires that the expected credit loss be based on the difference between the current fair value of the collateral discounted by the estimated selling expenses and the amortized cost basis of the financial asset. At this point, the loan would either be charged down or adequately reserved.
28
Determining the appropriateness of the allowance for credit losses is complex and requires significant management judgment about the effect of matters that are inherently uncertain. Due to those significant management judgments and the factors included in the calculation, significant changes to the allowance for credit losses could occur in future periods.
Goodwill — Wesbanco accounts for business combinations using the acquisition method of accounting. Accordingly, the identifiable assets acquired, the liabilities assumed, and any non-controlling interest of an acquired business are recorded at their estimated fair values as of the date of acquisition with any excess of the cost of the acquisition over the fair value recorded as goodwill. Goodwill is not amortized but is evaluated for impairment annually, or more often if events or circumstances indicate it may be impaired.
Wesbanco evaluates goodwill for impairment by determining if the fair value is greater than the carrying value of its reporting units. Wesbanco uses market capitalization, multiples of tangible book value, a discounted cash flow model, and various other market-based methods to estimate the current fair value of its reporting units. In particular, the discounted cash flow model includes various assumptions regarding an investor’s required rate of return on Wesbanco common stock, future loan loss provisions, future market spreads and net interest margins, along with various growth and economic recovery and stabilization assumptions of the economy as a whole. The resulting fair values of each method are then weighted based on the relevance and reliability of each respective method in light of the current economic environment to arrive at a weighted average fair value. The evaluation also considered macroeconomic conditions such as the general economic outlook, regional and national unemployment rates, and recent trends in equity and credit markets. Additionally, industry and market considerations, such as market-dependent multiples and metrics relative to peers, were evaluated. Wesbanco also considered recent trends in credit quality, overall financial performance, stock price appreciation, internal forecasts and various other market-based methods to estimate the current fair value of its reporting units. Since adopting ASU 2017-04, “Intangibles-Goodwill and Other (Topic 350)”, the impairment charge is based on the excess of a reporting unit’s carrying amount over its fair value. Wesbanco completed its annual goodwill impairment evaluation as of November 30, 2023. There were no indications of impairment as of November 30, 2023 nor December 31, 2023 as there were no significant change in market conditions, consolidated operating results or forecasted future results from November 30, 2023.
Wesbanco considered the sensitivity of significant assumptions in the impairment analysis including consideration of changes in estimated future cash flows and changes in the discount rate of the reporting units. The hypothetical sensitivity of the estimated fair value of the reporting units to an immediate and isolated increase of 100 basis points in the discount rate assumption at November 30, 2023, without consideration of any offsetting or simultaneous effects of other key assumptions, would not result in impairment, but could reduce the excess fair value over the carrying value to approximately 9%. The purpose of this sensitivity is to provide an indication of the isolated impacts of hypothetical alternative assumptions on modeled fair value estimates and is not considered probable.
Business Combinations— Business combinations are accounted for by applying the acquisition method. As of acquisition date, the identifiable assets acquired and liabilities assumed are measured at fair value and recognized separately from goodwill. Results of operations of the acquired entities are included in the consolidated statement of income from the date of acquisition. The calculation of intangible assets including core deposits and the fair value of loans are based on significant judgments. Core deposits intangibles are calculated using a discounted cash flow model based on various factors including discount rate, attrition rate, interest rate, cost of alternative funds and net maintenance costs.
Loans acquired in connection with acquisitions are recorded at their acquisition-date fair value with no carryover of related allowance for credit losses. Acquired loans are classified into two categories; PCD loans and non-PCD loans. PCD loans are defined as a loan or group of loans that have experienced more than insignificant credit deterioration since origination. Non-PCD loans will have an allowance established on acquisition date, which is recognized in the current period provision for credit losses. For PCD loans, an allowance is recognized on day 1 by adding it to the fair value of the loan, which is the “Day 1 amortized cost”. There is no credit loss expense recognized on PCD loans because the initial allowance is established by grossing-up the amortized cost of the PCD loan. Determining the fair value of the acquired loans involves estimating the principal and interest cash flows expected to be collected on the loans and discounting those cash flows at a market rate of interest. Management considers a number of factors in evaluating the acquisition-date fair value including the remaining life of the acquired loans, delinquency status, estimated prepayments, payment options and other loan features, internal risk grade, estimated value of the underlying collateral and interest rate environment.
29
EXECUTIVE OVERVIEW
Through successful operational execution, Wesbanco generated solid annual net income, while remaining a well-capitalized institution with sound liquidity and credit quality metrics. For the twelve months ended December 31, 2023, net income available to common shareholders was $148.9 million, or $2.51 per diluted share, as compared to $182.0 million, or $3.02 per diluted share, for the twelve months ended December 31, 2022. Net income available to common shareholders excluding after-tax restructuring and merger-related expenses (non-GAAP measure) was $151.9 million, or 2.56 per diluted share for the year ended December 31, 2023. These decreases were due in large part to the higher funding costs for both deposits and borrowings, inflationary cost pressures, and the recording of provision expense as compared to the benefit of a release of provision for credit losses in the prior year. Interest income increased $197.9 million or 38.5% to $711.5 million in 2023 compared to 2022. Net interest income increased $7.0 million or 1.5% from 2022, primarily due to loan growth and a rising rate environment. Non-interest income increased $3.1 million or 2.6% in 2023 compared to 2022, driven by a $2.7 million increase in net securities gains, and a $1.0 million increase in net gains on other real estate owned and other assets. Excluding restructuring and merger-related expenses, non-interest expense increased $30.9 million or 8.7%, driven by increases in FDIC insurance, salaries and wages, employee benefits and marketing expense.
Total assets as of December 31, 2023 were $17.7 billion, an increase of 4.6% as compared to December 31, 2022. As of December 31, 2023, total portfolio loans were $11.6 billion compared to $10.7 billion at December 31, 2022, reflecting an 8.7% increase year-over year. The loan growth funding is reflected within the increase in total borrowings of $615.8 million or 73.3% at December 31, 2023 compared to December 31, 2022. Criticized and classified loan balances decreased to 2.22% of total portfolio loans, as compared to 2.34% at December 31, 2022. Annualized net loan charge-offs to average loans for the full year period increased to four basis points compared to two basis points in 2022. Deposits remained steady in 2023, increasing by 0.3% from December 31, 2022.
Wesbanco continues to maintain what we believe are strong regulatory capital ratios, as both consolidated and bank-level regulatory capital ratios are well above the applicable “well-capitalized” standards promulgated by bank regulators and the BASEL III capital standards. At December 31, 2023, Tier I leverage was 9.87%, Tier I risk-based capital was 12.05%, total risk-based capital was 14.91%, and the common equity Tier 1 capital ratio was 10.99%.
Strong earnings enabled Wesbanco to increase the quarterly dividend to $0.36 per share in the fourth quarter of 2023, the seventeenth increase over the last thirteen years, cumulatively representing a 157% increase over that period.
30
Selected financial ratios for the years ended December 31, 2023, 2022 and 2021 are presented in the table below:
|
|
For the years ended December 31, |
|
|||||||||
(dollars in thousands, except shares and per share amounts) |
|
2023 |
|
|
2022 |
|
|
2021 |
|
|||
PER COMMON SHARE INFORMATION |
|
|
|
|
|
|
|
|
|
|||
Earnings per common share—basic |
|
$ |
2.51 |
|
|
$ |
3.03 |
|
|
$ |
3.54 |
|
Earnings per common share—diluted |
|
|
2.51 |
|
|
|
3.02 |
|
|
|
3.53 |
|
Earnings per common share—diluted, excluding certain items (1)(2) |
|
|
2.56 |
|
|
|
3.04 |
|
|
|
3.62 |
|
Dividends declared per common share |
|
|
1.41 |
|
|
|
1.37 |
|
|
|
1.32 |
|
Book value at year end |
|
|
40.23 |
|
|
|
38.55 |
|
|
|
40.91 |
|
Tangible book value at year end (1) |
|
|
21.28 |
|
|
|
19.43 |
|
|
|
22.61 |
|
Average common shares outstanding—basic |
|
|
59,303,210 |
|
|
|
60,047,177 |
|
|
|
65,520,527 |
|
Average common shares outstanding—diluted |
|
|
59,427,989 |
|
|
|
60,215,374 |
|
|
|
65,669,970 |
|
Period end common shares outstanding |
|
|
59,376,435 |
|
|
|
59,198,963 |
|
|
|
62,307,245 |
|
Period end preferred shares outstanding |
|
|
150,000 |
|
|
|
150,000 |
|
|
|
150,000 |
|
SELECTED RATIOS |
|
|
|
|
|
|
|
|
|
|||
Return on average assets |
|
|
0.86 |
% |
|
|
1.08 |
% |
|
|
1.37 |
% |
Return on average assets, excluding certain items (1)(2) |
|
|
0.88 |
|
|
|
1.09 |
|
|
|
1.40 |
|
Return on average tangible assets (1) |
|
|
0.97 |
|
|
|
1.21 |
|
|
|
1.53 |
|
Return on average tangible assets, excluding certain items (1)(2) |
|
|
0.99 |
|
|
|
1.22 |
|
|
|
1.56 |
|
Return on average equity |
|
|
6.02 |
|
|
|
7.23 |
|
|
|
8.40 |
|
Return on average equity, excluding certain items (1)(2) |
|
|
6.14 |
|
|
|
7.29 |
|
|
|
8.59 |
|
Return on average tangible equity (1) |
|
|
11.59 |
|
|
|
13.78 |
|
|
|
14.89 |
|
Return on average tangible equity, excluding certain items (1)(2) |
|
|
11.82 |
|
|
|
13.88 |
|
|
|
15.22 |
|
Return on average tangible common equity (1) |
|
|
12.99 |
|
|
|
15.39 |
|
|
|
16.35 |
|
Return on average tangible common equity, excluding certain items (1)(2) |
|
|
13.24 |
|
|
|
15.50 |
|
|
|
16.71 |
|
Net interest margin (3) |
|
|
3.14 |
|
|
|
3.20 |
|
|
|
3.11 |
|
Efficiency ratio (1) |
|
|
63.64 |
|
|
|
59.53 |
|
|
|
58.22 |
|
Average loans to average deposits |
|
|
85.71 |
|
|
|
74.21 |
|
|
|
78.11 |
|
Allowance for credit losses - loans to total loans |
|
|
1.12 |
|
|
|
1.10 |
|
|
|
1.25 |
|
Allowance for credit losses - loans to total non-performing loans |
|
|
487.45 |
|
|
|
284.41 |
|
|
|
308.00 |
|
Non-performing assets to total assets |
|
|
0.16 |
|
|
|
0.25 |
|
|
|
0.23 |
|
Net loan charge-offs to average loans |
|
|
0.04 |
|
|
|
0.02 |
|
|
|
0.02 |
|
Average shareholders’ equity to average assets |
|
|
14.34 |
|
|
|
14.90 |
|
|
|
16.33 |
|
Tangible equity to tangible assets (1) |
|
|
8.49 |
|
|
|
8.19 |
|
|
|
9.84 |
|
Tangible common equity to tangible assets (1) |
|
|
7.62 |
|
|
|
7.28 |
|
|
|
8.92 |
|
Tier 1 leverage ratio |
|
|
9.87 |
|
|
|
9.90 |
|
|
|
10.02 |
|
Tier 1 capital to risk-weighted assets |
|
|
12.05 |
|
|
|
12.33 |
|
|
|
14.05 |
|
Total capital to risk-weighted assets |
|
|
14.91 |
|
|
|
15.11 |
|
|
|
15.91 |
|
Common equity tier 1 capital ratio (CET 1) |
|
|
10.99 |
|
|
|
11.20 |
|
|
|
12.77 |
|
Dividend payout ratio |
|
|
56.18 |
|
|
|
45.36 |
|
|
|
37.39 |
|
Trust assets at market value (4) |
|
$ |
5,360,657 |
|
|
$ |
4,878,479 |
|
|
$ |
5,644,975 |
|
_______
31
Non-GAAP Measures
The following non-GAAP financial measures used by Wesbanco provide information that Wesbanco believes is useful to investors in understanding Wesbanco’s operating performance and trends, and facilitates comparisons with the performance of Wesbanco’s peers. The following tables summarize the non-GAAP financial measures derived from amounts reported in Wesbanco’s financial statements.
|
|
For the years ended December 31, |
|
|||||||||
(dollars in thousands, except per share amounts) |
|
2023 |
|
|
2022 |
|
|
2021 |
|
|||
Tangible common equity to tangible assets: |
|
|
|
|
|
|
|
|
|
|||
Total shareholders’ equity |
|
$ |
2,533,062 |
|
|
$ |
2,426,662 |
|
|
$ |
2,693,166 |
|
Less: goodwill and other intangible assets, net of deferred tax liability |
|
|
(1,124,811 |
) |
|
|
(1,131,990 |
) |
|
|
(1,140,111 |
) |
Tangible equity |
|
|
1,408,251 |
|
|
|
1,294,672 |
|
|
|
1,553,055 |
|
Less: preferred shareholders' equity |
|
|
(144,484 |
) |
|
|
(144,484 |
) |
|
|
(144,484 |
) |
Tangible common equity |
|
|
1,263,767 |
|
|
|
1,150,188 |
|
|
|
1,408,571 |
|
Total assets |
|
|
17,712,374 |
|
|
|
16,931,905 |
|
|
|
16,927,125 |
|
Less: goodwill and other intangible assets, net of deferred tax liability |
|
|
(1,124,811 |
) |
|
|
(1,131,990 |
) |
|
|
(1,140,111 |
) |
Tangible assets |
|
$ |
16,587,563 |
|
|
$ |
15,799,915 |
|
|
$ |
15,787,014 |
|
Tangible equity to tangible assets |
|
|
8.49 |
% |
|
|
8.19 |
% |
|
|
9.84 |
% |
Tangible common equity to tangible assets |
|
|
7.62 |
% |
|
|
7.28 |
% |
|
|
8.92 |
% |
Tangible book value per share: |
|
|
|
|
|
|
|
|
|
|||
Total shareholders’ equity |
|
$ |
2,533,062 |
|
|
$ |
2,426,662 |
|
|
$ |
2,693,166 |
|
Less: goodwill and other intangible assets, net of deferred tax liability |
|
|
(1,124,811 |
) |
|
|
(1,131,990 |
) |
|
|
(1,140,111 |
) |
Less: preferred shareholders' equity |
|
|
(144,484 |
) |
|
|
(144,484 |
) |
|
|
(144,484 |
) |
Tangible common equity |
|
|
1,263,767 |
|
|
|
1,150,188 |
|
|
|
1,408,571 |
|
Common shares outstanding |
|
|
59,376,435 |
|
|
|
59,198,963 |
|
|
|
62,307,245 |
|
Tangible book value per share at year end |
|
$ |
21.28 |
|
|
$ |
19.43 |
|
|
$ |
22.61 |
|
Return on average tangible equity: |
|
|
|
|
|
|
|
|
|
|||
Net income available to common shareholders |
|
$ |
148,907 |
|
|
$ |
181,988 |
|
|
$ |
232,135 |
|
Add: amortization of intangibles, net of tax |
|
|
7,180 |
|
|
|
8,120 |
|
|
|
9,051 |
|
Net income available to common shareholders before amortization of intangibles |
|
|
156,087 |
|
|
|
190,108 |
|
|
|
241,186 |
|
Average total shareholders’ equity |
|
|
2,474,627 |
|
|
|
2,515,509 |
|
|
|
2,764,337 |
|
Less: average goodwill and other intangibles, net of deferred tax liability |
|
|
(1,128,277 |
) |
|
|
(1,136,062 |
) |
|
|
(1,144,698 |
) |
Average tangible equity |
|
$ |
1,346,350 |
|
|
$ |
1,379,447 |
|
|
$ |
1,619,639 |
|
Return on average tangible equity |
|
|
11.59 |
% |
|
|
13.78 |
% |
|
|
14.89 |
% |
Average tangible common equity |
|
$ |
1,201,866 |
|
|
$ |
1,234,963 |
|
|
$ |
1,475,155 |
|
Return on average tangible common equity |
|
|
12.99 |
% |
|
|
15.39 |
% |
|
|
16.35 |
% |
Return on average tangible assets: |
|
|
|
|
|
|
|
|
|
|||
Net income available to common shareholders |
|
$ |
148,907 |
|
|
$ |
181,988 |
|
|
$ |
232,135 |
|
Add: amortization of intangibles, net of tax |
|
|
7,180 |
|
|
|
8,120 |
|
|
|
9,051 |
|
Net income before amortization of intangibles |
|
|
156,087 |
|
|
|
190,108 |
|
|
|
241,186 |
|
Average total assets |
|
|
17,259,720 |
|
|
|
16,879,541 |
|
|
|
16,928,377 |
|
Less: average goodwill and other intangibles, net of deferred tax liability |
|
|
(1,128,277 |
) |
|
|
(1,136,062 |
) |
|
|
(1,144,698 |
) |
Average tangible assets |
|
$ |
16,131,443 |
|
|
$ |
15,743,479 |
|
|
$ |
15,783,679 |
|
Return on average tangible assets |
|
|
0.97 |
% |
|
|
1.21 |
% |
|
|
1.53 |
% |
Efficiency ratio: |
|
|
|
|
|
|
|
|
|
|||
Non-interest expense |
|
$ |
390,002 |
|
|
$ |
356,966 |
|
|
$ |
353,143 |
|
Less: restructuring and merger-related expense |
|
|
(3,830 |
) |
|
|
(1,723 |
) |
|
|
(6,717 |
) |
Non-interest expense excluding restructuring and merger-related expense |
|
|
386,172 |
|
|
|
355,243 |
|
|
|
346,426 |
|
Net interest income on a fully-taxable equivalent basis |
|
|
486,343 |
|
|
|
479,315 |
|
|
|
462,229 |
|
Non-interest income |
|
|
120,447 |
|
|
|
117,391 |
|
|
|
132,785 |
|
Net interest income on a fully-taxable equivalent basis plus non-interest income |
|
$ |
606,790 |
|
|
$ |
596,706 |
|
|
$ |
595,014 |
|
Efficiency ratio |
|
|
63.64 |
% |
|
|
59.53 |
% |
|
|
58.22 |
% |
Net income per common shareholders, excluding after-tax restructuring and merger-related expenses: |
|
|
|
|
|
|
|
|
|
|||
Net income available to common shareholders |
|
$ |
148,907 |
|
|
$ |
181,988 |
|
|
$ |
232,135 |
|
Add: after-tax restructuring and merger-related expenses (1) |
|
|
3,026 |
|
|
|
1,361 |
|
|
|
5,306 |
|
Net income per common shareholders, excluding after-tax restructuring and merger-related expenses |
|
$ |
151,933 |
|
|
$ |
183,349 |
|
|
$ |
237,441 |
|
32
|
|
For the years ended December 31, |
|
|||||||||
(dollars in thousands, except per share amounts) |
|
2023 |
|
|
2022 |
|
|
2021 |
|
|||
Net income per common share - diluted, excluding after-tax restructuring and merger-related expenses: |
|
|
|
|
|
|
|
|
|
|||
Net income per common share - diluted |
|
$ |
2.51 |
|
|
$ |
3.02 |
|
|
$ |
3.53 |
|
Add: after-tax restructuring and merger-related expenses per common share - diluted (1) |
|
|
0.05 |
|
|
|
0.02 |
|
|
|
0.09 |
|
Net income per common share - diluted, excluding after-tax restructuring and merger-related expenses |
|
$ |
2.56 |
|
|
$ |
3.04 |
|
|
$ |
3.62 |
|
Return on average equity, excluding after-tax restructuring and merger-related expenses: |
|
|
|
|
|
|
|
|
|
|||
Net income available to common shareholders |
|
$ |
148,907 |
|
|
$ |
181,988 |
|
|
$ |
232,135 |
|
Add: after-tax restructuring and merger-related expenses (1) |
|
|
3,026 |
|
|
|
1,361 |
|
|
|
5,306 |
|
Net income available to common shareholders, excluding after-tax restructuring and merger-related expenses |
|
|
151,933 |
|
|
|
183,349 |
|
|
|
237,441 |
|
Average total shareholders’ equity |
|
$ |
2,474,627 |
|
|
$ |
2,515,509 |
|
|
$ |
2,764,337 |
|
Return on average equity, excluding after-tax restructuring and merger-related expenses |
|
|
6.14 |
% |
|
|
7.29 |
% |
|
|
8.59 |
% |
Return on average tangible equity, excluding after-tax restructuring and merger-related expenses: |
|
|
|
|
|
|
|
|
|
|||
Net income available to common shareholders |
|
$ |
148,907 |
|
|
$ |
181,988 |
|
|
$ |
232,135 |
|
Add: after-tax restructuring and merger-related expenses (1) |
|
|
3,026 |
|
|
|
1,361 |
|
|
|
5,306 |
|
Add: amortization of intangibles, net of tax |
|
|
7,180 |
|
|
|
8,120 |
|
|
|
9,051 |
|
Net income available to common shareholders before amortization of intangibles and excluding after-tax restructuring and merger-related expenses |
|
|
159,113 |
|
|
|
191,469 |
|
|
|
246,492 |
|
Average total shareholders’ equity |
|
|
2,474,627 |
|
|
|
2,515,509 |
|
|
|
2,764,337 |
|
Less: average goodwill and other intangibles, net of deferred tax liability |
|
|
(1,128,277 |
) |
|
|
(1,136,062 |
) |
|
|
(1,144,698 |
) |
Average tangible equity |
|
$ |
1,346,350 |
|
|
$ |
1,379,447 |
|
|
$ |
1,619,639 |
|
Return on average tangible equity, excluding after-tax restructuring and merger-related expenses |
|
|
11.82 |
% |
|
|
13.88 |
% |
|
|
15.22 |
% |
Average tangible common equity |
|
$ |
1,201,866 |
|
|
$ |
1,234,963 |
|
|
$ |
1,475,155 |
|
Return on average tangible common equity, excluding after-tax restructuring and merger-related expenses |
|
|
13.24 |
% |
|
|
15.50 |
% |
|
|
16.71 |
% |
Return on average assets, excluding after-tax restructuring and merger-related expenses: |
|
|
|
|
|
|
|
|
|
|||
Net income available to common shareholders |
|
$ |
148,907 |
|
|
$ |
181,988 |
|
|
$ |
232,135 |
|
Add: after-tax restructuring and merger-related expenses (1) |
|
|
3,026 |
|
|
|
1,361 |
|
|
|
5,306 |
|
Net income available to common shareholders, excluding after-tax restructuring and merger-related expenses |
|
|
151,933 |
|
|
|
183,349 |
|
|
|
237,441 |
|
Average total assets |
|
$ |
17,259,720 |
|
|
$ |
16,879,541 |
|
|
$ |
16,928,377 |
|
Return on average tangible assets, excluding after-tax restructuring and merger-related expenses |
|
|
0.88 |
% |
|
|
1.09 |
% |
|
|
1.40 |
% |
Return on average tangible assets, excluding after-tax restructuring and merger-related expenses: |
|
|
|
|
|
|
|
|
|
|||
Net income available to common shareholders |
|
$ |
148,907 |
|
|
$ |
181,988 |
|
|
$ |
232,135 |
|
Add: amortization of intangibles, net of tax |
|
|
7,180 |
|
|
|
8,120 |
|
|
|
9,051 |
|
Add: after-tax restructuring and merger-related expenses (1) |
|
|
3,026 |
|
|
|
1,361 |
|
|
|
5,306 |
|
Net income available to common shareholders, before amortization of intangibles and excluding after-tax restructuring and merger-related expenses |
|
|
159,113 |
|
|
|
191,469 |
|
|
|
246,492 |
|
Average total assets |
|
|
17,259,720 |
|
|
|
16,879,541 |
|
|
|
16,928,377 |
|
Less: average goodwill and other intangibles, net of deferred tax liability |
|
|
(1,128,277 |
) |
|
|
(1,136,062 |
) |
|
|
(1,144,698 |
) |
Average tangible assets |
|
$ |
16,131,443 |
|
|
$ |
15,743,479 |
|
|
$ |
15,783,679 |
|
Return on average tangible assets, excluding after-tax restructuring and merger-related expenses |
|
|
0.99 |
% |
|
|
1.22 |
% |
|
|
1.56 |
% |
Dividend payout ratio, excluding after-tax restructuring and merger related expenses: |
|
|
|
|
|
|
|
|
|
|||
Dividends declared per common share |
|
$ |
1.41 |
|
|
$ |
1.37 |
|
|
$ |
1.32 |
|
Net income per common share - diluted |
|
|
2.51 |
|
|
|
3.02 |
|
|
|
3.53 |
|
Add: after-tax restructuring and merger-related expenses per diluted share (1) |
|
|
0.05 |
|
|
|
0.02 |
|
|
|
0.09 |
|
Net income per common share - diluted, excluding after-tax restructuring and merger-related expenses |
|
$ |
2.56 |
|
|
$ |
3.04 |
|
|
$ |
3.62 |
|
Dividend payout ratio, excluding after-tax restructuring and merger related expenses |
|
|
55.08 |
|
|
|
45.07 |
|
|
|
36.46 |
|
(1) Tax effected at 21% for all periods presented.
33
RESULTS OF OPERATIONS
EARNINGS SUMMARY
For the twelve months ended December 31, 2023, net income available to common shareholders was $148.9 million, or $2.51 per diluted share, compared to $182.0 million, or $3.02 per diluted share. Net income available to common shareholders for the twelve months ended December 31, 2023 decreased 18.2% compared to 2022, while diluted per share earnings decreased 16.9%.
For the twelve months ending December 31, 2023, net interest income increased $7.0 million, or 1.5%, primarily due to loan growth and the benefit of rising rates on earning assets. The increase in net interest income was offset in part by a decrease in the net interest margin of six basis points to 3.14% in 2023 as compared to 2022 due to the overall higher rate environment and its effect on the rate paid on interest bearing liabilities. Average loan balances increased 10.4% in 2023, mostly due to a lower level of commercial real estate payoffs and a strong performance by the commercial and residential lending teams, while average investment securities decreased 7.4% over the same period. Total average deposits decreased in 2023 by $600.5 million or 4.4% compared to 2022, due to customer preferences in the higher interest rate environment.
For 2023, non-interest income increased $3.1 million or 2.6% compared to 2022. This increase was primarily due to an increase in net securities gains of $2.7 million, which resulted from market fluctuations of equity securities in the deferred compensation plan and a $1.0 million increase in net gains on other real estate owned and other assets from the recovery of an asset previously written off. These increases were offset somewhat by decreases in mortgage banking income and electronic banking fees, as well as negative fair value adjustments on loan swaps.
The following comments on non-interest expense exclude restructuring and merger-related expenses in both years. Non-interest expense in 2023 increased $30.9 million or 8.7% compared to 2022, while the efficiency ratio increased in 2023 to 63.6% from 59.5% in 2022. The primary drivers of this increase was a $9.9 million increase in salaries and wages due to annual merit increases and new revenue-producing hires, which were mainly commercial lenders, and a $9.1 million increase in employee benefits resulting from higher deferred compensation expense and higher health insurance expense. FDIC insurance expense, as well as equipment and software and marketing expenses, also increased from 2022. These increases were slightly offset by lower amortization expense on intangible assets.
The provision for federal and state income taxes decreased to $35.0 million in 2023 compared to $44.3 million in 2022, due primarily to lower pre-tax income in 2023. The effective tax rate was 18.1% and 18.7% for the years ended December 31, 2023 and 2022, respectively. Wesbanco recognized $3.7 million and $3.5 million in New Markets Tax Credits for the years ended December 31, 2023 and 2022, respectively.
34
TABLE 1. NET INTEREST INCOME
|
|
For the years ended December 31, |
|
|||||||||
(dollars in thousands) |
|
2023 |
|
|
2022 |
|
|
2021 |
|
|||
Net interest income |
|
$ |
481,338 |
|
|
$ |
474,313 |
|
|
$ |
457,933 |
|
Taxable-equivalent adjustments to net interest income |
|
|
5,005 |
|
|
|
5,002 |
|
|
|
4,296 |
|
Net interest income, fully taxable-equivalent |
|
$ |
486,343 |
|
|
$ |
479,315 |
|
|
$ |
462,229 |
|
Net interest spread, non-taxable-equivalent |
|
|
2.35 |
% |
|
|
3.02 |
% |
|
|
2.98 |
% |
Benefit of net non-interest bearing liabilities |
|
|
0.76 |
% |
|
|
0.15 |
% |
|
|
0.10 |
% |
Net interest margin |
|
|
3.11 |
% |
|
|
3.17 |
% |
|
|
3.08 |
% |
Taxable-equivalent adjustment |
|
|
0.03 |
% |
|
|
0.03 |
% |
|
|
0.03 |
% |
Net interest margin, fully taxable-equivalent |
|
|
3.14 |
% |
|
|
3.20 |
% |
|
|
3.11 |
% |
Net interest income, which is Wesbanco’s largest source of revenue, is the difference between interest income on earning assets, primarily loans and securities, and interest expense on liabilities, primarily deposits and short and long-term borrowings. Net interest income is affected by the general level of, and changes in interest rates, the steepness and shape of the yield curve, changes in the amount and composition of interest earning assets and interest bearing liabilities, as well as the frequency of repricing of existing assets and liabilities. Net interest income increased $7.0 million or 1.5% in 2023 compared to 2022, primarily due to loan growth and the benefit of rising rates on earning assets and was mitigated by a six basis point decrease in the net interest margin over the same time period. Rates were impacted from the 525 basis point increase in the federal funds rate since the first quarter of 2022. Purchase accounting accretion decreased in 2023, as approximately three basis points of accretion from prior acquisitions was included in the 2023 net interest margin as compared to six basis points in the 2022 net interest margin. Total average deposits, excluding CDs, decreased in 2023 by $510.8 million or 4.1% compared to 2022, due to increased competition for deposits during the higher rate environment. The cost of interest bearing deposits increased by 148 basis points and the cost of total liabilities increased by 183 basis points from 2022 to 2023. The increase in the cost is primarily due to the effect of the previously mentioned federal funds rate increases on the rates paid on interest bearing demand deposits, customer repurchase agreements, term Federal Home Loan Bank borrowings and junior subordinated debentures.
Interest income increased $197.9 million or 38.5% in 2023 compared to 2022 due to higher yields in most of the major earning asset categories. Earning asset yields were influenced positively in 2023 compared to 2022 from the previously mentioned increases in the Federal Reserve’s federal funds rate of 525 basis points since the first quarter of 2022. Average loan balances increased $1.0 billion or 10.4% in 2023 compared to 2022, due to commercial hiring efforts. Loan yields increased by 117 basis points during 2023 to 5.36% due to the previously mentioned higher rate environment and its effect on the repricing of portfolio loans, as well as higher offered rates on new loans. Loans provide the greatest impact on interest income and the yield on earning assets as they have the largest balance and the highest yield within major earning asset categories. In 2023, average loans represented 72.0% of average earning assets, an increase from 67.4% in 2022. Taxable securities yields increased by 42 basis points in 2023 due to the effect of the higher rate environment on the variable rate portion of the investment portfolio, which are typically tied to SOFR. Decreased prepayments on mortgage-backed securities in the higher rate environment also further benefited the taxable securities yields due to reduced amortization on securities purchased at a premium. Tax-exempt securities yields increased by two basis points in 2023 from 2022. The average balance of tax-exempt securities, which have the highest yields within securities, increased from 18.6% of total average securities in 2022 to 19.9% of total average securities in 2023.
Interest expense increased $190.8 million in 2023 as compared to 2022, due to increases in the cost of all interest bearing liability categories in the higher rate environment. The cost of interest bearing liabilities increased by 183 basis points from 2022 to 2.25% in 2023. Average interest bearing deposits decreased by $208.0 million or 2.3% from 2022 to 2023. The rate on interest bearing deposits increased 148 basis points to 1.75% in 2023 as compared to 2022, primarily from increases in rates on interest bearing demand deposits, money market accounts and savings deposits in response to competitive pressures from higher market rates. Average non-interest bearing demand deposit balances decreased from 2022 to 2023 by $392.5 million or 8.3%, and were 33.2% of total average deposits at December 31, 2023, compared to 34.7% at December 31, 2022. The average balance of FHLB borrowings increased by $963.1 million from 2022 to 2023 due to the funding of loan growth. New higher-rate borrowings taken out in 2023 increased the average rate by 294 basis points to 5.21% from 2.27% in 2022. Average repurchase agreements combined with average subordinated debt and junior subordinated debt balances increased $2.8 million or 0.7% from 2022 to 2023, and their average rates paid increased by 181 and 147 basis points, respectively, over this same time period, due primarily to increases in SOFR, the index upon which this variable-rate type of borrowing is priced.
35
TABLE 2. AVERAGE BALANCE SHEETS AND NET INTEREST MARGIN ANALYSIS
|
|
For the years ended December 31, |
|
|||||||||||||||||||||||||||||||||
|
|
2023 |
|
|
2022 |
|
|
2021 |
|
|||||||||||||||||||||||||||
(dollars in thousands) |
|
Average |
|
|
Interest |
|
|
Average |
|
|
Average |
|
|
Interest |
|
|
Average |
|
|
Average |
|
|
Interest |
|
|
Average |
|
|||||||||
ASSETS |
|
|
|
|
|
|
|
|
|
|
|
|
|
|
|
|
|
|
|
|
|
|
|
|
|
|
|
|||||||||
Due from banks-interest bearing |
|
$ |
348,109 |
|
|
$ |
18,918 |
|
|
|
5.43 |
% |
|
$ |
611,482 |
|
|
$ |
5,755 |
|
|
|
0.94 |
% |
|
$ |
860,249 |
|
|
$ |
1,156 |
|
|
|
0.13 |
% |
Loans, net of unearned income (1) |
|
|
11,132,618 |
|
|
|
596,852 |
|
|
|
5.36 |
% |
|
|
10,083,925 |
|
|
|
422,401 |
|
|
|
4.19 |
% |
|
|
10,380,605 |
|
|
|
415,965 |
|
|
|
4.01 |
% |
Securities: (2) |
|
|
|
|
|
|
|
|
|
|
|
|
|
|
|
|
|
|
|
|
|
|
|
|
|
|
|
|||||||||
Taxable |
|
|
3,150,781 |
|
|
|
73,449 |
|
|
|
2.33 |
% |
|
|
3,461,414 |
|
|
|
66,123 |
|
|
|
1.91 |
% |
|
|
2,966,745 |
|
|
|
50,401 |
|
|
|
1.70 |
% |
Tax-exempt (3) |
|
|
783,697 |
|
|
|
23,835 |
|
|
|
3.04 |
% |
|
|
789,564 |
|
|
|
23,820 |
|
|
|
3.02 |
% |
|
|
632,187 |
|
|
|
20,457 |
|
|
|
3.24 |
% |
Total securities |
|
|
3,934,478 |
|
|
|
97,284 |
|
|
|
2.47 |
% |
|
|
4,250,978 |
|
|
|
89,943 |
|
|
|
2.12 |
% |
|
|
3,598,932 |
|
|
|
70,858 |
|
|
|
1.97 |
% |
Other earning assets |
|
|
55,368 |
|
|
|
3,467 |
|
|
|
6.26 |
% |
|
|
15,265 |
|
|
|
559 |
|
|
|
3.66 |
% |
|
|
25,481 |
|
|
|
1,284 |
|
|
|
5.04 |
% |
Total earning assets (3) |
|
|
15,470,573 |
|
|
|
716,521 |
|
|
|
4.63 |
% |
|
|
14,961,650 |
|
|
|
518,658 |
|
|
|
3.47 |
% |
|
|
14,865,267 |
|
|
|
489,263 |
|
|
|
3.29 |
% |
Other assets |
|
|
1,789,147 |
|
|
|
|
|
|
|
|
|
1,917,891 |
|
|
|
|
|
|
|
|
|
2,063,110 |
|
|
|
|
|
|
|
||||||
Total Assets |
|
$ |
17,259,720 |
|
|
|
|
|
|
|
|
$ |
16,879,541 |
|
|
|
|
|
|
|
|
$ |
16,928,377 |
|
|
|
|
|
|
|
||||||
LIABILITIES AND |
|
|
|
|
|
|
|
|
|
|
|
|
|
|
|
|
|
|
|
|
|
|
|
|
|
|
|
|||||||||
Interest bearing demand deposits |
|
$ |
3,243,786 |
|
|
$ |
72,866 |
|
|
|
2.25 |
% |
|
$ |
3,314,384 |
|
|
$ |
12,181 |
|
|
|
0.37 |
% |
|
$ |
3,193,425 |
|
|
$ |
3,669 |
|
|
|
0.11 |
% |
Money market accounts |
|
|
1,763,921 |
|
|
|
36,616 |
|
|
|
2.08 |
% |
|
|
1,774,152 |
|
|
|
3,562 |
|
|
|
0.20 |
% |
|
|
1,760,540 |
|
|
|
1,803 |
|
|
|
0.10 |
% |
Savings deposits |
|
|
2,655,105 |
|
|
|
23,869 |
|
|
|
0.90 |
% |
|
|
2,692,568 |
|
|
|
4,115 |
|
|
|
0.15 |
% |
|
|
2,425,527 |
|
|
|
1,031 |
|
|
|
0.04 |
% |
Certificates of deposit |
|
|
1,008,950 |
|
|
|
18,472 |
|
|
|
1.83 |
% |
|
|
1,098,614 |
|
|
|
4,089 |
|
|
|
0.37 |
% |
|
|
1,457,730 |
|
|
|
7,623 |
|
|
|
0.52 |
% |
Total interest bearing |
|
|
8,671,762 |
|
|
|
151,823 |
|
|
|
1.75 |
% |
|
|
8,879,718 |
|
|
|
23,947 |
|
|
|
0.27 |
% |
|
|
8,837,222 |
|
|
|
14,126 |
|
|
|
0.16 |
% |
Federal Home Loan Bank |
|
|
1,138,247 |
|
|
|
59,318 |
|
|
|
5.21 |
% |
|
|
175,104 |
|
|
|
3,968 |
|
|
|
2.27 |
% |
|
|
343,185 |
|
|
|
6,167 |
|
|
|
1.80 |
% |
Repurchase agreements |
|
|
115,817 |
|
|
|
2,545 |
|
|
|
2.20 |
% |
|
|
146,590 |
|
|
|
568 |
|
|
|
0.39 |
% |
|
|
149,001 |
|
|
|
227 |
|
|
|
0.15 |
% |
Subordinated debt and junior |
|
|
281,788 |
|
|
|
16,492 |
|
|
|
5.85 |
% |
|
|
248,192 |
|
|
|
10,860 |
|
|
|
4.38 |
% |
|
|
180,649 |
|
|
|
6,514 |
|
|
|
3.61 |
% |
Total interest bearing |
|
|
10,207,614 |
|
|
|
230,178 |
|
|
|
2.25 |
% |
|
|
9,449,604 |
|
|
|
39,343 |
|
|
|
0.42 |
% |
|
|
9,510,057 |
|
|
|
27,034 |
|
|
|
0.28 |
% |
Non-interest bearing demand |
|
|
4,316,245 |
|
|
|
|
|
|
|
|
|
4,708,758 |
|
|
|
|
|
|
|
|
|
4,452,590 |
|
|
|
|
|
|
|
||||||
Other liabilities |
|
|
261,234 |
|
|
|
|
|
|
|
|
|
205,670 |
|
|
|
|
|
|
|
|
|
201,393 |
|
|
|
|
|
|
|
||||||
Shareholders’ equity |
|
|
2,474,627 |
|
|
|
|
|
|
|
|
|
2,515,509 |
|
|
|
|
|
|
|
|
|
2,764,337 |
|
|
|
|
|
|
|
||||||
Total Liabilities and Shareholders’ |
|
$ |
17,259,720 |
|
|
|
|
|
|
|
|
$ |
16,879,541 |
|
|
|
|
|
|
|
|
$ |
16,928,377 |
|
|
|
|
|
|
|
||||||
Taxable equivalent net interest spread |
|
|
|
|
|
|
|
|
2.38 |
% |
|
|
|
|
|
|
|
|
3.05 |
% |
|
|
|
|
|
|
|
|
3.01 |
% |
||||||
Taxable equivalent net interest |
|
|
|
|
$ |
486,343 |
|
|
|
3.14 |
% |
|
|
|
|
$ |
479,315 |
|
|
|
3.20 |
% |
|
|
|
|
$ |
462,229 |
|
|
|
3.11 |
% |
|||
36
TABLE 3. RATE/VOLUME ANALYSIS OF CHANGES IN INTEREST INCOME AND INTEREST EXPENSE (1)
|
|
2023 Compared to 2022 |
|
|
2022 Compared to 2021 |
|
||||||||||||||||||
(in thousands) |
|
Volume |
|
|
Rate |
|
|
Net Increase |
|
|
Volume |
|
|
Rate |
|
|
Net Increase |
|
||||||
Increase (decrease) in interest income: |
|
|
|
|
|
|
|
|
|
|
|
|
|
|
|
|
|
|
||||||
Due from banks—interest bearing |
|
$ |
(3,458 |
) |
|
$ |
16,621 |
|
|
$ |
13,163 |
|
|
$ |
(427 |
) |
|
$ |
5,026 |
|
|
$ |
4,599 |
|
Loans, net of unearned income |
|
|
47,259 |
|
|
|
127,192 |
|
|
|
174,451 |
|
|
|
(12,097 |
) |
|
|
18,533 |
|
|
|
6,436 |
|
Taxable securities |
|
|
(6,312 |
) |
|
|
13,638 |
|
|
|
7,326 |
|
|
|
9,003 |
|
|
|
6,719 |
|
|
|
15,722 |
|
Tax-exempt securities (2) |
|
|
(178 |
) |
|
|
193 |
|
|
|
15 |
|
|
|
4,821 |
|
|
|
(1,458 |
) |
|
|
3,363 |
|
Other earning assets |
|
|
2,289 |
|
|
|
619 |
|
|
|
2,908 |
|
|
|
(431 |
) |
|
|
(294 |
) |
|
|
(725 |
) |
Total interest income change (2) |
|
|
39,600 |
|
|
|
158,263 |
|
|
|
197,863 |
|
|
|
869 |
|
|
|
28,526 |
|
|
|
29,395 |
|
Increase (decrease) in interest expense: |
|
|
|
|
|
|
|
|
|
|
|
|
|
|
|
|
|
|
||||||
Interest bearing demand deposits |
|
|
(265 |
) |
|
|
60,950 |
|
|
|
60,685 |
|
|
|
144 |
|
|
|
8,368 |
|
|
|
8,512 |
|
Money market |
|
|
(21 |
) |
|
|
33,075 |
|
|
|
33,054 |
|
|
|
14 |
|
|
|
1,745 |
|
|
|
1,759 |
|
Savings deposits |
|
|
(58 |
) |
|
|
19,812 |
|
|
|
19,754 |
|
|
|
125 |
|
|
|
2,959 |
|
|
|
3,084 |
|
Certificates of deposit |
|
|
(360 |
) |
|
|
14,743 |
|
|
|
14,383 |
|
|
|
(1,628 |
) |
|
|
(1,906 |
) |
|
|
(3,534 |
) |
Federal Home Loan Bank borrowings |
|
|
44,771 |
|
|
|
10,579 |
|
|
|
55,350 |
|
|
|
(3,535 |
) |
|
|
1,336 |
|
|
|
(2,199 |
) |
Repurchase agreements |
|
|
(143 |
) |
|
|
2,120 |
|
|
|
1,977 |
|
|
|
(4 |
) |
|
|
345 |
|
|
|
341 |
|
Subordinated debt and junior subordinated debt |
|
|
1,612 |
|
|
|
4,020 |
|
|
|
5,632 |
|
|
|
2,766 |
|
|
|
1,580 |
|
|
|
4,346 |
|
Total interest expense change |
|
|
45,536 |
|
|
|
145,299 |
|
|
|
190,835 |
|
|
|
(2,118 |
) |
|
|
14,427 |
|
|
|
12,309 |
|
Net interest income (decrease) increase (2) |
|
$ |
(5,936 |
) |
|
$ |
12,964 |
|
|
$ |
7,028 |
|
|
$ |
2,987 |
|
|
$ |
14,099 |
|
|
$ |
17,086 |
|
PROVISION FOR CREDIT LOSSES - LOANS
The provision for credit losses – loans is the amount to be added to the allowance for credit losses – loans after net charge-offs have been deducted to bring the allowance to a level considered appropriate to absorb lifetime expected losses for all portfolio loans. The provision for credit losses – loan commitments is the amount to be added to the allowance for credit losses for loan commitments to bring that allowance to a level considered appropriate to absorb lifetime expected losses on unfunded loan commitments. The provision for credit losses - loans and loan commitments was $17.8 million in 2023 compared to ($1.7) million in 2022 as a result of loan growth as well as changes in macroeconomic conditions over the reasonable and supportable forecast period of one year, primarily increasing the allowance for loan losses and allowance for loan commitments. Furthermore, the increase to the provision was driven by qualitative factors, which addressed the risk of rising interest rates and office portfolio concentration. Non-performing loans were 0.23% of total loans as of December 31, 2023, and decreased from 0.39% of total loans at the end of 2022. Non-performing assets were 0.24% of total loans and other real estate and repossessed assets as of December 31, 2023, decreasing from 0.40% at the end of 2022. Criticized and classified loans were 2.22% of total loans, decreasing from 2.34% as of December 31, 2022, primarily due to improvements in loans categorized as criticized or classified during the pandemic. Past due loans at December 31, 2023 were 0.28% of total loans, compared to 0.19% at December 31, 2022. (Please see the Credit Quality and Allowance for Credit Losses – Loans and Loan Commitments section of this MD&A for additional discussion).
37
TABLE 4. NON-INTEREST INCOME
|
|
For the years ended December 31, |
|
|
|
|
|
|
|
|||||||
(dollars in thousands) |
|
2023 |
|
|
2022 |
|
|
$ Change |
|
|
% Change |
|
||||
Trust fees |
|
$ |
28,135 |
|
|
$ |
27,551 |
|
|
$ |
584 |
|
|
|
2.1 |
|
Service charges on deposits |
|
|
26,116 |
|
|
|
26,281 |
|
|
|
(165 |
) |
|
|
(0.6 |
) |
Electronic banking fees |
|
|
19,454 |
|
|
|
20,002 |
|
|
|
(548 |
) |
|
|
(2.7 |
) |
Net swap fee and valuation income |
|
|
6,912 |
|
|
|
7,067 |
|
|
|
(155 |
) |
|
|
(2.2 |
) |
Net securities brokerage revenue |
|
|
10,055 |
|
|
|
9,525 |
|
|
|
530 |
|
|
|
5.6 |
|
Bank-owned life insurance |
|
|
11,002 |
|
|
|
10,728 |
|
|
|
274 |
|
|
|
2.6 |
|
Mortgage banking income |
|
|
2,652 |
|
|
|
5,129 |
|
|
|
(2,477 |
) |
|
|
(48.3 |
) |
Net securities gains (losses) |
|
|
900 |
|
|
|
(1,777 |
) |
|
|
2,677 |
|
|
|
150.6 |
|
Net gains on other real estate owned and other assets |
|
|
1,520 |
|
|
|
482 |
|
|
|
1,038 |
|
|
|
215.4 |
|
Net insurance services revenue |
|
|
3,555 |
|
|
|
3,749 |
|
|
|
(194 |
) |
|
|
(5.2 |
) |
Payment processing fees |
|
|
3,652 |
|
|
|
3,352 |
|
|
|
300 |
|
|
|
8.9 |
|
Other |
|
|
6,494 |
|
|
|
5,302 |
|
|
|
1,192 |
|
|
|
22.5 |
|
Total non-interest income |
|
$ |
120,447 |
|
|
$ |
117,391 |
|
|
$ |
3,056 |
|
|
|
2.6 |
|
Non-interest income is a significant source of revenue and an important part of Wesbanco’s results of operations, as it represented 20.0% and 19.8% of total revenue for 2023 and 2022, respectively. Wesbanco offers its customers a wide range of retail, commercial, investment and electronic banking services, which are viewed as a vital component of Wesbanco’s ability to attract and maintain customers, as well as providing additional fee income beyond normal spread-related income to Wesbanco. Non-interest income increased $3.1 million or 2.6% in 2023 compared to 2022, primarily due to increases in trust fees, net securities gains (losses), and net gains on other real estate owned and other assets. The increases were slightly offset by a decrease in mortgage banking income.
Trust fees increased $0.6 million or 2.1% in 2023 compared to 2022. Trust assets of $5.4 billion at December 31, 2023, increased from $4.9 billion at December 31, 2022. As of December 31, 2023, trust assets include managed assets of $4.4 billion and non-managed (custodial) assets of $1.0 billion. Assets managed for the WesMark Funds, a proprietary group of mutual funds that is advised by Wesbanco Trust and Investment Services, were $0.8 billion as of December 31, 2023 and December 31, 2022, and are included in managed assets.
Swap fee and valuation income, which includes fair value adjustments, decreased $0.2 million or 2.2% in 2023 as compared to 2022. The decrease was specifically due to negative fair value adjustments on the swap portfolio in 2023 resulting from the late year market rate decreases, which outweighed a record amount of new swaps originated and their associated swap fee income. In 2023, new swaps totaled $728.7 million in notional principal resulting in $9.0 million in fee income, compared to new swaps totaling $254.3 million in notional principal resulting in $4.4 million in fee income in 2022. Fair market value adjustments on swaps in 2023 totaled a negative $2.1 million as compared to a positive $2.7 million in 2022.
Mortgage banking income decreased $2.5 million or 48.3% in 2023 compared to 2022, due primarily to a decrease in fair value adjustments on mortgage derivatives and increased deferred loan costs on mortgage loans. In 2023, total mortgage production was $0.7 billion, which was a decrease of 32.0% from total production in 2022. In 2023, $293.4 million in mortgages were sold into the secondary market as compared to $227.5 million in 2022. Included in mortgage banking income are gains of $0.8 million and $3.2 million from the fair value adjustments on mortgage loan commitments and related derivatives for 2023 and 2022, respectively.
Net securities gains (losses) include both gains and losses on investment security transactions, including sales and calls, as well as market value adjustments on the deferred compensation plan and other equity securities. In 2023, net securities gains (losses) increased $2.7 million from 2022 due to an increase in the market value adjustments on the deferred compensation plan. These market adjustments had an offsetting effect in employee benefits expense.
Net gains on other real estate owned and other assets increased $1.0 million in 2023 as compared to 2022, due primarily to the recovery of an asset that was previously written off.
38
TABLE 5. NON-INTEREST EXPENSE
|
|
For the years ended December 31, |
|
|
|
|
|
|
|
|||||||
(dollars in thousands) |
|
2023 |
|
|
2022 |
|
|
$ Change |
|
|
% Change |
|
||||
Salaries and wages |
|
$ |
176,938 |
|
|
$ |
167,028 |
|
|
$ |
9,910 |
|
|
|
5.9 |
|
Employee benefits |
|
|
46,901 |
|
|
|
37,771 |
|
|
|
9,130 |
|
|
|
24.2 |
|
Net occupancy |
|
|
25,338 |
|
|
|
26,105 |
|
|
|
(767 |
) |
|
|
(2.9 |
) |
Equipment and software |
|
|
36,666 |
|
|
|
32,508 |
|
|
|
4,158 |
|
|
|
12.8 |
|
Marketing |
|
|
11,178 |
|
|
|
9,335 |
|
|
|
1,843 |
|
|
|
19.7 |
|
FDIC insurance |
|
|
12,249 |
|
|
|
7,901 |
|
|
|
4,348 |
|
|
|
55.0 |
|
Amortization of intangible assets |
|
|
9,088 |
|
|
|
10,278 |
|
|
|
(1,190 |
) |
|
|
(11.6 |
) |
Restructuring and merger-related expenses |
|
|
3,830 |
|
|
|
1,723 |
|
|
|
2,107 |
|
|
|
122.3 |
|
Consulting, regulatory, accounting and advisory fees |
|
|
12,829 |
|
|
|
13,168 |
|
|
|
(339 |
) |
|
|
(2.6 |
) |
Franchise and other miscellaneous taxes |
|
|
11,686 |
|
|
|
12,012 |
|
|
|
(326 |
) |
|
|
(2.7 |
) |
ATM and electronic banking interchange expenses |
|
|
7,091 |
|
|
|
5,903 |
|
|
|
1,188 |
|
|
|
20.1 |
|
Communications |
|
|
5,325 |
|
|
|
4,688 |
|
|
|
637 |
|
|
|
13.6 |
|
Legal fees |
|
|
2,905 |
|
|
|
3,165 |
|
|
|
(260 |
) |
|
|
(8.2 |
) |
Other real estate owned and foreclosure expenses |
|
|
349 |
|
|
|
789 |
|
|
|
(440 |
) |
|
|
(55.8 |
) |
Postage, supplies and other |
|
|
27,629 |
|
|
|
24,592 |
|
|
|
3,037 |
|
|
|
12.3 |
|
Total non-interest expense |
|
$ |
390,002 |
|
|
$ |
356,966 |
|
|
$ |
33,036 |
|
|
|
9.3 |
|
Non-interest expense in 2023, excluding restructuring and merger-related expenses, increased $30.9 million or 8.7% compared to 2022. The primary drivers of this increase were higher salaries and wages, employee benefits, equipment and software costs, FDIC insurance expense and other operating expenses. These increases were slightly offset by decreases in net occupancy and amortization of intangible assets. Restructuring and merger related expenses of $3.8 million in 2023 and $1.7 million in 2022 were attributable to branch restructuring that occurred in both years.
Salaries and wages increased $9.9 million or 5.9% in 2023 compared to 2022 due primarily to increases in salaries and stock compensation expense. Salary expense increased due to annual merit increases and new revenue-producing hires, mainly commercial lenders, during the past year. Stock compensation expense increased due to higher overall award levels, combined with accelerated expense that was recorded for an executive retirement. Offsetting these increases slightly was an increase in deferred loan contra origination costs in 2023 due to higher loan origination volume, primarily in commercial loans.
Employee benefits expense increased $9.1 million or 24.2% in 2023 compared to 2022 due to an increase in the market adjustment on the underlying investments of the deferred compensation plan, which has an offsetting effect in net securities gains (losses). Also attributing to the increase in 2023 was higher health insurance expense due to increased claims in 2023, as well as increased pension fund expense due to higher interest costs and other pension expenses.
Equipment and software costs increased $4.2 million or 12.8% in 2023 compared to 2022, due to continuous improvements in technology and communication infrastructure, general inflationary cost increases for existing service agreements and increased usage of digital banking services. During 2023, Wesbanco upgraded most of its ATM fleet.
FDIC insurance increased $4.3 million or 55.0% in 2023 compared to 2022, due to higher quarterly assessment rates. In 2022, the FDIC announced a two basis point increase in the minimum FDIC assessment rate for all banks, which was effective beginning in the first assessment period of 2023.
Restructuring and merger-related expenses in 2023 totaled $3.8 million, an increase from $1.7 million incurred in 2022. The $3.8 million of expenses in 2023 consisted of fixed asset writedowns, lease termination expenses and severance expenses associated with the closure of branches, back-office buildings and a restructuring of the residential mortgage department. The restructuring and merger-related expenses in 2022 totaling $1.7 million were comprised of branch closure and lease termination expenses associated with the closure of 13 branches throughout 2022.
ATM and electronic banking interchange expenses increased $1.2 million or 20.1% in 2023 as compared to 2022, due to higher ACH and ATM processing charges resulting from an increase in transaction volume.
Other operating expenses increased $3.0 million or 12.3% in 2023 as compared to 2022, due to costs associated with higher customer transactional volume and increased employee travel expenses.
39
INCOME TAXES
The provision for income taxes was $35.0 million for 2023, which is a $9.3 million decrease as compared to $44.3 million in 2022. The decrease in the provision for income taxes is due in part to a decrease in the effective tax rate to 18.1% in 2023 compared to 18.7% in 2022. In addition, the decrease resulted from lower pre-tax income in 2023 as compared to 2022. The decrease in pre-tax income is primarily driven by the $17.7 million provision for credit losses recorded in 2023, as compared to a $1.7 million negative provision for credit losses in 2022, and an increase in non-interest expense.
FINANCIAL CONDITION
Total assets, deposits and shareholders' equity increased 4.6%, 0.3% and 4.4%, respectively, at December 31, 2023 compared to December 31, 2022. Total securities decreased $383.1 million or 10.1% from December 31, 2022 to December 31, 2023, as investment maturities, paydowns and calls were used to fund loan growth. Total portfolio loans increased $935.7 million or 8.7% in 2023 driven by strong performance from our commercial and residential lending teams. Total deposits increased $37.6 million or 0.3% from year end 2022 reflecting the benefit of deposit gathering and retention efforts by our retail and commercial teams. Reflecting the impact of the significant increase in the federal funds rate, there continued to be some mix shift in the composition of total deposits; however, total demand deposits continue to represent 56% of total deposits, with the non-interest bearing component representing 30%, which remains consistent with the percentage range since early 2020.
Deposit balances were also somewhat impacted by bonus and royalty payments from Marcellus and Utica shale energy companies in Wesbanco’s southwestern Pennsylvania, eastern Ohio and northern West Virginia markets totaling $104.7 million and $96.7 million for the years ended December 31, 2023 and December 31, 2022, respectively. The increase in certificates of deposit of $345.9 million is primarily due to customers' preferences during the higher interest rate environment. Total borrowings increased 54.7% or $613.5 million during 2023, as loan growth increased and required additional funding generated through FHLB borrowings.
Total shareholders’ equity increased $106.4 million or 4.4%, compared to December 31, 2022, primarily due to net income of $159.0 million for the year ended December 31, 2023, and a $35.7 million other comprehensive gain exceeding the declaration of common and preferred shareholder dividends totaling $82.9 million and $10.1 million, respectively.
40
SECURITIES
TABLE 6. COMPOSITION OF SECURITIES (1)
|
|
December 31, |
|
|
|
|
||||||||||
(dollars in thousands) |
|
2023 |
|
|
2022 |
|
|
$ Change |
|
|
% Change |
|
||||
Equity securities (at fair value) |
|
$ |
12,320 |
|
|
$ |
11,506 |
|
|
$ |
814 |
|
|
|
7.1 |
|
Available-for-sale debt securities (at fair value) |
|
|
|
|
|
|
|
|
|
|
|
|
||||
U.S. Government sponsored entities and agencies |
|
|
208,366 |
|
|
|
225,970 |
|
|
|
(17,604 |
) |
|
|
(7.8 |
) |
Residential mortgage-backed securities and |
|
|
1,629,684 |
|
|
|
1,846,053 |
|
|
|
(216,369 |
) |
|
|
(11.7 |
) |
Commercial mortgage-backed securities and |
|
|
268,307 |
|
|
|
349,731 |
|
|
|
(81,424 |
) |
|
|
(23.3 |
) |
Obligations of states and political subdivisions |
|
|
76,125 |
|
|
|
92,228 |
|
|
|
(16,103 |
) |
|
|
(17.5 |
) |
Corporate debt securities |
|
|
11,847 |
|
|
|
15,158 |
|
|
|
(3,311 |
) |
|
|
(21.8 |
) |
Total available-for-sale debt securities |
|
$ |
2,194,329 |
|
|
$ |
2,529,140 |
|
|
$ |
(334,811 |
) |
|
|
(13.2 |
) |
Held-to-maturity debt securities (at amortized cost) |
|
|
|
|
|
|
|
|
|
|
|
|
||||
U.S. Government sponsored entities and agencies |
|
$ |
3,587 |
|
|
$ |
4,357 |
|
|
$ |
(770 |
) |
|
|
(17.7 |
) |
Residential mortgage-backed securities and |
|
|
38,893 |
|
|
|
45,909 |
|
|
|
(7,016 |
) |
|
|
(15.3 |
) |
Obligations of states and political subdivisions |
|
|
1,136,779 |
|
|
|
1,177,986 |
|
|
|
(41,207 |
) |
|
|
(3.5 |
) |
Corporate debt securities |
|
|
20,268 |
|
|
|
20,377 |
|
|
|
(109 |
) |
|
|
(0.5 |
) |
Total held-to-maturity debt securities (2) |
|
$ |
1,199,527 |
|
|
$ |
1,248,629 |
|
|
$ |
(49,102 |
) |
|
|
(3.9 |
) |
Total securities |
|
$ |
3,406,176 |
|
|
$ |
3,789,275 |
|
|
$ |
(383,099 |
) |
|
|
(10.1 |
) |
Available-for-sale and equity securities: |
|
|
|
|
|
|
|
|
|
|
|
|
||||
Weighted average yield at the respective year-end (3) |
|
|
2.31 |
% |
|
|
2.23 |
% |
|
|
|
|
|
|
||
As a % of total securities |
|
|
64.8 |
% |
|
|
67.0 |
% |
|
|
|
|
|
|
||
Weighted average life (in years) |
|
|
6.8 |
|
|
|
6.7 |
|
|
|
|
|
|
|
||
Held-to-maturity securities: |
|
|
|
|
|
|
|
|
|
|
|
|
||||
Weighted average yield at the respective year-end (3) |
|
|
2.97 |
% |
|
|
2.96 |
% |
|
|
|
|
|
|
||
As a % of total securities |
|
|
35.2 |
% |
|
|
33.0 |
% |
|
|
|
|
|
|
||
Weighted average life (in years) |
|
|
8.7 |
|
|
|
9.5 |
|
|
|
|
|
|
|
||
Total securities: |
|
|
|
|
|
|
|
|
|
|
|
|
||||
Weighted average yield at the respective year-end (3) |
|
|
2.52 |
% |
|
|
2.45 |
% |
|
|
|
|
|
|
||
As a % of total securities |
|
|
100.0 |
% |
|
|
100.0 |
% |
|
|
|
|
|
|
||
Weighted average life (in years) |
|
|
7.4 |
|
|
|
7.6 |
|
|
|
|
|
|
|
||
Total investment securities, which are a source of liquidity for Wesbanco as well as a contributor to interest income, decreased by $383.1 million or 10.1% from December 31, 2022 to December 31, 2023. Over the same period, the available-for-sale portfolio decreased by $334.8 million or 13.2% primarily driven by $315.9 million in paydowns, $31.0 million in sales and $25.3 million in maturities and calls, and was slightly offset by a decrease of $38.7 million in unrealized losses. The held-to-maturity portfolio decreased by $49.1 million or 3.9% primarily due to maturities and calls of municipal bonds. The weighted average yield of the total portfolio increased seven basis points from 2.45% at December 31, 2022 to 2.52% at December 31, 2023, primarily due to increases in the indices tied to variable rate securities.
Total gross unrealized securities losses decreased $72.4 million, from $510.7 million as of December 31, 2022 to $438.3 million at December 31, 2023. The decrease in unrealized losses from December 31, 2022 was due to the overall decrease in investment balances combined with a decrease in market rates during late 2023 causing market prices to increase on the investment portfolio. Wesbanco believes that none of the unrealized losses on available-for-sale debt securities at December 31, 2023 require an allowance for credit losses. Please refer to Note 3, “Securities,” of the Consolidated Financial Statements for additional information. Wesbanco does not have any investments in private mortgage-backed securities or those that are collateralized by sub-prime mortgages, nor does Wesbanco have any exposure to collateralized debt obligations or government-sponsored enterprise preferred stocks.
41
Net unrealized losses on available-for-sale securities included in accumulated other comprehensive income, net of tax, as of December 31, 2023 and December 31, 2022 were $233.2 million and $261.8 million, respectively. These net unrealized pre-tax losses represent temporary fluctuations resulting from changes in market rates in relation to fixed yields in the available-for-sale portfolio, and on an after-tax basis are accounted for as an adjustment to other comprehensive income in shareholders’ equity. Net unrealized pre-tax losses in the held-to-maturity portfolio, which are not accounted for in other comprehensive income, were $130.4 million at December 31, 2023, compared to $164.2 million as of December 31, 2022. With approximately 35% of the investment portfolio in the held-to-maturity category, the recent volatility in interest rates does not have as much of an impact on other comprehensive income as if the entire portfolio were included in the available-for-sale category.
Wesbanco uses prices from independent pricing services and, to a lesser extent, indicative (non-binding) quotes from independent brokers, to measure the fair value of its securities. Wesbanco validates prices received from pricing services or brokers using a variety of methods, including, but not limited to, comparison to secondary pricing services, corroboration of pricing by reference to other independent market data such as secondary broker quotes and relevant benchmark indices, review of pricing by personnel familiar with market liquidity and other market-related conditions, review of pricing service methodologies, review of independent auditor reports received from the pricing service regarding its internal controls, and through review of inputs and assumptions used in pricing certain securities thinly-traded or with limited observable data points. The procedures in place provide management with a sufficient understanding of the valuation models, assumptions, inputs and pricing to reasonably measure the fair value of Wesbanco’s securities. For additional disclosure relating to fair value measurement, refer to Note 16, “Fair Value Measurement” in the Consolidated Financial Statements.
The corporate and municipal bonds in Wesbanco’s held-to-maturity debt portfolio are analyzed quarterly to determine if an allowance for current expected credit losses is warranted. Wesbanco uses a database of historical financials of all corporate and municipal issuers and actual historic default and recovery rates on rated and non-rated transactions to estimate expected credit losses on an individual security basis. The expected credit losses are adjusted quarterly and are recorded in an allowance for expected credit losses on the balance sheet, which is deducted from the amortized cost basis of the held-to-maturity portfolio as a contra asset. The losses are recorded on the income statement in the provision for credit losses. Accrued interest receivable on held-to-maturity securities, which was $8.8 million and $9.5 million as of December 31, 2023 and 2022, respectively, is excluded from the estimate of credit losses. Held-to-maturity investments in U.S. Government sponsored entities and agencies as well as mortgage-backed securities and collateralized mortgage obligations, which are all either issued by a direct governmental entity or a government-sponsored entity, have no historical evidence supporting expected credit losses; therefore, Wesbanco has estimated these losses at zero, and will monitor this assumption in the future for any economic or governmental policies that could affect this assumption. Wesbanco recorded an allowance on held-to-maturity debt securities of $0.2 million as of December 31, 2023 and 2022, respectively.
Equity securities, of which a portion consists of investments in various mutual funds held in grantor trusts formed in connection with a key officer and director deferred compensation plan, are recorded at fair value. Gains and losses due to fair value fluctuations on equity securities are included in net securities gains or losses. For those equity securities relating to the key officer and director deferred compensation plan, the corresponding change in the obligation to the employee is recognized in employee benefits expense.
Cost-method investments consist primarily of FHLB of Pittsburgh stock totaling $62.0 million and $36.2 million at December 31, 2023 and 2022, respectively, and are included in other assets in the Consolidated Balance Sheets.
42
TABLE 7. MATURITY DISTRIBUTION AND YIELD ANALYSIS OF SECURITIES
The following table presents the tax-equivalent yields of held-to-maturity debt securities by contractual maturity at December 31, 2023. In some instances, the issuers may have the right to call or prepay obligations without penalty prior to the contractual maturity date.
|
|
One Year |
|
|
One to Five |
|
|
Five to Ten |
|
|
Over Ten |
|
|
Mortgage-backed securities |
|
|
Total |
|
||||||
Weighted-average yield (1): |
|
|
|
|
|
|
|
|
|
|
|
|
|
|
|
|
|
|
||||||
U.S. Government sponsored entities and agencies |
|
|
— |
|
|
|
— |
|
|
|
— |
|
|
|
— |
|
|
|
2.16 |
% |
|
|
2.16 |
% |
Residential mortgage-backed securities and |
|
|
— |
|
|
|
— |
|
|
|
— |
|
|
|
— |
|
|
|
2.68 |
% |
|
|
2.68 |
% |
Obligations of states and political subdivisions (3) |
|
|
4.09 |
% |
|
|
4.01 |
% |
|
|
3.20 |
% |
|
|
2.56 |
% |
|
|
— |
|
|
|
3.03 |
% |
Corporate debt securities |
|
|
3.57 |
% |
|
|
3.57 |
% |
|
|
— |
|
|
|
— |
|
|
|
— |
|
|
|
3.57 |
% |
Total weighted average yield |
|
|
4.04 |
% |
|
|
3.94 |
% |
|
|
3.20 |
% |
|
|
2.56 |
% |
|
|
2.64 |
% |
|
|
2.97 |
% |
Wesbanco’s municipal portfolio comprises 35.6% of the overall securities portfolio as of December 31, 2023 compared to 33.5% as of December 31, 2022, which carries different risks that are not as prevalent in other security types contained in the portfolio. The following table presents the allocation of the individual bonds in the municipal bond portfolio based on the combined ratings of two major bond credit rating agencies (at fair value):
TABLE 8. MUNICIPAL BOND RATINGS
|
|
December 31, 2023 |
|
|
December 31, 2022 |
|
||||||||||
(dollars in thousands) |
|
Amount |
|
|
% of Total |
|
|
Amount |
|
|
% of Total |
|
||||
Municipal bonds (at fair value) (1): |
|
|
|
|
|
|
|
|
|
|
|
|
||||
Investment Grade - Prime |
|
$ |
115,566 |
|
|
|
10.6 |
|
|
$ |
122,914 |
|
|
|
11.1 |
|
Investment Grade - High |
|
|
850,020 |
|
|
|
78.3 |
|
|
|
850,746 |
|
|
|
76.6 |
|
Investment Grade - Upper Medium |
|
|
114,271 |
|
|
|
10.5 |
|
|
|
131,457 |
|
|
|
11.8 |
|
Investment Grade - Lower Medium |
|
|
2,532 |
|
|
|
0.2 |
|
|
|
1,064 |
|
|
|
0.0 |
|
Not rated |
|
|
3,849 |
|
|
|
0.4 |
|
|
|
4,636 |
|
|
|
0.5 |
|
Total municipal bond portfolio |
|
$ |
1,086,238 |
|
|
|
100.0 |
|
|
$ |
1,110,816 |
|
|
|
100.0 |
|
Wesbanco’s municipal bond portfolio at December 31, 2023, consists of $386.9 million of taxable and $699.4 million of tax-exempt general obligation and revenue bonds. The following table presents additional information regarding the municipal bond type and issuer (at fair value):
TABLE 9. COMPOSITION OF MUNICIPAL SECURITIES
|
|
December 31, 2023 |
|
|
December 31, 2022 |
|
||||||||||
(dollars in thousands) |
|
Amount |
|
|
% of Total |
|
|
Amount |
|
|
% of Total |
|
||||
Municipal bond type: |
|
|
|
|
|
|
|
|
|
|
|
|
||||
General Obligation |
|
$ |
796,448 |
|
|
|
73.3 |
|
|
$ |
805,621 |
|
|
|
72.5 |
|
Revenue |
|
|
289,790 |
|
|
|
26.7 |
|
|
|
305,195 |
|
|
|
27.5 |
|
Total municipal bond portfolio |
|
$ |
1,086,238 |
|
|
|
100.0 |
|
|
$ |
1,110,816 |
|
|
|
100.0 |
|
Municipal bond issuer: |
|
|
|
|
|
|
|
|
|
|
|
|
||||
State Issued |
|
$ |
67,268 |
|
|
|
6.2 |
|
|
$ |
72,855 |
|
|
|
6.6 |
|
Local Issued |
|
|
1,018,970 |
|
|
|
93.8 |
|
|
|
1,037,961 |
|
|
|
93.4 |
|
Total municipal bond portfolio |
|
$ |
1,086,238 |
|
|
|
100.0 |
|
|
$ |
1,110,816 |
|
|
|
100.0 |
|
43
Wesbanco’s municipal bond portfolio is broadly spread across the United States. The following table presents the top five states of municipal bond concentration based on total fair value at December 31, 2023:
TABLE 10. CONCENTRATION OF MUNICIPAL SECURITIES
|
|
December 31, 2023 |
|
|||||
(dollars in thousands) |
|
Fair Value |
|
|
% of Total |
|
||
California |
|
$ |
201,527 |
|
|
|
18.6 |
|
Pennsylvania |
|
|
199,225 |
|
|
|
18.3 |
|
Ohio |
|
|
92,046 |
|
|
|
8.5 |
|
Texas |
|
|
83,979 |
|
|
|
7.7 |
|
Illinois |
|
|
42,088 |
|
|
|
3.9 |
|
All other states (1) |
|
|
467,373 |
|
|
|
43.0 |
|
Total municipal bond portfolio |
|
$ |
1,086,238 |
|
|
|
100.0 |
|
(1) Wesbanco's municipal bond portfolio contains obligations in the state of West Virginia totaling $30.1 million or 2.8% of the total municipal portfolio.
44
LOANS AND LOAN COMMITMENTS
Loans represent Wesbanco’s largest balance sheet asset classification and the largest source of interest income. Commercial loans include CRE, which is further differentiated between land and construction, and improved property loans; as well as other C&I loans that are not secured by real estate. Retail loans include residential real estate mortgage loans, home equity lines of credit (“HELOC”), and loans for other consumer purposes.
Loan commitments, which are not reported on the balance sheet, represent available balances on commercial and consumer lines of credit, commercial letters of credit, deposit account overdraft protection limits, certain loan guarantee contracts, and approved commitments to extend credit. Approved commitments, which have been accepted by the customer, are included net of any Wesbanco loan balances that are to be refinanced by the new commitment. However, typically not all approved commitments will ultimately be funded.
Loans and loan commitments are summarized in Table 11.
TABLE 11. LOANS AND COMMITMENTS
|
|
December 31, |
|
|||||||||||||||||
|
|
2023 |
|
|
2022 |
|
||||||||||||||
(dollars in thousands) |
|
Balance |
|
Commitments |
|
Exposure |
|
|
Balance |
|
Commitments |
|
Exposure |
|
||||||
LOANS |
|
|
|
|
|
|
|
|
|
|
|
|
|
|
||||||
Commercial real estate: |
|
|
|
|
|
|
|
|
|
|
|
|
|
|
||||||
Land and construction |
|
$ |
1,055,865 |
|
$ |
1,238,440 |
|
$ |
2,294,305 |
|
|
$ |
943,887 |
|
$ |
1,093,848 |
|
$ |
2,037,735 |
|
Improved property |
|
|
5,509,583 |
|
|
222,561 |
|
|
5,732,144 |
|
|
|
5,117,457 |
|
|
211,275 |
|
|
5,328,732 |
|
Total commercial real estate |
|
|
6,565,448 |
|
|
1,461,001 |
|
|
8,026,449 |
|
|
|
6,061,344 |
|
|
1,305,123 |
|
|
7,366,467 |
|
Commercial and industrial |
|
|
1,670,659 |
|
|
1,578,557 |
|
|
3,249,216 |
|
|
|
1,579,395 |
|
|
1,359,275 |
|
|
2,938,670 |
|
Total commercial loans |
|
|
8,236,107 |
|
|
3,039,558 |
|
|
11,275,665 |
|
|
|
7,640,739 |
|
|
2,664,398 |
|
|
10,305,137 |
|
Residential real estate |
|
|
2,438,574 |
|
|
185,330 |
|
|
2,623,904 |
|
|
|
2,140,584 |
|
|
359,467 |
|
|
2,500,051 |
|
Home equity lines of credit |
|
|
734,219 |
|
|
1,071,785 |
|
|
1,806,004 |
|
|
|
695,065 |
|
|
1,190,386 |
|
|
1,885,451 |
|
Consumer |
|
|
229,561 |
|
|
29,850 |
|
|
259,411 |
|
|
|
226,340 |
|
|
39,127 |
|
|
265,467 |
|
Total retail loans |
|
|
3,402,354 |
|
|
1,286,965 |
|
|
4,689,319 |
|
|
|
3,061,989 |
|
|
1,588,980 |
|
|
4,650,969 |
|
Total portfolio loans |
|
|
11,638,461 |
|
|
4,326,523 |
|
|
15,964,984 |
|
|
|
10,702,728 |
|
|
4,253,378 |
|
|
14,956,106 |
|
Loans held for sale |
|
|
16,354 |
|
|
20,055 |
|
|
36,409 |
|
|
|
8,249 |
|
|
12,367 |
|
|
20,616 |
|
Deposit overdraft limits |
|
|
— |
|
|
391,598 |
|
|
391,598 |
|
|
|
— |
|
|
380,143 |
|
|
380,143 |
|
Total loans |
|
$ |
11,654,815 |
|
$ |
4,738,176 |
|
$ |
16,392,991 |
|
|
$ |
10,710,977 |
|
$ |
4,645,888 |
|
$ |
15,356,865 |
|
Letters of credit included above |
|
|
|
$ |
38,929 |
|
|
|
|
|
|
$ |
30,362 |
|
|
|
||||
Total portfolio loans increased $935.7 million or 8.7% from December 31, 2022 to December 31, 2023, due to strong growth throughout the year in both the commercial real estate and residential real estate portfolios. Commercial real estate loans increased $504.1 million or 8.3%, as improved property increased by 7.7% and land and construction loans increased 11.9%. Commercial and industrial loans increased $91.3 million or 5.8%. Retail loans also improved throughout the year, as residential real estate loans increased $298.0 million or 13.9%, home equity loans increased $39.2 million or 5.6%, and consumer loans increased $3.2 million or 1.4%. Portfolio loans are presented in the Consolidated Balance Sheets net of deferred loan fees and costs and discounts on purchased loans. The net deferred loan costs were $11.5 million and $9.6 million as of December 31, 2023 and 2022, respectively. Wesbanco conducts a deferred loan cost study to determine the allowable costs to be deferred over the life of the loan. Wesbanco’s deferred costs have continued to increase at a faster rate than the related customer deferred fee income causing the balance of the deferred loan costs to outweigh the deferred loan fees, primarily from home equity lines of credit, which have little fee income. Purchased loan discounts from acquisitions included in the portfolio loan balances were $13.5 million and $18.0 million as of December 31, 2023 and 2022, respectively. Loan accretion included in interest income on loans acquired from prior acquisitions was $4.5 million and $8.0 million for the years ended December 31, 2023 and 2022, respectively.
CRE loans at December 31, 2023 represent a significant component of the loan portfolio at 56.4%, a slight decrease of 0.2% as compared to CRE balances at December 31, 2022. CRE—land and construction loan balances increased $112.0 million or 11.9% from December 31, 2022 to December 31, 2023, while CRE—improved property loans increased $392.1 million or 7.7% during the same period.
C&I loans increased $91.3 million or 5.8% from December 31, 2022 to December 31, 2023. The available lines of credit within C&I loans increased slightly from 64.9% at December 31, 2022 to 67.6% of total C&I revolving lines of credit exposure as of December 31, 2023.
Residential real estate mortgage loans increased $298.0 million from December 31, 2022 to December 31, 2023. Wesbanco retained approximately 57% of mortgages by dollar volume originated in 2023 for the portfolio compared to 78% in 2022. Wesbanco sold more loans in 2023 as compared to 2022 as margins were reduced on fixed rate mortgage loans due to competitive pressures in the marketplace during the higher interest rate environment.
45
HELOC loans increased $39.2 million or 5.6% from December 31, 2022 to December 31, 2023. Consumer loans increased $3.2 million or 1.4% from December 31, 2022 to December 31, 2023.
Total loan commitments increased $92.3 million or 2.0% from December 31, 2022 to December 31, 2023. Commitments in the total CRE portfolio increased approximately $155.9 million or 11.9% and C&I commitments increased $219.3 million or 16.1%, while residential real estate commitments decreased $174.1 million or 48.4% and HELOC commitments decreased $118.6 million or 10.0%.
Geographic Distribution —Wesbanco extends credit primarily within the market areas where it has branch offices, markets adjacent thereto, or markets that have a loan production office. Loans outside of these markets are generally only made to established customers that have other business relationships with Wesbanco in its markets. Loans outside of Wesbanco’s markets represented approximately 4% of total loans at both December 31, 2023 and December 31, 2022. These loans consist primarily of C&I, CRE-improved property loans, residential real estate loans for second residences or vacation homes, consumer purpose lines of credit to wealth management customers, and automobile loans to family members of local customers.
The geographic distribution of the loan portfolio, excluding deposit overdraft limits and loans held for sale, is summarized in Table 12.
TABLE 12. GEOGRAPHIC DISTRIBUTION OF LOANS
|
|
December 31, 2023 (1) |
|
|||||||||||||||||||||||||
|
|
Commercial Real Estate |
|
|
|
|
|
|
|
|
|
|
|
|
|
|
|
|
||||||||||
(percentage of outstandings, rounded to nearest whole percent) |
|
Land and |
|
|
Improved |
|
|
Commercial |
|
|
Residential |
|
|
Home |
|
|
Consumer |
|
|
Total |
|
|||||||
Washington-Arlington-Alexandria |
|
|
6 |
% |
|
|
14 |
% |
|
|
7 |
% |
|
|
14 |
% |
|
|
4 |
% |
|
|
2 |
% |
|
|
13 |
% |
Columbus, OH MSA |
|
|
18 |
|
|
|
10 |
|
|
|
9 |
|
|
|
11 |
|
|
|
8 |
|
|
|
5 |
|
|
|
11 |
|
Pittsburgh, PA MSA |
|
|
7 |
|
|
|
9 |
|
|
|
14 |
|
|
|
11 |
|
|
|
14 |
|
|
|
6 |
|
|
|
10 |
|
Baltimore-Columbia-Towson MD MSA |
|
|
4 |
|
|
|
9 |
|
|
|
2 |
|
|
|
12 |
|
|
|
5 |
|
|
|
2 |
|
|
|
8 |
|
Western Ohio MSAs |
|
|
18 |
|
|
|
6 |
|
|
|
7 |
|
|
|
11 |
|
|
|
8 |
|
|
|
4 |
|
|
|
8 |
|
Louisville, KY—Jefferson County MSA |
|
|
15 |
|
|
|
9 |
|
|
|
10 |
|
|
|
4 |
|
|
|
5 |
|
|
|
3 |
|
|
|
8 |
|
Other Ohio Locations |
|
|
7 |
|
|
|
6 |
|
|
|
15 |
|
|
|
4 |
|
|
|
9 |
|
|
|
12 |
|
|
|
7 |
|
Upper Ohio Valley MSAs |
|
|
1 |
|
|
|
3 |
|
|
|
11 |
|
|
|
4 |
|
|
|
8 |
|
|
|
23 |
|
|
|
5 |
|
Other Kentucky Locations |
|
|
5 |
|
|
|
5 |
|
|
|
3 |
|
|
|
4 |
|
|
|
9 |
|
|
|
5 |
|
|
|
5 |
|
Other West Virginia Locations |
|
|
2 |
|
|
|
4 |
|
|
|
5 |
|
|
|
4 |
|
|
|
9 |
|
|
|
15 |
|
|
|
4 |
|
Lexington, KY—Fayette County MSA |
|
|
2 |
|
|
|
5 |
|
|
|
1 |
|
|
|
4 |
|
|
|
3 |
|
|
|
1 |
|
|
|
4 |
|
Morgantown, WV MSA |
|
|
— |
|
|
|
3 |
|
|
|
2 |
|
|
|
3 |
|
|
|
3 |
|
|
|
4 |
|
|
|
3 |
|
Huntington, WV-Ashland, KY MSA |
|
|
2 |
|
|
|
3 |
|
|
|
2 |
|
|
|
2 |
|
|
|
3 |
|
|
|
5 |
|
|
|
2 |
|
Parkersburg, WV-Marietta, OH MSA |
|
|
2 |
|
|
|
2 |
|
|
|
2 |
|
|
|
1 |
|
|
|
3 |
|
|
|
8 |
|
|
|
2 |
|
Other Indiana Locations |
|
|
4 |
|
|
|
2 |
|
|
|
2 |
|
|
|
2 |
|
|
|
1 |
|
|
|
— |
|
|
|
2 |
|
Other Maryland Locations |
|
|
— |
|
|
|
3 |
|
|
|
— |
|
|
|
2 |
|
|
|
1 |
|
|
|
— |
|
|
|
2 |
|
California-Lexington Park MD MSA |
|
|
— |
|
|
|
2 |
|
|
|
3 |
|
|
|
1 |
|
|
|
1 |
|
|
|
— |
|
|
|
1 |
|
Other Pennsylvania Locations |
|
|
— |
|
|
|
1 |
|
|
|
— |
|
|
|
1 |
|
|
|
5 |
|
|
|
2 |
|
|
|
1 |
|
Adjacent States & Outside-of-Market |
|
|
7 |
|
|
|
4 |
|
|
|
5 |
|
|
|
5 |
|
|
|
1 |
|
|
|
3 |
|
|
|
4 |
|
Total |
|
|
100 |
% |
|
|
100 |
% |
|
|
100 |
% |
|
|
100 |
% |
|
|
100 |
% |
|
|
100 |
% |
|
|
100 |
% |
The Upper Ohio Valley Metropolitan Statistical Areas (“MSAs”) include the Wheeling, West Virginia and Weirton, West Virginia-Steubenville, Ohio MSAs. Other West Virginia locations include the Fairmont-Clarksburg and Charleston MSAs as well as communities that are not located within an MSA primarily in the northern, central and eastern parts of the state. The western Ohio MSAs include the Dayton-Springfield and the Cincinnati-Middletown MSAs. Other Ohio locations include communities in Ohio that are not located within an MSA, the majority of which are located in southeastern Ohio. Other Indiana locations include communities in Indiana that are not located within an MSA, the majority of which are located in southern Indiana. Other Kentucky locations include the Elizabethtown KY MSA along with other Kentucky locations that are not located within an MSA. Through the acquisition of OLBK, Wesbanco added the Baltimore-Columbia-Towson, MD MSA and the Washington DC-Arlington-Alexandria, VA MSA as well as other Maryland locations. Adjacent states include parts of Delaware and Virginia that are within close proximity to Wesbanco’s markets. Outside-of-market loans consist of loans in all other locations not included in any of the other defined areas and have remained relatively unchanged over the past few years.
46
CREDIT RISK
The risk that borrowers will be unable or unwilling to repay their obligations is inherent in all lending activities. Repayment risk can be impacted by external events such as adverse economic conditions, social and political influences that impact entire industries or major employers, individual loss of employment or other personal calamities and changes in interest rates. This inherent risk may be further exacerbated by the terms and structure of each loan as well as potential concentrations of risk. The primary goal of managing credit risk is to minimize the impact of all of these factors on the quality of the loan portfolio.
Credit risk is managed through the initial underwriting process as well as through ongoing monitoring and administration of the portfolio. Credit policies establish standard underwriting guidelines for each type of loan and require an appropriate evaluation of the credit characteristics of each borrower. This evaluation focuses on the sufficiency and sustainability of the primary source of repayment, the adequacy of collateral, if any, as a secondary source of repayment, potential for guarantor support, as a tertiary source of repayment and other factors unique to each type of loan that may increase or mitigate their risk. The manner and degree of monitoring and administration of the portfolio varies by type and size of loan.
Credit risk is also managed by closely monitoring delinquency levels and trends and initiating collection efforts at the earliest stage of delinquency. Wesbanco also monitors general economic conditions, including unemployment, housing activity and real estate values in its markets. Underwriting standards are modified when appropriate based on market conditions, the performance of one or more loan categories, and other external factors. An independent loan review function also performs periodic reviews of the portfolio to assess the adequacy and effectiveness of underwriting, loan documentation and portfolio administration.
Each category of loans contains distinct elements of risk that impact the manner in which those loans are underwritten, structured, documented, administered and monitored. Customary terms and underwriting practices, together with specific risks associated with each category of loans and Wesbanco’s processes for managing those risks are discussed in the remainder of this section.
Commercial Loans —The commercial portfolio consists of loans to a wide range of business enterprises of varying size. Many commercial loans often involve multiple loans to one borrower or a group of related borrowers, therefore the potential for loss on any single transaction can be significantly greater for commercial loans than for retail loans. Commercial loan risk is mitigated by limiting total credit exposure to individual borrowers or groups of borrowers, industries and geographic markets and by requiring appropriate collateral or guarantors.
Commercial loans are monitored for potential concentrations of loans to any one borrower or group of related borrowers. At December 31, 2023 Wesbanco’s legal lending limit to any single borrower or their related interests approximated $266 million. The ten largest commercial relationships combined ranged from $826 million to $868 million during 2023. There were 24 relationships that exceeded $50 million at December 31, 2023. These large relationships generally consist of more than one loan to a borrower or their related entities. The single largest relationship exposure approximated $120 million at December 31, 2023 and consists of multiple loans to a business relationship for gasoline stations with convenience stores, which is in the real estate investment sector.
Commercial loans, including renewals and extensions of maturity, are approved within a framework of individual lending authorities based on the total credit exposure of the borrower. Loans with credit exposure up to $1 million are approved by underwriters that are not responsible for loan origination. Loans with credit exposure greater than $1 million minimally require the approval of a commercial banking executive, and credit exposures greater than $1.5 million require approval of a credit officer that is not responsible for loan origination. In the Mid-Atlantic market, credit exposures greater than $5 million up to $15 million require approval of a credit committee comprised of senior management in the market and credit officers not responsible for loan origination. Credit exposures greater than $25 million require approval of a centralized credit committee comprised of senior and executive management, credit officers, directors, and certain other non-voting qualified persons that are not responsible for loan origination. Underwriters and credit officers do not receive incentive compensation based on loan origination volume. Commercial banking executives receive incentive compensation based on multiple factors that include loan origination, net growth in outstanding loan balances, fees, credit quality and portfolio administration requirements.
CRE – land and construction consists of loans to finance land for development, investment, use in a commercial business enterprise, agricultural or minerals extraction, construction of residential dwellings for resale, multi-family apartments and other commercial buildings that may be owner-occupied or income-generating investments for the owner. Construction loans generally are made only when Wesbanco also commits to the permanent financing of the project, has a takeout commitment from another lender for the permanent loan or the loan is expected to be repaid from the sale of subdivided property. However, even if Wesbanco has a takeout commitment, construction loans are underwritten as if Wesbanco will retain the loan upon completion of construction. In recent years, many construction loans that did not have a takeout commitment when the loan originated have been sold or refinanced in the secondary market immediately upon completion of construction, at times, resulting in significant unscheduled loan payoffs.
47
CRE – land and construction loans require payment of interest-only during the construction period, with initial terms ranging from six months up to three years for larger, multiple-phase projects, such as residential housing developments and large scale commercial projects. Interest rates are often fully-floating based on an appropriate index, but may be structured in the same manner as the interest rate that will apply to the permanent loan upon completion of construction. Interest during the construction period is typically included in the project costs and therefore is often funded by loan advances. Advances are monitored to ensure that the project is at the appropriate stage of completion with each advance and that interest reserves are not exhausted prior to completion of the project. In the event a project is not completed within the initial term, the loan is re-underwritten at maturity, but interest beyond the initial term must be paid by the borrower and in some instances an additional interest reserve is required as a condition of extending the maturity. Upon completion of construction, the loan is converted to permanent financing and reclassified to CRE—improved property.
CRE – improved property loans consist of loans to purchase or refinance owner-occupied and investment properties. Owner-occupied CRE consists of loans to borrowers in a diverse range of industries and property types. Investment properties include multi-family apartment buildings, 1-to-4 family rental units, lodging and various types of commercial buildings that are rented or leased to unrelated parties of the owner.
CRE – improved property loans generally require monthly principal and interest payments based on amortization periods ranging from ten to thirty years depending on the type, age and condition of the property. Loans with amortization periods exceeding twenty years typically also have a maturity date or call option of ten years or less. Interest rates are generally adjustable after a fixed period ranging from one to five years based on an appropriate index of comparable duration. Interest rates may also be fixed for longer than five years and certain loans from acquisitions may have longer initial fixed rate terms. For certain larger loans, the borrower may be required to enter into an interest rate derivative contract that converts Wesbanco’s rate to an adjustable rate.
C&I loans consist of revolving lines of credit to finance accounts receivable, inventory and other general business purposes; term loans to finance fixed assets other than real estate, and letters of credit to support trade, insurance or governmental requirements for a variety of businesses. Most C&I borrowers are privately-held companies with annual sales up to $100 million.
C&I term loans secured by equipment and other types of collateral generally require monthly principal and interest payments based on amortization periods up to ten years depending on the estimated useful life of the collateral, with interest rates that may be fixed for the term of the loan (potentially via an interest rate derivative contract) or adjustable after a fixed period ranging from one to seven years based on an appropriate index.
Commercial lines and letters of credit are generally categorized as C&I but may also be categorized as CRE—improved property loans or CRE—land and construction if they are secured primarily by real estate. Lines of credit typically require payment of interest-only with principal due on demand or at maturity. Interest rates on lines of credit are generally fully-adjustable based on an appropriate short-term index. Letters of credit typically require a periodic fee with principal and interest due on demand in the event the beneficiary of the letter requests an advance on the commitment. Lines of credit may also include a fee based on the amount of the line that is not advanced. Lines and letters of credit are generally renewable or may be cancelled annually by Wesbanco, but may also be committed for up to three years for certain small business lines and certain letters of credit. Letters of credit may also require Wesbanco to notify the beneficiary within a specified time in the event Wesbanco does not intend to renew or extend the commitment.
48
Table 13 summarizes the distribution of maturities by rate type for all commercial loans.
TABLE 13. MATURITIES OF COMMERCIAL LOANS
|
|
December 31, 2023 |
|
|||||||||||||||||||||||||||||||||||||
|
|
Fixed Rate Loans |
|
|
Variable Rate Loans |
|
||||||||||||||||||||||||||||||||||
(in thousands) |
|
In One |
|
|
After |
|
|
After |
|
|
After |
|
|
Total |
|
|
In One |
|
|
After |
|
|
After |
|
|
After |
|
|
Total |
|
||||||||||
Commercial real estate: |
|
|
|
|
|
|
|
|
|
|
|
|
|
|
|
|
|
|
|
|
|
|
|
|
|
|
|
|
|
|
||||||||||
Land and construction |
|
$ |
8,247 |
|
|
$ |
48,128 |
|
|
$ |
40,364 |
|
|
$ |
33,454 |
|
|
$ |
130,193 |
|
|
$ |
209,058 |
|
|
$ |
456,516 |
|
|
$ |
250,857 |
|
|
$ |
9,241 |
|
|
$ |
925,672 |
|
Improved property |
|
|
183,079 |
|
|
|
812,680 |
|
|
|
518,744 |
|
|
|
16,626 |
|
|
|
1,531,129 |
|
|
|
260,381 |
|
|
|
1,292,357 |
|
|
|
2,131,737 |
|
|
|
293,979 |
|
|
|
3,978,454 |
|
Commercial and industrial |
|
|
50,525 |
|
|
|
352,310 |
|
|
|
272,935 |
|
|
|
61,636 |
|
|
|
737,406 |
|
|
|
505,796 |
|
|
|
245,732 |
|
|
|
149,903 |
|
|
|
31,822 |
|
|
|
933,253 |
|
Total commercial loans |
|
$ |
241,851 |
|
|
$ |
1,213,118 |
|
|
$ |
832,043 |
|
|
$ |
111,716 |
|
|
$ |
2,398,728 |
|
|
$ |
975,235 |
|
|
$ |
1,994,605 |
|
|
$ |
2,532,497 |
|
|
$ |
335,042 |
|
|
$ |
5,837,379 |
|
The primary factors considered in underwriting CRE—land and construction loans are the overall viability of each project, the experience and financial capacity of the developer or builder to successfully complete the project, market absorption rates and property values. These loans also have the unique risk that the developer or builder may not complete the project, or not complete it on time or within budget. Risk is generally mitigated by extending credit to developers and builders with established reputations who operate in Wesbanco’s markets and have the liquidity or other resources to absorb unanticipated increases in the cost of a project or longer than anticipated absorption, periodically inspecting construction in progress, and disbursing the loan at specified stages of completion. Certification of completed construction by a licensed architect or engineer and performance and payment bonds may also be required for certain types of projects. Since speculative projects are inherently riskier, Wesbanco may require a specified percentage of pre-sales for land and residential development or pre-lease commitments for investment property before construction can begin.
The primary factors that are considered in underwriting investment real estate are the debt service coverage calculation, the net rental income generated by the property, the composition of the tenants occupying the property, and the terms of leases, all of which may vary depending on the specific type of property. Other factors that are considered include the overall financial capacity of the investors and their experience owning and managing investment property.
Repayment of owner-occupied loans must come from the cash flow generated by the occupant’s commercial business. Therefore, the primary factors that are considered in underwriting owner-occupied CRE and C&I loans are the debt service coverage calculation, the historical and projected earnings, cash flow, capital resources, liquidity and leverage of the business. Other factors that are considered for their potential impact on repayment capacity include the borrower’s industry, competitive advantages and disadvantages, demand for the business’ products and services, business model viability, quality, experience and depth of management, and external influences that may impact the business such as general economic conditions and social or political changes.
The type, age, condition and location of real estate as well as any environmental risks associated with the property are considered for both owner-occupied and investment CRE. Environmental risk is mitigated by requiring assessments performed by qualified inspectors whenever the current or previous uses of the property or any adjacent properties are likely to have resulted in contamination of the property financed. Risk is further mitigated by requiring borrowers to have adequate down payments or cash equity, thereby limiting the loan amount in relation to the lower of the cost or the market value of the property, unless there are sufficient mitigating factors that would reduce the risk of a higher loan-to-value. Market values are determined by obtaining current appraisals or evaluations, whichever is appropriate or required by banking regulations based on the amount financed prior to the loan being made. New appraisals or evaluations may be obtained throughout the life of each loan to more accurately assess current market value when the initial term of a loan is being extended, market conditions indicate that the property value may have declined, and/or the primary source of repayment is no longer adequate to repay the loan under its original terms.
CRE loan-to-value (“LTV”) ratios are generally limited to the maximum percentages prescribed by Wesbanco credit policy or banking regulations, which range from 65% for unimproved land to 85% for improved commercial property. Regulatory guidelines also limit the aggregate of CRE loans that exceed prescribed LTV ratios to 30% of the Bank’s total risk-based capital. The aggregate of all CRE loans and loan commitments that exceeded the regulatory guidelines approximated $165 million or 9% of the Bank’s total risk-based capital at December 31, 2023, compared to $126 million or 8% at December 31, 2022. Regardless of credit policy or regulatory guidelines, lower LTV ratios may be required for certain types of properties or when other factors exist that increase the risk of volatility in market values such as single or special-use properties that cannot be easily converted to other uses or may have limited marketability. Conversely, higher LTV ratios may be acceptable when there are other factors to adequately mitigate the risk.
The type and amount of collateral for C&I loans varies depending on the overall financial strength of the borrower, the amount and terms of the loan, and available collateral or guarantors. The level of pledged collateral can vary from unsecured to fully secured with various types of collateral. Unsecured credit is only extended to those borrowers and/or guarantors that exhibit consistently strong repayment capacity and the financial condition to withstand a temporary decline in their operating cash flows. Unsecured loans totaled $210 million and $226 million at December 31, 2023 and December 31, 2022, respectively. Loans can be secured by bank deposit
49
accounts, marketable securities, working capital assets (accounts receivable and inventory), equipment or owner occupied real estate. Bank deposits and marketable securities represent the lowest risk. Marketable securities are subject to changes in market value and are monitored regularly by the bank to ensure they remain appropriately margined. Collateral other than equipment or real estate that fluctuates with business activity, such as accounts receivable and inventory, may also be subject to regular reporting and certification by the borrower and, in some instances, independent inspection and verification by Wesbanco. Loans secured by equipment or real estate may be subject to receipt of third party appraisals. Although loans can be collateral type-specific, they can also be secured by multiple property types and/or a blanket lien may be placed on all of a borrower’s assets.
Most commercial loans are originated directly by Wesbanco. Participation in loans originated by other financial institutions represents $871 million or 7.7% of total commercial loan exposure at December 31, 2023, compared to $789 million or 7.7% at December 31, 2022. Included in this total are Shared National Credits of approximately $178 million at December 31, 2023 and $10 million at December 31, 2022. Shared National Credits are defined as loans in excess of $100 million that are financed by three or more lending institutions. Wesbanco performs its own customary credit evaluation and underwriting before purchasing loan participations. The credit risk associated with these loans is similar to that of loans originated by Wesbanco, but additional risk may arise from the limited ability to control the actions of the lead, agent or servicing institution.
The commercial portfolio is monitored for potential concentrations of credit risk including by market, CRE – property type, C&I industry, loan type and loans affected by similar external factors. The breakdown of CRE – improved property includes 26% owner-occupied and 74% non-owner occupied.
Beginning in 2001 and revised in 2013, banks of a certain size are required to track C&I loan transactions designated as Highly Leveraged Transactions (“HLTs”). Loans that meet the criteria must be of a certain size, for the purpose of a buyout, acquisition or capital distributions and meet certain leverage ratios. As of December 31, 2023, Wesbanco had $108.0 million or 1.0% of total commercial loan exposure designated as HLTs, as compared to $39.8 million or 0.4% as of December 31, 2022.
The bank is monitoring the office building portfolio, as the continuing trend towards remote work has led to diminished need for dedicated office space. As of December 31, 2023, total exposure to land development and new development related to office buildings, improvements and renovation of existing structures, purchase of existing buildings and other related activities approximated $471 million or 4.2% of the total commercial loan exposure, as compared to $519 million or 5.0% of the total commercial loan exposure at December 31, 2022. There is a potential risk for office loan losses to materialize as lease agreements begin to expire and companies reduce their footprint.
50
TABLE 14. COMMERCIAL EXPOSURE BY INDUSTRY
|
|
December 31, 2023 |
|
||||||||||||||||||||||||||||
|
|
Land and Construction |
|
|
Improved Property |
|
|
Commercial and Industrial |
|
|
|
|
|
|
|
|
|||||||||||||||
(in thousands) |
|
Balance |
|
Commitment |
|
|
Balance |
|
Commitment |
|
|
Balance |
|
Commitment |
|
|
Total Loan Balance |
|
Total |
|
% of |
|
|||||||||
Agriculture and farming |
|
$ |
1,302 |
|
$ |
2,920 |
|
|
$ |
11,766 |
|
$ |
868 |
|
|
$ |
24,906 |
|
$ |
6,933 |
|
|
$ |
37,974 |
|
$ |
48,695 |
|
|
2.8 |
|
Energy |
|
|
3,211 |
|
|
— |
|
|
|
26,596 |
|
|
1,117 |
|
|
|
60,814 |
|
|
58,947 |
|
|
|
90,621 |
|
|
150,685 |
|
|
8.5 |
|
Construction |
|
|
112,277 |
|
|
129,007 |
|
|
|
127,466 |
|
|
33,789 |
|
|
|
195,695 |
|
|
247,537 |
|
|
|
435,438 |
|
|
845,771 |
|
|
47.8 |
|
Manufacturing |
|
|
30,600 |
|
|
19,454 |
|
|
|
149,033 |
|
|
30,139 |
|
|
|
158,792 |
|
|
153,764 |
|
|
|
338,425 |
|
|
541,782 |
|
|
30.6 |
|
Wholesale and distribution |
|
|
1,706 |
|
|
994 |
|
|
|
66,192 |
|
|
4,076 |
|
|
|
110,860 |
|
|
128,227 |
|
|
|
178,758 |
|
|
312,055 |
|
|
17.6 |
|
Retail |
|
|
43,990 |
|
|
20,212 |
|
|
|
306,627 |
|
|
35,414 |
|
|
|
114,233 |
|
|
86,633 |
|
|
|
464,850 |
|
|
607,109 |
|
|
34.3 |
|
Transportation and warehousing |
|
|
2,775 |
|
|
816 |
|
|
|
75,394 |
|
|
2,551 |
|
|
|
63,102 |
|
|
23,993 |
|
|
|
141,271 |
|
|
168,631 |
|
|
9.5 |
|
Information and communications |
|
|
28,437 |
|
|
6,204 |
|
|
|
10,011 |
|
|
— |
|
|
|
16,789 |
|
|
11,666 |
|
|
|
55,237 |
|
|
73,107 |
|
|
4.1 |
|
Finance and insurance |
|
|
3,000 |
|
|
1,476 |
|
|
|
20,403 |
|
|
1,028 |
|
|
|
42,230 |
|
|
127,751 |
|
|
|
65,633 |
|
|
195,888 |
|
|
11.1 |
|
Equipment leasing |
|
|
257 |
|
|
663 |
|
|
|
18,365 |
|
|
492 |
|
|
|
74,371 |
|
|
52,226 |
|
|
|
92,993 |
|
|
146,374 |
|
|
8.3 |
|
Real estate - 1-4 family |
|
|
7,133 |
|
|
11,215 |
|
|
|
209,292 |
|
|
10,336 |
|
|
|
2,250 |
|
|
3,395 |
|
|
|
218,675 |
|
|
243,621 |
|
|
13.8 |
|
Real estate - multi-family |
|
|
442,040 |
|
|
422,609 |
|
|
|
671,330 |
|
|
13,081 |
|
|
|
— |
|
|
40 |
|
|
|
1,113,370 |
|
|
1,549,100 |
|
|
87.5 |
|
Real estate - other retail |
|
|
8,471 |
|
|
2,560 |
|
|
|
151,235 |
|
|
1,178 |
|
|
|
4,080 |
|
|
95 |
|
|
|
163,786 |
|
|
167,619 |
|
|
9.5 |
|
Real estate - shopping center |
|
|
10,949 |
|
|
36,661 |
|
|
|
601,735 |
|
|
2,894 |
|
|
|
— |
|
|
— |
|
|
|
612,684 |
|
|
652,239 |
|
|
36.8 |
|
Real estate - office building |
|
|
9,241 |
|
|
1,946 |
|
|
|
440,135 |
|
|
11,483 |
|
|
|
7,369 |
|
|
589 |
|
|
|
456,745 |
|
|
470,763 |
|
|
26.6 |
|
Real estate - commercial/manufacturing |
|
|
23,632 |
|
|
23,637 |
|
|
|
298,235 |
|
|
13,023 |
|
|
|
10,305 |
|
|
170 |
|
|
|
332,172 |
|
|
369,002 |
|
|
20.8 |
|
Real estate - residential buildings |
|
|
35,572 |
|
|
108,163 |
|
|
|
116,000 |
|
|
4,027 |
|
|
|
10,392 |
|
|
20,940 |
|
|
|
161,964 |
|
|
295,094 |
|
|
16.7 |
|
Real estate - other |
|
|
79,596 |
|
|
96,660 |
|
|
|
505,504 |
|
|
19,779 |
|
|
|
51,856 |
|
|
44,779 |
|
|
|
636,956 |
|
|
798,174 |
|
|
45.1 |
|
Services |
|
|
12,504 |
|
|
24,687 |
|
|
|
273,348 |
|
|
17,497 |
|
|
|
221,954 |
|
|
163,896 |
|
|
|
507,806 |
|
|
713,886 |
|
|
40.3 |
|
Schools and education services |
|
|
5,008 |
|
|
416 |
|
|
|
56,234 |
|
|
884 |
|
|
|
97,890 |
|
|
16,671 |
|
|
|
159,132 |
|
|
177,103 |
|
|
10.0 |
|
Healthcare |
|
|
83,930 |
|
|
112,691 |
|
|
|
472,341 |
|
|
7,969 |
|
|
|
116,818 |
|
|
66,545 |
|
|
|
673,089 |
|
|
860,294 |
|
|
48.6 |
|
Entertainment and recreation |
|
|
9,737 |
|
|
801 |
|
|
|
41,692 |
|
|
154 |
|
|
|
8,212 |
|
|
5,725 |
|
|
|
59,641 |
|
|
66,321 |
|
|
3.7 |
|
Hotels |
|
|
14,260 |
|
|
26,290 |
|
|
|
642,470 |
|
|
3,383 |
|
|
|
1,613 |
|
|
5,742 |
|
|
|
658,343 |
|
|
693,758 |
|
|
39.2 |
|
Other accommodations |
|
|
29,634 |
|
|
67,152 |
|
|
|
32,148 |
|
|
271 |
|
|
|
232 |
|
|
654 |
|
|
|
62,014 |
|
|
130,091 |
|
|
7.3 |
|
Restaurants |
|
|
14,023 |
|
|
7,611 |
|
|
|
97,694 |
|
|
1,169 |
|
|
|
48,555 |
|
|
23,339 |
|
|
|
160,272 |
|
|
192,391 |
|
|
10.9 |
|
Religious organizations |
|
|
12,526 |
|
|
8,070 |
|
|
|
65,789 |
|
|
2,709 |
|
|
|
25,085 |
|
|
23,283 |
|
|
|
103,400 |
|
|
137,462 |
|
|
7.8 |
|
Government |
|
|
30,054 |
|
|
3,042 |
|
|
|
15,409 |
|
|
401 |
|
|
|
182,293 |
|
|
12,178 |
|
|
|
227,756 |
|
|
243,377 |
|
|
13.7 |
|
Unclassified |
|
|
— |
|
|
102,483 |
|
|
|
7,139 |
|
|
2,849 |
|
|
|
19,963 |
|
|
292,839 |
|
|
|
27,102 |
|
|
425,273 |
|
|
24.0 |
|
Total commercial loans |
|
$ |
1,055,865 |
|
$ |
1,238,440 |
|
|
$ |
5,509,583 |
|
$ |
222,561 |
|
|
$ |
1,670,659 |
|
$ |
1,578,557 |
|
|
$ |
8,236,107 |
|
$ |
11,275,665 |
|
|
636.9 |
|
Multi-family apartments represent the single largest category of commercial loans. Multi-family apartment exposure increased 17.7% from $1.3 billion at December 31, 2022 to $1.5 billion at December 31, 2023. This exposure represents 87.5% of total risk-based capital at December 31, 2023, up from 80.5% at December 31, 2022.
Healthcare represents the second largest category of commercial exposure with total exposure of $860 million. Healthcare exposure increased 16.4% from December 31, 2022 to December 31, 2023. This category represents 48.6% of risk-based capital, compared to 45.2% at December 31, 2022.
Construction represents the third largest category of commercial exposure with total exposure of $846 million. Construction exposure increased 28.4% from December 31, 2022 to December 31, 2023. This category represents 47.8% of risk-based capital, compared to 40.3% at December 31, 2022. Construction-coded loans are broken down between 1-4 family homes built for sale, lot development and general trade.
Real estate—other represents the fourth largest category of commercial exposure with total exposure of $798 million. Real estate—other exposure increased 17.2% from December 31, 2022 to December 31, 2023. This category represents 45.1% of risk-based capital, compared to 41.6% at December 31, 2022. Real estate – other consists of property types such as box stores, eating facilities and mixed use.
Services represents the fifth largest category of commercial loan exposure with total exposure of $714 million. Services exposure increased 12.4% from December 31, 2022 to December 31, 2023. This represents 40.3% of total risk-based capital at December 31, 2022, compared to 38.9% at December 31, 2022.
Lodging represents the sixth largest category of commercial exposure with total exposure of $694 million. Lodging increased 1.6% from December 31, 2022 to December 31, 2023. This category represents 39.2% of risk-based capital, compared to 41.8% at December 31, 2022.
In addition to the methods in which Wesbanco monitors the CRE portfolio for possible concentrations of risk, the regulatory agencies use a two-tiered assessment to determine whether a bank has an overall concentration of CRE lending as a percentage of bank total risk-based capital. Loan balances used to determine compliance are based upon Call Report instructions and therefore do not necessarily match the balances displayed in Table 14. The first tier measures loans for land, land development, residential and commercial construction. This tier totals $1.2 billion or 65.5% of total risk-based capital at December 31, 2023, compared to $1.3 billion or 79.6% at December 31, 2022. The regulatory guidance for the first tier is 100% of total risk-based capital. The second tier measures loans included in the first tier plus multi-family apartments and other commercial investment property. This tier totals $5.0 billion or 285.1% of total risk-based capital at December 31, 2023, compared to $4.7 billion or 289.9% at December 31, 2022. The regulatory
51
guidance for the second tier is 300% of total risk-based capital. The regulatory agencies also consider whether a bank’s CRE portfolio has increased by 50% or more within the prior thirty-six months of the assessment date. Total CRE exposure increased $819 million or 19.4% for the thirty-six month period ended December 31, 2023.
Basel III requires banks to identify High Volatility Commercial Real Estate (“HVCRE”) loans in their portfolios. These loans are subject to 150% weighting in the risk-based capital calculation, effective January 1, 2015. These regulations require, among other things, that investment CRE loans for acquisition, development or construction that are not in permanent amortizing loan status, meet the statutory LTV guidelines, have a minimum contributed equity of 15% in cash, marketable securities or contributed land at appraised value, and the loan documentation must contain a requirement that the initial capital injection remain in the project until the loan has converted to permanent financing or is paid in full. Changes to the law in May 2018 eliminated certain CRE loan categories from being subject to the regulation, such as owner-occupied, changed contributed land value from cost to appraised value for the equity component and required only the initial capital to meet the 15% threshold remain in the project. The bank has approximately $173 million in HVCRE exposure representing 2.2% of total CRE exposure and 9.8% of total risk-based capital at December 31, 2023. This compares to $119 million in HVCRE exposure representing 1.6% of total CRE exposure and 7.3% of total risk-based capital at December 31, 2022.
Retail Loans —Retail loans are a homogenous group, generally consisting of standardized products that are smaller in amount and distributed over a larger number of individual borrowers. This group is comprised of residential real estate loans, home equity lines of credit and consumer loans.
Residential real estate consists of loans to purchase, construct or refinance the borrower’s primary dwelling, second residence or vacation home. Residential real estate also includes approximately $12 million of 1-to-4 family rental properties at December 31, 2023, an increase from approximately $10 million at December 31, 2022. Wesbanco originates residential real estate loans for its portfolio as well as for sale in the secondary market. Portfolio loans also include loans to finance vacant land upon which the owner intends to construct a dwelling at a future date. The majority of portfolio loans require monthly principal and interest payments to amortize the loan with terms up to thirty years. Construction loans may only require interest payments during the construction period, which typically range from six to twelve months (but may be longer for larger residences) and will convert to principal and interest upon completion of construction. Loans for vacant land are generally five-year balloons based on a 20-year amortization and are refinanced when the owner begins construction of a dwelling. Interest rates on portfolio loans may be fixed for up to 30 years. Adjustable rate loans are based primarily on the Treasury Constant Maturity index and can adjust annually or in increments up to 15 years. Currently most 30-year and a portion of 15-year fixed-rate originations are sold into the secondary market.
HELOC loans are secured by first or second liens on a borrower’s primary residence or second home. HELOCs are generally limited to an amount which when combined with the first mortgage on the property, if any, does not exceed 90% of the market value. Maximum LTV ratios are also tiered based on the amount of the line and the borrower’s credit history. Most HELOCs originated prior to 2005 are available for draws by the borrower for up to fifteen years, at which time the outstanding balance is converted to a term loan requiring monthly principal and interest payments sufficient to repay the loan in not more than seven years. Most HELOCs originated from 2005 through 2013 are available to the borrower for an indefinite period as long as the borrower’s credit characteristics do not materially change, but may be cancelled by Wesbanco under certain circumstances. Generally, lines originated since 2013 have a 15 year draw period, a ten-year repayment period and also give borrowers the option to convert portions of the balance of their line into an installment loan requiring monthly principal and interest payments, with availability to draw on the line restored as the installment portions are repaid.
Consumer loans consist of installment loans originated directly by Wesbanco and indirectly through dealers to finance purchases of automobiles, trucks, motorcycles, boats, and other recreational vehicles; home equity installment loans, unsecured home improvement loans, and revolving lines of credit that can be secured or unsecured. The maximum term for installment loans is generally eighty-four months for automobiles, trucks, motorcycles and boats; one hundred eighty months for travel trailers; one hundred twenty months for home equity/improvement loans; and sixty months if the loan is unsecured. Maximum terms may be less depending on age of collateral. In January 2018, the bank decided to no longer underwrite indirect loans for motorcycles, recreational vehicles, trailers, boats or off-road vehicles to reduce the overall risk profile of the portfolio. Revolving lines of credit are generally available for an indefinite period of time as long as the borrower’s credit characteristics do not materially change, but may be cancelled by Wesbanco under certain circumstances. Interest rates on installment obligations are generally fixed for the term of the loan, while lines of credit are adjustable daily based on the Prime Rate.
52
TABLE 15. MATURITIES OF RETAIL LOANS
|
|
December 31, 2023 |
|
|||||||||||||||||||||||||||||||||||||
|
|
Fixed Rate Loans |
|
|
Variable Rate Loans |
|
||||||||||||||||||||||||||||||||||
(in thousands) |
|
In One |
|
|
After One |
|
|
After |
|
|
After |
|
|
Total |
|
|
In One |
|
|
After One |
|
|
After |
|
|
After |
|
|
Total |
|
||||||||||
Residential real estate |
|
$ |
5,803 |
|
|
$ |
67,821 |
|
|
$ |
117,388 |
|
|
$ |
171,634 |
|
|
$ |
362,646 |
|
|
$ |
159 |
|
|
$ |
3,738 |
|
|
$ |
40,087 |
|
|
$ |
2,031,944 |
|
|
$ |
2,075,928 |
|
Home equity lines of credit |
|
|
512 |
|
|
|
12,511 |
|
|
|
65,600 |
|
|
|
1,350 |
|
|
|
79,973 |
|
|
|
43,186 |
|
|
|
11,019 |
|
|
|
43,076 |
|
|
|
556,965 |
|
|
|
654,246 |
|
Consumer |
|
|
10,388 |
|
|
|
112,106 |
|
|
|
87,698 |
|
|
|
341 |
|
|
|
210,533 |
|
|
|
17,332 |
|
|
|
680 |
|
|
|
1,016 |
|
|
|
— |
|
|
|
19,028 |
|
Total retail loans |
|
$ |
16,703 |
|
|
$ |
192,438 |
|
|
$ |
270,686 |
|
|
$ |
173,325 |
|
|
$ |
653,152 |
|
|
$ |
60,677 |
|
|
$ |
15,437 |
|
|
$ |
84,179 |
|
|
$ |
2,588,909 |
|
|
$ |
2,749,202 |
|
The primary factors that are considered in underwriting retail loans are the borrower’s credit history and their current and reasonably anticipated ability to repay their obligations as measured by their total debt-to-income ratio. Portfolio residential real estate loans are generally underwritten to secondary market lending standards using automated underwriting systems developed for the secondary market that rely on empirical data to evaluate each loan application and assess credit risk. The amount of the borrower’s down payment is an important consideration for residential real estate, as is the borrower’s equity in the property for HELOCs. It is common practice to finance the total amount of the purchase price of motor vehicles and other consumer products plus certain allowable additions for tax, title, service contracts and credit insurance.
Risk is further mitigated by requiring residential real estate borrowers to have adequate down payments or cash equity, thereby limiting the loan amount in relation to the lower of the cost or the market value of the property, unless there are sufficient mitigating factors that would reduce the risk of a higher loan-to-value. Market values are determined by obtaining current appraisals or evaluations, whichever is appropriate or required by banking regulations, based on the amount financed prior to the loan being made. New appraisals or evaluations are not obtained unless the borrower requests a modification or refinance of the loan, or there is increased dependence on the value of the collateral because the borrower is in default.
Wesbanco does not maintain current information about the industry in which retail borrowers are employed. While such information is obtained when each loan is underwritten, it often becomes inaccurate with the passage of time as borrowers change employment. Instead, Wesbanco estimates potential exposure based on consumer demographics, market share, and other available information when there is a significant risk of loss of employment within an industry or a significant employer in Wesbanco’s markets. To management’s knowledge, there are no concentrations of employment that would have a material adverse impact on the retail portfolio.
Most retail loans are originated directly by Wesbanco except for indirect consumer loans originated by automobile dealers and other sellers of consumer goods. Wesbanco performs its own customary credit evaluation and underwriting before purchasing indirect loans. The credit risk associated with these loans is similar to that of loans originated by Wesbanco, but additional risk may arise from Wesbanco’s limited ability to control a dealer’s compliance with applicable consumer lending laws. Indirect consumer loans represented $121 million or 53% of consumer loans at December 31, 2023 compared to $121 million or 54% at December 31, 2022.
Loans Held For Sale —Loans held for sale consist of residential real estate loans originated for sale in the secondary market. Credit risk associated with such loans is mitigated by entering into sales commitments with third party investors to purchase the loans when they are originated. This practice has the effect of minimizing the amount of such loans that are unsold and the interest rate risk at any point in time. Wesbanco generally does not service these loans after they are sold. While most loans are sold without recourse, Wesbanco may be required to repurchase loans under certain circumstances for contractual periods of generally up to one year or less. The number and principal balance of loans that Wesbanco has been required to repurchase has not been material and therefore reserves established for this exposure are not material.
Banks that have been acquired by Wesbanco serviced some of the residential real estate loans that were sold to the secondary market prior to being acquired. Although these loans are not carried as an asset on the balance sheet, Wesbanco continues to service these loans. As of December 31, 2023 and 2022, Wesbanco serviced loans for others aggregating approximately $27 million and $29 million, respectively. There was no remaining unamortized balance of mortgage servicing rights related to these loans at either December 31, 2023 and 2022.
53
CREDIT QUALITY
The quality of the loan portfolio is measured by various factors, including the amount of loans that are past due, required to be reported as non-performing, or are adversely graded in accordance with internal risk classifications that are consistent with regulatory adverse risk classifications. Non-performing loans consist of non-accrual loans. In 2022, they also included TDRs. As of January 1, 2023, the TDR designation is no longer utilized; see Note 1, “Summary of Significant Accounting Policies” for additional information regarding the most recent modified loans policies. Non-performing assets also include other real estate owned (“OREO”) and repossessed assets. Net charge-offs are also an important measure of credit quality. Wesbanco seeks to develop individual strategies for all assets that have adverse risk characteristics in order to minimize potential loss. However, there is no assurance such strategies will be successful and loans may ultimately proceed to foreclosure or other course of liquidation that does not fully repay the amount of the loan.
Past Due Loans —Loans that are past due but not reported as non-performing generally consist of loans that are between 30 and 89 days contractually past due. Certain loans that are 90 days or more past due also continue to accrue interest because they are deemed to be well-secured and in the process of collection. Earlier stage delinquency requires routine collection efforts to prevent them from becoming more seriously delinquent. Early stage delinquency represents potential future non-performing loans if routine collection efforts are unsuccessful. Table 16 summarizes loans that are contractually past due 30 days or more, excluding non-accrual and TDR loans.
TABLE 16. PAST DUE AND ACCRUING LOANS EXCLUDING NON-ACCRUAL AND TDR LOANS
|
|
December 31, |
|
|||||||||||
|
|
2023 |
|
|
2022 |
|
||||||||
(dollars in thousands) |
|
Amount |
|
% of |
|
|
Amount |
|
% of |
|
||||
90 days or more: |
|
|
|
|
|
|
|
|
|
|
||||
Commercial real estate - land and construction |
|
$ |
— |
|
|
— |
|
|
$ |
629 |
|
|
0.07 |
|
Commercial real estate - improved property |
|
|
1,899 |
|
|
0.03 |
|
|
|
84 |
|
|
0.00 |
|
Commercial and industrial |
|
|
3,184 |
|
|
0.19 |
|
|
|
1,586 |
|
|
0.10 |
|
Residential real estate |
|
|
2,602 |
|
|
0.11 |
|
|
|
1,551 |
|
|
0.07 |
|
Home equity lines of credit |
|
|
1,407 |
|
|
0.19 |
|
|
|
1,063 |
|
|
0.15 |
|
Consumer |
|
|
546 |
|
|
0.24 |
|
|
|
530 |
|
|
0.23 |
|
Total 90 days or more |
|
|
9,638 |
|
|
0.08 |
|
|
|
5,443 |
|
|
0.05 |
|
30 to 89 days: |
|
|
|
|
|
|
|
|
|
|
||||
Commercial real estate - land and construction |
|
|
— |
|
|
— |
|
|
|
910 |
|
|
0.10 |
|
Commercial real estate - improved property |
|
|
7,476 |
|
|
0.14 |
|
|
|
2,459 |
|
|
0.05 |
|
Commercial and industrial |
|
|
1,834 |
|
|
0.11 |
|
|
|
984 |
|
|
0.06 |
|
Residential real estate |
|
|
3,093 |
|
|
0.13 |
|
|
|
3,582 |
|
|
0.17 |
|
Home equity lines of credit |
|
|
5,461 |
|
|
0.74 |
|
|
|
3,920 |
|
|
0.56 |
|
Consumer |
|
|
5,011 |
|
|
2.18 |
|
|
|
3,584 |
|
|
1.58 |
|
Total 30 to 89 days |
|
|
22,875 |
|
|
0.20 |
|
|
|
15,439 |
|
|
0.14 |
|
Total 30 days or more |
|
$ |
32,513 |
|
|
0.28 |
|
|
$ |
20,882 |
|
|
0.19 |
|
Loans past due 30 days or more and accruing interest increased $11.6 million, representing 0.28% of total loans at December 31, 2023, as compared to 0.19% at December 31, 2022. For the year ended December 31, 2022, this also excluded loans classified as TDRs at that time. The overall low level of delinquency is the result of management’s continued focus on sound initial underwriting and timely collection of loans at their earliest stage of delinquency.
Non-Performing Assets —Non-performing assets consist of non-accrual loans, OREO and repossessed assets. Prior to 2023, non-performing assets also included TDRs.
Prior to the adoption of ASU 2022-02 on January 1, 2023, loans were categorized as TDRs when Wesbanco, for economic or legal reasons related to a borrower’s financial difficulties, granted a concession to the borrower that it would not otherwise have considered unless the modification resulted in only an insignificant delay in the payments to be received. Concessions may have included a reduction of either the interest rate, the amount of accrued interest, or the principal balance of the loan. Other possible concessions were an interest rate that was less than the market rate for loans with comparable risk characteristics, an extension of the maturity date or an extension of the amortization schedule. Loans reported in this category continued to accrue interest so long as the borrower was able to continue repayment in accordance with the restructured terms. TDRs that were placed on non-accrual were reported in the non-accrual category and not included with accruing TDRs.
Loans are generally placed on non-accrual when they become past due 90 days or more unless they are both well-secured and in the process of collection. Prior to 2023, non-accrual loans included certain loans that were also TDRs as set forth in Note 4, “Loans and
54
the Allowance for Credit Losses,” of the Consolidated Financial Statements. Non-accrual loans also include consumer loans that were recently discharged in Chapter 7 bankruptcy but for which the borrower has continued to make payments for less than six consecutive months after the discharge.
OREO consists primarily of property acquired through or in lieu of foreclosure but may also include bank premises held for sale. Repossessed assets primarily consist of automobiles and other types of collateral acquired to satisfy defaulted consumer loans.
Table 17 summarizes non-performing assets.
TABLE 17. NON-PERFORMING ASSETS
|
|
December 31, |
|
|
|||||
(dollars in thousands) |
|
2023 |
|
|
2022 |
|
|
||
TDRs accruing interest: |
|
|
|
|
|
|
|
||
Commercial real estate—land and construction |
|
$ |
— |
|
|
$ |
— |
|
|
Commercial real estate—improved property |
|
|
— |
|
|
|
347 |
|
|
Commercial and industrial |
|
|
— |
|
|
|
166 |
|
|
Residential real estate |
|
|
— |
|
|
|
2,362 |
|
|
Home equity lines of credit |
|
|
— |
|
|
|
330 |
|
|
Consumer |
|
|
— |
|
|
|
25 |
|
|
Total TDRs accruing interest |
|
|
— |
|
|
|
3,230 |
|
|
Non-accrual loans: |
|
|
|
|
|
|
|
||
Commercial real estate—land and construction |
|
|
— |
|
|
|
112 |
|
|
Commercial real estate—improved property |
|
|
9,557 |
|
|
|
16,254 |
|
|
Commercial and industrial |
|
|
1,841 |
|
|
|
2,946 |
|
|
Residential real estate |
|
|
10,582 |
|
|
|
13,695 |
|
|
Home equity lines of credit |
|
|
4,777 |
|
|
|
5,044 |
|
|
Consumer |
|
|
51 |
|
|
|
134 |
|
|
Total non-accrual loans |
|
|
26,808 |
|
|
|
38,185 |
|
|
Total non-performing loans |
|
|
26,808 |
|
|
|
41,415 |
|
|
Real estate owned and repossessed assets |
|
|
1,497 |
|
|
|
1,486 |
|
|
Total non-performing assets |
|
$ |
28,305 |
|
|
$ |
42,901 |
|
|
Total portfolio loans |
|
$ |
11,638,461 |
|
|
$ |
10,702,728 |
|
|
Non-performing loans as a percentage of total portfolio |
|
|
0.23 |
|
% |
|
0.39 |
|
% |
Non-accrual loans as a percentage of total portfolio loans |
|
|
0.23 |
|
|
|
0.36 |
|
|
Non-performing assets as a percentage of total assets |
|
|
0.16 |
|
|
|
0.25 |
|
|
Non-performing assets as a percentage of total portfolio |
|
|
0.24 |
|
|
|
0.40 |
|
|
Non-accrual loans decreased $11.4 million or 29.8% from December 31, 2022 to December 31, 2023. For the year ended December 31, 2022, approximately $1.7 million or 4.5% of total non-accrual loans also had restructured terms that would have required them to be reported as a TDR if they were accruing interest.
OREO and repossessed assets totaled $1.5 million at both December 31, 2022 and December 31, 2023. Wesbanco seeks to minimize the period for which it holds OREO and repossessed assets while also attempting to obtain a fair value from their disposition. Therefore, the sales price of these assets is dependent on current market conditions that affect the value of real estate, used automobiles, and other collateral. Repossessed assets are generally sold at auction within 60 days after repossession. Expenses associated with owning OREO and repossessed assets charged to other expenses were $0.3 million for 2023 compared to $0.8 million for 2022. Net gains on the disposition of OREO and repossessed assets are credited or charged to non-interest income were immaterial for both 2023 and 2022.
Criticized and Classified Loans —Please refer to Note 4, “Loans and the Allowance for Credit Losses,” of the Consolidated Financial Statements for a description of internally-assigned risk grades for commercial loans and a summary of loans by grade. Wesbanco’s criticized loans are currently protected, but have weaknesses, which if not corrected, may be inadequately protected at some future date. Classified loan grades are equivalent to the classifications used by banking regulators to identify those loans that have significant adverse characteristics. A classified loan grade is assigned to all non-accrual commercial loans. Criticized and classified loans totaled $258.7 million or 3.1% of total commercial loans at December 31, 2023, compared to $250.5 million or 3.3% at December 31, 2022.
Charge-offs and Recoveries — Total charge-offs increased $3.3 million or 41.6% to $11.2 million, while total recoveries increased $0.3 million to $6.5 million, resulting in an increase of $3.0 million in net charge-offs for 2023 compared to 2022. The net loan charge-off rates of 0.04% and 0.02% of total average loans at December 31, 2023 and 2022, respectively, is consistent with
55
continued overall low levels of non-performing loans. Table 18 summarizes charge-offs and recoveries as well as net charge-offs as a percentage of average loans for each category of the loan portfolio.
TABLE 18. CHARGE-OFFS AND RECOVERIES
|
|
December 31, |
|
|
|||||||||
(dollars in thousands) |
|
2023 |
|
|
2022 |
|
|
2021 |
|
|
|||
Commercial real estate - land and construction |
|
|
|
|
|
|
|
|
|
|
|||
Net charge-offs / (recoveries) |
|
$ |
(65 |
) |
|
$ |
(52 |
) |
|
$ |
(167 |
) |
|
Average balance outstanding |
|
|
887,977 |
|
|
|
903,411 |
|
|
|
721,673 |
|
|
Net charge-offs (recoveries) as a percentage of average loans |
|
|
(0.01 |
) |
% |
|
(0.01 |
) |
% |
|
(0.02 |
) |
% |
Commercial real estate - improved property |
|
|
|
|
|
|
|
|
|
|
|||
Net charge-offs / (recoveries) |
|
$ |
1,030 |
|
|
$ |
(243 |
) |
|
$ |
466 |
|
|
Average balance outstanding |
|
|
5,403,653 |
|
|
|
4,825,288 |
|
|
|
4,943,980 |
|
|
Net charge-offs (recoveries) as a percentage of average loans |
|
|
0.02 |
|
% |
|
(0.01 |
) |
% |
|
0.01 |
|
% |
Commercial and industrial |
|
|
|
|
|
|
|
|
|
|
|||
Net charge-offs / (recoveries) |
|
$ |
1,064 |
|
|
$ |
71 |
|
|
$ |
226 |
|
|
Average balance outstanding |
|
|
1,569,476 |
|
|
|
1,539,694 |
|
|
|
2,066,116 |
|
|
Net charge-offs (recoveries) as a percentage of average loans |
|
|
0.07 |
|
% |
|
0.00 |
|
% |
|
0.01 |
|
% |
Residential real estate |
|
|
|
|
|
|
|
|
|
|
|||
Net charge-offs / (recoveries) |
|
$ |
(720 |
) |
|
$ |
(90 |
) |
|
$ |
(258 |
) |
|
Average balance outstanding |
|
|
2,317,910 |
|
|
|
1,903,157 |
|
|
|
1,661,138 |
|
|
Net charge-offs (recoveries) as a percentage of average loans |
|
|
(0.03 |
) |
% |
|
(0.00 |
) |
% |
|
(0.02 |
) |
% |
Home equity |
|
|
|
|
|
|
|
|
|
|
|||
Net charge-offs / (recoveries) |
|
$ |
316 |
|
|
$ |
16 |
|
|
$ |
(136 |
) |
|
Average balance outstanding |
|
|
706,365 |
|
|
|
605,892 |
|
|
|
623,796 |
|
|
Net charge-offs (recoveries) as a percentage of average loans |
|
|
0.04 |
|
% |
|
0.00 |
|
% |
|
(0.02 |
) |
% |
Consumer |
|
|
|
|
|
|
|
|
|
|
|||
Net charge-offs / (recoveries) |
|
$ |
1,678 |
|
|
$ |
654 |
|
|
$ |
484 |
|
|
Average balance outstanding |
|
|
230,069 |
|
|
|
291,379 |
|
|
|
286,717 |
|
|
Net charge-offs (recoveries) as a percentage of average loans |
|
|
0.73 |
|
% |
|
0.22 |
|
% |
|
0.17 |
|
% |
Loans held for sale |
|
|
|
|
|
|
|
|
|
|
|||
Net charge-offs / (recoveries) |
|
$ |
— |
|
|
$ |
— |
|
|
$ |
— |
|
|
Average balance outstanding |
|
|
17,168 |
|
|
|
15,104 |
|
|
|
77,186 |
|
|
Net charge-offs (recoveries) as a percentage of average loans |
|
|
— |
|
% |
|
— |
|
% |
|
— |
|
% |
Deposit Account Overdrafts |
|
|
|
|
|
|
|
|
|
|
|||
Net charge-offs / (recoveries) |
|
$ |
1,339 |
|
|
$ |
1,268 |
|
|
$ |
1,113 |
|
|
Total loans |
|
|
|
|
|
|
|
|
|
|
|||
Net charge-offs / (recoveries) |
|
$ |
4,642 |
|
|
$ |
1,624 |
|
|
$ |
1,728 |
|
|
Average balance outstanding |
|
|
11,132,618 |
|
|
|
10,083,925 |
|
|
|
10,380,605 |
|
|
Net charge-offs (recoveries) as a percentage of average loans |
|
|
0.04 |
|
% |
|
0.02 |
|
% |
|
0.02 |
|
% |
ALLOWANCE FOR CREDIT LOSSES
As of December 31, 2023, the total allowance for credit losses – loans and commitments was $139.3 million, of which $130.7 million relates to loans and $8.6 million relates to loan commitments. The allowance for credit losses – loans was 1.12% of total portfolio loans as of December 31, 2023, compared to 1.10% as of December 31, 2022.
The allowance for credit losses - loans individually-evaluated increased $2.6 million from December 31, 2022 to December 31, 2023 due to an individually-evaluated loan analysis completed on certain classified commercial real estate loans. The allowance for credit losses-loans collectively-evaluated increased from December 31, 2022 to December 31, 2023 by $10.3 million.
The allowance for credit losses - loan commitments was $8.6 million at December 31, 2023 as compared to $8.4 million as of December 31, 2022, and is included in other liabilities on the Consolidated Balance Sheets.
The allowance for credit losses by loan category, presented in Note 4, “Loans and the Allowance for Credit Losses” of the Consolidated Financial Statements, summarizes the impact of changes in various factors that affect the allowance for credit losses in each segment of the portfolio. The allowance for credit losses under CECL is calculated utilizing the PD/LGD, which is then discounted to net present value. PD is the probability the asset will default within a given time frame and LGD is the percentage of the asset not expected to be collected due to default. The primary macroeconomic drivers of the quantitative model include forecasts of national unemployment and interest rates, as well as modeling adjustments for changes in prepayment speeds, loan risk grades, portfolio mix,
56
concentrations and loan growth. For the calculation as of December 31, 2023, the forecast was based upon a blend of nationally-recognized published economic forecasts through December 31, 2023, and is primarily driven by national unemployment and interest rate spread forecasts. Wesbanco’s blended forecast of national unemployment, at year end, was projected to be 4.3%, and subsequently increase to an average of 4.6% over the 2024 forecast period. The calculation utilized an immediate reversion period back to the Company’s historical loss rate by loan classification. Included in the qualitative factors were deferred interest on modified loans, office space concentration and rising interest rates. The included qualitative factors address credit risk not covered by the traditional allowance process.
Table 19 summarizes the allowance together with selected relationships of the allowance and provision for credit losses to total loans and certain categories of loans.
TABLE 19. ALLOWANCE FOR CREDIT LOSSES
|
|
December 31, |
|
|||||||||
(dollars in thousands) |
|
2023 |
|
|
2022 |
|
|
2021 |
|
|||
Balance at beginning of year: |
|
|
|
|
|
|
|
|
|
|||
Allowance for credit losses - loans |
|
$ |
117,790 |
|
|
$ |
121,622 |
|
|
$ |
185,827 |
|
Allowance for credit losses - loan commitments |
|
|
8,368 |
|
|
|
7,775 |
|
|
|
9,514 |
|
Total beginning allowance for credit losses - loans and loan commitments |
|
|
126,158 |
|
|
|
129,397 |
|
|
|
195,341 |
|
Provision for credit losses: |
|
|
|
|
|
|
|
|
|
|||
Provision for loan losses |
|
|
17,527 |
|
|
|
(2,208 |
) |
|
|
(62,477 |
) |
Provision for loan commitments |
|
|
236 |
|
|
|
593 |
|
|
|
(1,739 |
) |
Total provision for credit losses - loans and loan commitments |
|
|
17,763 |
|
|
|
(1,615 |
) |
|
|
(64,216 |
) |
Net charge-offs: |
|
|
|
|
|
|
|
|
|
|||
Total charge-offs |
|
|
(11,177 |
) |
|
|
(7,892 |
) |
|
|
(10,136 |
) |
Total recoveries |
|
|
6,535 |
|
|
|
6,268 |
|
|
|
8,408 |
|
Net charge-offs |
|
|
(4,642 |
) |
|
|
(1,624 |
) |
|
|
(1,728 |
) |
Balance at end of year: |
|
|
|
|
|
|
|
|
|
|||
Allowance for credit losses - loans |
|
|
130,675 |
|
|
|
117,790 |
|
|
|
121,622 |
|
Allowance for credit losses - loan commitments |
|
|
8,604 |
|
|
|
8,368 |
|
|
|
7,775 |
|
Total ending allowance for credit losses - loans and loan commitments |
|
$ |
139,279 |
|
|
$ |
126,158 |
|
|
$ |
129,397 |
|
Allowance for credit losses - loans as a percentage of total portfolio loans |
|
|
1.12 |
% |
|
|
1.10 |
% |
|
|
1.25 |
% |
Allowance for credit losses - loans to non-accrual loans |
|
4.87x |
|
|
3.08x |
|
|
3.40x |
|
|||
Allowance for credit losses - loans to total non-performing loans |
|
4.87x |
|
|
2.84x |
|
|
3.08x |
|
|||
Allowance for credit losses - loans to total non-performing loans |
|
3.59x |
|
|
2.51x |
|
|
2.57x |
|
|||
The allowance consists of specific reserves for certain individually-evaluated loans, if any, and a general reserve for all other loans. Commercial loans, including CRE and C&I, that have other unique characteristics are tested individually for potential credit losses. Specific reserves are established when appropriate for such loans based on the net present value of expected future cash flows of the loan or the estimated realizable value of the collateral, if any. The evaluation also considers qualitative factors such as economic trends and conditions, which includes levels of regional unemployment, real estate values and the impact on specific industries and geographical markets, changes in lending policies and underwriting standards, delinquency and other credit quality trends, concentrations of credit risk, if any, the results of internal loan reviews and examinations by bank regulatory agencies pertaining to the allowance for credit losses. The allowance for collectively-evaluated loans is comprised of factors based on both historical loss experience and other qualitative factors. The allowance for collectively-evaluated loans increased $10.3 million or 8.9% from December 31, 2022 to December 31, 2023 due to changes in macroeconomic factors, changes in portfolio mix and changes in both quantitative and qualitative adjustments. The allowance for individually-evaluated loans was $5.7 million at December 31, 2023, an increase of $2.6 million from December 31, 2022. Despite the increase, the balance of commercial real estate loans individually-evaluated decreased from $50.4 million in 2022 to $37.0 million in 2023. The allowance for loan commitments increased $0.2 million from December 31, 2022 to December 31, 2023.
57
Table 20 summarizes the allocation of the allowance for credit losses to each category of loans.
TABLE 20. ALLOCATION OF THE ALLOWANCE FOR CREDIT LOSSES
|
|
December 31, |
|
|||||||||||
|
|
2023 |
|
|
2022 |
|
||||||||
(dollars in thousands) |
|
Allowance |
|
% of Loans or |
|
|
Allowance |
|
% of Loans or |
|
||||
Allowance for credit losses - loans: |
|
|
|
|
|
|
|
|
|
|
||||
Commercial real estate—land and construction |
|
$ |
7,123 |
|
|
9.1 |
|
|
$ |
6,737 |
|
|
8.8 |
|
Commercial real estate—improved property |
|
|
59,351 |
|
|
47.2 |
|
|
|
52,659 |
|
|
47.8 |
|
Commercial and industrial |
|
|
36,644 |
|
|
14.4 |
|
|
|
31,540 |
|
|
14.8 |
|
Residential real estate |
|
|
21,218 |
|
|
21.0 |
|
|
|
18,208 |
|
|
20.0 |
|
Home equity lines of credit |
|
|
1,017 |
|
|
6.3 |
|
|
|
4,234 |
|
|
6.5 |
|
Consumer |
|
|
3,956 |
|
|
2.0 |
|
|
|
3,127 |
|
|
2.1 |
|
Deposit account overdrafts |
|
|
1,366 |
|
|
— |
|
|
|
1,285 |
|
|
— |
|
Total allowance for credit losses - loans |
|
|
130,675 |
|
|
100.0 |
|
|
|
117,790 |
|
|
100.0 |
|
Allowance for credit losses - loan commitments: |
|
|
|
|
|
|
|
|
|
|
||||
Commercial real estate—land and construction |
|
|
6,894 |
|
|
28.6 |
|
|
|
6,025 |
|
|
25.7 |
|
Commercial real estate—improved property |
|
|
— |
|
|
5.1 |
|
|
|
— |
|
|
5.0 |
|
Commercial and industrial |
|
|
429 |
|
|
36.5 |
|
|
|
— |
|
|
31.9 |
|
Residential real estate |
|
|
1,276 |
|
|
4.3 |
|
|
|
2,215 |
|
|
8.5 |
|
Home equity lines of credit |
|
|
5 |
|
|
24.8 |
|
|
|
128 |
|
|
28.0 |
|
Consumer |
|
|
— |
|
|
0.7 |
|
|
|
— |
|
|
0.9 |
|
Total allowance for credit losses - loan commitments |
|
|
8,604 |
|
|
100.0 |
|
|
|
8,368 |
|
|
100.0 |
|
Total allowance for credit losses |
|
$ |
139,279 |
|
|
|
|
$ |
126,158 |
|
|
|
||
Please refer to Note 4, “Loans and the Allowance for Credit Losses,” of the Consolidated Financial Statements for a summary of changes in the allowance for credit losses applicable to each category of loans. Changes in the allowance for all categories of loans also reflect the net effect of changes in historical loss rates, loan balances, specific reserves and management’s judgment with respect to the impact of qualitative factors on each category of loans. A decrease in the allowance for a particular loan category generally reflects either lower loan balances, historical loss rate changes or reductions in non-performing and/or classified commercial loans. Although the allowance for credit losses is allocated as described in Table 20, the total allowance is available to absorb losses in any category of loans. However, differences between management’s estimation of expected future losses and actual incurred losses in subsequent periods may necessitate future adjustments to the provision for credit losses. Management believes the allowance for credit losses is appropriate to absorb expected future losses at December 31, 2023.
58
DEPOSITS
TABLE 21. DEPOSITS
|
|
December 31, |
|
|
|
|
|
|||||||
(dollars in thousands) |
|
2023 |
|
|
2022 |
|
$ Change |
|
% Change |
|
||||
Deposits |
|
|
|
|
|
|
|
|
|
|
||||
Non-interest bearing demand |
|
$ |
3,962,592 |
|
|
$ |
4,700,438 |
|
$ |
(737,846 |
) |
|
(15.7 |
) |
Interest bearing demand |
|
|
3,463,443 |
|
|
|
3,119,807 |
|
|
343,636 |
|
|
11.0 |
|
Money market |
|
|
2,017,713 |
|
|
|
1,684,023 |
|
|
333,690 |
|
|
19.8 |
|
Savings deposits |
|
|
2,493,254 |
|
|
|
2,741,004 |
|
|
(247,750 |
) |
|
(9.0 |
) |
Certificates of deposit |
|
|
1,231,702 |
|
|
|
885,818 |
|
|
345,884 |
|
|
39.0 |
|
Total deposits |
|
$ |
13,168,704 |
|
|
$ |
13,131,090 |
|
$ |
37,614 |
|
|
0.3 |
|
Deposits, which represent Wesbanco’s primary source of funds, are offered in various account forms at various rates through Wesbanco’s 192 financial centers, as of December 31, 2023, in West Virginia, Ohio, western Pennsylvania, Maryland, Kentucky, and southern Indiana. The FDIC insures all deposits up to $250,000 per account.
Total deposits increased by $37.6 million or 0.3% in 2023 primarily reflecting the benefit of deposit gathering and retention efforts by the retail and commercial teams. Money market and interest-bearing demand deposits increased 19.8% and 11.0%, respectively, while non-interest bearing demand deposits and savings deposits decreased 15.7% and 9.0%, respectively. Deposit balances were also somewhat impacted by bonus and royalty payments from Marcellus and Utica shale energy companies in Wesbanco’s southwestern Pennsylvania, eastern Ohio and northern West Virginia markets totaling $104.7 million and $96.7 million for the years ended December 31, 2023 and 2022, respectively. Money market deposits were influenced through Wesbanco’s increased participation in the Insured Cash Sweep (ICS®) money market deposits program. ICS® reciprocal balances totaled $1.0 billion at December 31, 2023 as compared to $580.6 million at December 31, 2022. ICS® one-way buys totaled $200.6 million at December 31, 2023. Wesbanco had no one-way buys at December 31, 2022.
Certificates of deposit increased $345.9 million, reflecting the significant increase in the federal funds rate and the continued remix from non interest-bearing demand deposits into certificates of deposit. The increase was also impacted by higher offered rates on certain maturing certificates of deposit. Wesbanco does not generally solicit brokered or other deposits out-of-market or over the internet, but does participate in the Certificate of Deposit Account Registry Services (“CDARS®”) program. CDARS® balances totaled $48.4 million in outstanding balances at December 31, 2023, of which $10.6 million represented one-way buys, compared to $21.0 million in total outstanding balances at December 31, 2022, none of which represented one-way buys. Certificates of deposit greater than $250,000 were approximately $223.4 million at December 31, 2023 compared to $133.9 million at December 31, 2022. Certificates of deposit of $100,000 or more were approximately $628.5 million at December 31, 2023 compared to $373.5 million at December 31, 2022. Certificates of deposit totaling approximately $915.4 million at December 31, 2023 with a cost of 3.27% are scheduled to mature within the next year. The average rate on certificates of deposit increased 146 basis points from 0.37% for the year ended December 31, 2022 to 1.83% in 2023, with a similar increase experienced for jumbo certificates of deposit. Wesbanco will continue to focus on its core deposit strategies and improving its overall mix of transaction accounts to total deposits, which includes offering special promotions on certain certificates of deposit maturities and savings products based on competition, sales strategies, liquidity needs and wholesale borrowing costs.
TABLE 22. UNINSURED DEPOSITS
|
|
December 31, |
|
|
|
|
|
|
|
|||||||
(dollars in thousands) |
|
2023 |
|
|
2022 |
|
|
$ Change |
|
|
% Change |
|
||||
Portion of certificates of deposit in excess of FDIC insurance limits |
|
$ |
105,947 |
|
|
$ |
133,875 |
|
|
$ |
(27,928 |
) |
|
|
(20.9 |
) |
|
|
|
|
|
|
|
|
|
|
|
|
|
||||
Certificates of deposit otherwise uninsured with a maturity of: |
|
|
|
|
|
|
|
|
|
|
|
|
||||
Three months or less |
|
$ |
32,764 |
|
|
$ |
35,522 |
|
|
$ |
(2,758 |
) |
|
|
(7.8 |
) |
Over three through six months |
|
|
16,946 |
|
|
|
27,251 |
|
|
|
(10,305 |
) |
|
|
(37.8 |
) |
Over six through twelve months |
|
|
18,422 |
|
|
|
38,437 |
|
|
|
(20,015 |
) |
|
|
(52.1 |
) |
Over twelve months |
|
|
37,815 |
|
|
|
32,665 |
|
|
|
5,150 |
|
|
|
15.8 |
|
Total uninsured certificates of deposit |
|
$ |
105,947 |
|
|
$ |
133,875 |
|
|
$ |
(27,928 |
) |
|
|
(20.9 |
) |
|
|
|
|
|
|
|
|
|
|
|
|
|
||||
Total uninsured deposits (1) |
|
$ |
4,040,705 |
|
|
$ |
4,390,789 |
|
|
$ |
(350,084 |
) |
|
|
(8.0 |
) |
(1) Uninsured deposits include public funds deposits that are collateralized by investment securities totaling $1.5 billion and $1.4 billion at December 31, 2023 and 2022, respectively.
59
BORROWINGS
TABLE 23. BORROWINGS
|
|
December 31, |
|
|
|
|
|
|
|
|||||||
(dollars in thousands) |
|
2023 |
|
|
2022 |
|
|
$ Change |
|
|
% Change |
|
||||
Federal Home Loan Bank Borrowings |
|
$ |
1,350,000 |
|
|
$ |
705,000 |
|
|
$ |
645,000 |
|
|
|
91.5 |
|
Other short-term borrowings |
|
|
105,893 |
|
|
|
135,069 |
|
|
|
(29,176 |
) |
|
|
(21.6 |
) |
Subordinated debt and junior subordinated debt |
|
|
279,078 |
|
|
|
281,404 |
|
|
|
(2,326 |
) |
|
|
(0.8 |
) |
Total |
|
$ |
1,734,971 |
|
|
$ |
1,121,473 |
|
|
$ |
613,498 |
|
|
|
54.7 |
|
Borrowings are a significant source of funding for Wesbanco in addition to deposits. During 2023, FHLB borrowings increased $645.0 million from December 31, 2022, as $1.6 billion in new advances were partially offset by $1.0 billion in maturities. The average cost in 2023 of maturing and paid-off FHLB borrowings was 5.28%, compared to the average cost of 5.36% for new borrowings in 2023.
Wesbanco is a member of the FHLB system. The FHLB system functions as a borrowing source for regulated financial institutions that are engaged in residential and commercial real estate lending along with securities investing. Wesbanco uses term FHLB borrowings as a general funding source and to more appropriately match interest maturities for certain assets. FHLB borrowings are secured by blanket liens on certain residential and other mortgage loans with a market value in excess of the outstanding borrowing balances. The terms of the security agreement with the FHLB include a specific assignment of collateral that requires the maintenance of qualifying mortgage and other types of loans as pledged collateral with unpaid principal amounts in excess of the FHLB advances, when discounted at certain pre-established percentages of the loans’ unpaid balances. FHLB stock, which is recorded at cost of $62.2 million at December 31, 2023, is also pledged as collateral for these advances. Wesbanco’s remaining maximum borrowing capacity, subject to the collateral requirements noted, with the FHLB at December 31, 2023 and 2022 was estimated to be approximately $3.4 billion and $3.6 billion, respectively. Wesbanco can also use a portion of its maximum borrowing capacity to acquire FHLB letters of credit, which in some jurisdictions can be used to collateralize Wesbanco's public fund deposits.
Other short-term borrowings, which may consist of federal funds purchased, callable repurchase agreements or overnight sweep checking accounts decreased $29.2 million to $105.9 million at December 31, 2023, compared to $135.1 million at December 31, 2022 due to moving certain customer relationships to interest-bearing demand deposits. At December 31, 2022 and 2021, there were no outstanding federal funds purchased.
In March of 2022, Wesbanco completed the issuance of $150.0 million in aggregate principal amount of subordinated debentures. The subordinated debentures have a fixed rate of 3.75% for the first five years and a floating rate for the next five years at Three Month SOFR plus a spread of 1.787%. In 2023, Wesbanco completed a partial repurchase and cancellation of $3.1 million of Oak Hill Capital Trust 4, at a discount of $0.7 million.
CAPITAL RESOURCES
Shareholders’ equity increased to $2.5 billion at December 31, 2023 from $2.4 billion at December 31, 2022. The increase was primarily the result of net income totaling $159.0 million for the year ended December 31, 2023 and a $35.7 million increase in other comprehensive income. This gain consisted of a $28.7 million unrealized gain in the securities portfolio and a $7.0 million gain in the defined benefits pension plan and other postretirement benefits for the year ended December 31, 2023. Shareholders' equity was negatively impacted by the repurchase of common shares net of restricted stock vesting activity totaling $3.7 million and the declaration of common and preferred shareholder dividends totaling $82.9 million and $10.1 million, respectively for the year ended December 31, 2023.
For 2023, common dividends increased to $1.41 per share, or 2.9% on an annualized basis, compared to $1.37 per share in 2022. The common dividend per share payout ratio increased to 56.2% in 2023 from 45.4% in 2022, which is primarily attributable to a decrease in earnings year-over-year. A board-approved policy generally targets dividends as a percent of net income in a range of 40% to 75%, subject to capital levels, earnings history and prospects, regulatory concerns, and other factors.
Wesbanco purchased 162,700 shares of its common stock on the open market at a total cost of $3.7 million or $23.04 per share during the year under current share repurchase authorizations. On February 24, 2022, Wesbanco's Board of Directors authorized the adoption of a new stock repurchase plan for the purchase of up to 3.2 million shares, which was in addition to the prior plans that were utilized during the year. At December 31, 2023, the remaining shares authorized to be purchased under the last approved repurchase plan totaled 1,021,901 shares.
Wesbanco is subject to risk-based capital guidelines that measure capital relative to risk-weighted assets and off-balance sheet instruments. Wesbanco and its banking subsidiary Wesbanco Bank maintain Tier 1 risk-based, Total risk-based and Tier 1 leverage capital ratios significantly above minimum regulatory levels. The Bank paid $77.0 million in dividends to Wesbanco during 2023, or 44% of the Bank’s net income. There are various legal limitations under federal and state laws that limit the payment of dividends from the Bank to the parent company. As of December 31, 2023, under FDIC and State of West Virginia regulations, Wesbanco could receive,
60
without prior regulatory approval, dividends of approximately $135.5 million from the Bank. The Bank’s policy is generally to declare dividends up to 90% of its earnings to the parent annually, subject to change, with Board approval.
Wesbanco currently has $279.1 million in subordinated debt and junior subordinated debt on its Consolidated Balance Sheet. For regulatory purposes, the junior subordinated debt and trust preferred securities totaling $126.9 million, issued by unconsolidated trust subsidiaries of Wesbanco underlying such junior subordinated debt, are accounted for as Tier 2 capital in accordance with current regulatory reporting requirements. In March of 2022, Wesbanco completed the issuance of $150.0 million in aggregate principal amount of subordinated debentures. These notes are considered Tier 2 regulatory capital for Wesbanco.
Please refer to Note 21, “Regulatory Matters,” of the Consolidated Financial Statements for more information on capital amounts, ratios and minimum regulatory requirements. Also refer to “Item 1. Business” within this Annual Report on Form 10-K for more information on the Dodd-Frank Wall Street Reform and Consumer Protection Act and Basel III Capital Standards.
LIQUIDITY RISK
Liquidity is defined as a financial institution’s capacity to meet its cash and collateral obligations at a reasonable cost. Liquidity risk is the risk that an institution’s financial condition or overall safety and soundness is adversely affected by an inability, or perceived inability, to meet its obligations. An institution’s obligations, and the funding sources to meet them, depend significantly on its business mix, balance sheet structure, and the cash flows of its on- and off-balance sheet obligations. Institutions confront various internal and external situations that can give rise to increased liquidity risk including funding mismatches, market constraints on funding sources, contingent liquidity events, changes in economic conditions, and exposure to credit, market, operation, legal and reputation risk. Wesbanco actively manages liquidity risk through its ability to provide adequate funds to meet changes in loan demand, unexpected outflows in deposits and other borrowings as well as to take advantage of market opportunities and meet operating cash needs. This is accomplished by maintaining liquid assets in the form of securities, sufficient borrowing capacity and a stable core deposit base. Liquidity is centrally monitored by Wesbanco’s ALCO with direct oversight from the Board of Directors ("BOD").
Wesbanco determines the degree of required liquidity by the relationship of total holdings of liquid assets to potential funding needs to meet unexpected deposit losses and/or loan demands. The ability to quickly convert assets to cash at a minimal loss is a primary function of managing Wesbanco’s investment portfolio. Wesbanco believes its cash flow from the loan portfolio, the investment portfolio, and other sources adequately meet its liquidity requirements. Wesbanco’s net loans-to-assets ratio was 65.0% and deposit balances funded 74.3% of total assets at December 31, 2023.
The following table lists the sources of liquidity from assets at December 31, 2023 expected within the next year:
(in thousands) |
|
|
|
|
Cash and cash equivalents |
|
$ |
595,353 |
|
Securities with a maturity date within the next year and callable securities |
|
|
284,449 |
|
Projected payments and prepayments on mortgage-backed securities and collateralized |
|
|
264,337 |
|
Loans held for sale |
|
|
16,354 |
|
Accruing loans scheduled to mature |
|
|
1,280,058 |
|
Normal loan repayments |
|
|
1,432,334 |
|
Total sources of liquidity expected within the next year |
|
$ |
3,872,885 |
|
(1) Projected prepayments are based on current prepayment speeds.
Deposit cash flows are another principal factor affecting overall Wesbanco liquidity. Deposits totaled $13.2 billion at December 31, 2023. Deposit cash flows are impacted by current interest rates, products and rates offered by Wesbanco versus various forms of competition, as well as customer behavior. Certificates of deposit scheduled to mature within one year totaled $915.4 million at December 31, 2023, with a weighted average cost of 3.27%, which includes jumbo regular certificates of deposit totaling $439.1 million with a weighted-average cost of 3.80%, and jumbo CDARS® certificates of deposit of $41.3 million with a weighted-average cost of 3.63%, which included $10.6 million of brokered one-way buys.
Uninsured deposits, as reported for regulatory purposes, totaled $4.0 billion at December 31 2023, or 31% of total deposits. Uninsured deposits include $1.5 billion of public funds deposits that are over the FDIC-insured limit. Wesbanco secures these public funds deposits by pledging investment securities with a market value at or above the deposit balance. Excluding these public funds, at December 31, 2023, uninsured deposits were $2.6 billion, or 20% of total deposits.
Wesbanco maintains a line of credit with the FHLB as an additional funding source. Available credit with the FHLB approximated $3.4 billion and $3.6 billion at December 31, 2023 and December 31, 2022, respectively. The FHLB requires securities to be specifically pledged to the FHLB and maintained in a FHLB-approved custodial arrangement if the member wishes to include such securities in the maximum borrowing capacity calculation. Wesbanco has elected not to specifically pledge to the FHLB unpledged securities. At December 31, 2023, the Bank had unpledged available-for-sale securities with an estimated fair value of $296.0 million, or 13.8% of the total available-for-sale portfolio. A portion of these securities could be sold for additional liquidity, or such securities could be pledged to secure additional FHLB borrowings. A significant portion of the portfolio is pledged to public deposit customers, as public
61
deposit balances have increased significantly through the several acquisitions made since 2015. As a result of this growth, Wesbanco is monitoring exposure to public funds deposits in relation to pledging requirements and providing insured cash sweep ("ICS") deposits via Intrafi® as a solution for a portion of new and existing public fund depositors. In addition, at December 31, 2023, the Bank had unpledged held-to-maturity securities with an estimated fair value of $798.7 million. Most of these securities are tax-exempt municipal securities, which can only be pledged in limited circumstances. Generally, these securities cannot be sold without tainting the remainder of the held-to-maturity portfolio. If tainting occurs, all remaining securities with the held-to-maturity designation would be required to be reclassified as available-for-sale, and the held-to-maturity designation would not be available to Wesbanco for a period of time.
Wesbanco participates in the Federal Reserve Bank’s Borrower-in-Custody Program (“BIC”) whereby Wesbanco pledges certain consumer loans as collateral for borrowings. Wesbanco did not have any BIC borrowings outstanding at December 31, 2023. Alternative funding sources may include the utilization of existing overnight lines of credit with third party banks totaling $235.0 million, none of which was outstanding at December 31, 2023, along with seeking other lines of credit, borrowings under repurchase agreement lines, increasing deposit rates to attract additional funds, accessing brokered deposits, or selling securities available-for-sale or certain types of loans. In addition, in March 2023, the Federal Reserve announced that it would make available additional funding to eligible depository institutions through the creation of a new Bank Term Funding Program ("BTFP"). The BTFP would offer loans of up to one year in length to eligible depository institutions that pledge U.S. Treasuries, agency debt and mortgage-backed securities, or other qualifying assets as collateral. As of December 31, 2023, Wesbanco has not utilized the BTFP for funding, but does have $291.9 million in par value of qualifying investment securities that could be used to access funds from the program.
Other short-term borrowings of $105.9 million at December 31, 2023 consisted of repurchase agreements or overnight sweep checking accounts for large commercial customers. Other short-term borrowings may also include federal funds purchased using the Federal Reserve's discount window or Lines of Credit with third party banks noted above. The overnight sweep checking accounts require U.S. Government securities to be pledged equal to or greater than the average deposit balance in the related customer accounts.
The principal sources of parent company liquidity are dividends from the Bank and $250.2 million in cash on hand. There are various legal limitations under federal and state laws that limit the payment of dividends from the Bank to the parent company. As of December 31, 2023, under FDIC and State of West Virginia regulations, Wesbanco could receive, without prior regulatory approval, dividends of approximately $135.6 million from the Bank. Management believes these are appropriate levels of cash for the parent company given the current environment. Management continuously monitors the adequacy of parent company cash levels and sources of liquidity through the use of metrics that relate current cash levels to historical and forecasted cash inflows and outflows.
Wesbanco had outstanding commitments to extend credit in the ordinary course of business approximating $4.7 billion and $4.6 billion at December 31, 2023 and December 31, 2022, respectively. On a historical basis, only a portion of these commitments will result in an outflow of funds. Please refer to Note 10, “Commitments and Contingent Liabilities” of the Consolidated Financial Statements and the “Loans and Credit Risk” section of this MD&A for additional information.
Federal financial regulatory agencies have previously issued guidance to provide for sound practices for managing funding and liquidity risk and strengthening liquidity risk management practices. Wesbanco maintains a comprehensive management process for identifying, measuring, monitoring, and controlling liquidity risk, which is fully integrated into its risk management process. Management believes Wesbanco has sufficient current liquidity to meet current obligations to borrowers, depositors and others and that Wesbanco’s current liquidity risk management policies and procedures, as periodically reviewed and adjusted, adequately address this guidance.
LIBOR TRANSITION
LIBOR is a widely used short-term reference interest rate benchmark for variable rate loans and securities, borrowings, and interest rate hedge/swap transactions. In July 2017, the U.K. Financial Conduct Authority (“FCA”) announced the discontinuation of LIBOR after certain banks provided purported interest rate figures which did not truly reflect the rate at which they could borrow. In addition to FCA, as early as 2014, financial institution regulators and the Federal Financial Institutions Examination Council (“FFIEC”) began to work to develop a uniform approach to the phase-out of LIBOR because the continued reliance on LIBOR could present systematic risk to financial institutions. The Board of Governors of the Federal Reserve System and the Federal Reserve Bank of New York convened the Alternative Reference Rates Committee (“AARC”) to identify alternative reference rates to LIBOR. The AARC released consultations on contractual fallback language to prepare for the transition away for LIBOR and on June 22, 2017, identified SOFR as the recommended alternative to LIBOR.
On July 1, 2020, the FFIEC issued a Joint Statement on Managing the LIBOR Transition to further explain that new financial contracts should either utilize a reference rate other than LIBOR or have robust fallback language that defines an alternative reference rate after LIBOR’s discontinuation. The FFIEC statement encouraged supervised financial institutions to continue their efforts to prepare for the change and address the risks associated with the LIBOR transition.
On November 6, 2020, the Board of Governors of the Federal Reserve System, the Office of the Comptroller of the Currency, and the Federal Deposit Insurance Corporation (collectively, the “Agencies”) issued a statement providing that a financial institution may use any reference rate for its loans that the financial institution determines to be appropriate for its funding model and customer needs.
62
Thereafter, on November 30, 2020, the Agencies issued an additional joint statement encouraging financial institutions to continue to transition away from LIBOR as soon as practicable, but no later than December 31, 2021. Given the risks associated with the use of LIBOR, the Agencies stated that entering into new contracts that use LIBOR as a reference rate after December 31, 2021, would create safety and soundness risks.
On March 5, 2021, the U.K. FCA and Intercontinental Exchange (“ICE”) Benchmark Administration announced that the publication of the overnight, as well as, the one, three, six, and twelve month LIBOR rates will continue through June 30, 2023, which will provide additional time to wind down or renegotiate existing contracts that reference LIBOR.
On October 20, 2021, the Agencies with the Consumer Financial Protection Bureau, National Credit Union Administration, and State Bank and Credit Union Regulators, issued an additional Joint Statement on Managing the LIBOR Transition to once again emphasize the expectation that supervised institutions with LIBOR exposure continue to progress toward an orderly transition away from LIBOR. The statement confirmed that entering into new contracts, including derivatives that use LIBOR as a reference rate after December 31, 2021, would create safety and soundness risks, including litigation, operational, and consumer protection risks.
On March 15, 2022, President Biden signed the Adjustable Interest Rate (LIBOR) Act into law (the “LIBOR Act”). The LIBOR Act provides a clear and uniform federal solution for transitioning legacy contracts that either lack or contain insufficient contractual provisions addressing the permanent cessation of LIBOR by providing for the transition from LIBOR to a replacement rate and avoiding related litigation.
On December 16, 2022, the Federal Reserve Board adopted a final rule that implements the Adjustable Interest Rate (LIBOR) Act by identifying benchmark rates based on SOFR that will replace LIBOR in certain financial contracts after June 30, 2023. The final rule is substantially similar to the proposal with certain clarifying changes made in response to comments.
As early as 2018, in anticipation of the potential discontinuance of LIBOR, Wesbanco established a LIBOR transition committee to effectively manage the Company’s transition away from LIBOR in two phases. The first phase included adding additional fallback language to loan documents to allow Wesbanco to replace LIBOR with an equivalent rate index plus the margin to ensure the resulting interest rate is the same as it previously was using LIBOR. Also, as part of the first phase, Wesbanco began quoting to the Treasury Rate published by the Federal Reserve Board instead of the ICE LIBOR Swap Index (which is tied to LIBOR) when repricing certain term loans and originating new loans. The second phase consisted of working to continue to transition existing adjustable-rate loans that fluctuate monthly or periodically that are tied to LIBOR or the ICE LIBOR Swap Index. Wesbanco tracked the dollar amount and number of loans tied to LIBOR or the ICE LIBOR Swap Index, monitored current industry trends, and worked with legal counsel to ensure the smooth transition away from LIBOR. Wesbanco has not offered LIBOR for new contracts after December 31, 2021. With respect to its back-to-back swap program, Wesbanco worked with its swap counterparty customers to institute and accept the International Swaps and Derivatives Association 2020 Interbank Offered Rate Fallbacks Protocol to address LIBOR cessation in swap transactions. Moreover, Wesbanco chose 1M Term SOFR as its replacement index for new loans in the bank’s back-to-back swap program, beginning on January 1, 2022. The final step ahead of the discontinuance of LIBOR on June 30, 2023 was to transition all remaining LIBOR based loans to their appropriate replacement indexes. Ahead of the discontinuance of LIBOR, Wesbanco provided notice to its impacted customers that, for any loan rate reset occurring after the discontinuance of LIBOR, the loan rate would be determined based on a new index consistent with the LIBOR Act and recommendations from the ARRC. Following that customer communication, all necessary changes were made within the applicable loan systems. With the final step now complete, Wesbanco has concluded its transition away from LIBOR.
63
ITEM 7A. QUANTITATIVE AND QUALITATIVE DISCLOSURES ABOUT MARKET RISK
The disclosures set forth in this item are qualified by the section captioned “Forward-Looking Statements” included in Item 7. Management’s Discussion and Analysis of Financial Condition and Results of Operations of this report.
MARKET RISK
The primary objective of Wesbanco’s ALCO with direct oversight from the BOD is to maximize net interest income within established policy parameters. This objective is accomplished through the management of balance sheet composition and duration, market risk exposures arising from changing economic conditions as well as liquidity risk.
Market risk is defined as the risk of loss due to adverse changes in the fair value of financial instruments resulting from fluctuations in interest rates and bond prices. Management considers interest rate risk to be Wesbanco’s most significant market risk. Interest rate risk is the exposure to adverse changes in net interest income due to changes in interest rates. The consistency of Wesbanco’s net interest income is largely dependent on effective management of Wesbanco's interest rate risk profile. As interest rates change in the market, rates earned on interest rate-sensitive assets and rates paid on interest rate-sensitive liabilities do not necessarily move concurrently. Differing rate sensitivities may arise because fixed rate assets and liabilities may not have the same maturities, because variable rate assets and liabilities differ in the timing and/or the magnitude of rate changes, or due to the shape of the yield curve shifting over time.
Wesbanco’s ALCO is an executive management committee with Board representation, responsible for monitoring and managing interest rate risk within approved policy limits, utilizing earnings sensitivity simulation and economic value-at-risk models. These models are highly dependent on various assumptions, which change regularly as the balance sheet composition and market interest rates change. The key assumptions and strategies employed are analyzed, reviewed and documented at least quarterly by the ALCO as well as provided to the Board.
The earnings sensitivity simulation model projects changes in net interest income resulting from the effects of changes in interest rates. Forecasting changes in net interest income requires management to make certain assumptions regarding loan and security prepayment rates, call dates, changes to deposit product betas and non-maturity deposit decay rates, which may not necessarily reflect the manner in which actual cash flows, yields, and costs respond to changes in market interest rates. Assumptions are based on internally-developed models derived from institution specific data, current market rates and economic forecasts, and are internally back-tested and periodically reviewed by an independent third-party consultant. The net interest income sensitivity results presented in Table 1, “Net Interest Income Sensitivity,” assumes that the balance sheet composition of interest sensitive assets and liabilities existing at the end of the period remains constant over the period being measured (otherwise known as a "static" balance sheet) and also assumes that a particular change in interest rates is reflected immediately and parallel across all tenors of the yield curve, regardless of the duration of the maturity or re-pricing of specific assets and liabilities. Since the assumptions used in the model relative to changes in interest rates are uncertain, the simulation analysis may not be indicative of actual results, particularly in times of stress. In addition, this analysis does not consider actions that management might employ in the future in response to changes in interest rates, as well as changes in earning asset and costing liability balances.
Interest rate risk policy limits are determined by measuring the anticipated change in net interest income over a twelve-month period, assuming immediate and sustained market interest rate increases and decreases of 100 - 400 basis points across the entire yield curve, as compared to a flat rate environment or base model. Wesbanco’s current policy limits this exposure for the noted interest rate changes to a reduction of between 7.5% - 20%, or less, of net interest income from the stable rate base model over a twelve-month period. The table below indicates Wesbanco’s interest rate sensitivity at December 31, 2023 and December 31, 2022, assuming the above-noted interest rate changes, as compared to a base model.
TABLE 1. NET INTEREST INCOME SENSITIVITY
Immediate Change in Interest |
|
Percentage Change in |
|
ALCO |
||
Rates (basis points) |
|
December 31, 2023 |
|
December 31, 2022 |
|
Guidelines |
+200 |
|
3.3% |
|
5.6% |
|
(10.0%) |
+100 |
|
3.0% |
|
2.8% |
|
(7.5%) |
-100 |
|
(3.0%) |
|
(4.4%) |
|
(7.5%) |
-200 |
|
(7.0%) |
|
(9.8%) |
|
(10.0%) |
-300 |
|
(11.5%) |
|
(15.6%) |
|
(15.0%) |
-400 |
|
(16.3%) |
|
N/A |
|
(20.0%) |
64
Net interest income sensitivity changes are due to the impact of the current rate and yield curve environment on base case net interest income and the related calculation of immediate parallel rate shock changes in rising and falling rate scenarios. Additional differences typically result from changes in the various earning assets and costing liabilities mix and growth rates, as well as periodic updates of various modeling assumptions. Generally, interest bearing non-maturity deposit betas utilized in modeling have increased to 40% in up shocks and 30% in down shocks as the banking industry continues to remain in a high interest rate environment where funding cost pressures have persisted over the past year. Deposit betas, decay rates and loan prepayment speeds are adjusted periodically, but no less than annually in our models for non-maturity deposits and loans. Indicated model asset sensitivity in rising rate scenarios may be less than anticipated due to slower prepayment speeds, rate floors, below forecast loan yields, spread compression between new asset yields and funding costs, customer requests for negotiated rates, mortgage-related extension risk and other factors. In a decreasing rate environment, asset sensitivity may have greater impact on the margin than currently modeled as prepayment speeds increase, customers refinance or request rate reductions on existing loans, estimated deposit betas do not perform as modeled, or for other reasons not listed.
In addition to the aforementioned parallel rate shock earnings sensitivity simulation model, the ALCO also reviews a “dynamic” forecast scenario to project Wesbanco's "most likely" net interest income over a rolling two-year time period. This forecast is updated at least quarterly, incorporating revisions and updated assumptions into the model for estimated loan and deposit growth, expected balance sheet re-mixing strategies, changes in forecasted interest rates for various indices and yield curves, competitive market spreads for various products and other assumptions not listed. Such modeling is directionally consistent with typical parallel rate shock scenarios, and it assists in predicting changes in forecasted outcomes and potential adjustments to management plans to assist in achieving earnings goals.
Wesbanco also periodically measures the economic value of equity (“EVE”), which is defined as the market value of tangible equity in various rate scenarios. Generally, changes in the economic value of equity relate to changes in various assets and liabilities, changes in the yield curve, as well as changes in loan prepayment speeds and deposit decay rates. The following table presents these results and Wesbanco’s policy limits as of December 31, 2023 and December 31, 2022. Changes in EVE sensitivity since year-end 2022 relate to the change in market interest rates and their impact upon the fair values of earning assets and costing liabilities:
Immediate Change in Interest |
|
Percentage Change in |
|
ALCO |
||
Rates (basis points) |
|
December 31, 2023 |
|
December 31, 2022 |
|
Guidelines |
+200 |
|
0.3% |
|
(4.3%) |
|
(20.0%) |
+100 |
|
2.6% |
|
(1.8%) |
|
(10.0%) |
-100 |
|
(2.8%) |
|
(0.8%) |
|
(10.0%) |
-200 |
|
(8.0%) |
|
(7.9%) |
|
(20.0%) |
-300 |
|
(16.5%) |
|
(17.5%) |
|
(30.0%) |
-400 |
|
(28.0%) |
|
N/A |
|
(40.0%) |
The Bank has significant additional borrowing capacity with the FHLB of Pittsburgh, the Federal Reserve Bank of Cleveland and various correspondent banks, and may utilize these funding sources or interest rate swap strategies as necessary to lengthen liabilities, offset mismatches in various asset maturities and manage liquidity. CDARS® and ICS® deposits also may be utilized for similar purposes for certain customers seeking higher-yielding instruments or maintaining deposit levels below FDIC insurance limits. Significant balance sheet strategies to assist in managing the net interest margin in the current interest rate environment include:
65
ITEM 8. FINANCIAL STATEMENTS AND SUPPLEMENTARY DATA
|
Page |
Management's Report on Internal Control Over Financial Reporting |
67 |
Reports of Independent Registered Public Accounting Firm (PCAOB ID: |
68 |
71 |
|
72 |
|
73 |
|
74 |
|
75 |
|
76 |
|
86 |
|
87 |
|
91 |
|
104 |
|
105 |
|
106 |
|
106 |
|
107 |
|
108 |
|
109 |
|
111 |
|
119 |
|
119 |
|
120 |
|
122 |
|
127 |
|
128 |
|
128 |
|
130 |
|
130 |
|
132 |
|
134 |
66
MANAGEMENT’S REPORT ON INTERNAL CONTROL OVER FINANCIAL REPORTING
The management of Wesbanco is responsible for establishing and maintaining adequate internal control over financial reporting. Wesbanco’s internal control over financial reporting is a process designed under the supervision of Wesbanco’s chief executive officer and chief financial officer to provide reasonable assurance regarding the reliability of financial reporting and the preparation of Wesbanco’s financial statements for external reporting purposes in accordance with U.S. generally accepted accounting principles.
Wesbanco’s management assessed the effectiveness of Wesbanco’s internal control over financial reporting as of December 31, 2023 based on criteria established in Internal Control—Integrated Framework issued by the Committee of Sponsoring Organizations of the Treadway Commission (2013 framework) (the COSO criteria). Based on the assessment, management determined that, as of December 31, 2023, Wesbanco’s internal control over financial reporting is effective, based on the COSO criteria. The effectiveness of Wesbanco’s internal control over financial reporting as of December 31, 2023 has been audited by Ernst & Young LLP, Wesbanco’s independent registered public accounting firm, as stated in their accompanying report appearing below.
|
|
|
/s/ Jeffrey H. Jackson |
|
/s/ Daniel K. Weiss, Jr. |
Jeffrey H. Jackson |
|
Daniel K. Weiss, Jr. |
President and Chief Executive Officer |
|
Executive Vice President and Chief Financial Officer |
67
Report of Independent Registered Public Accounting Firm
To the Shareholders and the Board of Directors of Wesbanco, Inc.
Opinion on Internal Control Over Financial Reporting
We have audited Wesbanco, Inc.’s internal control over financial reporting as of December 31, 2023, based on criteria established in Internal Control—Integrated Framework issued by the Committee of Sponsoring Organizations of the Treadway Commission (2013 framework) (the COSO criteria). In our opinion, Wesbanco, Inc. (the Company) maintained, in all material respects, effective internal control over financial reporting as of December 31, 2023, based on the COSO criteria.
We also have audited, in accordance with the standards of the Public Company Accounting Oversight Board (United States) (PCAOB), the consolidated balance sheets of the Company as of December 31, 2023 and 2022, the related consolidated statements of income, comprehensive income (loss), changes in shareholders’ equity, and cash flows for each of the three years in the period ended December 31, 2023, and the related notes and our report dated February 26, 2024 expressed an unqualified opinion thereon.
Basis for Opinion
The Company’s management is responsible for maintaining effective internal control over financial reporting and for its assessment of the effectiveness of internal control over financial reporting included in the accompanying Management’s Report on Internal Control Over Financial Reporting. Our responsibility is to express an opinion on the Company’s internal control over financial reporting based on our audit. We are a public accounting firm registered with the PCAOB and are required to be independent with respect to the Company in accordance with the U.S. federal securities laws and the applicable rules and regulations of the Securities and Exchange Commission and the PCAOB.
We conducted our audit in accordance with the standards of the PCAOB. Those standards require that we plan and perform the audit to obtain reasonable assurance about whether effective internal control over financial reporting was maintained in all material respects.
Our audit included obtaining an understanding of internal control over financial reporting, assessing the risk that a material weakness exists, testing and evaluating the design and operating effectiveness of internal control based on the assessed risk, and performing such other procedures as we considered necessary in the circumstances. We believe that our audit provides a reasonable basis for our opinion.
Definition and Limitations of Internal Control Over Financial Reporting
A company’s internal control over financial reporting is a process designed to provide reasonable assurance regarding the reliability of financial reporting and the preparation of financial statements for external purposes in accordance with generally accepted accounting principles. A company’s internal control over financial reporting includes those policies and procedures that (1) pertain to the maintenance of records that, in reasonable detail, accurately and fairly reflect the transactions and dispositions of the assets of the company; (2) provide reasonable assurance that transactions are recorded as necessary to permit preparation of financial statements in accordance with generally accepted accounting principles, and that receipts and expenditures of the company are being made only in accordance with authorizations of management and directors of the company; and (3) provide reasonable assurance regarding prevention or timely detection of unauthorized acquisition, use, or disposition of the company’s assets that could have a material effect on the financial statements.
Because of its inherent limitations, internal control over financial reporting may not prevent or detect misstatements. Also, projections of any evaluation of effectiveness to future periods are subject to the risk that controls may become inadequate because of changes in conditions, or that the degree of compliance with the policies or procedures may deteriorate.
/s/ Ernst & Young LLP
Pittsburgh, Pennsylvania
February 26, 2024
68
Report of Independent Registered Public Accounting Firm
To the Shareholders and the Board of Directors of Wesbanco, Inc.
Opinion on the Financial Statements
We have audited the accompanying consolidated balance sheets of Wesbanco, Inc. (the Company) as of December 31, 2023 and 2022, the related consolidated statements of income, comprehensive income (loss), changes in shareholders’ equity and cash flows for each of the three years in the period ended December 31, 2023, and the related notes (collectively referred to as the “consolidated financial statements”). In our opinion, the consolidated financial statements present fairly, in all material respects, the financial position of the Company at December 31, 2023 and 2022, and the results of its operations and its cash flows for each of the three years in the period ended December 31, 2023, in conformity with U.S. generally accepted accounting principles.
We also have audited, in accordance with the standards of the Public Company Accounting Oversight Board (United States) (PCAOB), the Company’s internal control over financial reporting as of December 31, 2023, based on criteria established in Internal Control—Integrated Framework issued by the Committee of Sponsoring Organizations of the Treadway Commission (2013 framework), and our report dated February 26, 2024 expressed an unqualified opinion thereon.
Basis for Opinion
These financial statements are the responsibility of the Company’s management. Our responsibility is to express an opinion on the Company’s financial statements based on our audits. We are a public accounting firm registered with the PCAOB and are required to be independent with respect to the Company in accordance with the U.S. federal securities laws and the applicable rules and regulations of the Securities and Exchange Commission and the PCAOB.
We conducted our audits in accordance with the standards of the PCAOB. Those standards require that we plan and perform the audit to obtain reasonable assurance about whether the financial statements are free of material misstatement, whether due to error or fraud. Our audits included performing procedures to assess the risks of material misstatement of the financial statements, whether due to error or fraud, and performing procedures that respond to those risks. Such procedures included examining, on a test basis, evidence regarding the amounts and disclosures in the financial statements. Our audits also included evaluating the accounting principles used and significant estimates made by management, as well as evaluating the overall presentation of the financial statements. We believe that our audits provide a reasonable basis for our opinion.
Critical Audit Matter
The critical audit matter communicated below is a matter arising from the current period audit of the financial statements that was communicated or required to be communicated to the audit committee and that: (1) relates to accounts or disclosures that are material to the financial statements and (2) involved our especially challenging, subjective or complex judgments. The communication of the critical audit matter does not alter in any way our opinion on the consolidated financial statements, taken as a whole, and we are not, by communicating the critical audit matter below, providing a separate opinion on the critical audit matter or on the account or disclosure to which it relates.
|
|
Allowance for credit losses - loans |
Description of the Matter |
|
The Company’s loan portfolio totaled $11.6 billion as of December 31, 2023 and the associated allowance for credit losses - loans (ACL) was $130.7 million. As discussed in Note 1 and 4 to the consolidated financial statements, the ACL reflects the lifetime expected credit losses on the Company’s loan portfolio. The ACL is calculated utilizing the probability of default / loss given default approach to calculate the expected loss for each segment, which is then discounted to net present value. The primary macroeconomic drivers of the quantitative model includes the forecast of national unemployment and interest rate spreads. The evaluation also considers qualitative factor adjustments such as economic trends and conditions.
Auditing management’s ACL estimate was complex due to the subjectivity in evaluating the national unemployment (macroeconomic forecast) used by the Company in their quantitative ACL model. Management utilizes information obtained from various third parties to inform their view of the macroeconomic forecast. Other internal and external indicators of economic forecasts are also considered by management when establishing the forecast for the ACL. We identified auditing the reasonableness of management’s macroeconomic forecast in the ACL for loans as a critical audit matter as it involves especially subjective auditor judgment. |
|
|
|
69
How We Addressed the Matter in Our Audit |
|
We obtained an understanding, evaluated the design, and tested the operating effectiveness of the Company’s controls over the ACL process, including controls over the appropriateness of the ACL methodology, the expected loss model, the reliability and accuracy of data used in developing the ACL estimate, and management’s review and approval process over their determination of the macroeconomic forecast.
We tested management’s expected loss model including evaluating the conceptual soundness of model methodology, assessing model performance and governance, testing key model assumptions, including the reasonable and supportable forecast, and independently recalculating model output with the assistance of EY specialists.
To test management’s determination of the macroeconomic forecast, we evaluated the reasonableness of the Company’s macroeconomic assumptions and judgments in estimating future credit losses, including the selection of the forecasted macroeconomic assumptions and considerations of alternative forecasted macroeconomic scenarios. This included obtaining corroborative information, including employment statistics, economic reports and alternative economic forecasts, as well as performing an independent search for the existence of new or contrary information relating to independent macroeconomic forecast to validate that management’s considerations are appropriate. We also verified the underlying economic forecast data used to estimate the quantitative reserve was complete and accurate. Additionally, we evaluated whether the overall ACL appropriately reflects losses expected in the loan portfolio by comparing it the Company’s historical loss data and to peer bank data. We also performed analytical procedures on the ACL, including coverage ratios and comparison to prior periods as well as prior economic cycles. |
/s/
We have served as the Company’s auditor since 1996.
February 26, 2024
70
WESBANCO, INC. CONSOLIDATED BALANCE SHEETS
|
|
December 31, |
|
|||||
(in thousands, except shares) |
|
2023 |
|
|
2022 |
|
||
ASSETS |
|
|
|
|
|
|
||
Cash and due from banks, including interest bearing amounts of $ |
|
$ |
|
|
$ |
|
||
Securities: |
|
|
|
|
|
|
||
Equity securities, at fair value |
|
|
|
|
|
|
||
Available-for-sale debt securities, at fair value |
|
|
|
|
|
|
||
Held-to-maturity debt securities (fair values of $ |
|
|
|
|
|
|
||
Allowance for credit losses, held-to-maturity debt securities |
|
|
( |
) |
|
|
( |
) |
Net held-to-maturity debt securities |
|
|
|
|
|
|
||
Total securities |
|
|
|
|
|
|
||
Loans held for sale |
|
|
|
|
|
|
||
Portfolio loans, net of unearned income |
|
|
|
|
|
|
||
Allowance for credit losses - loans |
|
|
( |
) |
|
|
( |
) |
Net portfolio loans |
|
|
|
|
|
|
||
Premises and equipment, net |
|
|
|
|
|
|
||
Accrued interest receivable |
|
|
|
|
|
|
||
Goodwill and other intangible assets, net |
|
|
|
|
|
|
||
Bank-owned life insurance |
|
|
|
|
|
|
||
Other assets |
|
|
|
|
|
|
||
Total Assets |
|
$ |
|
|
$ |
|
||
LIABILITIES |
|
|
|
|
|
|
||
Deposits: |
|
|
|
|
|
|
||
Non-interest bearing demand |
|
$ |
|
|
$ |
|
||
Interest bearing demand |
|
|
|
|
|
|
||
Money market |
|
|
|
|
|
|
||
Savings deposits |
|
|
|
|
|
|
||
Certificates of deposit |
|
|
|
|
|
|
||
Total deposits |
|
|
|
|
|
|
||
Federal Home Loan Bank borrowings |
|
|
|
|
|
|
||
Other short-term borrowings |
|
|
|
|
|
|
||
Subordinated debt and junior subordinated debt |
|
|
|
|
|
|
||
Total borrowings |
|
|
|
|
|
|
||
Accrued interest payable |
|
|
|
|
|
|
||
Other liabilities |
|
|
|
|
|
|
||
Total Liabilities |
|
|
|
|
|
|
||
SHAREHOLDERS’ EQUITY |
|
|
|
|
|
|
||
Preferred stock, par value; |
|
|
|
|
|
|
||
Common stock, $ |
|
|
|
|
|
|
||
Capital surplus |
|
|
|
|
|
|
||
Retained earnings |
|
|
|
|
|
|
||
Treasury stock ( |
|
|
( |
) |
|
|
( |
) |
Accumulated other comprehensive loss |
|
|
( |
) |
|
|
( |
) |
Deferred benefits for directors |
|
|
( |
) |
|
|
( |
) |
Total Shareholders’ Equity |
|
|
|
|
|
|
||
Total Liabilities and Shareholders’ Equity |
|
$ |
|
|
$ |
|
||
See Notes to Consolidated Financial Statements.
71
WESBANCO, INC. CONSOLIDATED STATEMENTS OF INCOME
|
|
For the Years Ended December 31, |
|
|||||||||
(in thousands, except shares and per share amounts) |
|
2023 |
|
|
2022 |
|
|
2021 |
|
|||
INTEREST AND DIVIDEND INCOME |
|
|
|
|
|
|
|
|
|
|||
Loans, including fees |
|
$ |
|
|
$ |
|
|
$ |
|
|||
Interest and dividends on securities: |
|
|
|
|
|
|
|
|
|
|||
Taxable |
|
|
|
|
|
|
|
|
|
|||
Tax-exempt |
|
|
|
|
|
|
|
|
|
|||
Total interest and dividends on securities |
|
|
|
|
|
|
|
|
|
|||
Other interest income |
|
|
|
|
|
|
|
|
|
|||
Total interest and dividend income |
|
|
|
|
|
|
|
|
|
|||
INTEREST EXPENSE |
|
|
|
|
|
|
|
|
|
|||
Interest bearing demand deposits |
|
|
|
|
|
|
|
|
|
|||
Money market deposits |
|
|
|
|
|
|
|
|
|
|||
Savings deposits |
|
|
|
|
|
|
|
|
|
|||
Certificates of deposit |
|
|
|
|
|
|
|
|
|
|||
Total interest expense on deposits |
|
|
|
|
|
|
|
|
|
|||
Federal Home Loan Bank borrowings |
|
|
|
|
|
|
|
|
|
|||
Other short-term borrowings |
|
|
|
|
|
|
|
|
|
|||
Subordinated debt and junior subordinated debt |
|
|
|
|
|
|
|
|
|
|||
Total interest expense |
|
|
|
|
|
|
|
|
|
|||
NET INTEREST INCOME |
|
|
|
|
|
|
|
|
|
|||
Provision for credit losses |
|
|
|
|
|
( |
) |
|
|
( |
) |
|
Net interest income after provision for credit losses |
|
|
|
|
|
|
|
|
|
|||
NON-INTEREST INCOME |
|
|
|
|
|
|
|
|
|
|||
Trust fees |
|
|
|
|
|
|
|
|
|
|||
Service charges on deposits |
|
|
|
|
|
|
|
|
|
|||
Electronic banking fees |
|
|
|
|
|
|
|
|
|
|||
Net swap fee and valuation income |
|
|
|
|
|
|
|
|
|
|||
Net securities brokerage revenue |
|
|
|
|
|
|
|
|
|
|||
Bank-owned life insurance |
|
|
|
|
|
|
|
|
|
|||
Mortgage banking income |
|
|
|
|
|
|
|
|
|
|||
Net securities gains (losses) |
|
|
|
|
|
( |
) |
|
|
|
||
Net gains on other real estate owned and other assets |
|
|
|
|
|
|
|
|
|
|||
Other income |
|
|
|
|
|
|
|
|
|
|||
Total non-interest income |
|
|
|
|
|
|
|
|
|
|||
NON-INTEREST EXPENSE |
|
|
|
|
|
|
|
|
|
|||
Salaries and wages |
|
|
|
|
|
|
|
|
|
|||
Employee benefits |
|
|
|
|
|
|
|
|
|
|||
Net occupancy |
|
|
|
|
|
|
|
|
|
|||
Equipment and software |
|
|
|
|
|
|
|
|
|
|||
Marketing |
|
|
|
|
|
|
|
|
|
|||
FDIC insurance |
|
|
|
|
|
|
|
|
|
|||
Amortization of intangible assets |
|
|
|
|
|
|
|
|
|
|||
Restructuring and merger-related expense |
|
|
|
|
|
|
|
|
|
|||
Other operating expenses |
|
|
|
|
|
|
|
|
|
|||
Total non-interest expense |
|
|
|
|
|
|
|
|
|
|||
Income before provision for income taxes |
|
|
|
|
|
|
|
|
|
|||
Provision for income taxes |
|
|
|
|
|
|
|
|
|
|||
NET INCOME |
|
$ |
|
|
$ |
|
|
$ |
|
|||
Preferred stock dividends |
|
|
|
|
|
|
|
|
|
|||
NET INCOME AVAILABLE TO COMMON SHAREHOLDERS |
|
$ |
|
|
$ |
|
|
$ |
|
|||
EARNINGS PER COMMON SHARE |
|
|
|
|
|
|
|
|
|
|||
Basic |
|
$ |
|
|
$ |
|
|
$ |
|
|||
Diluted |
|
|
|
|
|
|
|
|
|
|||
AVERAGE COMMON SHARES OUTSTANDING |
|
|
|
|
|
|
|
|
|
|||
Basic |
|
|
|
|
|
|
|
|
|
|||
Diluted |
|
|
|
|
|
|
|
|
|
|||
DIVIDENDS DECLARED PER COMMON SHARE |
|
$ |
|
|
$ |
|
|
$ |
|
|||
See Notes to Consolidated Financial Statements.
72
WESBANCO, INC. CONSOLIDATED STATEMENTS OF COMPREHENSIVE INCOME (LOSS)
|
|
For the Years Ended December 31, |
|
|||||||||
(in thousands) |
|
2023 |
|
|
2022 |
|
|
2021 |
|
|||
Net income |
|
$ |
|
|
$ |
|
|
$ |
|
|||
Debt securities available-for-sale: |
|
|
|
|
|
|
|
|
|
|||
Net change in unrealized gains (losses) on debt securities available-for-sale |
|
|
|
|
|
( |
) |
|
|
( |
) |
|
Related income tax (expense) benefit |
|
|
( |
) |
|
|
|
|
|
|
||
Net securities losses (gains) reclassified into earnings |
|
|
|
|
|
|
|
|
( |
) |
||
Related income tax (benefit) expense |
|
|
( |
) |
|
|
( |
) |
|
|
|
|
Net effect on other comprehensive income for the period |
|
|
|
|
|
( |
) |
|
|
( |
) |
|
Defined benefit plans: |
|
|
|
|
|
|
|
|
|
|||
Amortization of net loss and prior service costs |
|
|
|
|
|
|
|
|
|
|||
Related income tax benefit |
|
|
( |
) |
|
|
( |
) |
|
|
( |
) |
Recognition of unrealized gain (loss) |
|
|
|
|
|
( |
) |
|
|
|
||
Related income tax (expense) benefit |
|
|
( |
) |
|
|
|
|
|
( |
) |
|
Net effect on other comprehensive income for the period |
|
|
|
|
|
( |
) |
|
|
|
||
Total other comprehensive gain (loss) |
|
|
|
|
|
( |
) |
|
|
( |
) |
|
Comprehensive income (loss) |
|
$ |
|
|
$ |
( |
) |
|
$ |
|
||
See Notes to Consolidated Financial Statements.
73
WESBANCO, INC. CONSOLIDATED STATEMENTS OF CHANGES IN SHAREHOLDERS’ EQUITY
|
|
For the years ended December 31, 2023, 2022, and 2021 |
|
|||||||||||||||||||||||||||||||||
|
|
|
|
|
Common Stock |
|
|
|
|
|
|
|
|
|
|
|
|
|
|
|
|
|
|
|
||||||||||||
(in thousands, except shares and per share |
|
Preferred |
|
|
Shares |
|
|
Amount |
|
|
Capital |
|
|
Retained |
|
|
Treasury |
|
|
Accumulated |
|
|
Deferred |
|
|
Total |
|
|||||||||
January 1, 2021 |
|
$ |
|
|
|
|
|
$ |
|
|
$ |
|
|
$ |
|
|
$ |
( |
) |
|
$ |
|
|
$ |
( |
) |
|
$ |
|
|||||||
Net income |
|
|
— |
|
|
|
— |
|
|
|
— |
|
|
|
— |
|
|
|
|
|
|
— |
|
|
|
— |
|
|
|
— |
|
|
|
|
||
Other comprehensive loss |
|
|
— |
|
|
|
— |
|
|
|
— |
|
|
|
— |
|
|
|
— |
|
|
|
— |
|
|
|
( |
) |
|
|
— |
|
|
|
( |
) |
Comprehensive income |
|
|
|
|
|
|
|
|
|
|
|
|
|
|
|
|
|
|
|
|
|
|
|
|
|
|
|
|||||||||
Common dividends declared ($ |
|
|
— |
|
|
|
— |
|
|
|
— |
|
|
|
— |
|
|
|
( |
) |
|
|
— |
|
|
|
— |
|
|
|
— |
|
|
|
( |
) |
Preferred dividends declared ($ |
|
|
— |
|
|
|
— |
|
|
|
— |
|
|
|
— |
|
|
|
( |
) |
|
|
— |
|
|
|
— |
|
|
|
— |
|
|
|
( |
) |
Stock issued for dividend reinvestment |
|
|
— |
|
|
|
|
|
|
— |
|
|
|
— |
|
|
|
( |
) |
|
|
|
|
|
— |
|
|
|
— |
|
|
|
- |
|
||
Treasury shares acquired |
|
|
— |
|
|
|
( |
) |
|
|
— |
|
|
|
|
|
|
— |
|
|
|
( |
) |
|
|
— |
|
|
|
— |
|
|
|
( |
) |
|
Stock options exercised |
|
|
— |
|
|
|
|
|
|
— |
|
|
|
( |
) |
|
|
— |
|
|
|
|
|
|
— |
|
|
|
— |
|
|
|
|
|||
Restricted stock granted |
|
|
— |
|
|
|
|
|
|
— |
|
|
|
( |
) |
|
|
— |
|
|
|
|
|
|
— |
|
|
|
— |
|
|
|
- |
|
||
Stock compensation expense |
|
|
— |
|
|
|
— |
|
|
|
— |
|
|
|
|
|
|
— |
|
|
|
— |
|
|
|
— |
|
|
|
— |
|
|
|
|
||
Deferred benefits for directors—net |
|
|
— |
|
|
|
— |
|
|
|
— |
|
|
|
|
|
|
— |
|
|
|
— |
|
|
|
— |
|
|
|
( |
) |
|
|
( |
) |
|
December 31, 2021 |
|
$ |
|
|
|
|
|
$ |
|
|
$ |
|
|
$ |
|
|
$ |
( |
) |
|
$ |
( |
) |
|
$ |
( |
) |
|
$ |
|
||||||
Net income |
|
|
— |
|
|
|
— |
|
|
|
— |
|
|
|
— |
|
|
|
|
|
|
— |
|
|
|
— |
|
|
|
— |
|
|
|
|
||
Other comprehensive loss |
|
|
— |
|
|
|
— |
|
|
|
— |
|
|
|
— |
|
|
|
— |
|
|
|
— |
|
|
|
( |
) |
|
|
— |
|
|
|
( |
) |
Comprehensive loss |
|
|
|
|
|
|
|
|
|
|
|
|
|
|
|
|
|
|
|
|
|
|
|
|
|
|
( |
) |
||||||||
Common dividends declared ($ |
|
|
— |
|
|
|
— |
|
|
|
— |
|
|
|
— |
|
|
|
( |
) |
|
|
— |
|
|
|
— |
|
|
|
— |
|
|
|
( |
) |
Preferred dividends declared ($ |
|
|
— |
|
|
|
— |
|
|
|
— |
|
|
|
— |
|
|
|
( |
) |
|
|
— |
|
|
|
— |
|
|
|
— |
|
|
|
( |
) |
Stock issued for dividend reinvestment |
|
|
— |
|
|
|
|
|
|
— |
|
|
|
— |
|
|
|
( |
) |
|
|
|
|
|
— |
|
|
|
— |
|
|
|
— |
|
||
Treasury shares acquired |
|
|
— |
|
|
|
( |
) |
|
|
— |
|
|
|
— |
|
|
|
— |
|
|
|
( |
) |
|
|
— |
|
|
|
— |
|
|
|
( |
) |
Stock options exercised |
|
|
— |
|
|
|
|
|
|
— |
|
|
|
( |
) |
|
|
— |
|
|
|
|
|
|
— |
|
|
|
— |
|
|
|
|
|||
Restricted stock granted |
|
|
— |
|
|
|
|
|
|
— |
|
|
|
( |
) |
|
|
— |
|
|
|
|
|
|
— |
|
|
|
— |
|
|
|
— |
|
||
Stock compensation expense |
|
|
— |
|
|
|
— |
|
|
|
— |
|
|
|
|
|
|
— |
|
|
|
— |
|
|
|
— |
|
|
|
— |
|
|
|
|
||
Deferred benefits for directors—net |
|
|
— |
|
|
|
— |
|
|
|
— |
|
|
|
|
|
|
— |
|
|
|
— |
|
|
|
— |
|
|
|
( |
) |
|
|
( |
) |
|
December 31, 2022 |
|
$ |
|
|
|
|
|
$ |
|
|
$ |
|
|
$ |
|
|
$ |
( |
) |
|
$ |
( |
) |
|
$ |
( |
) |
|
$ |
|
||||||
Net income |
|
|
— |
|
|
|
— |
|
|
|
— |
|
|
|
— |
|
|
|
|
|
|
— |
|
|
|
— |
|
|
|
— |
|
|
|
|
||
Other comprehensive income |
|
|
— |
|
|
|
— |
|
|
|
— |
|
|
|
— |
|
|
|
— |
|
|
|
— |
|
|
|
|
|
|
— |
|
|
|
|
||
Comprehensive income |
|
|
|
|
|
|
|
|
|
|
|
|
|
|
|
|
|
|
|
|
|
|
|
|
|
|
|
|||||||||
Common dividends declared ($ |
|
|
— |
|
|
|
— |
|
|
|
— |
|
|
|
— |
|
|
|
( |
) |
|
|
— |
|
|
|
— |
|
|
|
— |
|
|
|
( |
) |
Preferred dividends declared ($ |
|
|
— |
|
|
|
— |
|
|
|
— |
|
|
|
— |
|
|
|
( |
) |
|
|
— |
|
|
|
— |
|
|
|
— |
|
|
|
( |
) |
Stock issued for dividend reinvestment |
|
|
— |
|
|
|
|
|
|
— |
|
|
|
— |
|
|
|
( |
) |
|
|
|
|
|
— |
|
|
|
— |
|
|
|
— |
|
||
Treasury shares acquired |
|
|
— |
|
|
|
( |
) |
|
|
— |
|
|
|
— |
|
|
|
— |
|
|
|
( |
) |
|
|
— |
|
|
|
— |
|
|
|
( |
) |
Stock options exercised |
|
|
— |
|
|
|
|
|
|
— |
|
|
|
( |
) |
|
|
— |
|
|
|
|
|
|
— |
|
|
|
— |
|
|
|
|
|||
Restricted stock granted |
|
|
— |
|
|
|
|
|
|
— |
|
|
|
( |
) |
|
|
— |
|
|
|
|
|
|
— |
|
|
|
— |
|
|
|
— |
|
||
Stock compensation expense |
|
|
— |
|
|
|
— |
|
|
|
— |
|
|
|
|
|
|
— |
|
|
|
— |
|
|
|
— |
|
|
|
— |
|
|
|
|
||
Deferred benefits for directors—net |
|
|
— |
|
|
|
— |
|
|
|
— |
|
|
|
|
|
|
— |
|
|
|
— |
|
|
|
— |
|
|
|
( |
) |
|
|
( |
) |
|
December 31, 2023 |
|
$ |
|
|
|
|
|
$ |
|
|
$ |
|
|
$ |
|
|
$ |
( |
) |
|
$ |
( |
) |
|
$ |
( |
) |
|
$ |
|
||||||
See Notes to Consolidated Financial Statements.
74
WESBANCO, INC. CONSOLIDATED STATEMENTS OF CASH FLOWS
|
|
For the Years Ended December 31, |
|
|||||||||
(in thousands) |
|
2023 |
|
|
2022 |
|
|
2021 |
|
|||
OPERATING ACTIVITIES |
|
|
|
|
|
|
|
|
|
|||
Net income |
|
$ |
|
|
$ |
|
|
$ |
|
|||
Adjustments to reconcile net income to net cash provided by operating activities: |
|
|
|
|
|
|
|
|
|
|||
Depreciation and amortization of premises and equipment |
|
|
|
|
|
|
|
|
|
|||
Other net amortization (accretion) |
|
|
|
|
|
|
|
|
( |
) |
||
Provision for credit losses |
|
|
|
|
|
( |
) |
|
|
( |
) |
|
Net securities (gains) losses |
|
|
( |
) |
|
|
|
|
|
( |
) |
|
Mortgage banking income |
|
|
( |
) |
|
|
( |
) |
|
|
( |
) |
Stock compensation expense |
|
|
|
|
|
|
|
|
|
|||
(Increase) decrease in deferred income tax assets, net |
|
|
( |
) |
|
|
|
|
|
|
||
Increase in cash surrender value of bank-owned life insurance |
|
|
( |
) |
|
|
( |
) |
|
|
( |
) |
Loans originated for sale |
|
|
( |
) |
|
|
( |
) |
|
|
( |
) |
Proceeds from the sale of loans originated for sale |
|
|
|
|
|
|
|
|
|
|||
Net change in: accrued interest receivable and other assets |
|
|
( |
) |
|
|
( |
) |
|
|
|
|
Net change in: accrued interest payable and other liabilities |
|
|
|
|
|
|
|
|
( |
) |
||
Other—net |
|
|
( |
) |
|
|
( |
) |
|
|
( |
) |
Net cash provided by operating activities |
|
|
|
|
|
|
|
|
|
|||
INVESTING ACTIVITIES |
|
|
|
|
|
|
|
|
|
|||
Net (increase) decrease in loans held for investment |
|
|
( |
) |
|
|
( |
) |
|
|
|
|
Available-for-sale debt securities: |
|
|
|
|
|
|
|
|
|
|||
Proceeds from sales |
|
|
|
|
|
— |
|
|
|
— |
|
|
Proceeds from maturities, prepayments and calls |
|
|
|
|
|
|
|
|
|
|||
Purchases of securities |
|
|
( |
) |
|
|
( |
) |
|
|
( |
) |
Held-to-maturity debt securities: |
|
|
|
|
|
|
|
|
|
|||
Proceeds from maturities, prepayments and calls |
|
|
|
|
|
|
|
|
|
|||
Purchases of securities |
|
|
— |
|
|
|
( |
) |
|
|
( |
) |
Purchases of bank owned life insurance |
|
|
— |
|
|
|
— |
|
|
|
( |
) |
Proceeds from bank owned life insurance |
|
|
|
|
|
|
|
|
|
|||
Purchases of premises and equipment—net |
|
|
( |
) |
|
|
( |
) |
|
|
( |
) |
Net cash used in investing activities |
|
|
( |
) |
|
|
( |
) |
|
|
( |
) |
FINANCING ACTIVITIES |
|
|
|
|
|
|
|
|
|
|||
Increase (decrease) in deposits |
|
|
|
|
|
( |
) |
|
|
|
||
Proceeds from Federal Home Loan Bank borrowings |
|
|
|
|
|
|
|
|
— |
|
||
Repayment of Federal Home Loan Bank borrowings |
|
|
( |
) |
|
|
( |
) |
|
|
( |
) |
Decrease in other short-term borrowings |
|
|
( |
) |
|
|
( |
) |
|
|
( |
) |
Principal repayments of finance lease obligations |
|
|
( |
) |
|
|
( |
) |
|
|
( |
) |
Issuance of subordinated debt, net of issuance costs |
|
|
— |
|
|
|
|
|
|
— |
|
|
Repayment of junior subordinated debt, net of discount and subordinated debt |
|
|
( |
) |
|
|
— |
|
|
|
( |
) |
Dividends paid to common shareholders |
|
|
( |
) |
|
|
( |
) |
|
|
( |
) |
Dividends paid to preferred shareholders |
|
|
( |
) |
|
|
( |
) |
|
|
( |
) |
Treasury shares purchased—net |
|
|
( |
) |
|
|
( |
) |
|
|
( |
) |
Net cash provided by financing activities |
|
|
|
|
|
|
|
|
|
|||
Net increase (decrease) in cash, cash equivalents and restricted cash |
|
|
|
|
|
( |
) |
|
|
|
||
Cash, cash equivalents and restricted cash at beginning of the year |
|
|
|
|
|
|
|
|
|
|||
Cash, cash equivalents and restricted cash at end of the year |
|
$ |
|
|
$ |
|
|
$ |
|
|||
SUPPLEMENTAL DISCLOSURES |
|
|
|
|
|
|
|
|
|
|||
Interest paid on deposits and other borrowings |
|
$ |
|
|
$ |
|
|
$ |
|
|||
Income taxes paid |
|
|
|
|
|
|
|
|
|
|||
Transfers of loans to other real estate owned |
|
|
|
|
|
|
|
|
|
|||
See Notes to Consolidated Financial Statements.
75
NOTE 1. SUMMARY OF SIGNIFICANT ACCOUNTING POLICIES
Nature of Operations— Wesbanco, Inc. (“Wesbanco” or the “Company”) is a bank holding company offering a full range of financial services, including trust and investment services, mortgage banking, insurance and brokerage services. Wesbanco’s defined business segments are community banking and trust and investment services. As of December 31, 2023, Wesbanco’s banking subsidiary, Wesbanco Bank, Inc. (“Wesbanco Bank” or the “Bank”), headquartered in Wheeling, West Virginia, operates through
Use of Estimates— The preparation of financial statements in conformity with U.S. generally accepted accounting principles requires management to make estimates and assumptions that affect the reported amounts of assets and liabilities and disclosure of contingent assets and liabilities at the date of the financial statements and the reported amounts of revenues and expenses during the reporting period. Actual results could differ from those estimates.
Principles of Consolidation— The Consolidated Financial Statements include the accounts of Wesbanco and those entities in which Wesbanco has a controlling financial interest. All intercompany balances and transactions have been eliminated in consolidation.
Wesbanco determines whether it has a controlling financial interest in an entity by first evaluating whether the entity is a voting interest entity or a variable interest entity. A voting interest entity is an entity in which the total equity investment at risk is sufficient to enable the entity to finance itself independently and provides the equity holders with the obligation to absorb losses, the right to receive residual returns and the right to make financial and operating decisions. Wesbanco consolidates voting interest entities in which it owns all, or at least a majority (generally, greater than
Variable interest entities (“VIE”) are entities that in general either do not have equity investors with voting rights or that have equity investors that do not provide sufficient financial resources for the entity to support its activities. Wesbanco uses VIEs in various legal forms to conduct normal business activities. Wesbanco reviews the structure and activities of VIEs for possible consolidation.
A controlling financial interest in a VIE is present when an enterprise has both the power to direct the activities of the VIE that most significantly impact the VIE’s economic performance and the obligation to absorb losses of the VIE that could potentially be significant to the VIE or the right to receive benefits of the VIE that could potentially be significant to the VIE. A VIE often holds financial assets, including loans or receivables, real estate or other property. The company with a controlling financial interest, known as the primary beneficiary, is required to consolidate the VIE. Wesbanco has
Business Combinations— Business combinations are accounted for by applying the acquisition method. As of acquisition date, the identifiable assets acquired and liabilities assumed are measured at fair value and recognized separately from goodwill. Results of operations of the acquired entities are included in the consolidated statement of income from the date of acquisition.
Revenue Recognition— Interest income, net securities gains (losses) and bank-owned life insurance are not in scope of ASC 606, Revenue from Contracts with Customers. For the revenue streams in scope of ASC 606, which include trust fees, service charges on deposits, net securities brokerage revenue, debit card sponsorship income, payment processing fees, electronic banking fees, net swap fee and valuation income, mortgage banking income and net gain or loss on sale of other real estate owned and other assets, there are no significant judgments related to the amount and timing of revenue recognition.
Trust fees: Fees are earned over a period of time between monthly and annually, per the related fee schedule. The fees are earned ratably over the period for investment, safekeeping and other services performed by Wesbanco. The fees are accrued when earned based on the daily asset value on the last day of the quarter. In most cases, the fees are directly debited from the customer account. WesMark fees consist of investment advisory fees and shareholder service fees and are paid to Wesbanco by the WesMark mutual funds on a monthly basis for Wesbanco’s involvement with the management of the funds.
Service charges on deposits: There are monthly service charges for both commercial and personal banking customers, which are earned over the month per the related fee schedule based on the customers’ deposits. There are also transaction-based fees, which are earned based on specific transactions or customer activity within the customers’ deposit accounts. These are earned at the time the transaction or customer activity occurs. The fees are debited from the customer account.
76
Net securities brokerage revenue: Commission income is earned based on customer transactions and management of investments. The commission income from customers’ transactions is recognized when the transaction is complete and approved. Annuity commissions are earned based upon the carrier’s commission rate for the annuity product chosen by the investing customer. The commission income from the management of investments over time is earned continuously over a quarterly period.
Payment processing fees: Payment processing fees are earned from the bill payment and electronic funds transfer (“EFT”) services provided under the name FirstNet. The fees are derived from both the individual consumer banking transactions and from businesses or service providers through monthly billing for total transactions occurring. These fees are earned at the time the transaction or customer activity occurs. The fees are debited from the customers’ deposit accounts or charged directly to the business or service provider. Payment processing fees are recorded within other non-interest income on the Consolidated Statements of Income.
Electronic banking fees: Interchange and ATM fees are earned based on customer and ATM transactions. Revenue is recognized when the transaction is settled.
Net swap fee and valuation income: Fee income is earned when Wesbanco executes interest rate swaps and caps with its commercial banking customers. These swaps and caps are economically hedged by offsetting interest rate swaps and caps that Wesbanco executes with a third party, generating the fee income. The fee income is recognized when the swap or cap transaction is complete and approved by all parties.
Mortgage banking income: Income is earned when Wesbanco-originated loans are sold to an investor on the secondary market. The investor bids on the loans. If the price is accepted, Wesbanco delivers the loan documents to the investor. Once received and approved by the investor, revenue is recognized and the loans are derecognized from the Consolidated Balance Sheet. Prior to the loans being sold, they are classified as loans held for sale. Additionally, the changes in the fair value of the loans held for sale, loan commitments and related derivatives are included in mortgage banking income and are somewhat offset by any deferred direct origination costs, such as mortgage loan officer commissions.
Net gain or loss on sale of other real estate owned and other assets: Net gain or loss on other real estate owned is recorded when the property is sold to a third party and the Bank collects substantially all of the consideration to which it is entitled in exchange for the transfer of the property. Net gain or loss on other assets can include, among other things, the sale of fixed assets, the change in fair value of the underlying investments funded by Wesbanco’s Community Development Corporation (“Wesbanco CDC”) and residual income earned from the sale of Wesbanco’s debit card sponsorship program. Gains or losses are recognized upon receipt of consideration and subsequent transfer of the property for fixed asset sales. The change in fair value of Wesbanco CDC investments occurs upon the change in the underlying investments as these are accounted for utilizing the equity method, and as such, are not within the scope of ASC 606. Residual income from the sale of the debit card sponsorship program is recognized over time as per the signed agreement between Wesbanco and the buyer.
Cash and Cash Equivalents— Cash and cash equivalents include cash and due from banks, due from banks – interest bearing and federal funds sold. Generally, federal funds are sold for one-day periods.
Securities— Equity securities: Equity securities, which include investments in various mutual funds held in grantor trusts formed in connection with the Company’s deferred compensation plan, are reported at fair value with the gains and losses included in non-interest income.
Available-for-sale debt securities: Debt securities not classified as held-to-maturity are classified as available-for-sale. These securities may be sold at any time based upon management’s assessment of changes in economic or financial market conditions, interest rate or prepayment risks, liquidity considerations and other factors. These securities are stated at fair value, with the fair value adjustment, net of tax, reported as a separate component of accumulated other comprehensive income.
Held-to-maturity debt securities: Securities that are purchased with the positive intent and ability to be held until their maturity are stated at cost and adjusted for amortization of premiums and accretion of discounts. Transfers of debt securities into the held-to-maturity category from the available-for-sale category are made at fair value at the date of transfer. The unrealized gain or loss at the date of transfer is retained in other comprehensive income and in the carrying value of the held-to-maturity securities. Such amounts are amortized over the remaining life of the security. Certain securities with less than
Cost method investments: Securities that do not have readily determinable fair values and for which Wesbanco does not exercise significant influence are carried at cost. Cost method investments consist primarily of Federal Home Loan Bank (“FHLB”) stock and are included in other assets in the Consolidated Balance Sheets. Cost method investments are evaluated for impairment whenever events or circumstances suggest that their carrying value may not be recoverable.
Securities acquired in acquisitions are recorded at fair value with the premium or discount derived from the fair market value adjustment recognized into interest income on a level yield basis over the remaining life of the security.
Gains and losses: Net realized gains and losses on sales of securities are included in non-interest income. The cost of securities sold is based on the specific identification method. The gain or loss is determined as of the trade date. Unrealized gains and losses on available-for-sale securities are recorded through other comprehensive income.
77
Amortization and accretion: Generally, premiums are amortized to call date and discounts are accreted to maturity, on a level yield basis.
Current expected credit losses (“CECL”): The corporate and municipal bonds in Wesbanco’s held-to-maturity debt portfolio are analyzed quarterly for CECL. Wesbanco uses a database of historical financials of all corporate and municipal issuers and actual historic default and recovery rates on rated and non-rated transactions to estimate CECL on an individual security basis. The CECL calculated amount is adjusted quarterly and is recorded in an allowance for expected credit losses on the balance sheet that is deducted from the amortized cost basis of the held-to-maturity portfolio as a contra asset, with the losses recorded on the income statement within the provision for credit losses. Because Wesbanco’s held-to-maturity investments in mortgage-backed securities and collateralized mortgage obligations are all either issued by a direct governmental entity or a government-sponsored entity, there is no historical evidence supporting the establishment of a CECL reserve; therefore, Wesbanco has estimated these losses at
Available-for-sale debt security impairment: An available-for-sale debt security is considered impaired if its fair value is less than its amortized cost basis. If Wesbanco intends to sell or will be required to sell the investment prior to recovery of cost, the entire impairment will be recognized immediately in the Consolidated Statements of Income. If Wesbanco does not intend to sell, nor is it more likely than not that it will be required to sell impaired securities prior to the recovery of their cost, a review is conducted each quarter to determine if any portion of the impairment is due to credit losses. In estimating credit losses, Wesbanco first considers the financial condition and near-term prospects of the issuer, evaluating any credit downgrades or other indicators of a potential credit problem, the type of security, either fixed or equity, and the receipt of principal and interest according to the contractual terms. If there are no indications that the impairment is credit-related, the impairment is recognized in other comprehensive income in the Consolidated Balance Sheet. If the impairment is considered to be credit-related based on management’s review of the various factors that indicate credit impairment, the amount of credit impairment is calculated using the present value of future expected cash flows. If the present value of future expected cash flows is less than the amortized cost basis of the security, a credit loss exists and an allowance for expected credit losses is recorded, limited by the total unrealized loss on the security, and is recognized in the Consolidated Statements of Income. The non-credit portion is calculated as the difference between the total unrealized loss and the credit portion of that loss and is recognized in other comprehensive income.
Loans and Loans Held for Sale — Loans originated by Wesbanco are reported at the principal amount outstanding, net of unearned income including credit valuation adjustments, unamortized deferred loan fee income and loan origination costs. Interest is accrued as earned on loans except where doubt exists as to collectability, in which case accrual of income is discontinued. Loans originated and intended for sale are carried, in aggregate, at fair value. The use of a valuation model using quoted prices of similar instruments are significant observable inputs in arriving at the fair value of loans held for sale.
Loan origination fees and direct costs are deferred and accreted or amortized into interest income, as an adjustment to the yield, over the life of the loan using the level yield method, or an approximation thereof. When a loan is paid off, the remaining unaccreted or unamortized net origination fees or costs are immediately recognized into income.
Loans are generally placed on non-accrual when they are
A loan is considered non-performing, based on current information and events, if it is probable that Wesbanco will be unable to collect the payments of principal and interest when due according to the original contractual terms of the loan agreement. Wesbanco recognizes interest income on non-accrual loans on the cash basis only if recovery of principal is reasonably assured. All non-accrual loans are considered non-performing loans.
Consumer loans are charged down to the net realizable value at
Modifications for Borrowers Experiencing Financial Difficulty (“MBEFD”) — A modification of a loan for borrowers experiencing financial difficulty is applicable when the loan modification results in a direct change in the timing or amount of contractual cash flows. The most common modifications provided to borrowers experiencing financial difficulty are expected to occur in the form of principal forgiveness, interest rate reductions, other-than-insignificant-payment delays, or term extensions under ASC 310-10-50-39. Upon Wesbanco's adoption of Accounting Standards Update (“ASU”) 2022-02 on January 1, 2023, Troubled Debt Restructuring ("TDR") accounting was prospectively discontinued and economic concessions for modifications occurring on or after the adoption date are no longer measured. This accounting also results in the elimination of any existing economic concession related to a loan that was previously designated as a TDR if such loan is restructured on or after January 1, 2023. Due to the elimination of economic concessions
78
under ASU 2022-02, the standard may result in modified loans being subject to the new disclosures that would have not been considered concessions and not treated as TDRs.
When determining whether a debtor is experiencing financial difficulties, consideration is given to any known default on any of its debt or whether it is probable that the debtor would be in payment default in the foreseeable future without the modification. Other indicators of financial difficulty include whether the debtor has declared or is in the process of declaring bankruptcy, the debtor’s ability to continue as a going concern, or the debtor’s projected cash flow to service its debt (including principal & interest) in accordance with the contractual terms for the foreseeable future, without a modification. If the payment of principal at original maturity is primarily dependent on the value of collateral, the current value of that collateral is considered in determining whether the principal will be paid.
The modification of a loan does not increase the allowance or provision for credit losses unless the loan is extended, or the loans are commercial loans that are individually evaluated for impairment, in which case a specific reserve is established pursuant to GAAP. Portfolio segment loss history is the primary factor for establishing the allowance for residential real estate, home equity and consumer MBEFDs.
Non-accrual loans that are restructured remain on non-accrual, but may move to accrual status after they have performed according to the restructured terms for a period of time. MBEFDs on accrual status generally remain on accrual as long as they continue to perform in accordance with their modified terms. MBEFDs may also be placed on non-accrual if they do not perform in accordance with the restructured terms. Loans may be removed from MBEFD status after they have performed according to the renegotiated terms for a period of time.
Troubled Debt Restructurings (prior to the adoption of ASU 2022-02) — A restructuring of a loan constitutes a TDR if the creditor, for economic or legal reasons related to the debtor's financial difficulties, grants a concession to the debtor that it would not otherwise consider. The determination of whether a concession has been granted includes an evaluation of the debtor’s ability to access funds at a market rate for debt with similar risk characteristics and among other things, the significance of the modification relative to unpaid principal or collateral value of the debt, and/or the significance of a delay in the timing of payments relative to the frequency of payments, original maturity date, or the expected duration of the loan. The most common concessions granted generally include one or more modifications to the terms of the debt such as a reduction in the interest rate below the prevailing market rate for the remaining life of the debt, an extension of the maturity date at an interest rate lower than the prevailing market rate for new debt with similar risk, or reduction of the unpaid principal or interest. Additionally, all consumer bankruptcies are considered TDR; all TDRs are considered nonperforming loans.
When determining whether a debtor is experiencing financial difficulties, consideration is given to any known default on any of its debt or whether it is probable that the debtor would be in payment default in the foreseeable future without the modification. Other indicators of financial difficulty include whether the debtor has declared or is in the process of declaring bankruptcy, the debtor’s ability to continue as a going concern, or the debtor’s projected cash flow to service its debt (including principal & interest) in accordance with the contractual terms for the foreseeable future, without a modification. If the payment of principal at original maturity is primarily dependent on the value of collateral, the current value of that collateral is considered in determining whether the principal will be paid.
The restructuring of a loan does not increase the allowance or provision for credit losses unless the loan is extended or the loans are commercial loans that are individually evaluated for impairment, in which case a specific reserve is established pursuant to GAAP. Portfolio segment loss history is the primary factor for establishing the allowance for residential real estate, home equity and consumer TDRs.
Non-accrual loans that are restructured remain on non-accrual, but may move to accrual status after they have performed according to the restructured terms for a period of time. TDRs on accrual status generally remain on accrual as long as they continue to perform in accordance with their modified terms. TDRs may also be placed on non-accrual if they do not perform in accordance with the restructured terms. Loans may be removed from TDR status after they have performed according to the renegotiated terms for a period of time if the interest rate under the modified terms is at or above market, is restructured or refinanced at market or if the loan returns to its original terms.
Acquired Loans— Loans acquired in connection with acquisitions are recorded at their acquisition-date fair value and are classified into two categories; purchased financial instruments with more than insignificant credit deterioration (“PCD”) loans, and loans with insignificant credit deterioration (“non-PCD”). PCD loans are defined as a loan or group of loans that have experienced more than insignificant credit deterioration since origination. Non-PCD loans will have an allowance established on acquisition date, which is recognized in the current period provision for credit losses. For PCD loans, an allowance is recognized on day 1 by adding it to the fair value of the loan, which is the “Day 1 amortized cost”. There is no credit loss expense recognized on PCD loans because the initial allowance is established by grossing-up the amortized cost of the PCD loan. Determining the fair value of the acquired loans involves estimating the principal and interest cash flows expected to be collected on the loans and discounting those cash flows at a market rate of interest. Management considers a number of factors in evaluating the acquisition-date fair value including the remaining life of the acquired loans, delinquency status, estimated prepayments, payment options and other loan features, internal risk grade, estimated value of the underlying collateral and interest rate environment.
PCD loans are accounted for in accordance with Accounting Standards Codification (“ASC”) 326-20, Financial Instruments – Credit Losses – Measure at Amortized Cost, if, at acquisition, the loan or pool of loans has experienced more-than-insignificant credit
79
deterioration since origination. At acquisition, Wesbanco considers several factors as indicators that an acquired loan or pool of loans has experienced more-than-insignificant credit deterioration. These factors include, but are not limited to, loans
Under ASC 326-20, a group of loans with similar risk characteristics can be assessed to determine if the pool of loans is PCD. However, if a loan does not have similar risk characteristics as any other acquired loan, the loan is individually assessed to determine if it is PCD. In addition, the initial allowance related to acquired loans can be estimated for a pool of loans if the loans have similar risk characteristics. Even if the loans were individually assessed to determine if they were PCD, they can be grouped together in the initial allowance calculation if they share similar risk characteristics. Since Wesbanco uses the discounted cash flow (DCF) approach, the initial allowance calculation for PCD loans is calculated as the expected contractual cash shortfalls, discounted at the rate that equals the net present value of estimated future cash flows expected to be collected with the purchase price of the loan(s). If a PCD loan has an unfunded commitment at acquisition, the initial allowance for credit losses calculation reflects only the expected credit losses associated with the funded portion of the PCD loan. Expected credit losses associated with the unfunded commitment are included in the initial measurement of the commitment.
For PCD loans, the non-credit discount or premium is allocated to individual loans as determined by the difference between the loan’s amortized cost basis and the unpaid principal balance. The non-credit premium or discount is recognized into interest income on a level yield basis over the remaining expected life of the loan. For non-PCD loans, the interest and credit discount or premium is allocated to individual loans as determined by the difference between the loan’s amortized cost basis and the unpaid principal balance. The premium or discount is recognized into interest income on a level yield basis over the remaining expected life of the loan.
Allowance for Credit Losses— The allowance for credit losses specific to loans reduces the loan portfolio to the net amount expected to be collected, representing the lifetime expected losses at the initial origination date. Similarly, an allowance for unfunded loan commitments, which is recorded in other liabilities, represents expected losses on unfunded commitments. Fluctuations in the allowance for credit losses specific to loans, the allowance for unfunded loan commitments, and the allowance for held-to-maturity debt securities are recognized in the provision for credit losses on the consolidated statement of operations. The allowance incorporates forward-looking information and applies a reversion methodology beyond the reasonable and supportable forecast. The allowance is increased by a provision charged to operating expense and reduced by charge-offs, net of recoveries. Management evaluates the appropriateness of the allowance at least quarterly. This evaluation is inherently subjective as it requires material estimates that may be susceptible to significant change from period to period.
The allowance for credit loss calculation specific to loans is based on the loan’s amortized cost basis, which is comprised of the unpaid principal balance of the loan, deferred loan fees (costs) and acquired premium (discount) minus any write-downs. Wesbanco made an accounting policy election to exclude accrued interest from the measurement of the allowance for credit losses because the Company has a policy in place to reverse or write-off accrued interest when a loan is placed on non-accrual, and also Wesbanco made an accounting policy election to reverse accrued interest deemed uncollectible as a reversal of interest income. However, Wesbanco is reserving, as part of the allowance for credit losses, for accrued interest on loan modifications under the CARES Act due to the nature and timing of these deferrals.
The allowance for credit losses reflects the risk of loss on the loan portfolio. To appropriately measure expected credit losses, management disaggregates the loan portfolio into pools of similar risk characteristics. The Company utilizes the probability of default (“PD”) / loss given default (“LGD”) approach to calculate the expected loss for each segment, which is then discounted to net present value. PD is the probability the asset will default within a given timeframe and LGD is the percentage of the assets not expected to be collected due to default. The primary macroeconomic drivers of the quantitative model include forecasts of national unemployment and interest rate spreads. Management relies on macroeconomic forecasts obtained from various reputable sources, which may include the Federal Open Market Committee (FOMC) forecast and other publicly available forecasts from well recognized, leading economists. These forecasts can range from to
The allowance for credit losses is calculated over the loan’s contractual life. For term loans, the contractual life is calculated based on the maturity date. For commercial and industrial (“C&I”) revolving loans with no stated maturity date, the contractual life is calculated based on the internal review date. For all other revolving loans, the contractual life is based on either the estimated maturity date or a default date. The contractual term does not include expected extensions, renewals or modifications.
The loan portfolio is segmented based on the risk profiles of the loans. Commercial loans are segmented between commercial real estate (“CRE”), which are collateralized by real estate, and C&I, which are typically utilized for general business purposes. CRE is further segmented between land and construction (“LCD”) and improved property, which are generally loans to purchase or refinance owner occupied or non-owner occupied investment properties. LCD loans have a unique risk that the developer or builder may not complete the project or not complete it on time or within budget. Improved property loans are reviewed for risk based on the underlying real estate property such as rental or owner income, appraisal value and other current lease terms, which affect debt service coverage and loan to value. Retail loans are a homogenous group, generally consisting of standardized products that are smaller in amount and
80
distributed over a large number of individual borrowers. The group is segmented into
Contractual terms are adjusted for estimated prepayments to arrive at expected cash flows. Wesbanco models term loans with an annualized “prepayment” rate. When Wesbanco has a specific expectation of differing payment behavior for a given loan, the loan may be evaluated individually. For revolving loans that do not have a principal payment schedule, a curtailment rate is factored into the cash flow.
The evaluation also considers qualitative factors such as economic trends and conditions, which includes levels of regional unemployment, real estate values and the impact on specific industries and geographical markets, changes in lending policies and underwriting standards, delinquency and other credit quality trends, concentrations of credit risk, if any, the results of internal loan reviews and examinations by bank regulatory agencies pertaining to the allowance for credit losses. Management relies on observable data from internal and external sources to the extent it is available to evaluate each of these factors and adjusts the model’s quantitative results to reflect the impact these factors may have on probable losses in the portfolio.
Commercial loans, including CRE and C&I that have unique characteristics, are tested individually for estimated credit losses. Specific reserves are established when appropriate for such loans based on the net present value of expected future cash flows of the loan or the estimated realizable value of the collateral, if any. The present value of expected future cash flows are discounted at the loan’s effective interest rate. The effective interest rate on a loan is the rate of return implicit in the loan, the loan’s observable market price, or the fair value of the collateral discounted by the estimated selling expenses, if the loan is collateral dependent. Wesbanco chooses the appropriate measurement method on a loan by loan basis for an individually evaluated loan, except for collateral dependent loans for which foreclosure of the collateral is probable. A loan is collateral dependent if repayment of the loan is to be provided solely by the underlying collateral. If the Bank determines that foreclosure of the collateral is probable, ASC 326-20 requires that the expected credit loss be based on the difference between the current fair value of the collateral and the amortized cost basis of the financial asset. At this point, the loan would either be charged down or adequately reserved.
Management may also adjust its assumptions to account for differences between expected and actual losses from period to period. The variability of management’s assumptions could alter the level of the allowance for credit losses and may have a material impact on future results of operations and financial condition. The loss estimation models and methods used to determine the allowance for credit losses are continually refined and enhanced.
Premises and Equipment— Premises and equipment are stated at cost less accumulated depreciation and amortization. Depreciation is computed using the straight-line method over the estimated useful lives of the assets. Leasehold improvements are amortized over the shorter of the estimated economic useful lives of the leased assets or the remaining terms of the underlying leases. Useful lives range from
Operating leases are recorded as a right of use (“ROU”) asset and operating lease liability, included in premises and equipment, net and other liabilities, respectively. Operating lease ROU assets represent the right to use an underlying asset during the lease term and operating lease liabilities represent our obligation to make lease payments arising from the lease. ROU assets and operating lease liabilities are recognized at lease commencement based on the present value of the remaining lease payments using a discount rate that represents our incremental borrowing rate at the lease commencement date. Operating lease expense, which is comprised of amortization of the ROU asset and the implicit interest accreted on the operating lease liability, is recognized on a straight-line basis over the lease term, and is recorded primarily in net occupancy expense in the consolidated statements of income.
Other Real Estate Owned and Repossessed Assets— Other real estate owned and repossessed assets, which are considered available-for-sale and are reported in other assets, are carried at the lower of cost or their estimated current fair value, less estimated costs to sell. Other real estate owned consists primarily of properties acquired through, or in lieu of, foreclosure. Repossessed collateral primarily consists of automobiles and other types of collateral acquired to satisfy defaulted consumer loans. Subsequent declines in fair value, if any, income and expense associated with the management of the collateral, and gains or losses on the disposition of these assets are recognized in the Consolidated Statements of Income in non-interest income. Refer to Note 13, “Revenue Recognition” for further detail.
Goodwill and Other Intangible Assets— Wesbanco accounts for business combinations using the acquisition method of accounting. Accordingly, the identifiable assets acquired, the liabilities assumed, and any non-controlling interest of an acquired business are recorded at their estimated fair values as of the date of acquisition with any excess of the cost of the acquisition over the fair value recorded as goodwill. Other intangible assets represent purchased assets that lack physical substance but can be distinguished from goodwill because of contractual or other legal rights or because the asset is capable of being sold or exchanged either on its own or in combination with a related contract, asset, or liability.
Goodwill is not amortized but is evaluated for impairment annually, or more often if events or circumstances indicate it may be impaired. Finite-lived intangible assets, which consist primarily of core deposit and customer list intangibles (long-term customer-relationship intangible assets) are amortized using straight-line and accelerated methods over their weighted-average estimated useful lives, ranging from to
81
carrying amount may not be recoverable. Non-compete agreements are recognized in other assets on the balance sheet and are amortized on a straight-line basis over the life of the respective agreements, ranging from to
Goodwill is evaluated for impairment by either assessing qualitative factors to determine whether it is necessary to perform the goodwill impairment test, or Wesbanco may elect to perform a quantitative goodwill impairment test. Under the qualitative assessment, Wesbanco assesses qualitative factors to determine whether it is more likely than not that the fair value of its reporting units are less than their carrying amounts, including goodwill. If it is more likely than not, the goodwill impairment test is used to identify potential goodwill impairment and measure the amount of a goodwill impairment loss to be recognized, if any. The estimated fair value of each reporting unit is compared to its carrying value, including goodwill. If the estimated fair value of a reporting unit exceeds its carrying amount, the goodwill of that reporting unit is not considered impaired, and no impairment loss is recognized. However, if the carrying amount of the reporting unit exceeds its fair value, an impairment loss is recognized based on the excess of a reporting unit’s carrying value over its fair value.
Intangible assets with finite useful lives are evaluated for impairment whenever events or changes in circumstances indicate that their carrying amount may not be recoverable. An impairment loss is recognized when the carrying amount of an intangible asset with a finite useful life is not recoverable from its undiscounted cash flows and is measured as the difference between the carrying amount and the fair value of the asset. Wesbanco does
Bank-Owned Life Insurance— Wesbanco has purchased life insurance policies on certain executive and other officers. Wesbanco receives the cash surrender value of each policy upon its termination or benefits are payable upon the death of the insured. These policies are recorded in the Consolidated Balance Sheets at their net cash surrender value. Changes in net cash surrender value are recognized in non-interest income in the Consolidated Statements of Income. Adjustments to cash surrender value and death benefits received, if recognized as income, are currently tax-exempt.
Interest Rate Lock Commitments— In order to attract potential home borrowers, Wesbanco offers interest rate lock commitments (“IRLC”) to such potential borrowers. IRLC are generally for
A mortgage loan sold on a mandatory basis to the secondary market is considered sold when the mortgage loan is funded. Wesbanco enters into TBA contracts in order to control interest rate risk during the period between the IRLC and the sale of the mortgage loan. The IRLC is executed between the mortgagee and Wesbanco, and the forward TBA contract is executed between Wesbanco and a counterparty. Both the IRLC and the forward TBA contract are considered derivatives. A mortgage loan sold on a best efforts basis is locked into a forward sales contract on the same day as the IRLC to control interest rate risk during the period between the IRLC and the sale of the mortgage loan. The IRLC is executed between the mortgagee and Wesbanco, and the forward sales contract is executed between Wesbanco and a counterparty. Both the IRLC and the forward sales contract are considered derivatives. Both types of derivatives are recorded at fair value and are not designated in a qualified hedged accounting program. The changes in fair value are recorded in current earnings within mortgage banking income in the Consolidated Statements of Income. The fair value of IRLC is the gain or loss that would be realized on the underlying loans assuming exercise of the commitments under current market rates versus the rate incorporated in the commitments, taking into consideration loans cancelled prior to closing. The fair value of forward sales contracts is based on quoted market prices. Since loans typically close before receipt of funding from an investor, they are accounted for at fair value as “Loans Held for Sale” in the Consolidated Balance Sheets.
Derivative Instruments and Hedging Activities— Wesbanco records all derivatives on the balance sheet at fair value. The accounting for changes in the fair value of derivatives depends on the intended use of the derivative, whether Wesbanco has elected to designate a derivative in a hedging relationship and apply hedge accounting and whether the hedging relationship has satisfied the criteria necessary to apply hedge accounting. Wesbanco enters into back-to-back interest rate swaps and caps with commercial banking customers and then with counterparties for the offsetting interest rate swap or cap. Currently, none of Wesbanco’s derivatives are designated in qualifying hedging relationships, as the derivatives are not used to manage risks within Wesbanco’s assets or liabilities. As such, all changes in fair value of Wesbanco’s derivatives are recognized directly in earnings.
Income Taxes— The provision for income taxes included in the Consolidated Statements of Income includes both federal and state income taxes and is based on income in the financial statements, rather than amounts reported on Wesbanco’s income tax returns. Deferred tax assets and liabilities are recognized for the future tax consequences attributable to differences between the financial statement carrying amounts of existing assets and liabilities and their respective tax bases at which rates they are expected to turnaround. A test of the anticipated realizability of deferred tax assets is performed at least annually.
Fair Value— Fair value is an exit price, representing the amount that would be received to sell an asset or paid to transfer a liability in an orderly transaction between market participants. Fair value measurements are not adjusted for transaction costs. The ASC also establishes a fair value hierarchy that prioritizes the inputs to valuation techniques used to measure fair value. The hierarchy gives
82
the highest priority to unadjusted quoted prices in active markets for identical assets or liabilities (Level 1 measurement) and the lowest priority to unobservable inputs (Level 3 measurement). The three levels of the fair value hierarchy are described below:
Level 1—Quoted prices in active markets for the same security that are accessible at the measurement date for identical, unrestricted assets or liabilities;
Level 2—Quoted prices for similar instruments in active markets, quoted prices for identical or similar instruments in markets that are not active, or model-based valuation techniques where all significant assumptions are observable, either directly or indirectly, in the market;
Level 3—Valuation is generated from model-based techniques where one or more significant assumptions are not observable, either directly or indirectly, in the market. These unobservable assumptions reflect estimates of assumptions that market participants would use in pricing the asset or liability. Valuation techniques may include use of discounted cash flow models and similar techniques.
A financial instrument’s level within the fair value hierarchy is based on the lowest level of input that is significant to the fair value measurement.
Earnings Per Common Share— Basic earnings per common share (“EPS”) is calculated by dividing net income available to common shareholders by the weighted-average number of shares of common stock outstanding during the period. For diluted EPS, the weighted-average number of shares for the period is increased by the number of shares, which would be issued assuming the exercise of in-the-money common stock options and any outstanding warrants. Time-based restricted stock shares are recorded as issued and outstanding upon their grant, rather than upon vesting, and therefore are included in the weighted-average shares outstanding due to voting rights granted at the time restricted stock is granted. Performance and market-based restricted stock shares are recorded as issued and outstanding upon their achieving the required performance or market factors. These restricted shares are included in the number of shares outstanding for diluted EPS if their performance or market factors are expected to be achieved as of the reporting date.
Trust Assets— Assets held by the Bank in fiduciary or agency capacities for its customers are not included as assets in the Consolidated Balance Sheets. Certain money market trust assets are held on deposit at the Bank and are accounted for as such.
Stock-Based Compensation— Stock-based compensation awards granted, comprised of stock options, performance and time-based restricted stock, and total shareholder return (“TSR”) awards are valued at fair value and compensation cost is recognized on a straight-line basis over the requisite service or performance period of each award. For service-based awards with graded vesting schedules, compensation expense is divided among the vesting periods with each separately vested portion of the award recognized in compensation expense on a straight-line basis over the requisite service period. For performance-based awards and TSR awards, compensation expense is recognized evenly over the performance period, based on the probability of the achievements of the performance or market conditions set forth in the plans. Upon adoption of Accounting Standards Update (“ASU”) 2016-09, “Compensation-Stock Compensation (Topic 718)”, Wesbanco recognizes forfeitures as they occur rather than estimating them over the life of the award.
Defined Benefit Pension Plan— Wesbanco recognizes in the statement of financial position an asset for the plan’s overfunded status or a liability for the plan’s underfunded status. Wesbanco recognizes fluctuations in the funded status in the year in which the changes occur through other comprehensive income. Plan assets are determined based on fair value generally representing observable market prices. The projected benefit obligation is determined based on the present value of projected benefit distributions at an assumed discount rate. The discount rate utilized is based on a fitted yield curve approach whereby the yield curve compares the expected stream of future benefit payments for the plan to high quality corporate bonds available in the marketplace to determine an equivalent discount rate. Periodic pension expense includes service costs, interest costs based on an assumed discount rate, an expected return on plan assets based on an actuarially-derived market-related value, an assumed rate of annual compensation increase, and amortization or accretion of actuarial gains and losses as well as other actuarial assumptions. The service cost component is recognized in salaries and wages and the remaining costs are recognized in employee benefits within the Company’s Consolidated Statement of Income. Wesbanco utilizes a full yield curve approach in the estimation of service and interest components by applying the specific spot rates along the yield curve used in the determination of the benefit obligation to the relevant projected cash flows. The plan has been closed to new entrants since August 2007; however, benefits are still earned for those plan participants with continuing employment after August 2007. Refer to Note 12, “Employee Benefit Plans” for further detail.
Post-retirement Medical Benefit Plan— Wesbanco acquired a non-qualified supplemental retirement plan for certain key employees from Farmers Capital Bank Corp. (“FFKT”). The Plan provides lifetime medical and dental benefits upon retirement for certain employees meeting the eligibility requirement, which were amended by Wesbanco upon acquisition. Wesbanco recognizes a liability for the projected benefit obligation in the Consolidated Balance Sheets in other liabilities as this plan is unfunded until period payments are made. Wesbanco recognizes fluctuations in the projected benefit obligation through other comprehensive income. The projected benefit obligation is based on the present value of projected medical and dental obligations at an assumed discount rate. Periodic benefit expense includes service cost, interest cost based on an assumed discount rate, and amortization or accretion of actuarial gains and losses, as well as other actuarial assumptions. Refer to Note 12, “Employee Benefit Plans” for further detail.
83
Recent accounting pronouncements—The Financial Accounting Standards Board (“FASB”) issued Accounting Standards Updates (“ASU”) as noted below.
ASU 2023-09 – Income Taxes (Topic 740): Improvements to Income Tax Disclosures
In December 2023, the FASB issued ASU 2023-09, "Income Taxes (Topic 740)." The amendments in this Update related to the rate reconciliation and income taxes paid disclosures and are designed to improve the transparency of income tax disclosures by requiring (1) consistent categories and greater disaggregation of information in the rate reconciliation and (2) income taxes paid disaggregated by jurisdiction. For Wesbanco, the amendments are effective for annual periods beginning after December 15, 2024. Early adoption is permitted for annual financial statements that have not yet been issued or made available for issuance. The adoption of this pronouncement is not expected to have a material impact on the Consolidated Financial Statements.
ASU 2023-08 – Intangibles-Goodwill and Other Crypto Assets (Subtopic 350-60): Accounting for and Disclosure of a Crypto Asset
In December 2023, the FASB issued ASU 2023-08, "Intangibles-Goodwill and Other Crypto Assets (Subtopic 350-60)." The amendments in this Update require that an entity measure crypto assets at fair value in the statement of financial position each reporting period and recognize changes from remeasurement in net income. The amendments also require that an entity provide enhanced disclosures for both annual and interim reporting periods to provide investors with relevant information to analyze and assess the exposure and risk of significant individual crypto asset holdings. In addition, fair value measurement aligns the accounting required for holders of crypto assets with the accounting for entities that are subject to certain industry-specific guidance (such as investment companies) and eliminates the requirement to test those assets for impairment, thereby reducing the associated cost and complexity of applying the current guidance. For Wesbanco, the amendments are effective beginning after December 15, 2024, including interim periods within those fiscal years. Early adoption is permitted. The adoption of this pronouncement is not expected to have a material impact on the Consolidated Financial Statements, as Wesbanco holds no crypto assets.
ASU 2023-07—Segment Reporting (Topic 280): Improvements to Reportable Segment Disclosures
In November 2023, the FASB issued ASU 2023-07, “Improvements to Reportable Segment Disclosures (Topic 280).” The amendments in this Update improve financial reporting by requiring disclosure of incremental segment information on an annual and interim basis for all public entities to enable investors to develop more decision-useful financial analyses. The amendments in this Update do not change how a public entity identifies its operating segments, aggregates those operating segments, or applies the quantitative thresholds to determine its reportable segments. For Wesbanco, the amendments are effective for fiscal years beginning after December 15, 2023, and interim periods within fiscal years beginning after December 15, 2024. Early adoption is permitted. The adoption of this pronouncement is not expected to have a material impact on the Consolidated Financial Statements.
ASU 2023-06 - Disclosure Improvements: Codification Amendments in Response to the SEC’s Disclosure Update and Simplification Initiative
In October 2023, the FASB issued ASU 2023-06, "Disclosure Improvements." For entities subject to the SEC’s existing disclosure requirements and for entities required to file or furnish financial statements with or to the SEC in preparation for the sale of or for purposes of issuing securities that are not subject to contractual restrictions on transfer, the effective date for each amendment will be the date on which the SEC’s removal of that related disclosure from Regulation S-X or Regulation S-K becomes effective. If by June 30, 2027, the SEC has not removed the applicable requirement from Regulation S-X or Regulation S-K, the pending content of the related amendment will be removed from the Codification and will not become effective for any entity. The adoption of this pronouncement is not expected to have a material impact on the Consolidated Financial Statements.
ASU 2023-05 – Business Combinations—Joint Venture Formations (Subtopic 805-60): Recognition and Initial Measurement
In August 2023, the FASB issued ASU 2023-05, "Business Combinations - Joint Venture Formations (Subtopic 805-60): Recognition and Initial Measurement," under which an entity that qualifies as either a joint venture or a corporate joint venture as defined in the FASB Accounting Standards Codification ("ASC") master glossary is required to apply a new basis of accounting upon the formation of the joint venture. Specifically, the ASU provides that a joint venture or a corporate joint venture (collectively, “joint ventures”) must initially measure its assets and liabilities at fair value on the formation date. For Wesbanco, the amendments are effective for all joint ventures within the ASU’s scope that are formed on or after
ASU 2023-04 - Liabilities (Topic 405): Amendments to SEC Paragraphs Pursuant to SEC Staff Accounting Bulletin No. 121 (SEC Update)
In August 2023, the FASB issued ASU 2023-04, "Liabilities (Topic 405): Amendments to SEC Paragraphs Pursuant to SEC Staff Accounting Bulletin No.121." ASU 2023-04 adds various SEC paragraphs to the Codification to reflect guidance included in SEC Staff Accounting Bulletin No. 121 on safeguarding crypto assets. As of December 31, 2023, this ASU does not apply to Wesbanco as Wesbanco does not safeguard crypto assets.
84
ASU 2023-03 - Amendments to SEC Paragraphs Pursuant to SEC Staff Accounting Bulletin No. 120
In July 2023, FASB issued ASU 2023-03, which amends or supersedes various SEC paragraphs within the Codification to conform to past SEC announcements and guidance issued by the SEC. The ASU does not provide any new guidance. Therefore, there is no transition or effective date associated with this update.
ASU 2023-02 – Investments Equity Method and Joint Ventures (Topic 323)
In March 2023, the FASB issued ASU 2023-02, Investments—Equity Method and Joint Ventures (Topic 323): Accounting for Investments in Tax Credit Structures Using the Proportional Amortization Method. ASU 2023-02 allows reporting entities to elect to account for qualifying tax equity investments using the proportional amortization method, regardless of the program giving rise to the related income tax credits. The ASU’s amendments “remove the specialized guidance for [low-income-housing tax credit] investments that are not accounted for using the proportional amortization method and instead require that those LIHTC investments be accounted for using the guidance in other [GAAP].” For Wesbanco, this update was effective on
ASU 2023-01 - Leases (Topic 842): Common Control Arrangements
In March 2023, the FASB issued ASU 2023-01, Leases (Topic 842): Common Control Arrangements. ASU 2023-01 amends certain provisions of ASC 842 that apply to arrangements between related parties under common control. Additionally, ASU 2023-01 amends the accounting for leasehold improvements in common-control arrangements for all entities. For Wesbanco, this update was effective on
ASU 2022-04 - Liabilities – Supplier Finance Programs (Sub-topic 405-50)
In September 2022, the FASB issued ASU 2022-04, “Liabilities—Supplier Finance Programs (Subtopic 405-50).” The amendments in this ASU require that a buyer in a supplier finance program disclose sufficient information about the program to allow a user of financial statements to understand the program’s nature, activity during the period, changes from period to period, and potential magnitude. To achieve that objective, the buyer should disclose qualitative and quantitative information about its supplier finance programs. For Wesbanco, this update was effective on January 1, 2023, except for the amendment on rollforward information, which was effective on
ASU 2022-03 - Fair Value Measurement (Topic 820)
In June 2022, the FASB issued ASU 2022-03, "Fair Value Measurement (Topic 820).” The amendments in this ASU clarify that a contractual restriction on the sale of an equity security is not considered part of the unit of account of the equity security, and therefore, is not considered in measuring fair value. Furthermore, the amendments to this ASU clarify that an entity cannot, as a separate unit of account, recognize and measure a contractual sale restriction. The update to this ASU requires the following disclosures for equity securities: (1) the fair value of equity securities subject to contractual sale restrictions reflected in the balance sheet; (2) the nature and remaining duration of the restriction(s) and; (3) the circumstances that could cause a lapse in the restriction(s). For Wesbanco, this update was effective on
ASU 2022-02 - Financial Instruments - Credit Losses (Topic 326)
In March 2022, the FASB issued ASU 2022-02, "Financial Instruments - Credit Losses (Topic 326)." The amendments in this ASU eliminate the accounting guidance for TDRs by creditors in Subtopic 310-40, "Receivables - Troubled Debt Restructurings by Creditors," while enhancing disclosure requirements for certain loan refinancings and restructurings by creditors when a borrower is experiencing financial difficulty. Specifically, rather than applying the recognition and measurement guidance for TDRs, an entity must apply the loan refinancing and restructuring guidance in paragraphs 310-20-35-9 through 35-11 to determine whether a modification results in a new loan or a continuation of an existing loan. In addition, for public business entities, the amendments in this Update require that an entity disclose current-period gross writeoffs by year of origination for financing receivables and net investments in leases within the scope of Subtopic 326-20, "Financial Instruments - Credit Losses - Measured at Amortized Cost." For Wesbanco, this update was effective beginning on
ASU 2020-04, ASU 2021-01 and ASU 2022-06 - Reference Rate Reform (Topic 848)
In March 2020, the FASB issued ASU 2020-04, “Reference Rate Reform (Topic 848).” This ASU provided temporary, optional guidance to ease the potential burden in accounting for, or recognizing the effects of, the transition away from the London Interbank Offered Rate ("LIBOR") or other reference rate expected to be discontinued on financial reporting. The ASU also provides optional expedients for contract modifications that replace a reference rate affected by reference rate reform. The guidance is effective as of March 12, 2020 through December 31, 2022, and can be adopted at any time during this period. In January 2021, the FASB issued ASU 2021-01, “Reference Rate Reform (Topic 848): Scope.” This ASU refines the scope of Topic 848 and addresses questions about whether
85
Topic 848 can be applied to derivative instruments that do not reference a rate that is expected to be discontinued, but that use an interest rate for margining, discounting or contract price alignment that is expected to be modified as a result of reference rate reform. ASU 2021-01 is effective upon issuance through December 31, 2024, and can be adopted at any time during this period. Wesbanco has not offered LIBOR for any new contracts after December 31, 2021. Wesbanco has chosen the One Month Term Secured Overnight Financing Rate ("1M Term SOFR") as its alternative replacement rate for LIBOR on both back-to-back swaps and on one-month variable loans. A transition plan was implemented in 2021 to identify and modify Wesbanco's loans and other financial instruments with attributes that are either directly or indirectly influenced by LIBOR. In December 2022, the FASB issued ASU 2022-06, “Reference Rate Reform (Topic 848): Deferral of the Sunset Date of Topic 848.” In the Update, the Board decided to defer the sunset date of Topic 848 to December 31, 2024, to permit entities to apply the guidance in Topic 848 through the expected cessation date of USD LIBOR. In the Board’s view, that time frame would have been sufficient to provide flexibility for additional unforeseen changes to the timeline of USD LIBOR cessation and to accommodate global interbank offered rate (IBOR) transition. The update did not have a material impact on Wesbanco’s Consolidated Financial Statements. At December 31, 2023, Wesbanco has completed its transition away from LIBOR.
NOTE 2. EARNINGS PER COMMON SHARE
Earnings per common share are calculated as follows:
|
|
For the Years Ended December 31, |
|
|||||||||
(in thousands, except shares and per share amounts) |
|
2023 |
|
|
2022 |
|
|
2021 |
|
|||
Numerator for both basic and diluted earnings per common share: |
|
|
|
|
|
|
|
|
|
|||
Net income available to common shareholders |
|
$ |
|
|
$ |
|
|
$ |
|
|||
Denominator: |
|
|
|
|
|
|
|
|
|
|||
Total average basic common shares outstanding |
|
|
|
|
|
|
|
|
|
|||
Effect of dilutive stock options and other stock compensation |
|
|
|
|
|
|
|
|
|
|||
Total diluted average common shares outstanding |
|
|
|
|
|
|
|
|
|
|||
Earnings per common share—basic |
|
$ |
|
|
$ |
|
|
$ |
|
|||
Earnings per common share—diluted |
|
|
|
|
|
|
|
|
|
|||
As of December 31, 2023, 2022 and 2021, respectively,
As of December 31, 2023,
In addition, performance-based restricted stock compensation totaling
86
NOTE 3. SECURITIES
The following table presents the fair value and amortized cost of available-for-sale and held-to-maturity debt securities:
|
December 31, 2023 |
|
|
December 31, 2022 |
|
||||||||||||||||||||
(in thousands) |
Amortized |
|
Gross |
|
Gross |
|
Estimated |
|
|
Amortized |
|
Gross |
|
Gross |
|
Estimated |
|
||||||||
Available-for-sale debt securities |
|
|
|
|
|
|
|
|
|
|
|
|
|
|
|
|
|
||||||||
U.S. Government sponsored entities and |
$ |
|
$ |
— |
|
$ |
( |
) |
$ |
|
|
$ |
|
$ |
|
$ |
( |
) |
$ |
|
|||||
Residential mortgage-backed securities |
|
|
|
|
|
( |
) |
|
|
|
|
|
|
|
|
( |
) |
|
|
||||||
Commercial mortgage-backed securities |
|
|
|
|
|
( |
) |
|
|
|
|
|
|
— |
|
|
( |
) |
|
|
|||||
Obligations of states and political |
|
|
|
|
|
( |
) |
|
|
|
|
|
|
|
|
( |
) |
|
|
||||||
Corporate debt securities |
|
|
|
— |
|
|
( |
) |
|
|
|
|
|
|
— |
|
|
( |
) |
|
|
||||
Total available-for-sale debt securities |
$ |
|
$ |
|
$ |
( |
) |
$ |
|
|
$ |
|
$ |
|
$ |
( |
) |
$ |
|
||||||
Held-to-maturity debt securities |
|
|
|
|
|
|
|
|
|
|
|
|
|
|
|
|
|
||||||||
U.S. Government sponsored entities and |
$ |
|
$ |
— |
|
$ |
( |
) |
$ |
|
|
$ |
|
$ |
— |
|
$ |
( |
) |
$ |
|
||||
Residential mortgage-backed securities |
|
|
|
— |
|
|
( |
) |
|
|
|
|
|
|
— |
|
|
( |
) |
|
|
||||
Obligations of states and political |
|
|
|
|
|
( |
) |
|
|
|
|
|
|
|
|
( |
) |
|
|
||||||
Corporate debt securities |
|
|
|
— |
|
|
( |
) |
|
|
|
|
|
|
— |
|
|
( |
) |
|
|
||||
Total held-to-maturity debt securities (1) |
$ |
|
$ |
|
$ |
( |
) |
$ |
|
|
$ |
|
$ |
|
$ |
( |
) |
$ |
|
||||||
Total debt securities |
$ |
|
$ |
|
$ |
( |
) |
$ |
|
|
$ |
|
$ |
|
$ |
( |
) |
$ |
|
||||||
(1) Total held-to-maturity debt securities are presented on the balance sheet net of their allowance for credit losses totaling $
At December 31, 2023 and 2022 there were
Equity securities, of which $
The following table presents the amortized cost and fair value of available-for-sale and held-to-maturity debt securities by contractual maturity at December 31, 2023. Actual maturities will differ from contractual maturities because borrowers may have the right to call or prepay debt obligations with or without prepayment penalties. Mortgage-backed securities and collateralized mortgage obligations are classified in the table below based on their contractual maturity date; however, regular principal payments and prepayments of principal are received on a monthly basis.
(in thousands) |
|
Amortized Cost |
|
|
Fair Value |
|
||
Available-for-sale debt securities |
|
|
|
|
|
|
||
Less than one year |
|
$ |
|
|
$ |
|
||
1-5 years |
|
|
|
|
|
|
||
5-10 years |
|
|
|
|
|
|
||
Over 10 years |
|
|
|
|
|
|
||
Total available-for-sale debt securities |
|
$ |
|
|
$ |
|
||
Held-to-maturity debt securities |
|
|
|
|
|
|
||
Less than one year |
|
$ |
|
|
$ |
|
||
1-5 years |
|
|
|
|
|
|
||
5-10 years |
|
|
|
|
|
|
||
Over 10 years |
|
|
|
|
|
|
||
Total held-to-maturity debt securities |
|
$ |
|
|
$ |
|
||
Total debt securities |
|
$ |
|
|
$ |
|
||
87
Securities with an aggregate fair value of $
The following table presents the gross realized gains and losses on sales and calls of available-for-sale and held-to-maturity debt securities, as well as gains and losses on equity securities from both sales and market adjustments for the years ended December 31, 2023, 2022 and 2021, respectively. All gains and losses presented in the table below are included in the net securities gains (losses) line item of the income statement. For those equity securities relating to the key officer and director deferred compensation plan, the corresponding change in the obligation to the participant is recognized in employee benefits expense.
|
|
For the Years Ended December 31, |
|
|||||||||
(in thousands) |
|
2023 |
|
|
2022 |
|
|
2021 |
|
|||
Debt securities: |
|
|
|
|
|
|
|
|
|
|||
Gross realized gains |
|
$ |
|
|
$ |
|
|
$ |
|
|||
Gross realized losses |
|
|
( |
) |
|
|
( |
) |
|
|
( |
) |
Net (losses) gains on debt securities |
|
$ |
( |
) |
|
$ |
|
|
$ |
|
||
Equity securities: |
|
|
|
|
|
|
|
|
|
|||
Unrealized gains (losses) recognized on securities still held |
|
$ |
|
|
$ |
( |
) |
|
$ |
|
||
Net gains (losses) on equity securities |
|
$ |
|
|
$ |
( |
) |
|
$ |
|
||
Net securities gains (losses) |
|
$ |
|
|
$ |
( |
) |
|
$ |
|
||
The corporate and municipal bonds in Wesbanco’s held-to-maturity debt portfolio are analyzed quarterly to determine if an allowance for current expected credit losses is warranted. Wesbanco uses a database of historical financials of all corporate and municipal issuers and actual historic default and recovery rates on rated and non-rated transactions to estimate expected credit losses on an individual security basis. The expected credit losses are adjusted quarterly and are recorded in an allowance for expected credit losses on the balance sheet, which is deducted from the amortized cost basis of the held-to-maturity portfolio as a contra asset. The losses are recorded on the income statement in the provision for credit losses. Accrued interest receivable on held-to-maturity securities, which was $
88
The following table provides a roll-forward of the allowance for credit losses on held-to-maturity securities for the years ended December 31, 2023, 2022 and 2021, respectively:
|
Allowance for Credit Losses By Category |
|
|||||||
|
For the Years Ended December 31, 2023, 2022 and 2021 |
|
|||||||
|
|
|
|
|
|
|
|||
|
|
|
|
|
|
|
|||
|
|
|
|
|
|
|
|||
|
|
|
|
|
|
|
|||
|
Obligations of |
|
|
|
|
|
|||
|
state and |
|
Corporate |
|
|
|
|||
|
political |
|
debt |
|
|
|
|||
(in thousands) |
subdivisions |
|
Securities |
|
Total |
|
|||
Beginning balance at January 1, 2023 |
$ |
|
$ |
|
$ |
|
|||
Current period provision |
|
( |
) |
|
( |
) |
|
( |
) |
Write-offs |
|
— |
|
|
— |
|
|
— |
|
Recoveries |
|
— |
|
|
— |
|
|
— |
|
Ending balance at December 31, 2023 |
$ |
|
$ |
|
$ |
|
|||
|
|
|
|
|
|
|
|||
Beginning balance at January 1, 2022 |
$ |
|
$ |
|
$ |
|
|||
Current period provision |
|
( |
) |
|
( |
) |
|
( |
) |
Write-offs |
|
— |
|
|
— |
|
|
— |
|
Recoveries |
|
— |
|
|
— |
|
|
— |
|
Ending balance at December 31, 2022 |
$ |
|
$ |
|
$ |
|
|||
|
|
|
|
|
|
|
|||
Beginning balance at January 1, 2021 |
$ |
|
$ |
|
$ |
|
|||
Current period provision |
|
|
|
( |
) |
|
( |
) |
|
Write-offs |
|
— |
|
|
— |
|
|
— |
|
Recoveries |
|
— |
|
|
— |
|
|
— |
|
Ending balance at December 31, 2021 |
$ |
|
$ |
|
$ |
|
|||
The following tables provide information on unrealized losses on available-for-sale debt securities that have been in an unrealized loss position for less than twelve months and twelve months or more, for which an allowance for credit losses has not been recorded as of December 31, 2023 and 2022, respectively:
|
|
December 31, 2023 |
|
|||||||||||||||||||||||||||||||||
|
|
Less than 12 months |
|
|
12 months or more |
|
|
Total |
|
|||||||||||||||||||||||||||
(dollars in thousands) |
|
Fair |
|
|
Unrealized |
|
|
# of |
|
|
Fair |
|
|
Unrealized |
|
|
# of |
|
|
Fair |
|
|
Unrealized |
|
|
# of |
|
|||||||||
U.S. Government sponsored |
|
$ |
|
|
$ |
( |
) |
|
|
|
|
$ |
|
|
$ |
( |
) |
|
|
|
|
$ |
|
|
$ |
( |
) |
|
|
|
||||||
Residential mortgage-backed |
|
|
— |
|
|
|
— |
|
|
|
— |
|
|
|
|
|
|
( |
) |
|
|
|
|
|
|
|
|
( |
) |
|
|
|
||||
Commercial mortgage-backed |
|
|
|
|
|
( |
) |
|
|
|
|
|
|
|
|
( |
) |
|
|
|
|
|
|
|
|
( |
) |
|
|
|
||||||
Obligations of states and |
|
|
|
|
|
( |
) |
|
|
|
|
|
|
|
|
( |
) |
|
|
|
|
|
|
|
|
( |
) |
|
|
|
||||||
Corporate debt securities |
|
|
|
|
|
( |
) |
|
|
|
|
|
|
|
|
( |
) |
|
|
|
|
|
|
|
|
( |
) |
|
|
|
||||||
Total temporarily impaired |
|
$ |
|
|
$ |
( |
) |
|
|
|
|
$ |
|
|
$ |
( |
) |
|
|
|
|
$ |
|
|
$ |
( |
) |
|
|
|
||||||
89
|
|
December 31, 2022 |
|
|||||||||||||||||||||||||||||||||
|
|
Less than 12 months |
|
|
12 months or more |
|
|
Total |
|
|||||||||||||||||||||||||||
(dollars in thousands) |
|
Fair |
|
|
Unrealized |
|
|
# of |
|
|
Fair |
|
|
Unrealized |
|
|
# of |
|
|
Fair |
|
|
Unrealized |
|
|
# of |
|
|||||||||
U.S. Government sponsored |
|
$ |
|
|
$ |
( |
) |
|
|
|
|
$ |
|
|
$ |
( |
) |
|
|
|
|
$ |
|
|
$ |
( |
) |
|
|
|
||||||
Residential mortgage-backed |
|
|
|
|
|
( |
) |
|
|
|
|
|
|
|
|
( |
) |
|
|
|
|
|
|
|
|
( |
) |
|
|
|
||||||
Commercial mortgage-backed |
|
|
|
|
|
( |
) |
|
|
|
|
|
|
|
|
( |
) |
|
|
|
|
|
|
|
|
( |
) |
|
|
|
||||||
Obligations of states and |
|
|
|
|
|
( |
) |
|
|
|
|
|
|
|
|
( |
) |
|
|
|
|
|
|
|
|
( |
) |
|
|
|
||||||
Corporate debt securities |
|
|
|
|
|
( |
) |
|
|
|
|
|
|
|
|
( |
) |
|
|
|
|
|
|
|
|
( |
) |
|
|
|
||||||
Total temporarily impaired |
|
$ |
|
|
$ |
( |
) |
|
|
|
|
$ |
|
|
$ |
( |
) |
|
|
|
|
$ |
|
|
$ |
( |
) |
|
|
|
||||||
Unrealized losses on debt securities in the tables above represent temporary fluctuations resulting from changes in market rates in relation to fixed yields. Unrealized losses in the available-for-sale portfolio are accounted for as an adjustment, net of taxes, to other comprehensive income in shareholders’ equity. Wesbanco does not believe the securities presented above are impaired due to reasons of credit quality, as substantially all debt securities are rated above investment grade and all are paying principal and interest according to their contractual terms. Wesbanco does not intend to sell, nor is it more likely than not that it will be required to sell, loss position securities prior to recovery of their cost, and therefore, management believes the unrealized losses detailed above do not require an allowance for credit losses relating to these securities to be recognized.
Securities that do not have readily determinable fair values and for which Wesbanco does not exercise significant influence are carried at cost. Cost method investments consist primarily of FHLB stock totaling $
90
NOTE 4. LOANS AND THE ALLOWANCE FOR CREDIT LOSSES
The recorded investment in loans is presented in the Consolidated Balance Sheets net of deferred loan fees and costs, and discounts on purchased loans. Net deferred loan costs were $
|
|
December 31, |
|
|
December 31, |
|
||
(in thousands) |
|
2023 |
|
|
2022 |
|
||
Commercial real estate: |
|
|
|
|
|
|
||
Land and construction |
|
$ |
|
|
$ |
|
||
Improved property |
|
|
|
|
|
|
||
Total commercial real estate |
|
|
|
|
|
|
||
Commercial and industrial |
|
|
|
|
|
|
||
Residential real estate |
|
|
|
|
|
|
||
Home equity |
|
|
|
|
|
|
||
Consumer |
|
|
|
|
|
|
||
Total portfolio loans |
|
|
|
|
|
|
||
Loans held for sale |
|
|
|
|
|
|
||
Total loans |
|
$ |
|
|
$ |
|
||
Allowance for Credit Losses
The allowance for credit losses under CECL is calculated utilizing the probability of default ("PD")/ loss given default ("LGD"), which is then discounted to net present value. PD is the probability the asset will default within a given time frame and LGD is the percentage of the asset not expected to be collected due to default. The primary macroeconomic drivers of the quantitative model include forecasts of national unemployment and interest rates, as well as modeling adjustments for changes in prepayment speeds, loan risk grades, portfolio mix, concentrations and loan growth. At December 31, 2023, the primary drivers of the allowance model calculation were loan growth, macroeconomic variables, prepayment speeds, qualitative factors for distressed industries, the current rate environment and changes in risk grading. The forecast was based upon a probability weighted approach which is designed to incorporate loss projections from a baseline, upside and downside economy. Due to the nonlinearity of credit losses to the economy, the asymmetry is best captured by evaluating multiple economic scenarios through a probability weighted approach. At year-end, Wesbanco applied a one-year forecast and immediately reverted to historical losses. The national unemployment was projected to be
91
The following tables summarize changes in the allowance for credit losses applicable to each category of the loan portfolio:
|
|
For the Year Ended December 31, 2023 |
|
|||||||||||||||||||||||||||||
(in thousands) |
|
Commercial |
|
|
Commercial |
|
|
Commercial |
|
|
Residential |
|
|
Home |
|
|
Consumer |
|
|
Deposit |
|
|
Total |
|
||||||||
Balance at beginning of year: |
|
|
|
|
|
|
|
|
|
|
|
|
|
|
|
|
|
|
|
|
|
|
|
|
||||||||
Allowance for credit |
|
$ |
|
|
$ |
|
|
$ |
|
|
$ |
|
|
$ |
|
|
$ |
|
|
$ |
|
|
$ |
|
||||||||
Allowance for credit |
|
|
|
|
|
— |
|
|
|
— |
|
|
|
|
|
|
|
|
|
— |
|
|
|
— |
|
|
|
|
||||
Total beginning allowance for |
|
|
|
|
|
|
|
|
|
|
|
|
|
|
|
|
|
|
|
|
|
|
|
|
||||||||
Provision for credit losses: |
|
|
|
|
|
|
|
|
|
|
|
|
|
|
|
|
|
|
|
|
|
|
|
|
||||||||
Provision for loan losses |
|
|
|
|
|
|
|
|
|
|
|
|
|
|
( |
) |
|
|
|
|
|
|
|
|
|
|||||||
Provision for loan commitments |
|
|
|
|
|
|
|
|
|
|
|
( |
) |
|
|
( |
) |
|
|
|
|
|
— |
|
|
|
|
|||||
Total provision for credit |
|
|
|
|
|
|
|
|
|
|
|
|
|
|
( |
) |
|
|
|
|
|
|
|
|
|
|||||||
Charge-offs |
|
|
( |
) |
|
|
( |
) |
|
|
( |
) |
|
|
( |
) |
|
|
( |
) |
|
|
( |
) |
|
|
( |
) |
|
|
( |
) |
Recoveries |
|
|
|
|
|
|
|
|
|
|
|
|
|
|
|
|
|
|
|
|
|
|
|
|
||||||||
Net recoveries (charge-offs) |
|
|
|
|
|
( |
) |
|
|
( |
) |
|
|
|
|
|
( |
) |
|
|
( |
) |
|
|
( |
) |
|
|
( |
) |
||
Balance at end of period: |
|
|
|
|
|
|
|
|
|
|
|
|
|
|
|
|
|
|
|
|
|
|
|
|
||||||||
Allowance for credit |
|
|
|
|
|
|
|
|
|
|
|
|
|
|
|
|
|
|
|
|
|
|
|
|
||||||||
Allowance for credit |
|
|
|
|
|
|
|
|
|
|
|
|
|
|
|
|
|
|
|
|
— |
|
|
|
|
|||||||
Total ending allowance for credit |
|
$ |
|
|
$ |
|
|
$ |
|
|
$ |
|
|
$ |
|
|
$ |
|
|
$ |
|
|
$ |
|
||||||||
(1) Deposit overdrafts of $
(2) The total provision for credit losses - loans and loan commitments is reported in the consolidated statements of income in the provision for credit losses line item, which also includes the provision for credit losses on held-to-maturity securities. For more information on the provision relating to held-to-maturity securities, please see Note 3, "Securities."
92
|
|
For the Year Ended December 31, 2022 |
|
|||||||||||||||||||||||||||||
(in thousands) |
|
Commercial |
|
|
Commercial |
|
|
Commercial |
|
|
Residential |
|
|
Home |
|
|
Consumer |
|
|
Deposit |
|
|
Total |
|
||||||||
Balance at beginning of year: |
|
|
|
|
|
|
|
|
|
|
|
|
|
|
|
|
|
|
|
|
|
|
|
|
||||||||
Allowance for credit |
|
$ |
|
|
$ |
|
|
$ |
|
|
$ |
|
|
$ |
|
|
$ |
|
|
$ |
|
|
$ |
|
||||||||
Allowance for credit |
|
|
|
|
|
|
|
|
|
|
|
|
|
|
|
|
|
|
|
|
— |
|
|
|
|
|||||||
Total beginning allowance for |
|
|
|
|
|
|
|
|
|
|
|
|
|
|
|
|
|
|
|
|
|
|
|
|
||||||||
Provision for credit losses: |
|
|
|
|
|
|
|
|
|
|
|
|
|
|
|
|
|
|
|
|
|
|
|
|
||||||||
Provision for loan losses |
|
|
( |
) |
|
|
( |
) |
|
|
|
|
|
|
|
|
|
|
|
|
|
|
|
|
|
( |
) |
|||||
Provision for loan commitments |
|
|
|
|
|
( |
) |
|
|
( |
) |
|
|
|
|
|
|
|
|
( |
) |
|
|
— |
|
|
|
|
||||
Total provision for credit |
|
|
|
|
|
( |
) |
|
|
|
|
|
|
|
|
|
|
|
( |
) |
|
|
|
|
|
( |
) |
|||||
Charge-offs |
|
|
( |
) |
|
|
( |
) |
|
|
( |
) |
|
|
( |
) |
|
|
( |
) |
|
|
( |
) |
|
|
( |
) |
|
|
( |
) |
Recoveries |
|
|
|
|
|
|
|
|
|
|
|
|
|
|
|
|
|
|
|
|
|
|
|
|
||||||||
Net recoveries (charge-offs) |
|
|
|
|
|
|
|
|
( |
) |
|
|
|
|
|
( |
) |
|
|
( |
) |
|
|
( |
) |
|
|
( |
) |
|||
Balance at end of period: |
|
|
|
|
|
|
|
|
|
|
|
|
|
|
|
|
|
|
|
|
|
|
|
|
||||||||
Allowance for credit |
|
|
|
|
|
|
|
|
|
|
|
|
|
|
|
|
|
|
|
|
|
|
|
|
||||||||
Allowance for credit |
|
|
|
|
|
|
|
|
|
|
|
|
|
|
|
|
|
|
|
|
— |
|
|
|
|
|||||||
Total ending allowance for credit |
|
$ |
|
|
$ |
|
|
$ |
|
|
$ |
|
|
$ |
|
|
$ |
|
|
$ |
|
|
$ |
|
||||||||
(1) Deposit overdrafts of $
(2) The total provision for credit losses - loans and loan commitments is reported in the consolidated statements of income in the provision for credit losses line item, which also includes the provision for credit losses on held-to-maturity securities. For more information on the provision relating to held-to-maturity securities, please see Note 3, "Securities."
93
|
|
For the Year Ended December 31, 2021 |
|
|||||||||||||||||||||||||||||
(in thousands) |
|
Commercial |
|
|
Commercial |
|
|
Commercial |
|
|
Residential |
|
|
Home |
|
|
Consumer |
|
|
Deposit |
|
|
Total |
|
||||||||
Balance at beginning of year: |
|
|
|
|
|
|
|
|
|
|
|
|
|
|
|
|
|
|
|
|
|
|
|
|
||||||||
Allowance for credit |
|
$ |
|
|
$ |
|
|
$ |
|
|
$ |
|
|
$ |
|
|
$ |
|
|
$ |
|
|
$ |
|
||||||||
Allowance for credit |
|
|
|
|
|
|
|
|
|
|
|
|
|
|
|
|
|
|
|
|
— |
|
|
|
|
|||||||
Total beginning allowance for |
|
|
|
|
|
|
|
|
|
|
|
|
|
|
|
|
|
|
|
|
|
|
|
|
||||||||
Provision for credit losses: |
|
|
|
|
|
|
|
|
|
|
|
|
|
|
|
|
|
|
|
|
|
|
|
|
||||||||
Provision for loan losses |
|
|
( |
) |
|
|
( |
) |
|
|
( |
) |
|
|
( |
) |
|
|
( |
) |
|
|
( |
) |
|
|
|
|
|
( |
) |
|
Provision for loan commitments |
|
|
( |
) |
|
|
( |
) |
|
|
|
|
|
|
|
|
|
|
|
|
|
|
— |
|
|
|
( |
) |
||||
Total provision for credit |
|
|
( |
) |
|
|
( |
) |
|
|
( |
) |
|
|
( |
) |
|
|
( |
) |
|
|
( |
) |
|
|
|
|
|
( |
) |
|
Charge-offs |
|
|
( |
) |
|
|
( |
) |
|
|
( |
) |
|
|
( |
) |
|
|
( |
) |
|
|
( |
) |
|
|
( |
) |
|
|
( |
) |
Recoveries |
|
|
|
|
|
|
|
|
|
|
|
|
|
|
|
|
|
|
|
|
|
|
|
|
||||||||
Net recoveries (charge-offs) |
|
|
|
|
|
( |
) |
|
|
( |
) |
|
|
|
|
|
|
|
|
( |
) |
|
|
( |
) |
|
|
( |
) |
|||
Balance at end of period: |
|
|
|
|
|
|
|
|
|
|
|
|
|
|
|
|
|
|
|
|
|
|
|
|
||||||||
Allowance for credit |
|
|
|
|
|
|
|
|
|
|
|
|
|
|
|
|
|
|
|
|
|
|
|
|
||||||||
Allowance for credit |
|
|
|
|
|
|
|
|
|
|
|
|
|
|
|
|
|
|
|
|
— |
|
|
|
|
|||||||
Total ending allowance for credit |
|
$ |
|
|
$ |
|
|
$ |
|
|
$ |
|
|
$ |
|
|
$ |
|
|
$ |
|
|
$ |
|
||||||||
(1) Deposit overdrafts of $
(2) The total provision for credit losses - loans and loan commitments is reported in the consolidated statements of income in the provision for credit losses line item, which also includes the provision for credit losses on held-to-maturity securities. For more information on the provision relating to held-to-maturity securities, please see Note 3, "Securities."
94
The following tables present the allowance for credit losses and recorded investments in loans by category, as of each period-end:
|
|
Allowance for Credit Losses and Recorded Investment in Loans |
|
|||||||||||||||||||||||||||||
(in thousands) |
|
Commercial |
|
|
Commercial |
|
|
Commercial |
|
|
Residential |
|
|
Home |
|
|
Consumer |
|
|
Deposit |
|
|
Total |
|
||||||||
December 31, 2023 |
|
|
|
|
|
|
|
|
|
|
|
|
|
|
|
|
|
|
|
|
|
|
|
|
||||||||
Allowance for credit losses: |
|
|
|
|
|
|
|
|
|
|
|
|
|
|
|
|
|
|
|
|
|
|
|
|
||||||||
Loans individually-evaluated |
|
$ |
|
|
$ |
|
|
$ |
|
|
$ |
— |
|
|
$ |
— |
|
|
$ |
— |
|
|
$ |
— |
|
|
$ |
|
||||
Loans collectively-evaluated |
|
|
|
|
|
|
|
|
|
|
|
|
|
|
|
|
|
|
|
|
|
|
|
|
||||||||
Loan commitments (2) |
|
|
|
|
|
— |
|
|
|
|
|
|
|
|
|
|
|
|
— |
|
|
|
— |
|
|
|
|
|||||
Total allowance for credit |
|
$ |
|
|
$ |
|
|
$ |
|
|
$ |
|
|
$ |
|
|
$ |
|
|
$ |
|
|
$ |
|
||||||||
|
|
|
|
|
|
|
|
|
|
|
|
|
|
|
|
|
|
|
|
|
|
|
|
|
||||||||
Portfolio loans: |
|
|
|
|
|
|
|
|
|
|
|
|
|
|
|
|
|
|
|
|
|
|
|
|
||||||||
Individually-evaluated for credit |
|
$ |
— |
|
|
$ |
|
|
$ |
|
|
$ |
— |
|
|
$ |
— |
|
|
$ |
— |
|
|
$ |
— |
|
|
$ |
|
|||
Collectively-evaluated for credit |
|
|
|
|
|
|
|
|
|
|
|
|
|
|
|
|
|
|
|
|
— |
|
|
|
|
|||||||
Total portfolio loans |
|
$ |
|
|
$ |
|
|
$ |
|
|
$ |
|
|
$ |
|
|
$ |
|
|
$ |
— |
|
|
$ |
|
|||||||
|
|
|
|
|
|
|
|
|
|
|
|
|
|
|
|
|
|
|
|
|
|
|
|
|
||||||||
December 31, 2022 |
|
|
|
|
|
|
|
|
|
|
|
|
|
|
|
|
|
|
|
|
|
|
|
|
||||||||
Allowance for credit losses: |
|
|
|
|
|
|
|
|
|
|
|
|
|
|
|
|
|
|
|
|
|
|
|
|
||||||||
Loans individually-evaluated |
|
$ |
— |
|
|
$ |
|
|
$ |
|
|
$ |
— |
|
|
$ |
— |
|
|
$ |
— |
|
|
$ |
— |
|
|
$ |
|
|||
Loans collectively-evaluated |
|
|
|
|
|
|
|
|
|
|
|
|
|
|
|
|
|
|
|
|
|
|
|
|
||||||||
Loan commitments (2) |
|
|
|
|
|
— |
|
|
|
— |
|
|
|
|
|
|
|
|
|
— |
|
|
|
— |
|
|
|
|
||||
Total allowance for credit |
|
$ |
|
|
$ |
|
|
$ |
|
|
$ |
|
|
$ |
|
|
$ |
|
|
$ |
|
|
$ |
|
||||||||
|
|
|
|
|
|
|
|
|
|
|
|
|
|
|
|
|
|
|
|
|
|
|
|
|
||||||||
Portfolio loans: |
|
|
|
|
|
|
|
|
|
|
|
|
|
|
|
|
|
|
|
|
|
|
|
|
||||||||
Individually-evaluated for credit |
|
$ |
|
|
$ |
|
|
$ |
|
|
$ |
— |
|
|
$ |
— |
|
|
$ |
— |
|
|
$ |
— |
|
|
$ |
|
||||
Collectively-evaluated for credit |
|
|
|
|
|
|
|
|
|
|
|
|
|
|
|
|
|
|
|
|
— |
|
|
|
|
|||||||
Total portfolio loans |
|
$ |
|
|
$ |
|
|
$ |
|
|
$ |
|
|
$ |
|
|
$ |
|
|
$ |
— |
|
|
$ |
|
|||||||
(1) Deposit overdrafts of $
(2) For additional detail relating to loan commitments, see Note 18, "Commitments and Contingent Liabilities".
Commercial Loan Risk Grades
Commercial loan risk grades are determined based on an evaluation of the relevant characteristics of each loan, assigned at inception and adjusted thereafter at any time to reflect changes in the risk profile throughout the life of each loan. The primary factors used to determine the risk grade are the sufficiency, reliability and sustainability of the primary source of repayment and overall financial strength of the borrower. The rating system more heavily weights the debt service coverage, leverage and loan to value factors to derive the risk grade. Other factors that are considered at a lesser weighting include management, industry or property type risks, payment history, collateral or guarantees.
Commercial real estate – land and construction consists of loans to finance investments in vacant land, land development, construction of residential housing, and construction of commercial buildings. Commercial real estate – improved property consists of loans for the purchase or refinance of all types of improved owner-occupied and investment properties. Factors that are considered in assigning the risk grade vary depending on the type of property financed. The risk grade assigned to construction and development loans is based on the overall viability of the project, the experience and financial capacity of the developer or builder to successfully complete the project, project specific and market absorption rates and comparable property values, and the amount of pre-sales for residential housing construction or pre-leases for commercial investment property. The risk grade assigned to commercial investment property loans is based primarily on the adequacy of the net operating income generated by the property to service the debt (“debt service coverage”), the loan to appraised value, the type, quality, industry and mix of tenants, and the terms of leases. The risk grade assigned to owner-occupied commercial real estate is based primarily on global debt service coverage and the leverage of the business, but may also consider the industry in which the business operates, the business’ specific competitive advantages or disadvantages, collateral margins and the quality and experience of management.
C&I loans consist of revolving lines of credit to finance accounts receivable, inventory and other general business purposes; term loans to finance fixed assets other than real estate, and letters of credit to support trade, insurance or governmental requirements for a variety of businesses. Most C&I borrowers are privately-held companies with annual sales up to $
95
considered in risk rating C&I loans include debt service coverage and leverage. Other factors including operating trends, collateral coverage along with management experience are also considered.
Pass loans are those that exhibit a history of positive financial results that are at least comparable to the average for their industry or type of real estate. The primary source of repayment is acceptable and these loans are expected to perform satisfactorily during most economic cycles. Pass loans typically have no significant external factors that are expected to adversely affect these borrowers more than others in the same industry or property type. Any minor unfavorable characteristics of these loans are outweighed or mitigated by other positive factors including but not limited to adequate secondary or tertiary sources of repayment.
Criticized loans, considered as compromised, have potential weaknesses that deserve management's close attention. If left uncorrected, these potential weaknesses may result in deterioration of the repayment prospects for the asset or in the bank's credit position at some future date. Criticized loans are not adversely classified by the banking regulators and do not expose the bank to sufficient risk to warrant adverse classification.
Classified loans, considered as substandard and doubtful, are equivalent to the classifications used by banking regulators. Substandard loans are inadequately protected by the current sound worth and paying capacity of the obligor or of the collateral pledged, if any. Loans so classified must have a well-defined weakness or weaknesses that jeopardize the liquidation of the debt. They are characterized by the distinct possibility that the bank will sustain some loss if the deficiencies are not corrected. These loans may or may not be reported as non-accrual. Doubtful loans have all the weaknesses inherent in those classified substandard, with the added characteristic that the weaknesses make collection or liquidation in full, on the basis of currently known facts, conditions, and values, highly questionable and improbable. These loans are reported as non-accrual.
The following tables summarize commercial loans by their assigned risk grade:
|
|
Commercial Loans by Internally Assigned Risk Grade |
|
|||||||||||||
(in thousands) |
|
Commercial |
|
|
Commercial |
|
|
Commercial |
|
|
Total |
|
||||
As of December 31, 2023 |
|
|
|
|
|
|
|
|
|
|
|
|
||||
Pass |
|
$ |
|
|
$ |
|
|
$ |
|
|
$ |
|
||||
Criticized—compromised |
|
|
|
|
|
|
|
|
|
|
|
|
||||
Classified—substandard |
|
|
|
|
|
|
|
|
|
|
|
|
||||
Classified—doubtful |
|
|
— |
|
|
|
— |
|
|
|
— |
|
|
|
— |
|
Total |
|
$ |
|
|
$ |
|
|
$ |
|
|
$ |
|
||||
|
|
|
|
|
|
|
|
|
|
|
|
|
||||
As of December 31, 2022 |
|
|
|
|
|
|
|
|
|
|
|
|
||||
Pass |
|
$ |
|
|
$ |
|
|
$ |
|
|
$ |
|
||||
Criticized—compromised |
|
|
|
|
|
|
|
|
|
|
|
|
||||
Classified—substandard |
|
|
|
|
|
|
|
|
|
|
|
|
||||
Classified—doubtful |
|
|
— |
|
|
|
— |
|
|
|
— |
|
|
|
— |
|
Total |
|
$ |
|
|
$ |
|
|
$ |
|
|
$ |
|
||||
Residential real estate, home equity and consumer loans are not assigned internal risk grades other than as required by regulatory guidelines that are based primarily on the age of past due loans. Wesbanco primarily evaluates the credit quality of residential real estate, home equity and consumer loans based on repayment performance and historical loss rates. The aggregate amount of residential real estate, home equity and consumer loans classified as substandard in accordance with regulatory guidelines were $
96
Past Due and Nonperforming Loans
The following tables summarize the age analysis of all categories of loans.
|
|
Age Analysis of Loans |
|
|||||||||||||||||||||||||
(in thousands) |
|
Current |
|
|
30-59 Days |
|
|
60-89 Days |
|
|
90 Days |
|
|
Total |
|
|
Total |
|
|
90 Days |
|
|||||||
As of December 31, 2023 |
|
|
|
|
|
|
|
|
|
|
|
|
|
|
|
|
|
|
|
|
|
|||||||
Commercial real estate: |
|
|
|
|
|
|
|
|
|
|
|
|
|
|
|
|
|
|
|
|
|
|||||||
Land and construction |
|
$ |
|
|
$ |
— |
|
|
$ |
— |
|
|
$ |
— |
|
|
$ |
— |
|
|
$ |
|
|
$ |
— |
|
||
Improved property |
|
|
|
|
|
|
|
|
|
|
|
|
|
|
|
|
|
|
|
|
|
|||||||
Total commercial real estate |
|
|
|
|
|
|
|
|
|
|
|
|
|
|
|
|
|
|
|
|
|
|||||||
Commercial and industrial |
|
|
|
|
|
|
|
|
|
|
|
|
|
|
|
|
|
|
|
|
|
|||||||
Residential real estate |
|
|
|
|
|
|
|
|
|
|
|
|
|
|
|
|
|
|
|
|
|
|||||||
Home equity |
|
|
|
|
|
|
|
|
|
|
|
|
|
|
|
|
|
|
|
|
|
|||||||
Consumer |
|
|
|
|
|
|
|
|
|
|
|
|
|
|
|
|
|
|
|
|
|
|||||||
Total portfolio loans |
|
|
|
|
|
|
|
|
|
|
|
|
|
|
|
|
|
|
|
|
|
|||||||
Loans held for sale |
|
|
|
|
|
— |
|
|
|
— |
|
|
|
— |
|
|
|
— |
|
|
|
|
|
|
— |
|
||
Total loans |
|
$ |
|
|
$ |
|
|
$ |
|
|
$ |
|
|
$ |
|
|
$ |
|
|
$ |
|
|||||||
|
|
|
|
|
|
|
|
|
|
|
|
|
|
|
|
|
|
|
|
|
|
|||||||
Nonperforming loans included above are as follows: |
|
|
|
|
|
|
|
|
|
|
|
|
|
|
|
|
|
|
|
|
|
|||||||
Non-accrual loans |
|
$ |
|
|
$ |
|
|
$ |
|
|
$ |
|
|
|
|
|
$ |
|
|
|
|
|||||||
|
|
|
|
|
|
|
|
|
|
|
|
|
|
|
|
|
|
|
|
|
|
|||||||
As of December 31, 2022 |
|
|
|
|
|
|
|
|
|
|
|
|
|
|
|
|
|
|
|
|
|
|||||||
Commercial real estate: |
|
|
|
|
|
|
|
|
|
|
|
|
|
|
|
|
|
|
|
|
|
|||||||
Land and construction |
|
$ |
|
|
$ |
— |
|
|
$ |
|
|
$ |
|
|
$ |
|
|
$ |
|
|
$ |
|
||||||
Improved property |
|
|
|
|
|
|
|
|
|
|
|
|
|
|
|
|
|
|
|
|
|
|||||||
Total commercial real estate |
|
|
|
|
|
|
|
|
|
|
|
|
|
|
|
|
|
|
|
|
|
|||||||
Commercial and industrial |
|
|
|
|
|
|
|
|
|
|
|
|
|
|
|
|
|
|
|
|
|
|||||||
Residential real estate |
|
|
|
|
|
|
|
|
|
|
|
|
|
|
|
|
|
|
|
|
|
|||||||
Home equity |
|
|
|
|
|
|
|
|
|
|
|
|
|
|
|
|
|
|
|
|
|
|||||||
Consumer |
|
|
|
|
|
|
|
|
|
|
|
|
|
|
|
|
|
|
|
|
|
|||||||
Total portfolio loans |
|
|
|
|
|
|
|
|
|
|
|
|
|
|
|
|
|
|
|
|
|
|||||||
Loans held for sale |
|
|
|
|
|
— |
|
|
|
— |
|
|
|
— |
|
|
|
— |
|
|
|
|
|
|
— |
|
||
Total loans |
|
$ |
|
|
$ |
|
|
$ |
|
|
$ |
|
|
$ |
|
|
$ |
|
|
$ |
|
|||||||
|
|
|
|
|
|
|
|
|
|
|
|
|
|
|
|
|
|
|
|
|
|
|||||||
Nonperforming loans included above are as follows: |
|
|
|
|
|
|
|
|
|
|
|
|
|
|
|
|
|
|
|
|
|
|||||||
Non-accrual loans |
|
$ |
|
|
$ |
|
|
$ |
|
|
$ |
|
|
|
|
|
$ |
|
|
|
|
|||||||
TDRs accruing interest (1) |
|
|
|
|
|
|
|
|
|
|
|
|
|
|
|
|
|
|
|
|
|
|||||||
Total non-performing loans |
|
$ |
|
|
$ |
|
|
$ |
|
|
$ |
|
|
$ |
|
|
$ |
|
|
|
|
|||||||
(1) For the table presented as of December 31, 2022, loans 90 days or more past due and accruing interest exclude TDRs
97
The following tables summarize nonperforming loans:
|
|
Nonperforming Loans |
|
|||||||||||||||||||||
|
|
December 31, 2023 |
|
|
December 31, 2022 |
|
||||||||||||||||||
(in thousands) |
|
Unpaid |
|
|
Recorded |
|
|
Related |
|
|
Unpaid |
|
|
Recorded |
|
|
Related |
|
||||||
With no related specific allowance recorded: |
|
|
|
|
|
|
|
|
|
|
|
|
|
|
|
|
|
|
||||||
Commercial real estate: |
|
|
|
|
|
|
|
|
|
|
|
|
|
|
|
|
|
|
||||||
Land and construction |
|
$ |
— |
|
|
$ |
— |
|
|
$ |
— |
|
|
$ |
|
|
$ |
|
|
$ |
— |
|
||
Improved property |
|
|
|
|
|
|
|
|
— |
|
|
|
|
|
|
|
|
|
— |
|
||||
Commercial and industrial |
|
|
|
|
|
|
|
|
— |
|
|
|
|
|
|
|
|
|
— |
|
||||
Residential real estate |
|
|
|
|
|
|
|
|
— |
|
|
|
|
|
|
|
|
|
— |
|
||||
Home equity |
|
|
|
|
|
|
|
|
— |
|
|
|
|
|
|
|
|
|
— |
|
||||
Consumer |
|
|
|
|
|
|
|
|
— |
|
|
|
|
|
|
|
|
|
— |
|
||||
Total nonperforming loans without a specific allowance |
|
|
|
|
|
|
|
|
— |
|
|
|
|
|
|
|
|
|
— |
|
||||
Total nonperforming loans with a specific allowance |
|
|
— |
|
|
|
— |
|
|
|
— |
|
|
|
— |
|
|
|
— |
|
|
|
— |
|
Total nonperforming loans |
|
$ |
|
|
$ |
|
|
$ |
— |
|
|
$ |
|
|
$ |
|
|
$ |
— |
|
||||
(1) The difference between the unpaid principal balance and the recorded investment generally reflects amounts that have been previously charged-off and fair market value adjustments on acquired nonperforming loans.
|
|
Nonperforming Loans |
|
|||||||||||||||||||||
|
|
For the Year |
|
|
For the Year |
|
|
For the Year |
|
|||||||||||||||
(in thousands) |
|
Average |
|
|
Interest |
|
|
Average |
|
|
Interest |
|
|
Average |
|
|
Interest |
|
||||||
With no related specific allowance recorded: |
|
|
|
|
|
|
|
|
|
|
|
|
|
|
|
|
|
|
||||||
Commercial real estate: |
|
|
|
|
|
|
|
|
|
|
|
|
|
|
|
|
|
|
||||||
Land and construction |
|
$ |
|
|
$ |
— |
|
|
$ |
|
|
$ |
|
|
$ |
|
|
$ |
— |
|
||||
Improved property |
|
|
|
|
|
— |
|
|
|
|
|
|
|
|
|
|
|
|
|
|||||
Commercial and industrial |
|
|
|
|
|
— |
|
|
|
|
|
|
|
|
|
|
|
|
|
|||||
Residential real estate |
|
|
|
|
|
— |
|
|
|
|
|
|
|
|
|
|
|
|
|
|||||
Home equity |
|
|
|
|
|
— |
|
|
|
|
|
|
|
|
|
|
|
|
|
|||||
Consumer |
|
|
|
|
|
— |
|
|
|
|
|
|
|
|
|
|
|
|
|
|||||
Total nonperforming loans without a specific allowance |
|
|
|
|
|
— |
|
|
|
|
|
|
|
|
|
|
|
|
|
|||||
With a specific allowance recorded: |
|
|
|
|
|
|
|
|
|
|
|
|
|
|
|
|
|
|
||||||
Commercial real estate: |
|
|
|
|
|
|
|
|
|
|
|
|
|
|
|
|
|
|
||||||
Land and construction |
|
|
— |
|
|
|
— |
|
|
|
— |
|
|
|
— |
|
|
|
— |
|
|
|
— |
|
Improved property |
|
|
— |
|
|
|
— |
|
|
|
— |
|
|
|
— |
|
|
|
|
|
|
— |
|
|
Commercial and industrial |
|
|
— |
|
|
|
— |
|
|
|
— |
|
|
|
— |
|
|
|
— |
|
|
|
— |
|
Residential real estate |
|
|
— |
|
|
|
— |
|
|
|
— |
|
|
|
— |
|
|
|
— |
|
|
|
— |
|
Home equity |
|
|
— |
|
|
|
— |
|
|
|
— |
|
|
|
— |
|
|
|
— |
|
|
|
— |
|
Consumer |
|
|
— |
|
|
|
— |
|
|
|
— |
|
|
|
— |
|
|
|
— |
|
|
|
— |
|
Total nonperforming loans with a specific allowance |
|
|
— |
|
|
|
— |
|
|
|
— |
|
|
|
— |
|
|
|
|
|
|
— |
|
|
Total nonperforming loans |
|
$ |
|
|
$ |
— |
|
|
$ |
|
|
$ |
|
|
$ |
|
|
$ |
|
|||||
The following table summarizes the recognition of interest income on nonperforming loans:
|
|
For the years ended December 31, |
|
|||||||||
(in thousands) |
|
2023 |
|
|
2022 |
|
|
2021 |
|
|||
Average nonperforming loans |
|
$ |
|
|
$ |
|
|
$ |
|
|||
Amount of contractual interest income on nonperforming loans |
|
|
|
|
|
|
|
|
|
|||
Amount of interest income recognized on nonperforming loans |
|
|
— |
|
|
|
|
|
|
|
||
98
The following table presents the recorded investment in non-accrual loans:
|
|
Non-accrual Loans (1) |
|
|||||
(in thousands) |
|
December 31, 2023 |
|
|
December 31, 2022 |
|
||
Commercial real estate: |
|
|
|
|
|
|
||
Land and construction |
|
$ |
— |
|
|
$ |
|
|
Improved property |
|
|
|
|
|
|
||
Total commercial real estate |
|
|
|
|
|
|
||
Commercial and industrial |
|
|
|
|
|
|
||
Residential real estate |
|
|
|
|
|
|
||
Home equity |
|
|
|
|
|
|
||
Consumer |
|
|
|
|
|
|
||
Total |
|
$ |
|
|
$ |
|
||
(1) At December 31, 2023, there were
Modifications for Borrowers Experiencing Financial Difficulty (following the adoption of ASU 2022-02)
Tables in this section exclude the financial effects of modifications for loans that were paid off or are otherwise no longer in the loan portfolio as of period end.
|
|
For the Year Ended December 31, 2023 |
|
|||||||||||||
(unaudited, in thousands) |
|
Term |
|
|
Payment |
|
|
Total |
|
|
% of |
|
||||
Commercial real estate - land and construction |
|
$ |
— |
|
|
$ |
— |
|
|
$ |
— |
|
|
|
— |
|
Commercial real estate - improved property |
|
|
|
|
|
|
|
|
|
|
|
|
||||
Commercial and industrial |
|
|
|
|
|
|
|
|
|
|
|
|
||||
Residential real estate |
|
|
— |
|
|
|
|
|
|
|
|
|
|
|||
Home equity |
|
|
|
|
|
|
|
|
|
|
|
|
||||
Consumer |
|
|
— |
|
|
|
|
|
|
|
|
|
|
|||
Total |
|
$ |
|
|
$ |
|
|
$ |
|
|
|
|
||||
Unfunded loan commitments on modifications for borrowers experiencing financial difficulty ("MBEFDs") totaled $
The following table summarizes the financial impacts of loan modifications and payment deferrals made to portfolio loans during the year ended December 31, 2023, presented by loan category:
|
|
For the Year Ended December 31, 2023 |
|
|
(unaudited, in thousands) |
|
Weighted-Average |
|
|
Commercial real estate - land and construction |
|
|
— |
|
Commercial real estate - improved property |
|
|
|
|
Commercial and industrial |
|
|
|
|
Residential real estate |
|
|
— |
|
Home equity |
|
|
|
|
Consumer |
|
|
— |
|
99
The following table summarizes loans with MBEFDs which defaulted (defined as 90 days past due) during the 12 months after the loan was modified. Modified loans, including those that have defaulted, are already included in the allowance for credit losses through the various methodologies used to estimate the allowance. As such,
|
|
For the Year Ended December 31, 2023 |
|
|
(unaudited, in thousands) |
|
Term Extension |
|
|
Commercial real estate - land and construction |
|
$ |
— |
|
Commercial real estate - improved property |
|
|
|
|
Commercial and industrial |
|
|
|
|
Residential real estate |
|
|
— |
|
Home equity |
|
|
— |
|
Consumer |
|
|
— |
|
Total loans that subsequently defaulted |
|
|
|
|
The following table presents an aging analysis of portfolio loans that were modified on or after January 1, 2023, the date that Wesbanco adopted ASU 2022-02, by loan category, as of December 31, 2023:
|
|
December 31, 2023 |
|
|||||||||||||||||||||
(unaudited, in thousands) |
|
30-59 Days |
|
|
60-89 Days |
|
|
90 Days |
|
|
Total |
|
|
Current |
|
|
Total |
|
||||||
Commercial real estate - land and construction |
|
$ |
— |
|
|
$ |
— |
|
|
$ |
— |
|
|
$ |
— |
|
|
$ |
— |
|
|
$ |
— |
|
Commercial real estate - improved property |
|
|
|
|
|
— |
|
|
|
|
|
|
|
|
|
|
|
|
|
|||||
Commercial and industrial |
|
|
— |
|
|
|
|
|
|
|
|
|
|
|
|
|
|
|
|
|||||
Residential real estate |
|
|
— |
|
|
|
|
|
|
|
|
|
|
|
|
|
|
|
|
|||||
Home equity |
|
|
— |
|
|
|
|
|
|
|
|
|
|
|
|
|
|
|
|
|||||
Consumer |
|
|
|
|
|
|
|
|
|
|
|
|
|
|
|
|
|
|
||||||
Total modified loans (1) |
|
|
|
|
|
|
|
|
|
|
|
|
|
|
|
|
|
|
||||||
(1) Represents balance at period end.
Troubled Debt Restructuring Disclosures (prior to the adoption of ASU 2022-02)
The following tables present details related to loans identified as TDRs during the year ended December 31, 2022:
|
|
TDRs |
|
|||||||||
|
|
December 31, 2022 |
|
|||||||||
(in thousands) |
|
Accruing |
|
|
Non-Accrual |
|
|
Total |
|
|||
Commercial real estate: |
|
|
|
|
|
|
|
|
|
|||
Land and construction |
|
$ |
— |
|
|
$ |
— |
|
|
$ |
— |
|
Improved property |
|
|
|
|
|
|
|
|
|
|||
Total commercial real estate |
|
|
|
|
|
|
|
|
|
|||
Commercial and industrial |
|
|
|
|
|
— |
|
|
|
|
||
Residential real estate |
|
|
|
|
|
|
|
|
|
|||
Home equity |
|
|
|
|
|
|
|
|
|
|||
Consumer |
|
|
|
|
|
— |
|
|
|
|
||
Total |
|
$ |
|
|
$ |
|
|
$ |
|
|||
100
|
|
New TDRs (1) |
|
|||||||||
(dollars in thousands) |
|
Number of |
|
|
Pre- |
|
|
Post- |
|
|||
Commercial real estate: |
|
|
|
|
|
|
|
|
|
|||
Land and construction |
|
|
|
|
$ |
|
|
$ |
— |
|
||
Improved property |
|
|
|
|
|
|
|
|
— |
|
||
Total commercial real estate |
|
|
|
|
|
|
|
|
— |
|
||
Commercial and industrial |
|
|
— |
|
|
|
— |
|
|
|
— |
|
Residential real estate |
|
|
— |
|
|
|
— |
|
|
|
— |
|
Home equity |
|
|
— |
|
|
|
— |
|
|
|
— |
|
Consumer |
|
|
— |
|
|
|
— |
|
|
|
— |
|
Total |
|
|
|
|
$ |
|
|
$ |
— |
|
||
(1) Excludes loans that were either paid off or charged-off by period end. The pre-modification balance represents the balance outstanding at the beginning of the period. The post-modification balance represents the outstanding balance at period end.
There were
101
The following table summarizes amortized cost basis loan balances by year of origination and credit quality indicator.
|
|
Loans As of December 31, 2023 |
|
|
|
|
|
|
|
|
|
|
||||||||||||||||||||||||
|
|
Amortized Cost Basis by Origination Year |
|
|
|
|
|
|
|
|
|
|
||||||||||||||||||||||||
(in thousands) |
|
2023 |
|
|
2022 |
|
|
2021 |
|
|
2020 |
|
|
2019 |
|
|
Prior |
|
|
Revolving Loans Amortized Cost Basis |
|
|
Revolving Loans Converted to Term |
|
|
Total |
|
|||||||||
Commercial real estate: land and construction |
|
|
|
|
||||||||||||||||||||||||||||||||
Risk rating: |
|
|
|
|
|
|
|
|
|
|
|
|
|
|
|
|
|
|
|
|
|
|
|
|
|
|
|
|||||||||
Pass |
|
$ |
|
|
$ |
|
|
$ |
|
|
$ |
|
|
$ |
|
|
$ |
|
|
$ |
|
|
$ |
|
|
$ |
|
|||||||||
Criticized - compromised |
|
|
— |
|
|
|
— |
|
|
|
— |
|
|
|
— |
|
|
|
— |
|
|
|
|
|
|
|
|
|
|
|
|
|
||||
Classified - substandard |
|
|
— |
|
|
|
— |
|
|
|
— |
|
|
|
— |
|
|
|
— |
|
|
|
|
|
|
— |
|
|
|
— |
|
|
|
|
||
Classified - doubtful |
|
|
— |
|
|
|
— |
|
|
|
— |
|
|
|
— |
|
|
|
— |
|
|
|
— |
|
|
|
— |
|
|
|
— |
|
|
|
— |
|
Total |
|
$ |
|
|
$ |
|
|
$ |
|
|
$ |
|
|
$ |
|
|
$ |
|
|
$ |
|
|
$ |
|
|
$ |
|
|||||||||
Current-period gross charge-offs |
|
$ |
— |
|
|
$ |
— |
|
|
$ |
— |
|
|
$ |
— |
|
|
$ |
— |
|
|
$ |
— |
|
|
$ |
— |
|
|
$ |
|
|
$ |
|
||
|
|
|
|
|
|
|
|
|
|
|
|
|
|
|
|
|
|
|
|
|
|
|
|
|
|
|
|
|||||||||
Commercial real estate: improved property |
|
|
|
|
||||||||||||||||||||||||||||||||
Risk rating: |
|
|
|
|
|
|
|
|
|
|
|
|
|
|
|
|
|
|
|
|
|
|
|
|
|
|
|
|||||||||
Pass |
|
$ |
|
|
$ |
|
|
$ |
|
|
$ |
|
|
$ |
|
|
$ |
|
|
$ |
|
|
$ |
|
|
$ |
|
|||||||||
Criticized - compromised |
|
|
— |
|
|
|
|
|
|
|
|
|
|
|
|
|
|
|
|
|
|
|
|
|
|
|
|
|
||||||||
Classified - substandard |
|
|
|
|
|
|
|
|
|
|
|
|
|
|
|
|
|
|
|
|
— |
|
|
|
|
|
|
|
||||||||
Classified - doubtful |
|
|
— |
|
|
|
— |
|
|
|
— |
|
|
|
— |
|
|
|
— |
|
|
|
— |
|
|
|
— |
|
|
|
— |
|
|
|
— |
|
Total |
|
$ |
|
|
$ |
|
|
$ |
|
|
$ |
|
|
$ |
|
|
$ |
|
|
$ |
|
|
$ |
|
|
$ |
|
|||||||||
Current-period gross charge-offs |
|
$ |
— |
|
|
$ |
— |
|
|
$ |
|
|
$ |
— |
|
|
$ |
— |
|
|
$ |
|
|
$ |
— |
|
|
$ |
— |
|
|
$ |
|
|||
|
|
|
|
|
|
|
|
|
|
|
|
|
|
|
|
|
|
|
|
|
|
|
|
|
|
|
|
|||||||||
Commercial and industrial |
|
|
|
|
||||||||||||||||||||||||||||||||
Risk rating: |
|
|
|
|
|
|
|
|
|
|
|
|
|
|
|
|
|
|
|
|
|
|
|
|
|
|
|
|||||||||
Pass |
|
$ |
|
|
$ |
|
|
$ |
|
|
$ |
|
|
$ |
|
|
$ |
|
|
$ |
|
|
$ |
|
|
$ |
|
|||||||||
Criticized - compromised |
|
|
|
|
|
|
|
|
|
|
|
|
|
|
|
|
|
|
|
|
|
|
|
|
|
|
|
|||||||||
Classified - substandard |
|
|
|
|
|
|
|
|
|
|
|
|
|
|
|
|
|
|
|
|
|
|
|
|
|
|
|
|||||||||
Classified - doubtful |
|
|
— |
|
|
|
— |
|
|
|
— |
|
|
|
— |
|
|
|
— |
|
|
|
— |
|
|
|
— |
|
|
|
— |
|
|
|
— |
|
Total |
|
$ |
|
|
$ |
|
|
$ |
|
|
$ |
|
|
$ |
|
|
$ |
|
|
$ |
|
|
$ |
|
|
$ |
|
|||||||||
Current-period gross charge-offs |
|
$ |
|
|
$ |
|
|
$ |
|
|
$ |
|
|
$ |
|
|
$ |
|
|
$ |
— |
|
|
$ |
|
|
$ |
|
||||||||
|
|
|
|
|
|
|
|
|
|
|
|
|
|
|
|
|
|
|
|
|
|
|
|
|
|
|
|
|||||||||
Residential real estate |
|
|
|
|
||||||||||||||||||||||||||||||||
Loan delinquency: |
|
|
|
|
|
|
|
|
|
|
|
|
|
|
|
|
|
|
|
|
|
|
|
|
|
|
|
|||||||||
Current |
|
$ |
|
|
$ |
|
|
$ |
|
|
$ |
|
|
$ |
|
|
$ |
|
|
$ |
— |
|
|
$ |
|
|
$ |
|
||||||||
30-59 days past due |
|
|
— |
|
|
|
— |
|
|
|
— |
|
|
|
— |
|
|
|
— |
|
|
|
|
|
|
— |
|
|
|
— |
|
|
|
|
||
60-89 days past due |
|
|
— |
|
|
|
— |
|
|
|
— |
|
|
|
|
|
|
— |
|
|
|
|
|
|
— |
|
|
|
— |
|
|
|
|
|||
90 days or more past due |
|
|
— |
|
|
|
|
|
|
|
|
|
— |
|
|
|
|
|
|
|
|
|
— |
|
|
|
|
|
|
|
||||||
Total |
|
$ |
|
|
$ |
|
|
$ |
|
|
$ |
|
|
$ |
|
|
$ |
|
|
$ |
— |
|
|
$ |
|
|
$ |
|
||||||||
Current-period gross charge-offs |
|
$ |
— |
|
|
$ |
— |
|
|
$ |
— |
|
|
$ |
— |
|
|
$ |
|
|
$ |
|
|
$ |
— |
|
|
$ |
— |
|
|
$ |
|
|||
|
|
|
|
|
|
|
|
|
|
|
|
|
|
|
|
|
|
|
|
|
|
|
|
|
|
|
|
|||||||||
Home equity |
|
|
|
|
||||||||||||||||||||||||||||||||
Loan delinquency: |
|
|
|
|
|
|
|
|
|
|
|
|
|
|
|
|
|
|
|
|
|
|
|
|
|
|
|
|||||||||
Current |
|
$ |
|
|
$ |
|
|
$ |
|
|
$ |
|
|
$ |
|
|
$ |
|
|
$ |
|
|
$ |
|
|
$ |
|
|||||||||
30-59 days past due |
|
|
|
|
|
|
|
|
|
|
|
|
|
|
|
|
|
|
|
|
|
|
|
— |
|
|
|
|
||||||||
60-89 days past due |
|
|
|
|
|
|
|
|
|
|
|
|
|
|
|
|
|
|
|
|
— |
|
|
|
|
|
|
|
||||||||
90 days or more past due |
|
|
— |
|
|
|
|
|
|
— |
|
|
|
|
|
|
|
|
|
|
|
|
— |
|
|
|
|
|
|
|
||||||
Total |
|
$ |
|
|
$ |
|
|
$ |
|
|
$ |
|
|
$ |
|
|
$ |
|
|
$ |
|
|
$ |
|
|
$ |
|
|||||||||
Current-period gross charge-offs |
|
$ |
— |
|
|
$ |
|
|
$ |
|
|
$ |
|
|
$ |
|
|
$ |
|
|
$ |
|
|
$ |
— |
|
|
$ |
|
|||||||
|
|
|
|
|
|
|
|
|
|
|
|
|
|
|
|
|
|
|
|
|
|
|
|
|
|
|
|
|||||||||
Consumer |
|
|
|
|
||||||||||||||||||||||||||||||||
Loan delinquency: |
|
|
|
|
|
|
|
|
|
|
|
|
|
|
|
|
|
|
|
|
|
|
|
|
|
|
|
|||||||||
Current |
|
$ |
|
|
$ |
|
|
$ |
|
|
$ |
|
|
$ |
|
|
$ |
|
|
$ |
|
|
$ |
|
|
$ |
|
|||||||||
30-59 days past due |
|
|
|
|
|
|
|
|
|
|
|
|
|
|
|
|
|
|
|
|
|
|
|
— |
|
|
|
|
||||||||
60-89 days past due |
|
|
|
|
|
|
|
|
|
|
|
|
|
|
|
|
|
|
|
|
— |
|
|
|
— |
|
|
|
|
|||||||
90 days or more past due |
|
|
|
|
|
|
|
|
|
|
|
|
|
|
|
|
|
|
|
|
— |
|
|
|
— |
|
|
|
|
|||||||
Total |
|
$ |
|
|
$ |
|
|
$ |
|
|
$ |
|
|
$ |
|
|
$ |
|
|
$ |
|
|
$ |
|
|
$ |
|
|||||||||
Current-period gross charge-offs |
|
$ |
|
|
$ |
|
|
$ |
|
|
$ |
|
|
$ |
|
|
$ |
|
|
$ |
|
|
$ |
— |
|
|
$ |
|
||||||||
102
|
|
Loans As of December 31, 2022 |
|
|
|
|
|
|
|
|
|
|
||||||||||||||||||||||||
|
|
Amortized Cost Basis by Origination Year |
|
|
|
|
|
|
|
|
|
|
||||||||||||||||||||||||
(unaudited, in thousands) |
|
2022 |
|
|
2021 |
|
|
2020 |
|
|
2019 |
|
|
2018 |
|
|
Prior |
|
|
Revolving Loans Amortized Cost Basis |
|
|
Revolving Loans Converted to Term |
|
|
Total |
|
|||||||||
Commercial real estate: land and construction |
|
|
|
|
||||||||||||||||||||||||||||||||
Risk rating: |
|
|
|
|
|
|
|
|
|
|
|
|
|
|
|
|
|
|
|
|
|
|
|
|
|
|
|
|||||||||
Pass |
|
$ |
|
|
$ |
|
|
$ |
|
|
$ |
|
|
$ |
|
|
$ |
|
|
$ |
|
|
$ |
|
|
$ |
|
|||||||||
Criticized - compromised |
|
|
|
|
|
|
|
|
— |
|
|
|
— |
|
|
|
|
|
|
|
|
|
— |
|
|
|
|
|
|
|
||||||
Classified - substandard |
|
|
— |
|
|
|
— |
|
|
|
|
|
|
— |
|
|
|
— |
|
|
|
|
|
|
— |
|
|
|
|
|
|
|
||||
Classified - doubtful |
|
|
— |
|
|
|
— |
|
|
|
— |
|
|
|
— |
|
|
|
— |
|
|
|
— |
|
|
|
— |
|
|
|
— |
|
|
|
— |
|
Total |
|
$ |
|
|
$ |
|
|
$ |
|
|
$ |
|
|
$ |
|
|
$ |
|
|
$ |
|
|
$ |
|
|
$ |
|
|||||||||
Current-period gross charge-offs |
|
$ |
— |
|
|
$ |
— |
|
|
$ |
— |
|
|
$ |
— |
|
|
$ |
|
|
$ |
— |
|
|
$ |
— |
|
|
$ |
— |
|
|
$ |
|
||
|
|
|
|
|
|
|
|
|
|
|
|
|
|
|
|
|
|
|
|
|
|
|
|
|
|
|
|
|||||||||
Commercial real estate: improved property |
|
|
|
|
||||||||||||||||||||||||||||||||
Risk rating: |
|
|
|
|
|
|
|
|
|
|
|
|
|
|
|
|
|
|
|
|
|
|
|
|
|
|
|
|||||||||
Pass |
|
$ |
|
|
$ |
|
|
$ |
|
|
$ |
|
|
$ |
|
|
$ |
|
|
$ |
|
|
$ |
|
|
$ |
|
|||||||||
Criticized - compromised |
|
|
|
|
|
|
|
|
|
|
|
|
|
|
|
|
|
|
|
|
|
|
|
— |
|
|
|
|
||||||||
Classified - substandard |
|
|
— |
|
|
|
|
|
|
|
|
|
|
|
|
|
|
|
|
|
|
|
|
|
— |
|
|
|
|
|||||||
Classified - doubtful |
|
|
— |
|
|
|
— |
|
|
|
— |
|
|
|
— |
|
|
|
— |
|
|
|
— |
|
|
|
— |
|
|
|
— |
|
|
|
— |
|
Total |
|
$ |
|
|
$ |
|
|
$ |
|
|
$ |
|
|
$ |
|
|
$ |
|
|
$ |
|
|
$ |
|
|
$ |
|
|||||||||
Current-period gross charge-offs |
|
$ |
— |
|
|
$ |
— |
|
|
$ |
|
|
$ |
|
|
$ |
|
|
$ |
|
|
$ |
— |
|
|
$ |
— |
|
|
$ |
|
|||||
|
|
|
|
|
|
|
|
|
|
|
|
|
|
|
|
|
|
|
|
|
|
|
|
|
|
|
|
|||||||||
Commercial and industrial |
|
|
|
|
||||||||||||||||||||||||||||||||
Risk rating: |
|
|
|
|
|
|
|
|
|
|
|
|
|
|
|
|
|
|
|
|
|
|
|
|
|
|
|
|||||||||
Pass |
|
$ |
|
|
$ |
|
|
$ |
|
|
$ |
|
|
$ |
|
|
$ |
|
|
$ |
|
|
$ |
|
|
$ |
|
|||||||||
Criticized - compromised |
|
|
|
|
|
|
|
|
|
|
|
|
|
|
|
|
|
|
|
|
|
|
|
|
|
|
|
|||||||||
Classified - substandard |
|
|
|
|
|
|
|
|
|
|
|
|
|
|
|
|
|
|
|
|
|
|
|
|
|
|
|
|||||||||
Classified - doubtful |
|
|
— |
|
|
|
— |
|
|
|
— |
|
|
|
— |
|
|
|
— |
|
|
|
— |
|
|
|
— |
|
|
|
— |
|
|
|
— |
|
Total |
|
$ |
|
|
$ |
|
|
$ |
|
|
$ |
|
|
$ |
|
|
$ |
|
|
$ |
|
|
$ |
|
|
$ |
|
|||||||||
Current-period gross charge-offs |
|
$ |
— |
|
|
$ |
|
|
$ |
|
|
$ |
|
|
$ |
|
|
$ |
|
|
$ |
— |
|
|
$ |
|
|
$ |
|
|||||||
|
|
|
|
|
|
|
|
|
|
|
|
|
|
|
|
|
|
|
|
|
|
|
|
|
|
|
|
|||||||||
Residential real estate |
|
|
|
|
||||||||||||||||||||||||||||||||
Loan delinquency: |
|
|
|
|
|
|
|
|
|
|
|
|
|
|
|
|
|
|
|
|
|
|
|
|
|
|
|
|||||||||
Current |
|
$ |
|
|
$ |
|
|
$ |
|
|
$ |
|
|
$ |
|
|
$ |
|
|
$ |
— |
|
|
$ |
|
|
$ |
|
||||||||
30-59 days past due |
|
|
— |
|
|
|
— |
|
|
|
— |
|
|
|
— |
|
|
|
— |
|
|
|
|
|
|
— |
|
|
|
— |
|
|
|
|
||
60-89 days past due |
|
|
— |
|
|
|
|
|
|
|
|
|
|
|
|
— |
|
|
|
|
|
|
— |
|
|
|
— |
|
|
|
|
|||||
90 days or more past due |
|
|
— |
|
|
|
— |
|
|
|
— |
|
|
|
|
|
|
|
|
|
|
|
|
— |
|
|
|
|
|
|
|
|||||
Total |
|
$ |
|
|
$ |
|
|
$ |
|
|
$ |
|
|
$ |
|
|
$ |
|
|
$ |
— |
|
|
$ |
|
|
$ |
|
||||||||
Current-period gross charge-offs |
|
$ |
— |
|
|
$ |
— |
|
|
$ |
— |
|
|
$ |
— |
|
|
$ |
|
|
$ |
|
|
$ |
— |
|
|
$ |
— |
|
|
$ |
|
|||
|
|
|
|
|
|
|
|
|
|
|
|
|
|
|
|
|
|
|
|
|
|
|
|
|
|
|
|
|||||||||
Home equity |
|
|
|
|
||||||||||||||||||||||||||||||||
Loan delinquency: |
|
|
|
|
|
|
|
|
|
|
|
|
|
|
|
|
|
|
|
|
|
|
|
|
|
|
|
|||||||||
Current |
|
$ |
|
|
$ |
|
|
$ |
|
|
$ |
|
|
$ |
|
|
$ |
|
|
$ |
|
|
$ |
|
|
$ |
|
|||||||||
30-59 days past due |
|
|
|
|
|
|
|
|
|
|
|
|
|
|
|
|
|
|
|
|
|
|
|
|
|
|
|
|||||||||
60-89 days past due |
|
|
— |
|
|
|
|
|
|
— |
|
|
|
|
|
|
|
|
|
|
|
|
— |
|
|
|
|
|
|
|
||||||
90 days or more past due |
|
|
— |
|
|
|
— |
|
|
|
|
|
|
|
|
|
|
|
|
|
|
|
|
|
|
|
|
|
|
|||||||
Total |
|
$ |
|
|
$ |
|
|
$ |
|
|
$ |
|
|
$ |
|
|
$ |
|
|
$ |
|
|
$ |
|
|
$ |
|
|||||||||
Current-period gross charge-offs |
|
$ |
— |
|
|
$ |
— |
|
|
$ |
— |
|
|
$ |
— |
|
|
$ |
— |
|
|
$ |
|
|
$ |
— |
|
|
$ |
|
|
$ |
|
|||
|
|
|
|
|
|
|
|
|
|
|
|
|
|
|
|
|
|
|
|
|
|
|
|
|
|
|
|
|||||||||
Consumer |
|
|
|
|
||||||||||||||||||||||||||||||||
Loan delinquency: |
|
|
|
|
|
|
|
|
|
|
|
|
|
|
|
|
|
|
|
|
|
|
|
|
|
|
|
|||||||||
Current |
|
$ |
|
|
$ |
|
|
$ |
|
|
$ |
|
|
$ |
|
|
$ |
|
|
$ |
|
|
$ |
|
|
$ |
|
|||||||||
30-59 days past due |
|
|
|
|
|
|
|
|
|
|
|
|
|
|
|
|
|
|
|
|
|
|
|
— |
|
|
|
|
||||||||
60-89 days past due |
|
|
|
|
|
|
|
|
|
|
|
|
|
|
|
|
|
|
|
|
— |
|
|
|
— |
|
|
|
|
|||||||
90 days or more past due |
|
|
|
|
|
|
|
|
|
|
|
|
|
|
|
|
|
|
|
|
— |
|
|
|
— |
|
|
|
|
|||||||
Total |
|
$ |
|
|
$ |
|
|
$ |
|
|
$ |
|
|
$ |
|
|
$ |
|
|
$ |
|
|
$ |
|
|
$ |
|
|||||||||
Current-period gross charge-offs |
|
$ |
|
|
$ |
|
|
$ |
|
|
$ |
|
|
$ |
|
|
$ |
|
|
$ |
— |
|
|
$ |
|
|
$ |
|
||||||||
The following table summarizes other real estate owned and repossessed assets included in other assets:
|
|
December 31, |
|
|||||
(in thousands) |
|
2023 |
|
|
2022 |
|
||
Other real estate owned |
|
$ |
|
|
$ |
|
||
Repossessed assets |
|
|
|
|
|
|
||
Total other real estate owned and repossessed assets |
|
$ |
|
|
$ |
|
||
Residential real estate included in other real estate owned was $
103
NOTE 5. PREMISES AND EQUIPMENT
Premises and equipment include:
|
|
December 31, |
|
|||||
(in thousands) |
|
2023 |
|
|
2022 |
|
||
Land and improvements |
|
$ |
|
|
$ |
|
||
Buildings and improvements |
|
|
|
|
|
|
||
Furniture and equipment |
|
|
|
|
|
|
||
Total cost |
|
|
|
|
|
|
||
Accumulated depreciation and amortization |
|
|
( |
) |
|
|
( |
) |
Right of use assets |
|
|
|
|
|
|
||
Total premises and equipment, net |
|
$ |
|
|
$ |
|
||
Depreciation and amortization expense of premises and equipment charged to operations for the years ended December 31, 2023, 2022 and 2021 was $
Operating leases are recorded as a right of use (“ROU”) asset and operating lease liability, included in premises and equipment, net and other liabilities, respectively, on the consolidated balance sheet. Operating lease ROU assets represent the right to use an underlying asset during the lease term and operating lease liabilities represent our obligation to make lease payments arising from the lease. ROU assets and operating lease liabilities are recognized at lease commencement based on the present value of the remaining lease payments using a discount rate that represents our incremental borrowing rate at the lease commencement date. Operating lease expense, which is comprised of amortization of the ROU asset and the implicit interest accreted on the operating lease liability, is recognized on a straight-line basis over the lease term, and is recorded primarily in net occupancy expense in the consolidated statements of income.
Operating leases relate primarily to bank branches, office space and license agreements with remaining lease terms of generally
Finance leases relate primarily to bank branches, equipment and office space with remaining lease terms of generally
Future minimum lease payments under non-cancellable leases with initial or remaining lease terms in excess of one year at December 31, 2023 are as follows (in thousands):
Year |
|
Operating Leases |
|
Finance Leases |
|
Total |
|
|||
2024 |
|
$ |
|
$ |
|
$ |
|
|||
2025 |
|
|
|
|
|
|
|
|||
2026 |
|
|
|
|
|
|
|
|||
2027 |
|
|
|
|
|
|
|
|||
2028 |
|
|
|
|
|
|
|
|||
2029 and thereafter |
|
|
|
|
|
|
|
|||
Total lease payments |
|
$ |
|
$ |
|
$ |
|
|||
Less: capitalized interest |
|
|
( |
) |
|
( |
) |
|
( |
) |
Present value of lease liabilities |
|
$ |
|
$ |
|
$ |
|
|||
104
NOTE 6. GOODWILL AND OTHER INTANGIBLE ASSETS
Wesbanco’s Consolidated Balance Sheets include goodwill of $
The following table shows Wesbanco’s capitalized other intangible assets and related accumulated amortization:
|
|
December 31, |
|
|||||
(in thousands) |
|
2023 |
|
|
2022 |
|
||
Other intangible assets: |
|
|
|
|
|
|
||
Gross carrying amount |
|
$ |
|
|
$ |
|
||
Accumulated amortization |
|
|
( |
) |
|
|
( |
) |
Net carrying amount of other intangible assets |
|
$ |
|
|
$ |
|
||
The following table shows the amortization on Wesbanco’s other intangible assets for each of the next five years (in thousands):
Year |
|
Amount |
|
|
2024 |
|
$ |
|
|
2025 |
|
|
|
|
2026 |
|
|
|
|
2027 |
|
|
|
|
2028 |
|
|
|
|
2029 and thereafter |
|
|
|
|
Total |
|
$ |
|
|
105
NOTE 7. INVESTMENTS IN LIMITED PARTNERSHIPS
Wesbanco is a limited partner in several tax-advantaged limited partnerships whose purpose is to invest in approved low-income housing investment tax credit projects. These investments are accounted for using the equity method of accounting and are included in other assets in the Consolidated Balance Sheets. The limited partnerships are considered to be VIEs as they generally do not have equity investors with voting rights or have equity investors that do not provide sufficient financial resources to support their activities. The VIEs have not been consolidated because Wesbanco is not considered the primary beneficiary. All of Wesbanco’s investments in limited partnerships are privately held, and their market values are not readily available. As of December 31, 2023 and 2022, Wesbanco had $
Wesbanco is also a limited partner in
The following table presents the scheduled equity commitments to be paid to the limited partnerships over the next five years and in the aggregate thereafter as of December 31, 2023:
Year |
|
Amount |
|
|
2024 |
|
$ |
|
|
2025 |
|
|
|
|
2026 |
|
|
|
|
2027 |
|
|
|
|
2028 |
|
|
|
|
2029 and thereafter |
|
|
|
|
Total |
|
$ |
|
|
NOTE 8. CERTIFICATES OF DEPOSIT
Certificates of deposit in denominations of $250 thousand or more were $
At December 31, 2023, the scheduled maturities of total certificates of deposit are as follows (in thousands):
Year |
|
Amount |
|
|
2024 |
|
$ |
|
|
2025 |
|
|
|
|
2026 |
|
|
|
|
2027 |
|
|
|
|
2028 |
|
|
|
|
2029 and thereafter |
|
|
|
|
Total |
|
$ |
|
|
106
NOTE 9. FHLB AND OTHER SHORT-TERM BORROWINGS
Wesbanco is a member of the FHLB system. Wesbanco’s FHLB borrowings, which consist of borrowings from the FHLB of Pittsburgh are secured by a blanket lien by the FHLB on certain residential mortgages and other loan types or securities with a market value in excess of the outstanding balances of the borrowings. As of December 31, 2023 and 2022, Wesbanco had FHLB borrowings of $
The following table presents the aggregate annual maturities and weighted-average interest rates of FHLB borrowings at December 31, 2023 based on their contractual maturity dates and interest rates (dollars in thousands):
Year |
|
Scheduled |
|
|
Weighted |
|
||
2024 |
|
$ |
|
|
|
% |
||
2025 |
|
|
|
|
|
% |
||
2026 |
|
|
— |
|
|
|
— |
|
2027 |
|
|
— |
|
|
|
— |
|
2028 |
|
|
— |
|
|
|
— |
|
2029 and thereafter |
|
|
— |
|
|
|
— |
|
Total |
|
$ |
|
|
|
% |
||
Other short-term borrowings of $
107
NOTE 10. SUBORDINATED DEBT AND JUNIOR SUBORDINATED DEBT
Wesbanco issued $
Certain trusts, consisting of Wesbanco Capital Trust II, Wesbanco Capital Statutory Trust III, Wesbanco Capital Trusts IV, V and VI, Oak Hill Capital Trusts 2, 3 and 4, Community Bank Shares Statutory Trusts I and II and First Federal Statutory Trust II are all wholly-owned trust subsidiaries of Wesbanco formed for the purpose of issuing Trust Preferred Securities (“Trust Preferred Securities”) into a pool of other financial services entity trust preferred securities, and lending the proceeds to Wesbanco. The Trust Preferred Securities were issued and sold in private placement offerings. The proceeds from the sale of the securities and the issuance of common stock by the Trusts were invested in Junior Subordinated Deferrable Interest Debentures (“Junior Subordinated Debt”) issued by Wesbanco and former acquired banks, which are the sole assets of the Trusts. The Trusts pay dividends on the Trust Preferred Securities at the same rate as the distributions paid by Wesbanco on the Junior Subordinated Debt held by the Trusts. The Trusts provide Wesbanco with the option to defer payment of interest on the Junior Subordinated Debt for an aggregate of
The Junior Subordinated Debt is presented as a separate category of long-term debt on the Consolidated Balance Sheets. For regulatory purposes, at December 31, 2023, all such securities are counted as Tier 2 capital subject to limits. The Trust Preferred Securities provide the issuer with a unique capital instrument that has a tax-deductible interest feature not normally associated with the equity of a corporation.
The following table shows Wesbanco’s trust subsidiaries with outstanding Trust Preferred Securities as of December 31, 2023:
(in thousands) |
|
Trust |
|
|
Common |
|
|
Junior |
|
|
Stated |
|
Optional |
|||
Wesbanco Capital Trust II (1) |
|
$ |
|
|
$ |
|
|
$ |
|
|
|
|||||
Wesbanco Capital Statutory Trust III (2) |
|
|
|
|
|
|
|
|
|
|
|
|||||
Wesbanco Capital Trust IV (3) |
|
|
|
|
|
|
|
|
|
|
|
|||||
Wesbanco Capital Trust V (3) |
|
|
|
|
|
|
|
|
|
|
|
|||||
Wesbanco Capital Trust VI (4) |
|
|
|
|
|
|
|
|
|
|
|
|||||
Oak Hill Capital Trust 2 (5) |
|
|
|
|
|
|
|
|
|
|
|
|||||
Oak Hill Capital Trust 3 (6) |
|
|
|
|
|
|
|
|
|
|
|
|||||
Oak Hill Capital Trust 4 (7) |
|
|
|
|
|
|
|
|
|
|
|
|||||
Community Bank Shares Statutory Trust I (3) |
|
|
|
|
|
|
|
|
|
|
|
|||||
Community Bank Shares Statutory Trust II (8) |
|
|
|
|
|
|
|
|
|
|
|
|||||
First Federal Statutory Trust II (9) |
|
|
|
|
|
|
|
|
|
|
|
|||||
Total |
|
$ |
|
|
$ |
|
|
$ |
|
|
|
|
|
|||
108
NOTE 11. DERIVATIVES AND HEDGING ACTIVITIES
Risk Management Objective of Using Derivatives
Wesbanco is exposed to certain risks arising from both its business operations and economic conditions. Wesbanco principally manages its exposures to a wide variety of business and operational risks through management of its core business activities. Wesbanco manages economic risks, including interest rate, liquidity and credit risk, primarily by managing the amount, sources and duration of its assets and liabilities. Wesbanco’s existing interest rate derivatives result from a service provided to certain qualifying customers and, therefore, are not used to manage interest rate risk in Wesbanco’s assets or liabilities. Wesbanco manages a matched book with respect to its derivative instruments in order to minimize its net risk exposure resulting from such transactions. A matched book is when the Bank’s assets and liabilities are equally distributed but also have similar maturities.
Loan Swaps
Wesbanco executes interest rate swaps and interest rate caps with commercial banking customers to facilitate their respective risk management strategies. Those interest rate swaps and caps are simultaneously economically hedged by offsetting interest rate swaps and caps that Wesbanco executes with a third party, such that Wesbanco minimizes its net risk exposure resulting from such transactions. Because the interest rate swaps and caps associated with this program do not meet the hedge accounting requirements of ASC 815, changes in the fair value of both the customer swaps and caps and the offsetting third-party swaps and caps are recognized directly in earnings. As of December 31, 2023 and 2022, Wesbanco had
Risk participation agreements are entered into as financial guarantees of performance on interest rate swap derivatives. The purchased asset or sold liability allows Wesbanco to participate-in (fee received) or participate-out (fee paid) the risk associated with certain derivative positions executed by the borrower of the lead bank in a loan syndication. As of December 31, 2023 and 2022, Wesbanco had
Mortgage Loans Held for Sale and Interest Rate Lock Commitments
Certain residential mortgage loans are originated for sale in the secondary mortgage loan market. These loans are classified as held for sale and carried at fair value as Wesbanco has elected the fair value option. Fair value is determined based on rates obtained from the secondary market for loans with similar characteristics. Wesbanco sells loans to the secondary market on either a mandatory or best efforts basis. The loans sold on a mandatory basis are not committed to an investor until the loan is closed with the borrower. Wesbanco enters into forward to be announced (“TBA”) contracts to manage the interest rate risk between the lock commitment and the closing of the loan. The total balance of forward TBA contracts entered into was $
Fair Values of Derivative Instruments on the Balance Sheet
All derivatives are carried on the consolidated balance sheet at fair value. Derivative assets are classified in the consolidated balance sheet under other assets, and derivative liabilities are classified in the consolidated balance sheet under other liabilities. Changes in fair value are recognized in earnings. None of Wesbanco’s derivatives are designated in qualifying hedging relationships under ASC 815.
109
The table below presents the fair value of Wesbanco’s derivative financial instruments as well as their classification on the Balance Sheet as of December 31, 2023 and 2022:
|
|
December 31, 2023 |
|
|
December 31, 2022 |
|
||||||||||||||||||
(in thousands) |
|
Notional or |
|
|
|
|
|
|
Notional or |
|
|
Asset |
|
|
Liability |
|
||||||||
Derivatives |
|
|
|
|
|
|
|
|
|
|
|
|
|
|
|
|
|
|
||||||
Loan Swaps: |
|
|
|
|
|
|
|
|
|
|
|
|
|
|
|
|
|
|
||||||
Interest rate swaps and caps |
|
$ |
|
|
$ |
|
|
$ |
|
|
$ |
|
|
$ |
|
|
$ |
|
||||||
Other contracts: |
|
|
|
|
|
|
|
|
|
|
|
|
|
|
|
|
|
|
||||||
Interest rate lock commitments |
|
|
|
|
|
|
|
|
— |
|
|
|
|
|
|
— |
|
|
|
|
||||
Forward TBA contracts |
|
|
|
|
|
— |
|
|
|
|
|
|
|
|
|
|
|
|
— |
|
||||
Total derivatives |
|
|
|
|
$ |
|
|
$ |
|
|
|
|
|
$ |
|
|
$ |
|
||||||
Effect of Derivative Instruments on the Income Statement
The table below presents the change in the fair value of the Company’s derivative financial instruments reflected within the other non-interest income line item of the consolidated income statement for the years ended December 31, 2023, 2022 and 2021, respectively.
|
|
|
|
For the Years Ended December 31, |
|
|||||||||
(in thousands) |
|
Location of Gain/(Loss) |
|
2023 |
|
|
2022 |
|
|
2021 |
|
|||
Interest rate swaps and caps |
|
|
$ |
( |
) |
|
$ |
|
|
$ |
|
|||
Interest rate lock commitments |
|
|
|
|
|
|
( |
) |
|
|
( |
) |
||
Forward TBA contracts |
|
|
|
|
|
|
|
|
|
|
||||
Total |
|
|
|
$ |
( |
) |
|
$ |
|
|
$ |
|
||
Credit Risk Related Contingent Features
Wesbanco has agreements with its derivative counterparties that contain a provision where if Wesbanco defaults on any of its indebtedness, including default where repayment of the indebtedness has not been accelerated by the lender, then Wesbanco could also be declared in default on its derivative obligations.
Wesbanco also has agreements with certain of its derivative counterparties that contain a provision where if Wesbanco fails to maintain its status as either a “well-" or “adequately-capitalized” institution, then the counterparty could terminate the derivative positions and Wesbanco would be required to settle its obligations under the agreements.
Dependent upon the net present value of the underlying swaps, Wesbanco has minimum collateral posting thresholds with certain of its derivative counterparties. If Wesbanco had breached any of these provisions at December 31, 2023, it could have been required to settle its obligations under the agreements at the termination value and would have been required to pay any additional amounts due in excess of amounts previously posted as collateral with the respective counterparty. In certain market situations, Wesbanco can also request collateral from the derivative counterparties. Due to the current higher interest rate environment, as of December 31, 2023, Wesbanco is holding net cash collateral from various derivative counterparties totaling $
110
NOTE 12. EMPLOYEE BENEFIT PLANS
Defined Benefit Pension Plan— The Wesbanco, Inc. Defined Benefit Pension Plan (“the Plan”) established on January 1, 1985, is a non-contributory, defined benefit pension plan. The Plan covers all employees of Wesbanco and its subsidiaries who were hired on or before August 1, 2007 who satisfy minimum age and length of service requirements. Benefits of the Plan are generally based on years of service and the employee’s compensation during the last
The benefit obligations and funded status of the Plan are as follows:
|
|
December 31, |
|
|||||
(dollars in thousands) |
|
2023 |
|
|
2022 |
|
||
Accumulated benefit obligation at end of year |
|
$ |
|
|
$ |
|
||
Change in projected benefit obligation: |
|
|
|
|
|
|
||
Projected benefit obligation at beginning of year |
|
$ |
|
|
$ |
|
||
Service cost |
|
|
|
|
|
|
||
Interest cost |
|
|
|
|
|
|
||
Actuarial loss (gain) |
|
|
|
|
|
( |
) |
|
Benefits paid |
|
|
( |
) |
|
|
( |
) |
Projected benefit obligation at end of year |
|
$ |
|
|
$ |
|
||
Change in fair value of plan assets: |
|
|
|
|
|
|
||
Fair value of plan assets at beginning of year |
|
$ |
|
|
$ |
|
||
Actual return on plan assets |
|
|
|
|
|
( |
) |
|
Employer contribution |
|
|
— |
|
|
|
— |
|
Benefits paid |
|
|
( |
) |
|
|
( |
) |
Fair value of plan assets at end of year |
|
$ |
|
|
$ |
|
||
Amounts recognized in the statement of financial position: |
|
|
|
|
|
|
||
Funded status |
|
$ |
|
|
$ |
|
||
Net amounts recognized as receivable pension costs in the |
|
$ |
|
|
$ |
|
||
Amounts recognized in accumulated other comprehensive |
|
|
|
|
|
|
||
Unrecognized prior service credit |
|
$ |
( |
) |
|
$ |
( |
) |
Unrecognized net loss |
|
|
( |
) |
|
|
|
|
Net amounts recognized in accumulated other comprehensive |
|
$ |
( |
) |
|
$ |
|
|
Weighted average assumptions used to determine benefit obligations: |
|
|
|
|
|
|
||
Discount rate |
|
|
% |
|
|
% |
||
Rate of compensation increase |
|
|
% |
|
|
% |
||
Expected long-term return on assets |
|
|
% |
|
|
% |
||
111
The components of and weighted-average assumptions used to determine net periodic benefit costs are as follows:
|
|
For the Years Ended December 31, |
|
|||||||||
(dollars in thousands) |
|
2023 |
|
|
2022 |
|
|
2021 |
|
|||
Components of net periodic benefit cost: |
|
|
|
|
|
|
|
|
|
|||
Service cost—benefits earned during year |
|
$ |
|
|
$ |
|
|
$ |
|
|||
Interest cost on projected benefit obligation |
|
|
|
|
|
|
|
|
|
|||
|
|
( |
) |
|
|
( |
) |
|
|
( |
) |
|
|
|
( |
) |
|
|
( |
) |
|
|
( |
) |
|
Amortization of net loss |
|
|
|
|
|
|
|
|
|
|||
Net periodic pension income |
|
$ |
( |
) |
|
$ |
( |
) |
|
$ |
( |
) |
Other changes in plan assets and benefit obligations recognized in other |
|
|
|
|
|
|
|
|
|
|||
Net loss (gain) for period |
|
$ |
( |
) |
|
$ |
|
|
$ |
( |
) |
|
Prior service credit |
|
|
— |
|
|
|
— |
|
|
|
— |
|
Amortization of prior service credit |
|
|
|
|
|
|
|
|
|
|||
Amortization of net loss |
|
|
( |
) |
|
|
( |
) |
|
|
( |
) |
Total recognized in other comprehensive loss (income) |
|
$ |
( |
) |
|
$ |
|
|
$ |
( |
) |
|
Total recognized in net periodic pension cost and other comprehensive |
|
$ |
( |
) |
|
$ |
( |
) |
|
$ |
( |
) |
Weighted-average assumptions used to determine net periodic |
|
|
|
|
|
|
|
|
|
|||
Discount rate |
|
|
% |
|
|
% |
|
|
% |
|||
Rate of compensation increase |
|
|
% |
|
|
% |
|
|
% |
|||
Expected long-term return on assets |
|
|
% |
|
|
% |
|
|
% |
|||
As permitted under ASC 715-30-35-13, the amortization of any prior service cost is determined using a straight-line amortization of the cost over the average remaining service period of employees expected to receive benefits under the Plan.
The expected long-term rate of return for the Plan’s total assets is based on the expected return of each of the Plan asset categories, weighted based on the median of the target allocation for each class.
Pension Plan Investment Policy and Strategy— The investment policy as established by the Pension and Post-Retirement Plan Committee, to be followed by the Trustee, which is Wesbanco’s Trust and Investment Services department, is to invest assets based on the target allocations shown in the table below. Assets are reallocated periodically by the Trustee based on the ranges set forth by the Committee to meet the target allocations. The investment policy is also subject to review periodically to determine if the policy should be changed. Plan assets are to be invested with the principal objective of maximizing long-term total return without exposing Plan assets to undue risk, taking into account the Plan’s funding needs and benefit obligations. Assets are to be invested in a balanced portfolio composed primarily of equities, fixed income, alternative asset funds and cash or cash equivalent money market investments.
In 2021, the Committee adopted certain changes to the investment policy for the Defined Benefit Pension Plan that recognizes over time the return requirements and risk tolerance of the plan will change. Based on an assessment of the long-term goals and desired risk levels, the Committee approved the development of a glide path that adjusts the target allocations as the Plan’s funded status changes. Given the United States pension regulations and demographics of the Plan, a more risk averse investment approach is deemed appropriate to reduce the funded status volatility. Thus, modifications were made to the return seeking portfolio and the liability hedging portfolio as detailed in the plan. The revised Plan notes that return seeking assets generally consist of investments that focus on price appreciation with returns that, over the long term, are above the interest costs of the Plan. Thus, the policy set target allocations to return seeking assets and rebalanced the ranges for the same. Additionally, the investment policy statement was changed to note that liability hedging assets will be investment grade fixed income investments and are expected to generally behave like the Plan’s liabilities. Since these assets focus mainly on current income, their expected long-term returns will generally be lower than return seeking assets. The policy provides that based on the hedge path, the mix of short term, intermediate term, and long term fixed income holdings will vary. As a result, there will not be set target allocations and ranges for each maturity category, but rather to the hedge path target. Changes to the Plan’s holdings, as noted in the chart below, reflect the changes implemented pursuant to the change in the investment policy statement. At December 31, 2023 and 2022, the Plan’s equity securities included
112
The following table sets forth the Plan’s weighted-average asset allocations by asset category:
|
|
Target |
|
|
|
|
|
|
||
|
|
Allocation |
|
December 31, |
|
|||||
|
|
for 2023 |
|
2023 |
|
|
2022 |
|
||
Asset Category: |
|
|
|
|
|
|
|
|
||
Equity securities |
|
|
|
% |
|
|
% |
|||
Debt securities |
|
|
|
% |
|
|
% |
|||
Cash and cash equivalents |
|
|
|
% |
|
|
% |
|||
Total |
|
|
|
|
% |
|
|
% |
||
The fair values of Wesbanco’s pension plan assets at December 31, 2023 and 2022, by asset category are as follows:
|
|
|
|
|
December 31, 2023 |
|
||||||||||
|
|
|
|
|
Fair Value Measurements Using: |
|
||||||||||
(in thousands) |
|
Assets at Fair |
|
|
Quoted Prices in |
|
|
Significant |
|
|
Significant |
|
||||
Defined benefit pension plan assets: |
|
|
|
|
|
|
|
|
|
|
|
|
||||
Registered investment companies |
|
$ |
|
|
$ |
|
|
$ |
— |
|
|
$ |
— |
|
||
Equity securities |
|
|
|
|
|
|
|
|
— |
|
|
|
— |
|
||
Corporate debt securities |
|
|
|
|
|
— |
|
|
|
|
|
|
— |
|
||
Municipal obligations |
|
|
|
|
|
— |
|
|
|
|
|
|
— |
|
||
Residential mortgage-backed securities and collateralized |
|
|
|
|
|
— |
|
|
|
|
|
|
— |
|
||
Total defined benefit pension plan assets (1) |
|
$ |
|
|
$ |
|
|
$ |
|
|
$ |
— |
|
|||
|
|
|
|
|
December 31, 2022 |
|
||||||||||
|
|
|
|
|
Fair Value Measurements Using: |
|
||||||||||
(in thousands) |
|
Assets at Fair |
|
|
Quoted Prices in |
|
|
Significant |
|
|
Significant |
|
||||
Defined benefit pension plan assets: |
|
|
|
|
|
|
|
|
|
|
|
|
||||
Registered investment companies |
|
$ |
|
|
$ |
|
|
$ |
— |
|
|
$ |
— |
|
||
Equity securities |
|
|
|
|
|
|
|
|
— |
|
|
|
— |
|
||
Corporate debt securities |
|
|
|
|
|
— |
|
|
|
|
|
|
— |
|
||
Municipal obligations |
|
|
|
|
|
— |
|
|
|
|
|
|
— |
|
||
Residential mortgage-backed securities and collateralized |
|
|
|
|
|
— |
|
|
|
|
|
|
— |
|
||
Total defined benefit pension plan assets (1) |
|
$ |
|
|
$ |
|
|
$ |
|
|
$ |
— |
|
|||
Registered investment companies and equity securities: Valued at the closing price reported on the active market on which the individual securities are traded.
Corporate debt securities, municipal obligations, and U.S. government sponsored entities and agency securities: Valued at fair value based on models that consider criteria such as dealer quotes, available trade data, issuer creditworthiness, market movements, sector news, and bond and swap yield curves.
Cash Flows— Wesbanco has no required minimum contribution to the Plan for 2024 and as of December 31, 2023 does
113
The following table presents estimated benefits to be paid in each of the next five years and in aggregate for all years thereafter (in thousands):
Year |
|
Amount |
|
|
2024 |
|
$ |
|
|
2025 |
|
|
|
|
2026 |
|
|
|
|
2027 |
|
|
|
|
2028 |
|
|
|
|
2029 and thereafter |
|
|
|
|
Total |
|
$ |
|
|
FFKT Postretirement Medical Benefit Plan— Wesbanco assumed FFKT’s postretirement medical benefit plan upon acquisition, which had a liability totaling $
The benefit obligation and funded status of the plan are as follows:
|
|
December 31, |
|
|||||
(dollars in thousands) |
|
2023 |
|
|
2022 |
|
||
Change in projected benefit obligation: |
|
|
|
|
|
|
||
Projected benefit obligation at beginning of year |
|
$ |
|
|
$ |
|
||
Interest cost |
|
|
|
|
|
|
||
Actuarial gain |
|
|
( |
) |
|
|
( |
) |
Participant contributions |
|
|
|
|
|
|
||
Benefits paid |
|
|
( |
) |
|
|
( |
) |
Projected benefit obligation at end of year |
|
$ |
|
|
$ |
|
||
Amounts recognized in the statement of financial position: |
|
|
|
|
|
|
||
Funded status |
|
$ |
|
|
$ |
|
||
Net amounts recognized as receivable pension costs in the consolidated balance sheets |
|
$ |
|
|
$ |
|
||
Amounts recognized in accumulated other comprehensive income consist of: |
|
|
|
|
|
|
||
Unrecognized net (gain) loss |
|
$ |
( |
) |
|
$ |
( |
) |
Prior service cost |
|
|
( |
) |
|
|
( |
) |
Net amounts recognized in accumulated other comprehensive income (before tax) |
|
$ |
( |
) |
|
$ |
( |
) |
Weighted average assumptions used to determine benefit obligations: |
|
|
|
|
|
|
||
Discount rate |
|
|
% |
|
|
% |
||
Rate of compensation increase |
|
NA |
|
|
NA |
|
||
Expected long-term return on assets |
|
NA |
|
|
NA |
|
||
114
The components of and weighted-average assumptions used to determine net periodic benefit costs are as follows:
|
|
For the Years Ended December 31, |
|
|||||
(dollars in thousands) |
|
2023 |
|
|
2022 |
|
||
Components of net periodic benefit cost: |
|
|
|
|
|
|
||
Interest cost on projected benefit obligation |
|
$ |
|
|
$ |
|
||
Amortization of prior service credit |
|
|
( |
) |
|
|
( |
) |
Amortization of net loss |
|
|
( |
) |
|
|
|
|
Net periodic pension cost |
|
$ |
( |
) |
|
$ |
|
|
Other changes in plan benefit obligations recognized in other comprehensive income: |
|
|
|
|
|
|
||
Prior service cost for period |
|
$ |
— |
|
|
$ |
— |
|
Net gain for the period |
|
|
( |
) |
|
|
( |
) |
Amortization of prior service credit |
|
|
|
|
|
|
||
Amortization of net loss |
|
|
|
|
|
( |
) |
|
Total recognized in other comprehensive income |
|
$ |
|
|
$ |
( |
) |
|
Total recognized in net periodic pension cost and other comprehensive income |
|
$ |
|
|
$ |
( |
) |
|
Weighted-average assumptions used to determine net periodic pension cost: |
|
|
|
|
|
|
||
Discount rate |
|
|
% |
|
|
% |
||
Rate of compensation increase |
|
NA |
|
|
NA |
|
||
Expected long-term return on assets |
|
NA |
|
|
NA |
|
||
The following table presents estimated benefits to be paid in each of the next five years and in aggregate for all years thereafter (in thousands):
Year |
|
Amount |
|
|
2024 |
|
$ |
|
|
2025 |
|
|
|
|
2026 |
|
|
|
|
2027 |
|
|
|
|
2028 |
|
|
|
|
2029 and thereafter |
|
|
|
|
Total |
|
$ |
|
|
401(k) Plan — Wesbanco sponsors a 401(k) plan consisting of a contributory 401(k) profit sharing plan covering substantially all of its employees. Under the provisions of the 401(k) plan, Wesbanco matches a portion of eligible employee contributions based on rates established and approved by the Board of Directors. For each of the past three years, Wesbanco matched
As of December 31, 2023, the 401(k) held
Incentive Bonus, Option and Restricted Stock Plan— The Incentive Bonus, Option and Restricted Stock Plan (the “Incentive Plan”), is a non-qualified plan that includes the following components: an Annual Bonus and a Long-Term Incentive, which included a Total Shareholder Return Plan, a Stock Option component, and a Restricted Stock component for certain key officers of the Company. The components allow for payments of cash, a mixture of cash and stock, granting of stock options, or granting of restricted stock, depending upon the component of the Incentive Plan in which the award is earned, through the attainment of certain performance goals or time-based vesting requirements. Performance goals or service vesting requirements are established by Wesbanco’s Compensation Committee. On April 22, 2021, Wesbanco registered an additional
Effective December 1, 2023, Wesbanco adopted a new incentive-based compensation recovery policy ("clawback policy") in reference to the requirements set forth in Listing Rule 5608 of the corporate governance rules of the NASDAQ Stock Market, and revoked the prior clawback policy that was in effect. Please refer to Exhibit 97 of this form 10-K for the full version of the clawback policy.
115
Annual Bonus
Compensation expense for key officers for the Annual Bonus was $
Stock Options
On May 24, 2023, Wesbanco granted
Compensation expense for the stock option component of the Incentive Plan was $
The total intrinsic value of options exercised was $
The fair value of stock options granted is estimated at the date of grant using the Black-Scholes option-pricing model. This model requires the input of highly subjective assumptions, changes to which can materially affect the fair value estimate. Additionally, there may be other factors that might otherwise have a significant effect on the value of stock options granted that are not considered by the model.
The following table sets forth the significant assumptions used in calculating the fair value of the grants:
|
|
For the Years Ended December 31, |
|
|||||||||
|
|
2023 |
|
|
2022 |
|
|
2021 |
|
|||
Weighted-average life |
|
|
|
|
|
|
||||||
Risk-free interest rate |
|
|
% |
|
|
% |
|
|
% |
|||
Dividend yield |
|
|
% |
|
|
% |
|
|
% |
|||
Volatility factor |
|
|
% |
|
|
% |
|
|
% |
|||
Fair value of the grants |
|
$ |
|
|
$ |
|
|
$ |
|
|||
The weighted-average life assumption is an estimate of the length of time that an employee might hold an option before option exercise, option expiration or employment termination. The weighted-average life assumption was developed using historical experience. Wesbanco used a weighted historical volatility of its common stock price over the weighted average life prior to each issuance as the volatility factor assumption, adjusted for abnormal volatility during certain periods, and current and future dividend payment expectations for the dividend assumption.
The following table shows the activity for the Stock Option component of the Incentive Plan:
|
|
For the Year |
|
|||||
|
|
Number |
|
|
Weighted |
|
||
Outstanding at beginning of the year |
|
|
|
|
$ |
|
||
Granted during the year |
|
|
|
|
|
|
||
Exercised during the year |
|
|
( |
) |
|
|
|
|
Forfeited or expired during the year |
|
|
( |
) |
|
|
|
|
Outstanding at end of the year |
|
|
|
|
$ |
|
||
Exercisable at year end |
|
|
|
|
$ |
|
||
The aggregate intrinsic value of the outstanding shares and the shares exercisable at year-end was $
116
The following table shows the average remaining life of the stock options at December 31, 2023:
Year Issued |
|
Exercisable |
|
|
Exercise |
|
|
Options |
|
|
Weighted |
|
|
Weighted Avg. |
|
|||||
2014 |
|
|
|
|
$ |
|
|
|
|
|
$ |
|
|
|
|
|||||
2015 |
|
|
|
|
|
|
|
|
|
|
|
|
|
|
|
|||||
2016 |
|
|
|
|
|
|
|
|
|
|
|
|
|
|
|
|||||
2017 |
|
|
|
|
|
|
|
|
|
|
|
|
|
|
|
|||||
2018 |
|
|
|
|
|
|
|
|
|
|
|
|
|
|
||||||
2019 |
|
|
|
|
|
|
|
|
|
|
|
|
|
|
|
|||||
2020 |
|
|
|
|
|
|
|
|
|
|
|
|
|
|
|
|||||
2021 |
|
|
|
|
|
|
|
|
|
|
|
|
|
|
|
|||||
2022 |
|
|
|
|
|
|
|
|
|
|
|
|
|
|
|
|||||
2023 |
|
|
— |
|
|
|
— |
|
|
|
|
|
|
|
|
|
|
|||
Total |
|
|
|
|
$ |
|
|
|
|
|
$ |
|
|
|
|
|||||
Restricted Stock
During 2023, Wesbanco granted
Wesbanco also granted
From the 2018 PBRS,
Dividends accrue on the restricted shares once the performance objective is achieved and then are converted into additional shares of restricted stock on the date the cash dividend would have otherwise been paid, but do not vest until the related grant of the restricted shares complete their vesting. Voting rights accrue upon achievement of the performance objective.
Compensation expense relating to all restricted stock was $
117
The following table shows the activity for the Restricted Stock component of the Incentive Plan:
For the Year Ended December 31, 2023 |
|
Restricted |
|
|
Weighted |
|
||
Non-vested at January 1, 2023 |
|
|
|
|
$ |
|
||
Granted during the year |
|
|
|
|
|
|
||
Vested during the year |
|
|
( |
) |
|
|
|
|
Forfeited or expired during the year |
|
|
( |
) |
|
|
|
|
Dividend reinvestment |
|
|
|
|
|
|
||
Non-vested at end of the year |
|
|
|
|
$ |
|
||
Total Shareholder Return Plan
On November 18, 2015, Wesbanco’s Compensation Committee adopted Administrative Rules for a Total Shareholder Return Plan (“TSRP”). The TSRP measures the TSR on Wesbanco common stock over a
Based on the calculation of shareholder return over the measurement period beginning January 1, 2021 and ending December 31, 2023, Wesbanco stock performance measured at the 50th percentile when compared to peer calculations of shareholder return, which meets the target of the 50th percentile. Therefore, in the first quarter of 2024, approximately
Compensation expense relating to the TSR plans was $
118
NOTE 13. REVENUE RECOGNITION
Interest income, net securities gains (losses) and bank-owned life insurance are not in scope of ASC 606, Revenue from Contracts with Customers. For the revenue streams in scope of ASC 606 - trust fees, service charges on deposits, net securities brokerage revenue, debit card sponsorship income, payment processing fees, electronic banking fees, net swap fee and valuation income, mortgage banking income and net gain or loss on sale of other real estate owned and other assets– there are no significant judgments related to the amount and timing of revenue recognition.
The following table summarizes the point of revenue recognition and the income recognized for each of the revenue streams:
|
|
|
|
For the Years Ended December 31, |
|
|||||||
(in thousands) |
|
Point of Revenue |
|
2023 |
|
2022 |
|
2021 |
|
|||
Revenue Streams |
|
|
|
|
|
|
|
|
|
|||
Trust fees |
|
|
|
|
|
|
|
|
|
|||
Trust account fees |
|
|
$ |
|
$ |
|
$ |
|
||||
WesMark fees |
|
|
|
|
|
|
|
|
||||
Total trust fees |
|
|
|
|
|
|
|
|
|
|||
Service charges on deposits |
|
|
|
|
|
|
|
|
|
|||
Commercial banking fees |
|
|
|
|
|
|
|
|
||||
Personal service charges |
|
|
|
|
|
|
|
|
||||
Total service charges on deposits |
|
|
|
|
|
|
|
|
|
|||
Net securities brokerage revenue |
|
|
|
|
|
|
|
|
|
|||
Annuity commissions |
|
|
|
|
|
|
|
|
||||
Equity and debt security trades |
|
|
|
|
|
|
|
|
||||
Managed money |
|
|
|
|
|
|
|
|
||||
Trail commissions |
|
|
|
|
|
|
|
|
||||
Total net securities brokerage revenue |
|
|
|
|
|
|
|
|
|
|||
|
|
|
|
|
|
|
|
|
|
|||
Debit card sponsorship income (1) |
|
|
|
|
|
|
|
|
||||
Payment processing fees (1) |
|
|
|
|
|
|
|
|
||||
Electronic banking fees |
|
|
|
|
|
|
|
|
||||
Net swap fee and valuation income (2) |
|
|
|
|
|
|
|
|
||||
Mortgage banking income |
|
|
|
|
|
|
|
|
||||
Net gain on other real estate owned and other assets (3) |
|
|
|
|
|
|
|
|
||||
(1) Debit card sponsorship income and payment processing fees are included in other non-interest income.
(2) The portion of this line item relating to the change in the fair value of the underlying swaps is not within the scope of ASC 606, and totaled (losses) gains of ($
(3) The portion of this line item relating to the sale and change in the fair value of the underlying investments funded by Wesbanco CDC is not within the scope of ASC 606, and totaled gains (losses) of $
NOTE 14. OTHER OPERATING EXPENSES
Other operating expenses are presented in the table below:
|
|
For the Years Ended December 31, |
|
|||||||
(in thousands) |
|
2023 |
|
2022 |
|
2021 |
|
|||
Franchise and other miscellaneous taxes |
|
$ |
|
$ |
|
$ |
|
|||
Consulting, regulatory and advisory fees |
|
|
|
|
|
|
|
|||
ATM and electronic banking interchange expenses |
|
|
|
|
|
|
|
|||
Legal fees |
|
|
|
|
|
|
|
|||
Communications |
|
|
|
|
|
|
|
|||
Other real estate owned and foreclosure expenses |
|
|
|
|
|
|
|
|||
Postage, supplies and other |
|
|
|
|
|
|
|
|||
Total other operating expenses |
|
$ |
|
$ |
|
$ |
|
|||
119
NOTE 15. INCOME TAXES
Reconciliation from the federal statutory income tax rate to the effective tax rate is as follows:
|
|
For the Years Ended December 31, |
|
|||||||||
|
|
2023 |
|
|
2022 |
|
|
2021 |
|
|||
Federal statutory tax rate |
|
|
% |
|
|
% |
|
|
% |
|||
Net tax-exempt interest income on securities and loans of state and |
|
|
( |
) |
|
|
( |
) |
|
|
( |
) |
State income taxes, net of federal tax effect |
|
|
|
|
|
|
|
|
|
|||
Bank-owned life insurance |
|
|
( |
) |
|
|
( |
) |
|
|
( |
) |
General business credits |
|
|
( |
) |
|
|
( |
) |
|
|
( |
) |
All other—net |
|
|
|
|
|
|
|
|
|
|||
Effective tax rate |
|
|
% |
|
|
% |
|
|
% |
|||
The provision for income taxes applicable to income before taxes consists of the following:
|
|
For the Years Ended December 31, |
|
|||||||||
(in thousands) |
|
2023 |
|
|
2022 |
|
|
2021 |
|
|||
Current: |
|
|
|
|
|
|
|
|
|
|||
Federal |
|
$ |
|
|
$ |
|
|
$ |
|
|||
State |
|
|
|
|
|
|
|
|
|
|||
Deferred: |
|
|
|
|
|
|
|
|
|
|||
Federal |
|
|
( |
) |
|
|
|
|
|
|
||
State |
|
|
|
|
|
|
|
|
|
|||
Total |
|
$ |
|
|
$ |
|
|
$ |
|
|||
The following income tax amounts were recorded in shareholders’ equity as elements of other comprehensive income:
(in thousands) |
|
2023 |
|
|
2022 |
|
|
2021 |
|
|||
Securities and defined benefit pension plan unrecognized items |
|
$ |
|
|
$ |
( |
) |
|
$ |
( |
) |
|
120
Deferred tax assets and liabilities consist of the following:
|
|
December 31, |
|
|||||||||
(in thousands) |
|
2023 |
|
|
2022 |
|
|
2021 |
|
|||
Deferred tax assets: |
|
|
|
|
|
|
|
|
|
|||
Allowance for credit losses |
|
$ |
|
|
$ |
|
|
$ |
|
|||
Compensation and benefits |
|
|
— |
|
|
|
— |
|
|
|
|
|
Security gains |
|
|
|
|
|
|
|
|
|
|||
Non-accrual interest income |
|
|
|
|
|
|
|
|
|
|||
Partnership adjustments |
|
|
|
|
|
|
|
|
— |
|
||
Net operating loss carryforwards |
|
|
|
|
|
|
|
|
|
|||
Fair value adjustments on securities available-for-sale |
|
|
|
|
|
|
|
|
|
|||
Lease accrual |
|
|
|
|
|
|
|
|
|
|||
Other |
|
|
|
|
|
|
|
|
|
|||
Gross deferred tax assets |
|
|
|
|
|
|
|
|
|
|||
Deferred tax liabilities: |
|
|
|
|
|
|
|
|
|
|||
Depreciation and amortization |
|
|
( |
) |
|
|
( |
) |
|
|
( |
) |
Accretion on securities |
|
|
( |
) |
|
|
( |
) |
|
|
( |
) |
Deferred fees and costs |
|
|
( |
) |
|
|
( |
) |
|
|
( |
) |
Purchase accounting adjustments |
|
|
( |
) |
|
|
( |
) |
|
|
( |
) |
Compensation and benefits |
|
|
— |
|
|
|
( |
) |
|
|
— |
|
Partnership adjustments |
|
|
( |
) |
|
|
— |
|
|
|
( |
) |
Lease - right of use assets |
|
|
( |
) |
|
|
( |
) |
|
|
( |
) |
Other |
|
|
( |
) |
|
|
( |
) |
|
|
( |
) |
Gross deferred tax liabilities |
|
|
( |
) |
|
|
( |
) |
|
|
( |
) |
Net deferred tax assets |
|
$ |
|
|
$ |
|
|
$ |
|
|||
As a result of the acquisition of Your Community Bankshares ("YCB") in 2016 and OLBK in 2019, Wesbanco has federal net operating loss (“NOL”) carryforwards of $
As a result of the previous acquisitions of YCB, ESB Financial Corporation, Fidelity Bancorp, Inc., Western Ohio Financial Corporation, Winton Financial Corporation and Oak Hill Financial, Inc., retained earnings at both December 31, 2023 and 2022 included $
Federal and state income taxes applicable to securities transactions totaled $
Wesbanco had $
Wesbanco is subject to U.S. federal income tax as well as to tax in various state income tax jurisdictions. Wesbanco and its prior acquired companies are no longer subject to any income tax examinations for years prior to
121
Unrecognized Tax Benefits
A reconciliation of the beginning and ending amount of unrecognized tax benefits (excluding interest and the federal income tax benefit of unrecognized state tax benefits) is as follows:
|
|
For the Years Ended December 31, |
|
|||||||||
(in thousands) |
|
2023 |
|
|
2022 |
|
|
2021 |
|
|||
Balance at beginning of year |
|
$ |
|
|
$ |
|
|
$ |
|
|||
Additions based on tax positions related to the current year |
|
|
|
|
|
|
|
|
|
|||
Reductions due to the statute of limitations |
|
|
( |
) |
|
|
( |
) |
|
|
( |
) |
Balance at end of year |
|
$ |
|
|
$ |
|
|
$ |
|
|||
NOTE 16. FAIR VALUE MEASUREMENT
Fair value estimates are based on quoted market prices, if available, quoted market prices of similar assets or liabilities, or the present value of expected future cash flows and other valuation techniques. These valuations are significantly affected by discount rates, cash flow assumptions, and risk assumptions used. Therefore, fair value estimates may not be substantiated by comparison to independent markets and are not intended to reflect the proceeds that may be realizable in an immediate settlement of the instruments.
Fair value is determined at one point in time and is not representative of future value. These amounts do not reflect the total value of a going concern organization. Management does not have the intention to dispose of a significant portion of its assets and liabilities, and therefore the unrealized gains or losses should not be interpreted as a forecast of future earnings and cash flows.
The following is a discussion of assets and liabilities measured at fair value on a recurring basis and valuation techniques applied:
Investment securities: The fair value of investment securities which are measured on a recurring basis are determined primarily by obtaining quoted prices on nationally recognized securities exchanges or matrix pricing, which is a mathematical technique used widely in the industry to value debt securities without relying exclusively on quoted prices for the specific securities but rather by relying on the securities’ relationship to other similar securities. These securities are classified within level 1 or 2 in the fair value hierarchy. Positions that are not traded in active markets for which valuations are generated using assumptions not observable in the market or management’s best estimate are classified within level 3 of the fair value hierarchy. This includes certain specific municipal debt issues for which the credit quality and discount rate must be estimated.
Loans held for sale: Loans held for sale are carried, in aggregate, at fair value as Wesbanco previously elected the fair value option. The use of a valuation model using quoted prices of similar instruments are significant observable inputs in arriving at the fair value and therefore loans held for sale are classified within level 2 of the fair value hierarchy.
Derivatives: Wesbanco enters into interest rate swap agreements with qualifying commercial customers to meet their financing, interest rate and other risk management needs. These agreements provide the customer the ability to convert from variable to fixed interest rates. The credit risk associated with derivatives executed with customers is essentially the same as that involved in extending loans and is subject to normal credit policies and monitoring. Those interest rate swaps are economically hedged by offsetting interest rate swaps that Wesbanco executes with derivative counterparties in order to offset its exposure on the fixed components of the customer interest rate swap agreements. The interest rate swap agreement with the loan customer and with the counterparty is reported at fair value in other assets and other liabilities on the consolidated balance sheets with any resulting gain or loss recorded in current period earnings within net swap fee and valuation income.
Wesbanco enters into forward TBA contracts to manage the interest rate risk between the loan commitments to the customer and the closing of the loan for loans that will be sold on a mandatory basis to secondary market investors. The forward TBA contract is reported at fair value in other assets and other liabilities on the consolidated balance sheets with any resulting gain or loss recorded in current period earnings within mortgage banking income.
Wesbanco determines the fair value for derivatives using widely accepted valuation techniques including discounted cash flow analysis on the expected cash flows of each derivative. This analysis reflects contractual terms of the derivative, including the period to maturity, and uses observable market-based inputs, including interest rate curves and implied volatilities. Wesbanco incorporates credit valuation adjustments to appropriately reflect both its own non-performance risk and the respective counterparty’s non-performance risk in the fair value measurements, and therefore both the derivative asset and derivative liability are classified within level 2 of the fair value hierarchy.
We may be required from time to time to measure certain assets and liabilities at fair value on a nonrecurring basis in accordance with GAAP. These adjustments to fair value usually result from the application of lower of cost or market accounting or write-downs of individual assets and liabilities.
Collateral dependent loans: Collateral dependent loans are carried at the amortized cost basis less the specific allowance calculated under the Current Expected Credit Losses Accounting Standard. Collateral dependent loans are calculated using a cost basis or collateral value approach, and therefore are classified within level 3 of the fair value hierarchy.
122
Other real estate owned and repossessed assets: Other real estate owned and repossessed assets are carried at the lower of the investment in the assets or the fair value of the assets less estimated selling costs. The use of independent appraisals and management’s best judgment are significant inputs in arriving at the fair value measure of the underlying collateral, and therefore other real estate owned and repossessed assets are classified within level 3 of the fair value hierarchy.
The fair value amounts presented in the table below are intended to permit reconciliation of the fair value hierarchy to the amounts presented in the statements of financial position.
|
|
December 31, 2023 |
|
|||||||||||||
|
|
Fair Value Measurements Using: |
|
|||||||||||||
(in thousands) |
|
December 31, 2023 |
|
|
Quoted Prices in |
|
|
Significant Other |
|
|
Significant |
|
||||
Recurring fair value measurements |
|
|
|
|
|
|
|
|
|
|
|
|
||||
Equity securities |
|
$ |
|
|
$ |
|
|
$ |
— |
|
|
$ |
— |
|
||
Available-for-sale debt securities: |
|
|
|
|
|
|
|
|
|
|
|
|
||||
U.S. Government sponsored entities and agencies |
|
|
|
|
|
— |
|
|
|
|
|
|
— |
|
||
Residential mortgage-backed securities and collateralized |
|
|
|
|
|
— |
|
|
|
|
|
|
— |
|
||
Commercial mortgage-backed securities and collateralized |
|
|
|
|
|
— |
|
|
|
|
|
|
— |
|
||
Obligations of state and political subdivisions |
|
|
|
|
|
— |
|
|
|
|
|
|
|
|||
Corporate debt securities |
|
|
|
|
|
— |
|
|
|
|
|
|
— |
|
||
Total available-for-sale debt securities |
|
$ |
|
|
$ |
— |
|
|
$ |
|
|
$ |
|
|||
Loans held for sale |
|
|
|
|
|
— |
|
|
|
|
|
|
— |
|
||
Other assets—interest rate derivatives agreements |
|
|
|
|
|
— |
|
|
|
|
|
|
— |
|
||
Total assets recurring fair value measurements |
|
$ |
|
|
$ |
|
|
$ |
|
|
$ |
|
||||
Other liabilities—interest rate derivatives agreements |
|
|
|
|
|
— |
|
|
|
|
|
|
— |
|
||
Total liabilities recurring fair value measurements |
|
$ |
|
|
$ |
— |
|
|
$ |
|
|
$ |
— |
|
||
Nonrecurring fair value measurements |
|
|
|
|
|
|
|
|
|
|
|
|
||||
Collateral dependent loans |
|
$ |
|
|
$ |
— |
|
|
$ |
— |
|
|
$ |
|
||
Other real estate owned and repossessed assets |
|
|
|
|
|
— |
|
|
|
— |
|
|
|
|
||
Total nonrecurring fair value measurements |
|
$ |
|
|
$ |
— |
|
|
$ |
— |
|
|
$ |
|
||
123
|
|
December 31, 2022 |
|
|||||||||||||
|
|
Fair Value Measurements Using: |
|
|||||||||||||
(in thousands) |
|
December 31, 2022 |
|
|
Quoted Prices in |
|
|
Significant Other |
|
|
Significant |
|
||||
Recurring fair value measurements |
|
|
|
|
|
|
|
|
|
|
|
|
||||
Equity securities |
|
$ |
|
|
$ |
|
|
$ |
— |
|
|
$ |
— |
|
||
Available-for-sale debt securities: |
|
|
|
|
|
|
|
|
|
|
|
|
||||
U.S. Government sponsored entities and agencies |
|
|
|
|
|
— |
|
|
|
|
|
|
— |
|
||
Residential mortgage-backed securities and collateralized |
|
|
|
|
|
— |
|
|
|
|
|
|
— |
|
||
Commercial mortgage-backed securities and collateralized |
|
|
|
|
|
— |
|
|
|
|
|
|
— |
|
||
Obligations of state and political subdivisions |
|
|
|
|
|
— |
|
|
|
|
|
|
|
|||
Corporate debt securities |
|
|
|
|
|
— |
|
|
|
|
|
|
— |
|
||
Total available-for-sale debt securities |
|
$ |
|
|
$ |
— |
|
|
$ |
|
|
$ |
|
|||
Loans held for sale |
|
|
|
|
|
— |
|
|
|
|
|
|
— |
|
||
Other assets—interest rate derivatives agreements |
|
|
|
|
|
— |
|
|
|
|
|
|
— |
|
||
Total assets recurring fair value measurements |
|
$ |
|
|
$ |
|
|
$ |
|
|
$ |
|
||||
Other liabilities—interest rate derivatives agreements |
|
|
|
|
|
— |
|
|
|
|
|
|
— |
|
||
Total liabilities recurring fair value measurements |
|
$ |
|
|
$ |
— |
|
|
$ |
|
|
$ |
— |
|
||
Nonrecurring fair value measurements |
|
|
|
|
|
|
|
|
|
|
|
|
||||
Collateral dependent loans |
|
$ |
|
|
$ |
— |
|
|
$ |
— |
|
|
$ |
|
||
Other real estate owned and repossessed assets |
|
|
|
|
|
— |
|
|
|
— |
|
|
|
|
||
Total nonrecurring fair value measurements |
|
$ |
|
|
$ |
— |
|
|
$ |
— |
|
|
$ |
|
||
Wesbanco’s policy is to recognize transfers between levels as of the actual date of the event or change in circumstances that caused the transfer. There were
The following table presents additional quantitative information about assets measured at fair value on a nonrecurring basis and for which Wesbanco has utilized level 3 inputs to determine fair value:
|
|
Quantitative Information about Level 3 Fair Value Measurements |
||||||||
(in thousands) |
|
Fair Value |
|
|
Valuation |
|
Unobservable |
|
Range / Weighted |
|
December 31, 2023: |
|
|
|
|
|
|
|
|
|
|
Collateral dependent loans |
|
$ |
|
|
Appraisal of collateral (1) |
|
Appraisal adjustments (2) |
|
||
|
|
|
|
|
|
|
Liquidation expenses (2) |
|
( |
|
Other real estate owned and |
|
|
|
|
Appraisal of collateral (1) (3) |
|
|
|
|
|
|
|
|
|
|
|
|
|
|
|
|
December 31, 2022: |
|
|
|
|
|
|
|
|
|
|
Collateral dependent loans |
|
$ |
|
|
Appraisal of collateral (1) |
|
Appraisal adjustments (2) |
|
||
|
|
|
|
|
|
|
Liquidation expenses (2) |
|
( |
|
Other real estate owned and |
|
|
|
|
Appraisal of collateral (1)(3) |
|
|
|
|
|
124
The estimated fair values of Wesbanco’s financial instruments are summarized below:
|
|
|
|
|
|
|
|
Fair Value Measurements at December 31, 2023 |
|
|||||||||||
(in thousands) |
|
Carrying |
|
|
Fair Value |
|
|
Quoted Prices in |
|
|
Significant |
|
|
Significant |
|
|||||
Financial Assets |
|
|
|
|
|
|
|
|
|
|
|
|
|
|
|
|||||
Cash and due from banks |
|
$ |
|
|
$ |
|
|
$ |
|
|
$ |
— |
|
|
$ |
— |
|
|||
Equity securities |
|
|
|
|
|
|
|
|
|
|
|
— |
|
|
|
— |
|
|||
Available-for-sale debt securities |
|
|
|
|
|
|
|
|
— |
|
|
|
|
|
|
|
||||
Net held-to-maturity debt securities |
|
|
|
|
|
|
|
|
— |
|
|
|
|
|
|
|
||||
Net loans |
|
|
|
|
|
|
|
|
— |
|
|
|
— |
|
|
|
|
|||
Loans held for sale |
|
|
|
|
|
|
|
|
— |
|
|
|
|
|
|
— |
|
|||
Other assets—interest rate derivatives |
|
|
|
|
|
|
|
|
— |
|
|
|
|
|
|
— |
|
|||
Accrued interest receivable |
|
|
|
|
|
|
|
|
|
|
|
— |
|
|
|
— |
|
|||
|
|
|
|
|
|
|
|
|
|
|
|
|
|
|
|
|||||
Financial Liabilities |
|
|
|
|
|
|
|
|
|
|
|
|
|
|
|
|||||
Deposits |
|
|
|
|
|
|
|
|
|
|
|
|
|
|
— |
|
||||
Federal Home Loan Bank borrowings |
|
|
|
|
|
|
|
|
— |
|
|
|
|
|
|
— |
|
|||
Other borrowings |
|
|
|
|
|
|
|
|
|
|
|
— |
|
|
|
— |
|
|||
Subordinated debt and junior subordinated debt |
|
|
|
|
|
|
|
|
— |
|
|
|
|
|
|
— |
|
|||
Other liabilities—interest rate derivatives |
|
|
|
|
|
|
|
|
— |
|
|
|
|
|
|
— |
|
|||
Accrued interest payable |
|
|
|
|
|
|
|
|
|
|
|
— |
|
|
|
— |
|
|||
|
|
|
|
|
|
|
|
Fair Value Measurements at December 31, 2022 |
|
|||||||||||
(in thousands) |
|
Carrying |
|
|
Fair Value |
|
|
Quoted Prices in |
|
|
Significant |
|
|
Significant |
|
|||||
Financial Assets |
|
|
|
|
|
|
|
|
|
|
|
|
|
|
|
|||||
Cash and due from banks |
|
$ |
|
|
$ |
|
|
$ |
|
|
$ |
— |
|
|
$ |
— |
|
|||
Equity securities |
|
|
|
|
|
|
|
|
|
|
|
— |
|
|
|
— |
|
|||
Available-for-sale debt securities |
|
|
|
|
|
|
|
|
— |
|
|
|
|
|
|
|
||||
Net held-to-maturity debt securities |
|
|
|
|
|
|
|
|
— |
|
|
|
|
|
|
|
||||
Net loans |
|
|
|
|
|
|
|
|
— |
|
|
|
— |
|
|
|
|
|||
Loans held for sale |
|
|
|
|
|
|
|
|
— |
|
|
|
|
|
|
— |
|
|||
Other assets—interest rate derivatives |
|
|
|
|
|
|
|
|
— |
|
|
|
|
|
|
— |
|
|||
Accrued interest receivable |
|
|
|
|
|
|
|
|
|
|
|
— |
|
|
|
— |
|
|||
|
|
|
|
|
|
|
|
|
|
|
|
|
|
|
|
|||||
Financial Liabilities |
|
|
|
|
|
|
|
|
|
|
|
|
|
|
|
|||||
Deposits |
|
|
|
|
|
|
|
|
|
|
|
|
|
|
— |
|
||||
Federal Home Loan Bank borrowings |
|
|
|
|
|
|
|
|
— |
|
|
|
|
|
|
— |
|
|||
Other borrowings |
|
|
|
|
|
|
|
|
|
|
|
— |
|
|
|
— |
|
|||
Subordinated debt and junior subordinated debt |
|
|
|
|
|
|
|
|
— |
|
|
|
|
|
|
— |
|
|||
Other liabilities—interest rate derivatives |
|
|
|
|
|
|
|
|
— |
|
|
|
|
|
|
— |
|
|||
Accrued interest payable |
|
|
|
|
|
|
|
|
|
|
|
— |
|
|
|
— |
|
|||
The following methods and assumptions were used to measure the fair value of financial instruments recorded at cost on Wesbanco’s consolidated balance sheets:
Cash and due from banks: The carrying amount for cash and due from banks is a reasonable estimate of fair value.
Held-to-maturity debt securities: Fair values for debt securities held-to-maturity are determined in the same manner as investment securities, which are described above.
125
Net loans: Fair values for loans are estimated using a discounted cash flow methodology. The discount rates take into account interest rates currently being offered to customers for loans with similar terms, the credit risk associated with the loan and other market factors, including liquidity. Wesbanco believes the discount rates are consistent with transactions occurring in the marketplace for both performing and distressed loan types. The carrying value is net of the allowance for loan losses and other associated premiums and discounts. Due to the significant judgment involved in evaluating credit quality, loans are classified within level 3 of the fair value hierarchy.
Accrued interest receivable: The carrying amount of accrued interest receivable approximates its fair value.
Deposits: The carrying amount is considered a reasonable estimate of fair value for all non-maturity deposit accounts, which includes non-interest bearing demand, interest bearing demand, money market and savings deposit accounts. Non-maturity deposit accounts are classified within level 1 of the fair value hierarchy. The fair value of fixed maturity certificates of deposit is estimated by a discounted cash flow method using rates currently offered for deposits of similar remaining maturities, and is therefore classified in level 2 of the fair value hierarchy.
Federal Home Loan Bank borrowings: The fair value of FHLB borrowings is based on rates currently available to Wesbanco for borrowings with similar terms and remaining maturities.
Other borrowings: The carrying amount of federal funds purchased and overnight sweep accounts generally approximate fair value. Other repurchase agreements are based on quoted market prices if available. If market prices are not available, for certain fixed and adjustable rate repurchase agreements, then quoted market prices of similar instruments are used.
Subordinated debt and junior subordinated debt: The fair value of subordinated debt is estimated using discounted cash flow analyses based on the current borrowing rates for similar types of borrowing arrangements. Due to the pooled nature of junior subordinated debt owed to unconsolidated subsidiary trusts, which are not actively traded, estimated fair value is based on recent similar transactions of single-issuer trust preferred securities.
Accrued interest payable: The carrying amount of accrued interest payable approximates its fair value.
Off-balance sheet financial instruments: Off-balance sheet financial instruments consist of commitments to extend credit, including letters of credit. Fair values for commitments to extend credit are estimated using the fees currently charged to enter into similar agreements, taking into account the remaining terms of the agreements and the present credit standing of the counterparties. The estimated fair value of the commitments to extend credit and letters of credit are insignificant and therefore are not presented in the above tables.
126
NOTE 17. COMPREHENSIVE INCOME/(LOSS)
The activity in accumulated other comprehensive income for the years ended December 31, 2023, 2022 and 2021 is as follows:
|
|
Accumulated Other Comprehensive Income/(Loss) (1) |
|
|||||||||
(in thousands) |
|
Defined |
|
|
Unrealized Gains |
|
|
Total |
|
|||
Balance at December 31, 2020 |
|
$ |
( |
) |
|
$ |
|
|
$ |
|
||
Other comprehensive income/(loss) before |
|
|
|
|
|
( |
) |
|
|
( |
) |
|
Amounts reclassified from accumulated other |
|
|
|
|
|
( |
) |
|
|
|
||
Period change |
|
|
|
|
|
( |
) |
|
|
( |
) |
|
Balance at December 31, 2021 |
|
$ |
( |
) |
|
$ |
( |
) |
|
$ |
( |
) |
|
|
|
|
|
|
|
|
|
|
|||
Balance at December 31, 2021 |
|
$ |
( |
) |
|
$ |
( |
) |
|
$ |
( |
) |
Other comprehensive income/(loss) before |
|
|
( |
) |
|
|
( |
) |
|
|
( |
) |
Amounts reclassified from accumulated other |
|
|
|
|
|
|
|
|
|
|||
Period change |
|
|
( |
) |
|
|
( |
) |
|
|
( |
) |
Balance at December 31, 2022 |
|
$ |
( |
) |
|
$ |
( |
) |
|
$ |
( |
) |
|
|
|
|
|
|
|
|
|
|
|||
Balance at December 31, 2022 |
|
$ |
( |
) |
|
$ |
( |
) |
|
$ |
( |
) |
Other comprehensive income/(loss) before |
|
|
|
|
|
|
|
|
|
|||
Amounts reclassified from accumulated other |
|
|
|
|
|
|
|
|
|
|||
Period change |
|
|
|
|
|
|
|
|
|
|||
Balance at December 31, 2023 |
|
$ |
|
|
$ |
( |
) |
|
$ |
( |
) |
|
(1) All amounts are net of tax. Related income tax expense or benefit is calculated using a combined Federal and State income tax rate approximating
Details about Accumulated Other Comprehensive |
|
Amounts Reclassified from |
|
|
Affected Line Item in the Statement of Net |
|||||||||
(in thousands) |
|
2023 |
|
|
2022 |
|
|
2021 |
|
|
|
|||
Securities available-for-sale (1): |
|
|
|
|
|
|
|
|
|
|
|
|||
Net securities losses (gains) reclassified into |
|
$ |
|
|
$ |
|
|
$ |
( |
) |
|
Net securities gains (Non-interest income) |
||
Related income tax (benefit) expense |
|
|
( |
) |
|
|
( |
) |
|
|
|
|
Provision for income taxes |
|
Net effect on accumulated other comprehensive |
|
|
|
|
|
|
|
|
( |
) |
|
|
||
Defined benefit plans (2): |
|
|
|
|
|
|
|
|
|
|
|
|||
Amortization of net loss and prior service |
|
|
|
|
|
|
|
|
|
|
Employee benefits (Non-interest expense) |
|||
Related income tax benefit |
|
|
( |
) |
|
|
( |
) |
|
|
( |
) |
|
Provision for income taxes |
Net effect on accumulated other comprehensive |
|
|
|
|
|
|
|
|
|
|
|
|||
Total reclassifications for the period |
|
$ |
|
|
$ |
|
|
$ |
|
|
|
|||
(1) For additional detail related to unrealized gains on securities and related amounts reclassified from accumulated other comprehensive income see Note 3, “Securities.”
(2) Included in the computation of net periodic pension cost. See Note 12, “Employee Benefit Plans” for additional detail.
127
NOTE 18. COMMITMENTS AND CONTINGENT LIABILITIES
Commitments— In the normal course of business, Wesbanco offers off-balance sheet credit arrangements to enable its customers to meet their financing objectives. Those instruments involve, to varying degrees, elements of credit and interest rate risk in excess of the amount recognized in the financial statements. Wesbanco’s exposure to credit losses in the event of non-performance by the other parties to the financial instruments for commitments to extend credit and standby letters of credit is limited to the contractual amount of those instruments. Wesbanco uses the same credit policies in making commitments and conditional obligations as for all other lending. Commitments generally have fixed expiration dates or other termination clauses and may require payment of a fee. Since many of the commitments are expected to expire without being drawn upon, the total commitment amounts do not necessarily represent future cash requirements. The allowance for credit losses associated with commitments was $
Letters of credit are conditional commitments issued by banks to guarantee the performance of a customer to a third party. Those guarantees are primarily issued to support public and private borrowing arrangements, including normal business activities, bond financing and similar transactions. Letters of credit are considered guarantees. The liability associated with letters of credit was $
Contingent obligations to purchase loans funded by other entities include affordable housing plan guarantees, credit card guarantees, loans sold with recourse as well as obligations to the FHLB. Affordable housing plan guarantees are performance guarantees for various building project loans. The guarantee amortizes as the loan balances decrease. Credit card guarantees are credit card balances not owned by Wesbanco, whereby the Bank guarantees the performance of the cardholder.
The following table presents total commitments to extend credit, guarantees and various letters of credit outstanding:
|
|
December 31, |
|
|||||
(in thousands) |
|
2023 |
|
|
2022 |
|
||
Lines of credit |
|
$ |
|
|
$ |
|
||
Loans approved but not closed |
|
|
|
|
|
|
||
Overdraft limits |
|
|
|
|
|
|
||
Letters of credit |
|
|
|
|
|
|
||
Contingent obligations and other guarantees |
|
|
|
|
|
|
||
Contingent Liabilities— Wesbanco is a party to various legal and administrative proceedings and claims. While any litigation contains an element of uncertainty, management does not believe that a material loss related to such proceedings or claims pending or known to be threatened is reasonably possible.
NOTE 19. WESBANCO BANK COMMUNITY DEVELOPMENT CORPORATION
Wesbanco Bank Community Development Corporation (“WBCDC”), a consolidated subsidiary of Wesbanco Bank, is a Certified Development Entity (“CDE”) with $
The credit provided to the investor totals
Wesbanco Bank recognized $
128
The NMTC claimed by Wesbanco Bank with respect to each QEI remain subject to recapture over each QEI’s credit allowance period upon the occurrence of any of the following:
As of December 31, 2023, 2022 and 2021, none of the above recapture events had occurred, nor in the opinion of management are such events anticipated to occur in the foreseeable future. Approximately half of the tax credits are no longer subject to recapture.
For the years ended December 31, 2023, 2022 and 2021, respectively, WBCDC recognized net gains (losses) of $
The following condensed financial statements summarize the financial position of WBCDC as of December 31, 2023, and the results of its operations and cash flows for the year ended December 31, 2023:
BALANCE SHEET
(in thousands) |
|
December 31, 2023 |
|
|
Assets |
|
|
|
|
Cash and due from banks |
|
$ |
|
|
Loans, net of allowance for credit losses of $ |
|
|
|
|
Other assets |
|
|
|
|
Total Assets |
|
$ |
|
|
Liabilities |
|
$ |
|
|
Shareholder Equity |
|
|
|
|
Total Liabilities and Shareholder Equity |
|
$ |
|
|
STATEMENT OF INCOME
(in thousands) |
|
For the Year Ended December 31, 2023 |
|
|
Interest income |
|
|
|
|
Loans |
|
$ |
|
|
Total interest income |
|
|
|
|
Provision for credit losses |
|
|
|
|
Net interest income after provision for credit losses |
|
|
|
|
Gain on investments |
|
|
|
|
Non-interest expense |
|
|
|
|
Income before provision for income taxes |
|
|
|
|
Provision for income taxes |
|
|
|
|
Net income |
|
$ |
|
|
129
STATEMENT OF CASH FLOWS
(in thousands) |
|
For the Year Ended December 31, 2023 |
|
|
Operating Activities |
|
|
|
|
Net income |
|
$ |
|
|
Provision for credit losses |
|
|
|
|
Gain on investments |
|
|
( |
) |
Net change in other assets |
|
|
( |
) |
Net change in other liabilities |
|
|
( |
) |
Net cash used in operating activities |
|
|
( |
) |
Investing Activities |
|
|
|
|
Increase in loans |
|
|
( |
) |
Proceeds from sale of investments |
|
|
|
|
Net cash used in investing activities |
|
|
( |
) |
Financing Activities |
|
|
|
|
Qualified equity investment by parent company |
|
|
- |
|
Net cash provided by financing activities |
|
|
- |
|
Net increase in cash and cash equivalents |
|
|
( |
) |
Cash and cash equivalents at beginning of year |
|
|
|
|
Cash and cash equivalents at end of year |
|
$ |
|
|
NOTE 20. TRANSACTIONS WITH RELATED PARTIES
Certain directors and officers (including their affiliates, families and entities in which they are principal owners) of Wesbanco and its subsidiaries are customers of, or suppliers to, those subsidiaries and have had, and are expected to have, transactions with the subsidiaries in the ordinary course of business. In addition, certain directors are also directors or officers of corporations that are customers of, or suppliers to, the Bank and have had, and are expected to have, transactions with the Bank in the ordinary course of business. In the opinion of management, such transactions are consistent with prudent banking practices and are within applicable banking regulations. Indebtedness of related parties aggregated approximately $
NOTE 21. REGULATORY MATTERS
The Federal Reserve Bank is the primary regulator for the parent company, Wesbanco. Wesbanco Bank is a state non-member bank jointly regulated by the FDIC and the West Virginia Division of Financial Institutions. Wesbanco is a legal entity separate and distinct from its subsidiaries and is dependent upon dividends from its subsidiary bank, Wesbanco Bank, to provide funds for the payment of dividends to shareholders, fund its current stock repurchase plan and to provide for other cash requirements. The payment of dividends by Wesbanco Bank to Wesbanco is subject to state and federal banking regulations. Under applicable law, bank regulatory agency approval is required if the total of all dividends declared by a bank in any calendar year exceeds the available retained earnings or exceeds the aggregate of the bank’s net profits (as defined by regulatory agencies) for that year and its retained net profits for the preceding two years. As of December 31, 2023, under FDIC and state of West Virginia regulations, Wesbanco could receive, without prior regulatory approval, a dividend of up to $
Wesbanco Bank is also required to maintain non-interest bearing reserve balances with the Federal Reserve Bank. The Bank did
Additionally, Wesbanco and Wesbanco Bank are subject to various regulatory capital requirements (risk-based capital ratios) administered by federal banking agencies. Failure to meet minimum capital requirements can initiate certain mandatory and possibly additional discretionary actions by the regulators that, if undertaken, could have a material adverse effect on Wesbanco’s financial results.
All bank holding companies and banking subsidiaries are required to have common equity Tier 1 (“CET1”) of at least
130
2022. There are no conditions or events since December 31, 2023 that management believes have changed Wesbanco’s “well-capitalized” category.
The Basel III capital standards, effective January 1, 2015 with a phase-in period ending January 1, 2019, establishes the minimum capital levels required under the Dodd-Frank Act, permanently grandfathers trust preferred securities as Tier 1 capital issued before May 19, 2010 for bank holding companies under $
Wesbanco currently has $
On March 26, 2020, regulators issued interim financial rule (“IFR”) “Regulatory Capital Rule: Revised Transition of the Current Expected Losses Methodology for Allowances” in response to the disrupted economic activity from the spread of COVID-19. The IFR provides financial institutions that adopt CECL during 2020 with the option to delay for
The following table summarizes risk-based capital amounts and ratios for Wesbanco and the Bank:
|
|
|
|
|
|
|
|
December 31, 2023 |
|
|
December 31, 2022 |
|
||||||||||||||||||||
(dollars in thousands) |
|
Minimum |
|
|
Well |
|
|
Amount |
|
|
Ratio |
|
|
Minimum |
|
|
Amount |
|
|
Ratio |
|
|
Minimum |
|
||||||||
Wesbanco, Inc. |
|
|
|
|
|
|
|
|
|
|
|
|
|
|
|
|
|
|
|
|
|
|
|
|
||||||||
Tier 1 leverage |
|
|
% |
|
|
% |
|
$ |
|
|
|
% |
|
$ |
|
|
$ |
|
|
|
% |
|
$ |
|
||||||||
Tier 1 capital to risk-weighted assets |
|
|
% |
|
|
% |
|
|
|
|
|
% |
|
|
|
|
|
|
|
|
% |
|
|
|
||||||||
Total capital to risk-weighted assets |
|
|
% |
|
|
% |
|
|
|
|
|
% |
|
|
|
|
|
|
|
|
% |
|
|
|
||||||||
Common equity Tier 1 |
|
|
% |
|
|
% |
|
|
|
|
|
% |
|
|
|
|
|
|
|
|
% |
|
|
|
||||||||
Wesbanco Bank, Inc. |
|
|
|
|
|
|
|
|
|
|
|
|
|
|
|
|
|
|
|
|
|
|
|
|
||||||||
Tier 1 leverage |
|
|
% |
|
|
% |
|
$ |
|
|
|
% |
|
$ |
|
|
$ |
|
|
|
% |
|
$ |
|
||||||||
Tier 1 capital to risk-weighted assets |
|
|
% |
|
|
% |
|
|
|
|
|
% |
|
|
|
|
|
|
|
|
% |
|
|
|
||||||||
Total capital to risk-weighted assets |
|
|
% |
|
|
% |
|
|
|
|
|
% |
|
|
|
|
|
|
|
|
% |
|
|
|
||||||||
Common equity Tier 1 |
|
|
% |
|
|
% |
|
|
|
|
|
% |
|
|
|
|
|
|
|
|
% |
|
|
|
||||||||
131
NOTE 22. CONDENSED PARENT COMPANY FINANCIAL STATEMENTS
Presented below are the Condensed Balance Sheets, Statements of Income and Statements of Cash Flows for the parent company:
BALANCE SHEETS
|
|
December 31, |
|
|||||
(in thousands) |
|
2023 |
|
|
2022 |
|
||
ASSETS |
|
|
|
|
|
|
||
Cash and due from banks |
|
$ |
|
|
$ |
|
||
Investment in subsidiaries—Bank |
|
|
|
|
|
|
||
Investment in subsidiaries—Nonbank |
|
|
|
|
|
|
||
Other assets |
|
|
|
|
|
|
||
Total Assets |
|
$ |
|
|
$ |
|
||
LIABILITIES |
|
|
|
|
|
|
||
Subordinated debt and junior subordinated debt |
|
$ |
|
|
$ |
|
||
Dividends payable and other liabilities |
|
|
|
|
|
|
||
Total Liabilities |
|
|
|
|
|
|
||
SHAREHOLDERS’ EQUITY |
|
|
|
|
|
|
||
Total Liabilities and Shareholders’ Equity |
|
$ |
|
|
$ |
|
||
STATEMENTS OF INCOME
|
|
For the years ended December 31, |
|
|||||||||
(in thousands) |
|
2023 |
|
|
2022 |
|
|
2021 |
|
|||
Dividends from subsidiaries—Bank |
|
$ |
|
|
$ |
|
|
$ |
|
|||
Dividends from subsidiaries—Nonbank |
|
|
|
|
|
|
|
|
|
|||
Other income |
|
|
|
|
|
|
|
|
— |
|
||
Total income |
|
|
|
|
|
|
|
|
|
|||
Interest expense |
|
|
|
|
|
|
|
|
|
|||
Other expense |
|
|
|
|
|
|
|
|
|
|||
Total expense |
|
|
|
|
|
|
|
|
|
|||
Income before income tax benefit and undistributed net income of subsidiaries |
|
|
|
|
|
|
|
|
|
|||
Income tax benefit |
|
|
( |
) |
|
|
( |
) |
|
|
( |
) |
Income before undistributed net income of subsidiaries |
|
|
|
|
|
|
|
|
|
|||
Equity in undistributed net income (excess dividends) of subsidiaries |
|
|
|
|
|
|
|
|
( |
) |
||
Net income |
|
|
|
|
|
|
|
|
|
|||
Preferred stock dividends |
|
|
|
|
|
|
|
|
|
|||
NET INCOME AVAILABLE TO COMMON SHAREHOLDERS |
|
$ |
|
|
$ |
|
|
$ |
|
|||
The details of other comprehensive income and accumulated other comprehensive income are included in the consolidated financial statements.
132
STATEMENTS OF CASH FLOWS
|
|
For the years ended December 31, |
|
|||||||||
(in thousands) |
|
2023 |
|
|
2022 |
|
|
2021 |
|
|||
OPERATING ACTIVITIES |
|
|
|
|
|
|
|
|
|
|||
Net income |
|
$ |
|
|
$ |
|
|
$ |
|
|||
Adjustments to reconcile net income to net |
|
|
|
|
|
|
|
|
|
|||
(Equity in undistributed net income) excess dividends of subsidiaries |
|
|
( |
) |
|
|
( |
) |
|
|
|
|
Decrease (increase) in other assets |
|
|
|
|
|
|
|
|
( |
) |
||
Other—net |
|
|
|
|
|
|
|
|
|
|||
Net cash provided by operating activities |
|
|
|
|
|
|
|
|
|
|||
INVESTING ACTIVITIES |
|
|
|
|
|
|
|
|
|
|||
Acquisitions and additional capitalization of subsidiaries, |
|
|
— |
|
|
|
( |
) |
|
|
— |
|
Net cash used in investing activities |
|
|
— |
|
|
|
( |
) |
|
|
— |
|
FINANCING ACTIVITIES |
|
|
|
|
|
|
|
|
|
|||
Repayment of subordinated and junior subordinated debt |
|
|
( |
) |
|
|
— |
|
|
|
( |
) |
Issuance of subordinated debt |
|
|
— |
|
|
|
|
|
|
— |
|
|
Treasury shares purchased—net |
|
|
( |
) |
|
|
( |
) |
|
|
( |
) |
Dividends paid to common and preferred shareholders |
|
|
( |
) |
|
|
( |
) |
|
|
( |
) |
Net cash used in financing activities |
|
|
( |
) |
|
|
( |
) |
|
|
( |
) |
Net (decrease) increase in cash and cash equivalents |
|
|
( |
) |
|
|
|
|
|
( |
) |
|
Cash and cash equivalents at beginning of year |
|
|
|
|
|
|
|
|
|
|||
Cash and cash equivalents at end of year |
|
$ |
|
|
$ |
|
|
$ |
|
|||
133
NOTE 23. BUSINESS SEGMENTS
Wesbanco operates
Condensed financial information by business segment is presented below:
(in thousands) |
|
Community |
|
|
Trust and |
|
|
Consolidated |
|
|||
For the Year Ended December 31, 2023 |
|
|
|
|
|
|
|
|
|
|||
Interest and dividend income |
|
$ |
|
|
$ |
— |
|
|
$ |
|
||
Interest expense |
|
|
|
|
|
— |
|
|
|
|
||
Net interest income |
|
|
|
|
|
— |
|
|
|
|
||
Provision for credit losses |
|
|
|
|
|
— |
|
|
|
|
||
Net interest income after provision for credit losses |
|
|
|
|
|
— |
|
|
|
|
||
Non-interest income |
|
|
|
|
|
|
|
|
|
|||
Non-interest expense |
|
|
|
|
|
|
|
|
|
|||
Income before provision for income taxes |
|
|
|
|
|
|
|
|
|
|||
Provision for income taxes |
|
|
|
|
|
|
|
|
|
|||
Net income |
|
|
|
|
|
|
|
|
|
|||
Preferred stock dividends |
|
|
|
|
|
— |
|
|
|
|
||
Net income available to common shareholders |
|
$ |
|
|
$ |
|
|
$ |
|
|||
For the Year Ended December 31, 2022 |
|
|
|
|
|
|
|
|
|
|||
Interest and dividend income |
|
$ |
|
|
$ |
— |
|
|
$ |
|
||
Interest expense |
|
|
|
|
|
— |
|
|
|
|
||
Net interest income |
|
|
|
|
|
— |
|
|
|
|
||
Provision for credit losses |
|
|
( |
) |
|
|
— |
|
|
|
( |
) |
Net interest income after provision for credit losses |
|
|
|
|
|
— |
|
|
|
|
||
Non-interest income |
|
|
|
|
|
|
|
|
|
|||
Non-interest expense |
|
|
|
|
|
|
|
|
|
|||
Income before provision for income taxes |
|
|
|
|
|
|
|
|
|
|||
Provision for income taxes |
|
|
|
|
|
|
|
|
|
|||
Net income |
|
|
|
|
|
|
|
|
|
|||
Preferred stock dividends |
|
|
|
|
|
— |
|
|
|
|
||
Net income available to common shareholders |
|
$ |
|
|
$ |
|
|
$ |
|
|||
For the Year Ended December 31, 2021 |
|
|
|
|
|
|
|
|
|
|||
Interest and dividend income |
|
$ |
|
|
$ |
— |
|
|
$ |
|
||
Interest expense |
|
|
|
|
|
— |
|
|
|
|
||
Net interest income |
|
|
|
|
|
— |
|
|
|
|
||
Provision for credit losses |
|
|
( |
) |
|
|
— |
|
|
|
( |
) |
Net interest income after provision for credit losses |
|
|
|
|
|
— |
|
|
|
|
||
Non-interest income |
|
|
|
|
|
|
|
|
|
|||
Non-interest expense |
|
|
|
|
|
|
|
|
|
|||
Income before provision for income taxes |
|
|
|
|
|
|
|
|
|
|||
Provision for income taxes |
|
|
|
|
|
|
|
|
|
|||
Net income |
|
|
|
|
|
|
|
|
|
|||
Preferred stock dividends |
|
|
|
|
|
— |
|
|
|
|
||
Net income available to common shareholders |
|
$ |
|
|
$ |
|
|
$ |
|
|||
Total non-fiduciary assets of the trust and investment services segment were $
134
ITEM 9. CHANGES IN AND DISAGREEMENTS WITH ACCOUNTANTS ON ACCOUNTING AND FINANCIAL DISCLOSURE
None.
ITEM 9A. CONTROLS AND PROCEDURES
Wesbanco’s management carried out an evaluation, under the supervision and with the participation of the chief executive officer and the chief financial officer, of the effectiveness of the design and operation of Wesbanco’s disclosure controls and procedures (as such term is defined in Rules 13a-15(e) and 15d-15(e) under the Exchange Act) as of December 31, 2023, pursuant to Exchange Act Rule 13a-15. Based upon that evaluation, the chief executive officer along with the chief financial officer concluded that Wesbanco’s disclosure controls and procedures as of December 31, 2023, are effective in timely alerting them to material information relating to Wesbanco (including its consolidated subsidiaries) required to be included in Wesbanco’s periodic filings under the Exchange Act.
No changes in Wesbanco's internal control over financial reporting have occurred during the period covered by this report that have materially affected, or are reasonably likely to materially affect, the Wesbanco's internal control over financial reporting.
Management’s Report on Internal Control Over Financial Reporting
Management’s Report on internal control over financial reporting and the audit report of Ernst & Young LLP, the Company’s independent registered public accounting firm, on internal control over financial reporting is included within this report at the beginning of “Item 8. Financial Statements and Supplementary Data” and is incorporated in this Item 9A by reference.
ITEM 9B. OTHER INFORMATION
Securities Trading Plans of Directors and Executive Officers
During the three months ended December 31, 2023, none of our directors or executive officers
ITEM 9C. DISCLOSURE REGARDING FOREIGN JURISDICTIONS THAT PREVENT INSPECTIONS
Not Applicable.
135
PART III
ITEM 10. DIRECTORS, EXECUTIVE OFFICERS AND CORPORATE GOVERNANCE
The information required by this Item 10 is incorporated by reference to the applicable information in our Proxy Statement set forth under the headings Election of Directors, Nominees, Continuing Directors, Executive Officers of the Corporation, Corporate Governance, Delinquent Section 16(a) Reports (if applicable) and Audit Committee and certain other sections.
CODE OF ETHICS
Wesbanco has adopted a Code of Business Conduct and Ethics that applies to our directors, officers and employees, including Wesbanco’s Chief Executive Officer, Chief Financial Officer, Controller and other executive officers. Wesbanco’s “Code of Business Conduct and Ethics” can be found posted on our website at http://www.wesbanco.com in the “About Us” section under “Investor Relations” under “Governance Documents.” Wesbanco intends to disclose any changes or amendments to or waivers from Wesbanco's "Code of Business Conduct and Ethics" on its website.
Wesbanco will provide a printed copy, free of charge, of Wesbanco’s Code of Business Conduct and Ethics to any shareholder requesting such information. To obtain a copy of Wesbanco’s Code of Ethics, contact: John Iannone, Wesbanco, Inc., 1 Bank Plaza, Wheeling, WV 26003. (304) 905-7021
ITEM 11. EXECUTIVE COMPENSATION
The information required by this Item 11 is incorporated by reference to the applicable information in our Proxy Statement set forth under the headings Summary Compensation Table, Meetings of Board of Directors and Committees and Compensation of Members, Compensation Committee Interlocks and Insider Participation, Compensation Committee Report, Compensation Discussion and Analysis and certain other sections.
ITEM 12. SECURITY OWNERSHIP OF CERTAIN BENEFICIAL OWNERS AND MANAGEMENT AND RELATED STOCKHOLDER MATTERS
The information required by this Item 12 (other than the information provided below under the heading Equity Compensation Plan Information) is incorporated by reference to the applicable information in our Proxy Statement set forth under the headings Ownership of Securities by Directors, Nominees and Officers and Beneficial Owners of More Than 5% of the Common Stock of the Corporation.
The following table sets forth certain information with respect to securities authorized for issuance under our equity compensation plans as of December 31, 2023.
Equity Compensation Plan Information
Plan Category |
|
Number of |
|
|
Weighted average |
|
|
Number of |
|
|||
Equity compensation plans approved by security holders |
|
|
891,106 |
|
|
$ |
29.62 |
|
|
|
1,069,689 |
|
Equity compensation plans not approved by security holders |
|
None |
|
|
None |
|
|
None |
|
|||
The information required by this Item 13 is incorporated by reference to the applicable information in our Proxy Statement set forth under the headings Transactions with Directors and Officers and Election of Directors. Additional information concerning related party transactions is set forth in the Annual Report under Note 20, “Transactions with Related Parties” in the Consolidated Financial Statements.
ITEM 14. PRINCIPAL ACCOUNTANT FEES AND SERVICES
The information required by this Item 14 is incorporated by reference to the applicable information in our Proxy Statement set forth under the heading Independent Registered Public Accounting Firm.
136
PART IV
ITEM 15. EXHIBITS AND FINANCIAL STATEMENT SCHEDULES
(A) CERTAIN DOCUMENTS FILED AS PART OF THE FORM 10-K
(1) CONSOLIDATED FINANCIAL STATEMENTS: Reference is made to Part II Item 8, of this Annual Report on Form 10-K.
(2) FINANCIAL STATEMENT SCHEDULES: No financial statement schedules are being filed since the required information is inapplicable or the information is presented in the Consolidated Financial Statements or related Notes.
(3) EXHIBIT LISTING Exhibits listed in the Exhibit Index of this Annual Report on Form 10-K are filed herein or are incorporated by reference.
ITEM 16. FORM 10-K SUMMARY
None.
137
EXHIBIT INDEX
Exhibit |
Document |
|
Location |
|
|
|
|
||
3.1 |
Bylaws of Wesbanco, Inc. (As Amended and Restated May 4, 2021). |
|
Incorporated by reference to Exhibit 3.1 of Form 10-Q filed by the Registrant with the Securities and Exchange Commission on May 6, 2021. |
|
|
|
|
||
3.2 |
|
Incorporated by reference to Exhibit 3.2 of Form 10-K filed by the Registrant with the Securities and Exchange Commission on February 28, 2020. |
|
|
|
|
|
|
|
3.3 |
Articles of Amendment to the Restated Articles of Incorporation of Wesbanco, Inc. |
|
Incorporated by reference to Exhibit 3.1 of Form 8-K filed by the Registrant with the Securities and Exchange Commission on August 11, 2020. |
|
|
|
|
||
4.1 |
Specimen Certificate of Wesbanco, Inc. Common Stock. (P) |
|
Incorporated by reference to a prior Registration Statement on Form S-4 under Registration No. 33-42157 filed by the Registrant with the Securities and Exchange Commission on August 9, 1991. |
|
|
|
|
||
4.2 |
|
Incorporated by reference to Form 10-Q filed by the Registrant with the Securities and Exchange Commission on August 13, 2003. |
|
|
|
|
|
||
4.3 |
|
Incorporated by reference to Form 10-Q filed by the Registrant with the Securities and Exchange Commission on August 13, 2003. |
|
|
|
|
|
||
4.4 |
|
Incorporated by reference to Form 10-Q filed by the Registrant with the Securities and Exchange Commission on August 9, 2004. |
|
|
|
|
|
|
|
4.5 |
|
Incorporated by reference to Form 10-Q filed by the Registrant with the Securities and Exchange Commission on August 9, 2004. |
||
|
|
|||
4.6 |
|
Incorporated by reference to Form 8-K filed by the Registrant with the Securities and Exchange Commission on March 18, 2005. |
||
|
|
|||
4.7 |
|
Incorporated by reference to Exhibit 4.7 of Form 10-K filed by the Registrant with the Securities and Exchange Commission on February 26, 2021. |
||
|
|
|||
4.8 |
|
Incorporated by reference to Exhibit 4.1 of Form 8-K filed by the Registrant with the Securities and Exchange Commission on August 11, 2020. |
||
|
|
|||
4.9 |
Specimen of Certificate representing the Series A Preferred Stock. |
|
Incorporated by reference to Exhibit 4.2 of Form 8-K filed by the Registrant with the Securities and Exchange Commission on August 11, 2020. |
|
|
|
|||
4.10 |
|
Incorporated by reference to Exhibit 4.1 of Form 8-K filed by the Registrant with the Securities and Exchange Commission on August 11, 2020. |
||
|
|
|
|
|
138
4.11 |
|
Incorporated by reference to Exhibit 4.1 of Form 8-K filed by the Registrant with the Securities and Exchange Commission on March 23, 2022. |
||
|
|
|
|
|
4.12 |
|
Incorporated by reference to Exhibit 4.2 of Form 8-K filed by the Registrant with the Securities and Exchange Commission on March 23, 2022. |
||
|
|
|
|
|
4.13 |
Form of 3.75% Fixed-to-Floating Rate Subordinated Note due 2032. |
|
Incorporated by reference to Exhibit 4.2 of Form 8-K filed by the Registrant with the Securities and Exchange Commission on March 23, 2022. |
|
|
|
|||
10.1 |
|
Incorporated by reference to Exhibit 10.1 of Form 8-K filed by the Registrant with the Securities and Exchange Commission on April 21, 2021. |
||
|
|
|||
10.2 |
Wesbanco, Inc. Deferred Compensation Plan – For Directors and Eligible Employees (as amended). ** |
|
Incorporated by reference to Exhibit 10.17 of Form 10-K filed by the Registrant with the Securities and Exchange Commission on March 10, 2006. |
|
|
|
|||
10.3 |
|
Incorporated by reference to Exhibit 10.1 of Form 8-K filed by the Registrant with the Securities and Exchange Commission on April 28, 2006. |
||
|
|
|||
10.4 |
|
Incorporated by reference to Exhibit 10.1 of Form 8-K filed by the Registrant with the Securities and Exchange Commission on June 5, 2013. |
||
|
|
|||
10.5 |
|
Incorporated by reference to Exhibit 10.1 of Form 8-K filed by the Registrant with the Securities and Exchange Commission on April 24, 2014. |
|
|
|
|
|||
10.6 |
Restricted Stock Agreement by and between Wesbanco, Inc. and Todd F. Clossin. ** |
|
Incorporated by reference to Exhibit 10.2 of Form 8-K filed by the Registrant with the Securities and Exchange Commission on October 24, 2013. |
|
|
|
|||
10.7 |
Wesbanco, Inc. KSOP, Amended and Restated, effective January 1, 2014. ** |
|
Incorporated by reference to Exhibit 10.21 of Form 10-K filed by the Registrant with the Securities and Exchange Commission on February 27, 2015. |
|
|
|
|
|
|
10.8 |
First Amendment to the Wesbanco, Inc. KSOP, effective January 1, 2014. ** |
|
Incorporated by reference to Exhibit 10.22 of Form 10-K filed by the Registrant with the Securities and Exchange Commission on February 27, 2015. |
|
|
|
|||
10.9 |
Second Amendment to the Wesbanco, Inc. KSOP, effective January 1, 2014. ** |
|
Incorporated by reference to Exhibit 10.23 of Form 10-K filed by the Registrant with the Securities and Exchange Commission on February 27, 2015. |
|
|
|
|||
10.10 |
|
Incorporated by reference to Exhibit 10.1 of Form 10-Q filed by the Registrant with the Securities and Exchange Commission on July 30, 2015. |
||
|
|
|||
10.11 |
Wesbanco, Inc. Administrative Rules for the Total Shareholder Return Plan. ** |
|
Incorporated by reference to Exhibit 10.1 of Form 8-K filed by the Registrant with the Securities and Exchange Commission on November 24, 2015. |
|
|
|
|||
10.12 |
|
Incorporated by reference to Exhibit 10.25 of Form 10-K filed by the Registrant with the Securities and Exchange Commission on February 26, 2016. |
||
|
|
|||
10.13 |
Third Amendment to the Wesbanco, Inc. KSOP, effective September 9, 2016. ** |
|
Incorporated by reference to Exhibit 10.31 of Form 10-K filed by the Registrant with the Securities and Exchange Commission on February 27, 2018. |
|
|
|
|||
139
10.14 |
|
Incorporated by reference to Exhibit 10.2 to Form 10-Q filed by the Registrant with the Securities and Exchange Commission on July 31, 2017. |
|
|
|
||
10.15 |
Fourth Amendment to the Wesbanco, Inc. KSOP effective April 1, 2018. ** |
|
Incorporated by reference to Exhibit 10.36 of Form 10-K filed by the Registrant with the Securities and Exchange Commission on March 1, 2019. |
|
|
||
10.16 |
Fifth Amendment to the Wesbanco, Inc. KSOP effective August 20, 2018. ** |
|
Incorporated by reference to Exhibit 10.37 of Form 10-K filed by the Registrant with the Securities and Exchange Commission on March 1, 2019. |
|
|
|
|
10.17 |
Sixth Amendment to the Wesbanco, Inc. KSOP effective January 1, 2020.** |
|
Incorporated by reference to Exhibit 10.34 of Form 10-K filed by the Registrant with the Securities and Exchange Commission on February 28, 2020. |
|
|
||
10.18 |
Seventh Amendment to the Wesbanco, Inc. KSOP effective November 22, 2019. ** |
|
Incorporated by reference to Exhibit 10.35 of Form 10-K filed by the Registrant with the Securities and Exchange Commission on February 28, 2020. |
|
|
|
|
10.19 |
|
Incorporated by reference to Exhibit 10.1 of Form 8-K filed by the Registrant with the Securities and Exchange Commission on December 17, 2021. |
|
|
|
|
|
10.20 |
|
Incorporated by reference to Exhibit 10.2 of Form 8-K filed by the Registrant with the Securities and Exchange Commission on December 17, 2021. |
|
|
|
||
10.21 |
|
Incorporated by reference to Exhibit 10.1 of Form 8-K filed by the Registrant with the Securities and Exchange Commission on February 22, 2022. |
|
|
|
|
|
10.22 |
|
Incorporated by reference to Exhibit 10.2 of Form 8-K filed by the Registrant with the Securities and Exchange Commission on July 5, 2022. |
|
|
|
|
|
10.23 |
Form of Wesbanco, Inc. Incentive Bonus, Option & Restricted Stock Plan – Stock Option Agreement. ** |
|
Incorporated by reference to Exhibit 10.1 of Form 10-Q filed by the Registrant with the Securities and Exchange Commission on August 3, 2023. |
|
|
|
|
10.24 |
|
Incorporated by reference to Exhibit 10.2 of Form 10-Q filed by the Registrant with the Securities and Exchange Commission on August 3, 2023. |
|
|
|
|
|
10.25 |
Eighth Amendment to the Wesbanco, Inc. KSOP, effective January 1, 2023. ** |
|
Incorporated by reference to Exhibit 10.3 of Form 10-Q filed by the Registrant with the Securities and Exchange Commission on August 3, 2023. |
|
|
|
|
10.26 |
Ninth Amendment to the Wesbanco, Inc. KSOP, effective July 31, 2023. ** |
|
Incorporated by reference to Exhibit 10.4 of Form 10-Q filed by the Registrant with the Securities and Exchange Commission on August 3, 2023. |
|
|
|
|
10.27 |
|
Incorporated by reference to Exhibit 10.1 of Form 8-K filed by the Registrant with the Securities and Exchange Commission on July 21, 2023. |
|
|
|
|
|
10.28 |
|
Incorporated by reference to Exhibit 10.2 of Form 8-K filed by the Registrant with the Securities and Exchange Commission on July 21, 2023. |
|
|
|
|
|
10.29 |
|
Incorporated by reference to Exhibit 10.3 of Form 8-K filed by the Registrant with the Securities and Exchange Commission on July 21, 2023. |
|
|
|
|
|
140
11 |
|
Computation of earnings per common share is set forth under Note 2, “Earnings Per Common Share” of this Annual Report on Form 10-K. |
|
|
|
|
|
21 |
|
* |
|
|
|
|
|
23 |
Consent of Independent Registered Public Accounting Firm, Ernst & Young LLP. |
|
* |
|
|
||
24 |
|
* |
|
|
|
||
31.1 |
|
* |
|
|
|
||
31.2 |
|
* |
|
|
|
||
32.1 |
|
* |
|
|
|
||
97 |
Policy Relating to Recovery of Erroneously Awarded Compensation. |
|
* |
|
|
||
101.INS |
Inline XBRL Instance Document (the instance document does not appear in the Interactive Data File because its XBRL tags are embedded within the Inline XBRL document). |
|
*** |
|
|
||
101.SCH |
Inline XBRL Taxonomy Extension Schema With Embedded Linkbase Document |
|
*** |
|
|
|
|
104 |
Cover Page Interactive Data File (formatted as inline XBRL and contained in Exhibit 101). |
|
*** |
* Filed herewith
** Indicates management compensatory plan, contract, or arrangement
*** Filed electronically
(P) Paper Filed
141
SIGNATURES
Pursuant to the Requirements of Section 13 or 15(d) of the Securities Exchange Act of 1934, the Registrant has duly caused this report to be signed on its behalf by the undersigned, thereunto duly authorized, on February 26, 2024.
|
|
|
WESBANCO, INC. |
|
|
|
|
|
By: |
|
/s/ Jeffrey H. Jackson |
|
|
|
Jeffrey H. Jackson |
|
|
|
President and Chief Executive Officer |
Pursuant to the requirements of the Securities Exchange Act of 1934, this report has been signed below by the following persons on behalf of the registrant and in the capacities indicated, on February 26, 2024.
|
By: |
|
/s/ Jeffrey H. Jackson |
|
|
|
Jeffrey H. Jackson |
|
|
|
President, Chief Executive Officer, and Director |
|
|
|
(Principal Executive Officer) |
|
By: |
|
/s/ Daniel K. Weiss, Jr. |
|
|
|
Daniel K. Weiss, Jr. |
|
|
|
Executive Vice President and Chief Financial Officer |
|
|
|
(Principal Financial and Accounting Officer) |
|
By: |
|
/s/ Christopher V. Criss |
|
|
|
Christopher V. Criss |
|
|
|
Chairman of the Board |
The Directors of Wesbanco (listed below) executed a power of attorney appointing Jeffrey H. Jackson their attorney-in-fact, empowering him to sign this report on their behalf.
|
By: |
|
/s/ Jeffrey H. Jackson |
|
|
|
Jeffrey H. Jackson |
|
|
|
Attorney-in-fact |
Rosie Allen-Herring |
|
Lisa A. Knutson |
Todd F. Clossin |
|
Gary L. Libs |
James W. Cornelsen |
|
Jay T. McCamic |
Michael J. Crawford |
|
F. Eric Nelson, Jr. |
Abigail M. Feinknopf |
|
Gregory S. Proctor, Jr. |
Robert J. Fitzsimmons |
|
Joseph R. Robinson |
Denise Knouse-Snyder |
|
Kerry M. Stemler |
D. Bruce Knox |
|
Reed J. Tanner |
142