UNITED STATES
SECURITIES AND EXCHANGE COMMISSION
WASHINGTON, D.C. 20549
FORM
(Mark One)
For the fiscal year ended
or
For the transition period from to
Commission File Number:
(Exact Name of Registrant as Specified in its Charter)
| ||
(State of or other Jurisdiction Incorporation or Organization) | (I.R.S. Employer Identification No.) | |
(Address of Principal Executive Offices) | (Zip Code) |
Registrant's Telephone Number, Including Area Code: (
Securities Registered Pursuant to Section 12(b) of the Act:
Title of Each Class |
| Trading Symbol |
| Name of Each Exchange On Which Registered |
Perpetual Preferred Stock, par value $0.0001 per share Tandem Preferred Stock, par value of $0.0001 per share |
Indicate by check mark if the Registrant is a well-known seasoned issuer, as defined in Rule 405 of the Securities Act. ☐ Yes ☒
Indicate by check mark if the Registrant is not required to file reports pursuant to Section 13 or Section 15(d) of the Act. ☐ Yes ☒
Indicate by check mark whether the Registrant (1) has filed all reports required by Section 13 or 15(d) of the Securities Exchange Act of 1934 during the preceding 12 months (or for such shorter period that the Registrant was required to file such reports), and (2) has been subject to such filing requirements for the past 90 days. ☒
Indicate by check mark whether the Registrant has submitted electronically every Interactive Data File required to be submitted pursuant to Rule 405 of Regulation S-T (§ 232.405 of this chapter) during the preceding 12 months (or for such shorter period that the Registrant was required to submit such files). ☒
Indicate by check mark whether the Registrant is a large accelerated filer, an accelerated filer, a non-accelerated filer, or a smaller reporting company. See definitions of “large accelerated filer”, “accelerated filer”, “smaller reporting company” and “emerging growth company” in Rule 12b-2 of the Exchange Act.
Large accelerated filer ☐ | Accelerated filer ☐ | Smaller reporting company | |
Emerging growth company |
Indicate by check mark whether the Registrant is a shell company (as defined in Rule 12b-2 of the Act).
Indicate by check mark whether the registrant has filed a report on and attestation to its management’s assessment of the effectiveness of its internal control over financial reporting under Section 404(b) of the Sarbanes-Oxley Act (15 U.S.C. 7262(b)) by the registered public accounting firm that prepared or issued its audit report.
If securities are registered pursuant to Section 12(b) of the Act, indicate by check mark whether the financial statements of the registrant included in the filing reflect the correction of an error to previously issued financial statements.
Indicate by check mark whether any of those error corrections are restatements that required a recovery analysis of incentive-based compensation received by any of the registrant’s executive officers during the relevant recovery period pursuant to §240.10D-1(b). ☐
The aggregate market value of the Registrant’s voting common equity held by non-affiliates of the Registrant, computed by reference to the price at which such voting common equity was last sold as of June 30, 2023, was approximately $
As of April 2, 2024, the Registrant had
____________________________________
DOCUMENTS INCORPORATED BY REFERENCE
The information required by Part III of this Report, to the extent not set forth herein, is incorporated herein by reference from the registrant’s definitive proxy statement relating to the Annual Meeting of Shareholders to be held in 2024, which definitive proxy statement shall be filed with the Securities and Exchange Commission no later than 120 days after the close of the fiscal year ended December 31, 2023.
TABLE OF CONTENTS
2
SPECIAL NOTE REGARDING FORWARD-LOOKING STATEMENTS
Certain statements included in this Annual Report on Form 10-K (“Annual Report”) are not historical facts but are forward-looking statements for purposes of the safe harbor provisions under The Private Securities Litigation Reform Act of 1995. Forward-looking statements generally are accompanied by words such as “may”, “should”, “would”, “plan”, “intend”, “anticipate”, “believe”, “estimate”, “predict”, “potential”, “seem”, “seek”, “continue”, “future”, “will”, “expect”, “outlook” or other similar words, phrases or expressions. These forward-looking statements include statements regarding our industry, future events, the estimated or anticipated future results and benefits of the Novitex Business Combination, future opportunities for the combined company, and other statements that are not historical facts. These statements are based on the current expectations of Exela management and are not predictions of actual performance. These statements are subject to a number of risks and uncertainties regarding Exela’s businesses, and actual results may differ materially. The factors that may affect our results include, among others: the impact of political and economic conditions on the demand for our services; the impact of a data or security breach; the impact of competition or alternatives to our services on our business pricing and other actions by competitors; our ability to address technological development and change in order to keep pace with our industry and the industries of our customers; the impact of terrorism, natural disasters or similar events on our business; the effect of legislative and regulatory actions in the United States and internationally; the impact of operational failure due to the unavailability or failure of third-party services on which we rely; the effect of intellectual property infringement; and other factors discussed in this report under the headings “Risk Factors”, “Legal Proceedings”, “Management’s Discussion and Analysis of Financial Condition and Results of Operations” and otherwise identified or discussed in this Annual Report. You should consider these factors carefully in evaluating forward-looking statements and are cautioned not to place undue reliance on such statements, which speak only as of the date of this report. It is impossible for us to predict new events or circumstances that may arise in the future or how they may affect us. We undertake no obligation to update forward-looking statements to reflect events or circumstances occurring after the date of this report. We are not including the information provided on the websites referenced herein as part of, or incorporating such information by reference into, this Annual Report. In addition, forward-looking statements provide Exela’s expectations, plans or forecasts of future events and views as of the date of this report. Exela anticipates that subsequent events and developments will cause Exela’s assessments to change. These forward-looking statements should not be relied upon as representing Exela’s assessments as of any date subsequent to the date of this report.
DEFINED TERMS
In this Annual Report, we use the terms “Company”, “we”, “us”, or “our” to refer to Exela Technologies, Inc. and its consolidated subsidiaries, and where applicable, our predecessors SourceHOV and Novitex prior to the closing of the Novitex Business Combination. Following is a glossary of other abbreviations and acronyms that are found in this Annual Report.
“Appraisal Action” means the petition for appraisal pursuant to 8 Del. C. § 262 in the Delaware Court of Chancery, captioned Manichaean Capital, LLC, et al. v. SourceHOV Holdings, Inc., C.A. No. 2017 0673 JRS. (pursuant to which former stockholders of SourceHOV sought, among other things, a determination of the fair value of their 10,304 SourceHOV shares at the time of the Novitex Business Combination).
“BPA” means business process automation.
“BPO” means business process outsourcing.
“Common Stock” means the common stock of Exela Technologies, Inc., par value $0.0001.
“EIM” means enterprise information management.
“EMEA” means Europe, Middle East, and Africa geographical region.
“ERP” means enterprise resource planning system.
“Exchange Act” means the Securities Exchange Act of 1934, as amended.
“GAAP” means generally accepted accounting principles in the United States.
3
“HGM Group” means, collectively, HandsOn Global Management LLC, HOVS LLC and HandsOn Fund 4 I, LLC and certain of their respective affiliates.
“HIPAA” means the Health Insurance Portability and Accountability Act of 1996.
“IT” mean information technology.
“JOBS Act” means the Jumpstart our Business Startups Act.
“Nasdaq” means The Nasdaq Capital Market.
“Novitex” means Novitex Holdings, Inc., a Delaware corporation.
“Novitex Business Combination” means the transactions contemplated by the Novitex Business Combination Agreement, which closed on July 12, 2017 and resulted in SourceHOV and Novitex becoming our wholly-owned subsidiaries and the financing transactions entered into in connection therewith.
“Novitex Business Combination Agreement” means the Business Combination Agreement, dated February 21, 2017, among the Company, Quinpario Merger Sub I, Inc., Quinpario Merger Sub II, Inc., SourceHOV, Novitex, HOVS LLC, HandsOn Fund 4 I, LLC and Novitex Parent, L.P., as amended.
“PCIDSS” means the Payment Card Industry Data Security Standard.
“Quinpario” means Quinpario Acquisition Corp. 2, a Delaware corporation, the former name of Exela Technologies, Inc.
“SEC” means the United States Securities and Exchange Commission.
“Securities Act” means the Securities Act of 1933, as amended.
“SourceHOV” means SourceHOV Holdings, Inc., a Delaware corporation.
“TCJA” means the Tax Cut and Jobs Act.
“TPS” means transaction processing solutions.
4
PART I
ITEM 1. BUSINESS
Exela is a business process automation leader, leveraging a global footprint and proprietary technology to provide digital transformation solutions enhancing quality, productivity, and end-user experience. By connecting data through user friendly software platforms and solutions, we enable our employees with business process management and help accelerate our customers’ digital transformation. We have decades of expertise earned from serving many of the world’s largest enterprises, including over 60% of the Fortune® 100 and in many mission critical environments across multiple industries, including banking, healthcare, insurance and manufacturing. For the fiscal year ended December 31, 2023, we generated $1.06 billion of revenue from over 4,000 customers throughout the world.
Our solutions and services touch multiple elements within a customer’s organization. We use a global delivery model and primarily host solutions in our data centers, on the cloud, or directly from our customers’ premises. As of December 31, 2023, half of our approximately 14,100 employees in 20 countries operate remotely, and the remainder operate from our business facilities or are co-located at our customers’ facilities. Our solutions are location agnostic, and we believe the combination of our hybrid hosted solutions and global work force in the Americas, EMEA and Asia offers a meaningful differentiation to the industries we serve and services we provide.
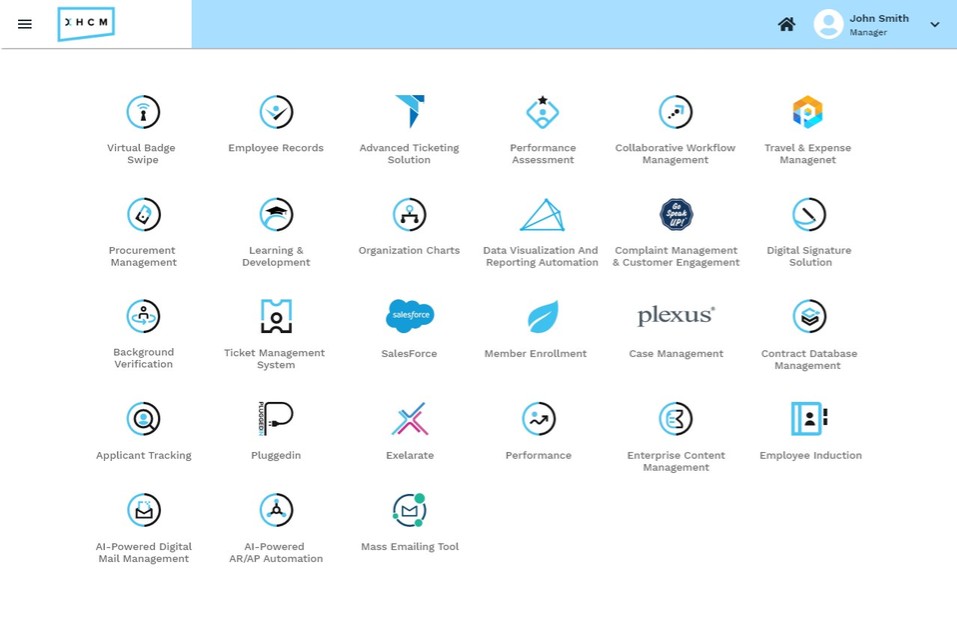
Above is an example of on-demand access to multi-factor authentication available to one of our employees working from anywhere. A similar portal is available to our customers for showing contracted for services.
5
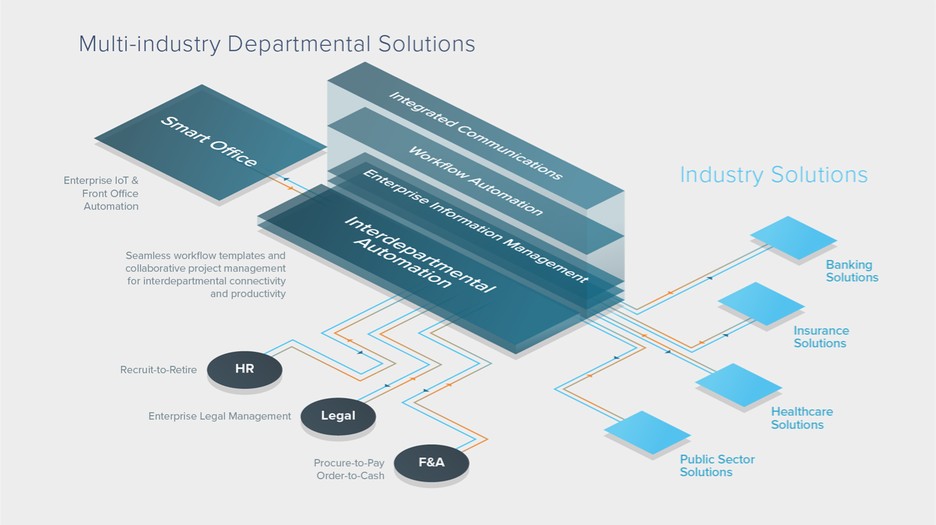
We will continue to expand our solutions and services for the industries we serve, with a focus on connecting the front, middle and the back office. We believe this positions us as one of the few companies that can offer solutions and services that span from multi-industry departmental solutions to industry specific solutions.
Our Solutions and Services
We are a leading, global provider in the Business Process Management (“BPM”) industry. Our digital foundation has been shaped to deliver outsourced solutions for current and evolving customer needs. Specifically, our seven-layer technology stack enables easier integration to build digital bridges over broken processes. We derive all our revenue from BPM, including approximately $94.0 million (8.8% of total revenues) in 2023 from our digital assets group (“DAG”).
We host our digital foundation across a hybrid environment, both on-premise and/or on the cloud and our customers are able to choose based on their needs. Our customers also take advantage of hybrid deployments leveraging either our or their own environment. We sell recurring licenses and maintenance to our customers, along with professional services for configuration and system integration services. We offer multiple options in relation to licensing: customers can purchase a license for a number of transactions, however they usually acquire multi-year term licenses with flexible recurring options, and as part of our DAG offerings, we also offer per user per month subscriptions. We plan for a growing portion of our digital foundation to be made available along these pricing and licensing models. Our solutions are evolving to contain more self-service features, are easy to deploy, and integrate with existing solutions, including for small and medium sized businesses.
Our BPM solutions have expanded to include a suite of Work from Anywhere (“WFA”) applications to support a remote workforce with enterprise software for connectivity and productivity. Our current BPM solutions are grouped as follows:
| ◾ | Finance & Accounting Services, including Procure-to-Pay, Order-to-Cash, Record-to-Report, FP&A and Expense Management |
| ◾ | Payment Technologies and Services |
| ◾ | Human Capital Management |
6
| ◾ | Healthcare Payers and Revenue Cycle Management (RCM) |
| ◾ | WFA Solutions |
| ◾ | Enterprise Information Management |
| ◾ | Integrated Communications and Marketing Automation Solutions |
| ◾ | Contact Center Services |
| ◾ | Reaktr.ai Solutions for Cyber security, Data Modernization and Cloud management, and generative AI |
| ◾ | Digital Storefront Solutions for Enterprise Customers |
Our multi-industry and departmental BPM suite of offerings combines platform modules for finance and accounting services, enterprise information management, robotic process automation, digital mailroom, business process management and workflow automation, visualization and analytics, contract management and legal management solutions, and integrated communication services which contribute to revenues across our organization and accounting segments and also complement our core industry solutions for banking, insurance, healthcare and the public sector.
Finance and Accounting Solutions (F&A)
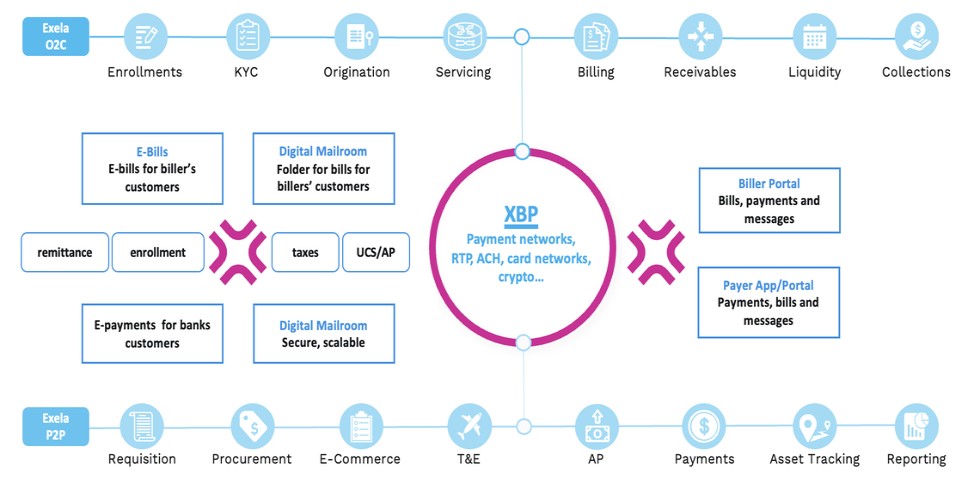
Exela offers a suite of finance and accounting (“F&A”) solutions providing digital roads to connect global commerce. By structuring and linking digital data across disparate customer systems, processes and standards, our exchange for bills and payments (“XBP”) enables digital transformation savings and modernization to be rapidly implemented utilizing existing customer infrastructure and in-country settlement processes. We provide process automation and enhanced services addressing the payments lifecycle from procure to pay (“P2P”) to order to cash (“O2C”). We use our own technology and our global operations to deliver these solutions.
Our XBP solution provides a platform with a secure messaging service, allowing billers, consumers and businesses to communicate and transact utilizing a modern technology stack that can be rapidly connected to any system without material investment by our customers. Billers are able to send bills to payers, whether businesses or consumers, electronically, offering transparency and simpler reconciliations. Payers are able to receive their bills in one place, with analytics, alerts and several payment options. With XBP making the bill component of P2P and O2C electronic, downstream processes can be integrated with richer and more actionable data.
Our O2C solutions enable consolidation of inbound payment channels and data continuity to drive digital adoption and enhance treasury management, including integrated receivables dashboards, multi-channel bill presentment and payment, reconciliation, exception and dispute management, aging analytics, collections management and targeted engagements. The full process includes fulfillment of a customer order, raising an invoice in accordance with customer contracts, accounts receivable management and collections.
Our P2P services can be integrated with our digital mail room technology, which expands our ability to support existing data types and formats. In effect, both digital and analog items can enter this information stream. The process begins by opening a requisition, and once approved it moves to procurement to solicit bids from an approved supplier network. We believe that supporting our customers by making available our supplier network can be a key differentiator in enabling a complete P2P solution. Our P2P platform also records receipt of goods and invoices and performs three way matching digitally. Exceptions are processed by our employees, and once approved, we record the purchase in a customer’s ERP system, so it can be paid. We then use our system to generate and deliver a payment file in the format the bank needs so that a payment can be processed. Some of our customers also authorize us to process the payment on their behalf.
Our Record-to-Report (R2R) services include spend analytics and data mining tools for financial planning and analysis to support reporting and audit functions, interchanges and robotics providing automation of ERP entries and regulatory reporting and fixed asset management.
7
Our mission is to connect bills, payments and many related processes across many industries by utilizing XBP:

Enterprise Information Management (EIM)
Exela’s enterprise information management (“EIM”) solutions ingest and organize large amounts of data and store the information in cloud enabled proprietary platforms. We also gather transactional data from enterprise systems for similar hosting. The collected, extracted data is used to complete a process, and is then made available to our customers and their end-consumers for an agreed upon period. We derive revenue for such services, hosting and access.
Our EIM systems host billions of often mission critical records for our customers and the total number continues to rise. As an example of a large deployment of our EIM platform, we helped enable online records access to over 63 million end-customers of a group of European savings banks for deposits, statements, and car and personal loans and mortgages. Another example of EIM deployment is in the hosting of images of healthcare records, checks and payroll taxes for many years for retrieval, compliance and internal information purposes.
Our platforms simplify integration with customers’ existing EIM systems, and our customers can benefit from being able to conduct federated searches across connected datasets, manage records in accordance with their needs and regulatory requirements, build live customer and employee profiles, and facilitate release of information and routing with control over security and permissions. We also provide business intelligence add-ons, offering summarization of data sets, dashboards and trend monitoring, relationship visualization, macro and micro drill-downs, escalation triggers and notifications.
Exela Robotic Process Automation
Exela has been at the forefront of using robotic process automation since 2009. Our deployment model is to use desktop automation first, and if the usage is very high, we usually migrate to server level automation. We have built a large library of rules by industry and by customer. While we have been using robotic solutions as part of our internal processes for years, only recently have we made them available to our customers. Our domain experts and analysts can
8
use an existing bot, modify one or create new ones using our design studio. Our robotic solutions are available as programmable robots with a rules library for a specific industry or feature, or as an enterprise license or on a per user per month basis.
Digital Mailroom Solutions
Exela is one of the leading global providers of digital mailroom (“DMR”) solutions. Our DMR solutions rely on proprietary technology, use our own or a customer’s facilities, and process a significant number of transactions daily. Our end-to-end DMR solution features ingestion from many sources – paper, fax, email and other digital data. We also offer recorded voice, image and video ingestion channels. This solution can be complemented with our shipping and receiving services with digital receipt, delivery and routing to our intelligent lockers. Our DMR SMB offering is experiencing rapid adoption, across geographies, and is serving as a catalyst for us to expand the features of DMR with additional proprietary platforms.
We own and deploy several classification engines for information processing, including unattended digital repositories, for example unattended email boxes that identify content and route it to the appropriate member of an organization. Exela offers DMR for enterprise wide deployment to captive mailrooms of our customers, mailrooms outsourced to both Exela and others, and for business locations where there is no dedicated mail room, such as a front desk. Our customers can see their information across the enterprise from a single platform. Our DMR solutions are available as SaaS, BpaaS or enterprise licenses and we often handle the entire mail operation for a customer.
Business process management and intelligent workflow automation
Exela has built extensive proprietary workflow automation platforms for business process management across several industries and regions. Our platforms are designed to have intuitive user interfaces with drag & drop configuration enabling a certain amount of customization. Our platforms use our EIM engines by default, are designed to integrate with popular database and enterprise systems, and are offered across three user categories:
| ● | Enterprise class, hosted on premises. Suitable for 10,000 or more users and 10,000 or more tasks or process automations. Over 10,000 of our employees use this every day to perform mission critical work for our customers in the Americas, EMEA and Asia. |
| ● | Interdepartmental class workflow automation is ideal to bring structure and collaboration across departments. Over 2,500 of our employees globally use this platform to collaborate with each other and their individual work management. The platform is designed to integrate with other industry leading platforms to create a comprehensive collaborative experience. |
| ● | Case-management workflow automation platform available as a shrink wrap version for building custom workflows. One can use our library of workflows, customize them or build one from scratch for purposes of case management only. Customers can buy enterprise licenses of this platform, or on a SaaS basis and build their own workflows. |
Exela provides visualization and analytics capabilities within its platforms to provide actionable intelligence tied to collaboration and task management. Configurable dashboards enable users to quickly consolidate and organize disparate data sources through intuitive interfaces. Users can also build their own dashboards with dynamic drilldown options and alerts, link data to managers, and launch action items in pursuit of optimization and issue resolution. By providing analytics tied to actionable tasks, we can help drive optimization to enhance profitability and connectivity. For example, users can create visualization of volume trends and set triggers upon statistical thresholds, sending SMS alerts to managers to adjust their downstream capacity planning, if trends are not in line with set thresholds.
We offer reporting and analytics on the scope of work processed through operations, and we also provide our customers the capability to consolidate various data streams into comprehensive dashboards to enhance business intelligence, including providing real-time visibility to revenue, cost, profitability and cash flow as well as process monitoring, KPI tracking, and actionable alerts.
9
We believe providing analytics modules complement our services and solutions, creating a superior user experience, and reducing the need for other third-party tools by centralizing business management in Exela’s platforms. By enabling users to share dashboards across their organization, we believe additional users will adopt Exela platforms and increase our penetration into the front-end applications across an enterprise.
Enterprise Legal Management
Exela provides a contract management system to streamline execution, organization, and data management of large volumes of contracts. We utilize natural language processing and machine learning to extract key terms within unstructured formats and complex content, providing variance analysis, summary tables, and automated organization. Users can easily find important data points in contracts, and quickly analyze large volumes of language variations across format types. The extracted data can then be used to connect to existing systems and ERPs and serve as inputs to business operations, such as accounting and billing processes, financial planning and analysis, and regulatory reporting, enabling real-time audit and automated alerts for deviations from contract parameters. By automating key term extraction, our contract management system enables large volumes of contracts to be analyzed quickly and enables processes such as billing or automatic reminders for significant dates. We believe that Exela’s ability to cost effectively provide high accuracy transactional operations with automated validations creates a competitive advantage against those relying on manual processes and discrete sampling.
Exela can also provide a digital signature system to streamline collaboration, approvals and execution of contracts. We deploy a secure, hosted environment to request and execute signatures and exchange contracts and documents across individuals or groups. Our platform, Drysign®, enables multiple signature execution with routing through approval hierarchies, while providing transparency to the status and tracking of comments and edits. Upon execution, documents are stored electronically for secure archiving and retrieval. As part of our expanded focus on WFA, we launched Drysign to the SMB and individual user market in 2020, initially in the Americas, but since then also expanding into the UK, India and Philippines, and into France and Germany in the spring of 2022. Drysign is offered through a dynamic pricing model, including freemium for low volume users, various SMB plans and also on a per user per month for enterprises. Adoption rate for Drysign since launch has been steady, quarter over quarter.
Furthermore, Exela offers a suite of enterprise legal management solutions and services that streamline and automate legal department processes to rationalize costs and drive productivity. Solutions and services range from preventative remediation, identifying risks such as overcharges, discrimination, and data breaches and proactively providing restitution, eDiscovery, word processing and contract management using automated summarization and metadata extraction along with cognitive search enabled by natural language processing; and records management.
Integrated Communications and Marketing Automation Solutions
Exela’s comprehensive multi-channel integrated communications solutions help customers communicate with other businesses or customers. This suite of solutions links through many channels, for example, email, print and mail, SMS, web, voice, and chat. Exela solutions and services can also include design and marketing and selection of optimal engagement and least cost routing for mission critical communications for example, bills, statements, enrollments, customer support, targeted marketing, mass notifications, reprographics, and regulatory notices.
We also work with our customers as a digital migration partner to improve user experience while helping to reduce and even eliminate inefficient, wasteful communications. We use proprietary discovery techniques and analytics in addition to service specific technology to propose optimal channel and content. Our employees can also generate personalized messages, customized promotions, incentives, escalations, and resolutions.
10
Exela Smart Office
In the second half of 2019, we launched a group of solutions that complement our existing offerings, labeled Exela Smart Office℠ (“Smart Office”). Smart Office seeks to improve employee and visitor experiences while optimizing facility management efficiency thereby contributing towards corporate sustainability standards. Smart Office is our enterprise IoT, which helps transform the front-office, energy and facilities management, logistics and fulfillment for our customers, and provides on-demand services with connected devices to facilitate green initiatives, and reduce waste. For example, our space management software uses sensors to detect facility utilization, which enables optimized space and energy usage and provides mobile workers directions to available work spaces, while our Contactless Entry and Exit (“CEE”) and lobby kiosk can be deployed to regulate facility access and track employee activities with automated time sheets. Our FYI platform connects our customers’ employees with AI assisted digital help desk channels across departments and a federated search forum to quickly explore related topics and discussions. Our Intelligent Lockers are available for visitor day storage of luggage and to provide a secure chain of custody for parcels and mail for employees using our hosted shipping and receiving tools. In June 2023, we sold our high-speed scanner business which accounted for approximately 1% of our 2022 revenue.
Human Capital Management (“HCM”)
We have on-boarded all of our employees to our proprietary human capital management platform, HCM. This platform integrates with our existing offerings and is designed to help an enterprise and its employees manage the data and processes relevant to the entire employment lifecycle from recruitment to retirement. By providing digital management and data tracking for human capital, we enable reduction in administrative overhead and enhanced management of human capital productivity while improving the overall experience. Our human capital management platform is available for sale. HCM has been supplemented by our human resource outsourcing solution, Exela HRS, launched in 2021. Exela HRS includes services such as recruitment, payroll and benefits administration, offered to SMBs and enterprises. Exela’s learning management platform, LYNX, launched as a SaaS offering in 2022.
Industry Specific Services and Solutions
While the above-described solutions and services can be leveraged across industries, over the years we have also developed services and solutions for specific industries which help our customers around the world better manage their liquidity. The most significant are summarized below.
Banking and Financial Industry Solutions and Services
Our banking and financial solutions consist of payment, mortgage, enrollment, lending and loan management, governance and information management solutions and accounted for approximately 24% of 2023 revenue. Exela’s payment operations and treasury management solutions are designed to improve digital engagement and transaction speed and compliance. We also provide mobile and remote deposit technologies to our banking and financial services customers.
We are one of the largest non-bank processors of payments. We handle many payment channels in addition to checks and credit cards including, automated clearing house (ACH), Faster Payments in UK, Single European Payment Area (SEPA), Bank Giro in the Nordics and other payment networks. We perform these services on behalf of banks or their customers. We believe the regulatory environment in many geographies is beginning to allow non-bank payment processors to connect to the payment networks directly such that one can verify funds, confirm payee and settlement of payments and are pursuing a PSP license in the European Union to further expand our payment offerings.
We have extensive experience and technology that we have built over decades to serve many banks and companies to process the payments related to both business to business (“B2B”) and business to consumer (“B2C”) transactions. We develop, use, and sell proprietary integrated receivables processing technology, providing our customers with a solution that consolidates B2B and B2C transactions across many payment channels into a single platform, connected to our XBP network of global buyers and suppliers. We plan to offer this as a branded or as a
11
private label solution to our banking customers giving them the ability to offer advanced treasury solutions with insights from accounts receivable, customer credit worthiness, payment habits, soft collections and delinquent collections.
We add value by automating manual, repetitive processes to improve speed and provide cost efficiencies within a compliant mortgage and lending completion process. Our proprietary mortgage and loan management solutions enable lenders to originate loans and service them with greater efficiency. Our platforms also enable invoice discounting, factoring, payables financing and leverage automation and integration such that traditional lenders and alternate lenders, including peer to peer lenders can provide liquidity to underserved borrowers.
Our key focus is connecting broken billing and payment processes through XBP using secure messaging and established settlement infrastructure. By providing a digital transformation path without heavy integration requirements, we believe we can rapidly improve user experience, reduce postage, print and mail costs, enable faster decisions, and facilitate optimal allocation of capital and risk management for our customers. By using our solutions and services, we believe our banking and financial services customers can better manage their lending book and at a lower cost of ownership.
Our banking solutions help organizations transform compliance, know your customer, anti-money laundering and confirmation of payee checks into a competitive advantage, including accelerated digital on-boarding, complex process automation, screening and monitoring and predictive analytics. Exela can provide these services as an end-to-end solution or as an augmentation of existing banking processes, as a technology license or through our employees to manage a component or an entire process.
Healthcare Industry Solutions and Services for Insurance Companies and Healthcare Providers
Exela’s healthcare industry customers include commercial and government sponsored healthcare plans, hospital networks and university hospital systems and large medical distribution systems and pharmacy networks, and accounted for approximately 26% of total revenues in 2023. We serve our customers using our proprietary technology and for some customers combined with their systems.
We bundle our core solutions and services with a suite of healthcare payer and provider specific services such as end-to-end revenue cycle management (RCM), including revenue integrity solutions, enrollments and credentialing, claims processing, adjudication, and payment operations. We specialize in simplifying complex transactions that require multiple layers of validation, supporting document digitization, reconciliation, and management of exceptions.
In 2020, the Company launched a cloud-based claims processing gateway for the healthcare industry. The platform – PCH Global – enables healthcare providers (physicians and other healthcare practitioners) to streamline submission of healthcare claims, and enables payers (health insurers) to more efficiently process claims and related payments. The real benefit of the platform is the expected reduction in claim denials, faster processing of payments to providers, and ultimately, a better healthcare experience for patients. Acting as a central hub, PCH Global streamlines the paper claims process efficiently across the healthcare ecosystem, while also providing a complete digital payment infrastructure. These innovative services directly address two of the most costly and time-consuming aspects of managing healthcare claims.
PCH Global leverages its distributed architecture to integrate Exela’s multiple industry offerings, including two industry leading edit engines to enable cleaner claims at point of service, reducing the risk of denial and delay. Along with processing and application of payments, the healthcare analytics feature generates insights, enabling further actions and process improvement. The platform also incorporates revenue integrity, denial and appeals management. Currently, PCH Global processes approximately 900,000 claims per day under this ecosystem and is available for deployment in various business models including SaaS and BpaaS.
Insurance Industry Solutions and Services
Exela offers a suite of insurance industry solutions aimed at providing digital engagements and rapid integration of disparate systems and silos. Our insurance industry solutions accounted for approximately 8% of total revenues in
12
2023. We provide applications and services to facilitate automation and digital transformation for underwriting and enrollments, premium payments, claims submission, first notification of loss, fraud, waste & abuse monitoring and integrated communications. Our solutions are aimed at improving the customer experience by providing digital pathways and transparency with web portals and integrated communications, while helping to improve quality and risk management.
Public Sector
We provide technology and solutions to public sector customers. Our public sector solutions accounted for approximately 10% of total revenues in 2023. Our mission is to help our public sector customers with their digital journey and meet their objectives of better serving the public. Exela solutions are primarily deployed across pension benefits and administration, tax return processing, payment operations, inter-agency information management and communications with citizens and employees of government institutions.
Our solutions have evolved over time to include digital capabilities and are designed to reduce taxpayer refund waiting time, decrease the potential for tax fraud, and provide reports and data to the relevant stakeholders. Exela also has the infrastructure in place to process payments, perform collection services, handle overflow taxpayer calls, provide e-filing for individual income tax, generate outbound taxpayer notification (traditional and/or electronic notifications), and host other developed solutions.
Commercial, Tech, Manufacturing, Telecommunication, Utilities, Pharma, Life Sciences and Legal Industries Solutions and Services
For the commercial, technology, manufacturing, telecommunication, utilities, pharma, life sciences and legal industries, we primarily provide multi-industry solutions described earlier. For 2023, our commercial industry revenue accounted for approximately 6% of total revenues, our revenues from the technology and manufacturing industry accounted for approximately 6%, our telecommunication and utilities industry revenue accounted for approximately 4% of total revenues, our pharma and life sciences industry revenue accounted for approximately 2% of total revenues, while our revenue from the legal industry accounted for approximately 5%.
Historically, the majority of revenue for the above-mentioned industries was generated in the Americas, though we believe there is significant expansion opportunity throughout EMEA and the Asian markets. As we have made investments in our global scale, technology platforms, and business strategy, some of our multi-national customers have expanded our services to other geographies to leverage our international footprint. We believe our value proposition as a single source provider with global platforms and location agnostic operations, positions us as a differentiated partner to our multi-national customers.
With the launch of Smart Office, we have been targeting technology companies in our initial go-to-market approach. We believe technology companies have a heavy focus on employee experience to attract top tier talent, and they often serve as early adopters for new offerings setting trends across other industries, and we believe they will serve as strong references as we expand our Smart Office growth strategy.
Cyber Security, Data Modernization and Cloud Management, and Generative AI
In January 2024, Exela announced the formation of Reaktr.ai, a business unit aimed at addressing the evolving needs of our clients in the cyber security, data modernization and cloud management, and generative AI spaces. With the constant threat of cybersecurity attacks, our clients’ operations are in need of robust fortification. Digital transformation is a broad subject, however all digital transformations have a common denominator, which is data modernization. Our data modernization solutions enable clients’ data to be cloud ready. In cases where clients are cloud ready, Reaktr.ai is able to advise on the right solutions and to undertake the transition and subsequent management of the digital data. All of these solutions are complemented by AI-powered platforms that supplement operations which we believe provides a competitive edge.
13
Overview of Revenues
We provide services to our customers on a global basis. In 2023, our revenues by geography were as follows: $877.3 million in the United States (82.4% of total revenues), $166.6 million in EMEA (15.7% of total revenues), and $20.3 million from the rest of the world (1.9% of total revenues). We present additional geographical financial information in Note 19 – Segment and Geographic Area Information within our consolidated financial statements.
Our business consists of three reportable segments:
| ● | Information and Transaction Processing Solutions ("ITPS"). Our largest segment, ITPS, spans across wide range of our solutions and services designed to aid businesses in information capture, processing, decisioning and distribution to customers primarily in the financial services, commercial, public sector and legal industries. The ITPS segment is our largest segment, with $732.3 million of revenues for the fiscal year ended December 31, 2023, representing 68.8% of our revenues. We generate ITPS revenues primarily from a transaction-based pricing model for the various types of volumes processed, licensing and maintenance fees for technology sales, and a mix of fixed management fee and transactional revenue for document logistics and location services. |
| ● | Healthcare Solutions ("HS"). HS segment includes our outsourcing business specializing in both the healthcare provider and payer markets. The HS segment generated $251.4 million of revenues for the fiscal year ended December 31, 2023, representing 23.6% of our revenues. We generate HS revenues primarily from a transaction-based pricing model for the various types of volumes processed for healthcare payers and providers. |
| ● | Legal & Loss Prevention Services ("LLPS"). Our LLPS segment includes a broad array of our support services in connection with class action settlement administration, claims adjudication, labor, employment and other legal matters. The LLPS segment generated $80.4 million of revenues for the fiscal year ended December 31, 2023, representing 7.6% of our revenues. We generate LLPS revenues primarily based on time and materials pricing as well as through transactional services priced on a per item basis. |
Additional financial information for our three business segments is included in Note 19 – Segment and Geographic Area Information within our consolidated financial statements.
Our revenues can be affected by various factors such as our customers' demand pattern for our services. These factors have historically resulted in lower revenues in the third quarter and higher revenues in the fourth quarter. Backlog is not a metric that we use to measure our business.
History and Development of Our Company
Exela is a Delaware corporation that was formed through the strategic combination of SourceHOV Holdings, Inc. ("SourceHOV") a leading global transaction processing company, and Novitex Holding, Inc. ("Novitex"), a cloud-based document outsourcing company, pursuant to a business combination agreement dated February 21, 2017. Formerly known as Quinpario Acquisition Corp. 2 ("Quinpario"), Exela was originally formed as a special purpose acquisition company on July 15, 2014 and completed its initial public offering on January 22, 2015. In conjunction with the completion of the Novitex Business Combination in July 2017, Quinpario was renamed "Exela Technologies, Inc." Exela began trading under the ticker "XELA" on the Nasdaq on July 13, 2017.
On April 10, 2018, Exela completed the acquisition of Asterion International Group, a well-established provider of technology driven business process outsourcing, document management and business process automation across Europe. The acquisition was strategic to expanding Exela’s European business.
On November 12, 2019 we announced that our Board of Directors (the “Board”) had adopted a debt reduction and liquidity improvement initiative (“Initiative”), the main goals of which was to increase the Company’s liquidity by $125 to $150 million and to reduce debt by $150 to $200 million in the subsequent two years. The Initiative was part of a strategic priority to position the Company for long-term success and increased stockholder value. As part of the Initiative, certain subsidiaries of the Company entered into accounts receivable securitization facilities during 2020 and
14
we consummated the sale of our tax benefits consulting group in March 2020 and our physical records storage and logistics business in July 2020. The Company has continued to pursue the goals of the Initiative including through the sale of non-core assets that are not central to the Company’s long-term strategic vision and engaging in transactions to reduce indebtedness and enhance liquidity:
• In fiscal year 2021 by:
| ● | Raising $407 million of gross equity capital; |
| ● | Reducing total long-term debt by $454 million; |
| ● | Settling the Appraisal Action. |
• In fiscal year 2022 by:
| ● | Raising additional $276 million of gross equity capital; |
| ● | Extinguishing its long-term debt maturing in 2022; |
| ● | Fully paying off the Appraisal Action; and |
| ● | Paying off securitization facilities and switching over to an off-balance sheet AR securitization facility with PNC. |
• In fiscal year 2023 by:
| ● | Issuing approximately $764.8 million aggregate principal amount of new notes in exchange for $956.0 million aggregate principal amount of existing 2026 notes; |
| ● | Executing a $40.0 million financing agreement and using the proceeds to repay existing debt; |
| ● | Fully discharging $48.4 million of outstanding principal amount of senior secured term loans scheduled to mature on July 12, 2023; |
| ● | Fully repaying $9.0 million of outstanding principal amount of the Company’s notes due 2023; |
| ● | Completing the sale of its high-speed scanner business on June 8, 2023 for a purchase price of approximately $30.1 million, subject to final working capital adjustments (the Company may also receive additional cash consideration upon the future occurrence of certain earn out events described in the sales agreement); and |
| ● | Completing the merger of its European business with CF Acquisition Corp. VIII (“CFFE”). |
On November 29, 2023, the Company completed the merger of its European business with CFFE. The combined company now operates as XBP Europe Holdings, Inc. (“XBP Europe”), a pan-European integrator of bills, payments and related solutions seeking to enable digital transformation of its more than 2,000 clients. Following the closing of the transaction the Company owns 72.3% of the outstanding capital stock of the combined company. The
15
shares and warrants of XBP Europe are listed on the Nasdaq Stock Market under the ticker symbols “XBP” and “XBPEW,” respectively.
Key Business Strategies
Exela business strategy is to use its Digital NowSM model, which aims to accelerate our customers’ digital transformation through deployment of our software automation techniques, hosted within a single, cloud hosted platform. Our overarching goal is to provide highest value and lowest cost of ownership. We accomplish this by building scalable systems that are used by our employees to deliver business process automation services globally. The key elements of our growth strategy are described below:
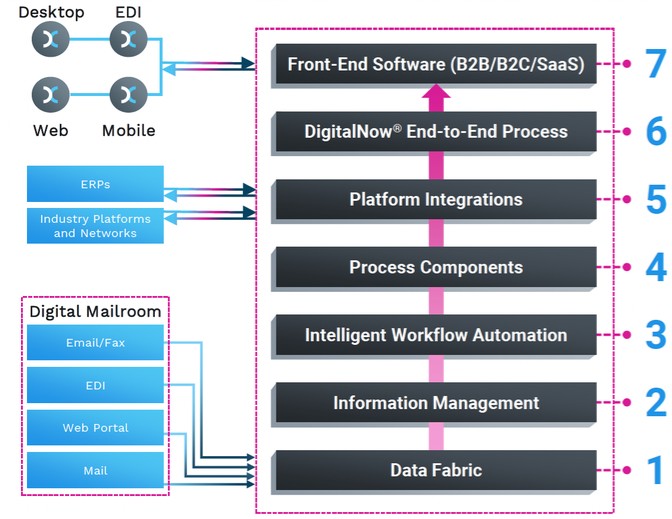
| ● | Expand Penetration of Solution Stack Across Customer Base. We seek to move up what we call “the seven layers of technology enabled solutions and services stack,” climbing the value chain from discrete services to end-to-end processes through use of front-end enterprise software. We believe continued deployment of our single sign on portals with on-demand applications will drive expansion of our front-end software (B2B/B2C/SaaS) and integrated offerings. |
| o | Layer 1 - Data Fabric - Host, gather, extract all types of structured and unstructured data, digital and analog |
| o | Layer 2 - Information Management - Digital classifications, data enhancement and normalization driving downstream processes improvement |
| o | Layer 3 – Intelligent Workflow Automation - Digital connectivity and automated decisioning driving productivity and quality |
| o | Layer 4 - Process Components - Operations partner for component(s) of larger process, handing off output file for downstream execution |
| o | Layer 5 - Platform Integrations - Exela platforms directly connected to customers’ core systems, accessed through SSO and common interfaces |
| o | Layer 6 - Digital Now End-to-End Process - Full cycle operations and technology for multi-channel process through execution of business outcomes |
| o | Layer 7 - Front-End Software (B2B/B2C/SaaS) - Exela front end applications (branded or private label) directly interfacing with end user experience |
16
See diagram of 7 layers of solutions below:
| ● | Expand relationships with existing customers. We intend to continue aggressively pursuing cross-selling and up-selling opportunities within our existing customer base. With an existing base of over 4,000 customers, we believe we have meaningful opportunities to offer a bundled suite of services and be a "one-stop-shop" for our customers' information and transaction processing needs. Our sales force is organized on an industry basis and utilizes solutions and relationships to better serve our customers across all levels of their organizations. As an example, we now offer a full suite of healthcare-focused solutions by bundling enrollments, policy and plan management, claims processing, audit and recovery services, payment solutions, integrated accounts payable and receivable, medical records management, and unified communication services for payers and providers. |
| ● | Expand XBP network of buyers and suppliers. The hundreds of millions of transactions we process globally present a significant opportunity to seamlessly connect all stakeholders with improved experience, lower cost, and value-added services. We intend to expand the scope and scale of services we offer to our customers by leveraging the integration value our existing network provides as we endeavor to further connect buyers and suppliers to communicate and transact digitally. |
| ● | XBP for ERP Consolidation. Managing multiple ERPs presents complex challenges, from integration hurdles to cash flow management issues. We offer a cost-effective solution, seamlessly integrating existing ERPs with our XBP platform. With expert guidance and data-driven insights, we centralize and standardize finance functions for our customers, covering Accounts Payable, Accounts Receivable, General Accounting, and Financial Reporting. Through best practices, automation, and AI, we elevate shared services, streamlining operations for optimal performance. |
| ● | Reaktr.ai - Taking the AI Plunge. Reaktr.AI was created as a direct result of the needs of our clients to fortify their operations and help them accelerate their digital transformation by serving as their data modernization and cloud migration partner, all of which are complemented by AI powered platforms. We have begun our outreach to clients and have commenced the investment cycle needed to make this a core offering. |
17
| ● | Leverage BPA suite across on-site services. Approximately 2,490 of our employees currently work at customers in an on-site capacity. We believe this on-site presence is a competitive differentiator and a valuable asset as we pursue future growth opportunities. We have been deploying our BPA software across these customer locations, and we believe that by offering our customers enhanced productivity and quality through our onsite employees, we will continue to create additional opportunities to expand our footprint and wallet share across their organization. For example, in customers where we provide underwriting support and claims processing, we can enable our onsite employees to accelerate the aggregation and analysis of datasets while also increasing accuracy and automatically flagging deficiencies using our software. By enhancing the productivity and quality of our onsite employees, we believe we will increase the demand from our customers to replicate our processes across their organization, bolstering our cross-sell/up-sell initiatives. By having our BPA suite already approved and deployed within existing onsite engagements, we believe our ability to expand into new lines of business will be streamlined and accelerated. |
| ● | Work-from-Anywhere (WFA) enablement – We believe the modern workforce will become more globalized, dynamic and distributed, demanding applications that support digital workflows, remote connectivity, productivity optimization and flexible facilities. We plan to continue expanding our WFA suite of enterprise and SMB software such as DMR, Drysign, Exela Remote Notarization and LYNX to meet the evolving needs of our customers and their employees. |
| ● | Pursue new customer opportunities. We plan to continue to develop new long-term, strategic customer relationships, especially where we have an opportunity to deliver a wide range of our capabilities and can have a meaningful impact on our customers' business outcomes. For example, we plan to dedicate resources within the legal industry in order to pursue opportunities in e-discovery and contract management services. |
| ● | Develop additional process capabilities and industry expertise. We will focus on developing additional process capabilities and market expertise for our core industries. We will continue to invest in technology and innovation that will accelerate the build-out of our portfolio of next-generation solutions, such as platform-based descriptive and predictive analytics services for processing flows of "Big Data" to help customers gain better insight into their processes and businesses. As an example, on behalf of our customers, we are deploying Big Data automation platforms to analyze individual consumer behavior and interaction patterns to identify opportunities for revenue enhancement and loss prevention, and configure optimal outreach campaigns to drive sales, loyalty, and profitability. |
| ● | Pursue meaningful cost synergy opportunities, make strategic investments, reposition services and accelerate long-term profitability. We adopted the work from anywhere model since 2021 to provide a safe place for our employee's and maintain compliance with the needs of our customers. We adapted to this hybrid model leveraging hyper automation and remote working platforms hosted in the cloud. This has enabled us to pursue savings in facilities as we need less space with fewer employees working from the office. We continue to consolidate production platforms into smaller number of platforms leading to higher utilization and lower maintenance costs of platforms. Also, we continue to pursue renegotiation of our customer contracts to adjust to current cost of living adjustments as wage inflation in the past had impacted us adversely. We also invested in building a center of excellence for some services. Finance and accounting outsourcing is one such service, which we have built out not only to serve our needs but also enables us to offer an expanded bundle of services to our customers. Another example is reorganization of our cyber security, AI solutions, data modernization, IT and networks with additional investments branded as Reactr.AI. |
We also reengineered processes to leverage our cloud and technology investments in mail rooms, digital exchange and public sector with a combination of AI solutions and the introduction of new digital imaging solutions built around scale hyper automation and work from anywhere cloud hosted platforms. To position the Company for growth and long-term profitability, we are investing in many key areas for example, business development, technology, new service offerings, sales functions and our finance organization to expand our pool of experienced and talented managers and execution bandwidth.
18
| ● | Capitalize on our enhanced scale and operating capacity. We intend to continue to utilize our global scale and brand recognition to strengthen our ability to bid on new opportunities. We plan to dedicate more resources to pursue whitespace coverage to expand our range of service offerings and pursue additional cross-selling opportunities. We will also look to use our increased scale and operations expertise to improve utilization of our assets. |
Customers
We serve over 4,000 customers across a variety of industries. Our customers are among the leading companies in their respective industries, and many of them are recurring customers that have maintained long-term relationships with us and our predecessor companies.
We have successfully leveraged our relationships with customers to offer extended value chain services, creating stickier customer relationships and increasing overall margins. Customers are increasingly turning to us due to a demonstrated ability to work on large-scale projects, past performance and record of delivery, and deep domain expertise accumulated from years of experience in key verticals. We believe, our stable base of customers and sticky long-term relationships lead to predictable revenues.
Our solutions reach a majority of US population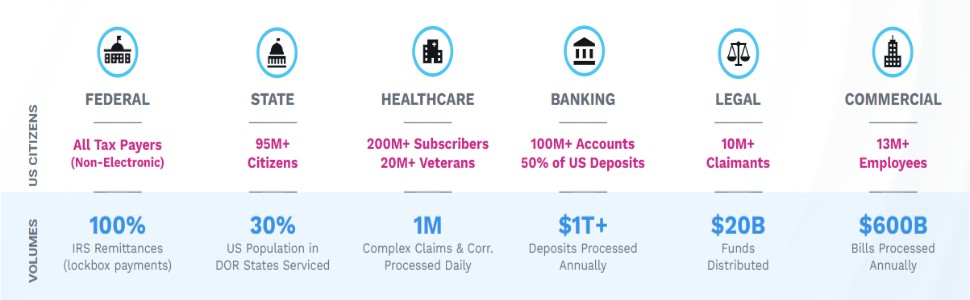
We maintain a strong mix of diversified customers with low customer concentration. No customer accounts for more than 10% of 2023 revenue. The diversity of our customer base has contributed to the stability and predictability of our revenue streams and cash flows even as we face macroeconomic headwinds. We have been able to effectively balance our customer mix and reduce dependency on any single customer or vertical by penetrating a diverse set of end markets.
Research and Development
Our ability to continue to compete successfully depends heavily upon our ability to ensure a timely flow of competitive products, services and technologies to the marketplace while also leveraging our domain expertise to demonstrate our understanding in implementing solutions across the industries we serve. Through regular and sustained investment, licensing of intellectual property and acquisition of third-party businesses and technology, we continue to develop new knowledge platforms, applications and supporting service bundles that enhance and expand our existing suite of services.
Our seven-layer technology model requires us to continue to harness our capabilities in each layer and the ultimate measure of success will be how many customers are in each layer. We believe that a greater customer concentration in the top layers will reflect the success of our R&D strategy. Additional financial information regarding our R&D expense is included in Note 2 – Basis of Presentation and Summary of Significant Accounting Policies within our consolidated financial statements.
19
Intellectual Property
We deploy a combination of internally developed proprietary knowledge platforms, applications and generally available third-party licensed software as part of our scalable and flexible solutions and services. We believe our intellectual property is our competitive strength.
Our platforms aim to enhance information management and workflow processes through automation and process optimization to minimize labor requirements or to improve labor performance. Our decisioning engines have been built with years of deep domain expertise, incorporating hundreds of thousands of customer and industry specific rules which enable efficiency and lowers cost preparation and decisioning of transactions. Our business processes and implementation methodologies are confidential and proprietary and include trade secrets that are important to our business. We own a variety of trademarks and patents, which are registered or pending.
We regularly enter into nondisclosure agreements with customers, business partners, employees, and contractors that require confidential treatment of our information to establish, maintain and enforce our intellectual property rights. Our licensed intellectual properties are generally governed by written agreements of varying durations, including some with fixed terms that are subject to renewal based on mutual agreement. Generally, each agreement may be further extended, and we have historically been able to renew most existing agreements before they expire. We expect these and other similar agreements to be extended so long as it is mutually advantageous to both parties at the time of renewal.
Competition
We believe that the principal competitive factors in providing our solutions include proprietary platforms, industry specific knowledge, quality, reliability and security of service, and price. We are differentiated competitively given our scale of operations, reputation as a trusted partner with deep domain expertise, innovative solutions, and highly integrated technology platforms that provide customers with end-to-end services addressing many aspects of their mission-critical operational processes. We continue to integrate best practice delivery processes into our service-delivery capabilities to improve its quality and service levels and to increase operational efficiencies. The markets in which we serve are competitive with both large and small businesses, as well as global companies:
| ● | Multi-national companies that provide data aggregation, information management and workflow automation services, such as IBM, EMC, OpenText, Hyland, Iron Mountain, Canon, and Ricoh; |
| ● | Consulting, discrete process and platform integration service providers such as Fiserv, Jack Henry, FIS, Black Knight Financial, Optum, Broadridge Financial Solutions, Computershare, Cognizant, and Accenture; |
| ● | Platform and front-end software providers, such as Workday, Salesforce, Blackline and Pega; |
| ● | Multi-shore BPO companies, such as Genpact, Cognizant, Exl service, Conduent, Wipro, and WNS; and |
| ● | Smaller, niche service providers in specific verticals or geographic markets. |
Regulation and Compliance
We handle, directly or indirectly through customer contracts and business associate agreements, a significant amount of information, including personal and health-related information, which results in our being subject to federal, state and local privacy laws, including the Gramm-Leach-Bliley Act, HIPAA and the HITECH Act of 2009. Further, we are subject to the local rules and regulations, including those relating to the handling of information, in the other countries in which we operate. In addition, services in our LLPS segment, though not directly regulated, must be provided in a manner consistent with the relevant legal framework. For example, our bankruptcy claims administration services must be provided in accordance with the requirements and deadlines of the United States Bankruptcy Code and
20
Federal Rules of Civil Procedure. In addition, some of our customers are subject to regulatory oversight, which may result in our being reviewed from time to time by such oversight bodies. Further, as a government contractor, we are subject to associated regulations and requirements.
Changes to existing laws, introduction of new laws, or failure to comply with existing laws that are applicable to us may subject us to, among other things, additional costs or changes to our business practices, liability for monetary damages, fines and/or criminal prosecution, unfavorable publicity, restrictions on our ability to obtain and process information and allegations by our customers and customers that we have not performed our contractual obligations, any of which may have a material adverse effect on profitability and cash flow.
Privacy and Information Security Regulations
Data privacy laws and regulations in the U.S. and foreign countries apply to the access, collection, transfer, use, storage, and destruction of personal information in connection with our services. In the U.S., our financial institution customers are required to comply with privacy regulations imposed under the Gramm-Leach-Bliley Act, in addition to other regulations. As a processor of personal information in our role as a provider of services to financial institutions, we are bound by similar limitations on disclosure of the information received from our customers as apply to the financial institutions themselves. We also perform services for healthcare companies and are, therefore, subject to compliance with laws and regulations regarding healthcare information, including HIPAA in the U.S. We also perform credit-related services and agree to comply with payment card standards, including the PCIDSS. In addition, federal and state privacy and information security laws, and consumer protection laws, which apply to businesses that collect or process personal information, also apply to our businesses.
Privacy laws and regulations may require notification to affected individuals, federal and state regulators, and consumer reporting agencies in the event of a security breach that results in unauthorized access to, or disclosure of, certain personal information. Privacy laws outside the U.S. may be more restrictive and may require different compliance requirements than U.S. laws and regulations and may impose additional duties on us in the performance of our services.
There has been increased public attention regarding the use of personal information and data transfer, accompanied by legislation and regulations intended to strengthen data protection, information security and consumer and personal privacy. The law in these areas continues to develop and the changing nature of privacy laws in the U.S., the European Union (“E.U”) and elsewhere could impact our processing of personal information of our employees and on behalf of our customers. In the E.U. the comprehensive General Data Privacy Regulation (the "GDPR") went into effect in May 2018. The GDPR has introduced significant privacy-related changes for companies operating both in and outside the EU. In the U.S., California has adopted the California Consumer Privacy Act, which went into effect on January 1, 2020, and several states have adopted or are considering adopting similar laws imposing obligations regarding the handling of personal information. While we believe that we are compliant with our regulatory responsibilities, information security threats continue to evolve resulting in increased risk and exposure. In addition, legislation, regulation, litigation, court rulings, or other events could expose us to increased costs, liability, and possible damage to our reputation.
Human Capital
The continued success of our business is driven by our people. Our senior leadership team has extensive experience within the larger BPO as well as the BPA industries. As we were formed through a series of acquisitions, we have retained an experienced and cohesive leadership team. The combination of our employees with our technology is the backbone of our ability to provide holistic solutions designed to meet the rapidly evolving needs of our customers.
As of December 31, 2023, we had approximately 14,100 total employees, of which approximately 450 are part-time employees. We have a global workforce with approximately half of our employees located in Americas and EMEA, and the remainder located in India and the Philippines. Our employee count fluctuates from time to time based upon the timing and duration of our engagements. We consider our employees to be the foundation for our growth and success. As such, our future success as an organization depends in part on our ability to attract, train, retain, and motivate
21
qualified personnel. We are also fully committed to developing and fostering a culture of diversity and inclusion, and understand that our ability to identify and hire talented individuals from all backgrounds and perspectives is key to our continued success.
| ● | Diversity and inclusion. We believe that a diverse workforce is critical to our success, and we continue to focus on the hiring, retention, and advancement of women and underrepresented populations. Our recent efforts have been focused in three areas: giving back and supporting the social issues impacting our communities and people, expanding our efforts to recruit and hire world-class diverse talent, and identifying strategic partners to accelerate our inclusion and diversity programs. |
| ● | Compensation and benefits. We offer a complete set of benefits for our employees, including competitive base salaries and annual cash bonus opportunities, as well as comprehensive health benefits, retirement plans, and a generous time off policy. In addition, we have used targeted equity-based grants with vesting conditions to facilitate retention of personnel, particularly those with critical leadership skills and experience. |
| ● | Health, safety, and wellness. Health, safety, and wellness. The success of our business is fundamentally connected to the well-being of our people. Accordingly, we are committed to the health, safety and wellness of our employees. We provide our employees and their families with access to a variety of innovative, flexible, and convenient health and wellness programs. These include benefits that provide protection and security so our people can have peace of mind concerning events that may require time away from work or that impact their financial well-being, benefits that support our people’s physical and mental health by providing tools and resources to help them improve or maintain their health status and encourage engagement in healthy behaviors, and benefits that offer choice, where possible, so our people can customize benefits to meet their needs and the needs of their families. |
| ● | Talent development. We invest significant resources to develop the talent needed to continue to be a leader in our industry. We deliver numerous training opportunities, provide rotational assignment opportunities, have expanded our focus on continuous learning and development, and implemented industry leading methodologies to manage performance, provide feedback and develop talent. Our talent development programs provide employees with the resources they need to help achieve their career goals, build management skills and lead their organizations. We provide a series of employee workshops around the globe that support professional growth and development. Additionally, our manager and employee forum programs provide an ongoing opportunity for employees to practice and apply learning around conversations aligned with our annual review process. We leverage our proprietary learning management system LYNX to provide employees and leaders with quick access to learning resources that are personalized to the individual's development needs. |
| ● | Building connections - with each other and our communities. We believe that building connections between our employees, their families, and our communities creates a more meaningful, fulfilling and enjoyable workplace. Our employees are passionate about many causes, so our corporate giving and volunteering programs support and encourage employees by engaging with those causes. We are active and involved members in the communities in which our employees live and work, and we promote a culture of volunteering and giving back. To support these efforts, exelashop.com offers an online portal where anyone can purchase eco-friendly and recycled Exela gear. All net proceeds from exelashop.com are donated to the #ExelaCares program. In coordination with exelashop.com, we also partnered with the Dian Fossey Gorilla fund to help fund conservation efforts, research, educational programs, and campus initiatives. We continued our efforts to support the Orthopaedic Institute for Children (OIC) to help fund diagnosis, treatment, and rehabilitation of kids all over the world with pediatric musculoskeletal conditions who may otherwise not have access to the necessary care. All net proceeds from Exela branded sales go toward helping these charities achieve their missions |
We locate our operation centers in areas where the value proposition it offers is attractive relative to other local opportunities, resulting in an engaged educated multi-lingual workforce that is able to make a meaningful global
22
contribution from their local marketplace. We offer our employees a focused set of training programs to increase their skills and leadership capabilities with the goal of creating a long-term funnel of talent to support the Company’s continued growth. Additionally, our proprietary platforms enable rapid learning and facilitate knowledge transfer among employees, reducing training time.
Executive Officers
The following table sets forth information concerning our executive officers as of April 3, 2024:
Name |
| Age |
| Position |
Par Chadha | 68 | Executive Chairman | ||
Matthew Brown | 38 | Interim Chief Financial Officer | ||
Suresh Yannamani | 58 | Chief Executive Officer, Exela Technologies BPA | ||
Srini Murali | 51 | President, Exela Technologies BPA |
Par Chadha is our Executive Chairman and is the founder, Chief Executive Officer and Chief Investment Officer of HGM, a family office, formed in 2001. Mr. Chadha brings over 46 years of experience in building businesses in the Americas, Europe and Asia, including execution of mergers and acquisitions, integration of businesses and public offerings. Mr. Chadha served as our Chairman from the Closing of the Business Combination and most recently became Executive Chairman in September 2021. He also served as Chairman of SourceHOV Holdings, Inc. from 2011 to July 2017 when it was acquired by Exela, and was Chairman of Lason Inc. from 2007 to 2011 until its merger with SourceCorp, a predecessor company of SourceHOV. Mr. Chadha is a Director and Chairman of HOV Services Limited (NSE:HOVS), a company listed on the National Stock exchange of India, since 2005, and served as its Chairman from 2009 to 2011. Mr. Chadha is co-founder of Rule 14, LLC, an artificial intelligence led automation company formed in 2011. During his career, Mr. Chadha has been a cofounder of technology companies in the fields of metro optical networks, systems-on-silicon, and communications. Mr. Chadha previously participated in director and executive roles in portfolio companies of HGM, and currently holds and manages investments in evolving financial technology, health technology and AI industries. Mr. Chadha is the husband of Sharon Chadha, a director. Mr. Chadha holds a B.S. degree in Electrical Engineering from the Punjab Engineering College, India.
Matthew Brown is the Interim Chief Financial Officer at Exela Technologies, Inc. Since May 2022, Mr. Brown served as President of ETI-MNA, the Company’s investment portfolio management entity, tasked with increasing shareholder value by strategically purchasing, developing, and selling operating businesses. Mr. Brown joined the Company in July 2017 as Global Head of Business Strategy to oversee the Company’s digital transformation strategy. Mr. Brown was also instrumental in identifying and leading the divestiture, acquisition, and integration of several operating businesses on behalf of the Company. As the Global Head of Business Strategy, Mr. Brown led the teams responsible for driving strategic initiatives and go-to-market priorities to deliver maximum value for the Company’s customers through integrated solution suites. Prior to joining the Company, from 2007 to 2017 Mr. Brown served in various roles at HGM, a family office and buyout fund with diversified professional capabilities, ultimately serving as a Senior Vice President at HGM from 2016 to 2017. In this role, Mr. Brown provided a broad range of services across strategy, financial, legal, consulting, digital transformation, and venture creation to HGM’s portfolio companies. During his tenure with HGM, Mr. Brown led all stages of the mergers and acquisitions life cycle, including supporting transitional operations and management of integration synergies, and participated in recapitalizations of over $4 billion in new equity and debt. Mr. Brown graduated summa cum laude from the University of California, San Diego, with a B.S. degree in electrical engineering.
Suresh Yannamani is Chief Executive Officer of Exela Technologies BPA since July 2022, and before that served as our President since the closing of the Novitex Business Combination and President, Americas of SourceHOV from 2011 until the closing of the Novitex Business Combination, and has been a part of companies that were predecessors to Exela since 1997. Mr. Yannamani oversees strategy for healthcare, financial services and commercial industries. Mr. Yannamani was also President of HOV Services, LLC from 2007 to 2011, serving customers in the healthcare, financial services, insurance and commercial industries. Mr. Yannamani was the Executive Vice President of BPO services for Lason from 1997 to 2007 prior to its acquisition by HOV Services, LLC. Mr. Yannamani also served in management roles at IBM from 1995 to 1997, managing the design, development, and implementation of financial management
23
information systems for the public sector and worked for Coopers & Lybrand as a consultant in public audits from 1992 to 1994. Mr. Yannamani has a bachelor’s degree in Chemistry from the University of London and holds an MBA from Eastern Michigan University.
Srini Murali is President of Exela Technologies BPA since July 2022, and before that served as our President, Americas and APAC from January 2019 and as Chief Operating Officer Americas and APAC from the Novitex Business Combination. He is responsible for all sales, operations and business strategy functions across the Americas and Asia Pacific. Prior to the Novitex Business Combination, Mr. Murali served as Senior Vice President, Operations for the Americas and APAC regions for SourceHOV, creating global operating strategies, developing client relationships, and overseeing compliance. Mr. Murali has been a part of predecessor companies to SourceHOV since 1993. During his tenure, Mr. Murali has held analysis, product development, IT, and operational roles. In 2010, Mr. Murali took on a broader scope of responsibility as SourceHOV’s Senior Vice President of Global Operations and IT. Mr. Murali has served in executive-level leadership roles at companies that preceded SourceHOV since 2007, when he was appointed Vice President of IT and Technology. Prior to these management roles, Mr. Murali served as Director of Information Technology for Lason from 2002 to 2007, and as an Application Development Manager for Lason from 1998 to 2002. Before joining Lason, Mr. Murali worked as a Systems Engineer for Vetri Systems from 1996 to 1998. Mr. Murali graduated with a bachelor’s degree in mathematics and statistics from Loyola College, Chennai, and earned an MBA from Davenport University, Michigan.
Reverse Stock Split
On May 12, 2023, the Company filed a Third Certificate of Amendment of the Company’s Second Amended and Restated Certificate of Incorporation, as amended (the “Certificate of Amendment”), with the Secretary of State of Delaware, to effect a one (1) share for two hundred (200) shares reverse stock split of the Company’s Common Stock (the “Reverse Stock Split”). The Reverse Stock Split had no effect on the par value of the Common Stock and did not reduce the number of authorized shares. Fractional shares were not issued as a result of the Reverse Stock Split. Stockholders who would otherwise have been entitled to a fractional share of Common Stock instead received cash in lieu of fractional shares based on the closing sales price of the Company’s Common Stock as quoted on the Nasdaq on May 12, 2023. The reason for the reverse stock split was to maintain the Company’s listing on Nasdaq, which pursuant to Nasdaq Listing Rule 5550(a)(2)(the “Rule”) requires that if the closing bid price of the Common Stock is below $1.00 for 30 consecutive trading days, then the closing bid price must be $1.00 or more for 10 consecutive trading days during a grace period to regain compliance with the Rule.
The Reverse Stock Split resulted in a proportionate adjustment to the per share exercise price and the number of shares of Common Stock issuable upon the exercise of our outstanding stock options and warrants, as well as the number of shares of Common Stock eligible for issuance under the Company’s 2018 Stock Incentive Plan. In addition, the conversion rate of our Series A Preferred Stock was equitably adjusted following the Reverse Stock Split, such that the conversion rate is now 0.000077 (previously 0.0153) and the Conversion Price is $104,439.35 (previously $522.20), with the effect that immediately following the Reverse Stock Split, each share of Series A Preferred Stock converts into 1/200th of the number of shares of Common Stock into which it was convertible immediately prior to the Reverse Stock Split. Similarly, the conversion rate of our Series B Preferred Stock was equitably adjusted following the Reverse Stock Split, such that the Conversion Price is $5,000.00 (previously $25.00), with the effect that immediately following the Reverse Stock Split, each share of Series B Preferred Stock converts into 1/200th of the number of shares of Common Stock into which it was convertible immediately prior to the Reverse Stock Split. As a result of the Reverse Stock Split, the number of shares of Common Stock issuable on exercise of each of our warrants has been decreased in proportion to such decrease in outstanding shares of Common Stock. As a result, each warrant previously exercisable for one-twentieth of a share at $4.00 per one-twentieth of a share, is now exercisable for one-four thousandth of a share at $4.00 per one-four thousandth of a share ($16,000.00 per share).
Except as otherwise indicated, all share and per share information herein gives pro forma effect to the Reverse Stock Split.
24
Status as a Smaller Reporting Company
We are a “smaller reporting company” as defined in Rule 12b-2 of the Exchange Act and have elected to take advantage of certain of the scaled disclosure available for smaller reporting companies.
Available Information
Our website address is www.exelatech.com. We are not including the information provided on our website as a part of, or incorporating it by reference into, this Annual Report. We make available free of charge (other than an investor's own internet access charges) through our website our annual reports on Form 10-K, quarterly reports on Form 10-Q, current reports on Form 8-K, and amendments to these reports, as soon as reasonably practicable after we electronically file such material with, or furnish such material to, the Securities and Exchange Commission (the "SEC"). In addition, we make available our code of ethics entitled "Global Code of Ethics and Business Conduct" free of charge through our website. We intend to post on our website all disclosures that are required by law or Nasdaq listing standards concerning any amendments to, or waivers from, any provision of our code of ethics.
The SEC maintains an internet site that contains reports, proxy and information statements and other information regarding issuers that file electronically with the SEC at www.sec.gov. The information contained on the websites referenced in this Annual Report is not incorporated by reference into this filing.
ITEM 1A. RISK FACTORS
In addition to the other information contained in this Annual Report, the following risks impact our business and operations. These risk factors are not exhaustive and all investors are encouraged to perform their own investigation with respect to our business, financial condition and prospects.
Risks Related to our Business
We have substantial indebtedness and other obligations and failure to generate sufficient cash flow to satisfy our obligations or to refinance on commercially reasonable terms could have a material adverse effect on our business, financial condition, cash flows and results of operations, could cause the market value of our securities to decline and could impact our ability to continue as a going concern.
As of December 31, 2023, we had approximately $1.0 billion of long-term debt, excluding current maturities. While we aim to repay or refinance a material portion of this debt, there can be no assurance that we will be successful, and, even if we are successful, we will likely still have a substantial amount of indebtedness.
Our high degree of leverage and other obligations could: tie up a substantial portion of any cash flow from operations in servicing our indebtedness, limiting our ability to fund operations, capital expenditures, and future business opportunities; increase the risks of breaching other indebtedness agreements, such as failing to make required payments of principal or interest due; decrease our ability to obtain additional financing for working capital, capital expenditures, or other purposes; limit our flexibility to make acquisitions; require non-strategic divestitures; increase our cash requirements to support the payment of interest; limit our flexibility in planning for or responding to changes in our business; disadvantage us against competitors; and increase our vulnerability to economic and industry changes.
Our ability to make payments of principal and interest and our ability to comply with covenants in our various debt agreements depends upon our future performance, and subject to general economic conditions and other factors, many of which are beyond our control. If we are unable to generate cash flow sufficient to service our debt and meet our other cash requirements, we may be required to seek additional financing in the debt or equity markets, refinance or restructure our debt, sell assets (to the extent permitted under our debt agreements) or reduce or delay planned expenditures. Our ability to restructure or refinance our debt will depend on the capital markets and our financial condition at such time. Refinancing could be at higher interest rates and may require us to comply with more onerous covenants, which could further restrict our business operations. In addition, any such financing, refinancing or sale of assets might not be available at all or on economically favorable terms. Failure to generate sufficient cash flow to satisfy
25
our debt obligations or to refinance on commercially reasonable terms could have a material adverse effect on our business, financial condition, cash flows and results of operations, could cause the market value of our securities to decline and impact our ability to continue as a going concern.
We have a history of net losses and may continue to incur losses in the future. Our ability to continue as a going concern is highly dependent upon our ability to raise additional funds in the future. There can be no assurance that we will be able to raise any additional funds, or if we are able to raise additional funds, that such funds will be in the amounts required or on terms favorable to us. As a result of our financial condition and other factors described herein, the Company believes there is substantial doubt about our ability to continue as a going concern.
Our future profitability and ability to achieve positive cash flow is uncertain.
Our future profitability depends on our ability to generate revenue in excess of our expenses, including fixed costs relating to the maintenance of our business and debt service requirements. Our future profitability also may be impacted by non-cash charges such as stock-based compensation charges and potential impairment of goodwill, which has at times negatively affected our reported financial results. Even if we achieve profitability on an annual or quarterly basis, we may incur significant losses in the future for a number of reasons and risks described in this Annual Report and we may encounter unforeseen expenses, difficulties, complications, and delays that may cause our costs to exceed our expectations.
Generating positive cash flow depends on our ability to generate collections from sales in excess of our expenditures. Our ability to generate and collect on sales can be negatively affected by many factors, including our inability to sell to new customers or convince existing customers to renew or expand their services; the lengthening of sales cycles; failure of customers to pay our invoices on a timely basis or at all; a failure in the performance of our solutions or internal controls that adversely affects our reputation or results in loss of business; the loss of market share to competitors; the failure to enter or succeed in new markets; regional or global economic conditions or regulations affecting perceived need for or value of our services; or our inability to develop and sell new or expanded offerings to meet evolving market needs.
We anticipate that we will incur increased sales and marketing and general and administrative expenses as we continue to diversify our business into new industries and geographic markets and that we will require significant amounts of working capital to support our growth. We may not achieve collections from sales to offset these anticipated expenditures. An inability to generate positive cash flow as a result may decrease our long-term viability.
Our securities may be delisted from Nasdaq
Our Common Stock is currently listed for trading on the Nasdaq, and the continued listing of our Common Stock on the Nasdaq is subject to our compliance with a number of listing standards, including Nasdaq Listing Rule 5550(b)(2), which requires that the Company maintain a market value of listed securities (“MVLS”) of at least $35 million (the “MVLS requirement”) and Listing Rules 5620(a) and 5810(c)(2)(G), which require us to hold an annual shareholder meeting within twelve months of the December 31, 2022 fiscal year end (the “Annual Meeting Requirement”). On November 13, 2023, we received an anticipated notice (the “MVLS Notice”) from Nasdaq notifying the Company that it is not in compliance with Nasdaq Listing Rule 5550(b)(2) because, for the last 30 consecutive business days, the Company’s MVLS was below the minimum requirement of $35 million. In the MVLS Notice, Nasdaq indicated that the Company has 180 calendar days from the date of the MVLS Notice (or until May 13, 2024) to regain compliance with the MVLS Rule by having our MVLS close at or above $35 million for a minimum of ten consecutive business days. On March 14, 2023, we received a second notice stating that the Company is not in compliance with the Annual Meeting Requirement and that the Company had 45 calendar days, or until April 29, 2024, to submit a plan to regain compliance.
There can be no assurance that we will remedy and continue to satisfy these and other continuing listing requirements and remain listed on the Nasdaq. If our Common Stock or Series B Preferred Stock were no longer listed on the Nasdaq, investors might only be able to trade on one of the over-the-counter markets. This would impair the liquidity of our securities not only in the number of shares that could be bought and sold at a given price, which might be
26
depressed by the relative illiquidity, but also through delays in the timing of transactions and reduction in media and analyst coverage. In addition, we could face significant material adverse consequences, including limited availability of market quotations for our securities and a decreased ability to issue additional securities or obtain additional financing.
We substantially increased the outstanding number of shares during 2023, substantially diluting existing stockholders’ interests in Exela, and we may engage in dilutive transactions in the future.
In 2023 we increased the outstanding shares of Common Stock from 1,393,276 at January 1, 2023 (adjusted to give effect for the 1:200 stock split on May 12, 2023) to 6,365,353 at December 31, 2023. The increase in outstanding shares was due principally to the sale of additional shares for cash, which resulted in all the shares of Common Stock outstanding on January 1, 2023 representing less than 22% of the outstanding shares of Common Stock on December 31, 2023. Due to the need to repay existing indebtedness and fund operations, we may issue a material number of additional shares of Common Stock in the future, which would have the effect of further diluting existing shareholders. Such issuances, or market perception of the possibility of substantial future dilution, could make our stock less attractive to investors and could have a material adverse effect on the price of our stock.
We have recorded significant goodwill impairment charges and may be required to record additional charges to future earnings if our goodwill or intangible assets become impaired.
As of December 31, 2023, our goodwill balance was $170.5 million which represented 26.8% of total consolidated assets. There was no impairment of goodwill and other intangible assets for the year ended December 31, 2023. Goodwill is required to be tested for impairment at least annually. We may be required to record additional charges to earnings during the period in which any impairment of our goodwill or other intangible assets is determined which could have a material adverse impact on our results of operations. Even though these charges may be non-cash items and may not have an immediate impact on our liquidity, the fact that we report charges of this nature could contribute to negative market perceptions about us or our securities, including our Common Stock.
The HGM Group has significant influence over us and our corporate governance.
Our Executive Chairman, Par Chadha, our Interim Chief Financial Officer, Matthew Brown, our director, Ms. Sharon Chadha, and several of our other executives have or have had affiliations with the HGM Group. The HGM Group’s interests may not align with the interests of our other stakeholders. The HGM Group is in the business of making investments in companies and may acquire and hold interests in businesses that compete directly or indirectly with us. The HGM Group may also pursue acquisition opportunities that may be complementary to our business, and, as a result, those acquisition opportunities may not be available to us.
Certain of our contracts are subject to termination rights, audits and/or investigations, which, if exercised, could negatively impact our reputation and reduce our ability to compete for new contracts and have an adverse effect on our business, results of operations and financial condition.
Many of our customer contracts may be terminated by our customers without cause and without any fee or penalty, with only limited notice. We may not be able to replace a customer that elects to terminate or fails to renew its contract with us.
In addition, a portion of our revenues is derived from contracts with the U.S. federal and state governments and their agencies and from contracts with foreign governments and their agencies. Government entities typically finance projects through appropriated funds. The public procurement environment is unpredictable and this could adversely affect our ability to perform work under new and existing contracts, including as a result of our business being diverted to a small or disadvantaged or minority-owned business pursuant to set-aside programs.
Moreover, government contracts are generally subject to a right to conduct audits and investigations by government agencies. If the government finds that it was inappropriately charged any costs to a contract, the costs are not reimbursable or, if already reimbursed, the cost must be refunded to the government. Additionally, we may be subject to various civil and criminal penalties and administrative sanctions, which may include termination of contracts,
27
forfeiture of profits, suspension of payments, fines and suspensions or debarment from doing business with the government. Further, the negative publicity that could arise from any such penalties, sanctions or findings in such audits or investigations could have an adverse effect on our reputation in the industry and reduce our ability to compete for new contracts and could materially adversely affect our results of operations and financial condition.
Downgrades in our credit ratings could impact our ability to access capital and materially adversely affect our business, financial condition and results of operations.
Credit rating agencies continually review their ratings for the companies that they follow, including us. Credit rating agencies also evaluate the industries in which we and our affiliates operate as a whole and may change their credit rating for us based on their overall view of such industries. There can be no assurance that any rating assigned to our currently outstanding public debt securities will remain in effect for any given period of time or that any such ratings will not be further lowered, suspended or withdrawn entirely by a rating agency if, in that rating agency’s judgment, circumstances so warrant. A further downgrade of our credit ratings could, among other things, limit our ability to access capital or otherwise adversely affect the availability of other new financing on favorable terms, which could materially adversely affect our results of operations and financial condition.
We may not be able to offset increased costs with increased fees under long-term contracts.
The pricing and other terms of our customer contracts, particularly our long-term contact center agreements, are based on estimates and assumptions we make at the time we enter into these contracts. These estimates reflect our best judgments regarding the nature of the engagement and our expected costs to provide the contracted services and could differ from actual results. Not all our larger long-term contracts allow for escalation of fees as our cost of operations increase and those that allow for such escalations do not always allow increases at rates comparable to increases that we experience. Where we cannot negotiate long-term contract terms that provide for fee adjustments to reflect increases in our cost of service delivery, our business, financial conditions, and results of operation would be materially impacted.
Our business process automation solutions often require long selling cycles and long implementation periods that may result in significant upfront expenses that may not be recovered.
We often face long selling cycles to secure new contracts for our business process automation solutions. If we are successful in obtaining an engagement, the selling cycle can be followed by a long implementation period. Delays in internal approvals, technology implementations, or customer decisions can prolong these cycles. Even if we succeed in developing a relationship with a potential customer and begin to discuss the services in detail, the potential customer may choose a competitor or decide to retain the work in-house prior to the time a contract is signed. Additionally, we may not begin receiving revenue until after the implementation period and our solution is fully operational, leading to upfront expenses without immediate profits. These extended cycles can strain finances, especially when hiring new staff before revenue collection. Our inability to obtain contractual commitments after a selling cycle, maintain contractual commitments after the implementation period or limit expenses prior to the receipt of corresponding revenue may have a material adverse effect on our business, results of operations and financial condition.
We face significant competition from U.S.-based and non-U.S.-based companies and from our customers who may elect to perform their business processes in-house or invest in their own technologies in-house.
Our industry is highly competitive, fragmented and subject to rapid change. We compete primarily against local, national, regional and large multi-national information and payment technology companies, including focused BPO companies based in offshore locations, BPO divisions of information technology companies located in India, other BPO and BPA and consulting services and digital transformation solution providers and the in-house capabilities of our customers and potential customers. These competitors may include entrants from adjacent industries or entrants in geographic locations with lower costs than those in which we operate.
Some of our competitors have stronger financial, marketing, and technological capabilities, larger customer bases, and better brand recognition. Expansion of competitors' global delivery centers or strategic partnerships with larger firms may increase competition. Further, we expect competition to intensify in the future as more companies enter
28
our markets and customers consolidate the services they require among fewer vendors. Increased competition, our inability to compete successfully against competitors, pricing pressures or loss of market share could result in reduced operating margins, which could adversely affect our business, results of operations and financial condition.
Our industry is characterized by rapid technological change and failure to compete successfully within the industry and address rapid technological change could adversely affect our results of operations and financial condition.
The process of developing new services and solutions is inherently complex and uncertain, requiring accurate anticipation of customer needs and emerging trends. It requires that we make long-term investments and commit significant resources before knowing whether these investments will eventually result in services that achieve customer acceptance and generate the revenues required to provide desired returns. If we fail to accurately anticipate and meet our customers’ needs through the development of new technologies and service offerings or if our new services are not widely accepted, we could lose market share and customers to our competitors and that could materially adversely affect our results of operations and financial condition.
More specifically, the business process solutions industry is characterized by rapid technological change, evolving industry standards and changing customer preferences. The success of our business depends, in part, upon our ability to develop technology and solutions that keep pace with changes in our industry and the industries of our customers. Although we have made, and will continue to make, significant investments in the research, design and development of new technology and platforms-driven solutions, we may not be successful in addressing these changes on a timely basis or in marketing the changes we implement. In addition, products or technologies developed by others may render our services uncompetitive or obsolete. Failure to address these developments could have a material adverse effect on our business, results of operations and financial condition.
In addition, existing and potential customers are actively shifting their businesses away from paper-based environments to electronic environments with reduced needs for physical document management and processing. This shift may result in decreased demand for the physical document management services we provide such that our business and revenues may become more reliant on technology-based services in electronic environments, which are typically provided at lower prices compared to physical document management services. Though we have solutions for customers seeking to make these types of transitions, a significant shift by our customers away from physical documents to non-paper based technologies, whether now existing or developed in the future, could adversely affect our business, results of operation and financial condition.
Also, some of the large international companies in the industry have significant financial resources and compete with us to provide document processing services and/or business process services. We compete primarily on the basis of technology, performance, price, quality, reliability, brand, distribution and customer service and support. Our success in future performance is largely dependent upon our ability to compete successfully, to promptly and effectively react to changing technologies and customer expectations and to expand into additional market segments. To remain competitive, we must develop services and applications; periodically enhance our existing offerings; remain cost efficient; and attract and retain key personnel and management. If we are unable to compete successfully, we could lose market share and important customers to our competitors and that could materially adversely affect our results of operations and financial condition.
We rely, in some cases, on third-party hardware and software, which could cause errors or failures of our services and could also result in adverse effects for our business and reputation if these third-party services fail to perform properly or are no longer available.
Although we developed our platform-driven solutions internally, we rely, in some cases, on third-party hardware and software in connection with our service offerings which we either purchase or lease from third-party vendors. While we are able to select from various competing hardware and software applications, detecting design defects or software errors is challenging due to complexity and unique specifications. Any errors or defects in third-party hardware or software incorporated into our service offerings, may result in a delay or loss of revenue, diversion of resources, damage to our reputation, or potential claims against us.
29
Further, this hardware and software may not continue to be available on commercially reasonable terms or at all. Any loss of the right to use any of this hardware or software, or any increases in the price charged by third-party vendors, could negatively affect our business until equivalent technology is either developed by us or, if available, is identified, obtained and integrated on commercially reasonable terms. Further, changing hardware vendors or software licensors could detract from management’s ability to focus on the ongoing operations of our business or could cause delays in the operations of our business.
Our ability to deliver our services is dependent on the development and maintenance of the infrastructure of the Internet by third parties.
The Internet’s infrastructure comprises many different networks and services that are highly fragmented and distributed by design. This infrastructure is run by a series of independent third-party organizations that work together to provide the infrastructure and supporting services of the Internet. The Internet has experienced a variety of outages and other delays as a result of damages to portions of its infrastructure, denial-of-service attacks or related cyber incidents, and it could face outages and delays in the future, potentially reducing the availability of the Internet to us or our customers for delivery of our Internet-based services. Any resulting interruptions in our services or the ability of our customers to access our services could result in a loss of potential or existing customers and harm our business. Additionally, regulatory actions in certain countries may limit access to the Internet or change the legal protections available to businesses that depend on the Internet for the delivery of their services, which would negatively impact access to our services, increase our risk or add liabilities, impede our growth, productivity and operational effectiveness, result in the loss of potential or existing customers and harm our business.
Some of the work we do involves greater risks than other types of claims processing or document management engagements.
We provide certain business process solutions for customers that, for financial, legal or other reasons, may present higher risks compared to other types of claims processing or document management engagements. Examples of higher risk engagements include class action and other legal distributions involving significant sums of money, economic analysis and expert testimony in high stakes legal matters, and engagements where we receive or process sensitive data, including personal consumer or private health information.
While we attempt to identify higher risk engagements and customers and mitigate our exposure by taking certain preventive measures and, where necessary, turning down certain engagements, these efforts may be ineffective and an actual or alleged error or omission on our part, the part of our customer or other third parties or possible fraudulent activity in one or more of these higher-risk engagements could result in the diversion of management resources, damage to our reputation, increased service costs or impaired market acceptance of our services, any of which could negatively impact our business and our financial condition.
Our business could be materially and adversely affected if we do not protect our intellectual property or if our services are found to infringe on the intellectual property of others.
Our success depends in part on certain methodologies and practices we utilize in developing and implementing applications and other proprietary intellectual property rights. In order to protect such rights, we rely upon a combination of nondisclosure and other contractual arrangements, as well as trade secret, copyright, trademark and patent laws. We also generally enter into confidentiality agreements with our employees, customers and potential customers and limit access to and distribution of our proprietary information. There can be no assurance that the laws, rules, regulations and treaties in effect in the U.S., India and the other jurisdictions in which we operate and the contractual and other protective measures we take are adequate to protect us from misappropriation or unauthorized use of our intellectual property, or that such laws will not change. There can be no assurance that the resources invested by us to protect our intellectual property will be sufficient or that our intellectual property portfolio will adequately deter misappropriation or improper use of our technology, and our intellectual property rights may not prevent competitors from independently developing or selling products and services similar to or duplicative of ours. We may not be able to detect unauthorized use and take appropriate steps to enforce our rights, and any such steps may be costly and unsuccessful. Infringement by others of our intellectual property, including the costs of enforcing our intellectual property rights, may have a material
30
adverse effect on our business, results of operations and financial condition. We could also face competition in some countries where we have not invested in an intellectual property portfolio. If we are not able to protect our intellectual property, the value of our brand and other intangible assets may be diminished, and our business may be adversely affected. Further, although we believe that we are not infringing on the intellectual property rights of others, claims may nonetheless be successfully asserted against us in the future, and we may be the target of enforcement of patents or other intellectual property by third parties, including aggressive and opportunistic enforcement claims by non-practicing entities. Regardless of the merit of such claims, responding to infringement claims can be expensive and time-consuming. If we are found to infringe any third-party rights, we could be required to pay substantial damages or we could be enjoined from offering some of our products and services. The costs of defending any such claims could be significant, and any successful claim may require us to modify our services. The value of, or our ability to use, our intellectual property may also be negatively impacted by dependencies on third parties, such as our ability to obtain or renew on reasonable terms licenses that we need in the future, or our ability to secure or retain ownership or rights to use data in certain software analytics or services offerings. Any such circumstances may have a material adverse effect on our business, results of operations and financial condition.
Our revenues are highly dependent on a limited number of industries, and any decrease in demand for business process solutions in these industries could reduce our revenues and adversely affect the results of operations.
A substantial portion of our revenues are derived from three specific industry based segments: ITPS, HS, and LLPS. Customers in ITPS accounted for 68.8% and 71.0% of our revenues in 2023 and 2022, respectively. Customers in HS accounted for 23.6% and 22.2% of our revenues in 2023 and 2022, respectively. Customers in LLPS accounted for 7.6% and 6.8% of our revenues in 2023 and 2022, respectively. Our success largely depends on continued demand for our services from customers in these segments, and a downturn or reversal of the demand for business process solutions in any of these segments, or the introduction of regulations that restrict or discourage companies from engaging our services, could materially adversely affect our business, financial condition and results of operations. For example, consolidation in any of these industries or combinations or mergers, particularly involving our customers, may decrease the potential number of customers for our services. We have been affected by the worsening of economic conditions and significant consolidation in the financial services industry and continuation of this trend may negatively affect our revenues and profitability.
We derive significant revenue and profit from commercial and government contracts awarded through competitive bidding processes, including renewals, which can impose substantial costs on us, and we will not achieve revenue and profit objectives if we fail to accurately and effectively bid on such projects. In addition, even if bids are won and we are awarded a contract, revenue and profit objectives may not be achieved due to a number of factors outside our control, including cases where an applicable contract or framework arrangement does not guarantee transaction volume.
Many of the contracts we are awarded through competitive bidding procedures are extremely complex and require the investment of significant resources in order to prepare accurate bids and proposals. Competitive bidding imposes substantial costs and presents a number of risks that may adversely affect our financial position, including: (i) the substantial cost and managerial time and effort that we spend to prepare bids and proposals for contracts that may or may not be awarded to us; (ii) the need to estimate accurately the resources and costs that will be required to implement and service any contracts we are awarded, sometimes in advance of the final determination of their full scope and design; (iii) the expense and delay that may arise if our competitors protest or challenge awards made to us pursuant to competitive bidding and the risk that such protests or challenges could result in the requirement to resubmit bids and in the termination, reduction or modification of the awarded contracts, or may eventually lead to litigation; and (iv) the opportunity cost of not bidding on and winning other contracts we might otherwise pursue.
Our profitability is dependent upon our ability to obtain adequate pricing for our services and to improve our cost structure.
Our success depends on our ability to obtain adequate pricing for our services. Depending on competitive market factors, future prices we obtain for our services may decline from previous levels. If we are unable to obtain adequate pricing for our services, it could materially adversely affect our results of operations and financial condition. In
31
addition, our contracts are increasingly requiring tighter timelines for implementation as well as more stringent service level metrics. This makes the bidding process for new contracts much more difficult and requires us to adequately consider these requirements in the pricing of our services.
We, from time to time, engage in restructuring actions to reduce our cost structure. If we are unable to continue to maintain our cost base at or below the current level and maintain process and systems changes resulting from prior restructuring actions or to realize the expected cost reductions in the ongoing strategic transformation program, it could materially adversely affect our results of operations and financial condition. In addition, in order to meet the service requirements of our customers, which often includes 24/7 service, and to optimize our employee cost base, including our back-office support, we often locate our delivery service and back-office support centers in lower-cost locations, including several developing countries. Concentrating our centers in these locations presents a number of operational risks, many of which are beyond our control, including the risks of political instability, natural disasters, safety and security risks, labor disruptions, excessive employee turnover and rising labor rates. Additionally, a change in the political environment in the U.S. or the adoption and enforcement of legislation and regulations curbing the use of such centers outside of the U.S. could materially adversely affect our results of operations and financial condition. These risks could impair our ability to effectively provide services to our customers and keep our costs aligned to our associated revenues and market requirements.
Our ability to sustain and improve profit margins is dependent on a number of factors, including our ability to continue to improve the cost efficiency of our operations through such programs as robotic process automation, to absorb the level of pricing pressures on our services through cost improvements and to successfully complete information technology initiatives. If any of these factors adversely materialize or if we are unable to achieve and maintain productivity improvements through restructuring actions or information technology initiatives, our ability to offset labor cost inflation and competitive price pressures would be impaired, each of which could materially adversely affect our results of operations and financial condition.
Defects or disruptions in our services could diminish demand for our services and subject us to substantial liability.
Since our customers use our services for important aspects of their business, any errors, defects, disruptions in service or other performance problems could hurt our reputation and may damage our customers’ businesses. As a result, customers could elect to not renew our services or delay or withhold payment to us. We could also lose future sales or customers may make warranty or other claims against us, which could result in an increase in our allowance for expected credit losses, an increase in collection cycles for accounts receivable or the expense and risk of litigation.
We are subject to regular customer and third-party security reviews and failure to pass these may have an adverse impact on our operations.
Many of our customer contracts require that we maintain certain physical and/or information security standards, and, in certain cases, we permit a customer to audit our compliance with these contractual standards. Any failure to meet such standards or pass such audits may have a material adverse impact on our business. Further, customers from time to time may require stricter physical and/or information security than they negotiated in their contracts, and may condition continued volumes and business on the satisfaction of such additional requirements. Some of these requirements may be expensive to implement or maintain, and may not be factored into our contract pricing. Further, on an annual basis we obtain third-party audits of certain of our locations in accordance with Statement on Standards for Attestation Engagements No. 16 (SSAE 16) put forth by the Auditing Standards Board (ASB) of the American Institute of Certified Public Accountants (AICPA). SSAE 16 is the current standard for reporting on controls at service organizations, and many of our customers expect that we will perform an annual SSAE 16 audit, and report to them the results. Negative findings in such an audit and/or the failure to adequately remediate in a timely fashion such negative findings may cause customers to terminate their contracts or otherwise have a material adverse effect on our reputation, results of operation and financial condition.
32
Cybersecurity issues, vulnerabilities, and criminal activity resulting in a data or security breach could result in risks to our systems, networks, products, solutions and services resulting in liability or reputational damage.
We collect and retain large volumes of internal and customer data, including personally identifiable information and other sensitive data both physically and electronically, for business purposes, and our various information technology systems enter, process, summarize and report such data. We also maintain personally identifiable information about our employees. Safeguarding customer, employee and our own data is a key priority for us, and our customers and employees have come to rely on us for the protection of their information. Despite our efforts to protect sensitive, confidential or personal data or information, we can provide no assurances that our security measures designed to protect our customers’ and our customers’ customers’ data will always be effective. Our services and underlying infrastructure may in the future be materially breached or compromised as a result of the following:
| ● | third-party attempts to fraudulently induce our employees, partners or customers to disclose sensitive information such as user names, passwords or other information to gain access to our customers’ data or IT systems, or our data or our IT systems; |
| ● | efforts by individuals or groups of hackers and sophisticated organizations, such as state-sponsored organizations or nation-states, to launch coordinated attacks, including ransomware, destructive malware and distributed denial-of-service attacks; |
| ● | third-party attempts to abuse our marketing, advertising, messaging or social products and functionalities to impersonate persons or organizations and disseminate information that is false, misleading or malicious; |
| ● | cyberattacks on our internally built infrastructure on which many of our service offerings operate, or on third-party cloud-computing platform providers; |
| ● | vulnerabilities resulting from enhancements and updates to our existing service offerings; |
| ● | vulnerabilities in the products or components across the broad ecosystem that our services operate in conjunction with and are dependent on; |
| ● | vulnerabilities existing within new technologies and infrastructures; |
| ● | attacks on, or vulnerabilities in, the many different underlying networks and services that power the Internet that our products depend on, most of which are not under our control or the control of our vendors, partners or customers; and |
| ● | employee or contractor errors or intentional acts that compromise our security systems. |
These risks are mitigated, to the extent possible, by enhanced processes and internal security controls. However, our ability to mitigate these risks may be impacted by the following:
| ● | frequent changes to, and growth in complexity of, the techniques used to breach, obtain unauthorized access to, or sabotage IT systems and infrastructure, which are generally not recognized until launched against a target, and could result in our being unable to anticipate or implement adequate measures to prevent such techniques; |
| ● | the continued evolution of our internal IT systems as we early adopt new technologies and new ways of sharing data and communicating internally and with partners and customers, which increases the complexity of our IT systems; |
| ● | authorization by our customers to third-party technology providers to access their customer data, which may lead to our customers’ inability to protect their data that is stored on our servers; and |
33
| ● | our limited control over our customers or third-party technology providers, or the processing of data by third-party technology providers, which may not allow us to maintain the integrity or security of such transmissions or processing. |
Yet, we remain vulnerable to such threats. A security breach or incident could result in unauthorized parties obtaining access to, or the denial of authorized access to, our IT systems or data, or our customers’ systems or data, including intellectual property and proprietary, sensitive or other confidential information. A security breach could also result in a loss of confidence in the security of our services, damage our reputation, negatively impact our future sales, disrupt our business and lead to increases in insurance premiums and legal, regulatory and financial exposure and liability. As an example in June 2022 we experienced a network outage which required us, among other things, to incur costs to respond to the incident and to limit access to our applications and services by our employees and customers. We believe the June 2022 network outage caused some of our customers to reduce volumes, look for alternate vendors and consider other providers for new requirements resulting in claims against us and lost revenue. Finally, the detection, prevention and remediation of known or potential security vulnerabilities, including those arising from third-party hardware or software, may result in additional financial burdens due to additional direct and indirect costs, such as additional infrastructure capacity spending to mitigate any system degradation and the reallocation of resources from development activities.
The use or capabilities of AI in our offerings may result in increased costs, and reputational harm and liability.
We are increasingly building AI into many of our offerings. As with many innovations, AI presents additional risks and challenges that could affect our business. If we enable or offer solutions that draw controversy due to their perceived or actual impact on human rights, privacy, employment, or in other social contexts, we may experience reputational harm, competitive harm or legal liability. Data practices by us or others that result in controversy could also impair the acceptance of AI solutions. This in turn could undermine the decisions, predictions or analysis AI applications produce, subjecting us to competitive harm, legal liability or reputational harm. The rapid evolution of AI will require the application of resources to develop, test and maintain our products and services to help ensure that AI is implemented ethically in order to minimize unintended, harmful impact. Uncertainty around new and emerging AI applications such as generative AI content creation may require additional investment in the development of proprietary datasets, machine learning models and systems to test for accuracy, bias and other variables, which are often complex, may be costly and could impact our profit margin as we decide to further expand generative AI into our product offerings.
Currency fluctuations among the Euro, British Pound, Swedish Krona, Indian rupee, the Philippine Peso, the Mexican Peso, the Canadian Dollar and the U.S. Dollar could have a material adverse effect on our results of operations.
The functional currencies of our businesses outside of the U.S. are the local currencies. Changes in exchange rates between these foreign currencies and the U.S. Dollar will affect the recorded levels of our assets, liabilities, net sales, cost of goods sold and operating margins and could result in exchange gains or losses. The primary foreign currencies to which we have exposure are the European Union Euro, Swedish Krona, British Pound Sterling, Canadian Dollar and Indian rupees. Exchange rates between these currencies and the U.S. Dollar in recent years have fluctuated significantly and may do so in the future. Our operating results and profitability may be affected by any volatility in currency exchange rates and our ability to manage effectively currency transaction and translation risks. To the extent the U.S. Dollar strengthens against foreign currencies, our foreign revenues and profits will be reduced when converted into and reported in U.S. Dollars.
Although the vast majority of our revenues are denominated in U.S. dollars, a significant portion of our expenses are incurred and paid in Euros, British Pound Sterling, Swedish Krona, Indian rupees, and to a lesser extent in other currencies, including the Philippine Peso, the Mexican Peso and the Canadian dollar. We report our financial results in U.S. Dollars. The exchange rate between the Indian rupee and the U.S. Dollar has changed substantially in recent years and may fluctuate substantially in the future. Our results of operations may be adversely affected if such fluctuations continue, or increase, or other currencies fluctuate significantly against the U.S. Dollar. Further, although we
34
do not currently take steps to hedge our foreign currency exposures, should we choose in the future to implement a hedging strategy, there can be no assurance that our hedging strategy will be successful.
Fluctuations in the costs of paper, ink, energy, by-products and other raw materials may adversely impact the results of our operations.
Purchases of paper, ink, energy and other raw materials represent a large portion of our costs. Increases in the costs of these inputs may increase our costs and we may not be able to pass these costs on to customers through higher prices. In addition, we may not be able to resell waste paper and other print-related by-products or may be adversely impacted by decreases in the prices for these by-products. Increases in the cost of materials may adversely impact customers’ demand for our printing and printing-related services.
Sales tax laws in the U.S. may change resulting in service providers having to collect sales taxes in states where the current laws do not require us to do so. This could result in substantial tax liabilities.
Our U.S. subsidiaries collect and remit sales tax in states in which the subsidiaries have physical presence or in which we believe sufficient nexus exists which obligates us to collect sales tax. Other states may, from time to time, claim that we have state-related activities constituting physical nexus to require such collection. Additionally, many other states seek to impose sales tax collection or reporting obligations on companies that sell goods to customers in their state, or directly to the state and its political subdivisions, regardless of physical presence. Such efforts by states have increased recently, as states seek to raise revenues without increasing the income tax burden on residents. We cannot predict whether the nature or level of contacts we have with a particular state will be deemed enough to require us to collect sales tax in that state nor can we be assured that Congress or individual states will not approve legislation authorizing states to impose tax collection or reporting obligations on our activities. A successful assertion by one or more states that we should collect sales tax could result in substantial tax liabilities related to past sales and would result in considerable administrative burdens and costs for us.
We are subject to laws of the United States and foreign jurisdictions relating to processing certain financial transactions, including payment card transactions and debit or credit card transactions, and failure to comply with those laws could subject us to legal actions and materially adversely affect our results of operations and financial condition.
We process, support and execute financial transactions, and disburse funds, on behalf of both government and commercial customers, often in partnership with financial institutions. This activity includes receiving debit and credit card information, processing payments for and due to our customers and disbursing funds on payment or debit cards to payees of our customers. As a result, the transactions we process may be subject to numerous United States (both federal and state) and foreign jurisdiction laws and regulations, including the Electronic Fund Transfer Act, as amended, the Currency and Foreign Transactions Reporting Act of 1970 (commonly known as the Bank Secrecy Act), as amended, the Dodd-Frank Wall Street Reform and Consumer Protection Act of 2010, as amended, the Gramm-Leach-Bliley Act, as amended, and the USA PATRIOT ACT of 2001, as amended. Other United States (both federal and state) and foreign jurisdiction laws apply to our processing of certain financial transactions and related support services. These laws are subject to frequent changes, and new statutes and regulations in this area may be enacted at any time. Changes to existing laws, the introduction of new laws in this area or failure to comply with existing laws that are applicable to us may subject us to, among other things, additional costs or changes to our business practices, liability for monetary damages, fines and/or criminal prosecution, unfavorable publicity, restrictions on our ability to process and support financial transactions and allegations by our customers, partners and clients that we have not performed our contractual obligations. Any of these could materially adversely affect our results of operations and financial condition.
As a smaller reporting company, we are subject to scaled disclosure requirements that may make it more challenging for investors to analyze our results of operations and financial prospects and certain investors may find investing in our securities less attractive.
Currently, we are a “smaller reporting company,” as defined by Rule 12b-2 of the Exchange Act. As a “smaller reporting company,” we are able to provide simplified executive compensation disclosures in our filings and have certain
35
other decreased disclosure obligations in our filings with the SEC, including being required to provide only two years of audited financial statements in annual reports. Consequently, it may be more challenging for investors to analyze our results of operations and financial prospects.
Furthermore, we are a non-accelerated filer as defined by Rule 12b-2 of the Exchange Act, and, as such, are not required to provide an auditor attestation of management’s assessment of internal control over financial reporting, which is generally required for SEC reporting companies under Section 404(b) of the Sarbanes-Oxley Act. Because we are not required to, and have not, had our auditor’s provide an attestation of our management’s assessment of internal control over financial reporting, a material weakness in internal controls may remain undetected for a longer period. If some investors find our securities less attractive as a result, there may be a less active trading market for our securities and their market price may be more volatile.
If we fail to maintain an effective system of disclosure controls and internal control over financial reporting, our ability to produce timely and accurate financial statements or comply with applicable regulations could be impaired.
As a public company, we are subject to the reporting requirements of the Exchange Act, the Sarbanes-Oxley Act of 2002, as amended (the "Sarbanes-Oxley Act"), and the listing standards of the Nasdaq. We expect that the requirements of these rules and regulations will continue to increase our legal, accounting and financial compliance costs, make some activities more difficult, time consuming and costly, and place significant strain on our personnel, systems and resources. The Sarbanes-Oxley Act requires, among other things, that we maintain effective disclosure controls and procedures and internal control over financial reporting. We are continuing to develop and refine our disclosure controls and other procedures that are designed to ensure that information required to be disclosed by us in the reports that we will file with the SEC is recorded, processed, summarized and reported within the time periods specified in SEC rules and forms, and that information required to be disclosed in reports under the Exchange Act is accumulated and communicated to our principal executive and financial officers. In order to maintain and improve the effectiveness of our disclosure controls and procedures and internal control over financial reporting, we have expended, and anticipate that we will continue to expend, significant resources, including accounting-related costs and significant management oversight.
Our current controls and any new controls that we develop may become inadequate because of changes in conditions in our business. Further, deficiencies in our disclosure controls or our internal control over financial reporting may be discovered in the future. Any failure to develop or maintain effective controls, or any difficulties encountered in their implementation or improvement, could harm our operating results or cause us to fail to meet our reporting obligations and may result in a restatement of our financial statements for prior periods. Any failure to implement and maintain effective internal control over financial reporting also could adversely affect the results of management evaluations of our internal control over financial reporting that we are required to include in our periodic reports that we file with the SEC. Ineffective disclosure controls and procedures and internal control over financial reporting could also cause investors to lose confidence in our reported financial and other information, which would likely have a negative effect on the trading price of our Common Stock. In addition, if we are unable to meet these requirements, we may not be able to remain listed on the Nasdaq.
Management assessed the effectiveness of our internal control over financial reporting as of December 31, 2023 and based on its assessment, our management, including our Executive Chairman and Interim Chief Financial Officer, has concluded that our internal control over financial reporting was not effective as of December 31, 2023 due to material weaknesses in our internal control over financial reporting. For more information, see Part II—Item 9A—Controls and Procedures of the Annual Report.
Any failure to maintain effective disclosure controls and internal control over financial reporting could have a material and adverse effect on our business and operating results and cause a decline in the price of our Common Stock.
Internal control matters are more fully discussed in Part II—Item 9A—Controls and Procedures of the Annual Report.
Certain of our subsidiaries completed a business combination with a SPAC, which resulted in our EMEA business operating as a separate public company.
36
On November 29, 2023, the Company completed the merger of its European business with CFFE. The combined company now operates as XBP Europe. We indirectly own a majority of the outstanding capital stock of XBP and control the majority of the board of directors of that entity. In addition certain of our employees and officers continue to serve our EMEA business. There can be no assurances that we will continue to own a control position in XPB Europe either as a result of dilution or a decision by us, in the future, to exit all or a portion of our position. Since XBP Europe has begun operating as a standalone public company, we have faced additional reporting and other obligations imposed by various rules and regulations applicable to public companies. Increased legal and financial compliance costs related to XBP Europe could potentially have an adverse effect on the Company’s revenue growth and profit margins.
General Risk Factors
Our results of operations could be adversely affected by economic and political conditions, creating complex risks, many of which are beyond our control.
Our business depends on the continued demand for our services. If global economic conditions worsen, our business could be adversely affected. Along with our customers we are subject to global political, economic and market conditions, including inflation, interest rates, energy costs, the impact of natural disasters, disease, military action and the threat of terrorism. Our revenue heavily depends on customers in North America and EMEA. Economic downturns like those we recently experienced as a result of COVID-19, could result in decreased demand for our services. Other developments such as consolidations, restructurings or reorganizations, particularly involving our customers, could also cause the demand for our services to decline. We may not be able to plan effectively for or respond to such impact. To adapt we have undertaken or may undertake initiatives to reduce our cost structure, such as consolidation of resources to provide region-wide support to our international subsidiaries in a centralized fashion. Any future workforce and/or facility reductions that may be implemented will be subject to local employment laws which may impose expenses and logistical challenges in connection with any such workforce reductions, and the costs actually incurred may prove higher than our anticipated cost savings in undertaking those initiatives. In addition, future disruptions in the global credit markets may adversely affect our liquidity and financial condition, and the liquidity and financial condition of our customers. Such disruptions may limit our ability to access or increase the cost of financing needed to meet liquidity needs and affect the ability of our customers to use credit to purchase our services or to make timely payments to us.
Our industry may be adversely impacted by a negative public reaction in the U.S. and elsewhere to providing certain of our services from outside the U.S. and related legislation.
We have based our strategy of future growth on certain assumptions regarding our industry and future demand in the market for the provision of business process solutions in part using offshore resources. However, providing services from offshore locations is a politically sensitive topic due to a perceived association between offshore service providers and the loss of jobs in their home countries. In addition, there has been some negative publicity about the experience of certain companies that provide their services offshore, particularly in India. The trend of providing business process solutions offshore may not continue and could reverse if companies elect to develop and perform their business processes internally or are discouraged from transferring these services to offshore service providers. Any slowdown or reversal of existing industry trends could harm our business and could have a material adverse effect on our business, results of operations, financial condition and cash flows.
If we fail to attract, train and retain skilled professionals, including highly skilled technical personnel to satisfy customer demand and senior management to lead our business globally, or our labor expenses increase, our business and results of operations will be materially adversely affected.
Our success relies on our ability to retain skilled professionals, including project managers, IT engineers and senior technical personnel to meet sufficient to meet customer demand and on our ability to attract and retain senior management to lead our business globally. Competition for skilled labor is intense and the costs associated with recruiting and training employees can be significant. Increased labor costs due to competition, increased minimum wage or employee benefits costs (including various federal, state and local actions to increase minimum wages), unionization activity or other factors would adversely impact our cost of sales and operating expenses. For example, as minimum
37
wage rates increase, we may need to increase not only the wages of our minimum wage employees but also the wages paid to employees at wage rates that are above minimum wage.
We are also subject to applicable rules and regulations relating to our relationship with our employees, including minimum wage and break requirements, health benefits, unemployment and sales taxes, overtime, and working conditions and immigration status. Legislated increases in the minimum wage and increases in additional labor cost components, such as employee benefit costs, workers’ compensation insurance rates, compliance costs and fines, as well as the cost of litigation in connection with these regulations, would increase our labor costs. Should employees become represented by unions, we would be obligated to bargain with those unions with respect to wages, hours, and other terms and conditions of employment, which could increase our labor costs. In addition, many employers have been subject to actions brought by governmental agencies and private individuals under wage-hour laws on a variety of claims, such as improper classification of workers as exempt from overtime pay requirements and failure to pay overtime wages or record breaks properly, with such actions sometimes brought as class actions or under “private attorney general” statutes. Employment litigation risks, including wage-hour disputes, could result in substantial liabilities and expenses, diverting management attention and elevating labor costs. If costs of labor increase significantly, our business, results of operations, and financial condition will be adversely affected.
Failure to comply with data privacy and data protection laws in processing and transferring personal data across jurisdictions may subject us to penalties and other adverse consequences, and the enactment of more stringent data privacy and data protection laws may increase its compliance costs.
Our failure to address privacy and security concerns could result in expenses and liabilities, and have an adverse impact on us. Privacy and data security regulations continue to become more complex and have greater consequences. For example, Europe’s General Data Protection Regulation, or GDPR, imposes several stringent requirements for controllers and processors of personal data, including, higher standards for obtaining consent from individuals to process their personal data, more robust disclosures to individuals and a strengthened individual data rights regime, and shortened timelines for data breach notifications. Failure to comply with the requirements of the GDPR and the applicable national data protection laws of the European Union member states may result in fines of up to €20,000,000 or up to 4% of the total worldwide annual turnover of the preceding financial year.
In addition, new domestic data privacy laws, such as the California Consumer Privacy Act (“CCPA”) as amended by the California Privacy Rights Act (“CPRA”), the Virginia Consumer Data Protection Act, the Colorado Privacy Act, the Connecticut Data Privacy Act and the Utah Consumer Privacy Act similarly impose or may impose new obligations on us and many of our customers, potentially as both businesses and service providers. These laws continue to evolve, and as various states introduce similar proposals, we and our customers could be exposed to additional regulatory burdens.
Although we monitor the regulatory, judicial and legislative environment and have invested in addressing these developments, these laws may require us to make additional changes to our practices and services to enable us or our customers to meet the new legal requirements, and may also increase our potential liability exposure through new or higher potential penalties for noncompliance. Furthermore, privacy laws and regulations are subject to differing interpretations and may be inconsistent among jurisdictions. In addition to government activity, privacy advocates and other industry groups have established or may establish new self-regulatory standards that may place additional burdens on our ability to provide our services globally. Our customers expect us to meet voluntary certification and other standards established by third parties, such as PCIDSS. If we are unable to maintain these certifications or meet these standards, it could adversely affect our ability to provide our solutions to certain customers and could harm our business.
The costs of compliance with, and other burdens imposed by, privacy laws, regulations and standards may limit the use and adoption of our services, reduce overall demand for our services, make it more difficult to meet expectations from our commitments to customers and our customers’ customers, lead to significant fines, penalties or liabilities for noncompliance, impact our reputation, or slow the pace at which we close sales transactions, in particular where customers request specific warranties and unlimited indemnity for noncompliance with privacy laws, any of which could harm our business.
38
Furthermore, the uncertain and shifting regulatory environment may cause our customers or our customers’ customers to resist providing the data necessary to allow our customers to use our services effectively. In addition, new services we develop or acquire in connection with changing events may expose us to liability or regulatory risk. Even the perception that the privacy and security of personal information are not satisfactorily protected or do not meet regulatory requirements could inhibit sales of our products or services and could limit adoption of our cloud-based solutions.
Failure to comply with the U.S. Foreign Corrupt Practices Act, or the FCPA, economic and trade sanctions, regulations, and similar laws could subject us to penalties and other adverse consequences.
We operate internationally and are subject to anti-corruption laws and regulations, including the FCPA, the U.K. Bribery Act and other laws that prohibit the making or offering of improper payments to foreign government officials and political figures. These laws prohibit improper payments or offers of payments to foreign governments and their officials and political parties for the purpose of obtaining or retaining business. We are also subject to certain economic and trade sanctions programs which prohibit or restrict transactions to or from or dealings with specified countries, their governments, and in certain circumstances, their nationals, and with individuals and entities that are specially-designated nationals of those countries, narcotics traffickers, and terrorists or terrorist organizations. We have implemented policies to identify and address potentially impermissible transactions under such laws and regulations; however, there can be no assurance that all of our and our subsidiaries’ employees, consultants, and agents will not take actions in violation of our policies for which we may be ultimately responsible.
Changes in laws or regulations, or a failure to comply with any laws and regulations, may adversely affect our business, investments and results of operations.
We are subject to laws, regulations and rules enacted by national, regional and local governments and Nasdaq. Compliance with applicable laws, regulations and rules may be difficult, time consuming and costly. Those laws, regulations and rules and their interpretation and application may also change from time to time and any failure to comply with applicable laws, regulations and rules, as interpreted and applied, could have a material adverse effect on our business and results of operations.
In addition, our customers conduct business in a variety of industries, including financial services, the public sector, healthcare and telecommunications. Regulators have adopted and may in the future adopt regulations or interpretive positions regarding the use of cloud computing and other outsourced services. The costs of compliance with and other burdens imposed by industry-specific laws, regulations and interpretive positions may limit our customers’ use and adoption of our services and reduce overall demand for our services. Compliance with these regulations may also require us to devote greater resources to support certain customers increasing costs and lengthening sales cycles. If we are unable to comply with these guidelines or controls, or if our customers are unable to obtain regulatory approval to use our services where required, our business may be harmed.
We operate in a number of jurisdictions and, as a result, may incur additional expenses in order to comply with the laws of those jurisdictions.
Our business operates globally, and is required to comply with the laws of multiple jurisdictions. These laws regulating the internet, payments, payments processing, privacy, taxation, terms of service, website accessibility, consumer protection, intellectual property ownership, services intermediaries, labor and employment, wages and hours, worker classification, background checks, and recruiting and staffing companies, among others, could be interpreted to apply to us, and could result in greater rights to competitors, users, and other third parties. Compliance with these laws and regulations may be costly, and at times, may require us to change our business practices or restrict our product offerings, and the imposition of any such laws or regulations on us, our clients, or third parties that we or our clients utilize to provide or use our services, may adversely impact our revenue and business. In addition, we may be subject to multiple overlapping legal or regulatory regimes that impose conflicting requirements and enhanced legal risks.
39
ITEM 1B. UNRESOLVED STAFF COMMENTS
None.
ITEM 1C. CYBERSECURITY
Risk Management and Strategy
Exela has developed and maintained a comprehensive cybersecurity program which is integrated within Exela’s enterprise risk management program and encompasses the corporate and operational technology environments, as well as client-facing products and services. Our cybersecurity program has implemented a governance structure and process to identify, assess, manage, mitigate, respond to and report on cybersecurity incidents and risks within an ever-changing threat landscape. We utilize cybersecurity policies and frameworks based on industry and government standards, including the National Institute of Standards and Technology Cyber Security Framework (“NIST CSF”). This does not imply that we meet any particular technical standards, specifications, or requirements, but rather that we use NIST CSF as a guide to help us identify, assess, and manage cybersecurity risks relevant to our business.
Our cybersecurity program includes an incident response plan, which establishes (1) a framework for classifying security incidents according to their severity level, taking into account the nature and scope of the incident; and (2) protocols for the escalation of incident. Exela owns and operates a 24 x 7 security operations center (“SOC”) which monitors our global cybersecurity solutions and production environments, and serves as a central location for the reporting of cybersecurity matters. The roles and responsibilities of the SOC and our cybersecurity team in the incident response context are established by the incident response plan, as well as in associated playbooks and other procedural documentation
We partner with third parties to support and evaluate our cybersecurity program including cybersecurity maturity assessments, incident response, penetration testing and consulting on best practices. Our processes also address cybersecurity threat risks associated with our use of third-party service providers, including those who have access to our data or our systems. Third-party risks are included within our risk assessment of vendors, as well as our cybersecurity-specific risk identification program. In addition, cybersecurity considerations affect the selection and oversight of third-party service providers. We perform diligence on third parties, particularly those that have access to our systems, data or facilities that house such systems or data, and continually monitor cybersecurity threat risks identified through such diligence.
The Company has implemented a cybersecurity awareness program which covers topics such as phishing, social networking safety, password security and mobile device usage. We regularly communicate these and other pertinent security issues or compliance across our organization. Additionally, Exela has mandatory security awareness training addressing cybersecurity, privacy and confidential information.
In 2023, we did not identify any cybersecurity threats that have materially affected or are reasonably likely to materially affect our business strategy, results of operations, or financial condition. In June 2022, we experienced a previously disclosed network outage which required us to, among other things, limit access to our applications and services by our employees and customers. In response, we incurred considerable costs to restore the security of our internal systems and networks and adopted various enhancements. Please refer to “Item 1A. Risk Factors” for further information about the material risks associated with various cybersecurity threats.
Governance
Our Board considers cybersecurity risk as part of its risk oversight function and has delegated to its Audit Committee oversight of cybersecurity and other information technology risks. Our Audit Committee oversees management’s ongoing activities related to our cybersecurity risk management and compliance programs.
Our cybersecurity program is led by our Chief Technology Officer (“CTO”), who has two decades of experience in various cybersecurity, software development, product management, and other technology-related roles. Our CTO
40
oversees teams across the company supporting our security functions of identify, prevent, detect, respond, and recover. These teams are comprised of personnel with a broad range of experience across the private and public sectors, the technology industry, and different geographic regions.
Our Audit Committee receives periodic reports from our CTO and management on our cybersecurity risks and the current threat landscape trends. In addition, management will update the Board directly, as necessary, regarding cybersecurity incidents. The full Board also receives presentations on cybersecurity topics from our CTO and other security management staff as part of the Board’s continuing oversight of topics that impact the Company.
ITEM 2. PROPERTIES
We lease and own numerous facilities worldwide with larger concentrations of space in Texas, Michigan, Connecticut, California, India, Mexico, and the Philippines. The size of our active property portfolio as of December 31, 2023 was approximately 2.7 million square feet (sq. ft.) and comprised of 100 leased properties and 7 owned properties including offices, sales offices, service locations, and production facilities. Many of our operating facilities are equipped with fiber connectivity and have access to other power sources. Substantially all of our operations facilities are leased under long term leases with varying expiration dates, except for the following owned locations: (i) two operations facilities in India with a combined building area of approximately 78,000 sq. ft., respectively, (ii) an operating facility in Georgiana, Alabama with an approximate building area of 20,000 sq. ft., (iii) an operating facility in Troy, Michigan that serves as the Company’s primary data center with an approximate building area of 66,000 sq. ft. (iv) an operating facility in Egham, England with an approximate building area of 11,000 sq. ft. (v) an operating facility in Dublin, Ireland with an approximate building area of 25,000 sq. ft. and (vi) an innovation center in New York, New York with an approximate building area of 2,300 sq. ft. We also maintain an operating presence at 436 customer sites.
Our management believes that in all material respects our properties have been satisfactorily maintained, are in good condition and are suitable for our operations.
ITEM 3. LEGAL PROCEEDINGS
Class Action
On March 23, 2020, the Plaintiff, Bo Shen, filed a putative class action against the Company, Ronald Cogburn, the Company’s former Chief Executive Officer and current member of the Board, and James Reynolds, the Company’s former Chief Financial Officer and current member of the Board. Plaintiff claimed to have been a holder of 4,000 shares of Company stock, purchased on October 4, 2019 at $1.34 per share (in the case of the number of shares and share price without adjusting for any of the reverse stock splits occurring after that date). Plaintiff asserted two claims covering the purported class period of March 16, 2018 to March 16, 2020: (1) a violation of Section 10(b) and Rule 10b-5 of the Exchange Act against all defendants; and (2) a violation of Section 20(a) of the Exchange Act against Mr. Cogburn and Mr. Reynolds. The allegations in the suit stemmed from the Company’s press release, dated March 16, 2020 (announcing the postponement of the earnings call and delay in filing of its annual report on Form 10-K for the fiscal year ended December 31, 2019), and press release and related SEC filings, dated March 17, 2020 (announcing its intent to restate its financial statements for 2017, 2018 and interim periods through September 30, 2019) and certain other matters. On July 27, 2023, the parties submitted a settlement agreement to the Court that resulted in the dismissal of the action with prejudice in exchange for a settlement payment of $5.0 million, which was preliminarily approved by the Court on August 21, 2023, and on December 7, 2023, the Court granted final approval of the settlement and entered a final judgment of dismissal and final orders approving the plan of allocation and plaintiffs’ attorneys’ fee award, which was to be paid entirely out of the $5.0 million settlement fund.
Derivative Action
On July 8, 2020, Plaintiff Gregory McKenna filed a shareholder derivative action asserting the following claims against current and former directors and officers of Exela: (1) Violations of Section 14(a) of the Exchange Act; (2) Violations of Section 10(b) and Rule 10b-5 of the Exchange Act; (3) Violations of Section 20(a) of the Exchange Act; (4) breach of fiduciary duty; (5) unjust enrichment; and (6) waste of corporate assets. On December 21, 2020, Plaintiffs
41
Richard W. Moser and Jonathan Gonzalez filed a substantially similar shareholder derivative action, which has been consolidated with the McKenna action. The claims stem from substantially the same factual allegations set forth in the Shen securities class action lawsuit, described above. These claims have not been discharged by the above referenced settlement, and at this time, it is not practicable to render an opinion about whether an unfavorable outcome is probable or remote with respect to this matter; however, the Company believes it has meritorious defenses.
Contract Claim
On October 24, 2018, HOV Services, Inc., a subsidiary of the Company (“HOV Services”), filed a lawsuit against ASG Technologies Group, Inc. (“ASG”) that sought to terminate the renewal of licensing agreement between the parties. HOV Services alleged that the licensing agreement was renewed under duress and brought claims against ASG under the Computer Fraud and Abuse Act, 18 U.S.C. § 1030 et seq., the Stored Communications Act, 18 U.S.C. § 2701 et seq., and various common law doctrines. ASG subsequently brought counterclaims asserting breach of contract and other allegations. On February 27, 2024, a judge granted ASG’s motion for directed verdict on its breach of contract claim and awarded ASG $2.5 million in damages plus interest, for a total of $3,717,465. On February 29, 2024, the jury found in favor of ASG on all remaining claims and awarded ASG damages in the amount of $687,000 plus interest, for a total of $997,738. The parties have until April 15, 2024 to file post-judgment motions. HOV Services is currently evaluating its options.
Other
We are, from time to time, involved in other legal proceedings, inquiries, claims and disputes, which arise in the ordinary course of business. Although our management cannot predict the outcomes of these matters, our management believes these actions will not have a material, adverse effect on our financial position, results of operations or cash flows.
ITEM 4. MINE SAFETY DISCLOSURES
Not applicable
42
PART II
ITEM 5. MARKET FOR REGISTRANT’S COMMON EQUITY, RELATED STOCKHOLDER MATTERS AND ISSUER PURCHASES OF EQUITY SECURITIES
Market Information
Our Common Stock is traded on the Nasdaq under the symbol “XELA”.
Stockholders
As of April 2, 2024 we had 38 record holders of our Common Stock (which excludes the beneficial owners of shares held in “street” name or held through participants in depositories).
Dividends
We have not paid any cash dividends on shares of our Common Stock. The payment of cash dividends in the future will be dependent upon our revenues and earnings, capital requirements, general financial condition, and is within the discretion of our Board.
Equity Compensation Plan Information
The following table provides information as of December 31, 2023, with respect to the shares of our Common Stock that may be issued under our existing equity compensation plans.
|
|
| ||||
Number of Securities to | Number of Securities | |||||
be Issued Upon | Remaining Available | |||||
Exercise of Outstanding | Weighted Average | for Future Issuance | ||||
Options, RSUs and | Exercise Price of | Under Equity | ||||
Market Performance Units | Outstanding Options | Compensation Plans(1) | ||||
Plan Category | ||||||
Equity compensation plans approved by stockholders |
| 2,446 | $ | 46,485 |
| 1,808 |
Equity compensation plans not approved by stockholders |
| — |
| — |
| — |
Total |
| 2,446 | $ | 46,485 |
| 1,808 |
| (1) | The Company currently maintains the 2018 Stock Incentive Plan, which was approved by our Board on December 19, 2017 and subsequently approved by a majority of our stockholders by written consent on December 20, 2017. The 2018 Stock Incentive Plan became effective on January 17, 2018 and there were originally 694 shares of our Common Stock reserved for issuance under our 2018 Stock Incentive Plan. On December 31, 2022, the shareholders of the Company approved our Amended and Restated 2018 Stock Incentive Plan increasing the number of shares of Common Stock reserved for issuance from an original 694 shares to 4,462. |
Sale of Unregistered Securities
There were no unregistered sales of equity securities in 2023 that have not been previously reported in a Quarterly Report on Form 10-Q or Current Report on Form 8-K.
43
Issuer Purchases of Equity Securities During the Year Ended December 31, 2023
The table below sets forth information with respect to purchases made by or on behalf of us or any “affiliated purchaser” (as defined in Rule 10b-18(a)(3) under the Securities Exchange Act of 1934) of shares of our Common Stock during the fourth quarter of 2023:
|
|
| Total Number |
| Maximum | ||||
of Shares | Number of | ||||||||
Purchased as | Shares that | ||||||||
Part of | May Yet Be | ||||||||
Average | Publicly | Purchased | |||||||
Number | Price | Announced | Under the | ||||||
of Shares | Paid per | Plans or | Plans or | ||||||
Period | Purchased | Share | Programs | Programs | |||||
October 1, 2023-October 31, 2023 | — | $ | — | 1,787 | 48,213 | ||||
November 1, 2023-November 30, 2023 | — | — | 1,787 | 48,213 | |||||
December 1, 2023-December 31, 2023 | — | $ | — | 1,787 | 48,213 | ||||
Total | — |
| |||||||
| (1) | On August 10, 2022, the Company’s Board authorized a share buyback program (the “2022 Share Buyback Program”), pursuant to which the Company was authorized to repurchase, from time to time, up to 50,000 shares of its Common Stock over a two-year period through various means, including, open market transactions and privately negotiated transactions. The 2022 Share Buyback Program does not obligate the Company to repurchase any shares. The decision as to whether to repurchase any shares and the timing of repurchases will be based on the price of the Company’s Common Stock, general business and market conditions and other investment considerations and factors. No shares were repurchased under the 2022 Share Buyback Program during the year ended December 31, 2023. As of December 31, 2023, the Company had repurchased and concurrently retired a total of 1,787 shares of Common Stock pursuant to the 2022 Share Buyback Program. |
ITEM 6. [Reserved]
ITEM 7. MANAGEMENT’S DISCUSSION AND ANALYSIS OF FINANCIAL CONDITION AND RESULTS OF OPERATIONS
Forward Looking Statements
The following Management’s Discussion and Analysis of Financial Condition and Results of Operations should be read in conjunction with a review of the other Items included in this Annual Report and our December 31, 2023 Consolidated Financial Statements included elsewhere in this report. Certain statements contained in this “Management’s Discussion and Analysis of Financial Condition and Results of Operations” may be deemed to be forward-looking statements. See “Special Note Regarding Forward-Looking Statements.”
Overview
We are a global provider of transaction processing solutions, enterprise information management, document management and digital business process services. Our technology-enabled solutions allow global organizations to address critical challenges resulting from the massive amounts of data obtained and created through their daily operations. Our solutions address the life cycle of transaction processing and enterprise information management, from enabling payment gateways and data exchanges across multiple systems, to matching inputs against contracts and handling exceptions, to ultimately depositing payments and distributing communications. We believe our process expertise, information technology capabilities and operational insights enable our customers’ organizations to more efficiently and effectively execute transactions, make decisions, drive revenue and profitability, and communicate critical information to their employees, customers, partners, and vendors.
44
History
We are a former special purpose acquisition company that completed our initial public offering on January 22, 2015. In July 2017, Exela Technologies, Inc. (“Exela”), formerly known as Quinpario Acquisition Corp. 2 (“Quinpario”), completed its acquisition of SourceHOV Holdings, Inc. (“SourceHOV”) and Novitex Holdings, Inc. (“Novitex”) pursuant to the business combination agreement dated February 21, 2017 (“Novitex Business Combination”). In conjunction with the completion of the Novitex Business Combination, Quinpario was renamed Exela Technologies, Inc.
The Novitex Business Combination was accounted for as a reverse merger for which SourceHOV was determined to be the accounting acquirer. Outstanding shares of SourceHOV were converted into our Common Stock, presented as a recapitalization, and the net assets of Quinpario were acquired at historical cost, with no goodwill or other intangible assets recorded. The acquisition of Novitex was treated as a business combination under ASC 805, Business Combinations (“ASC 805”) and was accounted for using the acquisition method. The strategic combination of SourceHOV and Novitex formed Exela, which is one of the largest global providers of information processing solutions based on revenues.
On November 29, 2023, we completed the merger of our European business with CF Acquisition Corp. VIII. The combined company now operates as XBP Europe and, beginning on November 30, 2023, XBP Europe shares started trading on the Nasdaq Stock Market under the ticker symbol “XBP” and its warrants started trading on the Nasdaq Stock Market under the ticker symbol “XBPEW”. We own a majority of the outstanding capital stock of XBP Europe.
Reverse Stock Split
On May 12, 2023, we effected a one-for-two hundred reverse stock split (the “Reverse Stock Split”) of our issued and outstanding shares of our Common Stock. At the effective time of the Reverse Stock Split, every two hundred (200) shares of Common Stock issued and outstanding were automatically combined into one (1) share of issued and outstanding Common Stock, without any change in the par value per share. Our Common Stock began trading on The Nasdaq Capital Market on a Reverse Stock Split-adjusted basis on May 15, 2023. There was no change in our ticker symbol as a result of the Reverse Stock Split. All information related to Common Stock, stock options, restricted stock units, warrants and earnings per share have been retroactively adjusted to give effect to the Reverse Stock Split for all periods presented.
Sale of Non-core Assets
On June 8, 2023, the Company completed the sale of its high-speed scanner business for a purchase price of approximately $30.1 million, subject to final working capital adjustments. As a result of this transaction, the Company disposed of $16.5 million of goodwill based on the relative fair value of the high-speed scanner business to the total fair value of the ITPS reporting unit. This transaction resulted in a total pre-tax gain of $7.2 million included in selling, general and administrative expenses (exclusive of depreciation and amortization) in the consolidated statements of operations for the year ended December 31, 2023. Per the terms of the sales agreement, the Company may receive additional cash consideration upon the future occurrence of certain earn out events described in the sales agreement.
Our Segments
Our three reportable segments are Information & Transaction Processing Solutions (“ITPS”), Healthcare Solutions (“HS”), and Legal & Loss Prevention Services (“LLPS”). These segments are comprised of significant strategic business units that align our TPS and EIM products and services with how we manage our business, approach our key markets and interact with our customers based on their respective industries.
ITPS: Our largest segment, ITPS, provides a wide range of solutions and services designed to aid businesses in information capture, processing, decisioning and distribution to customers primarily in the financial services, commercial, public sector and legal industries. Our major customers include many leading banks, insurance companies,
45
and utilities, as well as hundreds of federal, state and government entities. Our ITPS offerings enable companies to increase availability of working capital, reduce turnaround times for application processes, increase regulatory compliance and enhance consumer engagement.
HS: HS operates and maintains an outsourcing business specializing in both the healthcare provider and payer markets. We serve the top healthcare insurance payers and hundreds of healthcare providers.
LLPS: Our LLPS segment provides a broad array of support services in connection with class action settlement administration, claims adjudication, labor, employment and other legal matters. Our customer base consists of corporate counsel, government attorneys, and law firms.
Revenues
ITPS revenues are primarily generated from a transaction-based pricing model for the various types of volumes processed, licensing and maintenance fees for technology sales, and a mix of fixed management fee and transactional revenue for document logistics and location services. HS revenues are primarily generated from a transaction-based pricing model for the various types of volumes processed for healthcare payers and providers. LLPS revenues are primarily based on time and materials pricing as well as through transactional services priced on a per item basis.
People
We draw on the business and technical expertise of our talented and diverse global workforce to provide our customers with high-quality services. Our business leaders bring a strong diversity of experience in our industry and a track record of successful performance and execution.
As of December 31, 2023, we had approximately 14,100 employees globally excluding China as the Company has closed its China operations, with 7,200 employees located in Americas and EMEA, and the remainder located primarily in India and the Philippines.
Costs associated with our employees represent the most significant expense for our business. We incurred personnel costs of $509.7 million and $540.9 million for the years ended December 31, 2023 and 2022, respectively. The majority of our personnel costs are variable and are incurred only while we are providing our services. In certain jurisdictions, for example many countries in Europe, there is a statutory payment requirement for any people made redundant due to automation or relocation of delivery locations.
Facilities
We lease and own numerous facilities worldwide with larger concentrations of space in Texas, Michigan, Connecticut, California, India, Mexico, and the Philippines. Our owned and leased facilities house general offices, sales offices, service locations, and production facilities.
The size of our active property portfolio as of December 31, 2023 was approximately 2.7 million square feet. As of December 31, 2023, our active property portfolio comprised of 100 leased properties and 7 owned properties. We reduced our active portfolio of leased properties by 11 properties during 2023 with the continued adoption of our work from anywhere program.
We believe that our current facilities are suitable and adequate for our current businesses.
Key Performance Indicators
We use a variety of operational and financial measures to assess our performance. Among the measures considered by our management are the following:
| ● | Revenue by segment; |
46
| ● | EBITDA; and |
| ● | Adjusted EBITDA. |
Revenue by Segment
We analyze our revenue by comparing actual monthly revenue to internal projections and prior periods across our operating segments in order to assess performance, identify potential areas for improvement, and determine whether segments are meeting management’s expectations.
EBITDA and Adjusted EBITDA
We view EBITDA and Adjusted EBITDA as important indicators of performance of our consolidated operations. We define EBITDA as net income, plus taxes, interest expense, and depreciation and amortization. We define Adjusted EBITDA as EBITDA plus transaction and integration costs; non-cash equity compensation, (gain) or loss from sale or disposal of assets or business, non-recurring charges and impairment charges; and other infrequent, or unusual costs and expenses. See “—Other Financial Information (Non-GAAP Financial Measures)” for more information and a reconciliation of EBITDA and Adjusted EBITDA to net loss, the most directly comparable financial measure calculated and presented in accordance with GAAP.
Results of Operations
The following table sets forth our results of operation data for the year ended December 31, 2023 compared to the year ended December 31, 2022.
Year Ended December 31, | |||||
2023 | 2022 | ||||
Revenue: |
|
| |||
ITPS | $ | 732,319 | $ | 765,134 | |
HS |
| 251,380 |
| 239,270 | |
LLPS |
| 80,425 |
| 72,753 | |
Total revenue |
| 1,064,124 |
| 1,077,157 | |
Cost of revenue (exclusive of depreciation and amortization): |
|
|
|
| |
ITPS |
| 599,320 |
| 633,673 | |
HS |
| 185,796 |
| 190,835 | |
LLPS |
| 48,306 |
| 52,966 | |
Total cost of revenues |
| 833,422 |
| 877,474 | |
Selling, general and administrative expenses (exclusive of depreciation and amortization) |
| 150,672 |
| 176,524 | |
Depreciation and amortization |
| 60,535 |
| 71,831 | |
Impairment of goodwill and other intangible assets | — | 171,182 | |||
Related party expense |
| 11,444 |
| 8,923 | |
Operating profit (loss) |
| 8,051 |
| (228,777) | |
Interest expense, net |
| 139,656 |
| 164,870 | |
Debt modification and extinguishment costs (gain), net | (16,129) | 4,522 | |||
Sundry expense (income), net |
| 973 |
| (957) | |
Other expense (income), net |
| (884) |
| 14,170 | |
Net loss before income taxes |
| (115,565) |
| (411,382) | |
Income tax expense |
| (8,868) |
| (4,199) | |
Net loss | $ | (124,433) | $ | (415,581) | |
47
Revenue
For the year ended December 31, 2023, our revenue on a consolidated basis decreased by $13.0 million, or 1.2%, to $1,064.1 million from $1.077.2 million for the year ended December 31, 2022. We experienced revenue decline in our ITPS segment of $32.8 million while revenue increased in our HS segment and LLPS segment by $12.1 million and $7.7 million respectively. Our ITPS, HS, and LLPS segments constituted 68.8%, 23.6%, and 7.6% of total revenue, respectively, for the year ended December 31, 2023, compared to 71.0%, 22.2%, and 6.8%, respectively, for the year ended December 31, 2022. The revenue changes by reporting segment were as follows:
ITPS—Revenue attributable to our ITPS segment was $732.3 million for the year ended December 31, 2023 compared to $765.1 million for the year ended December 31, 2022. The majority of this revenue decline is attributable to exiting contracts and statements of work from certain customers with revenue that we believe was unpredictable, non-recurring and were not a strategic fit to Company’s long-term success. In June 2023, we sold our high-speed scanner business and this resulted in $6.8 million lower revenue in the current fiscal compared to the year ended December 31, 2022. The impact in revenue is also linked to market conditions including customer buying behavior, emerging technologies and market disruptors. The reported ITPS segment revenue benefited by $0.6 million from currency conversion during the year ended December 31, 2023, compared to the year ended December 31, 2022.
HS—For the year ended December 31, 2023, revenue attributable to our HS segment increased by $12.1 million, or 5.1%, to $251.4 million from $239.3 million for the year ended December 31, 2022. The increase in revenue was primarily due to higher volumes from our new and existing healthcare customers.
LLPS—Revenue attributable to our LLPS segment was $80.4 million for the year ended December 31, 2023 compared to $72.8 million for the year ended December 31, 2022. The increase in revenue by $7.7 million, or 10.5%, is primarily due to an increase in project based engagements in legal claims administration services.
Cost of Revenue
For the year ended December 31, 2023, our cost of revenue decreased by $44.1 million, or 5%, compared to the year ended December 31, 2022. Costs in our ITPS segment decreased by $34.4 million, or 5.4%, primarily attributable to the corresponding decline in revenues. HS segment costs decreased by $5.0 million, or 2.6% primarily due to decrease in employee-related cost. LLPS segment cost of revenue decreased by $4.7 million, or 8.8% primarily due to lower employee related costs and third party operating costs.
The decrease in cost of revenues on a consolidated basis was primarily due to a decrease in employee-related costs of $31.8 million, lower infrastructure and maintenance costs of $9.3 million, lower other operating costs of $7.0 million which primarily include supplies, cost of products, service expenses, offset by higher travel costs of $0.1 million and pass through cost of $4.0 million. The Company has also recorded an impairment charge of $1.9 million on right-of-use assets during the year ended December 31, 2023, which is part of infrastructure and maintenance cost.
Cost of revenue for the year ended December 31, 2023 was 78.3% of revenue compared to the 81.5% of revenue for the comparable same period in the prior year.
Selling, General and Administrative Expenses
Selling, general and administrative expenses (“SG&A expenses”) decreased by $25.9 million, or 14.6%, to $150.7 million for the year ended December 31, 2023, compared to $176.5 million for the year ended December 31, 2022. The decrease in our SG&A costs was primarily attributable to a gain of $7.2 million on sale of the high-speed scanner business, $10.8 million in business interruption insurance recoveries, lower employee related costs by $0.9 million, lower travel costs of $0.8 million, lower infrastructure, maintenance and operating costs of $3.4 million, lower legal and professional fees of $6.3 million and lower other SG&A expenses of $3.1 million partially offset by employee severances and facility exit costs of $4.3 million, including $1.8 million for exit costs related to China operations. SG&A expenses decreased as a percentage of revenues to 14.2% for the year ended December 31, 2023 as compared to 16.4% for the year ended December 31, 2022.
48
Depreciation & Amortization
Total depreciation and amortization expense was $60.5 million and $71.8 million for the years ended December 31, 2023 and 2022, respectively. The decrease in total depreciation and amortization expense by $11.3 million was primarily due to a reduction in depreciation expense as a result of the expiration of the lives of assets acquired in prior periods and decrease in intangibles amortization expense due to end of useful lives for certain intangible assets during the year ended December 31, 2023 compared to the year ended December 31, 2022.
Impairment of Goodwill and Other Intangible Assets
There was no impairment of goodwill and other intangible assets for the year ended December 31, 2023. Impairment of goodwill and other intangible assets for the year ended December 31, 2022 was $171.2 million. During the three months ended September 30, 2022 and year ended December 31, 2022 the Company made an evaluation based on factors such as changes in the Company’s growth rate and recent trends in the Company’s market capitalization, and concluded that a triggering event for an interim impairment analysis had occurred in the third quarter and fourth quarter of 2022. As a result of the interim impairment analysis at September 30, 2022, the Company recorded an impairment charge of $29.6 million and the interim impairment analysis at December 31, 2022, the Company recorded an additional impairment charge of $141.6 million including taxes to goodwill relating to ITPS.
Related Party Expenses
Related party expense was $11.4 million for the year ended December 31, 2023 compared to $8.9 million for the year ended December 31, 2022. The increase in related party expenses is on account of increase in our cloud solution consumption.
Interest Expense
Interest expense was $139.7 million for the year ended December 31, 2023 compared to $164.9 million for the year ended December 31, 2022. The decrease in interest expenses by $25.2 million was primarily due to amortization of debt exchange premium and reduction in interest costs due to exchange of July 2026 Notes for April 2026 Notes during the year ended December 31, 2023 compared to the year ended December 31, 2022.
Debt Modification and Extinguishment Costs (Gain), net
Debt modification and extinguishment gain was $16.1 million for the year ended December 31, 2023 compared to a net extinguishment loss of $4.5 million for the year ended December 31, 2022.
During the year ended December 31, 2023, we repurchased $13.8 million principal amount of 2023 Notes for a cash consideration of $4.4 million. The gain on early extinguishment of debt for the 2023 Notes (as defined below) totaled $9.9 million and is inclusive of less than $0.1 million write off of original issue discount and debt issuance costs. During the year ended December 31, 2023, we repurchased $15.1 million principal amount of the 2023 Term Loans (as defined below) outstanding under the Credit Agreement for a cash consideration of $8.0 million. The gain on early extinguishment of debt for the 2023 Term Loans repurchases totaled $7.1 million and is inclusive of less than $0.1 million write off of original issue discount and debt issuance costs. In July 2023, the Company recorded an additional debt extinguishment gain of $0.6 million when the Company fully repaid and discharged the remaining outstanding balance of $48.4 million under the 2023 Term Loans by making a cash payment of $44.8 million and by issuance of $3.0 million principal amount of the April 2026 Notes in an exchange transaction. On July 11, 2023, the Company fully repaid and discharged the remaining outstanding balance of $48.4 million of the 2023 Term Loans by making a cash payment of $44.8 million and by issuance of $3.0 million principal amount of the April 2026 Notes in an exchange transaction (as further discussed below). The Company recorded $0.6 million debt extinguishment gain on repayment of the 2023 Term Loans. During the year ended December 31, 2023, we paid $1.6 million of exit fees on the partial prepayment of the BRCC Term Loan (as defined and described further in the description of “Indebtedness” below) which was treated as a debt extinguishment cost.
49
For the year ended December 31, 2022, the Company recorded a debt extinguishment cost of $9.0 million in connection with partial prepayment of $50.0 million in cash on the $100.0 million senior secured revolving facility maturing July 12, 2022. Additionally, the exit fees paid on the partial prepayment of BRCC Term Loan was treated as a debt extinguishment cost offset by gain on extinguishment of debt of $5.3 million related to buyback of July 2026 Notes.
Sundry Expense (Income), net
Sundry expense, net was $1.0 million for the year ended December 31, 2023 compared to sundry income, net of $1.0 million for the year ended December 31, 2022. The change over the prior year period is primarily attributable to exchange rate fluctuations on foreign currency transactions.
Other Expense (Income), net
Other income, net was $0.9 million for the year ended December 31, 2023 compared to other expense, net of $14.2 million for the year ended December 31, 2022. The decrease in expense was primarily attributable to re-measurement of our true-up guarantee obligation under the Revolver Exchange (as defined below) and accrual of true-up liability based on the market price of the July 2026 Notes in other expense, net during the year ended December 31, 2022.
Income Tax Expense
We had an income tax expense of $8.9 million for the year ended December 31, 2023 compared to income tax expense of $4.2 million for the year ended December 31, 2022. The increase in tax expense from the prior year was largely due to improvement in operating performance.
Other Financial Information (Non-GAAP Financial Measures)
We view EBITDA and Adjusted EBITDA as important indicators of performance. We define EBITDA as net income, plus taxes, interest expense, and depreciation and amortization. We have historically defined Adjusted EBITDA, including in our Annual Report on Form 10-K for the fiscal year ended December 31, 2022, as EBITDA plus optimization and restructuring charges, including severance and retention expenses; transaction and integration costs; other non-cash charges, including non-cash compensation, (gain) or loss from sale or disposal of assets, and impairment charges; and management fees and expenses consistent with the definitions contained in our debt agreements.
Beginning with this Annual Report, the Company has made certain changes to the way it defines Adjusted EBITDA that impact the comparability of the metrics to prior periods. Specifically, the Company will no longer include optimization and restructuring expenses, contract costs and certain other charges that we historically added back to our computation of Adjusted EBITDA consistent with the definitions in our debt agreements. The Company’s presentation of Adjusted EBITDA for prior years in this Annual Report also reflects this updated definition of Adjusted EBITDA (i.e., will not be the same as set forth in prior filings due to the change of definition).
We present EBITDA and Adjusted EBITDA because we believe they provide useful information regarding the factors and trends affecting our business in addition to measures calculated under GAAP.
Note Regarding Non-GAAP Financial Measures
EBITDA and Adjusted EBITDA are not financial measures presented in accordance with GAAP. We believe that the presentation of these non-GAAP financial measures will provide useful information to investors in assessing our financial performance and results of operations as our Board and management use EBITDA and Adjusted EBITDA to assess our financial performance, because it allows them to compare our operating performance on a consistent basis across periods by removing the effects of our capital structure (such as varying levels of interest expense), asset base (such as depreciation and amortization) and items outside the control of our management team. Net loss is the GAAP measure most directly comparable to EBITDA and Adjusted EBITDA. Our non-GAAP financial measures should not be considered as alternatives to the most directly comparable GAAP financial measure. Each of these non-GAAP financial measures has important limitations as analytical tools because they exclude some but not all items that affect the most
50
directly comparable GAAP financial measures. These non-GAAP financial measures are not required to be uniformly applied, are not audited and should not be considered in isolation or as substitutes for results prepared in accordance with GAAP. Because EBITDA and Adjusted EBITDA may be defined differently by other companies in our industry, our definitions of these non-GAAP financial measures may not be comparable to similarly titled measures of other companies, thereby diminishing their utility.
The following tables present a reconciliation of EBITDA and Adjusted EBITDA to our net loss, the most directly comparable GAAP measure, for the years ended December 31, 2023 and 2022:
Year Ended December 31, | |||||
2023 |
| 2022 | |||
Net Loss | $ | (124,433) | $ | (415,581) | |
Taxes |
| 8,868 |
| 4,199 | |
Interest expense |
| 139,656 |
| 164,870 | |
Depreciation and amortization |
| 60,535 |
| 71,831 | |
EBITDA |
| 84,626 |
| (174,681) | |
Transaction and integration costs (1) |
| 6,172 | 18,586 | ||
Non-cash equity compensation (2) |
| 115 | 985 | ||
Other charges including non-cash (3) | (12,991) | 35,932 | |||
Loss/(gain) on sale of assets (4) | 1,105 | 1,357 | |||
Loss/(gain) on business disposals (5) | (7,223) | — | |||
Debt modification and extinguishment costs (gain), net | (16,129) | 4,522 | |||
Loss/(gain) on derivative instruments |
| — |
| (1,091) | |
Exit costs related to China operations | 1,850 | — | |||
XBP Europe related de-SPAC costs | 2,478 | — | |||
Impairment of goodwill, other intangible assets |
| — |
| 171,182 | |
Adjusted EBITDA | $ | 60,003 | $ | 56,792 | |
| (1) | Represents non-recurring legal, consulting and other fees and expenses incurred in connection with acquisitions, dispositions, debt-exchanges and other extraordinary transactions and events during the applicable period. |
| (2) | Represents the non-cash charges related to restricted stock units and options. |
| (3) | Represents fair value adjustments to our true-up guarantee obligation under the Revolver Exchange (as defined below), network outage related costs and related insurance recoveries, legal settlement costs for class action. |
| (4) | Represents a loss/(gain) recognized on the disposal of property, plant, and equipment and other assets. |
| (5) | Represents a loss/(gain) recognized on the sale of high-speed scanner business in the second quarter of 2023. |
Liquidity and Capital Resources
Overview
Under ASC Subtopic 205-40, Presentation of Financial Statements—Going Concern (“ASC 205-40”), the Company has the responsibility to evaluate whether conditions and/or events raise substantial doubt about its ability to meet its future financial obligations as they become due within one year after the date that the financial statements are issued. The following conditions raised substantial doubt about our ability to continue as a going concern: a history of net losses, working capital deficits, accumulated deficit and significant cash payments for interest on our long-term debt. Going concern matters are more fully discussed in Note 2, Basis of Presentation and Summary of Significant Accounting Policies.
Liquidity is the availability of adequate amounts of cash with an enterprise to meet its needs for cash requirements. At December 31, 2023, cash, restricted cash, and cash equivalents totaled $67.2 million, including restricted cash of $43.8 million. As of December 31, 2023, our working capital deficit amounted to $213.7 million, a decrease of $105.9 million as compared to working capital deficit of $319.6 million as of December 31, 2022. This decrease in working capital deficit is primarily a result of repayments and a decrease in the current portion of long-term debt and a decrease in accrued interest due to debt reduction.
51
In the ordinary course of business, we enter into contracts and commitments that obligate us to make payments in the future. These obligations include borrowings, interest obligations, purchase commitments, operating and finance lease commitments, employee benefit payments and taxes. Specifically, $19.9 million outstanding under the BRCC Revolver (as defined and described further in the description of “Indebtedness” below) is payable in eight (8) monthly installments of $2.0 million commencing January 31, 2024, with the remaining outstanding principal balance of $3.9 million payable on September 30, 2024. The current maturities of the Senior Secured Term Loan and the other debts are $2.0 million and $8.1 million, respectively. See Note 11 – Long-Term Debt and Credit Facilities, Note 13 – Employee Benefit Plans, and Note 14 – Commitments and Contingencies, to our consolidated financial statements herein for further information on material cash requirements from known contractual and other obligations.
We plan to spend approximately 1.5% of total revenue on total capital expenditures over the next twelve months. Our business model has evolved to leverage cloud hosted platforms. This has reduced our capital expenditures and increased our operating expenses. This is the primary driver of changes in our capital expenditures when compared with historical periods. Our future cash requirements will depend on many factors, including our rate of revenue growth, our investments in strategic initiatives, applications or technologies, operation centers and acquisition of complementary businesses, which may require the use of significant cash resources and/or additional equity or debt financing. In the event that additional financing is required from outside sources, we may not be able to raise it on terms acceptable to us or at all adversely impacting our plans.
On March 27, 2020, the Coronavirus Aid, Relief, and Economic Security Act (“CARES Act”) was enacted in response to the COVID-19 pandemic. The CARES Act, among other things, includes provisions relating to refundable payroll tax credits, deferment of employer side social security payments, net operating loss carryback periods, alternative minimum tax credit refunds, modifications to the net interest deduction limitations and technical corrections to tax depreciation methods for qualified improvement property. The Company has implemented favorable provisions of the CARES Act, including the refundable payroll tax credits and the deferment of employer social security payments. At the end of 2021, the Company paid a portion of the deferred employer social security due as per Internal Revenue Services guidance. The remaining balance of deferred employer social security taxes will need to be paid by fiscal year 2024. The Company similarly used COVID-19 relief measures in various European jurisdictions, including permitted deferrals of certain payroll, social security and value added taxes. At the end of 2021, the Company paid a portion of these deferred payroll taxes, social security and value added taxes. The remaining balance of European deferred payroll taxes, social security and value added taxes will need to be paid by fiscal year 2025 as per deferment timeline.
On May 27, 2021, the Company entered into an At Market Issuance Sales Agreement (“First ATM Agreement”) with B. Riley Securities, Inc. (“B. Riley”) and Cantor Fitzgerald & Co. (“Cantor”), as distribution agents under which the Company may offer and sell shares of the Common Stock from time to time through the Distribution Agents, acting as sales agent or principal. On September 30, 2021, the Company entered into a second At Market Issuance Sales Agreement with B. Riley, BNP Paribas Securities Corp., Cantor, Mizuho Securities USA LLC and Needham & Company, LLC, as distribution agents (together with the First ATM Agreement, the “ATM Agreement”).
Sales of the shares of Common Stock under the ATM Agreement, have been in “at the market offerings” as defined in Rule 415 under the Securities Act, including, without limitation, sales made directly on or through the Nasdaq or on any other existing trading market for the Common Stock, as applicable, or to or through a market maker or any other method permitted by law, including, without limitation, negotiated transactions and block trades. Shares of Common Stock sold under the ATM Agreement have been offered pursuant to the Company’s Registration Statement on Form S-3 (File No. 333-255707), filed with the SEC on May 3, 2021, and declared effective on May 12, 2021 and the Company’s Registration Statement on Form S-3 (File No. 333-263909), filed with the SEC on March 28, 2022, and
52
declared effective on May 10, 2022 , and the prospectuses and related prospectus supplements included therein for sales of shares of Common Stock as follows:
Supplement | Period | Number of Shares Sold | Weighted Average Price Per Share | Gross Proceeds | Net Proceeds |
Prospectus supplement dated May 27, 2021 with an aggregate offering price of up to $100.0 million (“Common ATM Program–1”) | May 28, 2021 through July 1, 2021 | 12,356 | $8,032.74 | $99.3 million | $95.7 million |
Prospectus supplement dated June 30, 2021 with an aggregate offering price of up to $150.0 million (“Common ATM Program–2”) | June 30, 2021 through September 2, 2021 | 14,395 | $10,413.79 | $149.9 million | $144.4 million |
Prospectus supplement dated September 30, 2021 with an aggregate offering price of up to $250.0 million (“Common ATM Program–3”) | October 6, 2021 through March 31, 2022 | 83,719 | $2,986.18 | $250.0 million | $241.0 million |
Prospectus supplement dated May 23, 2022 with an aggregate offering price of up to $250.0 million (“Common ATM Program–4”) (1) | May 24, 2022 through March 31, 2023 | 6,262,182 | $36.15 | $226.4 million | $219.3 million |
| (1) | Due to the late filing of 2022 Form 10-K the Company lost eligibility to use Form S-3 (and thereby the ability to conduct at the market offerings and one of its sources of liquidity) for a period of time which was extended, as a result of subsequent delinquent quarterly reports on Form 10-Q, including for the period ended September 30, 2023 (the “Q3 Form 10-Q”). As of the date of this filing, the Company does not expect to regain eligibility to use Form S-3 until twelve full calendar months following the date the Q3 Form 10-Q was due. Any future delinquency with respect to the filing of a Form 10-K, Form 10-Q, or certain Form 8-Ks will cause the Company to lose Form S-3 eligibility for at least twelve (12) calendar months from the due date of the delinquent filing. |
The Amended Receivables Purchase Agreement (as defined and described further in the description of “Indebtedness” below) entered into on June 17, 2022, provides us access to liquidity through the sale of receivables. Under the Amended Receivables Purchase Agreement, transfers of accounts receivable are treated as sales and are accounted for as a reduction in accounts receivable because the agreement transfers effective control over and risk related to the accounts receivable to the purchasers of the receivables. The Company de-recognized $522.7 million and $408.9 million of accounts receivable under this agreement during the years ended December 31, 2023 and 2022, respectively. The amount remitted to the Purchasers during fiscal years 2023 and 2022 was $507.6 million and $308.7 million, respectively. Unsold accounts receivable of $41.2 million and $46.5 million were pledged by the SPEs as collateral to the Purchasers as of December 31, 2023, and 2022, respectively.
On August 10, 2022, the Company’s Board authorized a share buyback program (the “2022 Share Buyback Program”), pursuant to which the Company is authorized to repurchase, from time to time, up to 50,000 shares of Common Stock over the following two-year period through various means, including, open market transactions and privately negotiated transactions. The 2022 Share Buyback Program does not obligate the Company to repurchase any shares. The decision as to whether to repurchase any shares and the timing of repurchases will be based on the price of the Common Stock, general business and market conditions and other investment considerations and factors. No shares were repurchased under the 2022 Share Buyback Program during the year ended December 31, 2023. As of December 31, 2023, we had repurchased and concurrently retired a total of 1,787 shares of Common Stock pursuant to the 2022 Share Buyback Program.
On December 7, 2023, the Company received insurance claim settlement proceeds of $9.9 million under the business interruption claim filed for the network outage which occurred in June 2022. The Company received additional settlement proceeds of $0.9 million over the year 2023 under similar claims. These proceeds were used for working capital.
53
With an objective to increase free cash flows and in order to maintain sufficient liquidity to support profitable growth, the Company is pursuing further reduction in debt and repricing of existing debt. The Company will continue to pursue the sale of certain non-core businesses that are not central to the Company’s long-term strategic vision and invest in the acquisition of businesses that enhance the value proposition. The Company also plans to take further action to raise additional funds in the debt and equity capital markets. Based on our experience with the at-the-market programs and our knowledge of the Company and the financial market, we believe that we will be able to raise those additional funds. There can be no assurances, however, that any of these initiatives will be consummated or will achieve its desired result.
Cash Flows
The following table summarizes our cash flows for the years indicated:
Year Ended December 31, | |||||
2023 |
| 2022 | |||
Net cash provided by (used in) operating activities | $ | 3,556 | $ | (87,162) | |
Net cash provided by (used in) investing activities |
| 17,918 |
| (21,770) | |
Net cash provided by financing activities |
| 624 |
| 106,639 | |
Subtotal |
| 22,098 |
| (2,293) | |
Effect of exchange rates on cash, restricted cash and cash equivalents |
| (12) |
| (700) | |
Net increase (decrease) in cash, restricted cash and cash equivalents | $ | 22,086 | $ | (2,993) | |
Analysis of Cash Flow Changes between the years ended December 31, 2023 and December 31, 2022
Operating Activities— Net cash provided by operating activities was $3.6 million for the year ended December 31, 2023, compared to net cash used in operating activities of $87.2 million for the year ended December 31, 2022. The decrease of $90.7 million in cash used in operating activities for the year ended December 31, 2023 was due to lower cost of revenue, lower selling, general and administrative expenses, insurance proceeds received for business interruption and other expenses, improvement in operating cycle for accounts payable and accrued liabilities primarily on account of lower interest expense for the period, and higher cash inflow from sales of accounts receivable.
Investing Activities— Net cash provided by investing activities was $17.9 million for the year ended December 31, 2023, compared to cash used in investing activities of $21.8 million for the year ended December 31, 2022. The decrease of $39.7 million in cash used in investing activities for the year ended December 31, 2023 was primarily due to $29.8 million of net cash proceeds from the sale of the high-speed scanner business and lower additions to property, plant and equipment and patents in 2023 offset by higher additions to internally developed software.
Financing Activities— Net cash provided by financing activities was $0.6 million for the year ended December 31, 2023, compared to cash provided by financing activities of $106.6 million for the year ended December 31, 2022. The decrease of $106.0 million in cash provided by financing activities for the year ended December 31, 2023 was primarily as a result of net repayment of the BRCC Term Loan, senior secured term loans and other loans of $132.3 million, debt issuance costs of $8.5 million, cash outflow of $11.9 million for debt repurchases (all as defined and described further in the description of “Indebtedness” below), which is offset by $67.0 million of net proceeds from equity offerings, $40.0 million of proceeds from the Senior Secured Term Loan, $31.5 million of proceeds from the Second Lien Note, $9.6 million of proceeds from borrowings under the BRCC Revolver and $5.2 million of proceeds from issuance of XBP Europe’s common stock.
Indebtedness
Following is a description of the Company’s key credit facilities since the Novitex Business Combination, when we borrowed term loans of $350.0 million, issued notes of $1.0 billion and established a revolving facility of $100.0 million. Proceeds from the indebtedness were initially used to pay off credit facilities existing immediately before the Novitex Business Combination.
54
2023 Term Loans
On July 13, 2018, subsidiaries of the Company repriced $343.4 million of term loans then outstanding under that certain First Lien Credit Agreement, dated July 12, 2017, with Royal Bank of Canada, Credit Suisse AG, Cayman Islands Branch, Natixis, New York Branch and KKR Corporate Lending LLC (the “Repricing Term Loans”) and borrowed an additional $30.0 million pursuant to incremental term loans (the “2018 Incremental Term Loans”). On April 16, 2019, subsidiaries of the Company borrowed a further $30.0 million pursuant to incremental term loans (the “2019 Incremental Term Loans”, and, together with the 2018 Incremental Terms Loans and Repricing Term Loans, referred to herein as the “2023 Term Loans”). The subsidiaries of the Company made periodic interest and principal repayments on the 2023 Term Loan.
On December 9, 2021, in a private exchange transaction, subsidiaries of the Company exchanged $212.1 million of 2023 Term Loans for $84.3 million in cash and in $127.8 million principal amount of new 11.500% First-Priority Senior Secured Notes scheduled to mature July 15, 2026 (the “July 2026 Notes”) issued by Exela Intermediate LLC and Exela Finance Inc., wholly-owned subsidiaries of the Company (together, the “Issuers”).
As a result of the private exchange, repurchases (as discussed below) and periodic principal repayments, $48.4 million aggregate principal amount of the 2023 Term Loans were outstanding as of July 11, 2023, the date the Company fully repaid and discharged the remaining outstanding balance of the 2023 Term Loans by making a cash payment of $44.8 million and by issuance of $3.0 million principal amount of new 11.500% First-Priority Senior Secured Notes scheduled to mature April 15, 2026 (the “April 2026 Notes”) issued by the Issuers in an exchange transaction (as discussed below).
2023 Notes
On July 12, 2017, subsidiaries of the Company issued $1.0 billion in aggregate principal amount of 10.0% First Priority Senior Secured Notes due 2023 (the “2023 Notes”). The 2023 Notes were guaranteed by nearly all U.S. subsidiaries of Exela Intermediate LLC. The 2023 Notes bore interest at a rate of 10.0% per year. The issuers paid interest on the 2023 Notes on January 15 and July 15 of each year, commencing on January 15, 2018.
On December 9, 2021, upon the settlement of a public exchange, $662.7 million aggregate principal amount of the July 2026 Notes were issued and an aggregate $225.0 million in cash (plus accrued but unpaid interest) was paid to participating holders in respect of the validly tendered $912.7 million principal amount of outstanding 2023 Notes.
As a result of the 2021 public exchange and repurchases (as discussed below), $9.0 million aggregate principal amount of the 2023 Notes remained outstanding as of July 11, 2023, the date the Company fully repaid and discharged the remaining outstanding balance of the 2023 Notes in cash.
July 2026 Notes
As of December 31, 2022, the Issuers had $980.0 million aggregate principal amount of the July 2026 Notes outstanding. During the year ended December 31, 2023, no July 2026 Notes were sold by subsidiaries of the Company. The July 2026 Notes are guaranteed by nearly all U.S. subsidiaries of Exela Intermediate LLC. The July 2026 Notes bear interest at a rate of 11.5% per year. We are required to pay interest on the July 2026 Notes on January 15 and July 15 of each year, and commenced making such interest payments on July 15, 2022. The July 2026 Notes are scheduled to mature on July 15, 2026. The Issuers may redeem the July 2026 Notes in whole or in part from time to time, at a redemption price of 100%, plus accrued and unpaid interest, if any, to, but excluding, the applicable redemption date.
On July 11, 2023, the Issuers, certain guarantors and U.S. Bank Trust Company, National Association, as trustee, entered into an indenture (the “April 2026 Notes Indenture”) governing the Company’s April 2026 Notes and issued approximately $764.8 million aggregate principal amount of the April 2026 Notes as consideration for the exchange of $956.0 million aggregate principal amount of the Issuers’ existing July 2026 Notes pursuant to a public exchange offer (the “2023 Exchange”). The Company performed an assessment of the 2023 Exchange and determined that it met the criteria to be accounted for as a troubled debt restructuring under ASC 470-60, Troubled Debt
55
Restructurings by Debtors. The undiscounted cash flows associated with the April 2026 Notes issued were compared to the carrying value of the exchanged July 2026 Notes and since the undiscounted cash flows of the April 2026 Notes exceeded the carrying value of the exchanged July 2026 Notes, the carrying value of the April 2026 Notes was established at the carrying value of the exchanged July 2026 Notes and the Company established new effective interest rates based on the carrying value of the exchanged July 2026 Notes prior to the 2023 Exchange. The difference between the principal amount of the issued April 2026 Notes and their carrying value was recorded as a premium and is included in long-term debt on the Company’s consolidated balance sheets. The Company recorded a premium of $142.3 million on the notes exchange, which will be reduced following the effective interest method as contractual interest payments are made on the April 2026 Notes.
On July 11, 2023, we entered into a seventh supplemental indenture to the July 2026 Notes Indenture which eliminated substantially all of the restrictive covenants, eliminated certain events of default, modified covenants regarding mergers and consolidations and modified or eliminated certain other provisions, including certain provisions relating to future guarantors and defeasance, contained in the July 2026 Notes Indenture and the July 2026 Notes. In addition, all of the collateral securing the July 2026 Notes was released pursuant to the seventh supplemental indenture.
As a result of the 2023 Exchange and repurchases (as discussed below), $24.0 million aggregate principal amount of the July 2026 Notes maturing July 15, 2026 remained outstanding as of December 31, 2023.
Senior Secured April 2026 Notes
On July 11, 2023, the Issuers issued approximately $767.8 million aggregate principal amount of the April 2026 Notes under the April 2026 Notes Indenture, which includes (i) $764.8 million aggregate principal amount of the April 2026 Notes issued under the 2023 Exchange (as described above) and (ii) $3.0 million aggregate principal amount of the April 2026 Notes issued as consideration for the exchange of certain of the Company’s outstanding 2023 Term Loans (as described above).
The April 2026 Notes are scheduled to mature on April 15, 2026. Interest on the April 2026 Notes will accrue at 11.500% per annum and will be paid semi-annually, in arrears, on January 15 and July 15 of each year, beginning July 15, 2023. Interest will be payable in cash or in kind by issuing additional April 2026 Notes (or increasing the principal amount of the outstanding April 2026 Notes) (“PIK Interest”) as follows: (A) for the July 15, 2023 interest payment date, such interest was paid in kind as PIK Interest, (B) for each interest payment date from and including the January 15, 2024 interest payment date through and including the July 15, 2024 interest payment date, such interest shall be paid in cash in an amount equal to (i) 50% of such interest plus (ii) an amount not to exceed an amount that, pro forma for such payment, would leave the issuers with Unrestricted Cash (as defined in the April 2026 Notes Indenture) of at least $15 million, with the remaining interest paid in kind as PIK Interest, and (C) for interest payment dates falling on or after January 15, 2025, such interest shall be paid in cash.
On July, 15, 2023, the Company issued $44.1 million in aggregate principal amount of the April 2026 Notes as a payment for PIK Interest due on July 15, 2023. $811.9 million aggregate principal amount of the April 2026 Notes maturing April 15, 2026 remained outstanding as of December 31, 2023.
The Issuers’ obligations under the April 2026 Notes and the April 2026 Notes Indenture are irrevocably and unconditionally guaranteed, jointly and severally, by the same guarantors (the “Guarantors”) that guarantee the July 2026 Notes (other than certain guarantors that have ceased to have operations or assets) and by certain of the Issuers’ other affiliates (“Affiliated Guarantors”). The April 2026 Notes and the related guarantees are first-priority senior secured obligations of the Issuers and the Guarantors.
The Issuers may redeem the April 2026 Notes at their option, in whole at any time or in part from time to time, at a redemption price of 100%, plus accrued and unpaid interest, if any, to, but excluding, the applicable redemption date. In addition, the April 2026 Notes will be mandatorily redeemable in part upon the sale of certain assets that constitute additional credit support.
56
The April 2026 Notes Indenture contains covenants that limit the Issuers’ and the Affiliated Guarantors and their respective subsidiaries’ ability to, among other things, (i) incur or guarantee additional indebtedness, (ii) pay dividends or distributions on, or redeem or repurchase, capital stock and make other restricted payments, (iii) make investments, (iv) consummate certain asset sales, (v) engage in certain transactions with affiliates, (vi) grant or assume certain liens and (vii) consolidate, merge or transfer all or substantially all of their assets. These covenants are subject to a number of important limitations and exceptions. In addition, upon the occurrence of specified change of control events, the Issuers must offer to repurchase the April 2026 Notes at 101% of the principal amount, plus accrued and unpaid interest, if any, to, but excluding, the applicable repurchase date. The April 2026 Notes Indenture also provides for events of default, which, if any of them occurs, would permit or require the principal, premium, if any, interest and any other monetary obligations on all of the then outstanding April 2026 Notes to be due and payable immediately.
Repurchases
In July 2021, the Company commenced a debt buyback program to repurchase senior secured indebtedness, which is ongoing. During the year ended December 31, 2022, we repurchased $15.0 million principal amount of the July 2026 Notes for a net cash consideration of $4.7 million. The gain on early extinguishment of debt for the July 2026 Notes during the year ended December 31, 2022 totaled $5.3 million and is inclusive of $5.0 million and $0.1 million write off of original issue discount and debt issuance costs, respectively.
During the year ended December 31, 2023, we repurchased $13.8 million principal amount of the 2023 Notes for a cash consideration of $4.4 million. The gain on early extinguishment of debt for the 2023 Notes during the year ended December 31, 2023 totaled $9.9 million and is inclusive of less than $0.1 million write off of original issue discount and debt issuance costs. During the year ended December 31, 2023, we repurchased $15.1 million principal amount of the 2023 Term Loans for a cash consideration of $8.0 million. The gain on early extinguishment of debt for the 2023 Term Loans during the year ended December 31, 2023 totaled $7.1 million and is inclusive of less than $0.1 million write off of original issue discount and debt issuance costs.
BRCC Facility
On November 17, 2021, GP2 XCV, LLC, a subsidiary of the Company (“GP2 XCV”), entered into a borrowing facility with B. Riley Commercial Capital, LLC (which was subsequently assigned to BRF Finance Co., LLC (“BRF Finance”)) pursuant to which the Company was able to borrow an original principal amount of $75.0 million, which was later increased to $115.0 million as of December 7, 2021 (as the same may be amended from time to time, the “BRCC Term Loan”). On March 31, 2022, GP2 XCV and B. Riley Commercial Capital, LLC amended this facility to permit GP2 XCV to borrow up to $51.0 million under a separate revolving loan (the “BRCC Revolver”, collectively with the BRCC Term Loan, the “BRCC Facility”).
The BRCC Facility is secured by a lien on all the assets of GP2 XCV and by a pledge of the equity of GP2 XCV. GP2 XCV is a bankruptcy-remote entity and as such its assets are not available to other creditors of the Company or any of its subsidiaries other than GP2 XCV. Interest under the BRCC Facility accrues at a rate of 11.5% per annum (13.5% per annum default rate) and is payable quarterly on the last business day of each March, June, September and December. The purpose of BRCC Term Loan was to fund certain repurchases of the secured indebtedness and to provide funding for certain debt exchange transactions. The purpose of BRCC Revolver is to fund general corporate purposes.
During the year ended December 31, 2023, we borrowed $9.6 million of principal amount under the BRCC Revolver. During the year ended December 31, 2023, we repaid $48.5 million and $9.7 million of outstanding principal amount under the BRCC Term Loan and the BRCC Revolver, respectively along with $1.6 million of exit fees on the BRCC Term Loan. The exit fees paid on the prepayment of the BRCC Term Loan were treated as a debt extinguishment cost under ASC 470-50, Modifications and Extinguishments and reported within debt modification and extinguishment costs (gain), net in our consolidated statements of operations. The BRCC Facility matured on June 10, 2023. As of December 31, 2023, the Company had fully repaid the outstanding balances under the BRCC Term Loan. As of December 31, 2023, there were borrowings of $19.9 million outstanding under the BRCC Revolver. The outstanding principal amount under the BRCC Revolver is payable in eight (8) monthly installments of $2.0 million commencing January 31, 2024, with the remaining outstanding principal balance of $3.9 million payable on September 30, 2024.
57
Senior Secured Term Loan
On July 11, 2023, Exela Intermediate LLC and Exela Finance Inc., wholly-owned subsidiaries of the Company, entered into a financing agreement with certain lenders and Blue Torch Finance LLC, as administrative agent, pursuant to which the lenders extended a term loan of principal amount of $40.0 million (“Senior Secured Term Loan”). On the same date, the Company used proceeds of this term loan and cash on hand to repay its outstanding 2023 Notes and 2023 Term Loans.
The Senior Secured Term Loan shall be, at the option of the Company, either a Reference Rate Loan, or a SOFR Rate Loan. Each portion of the Senior Secured Term Loan that is a Reference Rate Loan bears interest on the principal amount outstanding from the date of the Senior Secured Term Loan until repaid, at a rate per annum equal to the Reference Rate plus the Applicable Margin. “Reference Rate” for any period means the greatest of (i) 4.00% per annum, (ii) the federal funds rate plus 0.50% per annum, (iii) the Adjusted Term SOFR (which rate shall be calculated based upon an interest period of 1 month and shall be determined on a daily basis) plus 1.00% per annum, and (iv) the rate last quoted by the Wall Street Journal as the "Prime Rate" in the United States. “Applicable Margin,” with respect to the interest rate of (a) any Reference Rate Loan is 10.39% per annum, and (b) any SOFR Rate Loan is 11.39% per annum. SOFR Rate Loan shall bear interest on the principal amount outstanding, at a rate per annum equal to the Adjusted Term SOFR rate for the Interest Period in effect for the Term Loan plus Applicable Margin. “Adjusted Term SOFR” means the rate per annum equal to Term SOFR for such calculation, plus 0.26161%. “Term SOFR,” for calculation with respect to a SOFR Rate Loan, is the per annum forward-looking term rate based on secured overnight financing rate for a tenor comparable to the applicable interest period on the day that is two business days prior to the first day of such interest period. However, with respect to a Reference Rate Loan, “Term SOFR” means the per annum forward-looking term rate based on secured overnight financing rate for a tenor of three months on the day that is two business days prior to such day. If Term SOFR as so determined shall ever be less than 4.00%, then Term SOFR shall be deemed to be 4.00%.
The Company may, at any time, elect to have interest on all or a portion of the loans be charged at a rate of interest based upon Term SOFR (the “SOFR Option”) by notifying the administrative agent at least three (3) business days. Such notice needs to be provided in the case of the continuation of a SOFR Rate Loan as a SOFR Rate Loan on the last day of the then current interest period. The Company shall have not more than five (5) SOFR Rate Loans in effect at any given time, and only may exercise the SOFR Option for SOFR Rate Loans of at least $500,000 and integral multiples of $100,000 in excess thereof.
As of December 31, 2023, there were borrowings of $39.5 million outstanding under the Senior Secured Term Loan. The outstanding principal amount of the Senior Secured Term Loan shall be repaid in ten (10) equal quarterly installments of $0.5 million commencing March 31, 2024, with the remaining outstanding principal amount of $34.5 million payable at maturity along with accrued and unpaid interest. The maturity date of the Senior Secured Term Loan is January 14, 2026.
The Company may, at any time, prepay the principal of the Senior Secured Term Loan. Each prepayment shall be accompanied by the payment of accrued interest and the applicable premium, if any. Each prepayment shall be applied against the remaining installments of principal due on the Senior Secured Term Loan in the inverse order of maturity. The applicable premium shall be payable in the form of a make-whole amount if prepayment is made within one year of the borrowing date (the “First Period”). If optional prepayment is made between after the year one anniversary of the borrowing date to the date of two-year anniversary (the “Second Period”), the applicable premium shall be an amount equal to 1% times the amount of the principal amount of the Senior Secured Term Loan being paid on such date. The applicable premium shall be zero in case of prepayment after the date of two-year anniversary of the borrowing date. Further, during the Second Period, if the prepayment is because of an event of default or termination of contract for any reason, the applicable premium shall be 1% times the aggregate principal amount of the Senior Secured Term Loan outstanding on such date.
58
Securitization Facility
On December 17, 2020, certain subsidiaries of the Company entered into a $145.0 million securitization facility with a five year term (the “Securitization Facility”) with certain lenders and Alter Domus (US), LLC, as administrative agent (the “Securitization Administrative Agent”). The Securitization Facility provided for an initial funding of approximately $92.0 million supported by receivables, and, subject to contribution, a further funding of approximately $53.0 million to be supported by inventory and intellectual property. On December 17, 2020, Exela Receivables 3, LLC (the “Securitization Borrower”) made the initial borrowing of approximately $92.0 million under the Securitization Facility and used a portion of the proceeds to repay $83.0 million of the aggregate outstanding principal amount of loans as of December 17, 2020 under a previous $160.0 million accounts receivable securitization facility (“A/R Facility”) and used the remaining proceeds for general corporate purposes. On April 11, 2021, the Company amended the Securitization Facility to, among other things, extend the period during which the Company could access the approximately $53.0 million in additional borrowings upon the contribution of inventory and intellectual property to support the borrowing base from April 10, 2021 to September 30, 2021.
The Securitization Borrower, Exela Receivables 3 Holdco, LLC (the “Securitization Parent SPE,” and together with the Securitization Borrower, the “SPEs”), the Company, and certain of our operating subsidiaries that agreed to sell receivables in connection with the Securitization
Facility (the “Securitization Originators”) provided customary representations and covenants under the agreements underlying the Securitization Facility. The Securitization Facility identified certain events of default upon the occurrence of which the Securitization Administrative Agent may declare the facility’s termination date to have occurred and declare the outstanding Securitization Loan and all other obligations of the Securitization Borrower to be immediately due and payable, however the Securitization Facility does not include an ongoing liquidity covenant like the A/R Facility and aligns reporting obligations with the Company’s other material indebtedness agreements.
The Securitization Borrower and Securitization Parent SPE were formed in December 2020, and are consolidated into the Company’s financial statements. The Securitization Borrower and Securitization Parent SPE are bankruptcy remote entities and as such their assets are not available to creditors of the Company or any of its subsidiaries. Each loan under the Securitization Facility bore interest on the unpaid principal amount as follows: (i) if a Base Rate Loan, at a rate per annum equal to (x) the greatest of (a) the Prime Rate in effect on such day, (b) the Federal Funds Effective Rate in effect on such day plus 0.50% and (c) the Adjusted LIBOR Rate (as defined in the Securitization Loan Agreement) plus 1.00%, plus (y) 8.75%; or (ii) if a LIBOR Rate Loan, at the Adjusted LIBOR Rate plus 9.75%.
On June 17, 2022, the Company repaid in full the approximately $91.9 million principal amount of loans outstanding under the Securitization Facility, triggered a prepayment premium of $2.7 million and a required payment of approximately $0.5 million and $1.3 million in respect of accrued interest and fees, respectively. All obligations under the Securitization Facility (other than contingent indemnification obligations that expressly survive termination) terminated upon repayment. The Securitization Facility was replaced by the Amended Receivables Purchase Agreement and related agreements described below.
On June 17, 2022, the Company entered into an amended and restated receivables purchase agreement (as amended, the “Amended Receivables Purchase Agreement”) under a $150.0 million Securitization Facility among certain of the Company’s subsidiaries, the SPEs and certain global financial institutions (“Purchasers”). The Amended Receivables Purchase Agreement extends the term of the Securitization Facility such that the SPEs may sell certain receivables to the Purchasers until June 17, 2025. Under the Amended Receivables Purchase Agreement, transfers of accounts receivable from the SPEs are treated as sales and are accounted for as a reduction in accounts receivable, because the agreement transfers effective control over and risk related to the accounts receivable to the Purchasers. The Company and related subsidiaries have no continuing involvement in the transferred accounts receivable, other than collection and administrative responsibilities and, once sold, the accounts receivable are no longer available to satisfy creditors of the Company, the Securitization Originators, or any other relevant subsidiaries.
On June 17, 2022, the Company sold $85.0 million of its accounts receivable and used the whole proceeds from this sale to repay part of the $91.9 million borrowings under the Securitization Facility (as discussed above). These sales
59
were transacted at 100% of the face value of the relevant accounts receivable, resulting in derecognition of the accounts receivable from the Company’s consolidated balance sheet. The Company de-recognized $522.7 million and $408.9 million of accounts receivable under this agreement during the years ended December 31, 2023 and 2022, respectively. The amount remitted to the Purchasers during fiscal years 2023 and 2022 was $507.6 million and $308.7 million, respectively. Unsold accounts receivable of $41.2 million and $46.5 million were pledged by the SPEs as collateral to the Purchasers as of December 31, 2023, and 2022, respectively. These pledged accounts receivables are included in accounts receivable, net in the consolidated balance sheets. The program resulted in a pre-tax loss of $9.0 million and 3.1 million for the years ended December 31, 2023 and 2022, respectively.
BR Exar AR Facility
On February 15, 2023, certain of the Company’s subsidiaries entered into a receivables purchase agreement (the “First RPA”) with BR Exar, LLC (“BREL”), an affiliate of B. Riley Commercial Capital, LLC. The Company received $9.8 million, net of legal and other fees of $0.2 million, in purchase price under the First RPA. Under the terms of the First RPA, certain of the Company’s subsidiaries agreed to sell certain existing receivables and all of their future receivables to BREL until such time as BREL shall have collected $13.5 million, net of any costs, expenses or other amounts paid to or owing to the buyer under the agreement. BREL collected the entire outstanding balance of $13.5 million under the First RPA during the period from March 2023 to April 2023. Subsequent to the First RPA, certain of the Company’s subsidiaries entered into an another receivables purchase agreement on June 13, 2023 and additional eight (8) amendments to this receivables purchase agreement over the course of fiscal 2023 (the “Second RPA”, together with the First RPA, the “BR Exar AR Facility”) with BREL. The Company received $32.3 million, net of legal and other fees of $0.2 million, in purchase price under the Second RPA. Under the terms of the Second RPA, the Company’s subsidiaries agreed to sell certain existing receivables and all of their future receivables to BREL until such time as BREL shall have collected a total of $39.8 million, net of any costs, expenses or other amounts paid to or owing to the buyer under the agreement. BREL collected the entire outstanding balance of $39.8 million under the Second RPA during the period from June 2023 to December 2023. As of December 31, 2023, there was no outstanding balance under the BR Exar AR Facility.
Second Lien Note
On February 27, 2023, the SPEs and B. Riley Commercial Capital, LLC entered into a new Secured Promissory Note (which was subsequently assigned to BRF Finance) pursuant to which B. Riley Commercial Capital, LLC agreed to lend up to $35.0 million secured by a second lien pledge of the Securitization Borrower (the “Second Lien Note”). The Second Lien Note is scheduled to mature on June 17, 2025 and bears interest at a per annum rate of one-month Term SOFR plus 7.5%. The SPEs are party to the Amended Receivables Purchase Agreement, thus the transactions necessitated amendments to that agreement and related documents to permit the addition of subordinated debt and additional borrowing capacity into that transaction structure, in addition to providing for a $5.0 million fee to the lenders for facilitating the transaction. In connection with the above-described facility, we also amended the BRCC Term Loan and BRCC Revolver to provide for $9.6 million of borrowing capacity, which was drawn as described above.
As of December 31, 2023, there were borrowings of $31.5 million outstanding under the Second Lien Note payable at maturity.
Historical Trend Information
The following selected consolidated financial data should be read in conjunction with Item 8, "Financial Statements and Supplementary Data" of this Annual Report in order to fully understand factors that may affect the comparability of the financial data. The following selected Consolidated Balance Sheet data as of December 31, 2023 and 2022 and selected Consolidated Statements of Operations for the years ended December 31, 2023 and 2022 are derived from our audited financial statements included in Item 8 of this Annual Report. The following selected
60
consolidated financial data is provided here as historical trend information. The historical results do not necessarily indicate results expected for any future period.
|
|
|
| ||||||||||||
|
|
|
| ||||||||||||
Year Ended December 31, | |||||||||||||||
(in thousands, except share and per share data) |
| 2023 |
| 2022 |
| 2021 | 2020 |
| 2019 | ||||||
Statements of Operations Information: |
|
|
|
|
|
|
|
| |||||||
Revenue | $ | 1,064,124 | $ | 1,077,157 | $ | 1,166,606 | $ | 1,292,562 | $ | 1,562,337 | |||||
Cost of revenue (exclusive of depreciation and amortization) |
| 833,422 |
| 877,474 | 889,095 | 1,023,544 |
| 1,224,735 | |||||||
Selling, general and administrative expenses (exclusive of depreciation and amortization) |
| 150,672 |
| 176,524 | 169,781 | 186,104 |
| 198,864 | |||||||
Depreciation and amortization |
| 60,535 |
| 71,831 | 77,150 | 93,953 |
| 100,903 | |||||||
Impairment of goodwill and other intangible assets |
| — |
| 171,182 | — | — |
| 349,557 | |||||||
Related party expense |
| 11,444 |
| 8,923 | 9,191 | 5,381 |
| 9,501 | |||||||
Operating profit (loss) |
| 8,051 |
| (228,777) | 21,389 | (16,420) |
| (321,223) | |||||||
Other expense (income), net: |
|
|
|
|
|
|
|
| |||||||
Interest expense, net |
| 139,656 |
| 164,870 | 168,048 | 173,878 |
| 163,449 | |||||||
Debt modification and extinguishment costs (gain), net |
| (16,129) |
| 4,522 | (16,689) | 9,589 |
| 1,404 | |||||||
Sundry expense (income), net |
| 973 |
| (957) | 363 | (153) |
| 969 | |||||||
Other expense (income), net |
| (884) |
| 14,170 | 401 | (34,788) |
| 14,429 | |||||||
Net loss before income taxes |
| (115,565) |
| (411,382) | (130,734) | (164,946) |
| (501,474) | |||||||
Income tax expense |
| (8,868) |
| (4,199) | (11,656) | (13,584) |
| (7,642) | |||||||
Net loss |
| (124,433) |
| (415,581) | (142,390) | (178,530) |
| (509,116) | |||||||
Net profit (loss) attributable to noncontrolling interest in XBP Europe, net of taxes |
| 723 |
| — | — | — |
| — | |||||||
Net loss attributable to Exela Technologies, Inc. | $ | (125,156) | $ | (415,581) | $ | (142,390) | $ | (178,530) | $ | (509,116) | |||||
Cumulative dividends for Series A Preferred Stock |
| (3,961) |
| (3,588) | (1,576) | (1,309) |
| (3,309) | |||||||
Cumulative dividends for Series B Preferred Stock | (4,718) | (3,665) | — | — | — | ||||||||||
Net loss attributable to common stockholders | $ | (133,835) | $ | (422,834) | $ | (143,966) | $ | (179,839) | $ | (512,425) | |||||
Loss per share: |
|
|
|
|
|
|
|
| |||||||
Basic |
| (22.37) |
| (1,372.98) | (4,880.20) | (14,637.72) |
| (42,199.21) | |||||||
Diluted |
| (22.37) |
| (1,372.98) | (4,880.20) | (14,637.72) |
| (42,199.21) | |||||||
Weighted average number of shares outstanding (1): |
|
|
| ||||||||||||
Basic |
| 5,983,517 |
| 307,967 | 29,500 | 12,286 |
| 12,143 | |||||||
Diluted |
| 5,983,517 |
| 307,967 | 29,500 | 12,286 |
| 12,143 | |||||||
| (1) | Excluding in each case the 381 shares returned to the Company in the first quarter of 2020 in connection with the Appraisal Action, which were treated as outstanding until they were returned to the Company. |
As of December 31, | |||||||||||||||
(in thousands) |
| 2023 |
| 2022 |
| 2021 |
| 2020 |
| 2019 | |||||
Balance Sheet Data: |
|
|
|
|
|
|
|
|
|
| |||||
Cash and cash equivalents | $ | 23,341 | $ | 15,073 | $ | 20,775 | $ | 68,221 | $ | 6,198 | |||||
Accounts receivable, net of allowance for credit losses |
| 76,893 |
| 101,616 |
| 184,102 |
| 206,868 |
| 261,400 | |||||
Working capital |
| (213,674) |
| (319,549) |
| (311,949) |
| (131,446) |
| (147,056) | |||||
Total Assets |
| 636,337 |
| 721,912 |
| 1,037,023 |
| 1,157,779 |
| 1,258,324 | |||||
Long‑term debt, net of current maturities |
| 1,030,580 |
| 942,035 |
| 1,012,452 |
| 1,498,004 |
| 1,398,385 | |||||
Total liabilities |
| 1,495,172 |
| 1,529,501 |
| 1,703,795 |
| 2,084,311 |
| 2,001,365 | |||||
Total stockholders’ deficit |
| (858,835) |
| (807,589) |
| (666,772) |
| (926,532) |
| (743,041) | |||||
Potential Future Transactions
We may, from time to time explore and evaluate possible strategic transactions, which may include joint ventures, as well as business combinations or the acquisition or disposition of assets. In order to pursue certain of these opportunities, additional funds will likely be required. Subject to applicable contractual restrictions, to obtain such financing, we may seek to use cash on hand, or we may seek to raise additional debt or equity financing through private placements or through underwritten offerings. There can be no assurance that we will enter into additional strategic transactions or alliances, nor do we know if we will be able to obtain the necessary financing for transactions that require
61
additional funds on favorable terms, if at all. In addition, pursuant to registration rights agreements that we have entered into, or may enter into in the future, certain of our stockholders may have the right to demand underwritten offerings of our Common Stock. We may from time to time in the future explore, with certain of those stockholders the possibility of an underwritten public offering of our Common Stock held by those stockholders. There can be no assurance as to whether or when an offering may be commenced or completed, or as to the actual size or terms of the offering.
Critical Accounting Policies and Estimates
The preparation of financial statements requires the use of judgments and estimates. Our critical accounting policies and estimates are described below to provide a better understanding of how we develop our assumptions and judgments about future events and related estimations and how they can impact our financial statements. A critical accounting estimate is one that requires subjective or complex estimates and assessments, and is fundamental to our results of operations. We base our estimates on historical experience and on various other assumptions we believe to be reasonable according to the current facts and circumstances, the results of which form the basis for making judgments about the carrying values of assets and liabilities that are not readily apparent from other sources. We believe the current assumptions, judgments and estimates used to determine amounts reflected in our consolidated financial statements are appropriate; however, actual results may differ under different conditions. This discussion and analysis should be read in conjunction with our consolidated financial statements and related notes included in this document.
Goodwill and other intangible assets: Goodwill and other intangible assets are initially recorded at their fair values. Goodwill represents the excess of the purchase price of acquisitions over the fair value of the net assets acquired. Our goodwill at December 31, 2023 and 2022 was $170.5 million and $186.8 million, respectively. Goodwill and indefinite-lived intangible assets not subject to amortization are tested for impairment annually or more frequently if events or changes in circumstances indicate that the asset might be impaired. Intangible assets with finite useful lives are amortized either on a straight-line basis over the asset’s estimated useful life or on a basis that reflects the pattern in which the economic benefits of the intangible assets are realized.
Impairment of goodwill, long-lived and other intangible assets: Long-lived assets, such as property and equipment and finite-lived intangible assets are evaluated for impairment whenever events or changes in circumstances indicate that their carrying value may not be recoverable. Recoverability is measured by a comparison of their carrying amount to the estimated undiscounted cash flows to be generated by those assets. If the undiscounted cash flows are less than the carrying amount, we record impairment losses for the excess of the carrying value over the estimated fair value. Fair value is determined, in part, by the estimated cash flows to be generated by those assets. Our cash flow estimates are based upon, among other things, historical results adjusted to reflect our best estimate of future market rates, and operating performance. Development of future cash flows also requires us to make assumptions and to apply judgment, including timing of future expected cash flows, using the appropriate discount rates, and determining salvage values. The estimate of fair value represents our best estimates of these factors, and is subject to variability. Assets are generally grouped at the lowest level of identifiable cash flows, which is the reporting unit level for us. Changes to our key assumptions related to future performance and other economic factors could adversely affect our impairment valuation.
We conduct our annual goodwill impairment tests on October 1st of each year, or more frequently if indicators of impairment exist. When performing the annual impairment test, we have the option of performing a qualitative or quantitative assessment to determine if an impairment has occurred. If a qualitative assessment indicates that it is more likely than not that the fair value of a reporting unit is less than its carrying amount, we would be required to perform a quantitative impairment test for goodwill. A quantitative test requires comparison of fair value of the reporting unit to its carrying value, including goodwill. We use a combination of the Guideline Public Company Method of the Market Approach and the Discounted Cash Flow Method of the Income Approach to determine the reporting unit fair value. For the Guideline Public Company Method, our annual impairment test utilizes valuation multiples of publicly traded peer companies. For the Discounted Cash Flow Method, our annual impairment test utilizes discounted cash flow projections using market participant weighted average cost of capital calculation. If the fair value of goodwill at the reporting unit level is less than its carrying value, an impairment loss is recorded for the amount by which a reporting unit’s carrying amount exceeds its fair value, limited to the total amount of goodwill allocated to that reporting unit. We conducted our annual goodwill impairment test for year 2023 on October 1, 2023 and concluded that there was no impairment in our goodwill and other intangible assets during the year. During the third quarter of 2022, the Company concluded that a
62
triggering event for an interim impairment analysis had occurred. Our evaluation incorporated factors such as changes in the Company’s growth rate and recent trends in the Company’s market capitalization. As part of the assessment, long-term projections were revised resulting in lower than previously projected long-term future cash flows for the reporting units which reduced the estimated fair value to below carrying value. As a result of the interim impairment analysis at September 30, 2022, the Company recorded an impairment charge of $29.6 million, including taxes to goodwill relating to ITPS reporting unit. Additionally, later during the fourth quarter of 2022, the Company conducted its annual budgeting process along with an update to its long-range plan. Following the completion of that process, the Company made an evaluation based on factors such as changes in the Company’s growth rate and recent trends in the Company’s market capitalization, concluding that a triggering event for an impairment analysis had occurred. As a result, we performed another quantitative impairment test as of December 31, 2022, resulting in an additional goodwill impairment charge of $141.6 million, including taxes to goodwill relating to ITPS reporting unit. Therefore, as a result of these two impairment assessments in the third and fourth quarters of 2022, a total impairment charge of $171.2, including taxes was recorded to goodwill for the year ended December 31, 2022.
Application of the goodwill impairment test requires judgment, including the identification of reporting units, allocation of assets and liabilities to reporting units, and determination of fair value. The determination of reporting unit fair value is sensitive to the amount of Revenue and EBITDA generated by us, as well as the Revenue and EBITDA market multiples used in the calculation. Additionally, the fair value is sensitive to changes in the valuation assumptions such as expected income tax rate, risk-free rate, asset beta, and various risk premiums. Unanticipated changes, including immaterial revisions, to these assumptions could result in a provision for impairment in a future period. Given the nature of these evaluations and their application to specific assets and time frames, it is not possible to reasonably quantify the impact of changes in these assumptions.
Benefit Plan Accruals: The Company has defined benefit plans in the U.K. and Germany under which participants earn a retirement benefit based upon a formula set forth in the respective plans. The Company records annual amounts relating to its pension plans based on calculations that incorporate various actuarial and other assumptions, including discount rates, mortality, assumed rates of return, and compensation increases. The Company reviews its assumptions on an annual basis and makes modifications to the assumptions based on current rates and trends when it is appropriate to do so.
Revenue: We account for revenue in accordance with ASC 606, Revenue from Contracts with Customers (ASC 606). A performance obligation is a promise in a contract to transfer a distinct good or service to the customer, and is the unit of account in ASC 606. Revenue is measured as the amount of consideration we expect to receive in exchange for transferring goods or providing services. The contract transaction price is allocated to each distinct performance obligation and recognized as revenue when, or as, the performance obligation is satisfied. All of our material sources of revenue are derived from contracts with customers, primarily relating to the provision of business and transaction processing services within each of our segments. We do not have any significant extended payment terms, as payment is received shortly after goods are delivered or services are provided. Refer to Note 2—Basis of Presentation and Summary of Significant Accounting Policies to the consolidated financial statements included in Item 8 of this Annual Report for additional information regarding our revenue recognition policy.
Income Taxes: We account for income taxes by using the asset and liability method. We account for income taxes regarding uncertain tax positions and recognize interest and penalties related to uncertain tax positions in income tax benefit/(expense) in the consolidated statements of operations.
The provisions of the Tax Cuts and Jobs Act (“TCJA”), which was enacted into law in 2017, has had a significant impact to the Company due to reduction in the corporate tax rate, imposition of a territorial tax regime and the limitation of the deduction of business interest.
Deferred income taxes are recognized on the tax consequences of temporary differences by applying enacted statutory tax rates applicable in future years to differences between the financial statement carrying amounts and the tax bases of existing assets and liabilities, as determined under tax laws and rates. A valuation allowance is provided when it is more likely than not that all or some portion of the deferred tax assets will not be realized. Due to numerous ownership changes, we are subject to limitations on existing net operating losses under Section 382 of the Internal Revenue Code. In the event we determine that we would be able to realize deferred tax assets that have valuation allowances established,
63
an adjustment to the net deferred tax assets would be recognized as a component of income tax expense through continuing operations.
We engage in transactions (such as acquisitions) in which the tax consequences may be subject to uncertainty and examination by the varying taxing authorities. Significant judgment is required by us in assessing and estimating the tax consequences of these transactions. While our tax returns are prepared and based on our interpretation of tax laws and regulations, in the normal course of business the tax returns are subject to examination by the various taxing authorities. Such examinations may result in future assessments of additional tax, interest and penalties. For purposes of our income tax provision, a tax benefit is not recognized if the tax position is not more likely than not to be sustained based solely on its technical merits. Considerable judgment is involved in determining which tax positions are more likely than not to be sustained.
Recently Adopted and Recently Issued Accounting Pronouncements
See Note 2—Basis of Presentation and Summary of Significant Accounting Policies to the consolidated financial statements included in Item 8 of this Annual Report.
ITEM 7A. QUANTITATIVE AND QUALITATIVE DISCLOSURE ABOUT MARKET RISK
Quantitative and Qualitative Disclosure About Market Risk
We are exposed to a variety of market and other risks, including the effects of changes in interest rates, inflation and foreign currency translation and transaction risks, as well as risks to the availability of funding sources, hazard events and specific asset risks. Our market risk exposure is expected to be limited to risks that arise in the normal course of business, as we do not engage in speculative, non-operating transactions, nor do we use financial instruments or derivative instruments for trading purposes.
Interest Rate Risk
At December 31, 2023, we had $948.0 million of principal amount of debt outstanding, with a weighted average interest rate of 11.7%. Interest is calculated at the stated fixed rate of interest under the term so of the majority of our loans. Interest is calculated under the terms of the Senior Secured Term Loan and the Second Lien Notes based on certain specified base rates plus an applicable margin that varies based on certain factors. Assuming no change in the principal amount outstanding, the impact on interest expense of a 1% increase or decrease in the assumed weighted average interest rate would be approximately $9.5 million per year.
Foreign Currency Risk
We are exposed to foreign currency risks that arise from normal business operations. These risks include transaction gains and losses associated with intercompany loans with foreign subsidiaries and transactions denominated in currencies other than a location’s functional currency. Our contracts are denominated in currencies of major industrial countries.
Equity Price Risk
We have in the past, and may in the future, seek to acquire additional funding by sale of common stock and other equity. The price of our common stock has been volatile in the past and may also be volatile in the future. As a result, there is a risk that we may not be able to sell our Common Stock at an acceptable price should the need for new equity funding arise.
Inflation Fluctuation Risk
Inflation generally affects us by increasing our cost of labor, laboratory supplies, consumables and equipment. We believe that inflation had a material effect on our business, more specifically on our costs of revenues as discussed in the sections results of operations for the twelve months ended months ended December 31, 2023 of our management’s discussion and analysis of our financial condition and results of operations.
64
ITEM 8. FINANCIAL STATEMENTS AND SUPPLEMENTARY DATA
FINANCIAL STATEMENTS AND SUPPLEMENTARY DATA
The following financial statements are included herein:
65
Report of Independent Registered Public Accounting Firm
To the Board of Directors and Stockholders of
Exela Technologies, Inc.
Opinion on the Financial Statements
We have audited the accompanying consolidated balance sheets of Exela Technologies, Inc. and Subsidiaries (the “Company”) as of December 31, 2023, and the related consolidated statements of operations, comprehensive loss, stockholders’ deficit, and cash flows for the year then ended, and the related notes (collectively referred to as the “financial statements”). In our opinion, the financial statements present fairly, in all material respects, the consolidated financial position of the Company as of December 31, 2023, and the consolidated results of their operations and their cash flows for the year then ended, in conformity with accounting principles generally accepted in the United States of America.
We did not audit the financial statements of XBP Europe Holdings, Inc., a consolidated subsidiary, which statements reflect total assets and revenues constituting 16 percent and 16 percent, respectively, of the related consolidated totals. Those statements were audited by other auditors whose report has been furnished to us, and our opinion, insofar as it relates to the amounts included for XBP Europe Holdings, Inc., is based solely on the report of the other auditors.
Going Concern
The accompanying financial statements have been prepared assuming that the Company will continue as a going concern. As discussed in Note 2 to the consolidated financial statements, the Company has experienced recurring losses, has a working capital deficit and stockholders’ deficit and significant future required cash payments for interest under its long-term debt obligations that raise substantial doubt about its ability to continue as a going concern. Management’s plans regarding these matters are also described in Note 2. The financial statements do not include any adjustments that might result from the outcome of this uncertainty.
Basis for Opinion
These financial statements are the responsibility of the Company’s management. Our responsibility is to express an opinion on the Company’s financial statements based on our audit. We are a public accounting firm registered with the Public Company Accounting Oversight Board (United States) (“PCAOB”) and are required to be independent with respect to the Company in accordance with the U.S. federal securities laws and the applicable rules and regulations of the Securities and Exchange Commission and the PCAOB.
We conducted our audit in accordance with the standards of the PCAOB. Those standards require that we plan and perform the audit to obtain reasonable assurance about whether the financial statements are free of material misstatement, whether due to error or fraud. The Company is not required to have, nor were we engaged to perform, an audit of its internal control over financial reporting. As part of our audit, we are required to obtain an understanding of internal control over financial reporting but not for the purpose of expressing an opinion on the effectiveness of the Company’s internal control over financial reporting. Accordingly, we express no such opinion.
Our audit included performing procedures to assess the risks of material misstatement of the financial statements, whether due to error or fraud, and performing procedures that respond to those risks. Such procedures included examining, on a test basis, evidence regarding the amounts and disclosures in the financial statements. Our audit also included evaluating the accounting principles used and significant estimates made by management, as well as evaluating the overall presentation of the financial statements. We believe that our audit provides a reasonable basis for our opinion.
Critical Audit Matters
The critical audit matter communicated below is a matter arising from the current period audit of the financial statements that was communicated or required to be communicated to the audit committee and that: (1) relates to accounts or
66
disclosures that are material to the financial statements and (2) involved our especially challenging, subjective, or complex judgments. The communication of the critical audit matter does not alter in any way our opinion on the financial statements, taken as a whole, and we are not, by communicating the critical audit matter below, providing a separate opinion on the critical audit matter or on the accounts or disclosures to which it relates.
Goodwill: Evaluation of impairment for certain reporting units and allocation of Goodwill to disposal
As discussed in Notes 2 and 9 to the consolidated financial statements, goodwill is tested for impairment at the reporting unit level at least annually, or more frequently if indicators of impairment exist. Goodwill is impaired if the carrying value of a reporting unit exceeds its fair value. The fair value of each reporting unit is estimated using a combination of the discounted cash flow method and the guideline public company method. To validate the reasonableness of the assumptions used in these methods, management performed a market capitalization reconciliation by comparing the determined fair value of all reporting units to the Company’s market capitalization as of the date of the analysis. The Company’s goodwill balance was $170.5 million as of December 31, 2023, and goodwill derecognized during the year resulting from the sale of the scanner business was approximately $16.4 million.
We identified the evaluation of goodwill impairment and allocation of goodwill to the disposed business component as a critical audit matter due to the significant judgements exercised by management in performing the goodwill impairment analysis as well as in the allocation of goodwill to the disposed business component. Significant auditor effort and judgment was required to evaluate certain assumptions used in the discounted cash flow method, including forecasted revenue, gross margins for the operating segments and the disposed business component and discount rates. Additionally, subjective auditor judgment was required to evaluate the implied control premium used in management’s market capitalization reconciliation.
Addressing the matter involved performing procedures and evaluating audit evidence, in connection with forming our overall opinion on the consolidated financial statements. The following are the primary procedures we performed to address this critical audit matter. We obtained an understanding of Management’s process and evaluated the design of controls over the goodwill impairment process. We evaluated the forecasted results of operations by comparing them to historical results for each of the reporting units and assessing forecasted growth assumptions. We also involved valuation professionals with specialized skills and knowledge, who assisted in evaluating the discount rates, performed sensitivity analyses over the forecasted gross margin and discount rates to assess the impact of changes on the Company’s fair value estimates for the reporting units and evaluated the implied control premium used in the market capitalization reconciliation.
/s/ EisnerAmper LLP
We have served as the Company’s auditor since 2023.
April 3, 2024
67
Report of Independent Registered Public Accounting Firm
To the Stockholders and Board of Directors
Exela Technologies, Inc.:
Opinion on the Consolidated Financial Statements
We have audited the accompanying consolidated balance sheet of Exela Technologies, Inc. and subsidiaries (the Company) as of December 31, 2022, the related consolidated statements of operations, comprehensive loss, stockholders’ deficit, and cash flows for the year ended December 31, 2022 and the related notes (collectively, the consolidated financial statements). In our opinion, the consolidated financial statements present fairly, in all material respects, the financial position of the Company as of December 31, 2022, and the results of its operations and its cash flows for the year ended December 31, 2022, in conformity with U.S. generally accepted accounting principles.
Going Concern
The accompanying consolidated financial statements have been prepared assuming that the Company will continue as a going concern. As discussed in Note 2 to the consolidated financial statements, the Company has a history of net losses, net operating cash outflows, working capital deficits, significant cash payments for interest on long-term debt, and significant current maturities of long-term debt that raise substantial doubt about its ability to continue as a going concern. Management’s plans in regard to these matters are also described in Note 2. The consolidated financial statements do not include any adjustments that might result from the outcome of this uncertainty.
Basis for Opinion
These consolidated financial statements are the responsibility of the Company’s management. Our responsibility is to express an opinion on these consolidated financial statements based on our audit. We are a public accounting firm registered with the Public Company Accounting Oversight Board (United States) (PCAOB) and are required to be independent with respect to the Company in accordance with the U.S. federal securities laws and the applicable rules and regulations of the Securities and Exchange Commission and the PCAOB.
We conducted our audit in accordance with the standards of the PCAOB. Those standards require that we plan and perform the audit to obtain reasonable assurance about whether the consolidated financial statements are free of material misstatement, whether due to error or fraud. Our audit included performing procedures to assess the risks of material misstatement of the consolidated financial statements, whether due to error or fraud, and performing procedures that respond to those risks. Such procedures included examining, on a test basis, evidence regarding the amounts and disclosures in the consolidated financial statements. Our audit also included evaluating the accounting principles used and significant estimates made by management, as well as evaluating the overall presentation of the consolidated financial statements. We believe that our audit provides a reasonable basis for our opinion.
/s/ KPMG LLP
We served as the Company’s auditor from 2013 to 2023.
Detroit, Michigan
April 3, 2023
68
Exela Technologies, Inc. and Subsidiaries
Consolidated Balance Sheets
As of December 31, 2023 and 2022
(in thousands of United States dollars except share and per share amounts)
December 31, | ||||||
2023 |
| 2022 | ||||
Assets |
|
|
| |||
Current assets |
|
|
| |||
Cash and cash equivalents | $ | | $ | | ||
Restricted cash |
| |
| | ||
Accounts receivable, net of allowance for credit losses of $ | | | ||||
Related party receivables and prepaid expenses | | | ||||
Inventories, net | | | ||||
Prepaid expenses and other current assets | | | ||||
Total current assets |
| |
| | ||
Property, plant and equipment, net of accumulated depreciation of $ | | | ||||
Operating lease right-of-use assets, net | | | ||||
Goodwill | | | ||||
Intangible assets, net | | | ||||
Deferred income tax assets | | | ||||
Other noncurrent assets |
| |
| | ||
Total assets | $ | | $ | | ||
Liabilities and Stockholders' Deficit |
|
|
|
| ||
Liabilities |
|
|
|
| ||
Current liabilities | ||||||
Current portion of long-term debt | $ | | $ | | ||
Accounts payable | | | ||||
Related party payables | | | ||||
Income tax payable | | | ||||
Accrued liabilities | | | ||||
Accrued compensation and benefits | | | ||||
Accrued interest | | | ||||
Customer deposits | | | ||||
Deferred revenue | | | ||||
Obligation for claim payment | | | ||||
Current portion of finance lease liabilities | | | ||||
Current portion of operating lease liabilities | | | ||||
Total current liabilities |
| |
| | ||
Long-term debt, net of current maturities | | | ||||
Finance lease liabilities, net of current portion | | | ||||
Pension liabilities, net | | | ||||
Deferred income tax liabilities | | | ||||
Long-term income tax liabilities | | | ||||
Operating lease liabilities, net of current portion | | | ||||
Other long-term liabilities | | | ||||
Total liabilities | | | ||||
Commitments and Contingencies (Note 14) |
|
|
|
| ||
Stockholders' deficit |
|
|
|
| ||
Common Stock, par value of $ |
| |
| | ||
Preferred stock, $ | ||||||
Series A Preferred Stock, | | | ||||
Series B Preferred Stock, | ||||||
Additional paid in capital |
| |
| | ||
Less: Common Stock held in treasury, at cost; | — | ( | ||||
Equity-based compensation | | | ||||
Accumulated deficit |
| ( |
| ( | ||
Accumulated other comprehensive loss: | ||||||
Foreign currency translation adjustment | ( | ( | ||||
Unrealized pension actuarial losses, net of tax | ( | ( | ||||
Total accumulated other comprehensive loss | ( | ( | ||||
Total stockholders’ deficit attributable to Exela Technologies, Inc. | ( | ( | ||||
Noncontrolling interest in XBP Europe | ( | — | ||||
Total stockholders’ deficit |
| ( |
| ( | ||
Total liabilities and stockholders’ deficit | $ | | $ | | ||
The accompanying notes are an integral part of these consolidated financial statements.
69
Exela Technologies, Inc. and Subsidiaries
Consolidated Statements of Operations
For the years ended December 31, 2023 and 2022
(in thousands of United States dollars except share and per share amounts)
Years ended December 31, | |||||
2023 |
| 2022 | |||
Revenue | $ | | $ | | |
Cost of revenue (exclusive of depreciation and amortization) | |
| | ||
Selling, general and administrative expenses (exclusive of depreciation and amortization) | | | |||
Depreciation and amortization | | | |||
Impairment of goodwill and other intangible assets | — | | |||
Related party expense | | | |||
Operating profit (loss) | | ( | |||
Other expense (income), net: | |||||
Interest expense, net | | | |||
Debt modification and extinguishment costs (gain), net | ( | | |||
Sundry expense (income), net | | ( | |||
Other expense (income), net | ( | | |||
Loss before income taxes | ( | ( | |||
Income tax expense | ( | ( | |||
Net loss | ( | ( | |||
Net profit (loss) attributable to noncontrolling interest in XBP Europe, net of taxes | | — | |||
Net loss attributable to Exela Technologies, Inc. | $ | ( | $ | ( | |
Cumulative dividends for Series A Preferred Stock | ( | ( | |||
Cumulative dividends for Series B Preferred Stock | ( | ( | |||
Net loss attributable to common stockholders | $ | ( | $ | ( | |
Loss per share: | |||||
Basic and diluted | ( | ( | |||
The accompanying notes are an integral part of these consolidated financial statements.
70
Exela Technologies, Inc. and Subsidiaries
Consolidated Statements of Comprehensive Loss
For the years ended December 31, 2023 and 2022
(in thousands of United States dollars)
Years ended December 31, | |||||
2023 |
| 2022 | |||
Net loss | $ | ( | $ | ( | |
Other comprehensive income (loss), net of tax | |||||
Foreign currency translation adjustments |
| ( |
| | |
Unrealized pension actuarial gains, net of tax |
| |
| | |
Total other comprehensive gain, net of tax | | | |||
Comprehensive loss | ( | ( | |||
Comprehensive profit (loss) attributable to noncontrolling interest in XBP Europe, net of tax | | — | |||
Comprehensive loss attributable to Exela Technologies, Inc., net of tax | $ | ( | $ | ( | |
The accompanying notes are an integral part of these consolidated financial statements.
71
Exela Technologies, Inc. and Subsidiaries
Consolidated Statements of Stockholders’ Deficit
For the year ended December 31, 2022
(in thousands of United States dollars except share and per share amounts)
Accumulated Other | ||||||||||||||||||||||||||||||||||||||
Unrealized | ||||||||||||||||||||||||||||||||||||||
Foreign | Pension | |||||||||||||||||||||||||||||||||||||
Currency | Actuarial | Total | ||||||||||||||||||||||||||||||||||||
Common Stock | Series A Preferred Stock | Series B Preferred Stock | Treasury Stock | Additional | Equity-Based | Translation | Losses, | Accumulated | Stockholders' | |||||||||||||||||||||||||||||
| Shares |
| Amount |
| Shares |
| Amount |
| Shares |
| Amount |
| Shares |
| Amount |
| Paid in Capital |
| Compensation |
| Adjustment |
| net of tax |
| Deficit |
| Deficit | |||||||||||
Balances at January 1, 2022 | | $ | | | $ | | — | $ | — | | $ | ( | $ | | $ | | $ | ( | $ | ( | $ | ( | $ | ( | ||||||||||||||
Net loss | — | — | — | — | — | — | — | — | — | — | — | — | ( | ( | ||||||||||||||||||||||||
Equity-based compensation | — | — | — | — | — | — | — | — | — | | — | — | — | | ||||||||||||||||||||||||
Foreign currency translation adjustment | — | — | — | — | — | — | — | — | — | — | | — | — | | ||||||||||||||||||||||||
Net realized pension actuarial gains, net of tax | — | — | — | — | — | — | — | — | — | — | — | | — | | ||||||||||||||||||||||||
Common Stock exchanged for Series B Preferred Stock | ( | ( | — | — | | — | — | — | | — | — | — | — | — | ||||||||||||||||||||||||
Issuance of Common Stock from at the market offerings, net of offering costs | | | — | — | — | — | — | — | | — | — | — | — | | ||||||||||||||||||||||||
Withholding of employee taxes on vested RSUs | — | — | — | — | — | — | — | — | — | ( | — | — | — | ( | ||||||||||||||||||||||||
Common Stock issued for vested RSUs | | — | — | — | — | — | — | — | — | — | — | — | — | — | ||||||||||||||||||||||||
Agreed cancellation of Common Stock issued for Director's vested RSUs | ( | — | — | — | — | — | — | — | — | — | — | — | — | — | ||||||||||||||||||||||||
Dividend declared and paid on Series B Preferred Stock ($ | — | — | — | — | — | — | — | — | ( | — | — | — | — | ( | ||||||||||||||||||||||||
Common Stock repurchased and retired | ( | — | — | — | — | — | — | — | ( | — | — | — | — | ( | ||||||||||||||||||||||||
Reversal of excess withholding of employee taxes on vested RSUs | — | — | — | — | — | — | — | — | — | | — | — | — | | ||||||||||||||||||||||||
Issuance of Common Stock to Executive Chairman under certain subscription agreement | | — | — | — | — | — | — | — | | — | — | — | — | | ||||||||||||||||||||||||
Payment for fractional shares on Reverse Stock Split in 2022 | ( | — | — | — | — | — | — | — | ( | — | — | — | — | ( | ||||||||||||||||||||||||
Balances at December 31, 2022 | | $ | | | $ | | | $ | — | | $ | ( | $ | | $ | | $ | ( | $ | ( | $ | ( | $ | ( | ||||||||||||||
The accompanying notes are an integral part of these consolidated financial statements.
72
Exela Technologies, Inc. and Subsidiaries
Consolidated Statements of Stockholders’ Deficit
For the year ended December 31, 2023
(in thousands of United States dollars except share and per share amounts)
Accumulated Other | |||||||||||||||||||||||||||||||||||||||||
Unrealized | |||||||||||||||||||||||||||||||||||||||||
Foreign | Pension | ||||||||||||||||||||||||||||||||||||||||
Currency | Actuarial | Non- |
| Total | |||||||||||||||||||||||||||||||||||||
Common Stock | Series A Preferred Stock | Series B Preferred Stock | Treasury Stock | Additional | Equity-Based | Translation | Losses, | Accumulated | Controlling Interest | Stockholders' | |||||||||||||||||||||||||||||||
| Shares |
| Amount |
| Shares |
| Amount |
| Shares |
| Amount |
| Shares |
| Amount |
| Paid in Capital |
| Compensation |
| Adjustment |
| net of tax |
| Deficit |
| in XBP Europe | Deficit | |||||||||||||
Balances at January 1, 2023 | | $ | | | $ | | | $ | — | | $ | ( | $ | | $ | | $ | ( | $ | ( | $ | ( | $ | — | $ | ( | |||||||||||||||
Net loss | — | — | — | — | — | — | — | — | — | — | — | — | ( | | ( | ||||||||||||||||||||||||||
Equity-based compensation | — | — | — | — | — | — | — | — | — | | — | — | — | — | | ||||||||||||||||||||||||||
Foreign currency translation adjustment | — | — | — | — | — | — | — | — | — | — | ( | — | — | ( | ( | ||||||||||||||||||||||||||
Net realized pension actuarial gains, net of tax | — | — | — | — | — | — | — | — | — | — | — | | — | | | ||||||||||||||||||||||||||
Issuance of Common Stock from at the market offerings, net of offering costs | | | — | — | — | — | — | — | | — | — | — | — | — | | ||||||||||||||||||||||||||
Payment for fractional shares on reverse stock split in May 2023 | ( | — | — | — | — | — | — | — | ( | — | — | — | — | — | ( | ||||||||||||||||||||||||||
Treasury stock retired | — | — | — | — | — | — | ( | | — | — | — | — | ( | — | — | ||||||||||||||||||||||||||
Contributions in exchange for the issuance of noncontrolling interest shares in XBP Europe | — | — | — | — | — | — | — | — | | — | | | — | ( | | ||||||||||||||||||||||||||
Balances at December 31, 2023 | | $ | | | $ | | | $ | — | — | $ | — | $ | | $ | | $ | ( | $ | ( | $ | ( | $ | ( | $ | ( | |||||||||||||||
The accompanying notes are an integral part of these consolidated financial statements.
73
Exela Technologies, Inc. and Subsidiaries
Consolidated Statements of Cash Flows
For the years ended December 31, 2023 and 2022
(in thousands of United States dollars unless otherwise stated)
Years ended December 31, | ||||||
2023 |
| 2022 | ||||
Cash flows from operating activities | ||||||
Net loss | $ | ( | $ | ( | ||
Adjustments to reconcile net loss | ||||||
Depreciation and amortization | | | ||||
Original issue discount, debt premium and debt issuance cost amortization | | | ||||
Interest paid on BR Exar AR Facility | ( | — | ||||
Debt modification and extinguishment gain, net | ( | ( | ||||
Impairment of goodwill and other intangible assets | — | | ||||
Impairment of operating lease right-of-use assets | | — | ||||
Credit loss expense | | | ||||
Deferred income tax provision | ( | | ||||
Share-based compensation expense | | | ||||
Unrealized foreign currency gain |
| ( |
| ( | ||
(Gain) loss on sale of assets | ( | | ||||
Fair value adjustment for private warrants liability of XBP Europe | | — | ||||
Change in operating assets and liabilities |
|
| ||||
Accounts receivable |
| |
| | ||
Prepaid expenses and other current assets | | ( | ||||
Accounts payable and accrued liabilities | | ( | ||||
Related party payables | ( | | ||||
Additions to outsource contract costs | ( | ( | ||||
Net cash provided by (used in) operating activities |
| |
| ( | ||
Cash flows from investing activities |
|
|
|
| ||
Purchase of property, plant and equipment | ( | ( | ||||
Additions to patents | — | ( | ||||
Additions to internally developed software | ( | ( | ||||
Proceeds from sale of assets | | | ||||
Net cash provided by (used in) investing activities |
| |
| ( | ||
Cash flows from financing activities |
|
|
|
| ||
Proceeds from issuance of Common Stock from private placement | — | | ||||
Proceeds from issuance of Common Stock from at the market offerings | | | ||||
Cash received in exchange for the issuance of noncontrolling interest shares in XBP Europe | | — | ||||
Cash paid for equity issuance costs from at the market offerings | ( | ( | ||||
Dividend paid on Series B Preferred Stock | — | ( | ||||
Payment for fractional shares on reverse stock split | ( | — | ||||
Repurchases of Common Stock for retirement | — | ( | ||||
Borrowings under factoring arrangement and Securitization Facility | | | ||||
Principal repayment on borrowings under factoring arrangement and Securitization Facility | ( | ( | ||||
Cash paid for withholding taxes on vested RSUs | — | ( | ||||
Lease terminations | — | | ||||
Cash paid for debt issuance costs | ( | ( | ||||
Principal payments on finance lease obligations | ( | ( | ||||
Borrowings from senior secured revolving facility and BRCC revolver | | | ||||
Repayments on senior secured revolving facility | — | ( | ||||
Proceeds from issuance of July 2026 Notes | — | | ||||
Borrowings from other loans | | | ||||
Cash paid for debt repurchases | ( | ( | ||||
Proceeds from Senior secured term loan | | — | ||||
Proceeds from Second Lien Note | | — | ||||
Borrowing under BR Exar AR Facility | | — | ||||
Repayments under BR Exar AR Facility | ( | — | ||||
Repayment of BRCC term loan | ( | ( | ||||
Principal repayments on senior secured term loans and other loans |
| ( |
| ( | ||
Net cash provided by financing activities |
| |
| | ||
Effect of exchange rates on cash, restricted cash and cash equivalents | ( | ( | ||||
Net increase (decrease) in cash, restricted cash and cash equivalents |
| |
| ( | ||
Cash, restricted cash, and cash equivalents |
|
| ||||
Beginning of period | | | ||||
End of period | $ | | $ | | ||
Supplemental cash flow data: |
|
| ||||
Income tax payments, net of refunds received | $ | | $ | | ||
Interest paid | | | ||||
Noncash investing and financing activities: | ||||||
Assets acquired through right-of-use arrangements | $ | | $ | | ||
Issuance of April 2026 Notes in exchange of July 2026 Notes | | — | ||||
Issuance of April 2026 Notes in exchange of 2023 term loan | | — | ||||
Accrued PIK interest paid through issuance of PIK Notes | | — | ||||
Common Stock exchanged for Series B Preferred Stock | — | | ||||
Accrued liability for true-up obligation settled through the issuance of July 2026 Notes | — | | ||||
Accrued capital expenditures | | | ||||
The accompanying notes are an integral part of these consolidated financial statements.
74
Exela Technologies, Inc. and Subsidiaries
Notes to the Consolidated Financial Statements
(in thousands of United States dollars except share and per share amounts or unless otherwise noted)
1. Description of the Business
Organization
Exela Technologies, Inc. (the “Company” or “Exela”) is a global provider of transaction processing solutions, enterprise information management, document management and digital business process services. The Company provides mission-critical information and transaction processing solutions services to clients across
The Company was originally incorporated in Delaware on July 15, 2014 as a special purpose acquisition company under the name Quinpario Acquisition Corp 2 (“Quinpario”) for the purpose of effecting a merger, capital stock exchange, asset acquisition, stock purchase, reorganization or similar business combination involving Quinpario and one or more businesses or entities. On July 12, 2017 (the “Closing”), the Company consummated its business combination with SourceHOV Holdings, Inc. (“SourceHOV”) and Novitex Holdings, Inc. (“Novitex”) pursuant to the Business Combination Agreement, dated February 21, 2017, among the Company, Quinpario Merger Sub I, Inc., Quinpario Merger Sub II, Inc., SourceHOV, Novitex, HOVS LLC, HandsOn Fund 4 I, LLC and Novitex Parent, L.P., as amended (the “Novitex Business Combination”). In connection with the Closing, the Company changed its name from Quinpario Acquisition Corp 2 to Exela Technologies, Inc. Unless the context otherwise requires, the “Company” refers to the combined company and its subsidiaries following the Novitex Business Combination, “Quinpario” refers to the Company prior to the closing of the Novitex Business Combination, “SourceHOV” refers to SourceHOV prior to the Novitex Business Combination or SourceHOV on a standalone basis and “Novitex” refers to Novitex prior to the Novitex Business Combination.
2. Basis of Presentation and Summary of Significant Accounting Policies
The following is a summary of the significant accounting policies consistently applied in the preparation of the accompanying consolidated financial statements.
Basis of Presentation
The accompanying consolidated financial statements and related notes to the consolidated financial statements have been prepared in accordance with generally accepted accounting principles in the United States (“U.S. GAAP”) and in accordance with the rules and regulations of the Securities and Exchange Commission (“SEC”).
Principles of Consolidation
The accompanying consolidated financial statements and related notes to the consolidated financial statements include the accounts of the Company, its wholly owned subsidiaries and XBP Europe Holdings, Inc. (“XBP Europe”), a publicly traded company that is majority-owned by the Company. All intercompany balances and transactions have been eliminated. In addition, the Company evaluates its relationships with other entities to identify whether they are variable interest entities as defined by the Financial Accounting Standards Board (“FASB”) Accounting Standards Codification (“ASC”) 810-10, Consolidation and whether the Company is the primary beneficiary. Consolidation is required if both of these criteria are met.
75
Noncontrolling Interest
A noncontrolling interest in a subsidiary (minority interest) represents an ownership interest in the consolidated entity that is reported as equity in the consolidated financial statements and separate from the parent company’s equity. Net income/loss from a consolidated subsidiary attributable to noncontrolling interest in our consolidated subsidiary is reported as deductions/additions from/to net income/loss to arrive at net income/loss attributable to shareholders of the Company. Comprehensive income/loss attributable to the noncontrolling interest is reported as reductions/additions from/to comprehensive income/loss.
As described in Note 3, following the closing of the transactions in November 2023, the Company owns
Use of Estimates in Preparation of the Financial Statements
The preparation of consolidated financial statements in conformity with U.S. GAAP requires management to make estimates and assumptions that affect the reported amounts of assets and liabilities and disclosure of contingent assets and liabilities at the date of the financial statements and the reported amounts of revenues and expenses during the reporting period.
Estimates and judgments relied upon in preparing these consolidated financial statements include, among others, revenue recognition for multiple element arrangements, allowance for expected credit losses, income taxes, depreciation, amortization, employee benefits, equity-based compensation, contingencies, goodwill, intangible assets, right of use assets, pension obligations, pension assets, and asset and liability valuations. The Company regularly assesses these estimates and records changes in estimates in the period in which they become known. The Company bases its estimates on historical experience and various other assumptions that the Company believes to be reasonable under the circumstances. Actual results could differ from those estimates.
Reverse Stock Split
On May 12, 2023, we effected a one-for- reverse stock split (the “Reverse Stock Split”) of our issued and outstanding shares of common stock, par value $
Going Concern
In accordance with ASC Subtopic 205-40, Presentation of Financial Statements—Going Concern (“ASC 205-40”), the Company has the responsibility to evaluate whether conditions and/or events raise substantial doubt about its ability to meet its obligations as they become due within one year after the date that the financial statements are issued. As required under ASC 205-40, management’s evaluation should initially not take into consideration the potential mitigating effects of management’s plans that have not been fully implemented as of the date the financial statements are issued. The accompanying financial statements have been prepared assuming that the Company will continue as a going concern.
In performing this evaluation, we concluded that under the standards of ASC 205-40 the following conditions raised substantial doubt about our ability to continue as a going concern:
76
| ● | a history of net losses, including net losses of $ |
| ● | working capital deficit of $ |
| ● | an accumulated deficit of $ |
| ● | significant cash payments for interest on our long-term obligations. |
The Company has undertaken and/or completed the following plans and actions to improve its available cash balances, liquidity or cash generated from operations:
| ● | identified and in the process of executing on significant cost savings for fiscal year 2024; |
| ● | issued approximately $ |
| ● | executed a $ |
| ● | fully discharged $ |
| ● | fully repaid $ |
| ● | completed the merger of its European business on November 29, 2023 (see Note 3 – Sale of Non-Core Assets and Merger Agreement for further details). |
In addition to these actions, management has reviewed the Company's operational plans which include executing on price increases, projected growth of margins and cost containment activities. The Company will have to continue to maintain positive operating cash flows and restore profitability over the next twelve months and otherwise execute its business plan. However, the Company’s ability to execute its operational plans is uncertain and its ability to obtain additional financing in the debt and equity capital markets is subject to several factors, including market and economic conditions, the Company’s performance and investor sentiment with respect to the Company and its industry and considering these factors are outside of the Company’s control, substantial doubt about the Company’s ability to continue as a going concern exists. The consolidated financial statements do not include any adjustments to the carrying amounts and classification of assets, liabilities, and reported expenses that may be necessary if the Company were unable to continue as a going concern.
Insurance Settlements for Network Outage
During the second half of 2022, the Company experienced a network security incident impacting certain of the Company’s operational and information technology systems. The Company immediately took steps to isolate the impact and prevent additional systems from being affected, including taking large parts of its network offline as a precaution and thereby disrupting some access to our applications and services by our employees and customers. Promptly upon our detection of this incident, we initiated response and containment protocols and our security teams, supplemented by third party cyber forensic and defense firms, worked to remediate this incident. We notified law enforcement, contacted our customers to apprise them of the situation, and provided and will provide any notices that may be required by applicable law. We maintain a variety of insurance policies, including cyber insurance and business interruption insurance that have and may continue to partially off-set the costs related to this incident.
We undertook extensive efforts to identify, contain and recover from this incident quickly and securely. We systematically brought our information systems back online in a controlled, phased approach. Our teams worked to maintain our business operations and minimize the impact on our customers, operating partners, and employees. The Company’s systems recovery efforts are complete, and the Company’s operations are fully functional, however, the incident did result in some loss of revenue as well as certain incremental costs.
77
During the year ended December 31, 2022, expenses associated with this incident, including remediation cost and various third party consulting services including forensic experts, legal counsel and other IT professional expenses totaled $
During the year 2023, the Company received insurance claims settlement proceeds of $
Segment Reporting
The management has chosen to organize the Company around three major verticals based on combination of specialized product and service offerings and industry focused solutions.
The Company consists of the following
1. Information & Transaction Processing Solutions (“ITPS”). ITPS provides industry-specific solutions for banking and financial services, including lending solutions for mortgages and auto loans, and banking solutions for clearing, anti-money laundering, sanctions, and interbank cross-border settlement; property and casualty insurance solutions for origination, enrollments, claims processing, and benefits administration communications; public sector solutions for income tax processing, benefits administration, and record management; multi-industry solutions for payment processing and reconciliation, integrated receivables and payables management, document logistics and location services, records management and electronic storage of data, documents; and software, hardware, professional services and maintenance related to information and transaction processing automation, among others.
2. Healthcare Solutions (“HS”). HS offerings include revenue cycle solutions, integrated accounts payable and accounts receivable, and information management for both the healthcare payer and provider markets. Payer service offerings include claims processing, claims adjudication and auditing services, enrollment processing and policy management, and scheduling and prescription management. Provider service offerings include medical coding and insurance claim generation, underpayment audit and recovery, and medical records management.
3. Legal and Loss Prevention Services (“LLPS”). LLPS solutions include processing of legal claims for class action and mass action settlement administrations, involving project management support, notification and outreach to claimants, collection, analysis and distribution of settlement funds. Additionally, LLPS provides data and analytical services in the context of litigation consulting, economic and statistical analysis, expert witness services, and revenue recovery services for delinquent accounts receivable.
Cash and Cash Equivalents
Cash and cash equivalents include cash deposited with financial institutions and liquid investments acquired with maturity dates equal to or less than three months. All bank deposits and money market accounts are considered cash
78
and cash equivalents. The Company holds cash and cash equivalents at major financial institutions, which often exceed Federal Deposit Insurance Corporation insured limits. Historically, the Company has not experienced any losses due to bank depository concentration.
Certificates of deposit and fixed deposits whose maturity, when acquired, is greater than three months and one year or less are classified as short-term investments, and certificates of deposit and fixed deposits whose maturity is greater than one year at the balance sheet date are classified as non-current assets in the consolidated balance sheets. The purchase of any certificates of deposit or fixed deposits that are classified as short-term investments or non-current assets appear in the investing section of the consolidated statements of cash flows.
Restricted Cash
Restricted cash is the carrying amount of cash and cash equivalents which are restricted under contract or otherwise as to withdrawal or usage. These include deposits held as compensating balances against obligation for claim payment or under agreements entered into with others, but exclude compensating balance arrangements that do not legally restrict the use of cash amounts shown on the balance sheet.
Obligation for Claim Payment
As part of the Company’s legal claims processing service, the Company holds cash for various settlement funds. Some of the cash is used to pay tax obligations and other liabilities of the settlement funds. The Company has recorded a liability for the settlement funds received, which is included in obligation for claim payment in the consolidated balance sheets, of $
Accounts Receivable and Allowance for Expected Credit Losses
Accounts receivable are carried at the original invoice amount less allowances for expected credit losses. Revenue that has been earned but remains unbilled at the end of the period is recorded as a component of accounts receivable, net. The Company specifically analyzes accounts receivable mainly based on customer type and related aging schedules, historical collection experience, current and future economic and market condition to estimate the probability of default in the future when evaluating the adequacy of its allowance for expected credit losses. The Company writes off accounts receivable balances against the allowances for expected credit losses, net of any amounts recorded in deferred revenue, when it becomes probable that the receivable will not be collected.
Inventories
Our inventories primarily include heavy-duty scanners and related parts, toner, paper stock, envelopes and postage supplies. Inventories are stated at the lower of cost or net realizable values and include the cost of raw materials, labor, and purchased subassemblies. Cost is determined using the weighted average method.
Property, Plant and Equipment
Property, plant, and equipment are recorded at cost less accumulated depreciation. Depreciation is computed using the straight-line method (which approximates the use of the assets) over the estimated useful lives of the assets. When these assets are sold or otherwise disposed of, the asset and related depreciation is relieved, and any gain or loss is included in the consolidated statements of operations for the period of sale or disposal. Leasehold improvements are amortized over the lease term or the useful life of the asset, whichever is shorter. Repair and maintenance costs are expensed as incurred.
79
Intangible Assets
Customer Relationships
Customer relationship intangible assets represent customer contracts and relationships obtained as part of acquired businesses. Customer relationship values are estimated by evaluating various factors including historical attrition rates, contractual provisions and customer growth rates, among others. The estimated average useful lives of customer relationships range from
Trade Names
The Company has determined that its trade name intangible assets are indefinite-lived assets and therefore are not subject to amortization. Trade names are tested for impairment as per the Company’s policy for impairment of indefinite-lived assets.
Developed Technology
The Company has acquired various developed technologies embedded in its technology platform. Developed technology is an integral asset to the Company in providing solutions to customers and is recorded as an intangible asset. The Company amortizes developed technology on a straight-line basis over the estimated useful life, which is typically
Capitalized Software Costs
The Company capitalizes certain costs incurred to develop software products to be sold, leased or otherwise marketed after establishing technological feasibility in accordance with ASC section 985-20, Software—Costs of Software to Be Sold, Leased, or Marketed, and the Company capitalizes costs to develop or purchase internal-use software in accordance with ASC section 350-40, Intangibles—Goodwill and Other— Internal-Use Software. Significant estimates and assumptions include determining the appropriate period over which to amortize the capitalized costs based on estimated useful lives and estimating the marketability of the commercial software products and related future revenues. The Company amortizes capitalized software costs on a straight-line basis over the estimated useful life, which is typically
Outsourced Contract Costs
Costs of outsourcing contracts, including costs incurred for bid and proposal activities, are generally expensed as incurred. However, certain costs incurred upon initiation of an outsourcing contract are deferred and expensed on a straight-line basis over the estimated contract term. These costs represent incremental external costs or certain specific internal costs that are directly related to the contract acquisition or fulfillment activities and can be separated into
Impairment of Indefinite-Lived Assets
The Company conducts its annual indefinite-lived assets impairment tests on October 1st of each year for its indefinite-lived assets, including trade names, or more frequently if indicators of impairment exist. When performing the impairment test, the Company has the option of performing a qualitative or quantitative assessment to determine if an impairment has occurred. A quantitative assessment requires comparison of fair value of the asset to its carrying value. If carrying value of the indefinite-lived assets exceeds fair value, the Company recognizes an impairment loss by an amount which is equal to the excess of carrying value over fair value. The Company utilizes the Income Approach,
80
specifically the Relief-from-Royalty method, which has the basic tenet that a user of that intangible asset would have to make a stream of payments to the owner of the asset in return for the rights to use that asset. Refer to Note 9- Intangible Assets and Goodwill for additional discussion of impairment of trade names.
Impairment of Long-Lived Assets
The Company reviews the recoverability of its long-lived assets, including finite-lived customer relationships, developed technology, capitalized software costs, outsourced contract costs, acquired software, and property, plant and equipment, when events or changes in circumstances occur that indicate that the carrying value of the asset may not be recoverable. The assessment of possible impairment is based on the ability to recover the carrying value of the asset from the expected future cash flows (undiscounted and without interest charges) of the related operations. If these cash flows are less than the carrying value of such asset, an impairment loss is recognized for the difference between estimated fair value and carrying value. The primary measure of fair value is based on discounted cash flows based in part on the financial results and the expectation of future performance.
The Company did not record any material impairment related to its property, plant, and equipment, customer relationships, developed technology, capitalized software cost or outsourced contract costs for the years ended December 31, 2023 and 2022.
Goodwill
Goodwill represents the excess purchase price over tangible and intangible assets acquired less liabilities assumed arising from business combinations. Goodwill is generally allocated to reporting units based upon relative fair value (taking into consideration other factors such as synergies) when an acquired business is integrated into multiple reporting units. The Company’s reporting units are at the operating segment level, for which discrete financial information is prepared and regularly reviewed by management. When a business within a reporting unit is disposed of, goodwill is allocated to the disposed business using the relative fair value method.
The Company conducts its annual goodwill impairment tests on October 1st of each year, or more frequently if indicators of impairment exist. When performing the annual impairment test, the Company has the option of performing a qualitative or quantitative assessment to determine if an impairment has occurred. If a qualitative assessment indicates that it is more likely than not that the fair value of a reporting unit is less than its carrying amount, the Company would be required to perform a quantitative impairment analysis for goodwill. The quantitative analysis requires a comparison of fair value of the reporting unit to its carrying value, including goodwill. If the carrying value of the reporting unit exceeds its fair value, an impairment loss is recognized in an amount equal to that excess, limited to the total amount of goodwill allocated to that reporting unit. The Company uses a combination of the Guideline Public Company Method of the Market Approach and the Discounted Cash Flow Method of the Income Approach to determine the reporting unit fair value. Refer to Note 9- Intangible Assets and Goodwill for additional discussion of the consideration of impairment of goodwill.
Benefit Plan Accruals
The Company has defined benefit plans in the U.K and Germany, under which participants earn a retirement benefit based upon a formula set forth in the respective plans. The Company records annual amounts relating to its pension plans based on calculations that incorporate various actuarial and other assumptions, including discount rates, mortality, assumed rates of return, and compensation increases. The Company reviews its assumptions on an annual basis and makes modifications to the assumptions based on current rates and trends when it is appropriate to do so.
Leases
The Company determines if a contract is, or contains, a lease at contract inception. Operating leases are included in operating lease right-of-use (“ROU”) assets, current portion of operating lease liabilities and operating lease liabilities, net of current portion in the Company’s consolidated balance sheet. Finance leases are included in property,
81
plant and equipment, current portion of finance lease liabilities and finance lease liabilities, net of current portion in the Company’s consolidated balance sheet.
ROU assets represent the right to use an underlying asset for the lease term and lease liabilities represent the obligation to make lease payments arising from the lease. ROU assets and lease liabilities are recognized at the commencement date based on the present value of lease payments over the lease term. In addition, ROU assets include initial direct costs incurred by the lessee as well as any lease payments made at or before the commencement date, and exclude lease incentives. As most of the Company’s leases do not provide an implicit rate, the Company uses its incremental borrowing rate based on the information available at the commencement date in determining the present value of lease payments. We use the implicit rate when readily determinable. Lease terms include
Finance lease ROU assets are amortized over the lease term or the useful life of the asset, whichever is shorter. The amortization of finance lease ROU assets is recorded in depreciation expense in the consolidated statements of operations. For operating leases, we recognize expense for lease payments on a straight-line basis over the lease term.
Stock-Based Compensation
The Company accounts for all equity-classified awards under stock-based compensation plans at their “fair value”. This fair value is measured at the fair value of the awards at the grant date and recognized as compensation expense on a straight-line basis over the vesting period. The fair value of the awards on the grant date is determined using the stock price on the respective grant date in the case of restricted stock units and using an option pricing model in the case of stock options. The expense resulting from share-based payments is recorded in selling, general and administrative expense in the accompanying consolidated statements of operations.
Revenue Recognition
We account for revenue in accordance with ASC 606, Revenue from Contracts with Customers. A performance obligation is a promise in a contract to transfer a distinct good or service to the customer and is the unit of account in ASC 606. Revenue is measured as the amount of consideration we expect to receive in exchange for transferring goods or providing services. The contract transaction price is allocated to each distinct performance obligation and recognized as revenue when, or as, the performance obligation is satisfied. All of our material sources of revenue are derived from contracts with customers, primarily relating to the provision of business and transaction processing services within each of our segments. We do not have any significant extended payment terms, as payment is received shortly after goods are delivered or services are provided.
Nature of Services
Our primary performance obligations are to stand ready to provide various forms of business processing services, consisting of a series of distinct services that are substantially the same and have the same pattern of transfer over time, and accordingly are combined into a single performance obligation. Our promise to our customers is typically to perform an unknown or unspecified quantity of tasks and the consideration received is contingent upon the customers’ use (i.e., number of transactions processed, requests fulfilled, etc.); as such, the total transaction price is variable. We allocate the variable fees to the single performance obligation charged to the distinct service period in which we have the contractual right to bill under the contract.
82
Disaggregation of Revenues
The following tables disaggregate revenue from contracts by geographic region and by segment for the years ended December 31, 2023 and 2022:
Year Ended December 31, | ||||||||||||||||||||||||
2023 | 2022 | |||||||||||||||||||||||
| ITPS |
| HS |
| LLPS |
| Total |
| ITPS |
| HS |
| LLPS |
| Total | |||||||||
U.S.A. |
| $ | | $ | | $ | | $ | | $ | | $ | | $ | |
| $ | | ||||||
EMEA |
| |
| — |
| — |
| |
| |
| — |
| — |
| | ||||||||
Other |
| |
| — |
| — |
| |
| |
| — |
| — |
| | ||||||||
Total |
| $ | | $ | | $ | | $ | | $ | | $ | |
| $ | |
| $ | | |||||
Contract Balances
The following table presents contract assets, contract liabilities and contract costs recognized at December 31, 2023 and 2022:
| December 31, |
| December 31, |
| January 1, | ||||
2023 | 2022 | 2022 | |||||||
Accounts receivable, net | $ | | $ | | $ | | |||
Deferred revenues |
| |
| |
| | |||
Customer deposits |
| |
| |
| | |||
Costs to obtain and fulfill a contract | | | | ||||||
Accounts receivable, net includes $
Deferred revenues relate to payments received in advance of performance under a contract. A significant portion of this balance relates to maintenance contracts or other service contracts where we received payments for upfront conversions or implementation activities which do not transfer a service to the customer but rather are used in fulfilling the related performance obligations that transfer over time. The advance consideration received from customers is deferred over the contract term. We recognized revenue of $
Costs incurred to obtain and fulfill contracts are deferred and presented as part of intangible assets, net and expensed on a straight-line basis over the estimated benefit period. We recognized $
Customer deposits consist primarily of amounts received from customers in advance for postage. These advanced postage deposits are used to cover the costs associated with postage, with the corresponding postage revenue being recognized as services are performed.
Performance Obligations
At the inception of each contract, we assess the goods and services promised in our contracts and identify each distinct performance obligation. The majority of our contracts have a single performance obligation, as the promise to transfer the individual goods or services is not separately identifiable from other promises in the contracts. For the
83
majority of our business and transaction processing service contracts, revenues are recognized as services are provided based on an appropriate input or output method, typically based on the related labor or transactional volumes.
Certain of our contracts have multiple performance obligations, including contracts that combine software implementation services with post-implementation customer support. For contracts with multiple performance obligations, we allocate the contract’s transaction price to each performance obligation using our best estimate of the standalone selling price of each distinct good or service in the contract. The primary method used to estimate standalone selling price is the expected cost plus a margin approach, under which we estimate our expected costs of satisfying a performance obligation and add an appropriate margin for that distinct good or service. We also use the adjusted market approach whereby we estimate the price that customers in the market would be willing to pay. In assessing whether to allocate variable consideration to a specific part of the contract, we consider the nature of the variable payment and whether it relates specifically to its efforts to satisfy a specific part of the contract. Certain of our software implementation performance obligations are satisfied at a point in time, typically when customer acceptance is obtained.
When evaluating the transaction price, we analyze, on a contract-by-contract basis, all applicable variable consideration. The nature of our contracts gives rise to variable consideration, including volume discounts, contract penalties, and other similar items that generally decrease the transaction price. We estimate these amounts based on the expected amount to be provided to customers and reduce revenues recognized. We do not anticipate significant changes to our estimates of variable consideration.
We include reimbursements from customers, such as postage costs, in revenue, while the related costs are included in cost of revenue.
Transaction Price Allocated to the Remaining Performance Obligations
In accordance with optional exemptions available under ASC 606, we did not disclose the value of unsatisfied performance obligations for (a) contracts with an original expected length of
Estimated Remaining Fixed Consideration for Unsatisfied | |||
| |||
2024 | $ | | |
2025 |
| | |
2026 |
| | |
2027 |
| | |
2028 |
| | |
2029 and thereafter |
| — | |
Total |
| $ | |
Research and Development
Research and development costs are expensed as incurred and recorded in selling, general and administrative expense. Research and development costs expensed for the years ended December 31, 2023 and 2022 were $
Advertising
Advertising costs are expensed as incurred and recorded in selling, general and administrative expense. Advertising expense for the years ended December 31, 2023 and 2022 were $
84
Income Taxes
The Company accounts for income taxes by using the asset and liability method. The Company accounts for income taxes regarding uncertain tax positions and recognized interest and penalties related to income taxes in income tax benefit/(expense) in the consolidated statements of operations.
Deferred income taxes are recognized on the tax consequences of temporary differences by applying enacted statutory tax rates applicable in future years to differences between the financial statement carrying amounts and the tax bases of existing assets and liabilities, as determined under tax laws and rates. A valuation allowance is provided when it is more likely than not that all or some portion of the deferred tax assets will not be realized. Due to numerous ownership changes, the Company is subject to limitations on existing net operating losses under Section 382 of the Internal Revenue Code (the “Code”). Accordingly, valuation allowances have been established against a portion of the net operating losses to reflect estimated Section 382 limitations. The Company also considered the realizability of net operating losses not limited by Section 382. The Company did not consider future book income as a source of taxable income when assessing if a portion of the deferred tax assets are more likely than not to be realized. However, scheduling the reversal of existing deferred tax liabilities indicated that a portion of the deferred tax assets are likely to be realized. Therefore, partial valuation allowances were established against a portion of the Company’s deferred tax assets. In the event the Company determines that it would be able to realize deferred tax assets that have valuation allowances established, an adjustment to the net deferred tax assets would be recognized as a component of income tax expense through continuing operations.
The Company engages in transactions (i.e. acquisitions) in which the tax consequences may be subject to uncertainty and examination by the varying taxing authorities. Therefore, judgment is required by the Company in assessing and estimating the tax consequences of these transactions. While the Company’s tax returns are prepared and based on the Company’s interpretation of tax laws and regulations, in the normal course of business the tax returns are subject to examination by the various taxing authorities. Such examinations may result in future assessments of additional tax, interest and penalties. For purposes of the Company’s income tax provision, a tax benefit is not recognized if the tax position is not more likely than not to be sustained based solely on its technical merits. Considerable judgment is involved in determining which tax positions are more likely than not to be sustained. Refer to Note 12 – Income Taxes for further information.
Loss Contingencies
The Company reviews the status of each significant matter, if any, and assesses its potential financial exposure considering all available information including, but not limited to, the impact of negotiations, settlements, rulings, advice of legal counsel and other updated information and events pertaining to a particular matter. If the potential loss from any claim or legal proceeding is considered probable and the amount can be reasonably estimated, the Company accrues a liability for the estimated loss. Judgment is required in both the determination of probability and the determination as to whether an exposure is reasonably estimable. Because of uncertainties related to loss contingencies, accruals are based on the best information available at the time. As additional information becomes available, the Company reassesses the potential liability related to its pending claims and litigation, and may revise its estimates. These revisions in the estimates of the potential liabilities could have a material impact on the results of operations and financial position of the Company. The Company’s liabilities exclude any estimates for legal costs not yet incurred associated with handling these matters.
Operations
A portion of the Company’s labor and operations is situated outside of the United States in India and other locations. The carrying value of long-lived assets that are situated outside of the United States is approximately $
85
Foreign Currency Translation
The functional currency for the Company’s production operations located in India, Philippines, China, and Mexico is the United States dollar. Included in other expense as sundry expense (income), net in the consolidated statements of operations are net exchange gains of $
The Company has determined all other international subsidiaries’ functional currency is the local currency. These assets and liabilities are translated at exchange rates in effect at the balance sheet date while income and expense amounts are translated at average exchange rates during the period. The resulting foreign currency translation adjustments are disclosed as a separate component of other comprehensive loss.
Beneficial Conversion Feature
The Company’s Series A Perpetual Convertible Preferred Stock, par value $
Net Loss per Share
Earnings per share (“EPS”) is computed by dividing net loss attributable to common stockholders by the weighted average number of shares of common stock outstanding during the period, excluding the effects of any potentially dilutive securities. Diluted EPS gives effect to the potential dilution that could occur if securities or other contracts to issue common stock were exercised or converted into common stock, using the more dilutive of the two-class method and if-converted method in the period of earnings. The two class method is an earnings allocation method that determines earnings per share (when there are earnings) for common stock and participating securities. The if-converted method assumes all convertible securities are converted into common stock. Diluted EPS excludes all dilutive potential shares of common stock if their effect is anti-dilutive.
As the Company experienced net losses for the periods presented, the impact of the Company’s Series A Perpetual Convertible Preferred Stock (“Series A Preferred Stock”) and Series B Cumulative Convertible Perpetual Preferred Stock (the “Series B Preferred Stock”), was calculated using the if-converted method. As of December 31, 2023, the outstanding shares of the Company’s Series A Preferred Stock and Series B Preferred Stock, if converted would have resulted in an additional
Similarly, the Company also did not include the effect of
86
The components of basic and diluted EPS are as follows. All shares and per share amounts for the years 2022 have been adjusted for a share-for-two hundred shares Reverse Stock Split which took effect on May 12, 2023:
Year Ended December 31, | |||||
2023 |
| 2022 | |||
Net loss attributable to common stockholders (A) | $ | ( | $ | ( | |
Weighted average common shares outstanding – basic and diluted (B) | | | |||
Loss Per Share: | |||||
Basic and diluted (A/B) | ( | ( | |||
Business Combinations
The Company includes the results of operations of the businesses acquired as of the respective dates of acquisition. The Company allocates the fair value of the purchase price of acquisitions to the assets acquired and liabilities assumed based on their estimated fair values. The excess of the fair value of the purchase price over the fair values of these identifiable assets and liabilities is recorded as goodwill.
Fair Value Measurements
The Company records the fair value of assets and liabilities in accordance with ASC 820, Fair Value Measurement (“ASC 820”). ASC 820 defines fair value as the price received to sell an asset or paid to transfer a liability in an orderly transaction between market participants at the measurement date and in the principal or most advantageous market for that asset or liability. The fair value should be calculated based on assumptions that market participants would use in pricing the asset or liability, not on assumptions specific to the entity.
In addition to defining fair value, ASC 820 expands the disclosure requirements around fair value and establishes a fair value hierarchy for valuation inputs. The hierarchy prioritizes the inputs into three levels based on the extent to which inputs used in measuring fair value are observable in the market. Each fair value measurement is reported in one of the three levels, which is determined by the lowest level input that is significant to the fair value measurement in its entirety. These levels are:
Level 1 — quoted prices (unadjusted) in active markets for identical assets or liabilities.
Level 2 — quoted prices for similar assets and liabilities in active markets or inputs that are observable for the asset or liability, either directly or indirectly through market corroboration, for substantially the full term of the financial instrument.
Level 3 — unobservable inputs reflecting management’s own assumptions about the inputs used in pricing the asset or liability at fair value.
Refer to Note 15 — Fair Value Measurement for further discussion.
87
Concentration of Credit Risk
Financial instruments that potentially subject the Company to concentration of credit risk consist primarily of cash and cash equivalents and trade receivables. The Company maintains its cash and cash equivalents and certain other financial instruments with highly rated financial institutions and limits the amount of credit exposure with any one financial institution. From time to time, the Company assesses the credit worthiness of its customers. Credit risk on trade receivables is minimized because of the large number of entities comprising the Company’s client base and their dispersion across many industries and geographic areas. The Company generally has not experienced any material losses related to receivables from any individual customer or groups of customers. The Company does not require collateral. Due to these factors, no additional credit risk beyond amounts provided for collection losses is believed by management to be probable in the Company’s accounts receivable, net. The Company does not have any customers that account for 10% or more of the total consolidated revenues.
Recently Adopted Accounting Pronouncements
Effective January 1, 2023, the Company adopted Accounting Standards Update (“ASU”) No. 2016-13, Financial Instruments – Credit Losses (Topic 326): Measurement of Credit Losses on Financial Instruments, to replace the incurred loss impairment methodology under current GAAP with a methodology that reflects expected credit losses and requires consideration of a broader range of reasonable and supportable information to inform credit loss estimates. The Company is required to use a forward-looking expected credit loss model for accounts receivables, loans, and other financial instruments. This ASU along with related additional clarificatory guidance in the ASU No. 2019-05, “Financial Instruments—Credit Losses (Topic 326)” and ASU No. 2019-11, “Codification Improvements to Topic 326, Financial Instruments—Credit Losses”, was also adopted. The Company has performed its analysis of the impact on its financial instruments that are within the scope of this guidance, primarily cash equivalents, restricted cash and accounts receivable, based on class of financing receivables which share the same or similar risk characteristics such as customer type and geographic location, among others. For accounts receivable, the Company applied this methodology using aging schedules reflecting how long the receivables have been outstanding, historical collection experience, current and future economic and market conditions. There was no impact to the Company’s opening retained earnings or its consolidated balance sheet upon adoption and as a result, the balances presented for December 31, 2022, which were derived under the incurred loss model, are comparable to December 31, 2023.
The following table describes the changes in the allowance for expected credit losses for the year ended December 31, 2023 (all related to accounts receivables):
Balance at January 1, 2023 of the allowance for expected credit losses | $ | |
Change in the provision for expected credit losses for the period | | |
Balance at December 31, 2023 of the allowance for expected credit losses | $ | |
Effective January 1, 2023, the Company adopted ASU No. 2021-08, Business Combinations (Topic 805): Accounting for Contract Assets and Contract Liabilities from Contracts with Customers. The ASU amends ASC 805 to add contract assets and contract liabilities to the list of exceptions to the recognition and measurement principles that apply to business combinations and to require that an entity (acquirer) recognize and measure contract assets and contract liabilities acquired in a business combination in accordance with Topic 606. While primarily related to contract assets and contract liabilities that were accounted for by the acquiree in accordance with ASC 606, the amendments also apply to contract assets and contract liabilities from other contracts to which the provisions of Topic 606 apply, such as contract liabilities from the sale of nonfinancial assets within the scope of Subtopic 610-20. The ASU was applied prospectively. The adoption had no material impact on the Company’s consolidated results of operations, cash flows, financial position or disclosures.
Recently Issued Accounting Pronouncements Not Yet Adopted
In March 2023, the Financial Accounting Standards Board (“FASB”) issued ASU No. 2023-01, Leases (Topic 842): Common Control Arrangements. The FASB-issued guidance clarifies the accounting for leasehold improvements associated with common control leases by requiring that leasehold improvements associated with common control leases
88
be amortized by the lessee over the useful life of the leasehold improvements to the common control group (regardless of the lease term), as long as the lessee controls the use of the underlying asset through a lease. Additionally, leasehold improvements associated with common control leases should be accounted for as a transfer between entities under common control through an adjustment to equity, if, and when, the lessee no longer controls the use of the underlying asset. The amendments in this ASU are effective for annual and interim periods beginning after December 15, 2023. This standard is expected to have no impact on the Company’s consolidated financial statements.
In October 2023, the FASB issued ASU No. 2023-06, Disclosure Improvements-Codification Amendments in Response to the SEC’s Disclosure Update and Simplification Initiative, which modifies the disclosure and presentation requirements of a variety of US GAAP codification topics by aligning them with the SEC Regulation S-X or S-K, which are rules about the form and content of financial reports. The provisions of this ASU are contingent upon when the SEC removes the related disclosure provisions from Regulation S-X and S-K. This guidance is effective for the Company no later than June 30, 2027 and is not expected to have a material impact on the Company’s consolidated financial statements.
In November 2023, the FASB issued ASU No. 2023-07, Segment Reporting (Topic 280): Improvements to Reportable Segment Disclosures, which requires retrospective disclosure of significant segment expenses and other segment items on an annual and interim basis. Additionally, it requires disclosure of the title and position of the Chief Operating Decision Maker (“CODM”). This ASU is effective for fiscal years beginning after December 15, 2023, and for interim periods within fiscal years beginning after December 15, 2024, with early adoption permitted. The Company is currently evaluating the impact that adopting this standard will have on its consolidated financial statements.
In December 2023, the FASB issued ASU No. 2023-09, Income Taxes (Topic 740): Improvements to Income Tax Disclosures, which requires an annual tabular effective tax rate reconciliation disclosure including information for specified categories and jurisdiction levels, as well as, disclosure of income taxes paid, net of refunds received, disaggregated by federal, state/local, and significant foreign jurisdiction. This ASU is effective for fiscal years beginning after December 15, 2024, with early adoption permitted. The Company is currently evaluating the impact that adopting this standard will have on its consolidated financial statements.
3. Sale of Non-Core Assets and Merger Agreement
Sale of Non-Core Assets
On June 8, 2023, the Company completed the sale of its high-speed scanner business, which was a part of its ITPS segment (as defined in Note 2 – Basis of Presentation and Summary of Significant Accounting Policies), for a purchase price of approximately $
Merger Agreement
On October 9, 2022, the Company entered into a definitive merger agreement (the “merger agreement”) to merge its European business with CF Acquisition Corp. VIII (“CFFE”), a special purpose acquisition company, to form a new publicly-traded company XBP Europe, which is a part of the ITPS segment (as defined in Note 2 – Basis of Presentation and Summary of Significant Accounting Policies. The business combination was accounted for as a reverse capitalization in accordance with FASB’s ASC Topic 805, Business Combinations (“ASC 805”). Under this method of
89
accounting, CFFE was treated as the “acquired” company for financial reporting purposes with XBP Europe surviving as a direct wholly-owned subsidiary of CFFE.
Following the closing of the transaction on November 29, 2023, the combined company operates as XBP Europe and the Company owns
4. Inventories
Inventories, net consist of the following:
December 31, | ||||||
| 2023 |
| 2022 | |||
Work in process | $ | | $ | | ||
Finished goods | | | ||||
Supplies and parts | | | ||||
Less: Allowance for obsolescence | ( | ( | ||||
| | |||||
5. Accounts Receivable
Accounts receivable, net consist of the following:
December 31, | ||||||
| 2023 |
| 2022 | |||
Billed receivables | $ | | $ | | ||
Unbilled receivables | | | ||||
Other | | | ||||
Less: Allowance for credit losses | ( | ( | ||||
$ | | $ | | |||
Unbilled receivables represent balances recognized as revenue that have not been billed to the customer. The Company’s allowance for credit losses is based on a policy developed by historical experience and management judgment. Adjustments to the allowance for credit losses may occur based on market conditions or specific client circumstances.
6. Prepaid Expenses and Other Current Assets
Prepaid expenses and other current assets consist of the following:
December 31, | ||||||
| 2023 |
| 2022 | |||
Prepaids | $ | | $ | | ||
Deposits | | | ||||
$ | | $ | | |||
7. Leases
The Company leases numerous facilities worldwide with larger concentrations of space in Texas, Michigan, Connecticut, California, India, Mexico and the Philippines. The Company’s facilities house general offices, sales offices,
90
service locations, and production facilities. Substantially all of the Company’s operations facilities are leased under long-term leases with varying expiration dates, except for the few owned locations. The Company regularly obtains various machinery, equipment, vehicles and furniture on leases. The machinery and equipment leases mainly include leasing of computers, servers, other IT equipment, mailing system, production equipment, generators, office equipment, printers, copiers and miscellaneous warehouse equipment.
The Company’s ROU assets and lease liabilities as of December 31, 2023 and 2022 recorded on the consolidated balance sheets are as follows:
| December 31, | December 31, | |||
2023 | 2022 | ||||
Balance sheet location: | |||||
Operating Lease | |||||
Operating lease right-of-use assets, net | $ | | $ | | |
Current portion of operating lease liabilities | | | |||
Operating lease liabilities, net of current portion | | | |||
Finance Lease | |||||
| | ||||
Current portion of finance lease liabilities | | | |||
Finance lease liabilities, net of current portion | | | |||
Supplemental balance sheet information related to leases is as follows:
December 31, | December 31, | |||||
| 2023 |
| 2022 | |||
Weighted-average remaining lease term | ||||||
Operating leases | ||||||
Finance leases | ||||||
Weighted-average discount rate | ||||||
Operating leases | ||||||
Finance leases | ||||||
The interest on financing lease liabilities was $
Maturities of finance and operating lease liabilities based on lease term for the next five years are as follows:
Finance | Operating | |||||
| Leases |
| Leases | |||
2024 | $ | | $ | | ||
2025 | | | ||||
2026 | | | ||||
2027 | | | ||||
2028 | | | ||||
2029 and thereafter | | | ||||
Total lease payments | | | ||||
Less: Imputed interest | ( | ( | ||||
Present value of lease liabilities | $ | | $ | | ||
Consolidated rental expense for all operating leases was $
91
The following table summarizes the cash paid and related right-of-use operating finance or operating lease recognized for the years ended December 31, 2023 and 2022.
Year Ended | Year Ended | ||||
| December 31, 2023 | December 31, 2022 | |||
Cash paid for amounts included in the measurement of lease liabilities: | |||||
Operating cash flows from operating leases | $ | | $ | | |
Financing cash flows from finance leases | | | |||
Right-of-use lease assets obtained in the exchange for lease liabilities: | |||||
Operating leases | | | |||
Finance leases | | |
8. Property, Plant and Equipment, Net
Property, plant, and equipment, which include assets recorded under finance leases, are stated at cost less accumulated depreciation, and amortization, and consist of the following:
Estimated Useful Lives | December 31, | |||||||
| (in Years) |
| 2023 |
| 2022 | |||
Land | N/A | $ | | $ | | |||
Buildings and improvements | | | ||||||
Leasehold improvements | Shorter of life of improvement or lease term | | | |||||
Vehicles | | | ||||||
Machinery and equipment | | | ||||||
Computer equipment and software | | | ||||||
Furniture and fixtures | | | ||||||
Finance lease right-of-use assets | Shorter of life of the asset or lease term | | | |||||
| | |||||||
Less: Accumulated depreciation and amortization | ( | ( | ||||||
Property, plant and equipment, net | $ | | $ | | ||||
Depreciation expense related to property, plant and equipment was $
92
9. Intangible Assets and Goodwill
Intangibles
Intangible assets are stated at cost or acquisition-date fair value less amortization and impairment and consist of the following:
Weighted Average | December 31, 2023 | ||||||||||
Remaining Useful Life | Gross Carrying | Accumulated | Intangible | ||||||||
| (in Years) |
| Amount (a) |
| Amortization |
| Asset, net | ||||
Customer relationships | $ | | $ | ( | $ | | |||||
Developed technology | | ( | | ||||||||
Patent | | ( | | ||||||||
Trade names (b) | Indefinite-lived | | — | | |||||||
Outsource contract costs | | ( | | ||||||||
Internally developed software | | ( | | ||||||||
Purchased software | | ( | | ||||||||
Intangibles, net | $ | | $ | ( | $ | | |||||
Weighted Average | December 31, 2022 | ||||||||||
Remaining Useful Life | Gross Carrying | Accumulated | Intangible | ||||||||
| (in Years) |
| Amount (a) |
| Amortization |
| Asset, net | ||||
Customer relationships | $ | | $ | ( | $ | | |||||
Developed technology | | ( | | ||||||||
Patent | | ( | | ||||||||
Trade names (b) | Indefinite-lived | | ( | | |||||||
Outsource contract costs | | ( | | ||||||||
Internally developed software | | ( | | ||||||||
Purchased software | | ( | | ||||||||
Intangibles, net | $ | | $ | ( | $ | | |||||
| (a) | Amounts include intangibles acquired in business combinations and asset acquisitions. |
| (b) | The carrying amount of trade names for 2023 and 2022 is net of accumulated impairment losses of $ |
Aggregate amortization expense related to intangible assets was $
Estimated intangibles amortization expense for the next five years and thereafter consists of the following:
Estimated | |||
Amortization | |||
| Expense | ||
2024 | $ | | |
2025 | | ||
2026 | | ||
2027 | | ||
2028 | | ||
Thereafter | | ||
$ | | ||
93
Goodwill
Goodwill by reporting segment consists of the following:
| Balances as at January 1, 2023 (a) | Additions | Deletions | Impairments | Currency Translation Adjustments | Balances as at December 31, 2023 (a) | ||||||||||||
ITPS | $ | | $ | — | $ | ( | (b) | $ | — | $ | | $ | | |||||
HS | | — | — | — | — | | ||||||||||||
LLPS | | — | — | — | — | | ||||||||||||
Total | $ | | $ | — | $ | ( | $ | — | $ | | $ | | ||||||
| Balances as at January 1, 2022 (a) | Additions | Deletions | Impairments | Currency Translation Adjustments | Balances as at December 31, 2022 (a) | ||||||||||||
ITPS | $ | | $ | — | $ | — | $ | ( | $ | ( | $ | | ||||||
HS | | — | — | — | — | | ||||||||||||
LLPS | | — | — | — | — | | ||||||||||||
Total | $ | | $ | — | $ | — | $ | ( | $ | ( | $ | | ||||||
| (a) | The goodwill amount for all periods presented is net of accumulated impairment amounts. Accumulated impairment relating to ITPS is $ |
| (b) | The deletion in goodwill is due to derecognition of allocated goodwill on sale of the high-speed scanner business in the second quarter of 2023. Refer to Note 3— Sale of Non-Core Assets and Merger Agreement. |
The Company tests for goodwill impairment at the reporting unit level on October 1 of each year and between annual tests if a triggering event indicates the possibility of an impairment. The Company monitors changing business conditions as well as industry and economic factors, among others, for events which could trigger the need for an interim impairment analysis.
In connection with the completion of the annual impairment test as of October 1, 2023, the Company recorded
The impairment charges are included within impairment of goodwill and other intangible assets in the consolidated statements of operations.
94
10. Accrued Liabilities and Other Long-Term Liabilities
Accrued liabilities consist of the following:
December 31, | ||||||
| 2023 |
| 2022 | |||
Accrued taxes (exclusive of income taxes) | $ | | $ | | ||
Accrued lease exit obligations | | — | ||||
Accrued professional, legal fees and other expenses | | | ||||
Accrued legal reserve for pending litigation | | | ||||
Accrued transaction costs | | | ||||
Other accruals | | | ||||
$ | | $ | | |||
Other Long-term liabilities consist of the following:
December 31, | ||||||
| 2023 |
| 2022 | |||
Deferred revenue | $ | | $ | | ||
Accrued lease exit obligations | | | ||||
Accrued compensation expense | | | ||||
Private warrants liability of XBP Europe | | — | ||||
Customer deposits under long term contracts | | | ||||
Other | | | ||||
$ | | $ | | |||
11. Long-Term Debt and Credit Facilities
Senior Credit Facilities
On July 12, 2017, subsidiaries of the Company entered into a First Lien Credit Agreement with Royal Bank of Canada, Credit Suisse AG, Cayman Islands Branch, Natixis, New York Branch and KKR Corporate Lending LLC (the “Credit Agreement”) providing Exela Intermediate LLC, a wholly owned subsidiary of the Company, upon the terms and subject to the conditions set forth in the Credit Agreement, (i) a $
On July 13, 2018, subsidiaries of the Company were able to reprice $
On December 9, 2021, in a private exchange transaction, subsidiaries of the Company exchanged $
As a result of the private exchange, repurchases (as discussed below) and periodic principal repayments, $
95
discussed below). The Company recorded $
The 2023 Term Loans bore interest at a rate per annum of, at the borrower’s option, either (a) a LIBOR rate determined by reference to the costs of funds for Eurodollar deposits for the interest period relevant to such borrowing, adjusted for certain additional costs, subject to a
Revolving Credit Facility; Letters of Credit
As of December 31, 2021, the $
On March 7, 2022, subsidiaries of the Company entered into a Revolving Loan Exchange and Prepayment Agreement with Royal Bank of Canada, Credit Suisse AG, Cayman Islands Branch, KKR Corporate Lending LLC, Granite State Capital Master Fund LP, Credit Suisse Loan Funding LLC and Revolvercap Partners Fund LP exchanging $
The Exchange Notes were subject to a guarantee in the form of a true-up mechanism whereby subsidiaries of the Company were responsible to make a payment to the holders of the Exchange Notes to true-up the shortfall below certain agreed thresholds if holders of the Exchange Notes sold their notes at a price below that threshold during agreed periods in 2022. As security for the true-up obligation under the Revolver Exchange, subsidiaries of the Company issued $
In July 2022, $
2023 Notes
On July 12, 2017, the Issuers issued $
96
Intermediate LLC. The 2023 Notes bore interest at a rate of
On December 9, 2021, upon the settlement of a public exchange, $
As a result of the public exchange and repurchases (as discussed below), $
July 2026 Notes
As of December 31, 2022, the Issuers had $
On July 11, 2023, the Issuers, certain guarantors and U.S. Bank Trust Company, National Association, as trustee, entered into an indenture (the “April 2026 Notes Indenture”) governing the Company’s April 2026 Notes and issued approximately $
On July 11, 2023, we entered into a seventh supplemental indenture to the July 2026 Notes Indenture which eliminated substantially all of the restrictive covenants, eliminated certain events of default, modified covenants regarding mergers and consolidations and modified or eliminated certain other provisions, including certain provisions relating to future guarantors and defeasance, contained in the July 2026 Notes Indenture and the July 2026 Notes. In addition, all of the collateral securing the July 2026 Notes was released pursuant to the seventh supplemental indenture.
The July 11, 2023 transaction resulted in cancellation of debt income (“CODI”) for tax purposes. Absent an exception, a debtor recognizes CODI upon discharge of its outstanding indebtedness for an amount of consideration that is less than the outstanding debt. The Internal Revenue Code of 1986, as amended, (the “Code”), provides that a debtor may wholly or partially exclude CODI from taxable income but must reduce certain of its tax attributes by the amount of CODI excluded from taxable income. Pursuant to the US tax rules, the Company computes the final CODI calculation based on the tax basis as of the last day of the fiscal tax year (i.e., December 31, 2023) which includes the date in which the debt transaction occurred. For the year ended December 31, 2023, the Company generated CODI in the amount of $
97
As a result of the 2023 Exchange and repurchases (as discussed below), $
Senior Secured April 2026 Notes
On July 11, 2023, the Issuers issued approximately $
Interest on the April 2026 Notes will accrue at
On July 15, 2023, the Company issued $
The Issuers’ obligations under the April 2026 Notes and the April 2026 Notes Indenture are irrevocably and unconditionally guaranteed, jointly and severally, by the same guarantors (the “Guarantors”) that guarantee the July 2026 Notes (other than certain guarantors that have ceased to have operations or assets) and by certain of the Issuers’ other affiliates (the “Affiliated Guarantors”). The April 2026 Notes and the related guarantees are first-priority senior secured obligations of the Issuers, the Guarantors and Affiliated Guarantors.
The issuers may redeem the April 2026 Notes at their option, in whole at any time or in part from time to time, at a redemption price of
The April 2026 Notes Indenture contains covenants that limit the Issuers’ and the Affiliated Guarantors (as defined below) and their respective subsidiaries’ ability to, among other things, (i) incur or guarantee additional indebtedness, (ii) pay dividends or distributions on, or redeem or repurchase, capital stock and make other restricted payments, (iii) make investments, (iv) consummate certain asset sales, (v) engage in certain transactions with affiliates, (vi) grant or assume certain liens and (vii) consolidate, merge or transfer all or substantially all of their assets. These covenants are subject to a number of important limitations and exceptions. In addition, upon the occurrence of specified change of control events, the Issuers must offer to repurchase the April 2026 Notes at
Repurchases
In July 2021 the Company commenced a debt buyback program to repurchase senior secured indebtedness, which is ongoing. During the year ended December 31, 2022, we repurchased $
98
million and is inclusive of $
During the year ended December 31, 2023, we repurchased $
BRCC Facility
On November 17, 2021, GP2 XCV, LLC, a subsidiary of the Company (“GP2 XCV”), entered into a borrowing facility with B. Riley Commercial Capital, LLC (which was subsequently assigned to BRF Finance Co., LLC (“BRF Finance”)) pursuant to which such subsidiary was able to borrow an original principal amount of $
The BRCC Facility is secured by a lien on all the assets of GP2 XCV and by a pledge of the equity of GP2 XCV. GP2 XCV is a bankruptcy-remote entity and as such its assets are not available to other creditors of the Company or any of its subsidiaries other than GP2 XCV. Interest under the BRCC Facility accrues at a rate of
During the year ended December 31, 2023, we borrowed $
Senior Secured Term Loan
On July 11, 2023, Exela Intermediate LLC and Exela Finance Inc., wholly-owned subsidiaries of the Company, entered into a financing agreement with certain lenders and Blue Torch Finance LLC, as administrative agent, pursuant to which the lenders extended a term loan of principal amount of $
The Senior Secured Term Loan shall be, at the option of the Company, either a Reference Rate Loan, or a SOFR Rate Loan. Each portion of the Senior Secured Term Loan that is a Reference Rate Loan bears interest on the principal amount outstanding from the date of the Senior Secured Term Loan until repaid, at a rate per annum equal to the Reference Rate plus the Applicable Margin. “Reference Rate” for any period means the greatest of (i)
99
rate last quoted by the Wall Street Journal as the "Prime Rate" in the United States. “Applicable Margin,” with respect to the interest rate of (a) any Reference Rate Loan is
The Company may, at any time, elect to have interest on all or a portion of the loans be charged at a rate of interest based upon Term SOFR (the “SOFR Option”) by notifying the administrative agent at least business days prior to the proposed change. Such notice needs to be provided in the case of the continuation of a SOFR Rate Loan as a SOFR Rate Loan on the last day of the then current interest period. The Company shall have not more than
As of December 31, 2023, there were borrowings of $
The Company may, at any time, prepay the principal of the Senior Secured Term Loan. Each prepayment shall be accompanied by the payment of accrued interest and the applicable premium, if any. Each prepayment shall be applied against the remaining installments of principal due on the Senior Secured Term Loan in the inverse order of maturity. The applicable premium shall be payable in the form of a make-whole amount if prepayment is made within one year of the borrowing date (the “First Period”). If optional prepayment is made after the year one anniversary of the borrowing date to the date of the two-year anniversary (the “Second Period”), the applicable premium shall be an amount equal to 1% times the amount of the principal amount of the Senior Secured Term Loan being paid on such date. The applicable premium shall be zero in case of prepayment after the date of the two-year anniversary of the borrowing date. Further, during the Second Period, if the prepayment is because of an event of default or termination of contract for any reason, the applicable premium shall be 1% times the aggregate principal amount of the Senior Secured Term Loan outstanding on such date.
The Senior Secured Term Loan contains customary events of default, affirmative and negative covenants, including limitation on the Company’s and certain of its subsidiaries’ ability to create, incur or allow certain liens; enter into sale and lease-back transactions; make any restricted payments; undergo fundamental changes, as well as certain financial covenants. The Company was in compliance with all financial covenants as of December 31, 2023.
Securitization Facility
On December 17, 2020, certain subsidiaries of the Company entered into a $
100
$
The Securitization Borrower, Exela Receivables 3 Holdco, LLC (the “Securitization Parent SPE,” and together with the Securitization Borrower, the “SPEs”), the Company, and certain of our operating subsidiaries that agreed to sell receivables in connection with the Securitization Facility (the “Securitization Originators”) provided customary representations and covenants under the agreements underlying the Securitization Facility. The Securitization Facility identified certain events of default upon the occurrence of which the Securitization Administrative Agent may declare the facility’s termination date to have occurred and declare the outstanding Securitization Loan and all other obligations of the Securitization Borrower to be immediately due and payable, however the Securitization Facility does not include an ongoing liquidity covenant like the A/R Facility and aligns reporting obligations with the Company’s other material indebtedness agreements.
The Securitization Borrower and Securitization Parent SPE were formed in December 2020, and are identified as variable interest entities (“VIE”) and consolidated into the Company’s financial statements following VIE consolidation model under ASC 810. The Securitization Borrower and Securitization Parent SPE are bankruptcy remote entities and as such their assets are not available to creditors of the Company or any of its subsidiaries. Each loan under the Securitization Facility bore interest on the unpaid principal amount as follows: (i) if a Base Rate Loan, at a rate per annum equal to (x) the greatest of (a) the Prime Rate in effect on such day, (b) the Federal Funds Effective Rate in effect on such day plus
On June 17, 2022, the Company repaid in full the approximately $
On June 17, 2022, the Company entered into an amended and restated receivables purchase agreement (as amended, the “Amended Receivables Purchase Agreement”) under a $
On June 17, 2022, the Company sold $
101
The fair value of the sold accounts receivable approximated their book value due to their short-term nature. Sold accounts receivable are presented as a change in receivables within operating activities in the consolidated statements of cash flows.
BR Exar AR Facility
On February 15, 2023, certain of the Company’s subsidiaries entered into a receivables purchase agreement (the “First RPA”) with BR Exar, LLC (“BREL”), an affiliate of B. Riley Commercial Capital, LLC. The Company received $
Under the BR Exar AR Facility, transfers of accounts receivable from certain of the Company’s subsidiaries are treated as secured borrowings under ASC 860, Transfers and Servicing and are not accounted for as a reduction in accounts receivable because the agreements do not transfer effective control over and risk related to the accounts receivable to BREL. Accordingly, the Company treated total of $
Second Lien Note
On February 27, 2023, the SPEs and B. Riley Commercial Capital, LLC entered into a new Secured Promissory Note (which was subsequently assigned to BRF Finance) pursuant to which B. Riley Commercial Capital, LLC agreed to lend up to $
102
for facilitating the transaction. In connection with the above-described facility, we also amended the BRCC Term Loan and BRCC Revolver to provide for $
As of December 31, 2023, there were borrowings of $
Long-Term Debt Outstanding
As of December 31, 2023 and 2022, the following long-term debt instruments were outstanding:
December 31, |
| December 31, | |||
2023 |
| 2022 | |||
Other (a) | $ | | $ | | |
2023 term loans (b) | — | | |||
Senior secured term loan maturing January 14, 2026 (c) | | — | |||
2023 notes (d) | — | | |||
July 2026 Notes maturing July 15, 2026 (e) | | | |||
April 2026 Notes maturing April 15, 2026 (f) | | — | |||
Secured borrowings under BRCC Facility matured on June 10, 2023 | | | |||
Second lien note maturing June 17, 2025 (g) | | — | |||
Total debt | | | |||
Less: Current portion of long-term debt | ( | ( | |||
Long-term debt, net of current maturities | $ | | $ | | |
| (a) | Other debt represents outstanding loan balances associated with various hardware, software purchases, maintenance and leasehold improvements along with loans and receivables factoring arrangement entered into by subsidiaries of the Company. |
| (b) | Net of unamortized original issue discount and debt issuance costs of $ |
| (c) | Net of unamortized debt issuance costs of $ |
| (d) | Net of unamortized original issue discount and debt issuance costs of $ |
| (e) | Net of unamortized net original issue discount and debt issuance costs of $ |
| (f) | Net of unamortized net debt exchange premium of $ |
| (g) | Net of unamortized debt issuance costs of $ |
As of December 31, 2023, maturities of long-term debt are as follows:
| Maturity | ||
2024 | $ | | |
2025 |
| | |
2026 |
| | |
2027 |
| | |
2028 | — | ||
Thereafter |
| — | |
Total long-term debt |
| | |
Less: Unamortized original issue discount, debt premium and debt issuance cost |
| | |
$ | | ||
103
12. Income Taxes
The Company provides for income taxes using an asset and liability approach, under which deferred income taxes are provided for based upon enacted tax laws and rates applicable to periods in which the taxes become payable.
For financial reporting purposes, income/ (loss) before income taxes includes the following components:
Year Ended December 31, | ||||||
| 2023 |
| 2022 | |||
United States | $ | ( | $ | ( | ||
Foreign |
| | | |||
$ | ( | $ | ( | |||
The provision for federal, state, and foreign income taxes consists of the following:
Year Ended December 31, | ||||||
| 2023 |
| 2022 | |||
Federal | ||||||
Current | $ | — | $ | — | ||
Deferred |
| |
| ( | ||
State |
|
| ||||
Current |
| |
| | ||
Deferred |
| ( |
| ( | ||
Foreign | ||||||
Current |
| |
| | ||
Deferred |
| ( |
| | ||
Income Tax Expense | $ | | $ | | ||
The differences between income taxes expected by applying the U.S. federal statutory tax rate of
Year Ended December 31, | ||||||
| 2023 |
| 2022 | |||
Tax at statutory rate | $ | ( | $ | ( | ||
Add (deduct) |
|
| ||||
State income taxes |
| ( |
| ( | ||
Foreign income taxes |
| |
| | ||
Nondeductible goodwill impairment |
| |
| | ||
Cancellation of debt income | — | | ||||
Permanent differences |
| |
| | ||
Litigation settlement | — | — | ||||
Changes in valuation allowance |
| |
| | ||
Unremitted earnings |
| |
| | ||
GILTI Inclusion | | | ||||
Expiration and reduction of tax attributes | ( | ( | ||||
Uncertain tax positions | | — | ||||
Debt related basis differences | — | | ||||
Other |
| ( |
| ( | ||
Income Tax Expense | $ | | $ | | ||
The Tax Cuts and Jobs Act (“TCJA”) was signed by the President of the United States and enacted into law on December 22, 2017. This overhaul of the US tax law made a number of substantial changes, including the reduction of the corporate tax rate from
104
executive compensation), imposing a mandatory tax on previously unrepatriated earnings accumulated offshore since 1986 and establishing global minimum income tax and base erosion tax provisions related to offshore activities and affiliated party payments.
The TCJA subjects a US shareholder to tax on Global Intangible Low-taxed Income (“GILTI”) earned by certain foreign subsidiaries. The FASB Staff Q&A, Topic 740, No. 5, Accounting for GILTI, states that an entity can make an accounting policy election to either recognize deferred taxes for temporary basis differences expected to reverse as GILTI in future years or provide for the tax expense related to GILTI in the year the tax is incurred as a period expense only. The Company has elected the accounting policy to recognize the tax expense related to GILTI in the year the tax is incurred as a period expense. At December 31 2023, the Company has GILTI inclusion of $
On July 20, 2020, the U.S. Treasury and the Internal Revenue Service issued Final Regulations which will allow an annual election to exclude from the U.S. tax return certain GILTI amounts when the taxes paid by a foreign affiliate exceed 18.9% (90% of U.S. statutory rate of
Beginning in 2018, the TCJA also subjects a U.S. shareholder of a controlled foreign corporation to current tax on certain payments from corporations subject to US tax to related foreign persons, also referred to as base erosion and anti-abuse tax ("BEAT"). The BEAT provisions in the Tax Reform Act eliminates the deduction of certain base-erosion payments made to related foreign corporations and impose a minimum tax if greater than regular tax. The Company has recorded
105
The components of deferred income tax liabilities and assets are as follows:
Year Ended December 31, | ||||||
| 2023 |
| 2022 | |||
Deferred income tax liabilities: | ||||||
Book over tax basis of intangible assets and fixed assets | $ | ( | $ | ( | ||
Unremitted foreign earnings |
| ( |
| ( | ||
Operating lease and finance lease right-of-use assets | ( | ( | ||||
Other, net | ( | ( | ||||
Total deferred income tax liabilities | $ | ( | $ | ( | ||
Deferred income tax assets: | ||||||
Allowance for credit losses and receivable adjustments | $ | | $ | | ||
Inventory |
| |
| | ||
Accrued liabilities |
| |
| | ||
Net operating loss and tax credit carryforwards |
| |
| | ||
Tax deductible goodwill |
| |
| | ||
Disallowed interest deduction | | | ||||
Operating lease and finance lease liabilities | | | ||||
Sec 174 Costs | | — | ||||
Debt and credit facilities | | | ||||
Other, net |
| |
| | ||
Total deferred income tax assets | $ | | $ | | ||
Valuation allowance |
| ( |
| ( | ||
Total net deferred income tax assets (liabilities) | $ | ( | $ | ( | ||
Gross deferred tax assets are reduced by valuation allowances to the extent the Company determines it is not more-likely-than-not the deferred tax assets are expected to be realized. At December 31, 2023, the Company recognized $
The net change during the year in the total valuation allowance was an increase of $
Under the debt buy-back program a substantial amount of the Company’s debt was extinguished. Absent an exception, a debtor recognizes cancelation of debt income (“CODI”) upon discharge of its outstanding indebtedness for an amount of consideration that is less than the outstanding debt. The Internal Revenue Code of 1986, as amended, (the Code), provides that a debtor may exclude CODI from taxable income to the extent the entity is insolvent, but must reduce certain of its tax attributes by the amount of CODI. The Company determined that the level of its insolvency at July 12, 2023 was below the indicated amount of CODI resulting from the debt exchange. For the year ended December 31, 2023 the amount of CODI was $
Included in deferred tax assets are foreign and state net operating loss carryforwards and state tax credit carryforwards due to expire beginning in 2023 through 2041. As of December 31, 2023, the Company has state income tax net operating loss (NOL) carryforwards of $
106
2042, and $
|
| State and Local | ||||
| Federal NOL |
| NOL | |||
2024 - 2028 | $ | — | $ | | ||
2029 - 2033 |
| — | | |||
2034- 2042 |
| — | | |||
Indefinite | | | ||||
$ | | $ | | |||
As of December 31, 2023, the Company has foreign net operating loss carryforwards of $
The Company adopted the provision of accounting for uncertainty in income taxes in the Topic of the ASC 740, Income Taxes (“ASC 740”). ASC 740 clarifies the accounting for uncertain tax positions in the Company's financial statements and prescribes a recognition threshold and measurement attribute for financial statement disclosure of tax positions taken or expected to be taken on tax returns. The total amount of unrecognized tax benefits, exclusive of interest and penalties, is $
The following is a tabular reconciliation of the total amounts of unrecognized tax benefits:
Year Ended December 31, | ||||||
| 2023 |
| 2022 | |||
Unrecognized tax benefits—January 1 | $ | | $ | | ||
Gross increases—tax positions in prior period |
| |
| — | ||
Gross decreases—tax positions in prior period |
| ( |
| ( | ||
Gross increases—tax positions in current period |
| |
| | ||
Settlement |
| — |
| — | ||
Lapse of statute of limitations | ( | — | ||||
Unrecognized tax benefits—December 31 | $ | | $ | | ||
The Company files income tax returns in the U.S. and various state and foreign jurisdictions. The statute of limitations for U.S. purposes is open for tax years ending on or after December 31, 2018. State jurisdictions that remain subject to examination are not considered significant. The Company has significant foreign operations in India and EMEA. The Company may be subject to examination by the India tax authorities for tax periods ending on or after March 31, 2014.
At December 31, 2023, the Company maintains its prior indefinite reinvestment assertion on undistributed earnings related to certain foreign subsidiaries. Accordingly,
107
consolidated statement of operations at December 31, 2023 and 2022, respectively. The foreign withholding taxes deferred expense recorded in the current year is attributable to the current year undistributed earnings.
13. Employee Benefit Plans
German Pension Plan
The Company’s subsidiary in Germany provides pension benefits to certain retirees. Employees eligible for participation include all employees who started working for the Company or its predecessors prior to September 30, 1987 and have finished a qualifying period of at least
U.K. Pension Plan
The Company’s subsidiary in the United Kingdom provides pension benefits to certain retirees and eligible dependents. Employees eligible for participation included all full-time regular employees who were more than
The expected rate of return assumptions for plan assets relate solely to the UK plan and are based mainly on historical performance achieved over a long period of time (
Norway Pension Plan
The Company’s subsidiary in Norway provides pension benefits to eligible retirees and eligible dependents. Employees eligible for participation include all employees who were more than
Asterion Pension Plan
In April 2018, through its acquisition of Asterion International Group, the Company became obligated to provide pension benefits to eligible retirees and eligible dependents of Asterion. Employees eligible for participation included all full-time regular employees who were more than
108
Funded Status
The change in benefit obligations, the change in the fair value of the plan assets and the funded status of the Company’s pension plans (except for the German pension plan which is unfunded) and the amounts recognized in the Company’s consolidated financial statements are as follows:
Year ended December, | ||||||
| 2023 |
| 2022 | |||
Change in Benefit Obligation: |
|
| ||||
Benefit obligation at beginning of period (a) | $ | $ | | |||
Service cost |
| |
| | ||
| |
| | |||
Actuarial gain |
| ( |
| ( | ||
Plan amendments | — | | ||||
Benefits paid |
| ( |
| ( | ||
Foreign-exchange rate changes |
| |
| ( | ||
Benefit obligation at end of year | $ | | $ | | ||
Change in Plan Assets: |
|
|
|
| ||
Fair value of plan assets at beginning of period | $ | | $ | | ||
Actual return on plan assets |
| |
| ( | ||
Employer contributions |
| |
| | ||
Benefits paid |
| ( |
| ( | ||
Foreign-exchange rate changes |
| |
| ( | ||
Fair value of plan assets at end of year |
| |
| | ||
Funded status at end of year | $ | ( | $ | ( | ||
|
| |||||
Net amount recognized in the Consolidated Balance Sheets: |
|
|
|
| ||
Pension liability, net (b) | $ | ( | $ | ( | ||
Amounts recognized in accumulated other comprehensive loss, net of tax consist of: |
|
|
|
| ||
Net actuarial gain (loss) | ( | ( | ||||
Net amount recognized in accumulated other comprehensive loss, net of tax | $ | ( | $ | ( | ||
Plans with underfunded or non-funded accumulated benefit obligation: |
|
|
|
| ||
Aggregate projected benefit obligation | $ | | $ | | ||
Aggregate accumulated benefit obligation | $ | | $ | | ||
Aggregate fair value of plan assets | $ | | $ | | ||
| (a) | An immaterial change was made in the benefit obligation at beginning of year 2023 compared to the benefit obligation at end of year 2022 on account of inclusion of payroll tax liability on Norway pension plan. |
| (b) | Consolidated balance of $ |
Tax Effect on Accumulated Other Comprehensive Loss
As of December 31, 2023 and 2022, the Company recorded actuarial losses of $
109
Pension and Postretirement Expense
The components of the net periodic benefit cost are as follows:
Year ended December 31, | |||||
2023 |
| 2022 | |||
Service cost | $ | | $ | | |
Interest cost | | | |||
Expected return on plan assets | ( | ( | |||
Amortization: | |||||
Amortization of prior service cost | | | |||
Amortization of net loss | | | |||
Net periodic benefit cost | $ | | $ | | |
Valuation
The Company uses the corridor approach and projected unit credit method in the valuation of its defined benefit plans for the UK, Germany, and Norway. The corridor approach defers all actuarial gains and losses resulting from variances between actual results and economic estimates or actuarial assumptions. For defined benefit pension plans, these unrecognized gains and losses are amortized when the net gains and losses exceed
The following tables set forth the principal actuarial assumptions used to determine benefit obligation and net periodic benefit costs:
December 31, |
| |||||||||||||||||||
| 2023 |
| 2022 |
| 2023 |
| 2022 |
| 2023 |
| 2022 |
| 2023 |
| 2022 |
| ||||
UK | Germany | Norway |
| Asterion |
| |||||||||||||||
Weighted-average assumptions used to determine benefit obligations: |
|
|
|
|
|
|
|
| ||||||||||||
Discount rate |
| | % | | % | | % | | % | | % | | % | | % | | % | |||
Rate of compensation increase |
| N/A |
| N/A |
| N/A |
| N/A |
| | % | | % | N/A | N/A | |||||
Weighted-average assumptions used to determine net periodic benefit cost: |
|
|
|
|
|
|
|
| ||||||||||||
Discount rate |
| | % | | % | | % | | % | | % | | % | | % | | % | |||
Expected asset return |
| | % | | % | N/A | N/A | % | | % | | % | | % | | % | ||||
Rate of compensation increase |
| N/A |
| N/A |
| N/A |
| N/A |
| | % | | % | N/A | N/A | |||||
The Germany plan is an unfunded plan and therefore has
The Company assumed a weighted average expected long-term rate of return on plan assets for the overall scheme of
110
government
The discount rate assumption was developed considering the current yield on an investment grade non-gilt index with an adjustment to the yield to match the average duration of the index with the average duration of the plan’s liabilities. The index utilized reflected the market’s yield requirements for these types of investments.
The inflation rate assumption was developed considering the difference in yields between a long-term government stocks index and a long-term index-linked stocks index. This difference was modified to consider the depression of the yield on index-linked stocks due to the shortage of supply and high demand, the premium for inflation above the expectation built into the yield on fixed-interest stocks and the government’s target rate for inflation (CPI) at 2.3%. The assumptions used are the best estimates chosen from a range of possible actuarial assumptions which, due to the time scale covered, may not necessarily be borne out in practice.
Plan Assets
The investment objective for the plan is to earn, over moving to
The Company’s investment policy related to the defined benefit plan is to continue to maintain investments in government gilts and highly rated bonds as a means to reduce the overall risk of assets held in the fund. No specific targeted allocation percentages have been set by category, but are set at the direction and discretion of the plan trustees. The weighted average allocation of plan assets by asset category is as follows:
December 31, | |||||
| 2023 |
| 2022 |
| |
U.K. and other international equities | | % | | % | |
U.K. government and corporate bonds | | | |||
Diversified growth fund | | | |||
Liability driven investments | | | |||
Multi-asset credit fund | | | |||
Total | | % | | % | |
111
The following tables set forth, by category and within the fair value hierarchy, the fair value of the Company’s pension assets at December 31, 2023 and 2022:
December 31, 2023 | ||||||||||||
| Total |
| Level 1 |
| Level 2 |
| Level 3 | |||||
Asset Category: |
|
|
|
| ||||||||
Cash | $ | | $ | | $ | — | $ | — | ||||
Equity funds: |
|
|
|
|
|
|
| |||||
U.K. |
| — |
| — |
| — |
| — | ||||
Other international |
| |
| — |
| |
| — | ||||
Fixed income securities: |
|
|
|
|
|
| ||||||
Corporate bonds / U.K. Gilts |
| |
| — |
| |
| — | ||||
Other investments: |
|
|
|
|
|
| ||||||
Diversified growth fund |
| |
| — |
| |
| — | ||||
Liability driven investments | | — | | — | ||||||||
Multi-asset credit fund | | — | | — | ||||||||
Total fair value | $ | | $ | | $ | | $ | — | ||||
December 31, 2022 | ||||||||||||
| Total |
| Level 1 |
| Level 2 |
| Level 3 | |||||
Asset Category: |
|
|
|
| ||||||||
Cash | $ | | $ | | $ | — | $ | — | ||||
Equity funds: |
|
|
|
|
|
|
| |||||
U.K. |
| — |
| — |
| — |
| — | ||||
Other international |
| |
| — |
| |
| — | ||||
Fixed income securities: |
|
|
|
|
|
| ||||||
Corporate bonds / U.K. Gilts |
| |
| — |
| |
| — | ||||
Other investments: |
|
|
|
|
|
| ||||||
Diversified growth fund |
| |
| — |
| |
| — | ||||
Liability driven investments | | — | | — | ||||||||
Multi-asset credit fund | | — | | — | ||||||||
Total fair value | $ | | $ | | $ | | $ | — | ||||
The plan assets are categorized as follows, as applicable:
Level 1: Any asset for which a unit price is available and used without adjustment, cash balances, etc.
Level 2: Any asset for which the amount disclosed is based on market data, for example a fair value measurement based on a present value technique (where all calculation inputs are based on data).
Level 3: Other assets. For example, any asset value with a fair value adjustment made not based on available indices or data.
Employer Contributions
The Company’s funding is based on governmental requirements and differs from those methods used to recognize pension expense. The Company made contributions of $
112
Estimated Future Benefit Payments
The estimated future pension benefit payments expected to be paid to plan participants are as follows:
Estimated | |||
Benefit | |||
| Payments | ||
Year ended December 31, | |||
2024 | $ | | |
2025 |
| | |
2026 |
| | |
2027 |
| | |
2028 |
| | |
2029 – 2033 |
| | |
Total | $ | | |
14. Commitments and Contingencies
Litigation
The Company is, from time to time, involved in certain legal proceedings, inquiries, claims and disputes, which arise in the ordinary course of business. Although management cannot predict the outcomes of these matters, management does not believe these actions will have a material, adverse effect on the Company’s consolidated balance sheets, consolidated statements of operations or consolidated statements of cash flows.
Adverse Arbitration Order
In April 2020, one of the Company’s Nordic subsidiaries commenced an arbitration in Finland against a customer alleging breach of contract and other damages in connection with an outsourcing services agreement and transition services agreement executed in 2017. In September 2020, the customer submitted counterclaims against the Company in an aggregate amount in excess of €
Class Action
On March 23, 2020, the Plaintiff, Bo Shen, filed a putative class action against the Company, Ronald Cogburn, the Company’s former Chief Executive Officer, and James Reynolds, the Company’s former Chief Financial Officer and current member of the Company’s board of directors (the “Board”). Plaintiff claims to have been a holder of
113
prejudice in exchange for a settlement payment of $
Contract Claim
On October 24, 2018, HOV Services, Inc., a subsidiary of the Company (“HOV Services”), filed a lawsuit against ASG Technologies Group, Inc. (“ASG”) that sought to terminate the renewal of licensing agreement between the parties. HOV Services alleged that the licensing agreement was renewed under duress and brought claims against ASG under the Computer Fraud and Abuse Act, 18 U.S.C. § 1030 et seq., the Stored Communications Act, 18 U.S.C. § 2701 et seq., and various common law doctrines. ASG subsequently brought counterclaims asserting breach of contract and other allegations. On February 27, 2024, a judge granted ASG’s motion for directed verdict on its breach of contract claim and awarded ASG $
Contract-Related Contingencies
The Company has certain contingent obligations that arise in the ordinary course of providing services to its customers. These contingencies are generally the result of contracts that require the Company to comply with certain performance measurements or the delivery of certain services to customers by a specified deadline. The Company believes the adjustments to the transaction price, if any, under these contract provisions will not result in a significant revenue reversal or have a material adverse effect on the Company’s consolidated balance sheets, consolidated statements of operations or consolidated statements of cash flows.
15. Fair Value Measurement
Assets and Liabilities Measured at Fair Value
The carrying amount of assets and liabilities including current portion of other debt approximated their fair value as of December 31, 2023 and 2022, due to the relative short maturity of these instruments. Management estimates the fair values of the July 2026 Notes and the April 2026 Notes at approximately
The Company determined the fair value of its long-term debt and current portion of long-term debts using Level 2 inputs including the recent issue of the debt, the Company’s credit rating, and the current risk-free rate.
The Company determined the fair value of private warrants liability of XBP Europe included in the other long-term liabilities in the consolidated balance sheet as of December 31, 2023 under Level 3 fair value measurement using the Black-Scholes option pricing model.
114
The following table provides the carrying amounts and estimated fair values of the Company’s financial instruments as of December 31, 2023 and December 31, 2022:
Carrying | Fair | Fair Value Measurements | |||||||||||||
As of December 31, 2023 |
| Amount |
| Value |
| Level 1 |
| Level 2 |
| Level 3 | |||||
Recurring assets and liabilities: | |||||||||||||||
Long-term debt | $ | | $ | | $ | — | $ | | $ | — | |||||
Current portion of long-term debts | | | — | | — | ||||||||||
Private warrants liability of XBP Europe | | | — | — | | ||||||||||
| Carrying | Fair |
| Fair Value Measurements | |||||||||||
As of December 31, 2022 |
| Amount |
| Value |
| Level 1 |
| Level 2 |
| Level 3 | |||||
Recurring assets and liabilities: | |||||||||||||||
Long-term debt | $ | | $ | | $ | — | $ | | $ | — | |||||
Current portion of long-term debts | | | — | | — | ||||||||||
The significant unobservable inputs used in the fair value of the private warrants liability of XBP Europe are assumptions related to the inputs of exercise price, fair value of the underlying common stock, risk-free interest rate, expected term, expected volatility, and expected dividend yield. Significant increases (decreases) in the discount rate would have resulted in a lower (higher) fair value measurement. Significant increases (decreases) in the forecasted financial information would have resulted in a higher (lower) fair value measurement. For all significant unobservable inputs used in the fair value measurement of the Level 3 liabilities, a change in one of the inputs would not necessarily result in a directionally similar change in the fair value.
The following table reconciles the beginning and ending balances of net assets and liabilities classified as Level 3 for which a reconciliation is required:
December 31, | |||
| 2023 | ||
Balance as of November 29, 2023 | $ | | |
( | |||
Balance as of December 31, 2023 | $ | | |
16. Stock-Based Compensation
Exela 2018 Stock Incentive Plan
On January 17, 2018, Exela’s 2018 Stock Incentive Plan (the “2018 Plan”) became effective. The 2018 Plan provides for the grant of incentive and nonqualified stock options, restricted stock, restricted stock units, stock appreciation rights, performance awards, and other stock-based compensation to eligible participants. The Company was initially authorized to issue up to
115
Restricted Stock Unit Grants
Restricted stock unit awards generally vest ratably over a to
A summary of restricted stock unit activities under the 2018 Plan for the year ended December 31, 2023 is summarized in the following table:
Average | |||||||
Weighted | Remaining | ||||||
Number | Average Grant | Contractual Life | |||||
| of Units |
| Date Fair Value |
| (Years) | ||
Outstanding Balance as of December 31, 2022 | | $ | |
| |||
Granted |
| — |
| — | |||
Forfeited |
| — |
| — | |||
Vested |
| — |
| — | |||
Outstanding Balance as of December 31, 2023 (1) | | $ | |
| — | ||
(1) All of these outstanding restricted stock units shall vest on the date of the annual general meeting for the year 2023.
Options
Under the 2018 Plan, stock options are granted at a price per share not less than
Average | ||||||||||
Weighted | Weighted | Remaining | ||||||||
Average Grant | Average | Vesting Period | ||||||||
| Outstanding |
| Date Fair Value |
| Exercise Price |
| (Years) | |||
Outstanding Balance as of December 31, 2022 | |
| $ | |
| $ | |
| ||
Granted |
| — |
| — |
| |||||
Exercised |
| — | — | |||||||
Forfeited |
| ( | | |||||||
Expired | — | — | ||||||||
Outstanding Balance as of December 31, 2023 (1) |
| |
| $ | |
| $ | |
| |
(1)
As of December 31, 2023, there was less than $
Market Performance Units
On September 14, 2021, the Company granted its Executive Chairman performance units with a market performance condition, which are notional units representing the right to receive one share of Common Stock (or the
116
cash value of one share of Common Stock). At the election of the compensation committee of the Company, these performance units might be settled in cash or in shares of Common Stock.
The fair value of per unit of the awards was determined to be $
The following table summarizes the activity for the market performance restricted stock units for the year ended December 31, 2023:
Remaining Service | ||||||||
Weighted | Period Over | |||||||
Number | Average | Which Expected | ||||||
| of Units |
| Fair Value | to be Recognized | ||||
Outstanding Balance as of December 31, 2022 | | $ | | |||||
Granted |
| — |
| — |
| |||
Forfeited |
| — |
| — | ||||
Vested |
| — |
| — | ||||
Outstanding Balance as of December 31, 2023 | | $ | | |||||
As of December 31, 2023, there was approximately $
117
17. Stockholders’ Equity
The following description summarizes the material terms and provisions of the securities that the Company has authorized.
Common Stock
The Company is authorized to issue
Reverse Stock Split
On May 12, 2023, we effected the Reverse Stock Split of our issued and outstanding shares of Common Stock. As a result of the Reverse Stock Split every (200) shares of Common Stock issued and outstanding were automatically combined into
Giving effect to the Reverse Stock Split the Company’s issued and outstanding stock decreased from
Common Stock At-The-Market Sales Program
On May 27, 2021, the Company entered into an At Market Issuance Sales Agreement (“First ATM Agreement”) with B. Riley Securities, Inc. (“B. Riley”) and Cantor Fitzgerald & Co. (“Cantor”), as distribution agents, under which the Company may offer and sell shares of the Common Stock from time to time through the Distribution Agents, acting as sales agent or principal. On September 30, 2021, the Company entered into a second At Market Issuance Sales Agreement with B. Riley, BNP Paribas Securities Corp., Cantor, Mizuho Securities USA LLC and Needham & Company, LLC, as distribution agents (together with the First ATM Agreement, the “ATM Agreement”).
118
Sales of the shares of Common Stock under the ATM Agreement, have been in “at the market offerings” as defined in Rule 415 under the Securities Act, including, without limitation, sales made directly on or through the Nasdaq or on any other existing trading market for the Common Stock, as applicable, or to or through a market maker or any other method permitted by law, including, without limitation, negotiated transactions and block trades. Shares of Common Stock sold under the ATM Agreement have been offered pursuant to the Company’s Registration Statement on Form S-3 and the prospectuses and related prospectus supplements included therein for sales of shares of Common Stock as follows:
Supplement | Period | Number of Shares Sold | Weighted Average Price Per Share | Gross Proceeds | Net Proceeds |
Prospectus supplement dated May 27, 2021 with an aggregate offering price of up to $ | May 28, 2021 through July 1, 2021 | $ | $ | $ | |
Prospectus supplement dated June 30, 2021 with an aggregate offering price of up to $ | June 30, 2021 through September 2, 2021 | $ | $ | $ | |
Prospectus supplement dated September 30, 2021 with an aggregate offering price of up to $ | October 6, 2021 through March 31, 2022 | $ | $ | $ | |
Prospectus supplement dated May 23, 2022 with an aggregate offering price of up to $ | May 24, 2022 through March 31, 2023 | $ | $ | $ |
Due to the late filing of the 2022 Form 10-K, the Company lost eligibility to use Form S-3 (and thereby the ability to conduct at the market offerings). As a result of subsequent delinquent quarterly reports on Form 10-Q, including for the period ended September 30, 2023 (the “Q3 Form 10-Q”), the Company will not regain eligibility to use Form S-3 until twelve full calendar months following the date the Q3 Form 10-Q was due. Any future delinquency with respect to the filing of a Form 10-K, Form 10-Q, or certain Form 8-Ks will cause the Company to lose Form S-3 eligibility for at least 12 calendar months from the due date of the delinquent filing.
Share Buyback Program
On August 10, 2022, the Board authorized a share buyback program (the “2022 Share Buyback Program”), pursuant to which the Company is permitted to repurchase up to
The Company records such stock repurchases as a reduction to stockholders’ equity. The Company allocates the excess of the repurchase price over the par value of shares acquired to Accumulated Deficit and Additional Paid-in Capital. The portion allocated to Additional Paid-in Capital is determined by dividing the number of shares to be retired by the number of shares issued multiplied by the balance of Additional Paid-in Capital as of the retirement date.
Series A Preferred Stock
The Company is authorized to issue
119
takes into account the amount of Liquidation Preference per share as adjusted for accrued but unpaid dividends, as described below. As of December 31, 2023, after taking into account the effect of the Reverse Stock Split, each outstanding share of Series A Preferred Stock was convertible into
Holders of the Series A Preferred Stock are entitled to receive cumulative dividends at a rate per annum of
In addition, holders of the Series A Preferred Stock will participate in any dividend or distribution of cash or other property paid in respect of the Common Stock pro rata with the holders of the Common Stock (other than certain dividends or distributions that trigger an adjustment to the conversion rate, as described in the Certificate of Designations), as if all shares of Series A Preferred Stock had been converted into Common Stock immediately prior to the date on which such holders of the Common Stock became entitled to such dividend or distribution.
Series B Preferred Stock and Tandem Preferred Stock
The Company has designated
Holders of the Series B Preferred Stock are entitled to receive cumulative dividends at a rate per annum of
120
Stock since inception on March 23, 2022 was $
In addition, holders of the Series B Preferred Stock will participate in any dividend or distribution of cash or other property paid in respect of the Common Stock pro rata with the holders of the Common Stock (other than certain dividends or distributions that trigger an adjustment to the conversion rate, as described in the Certificate of Designations), as if all shares of Series B Preferred Stock had been converted into Common Stock immediately prior to the date on which such holders of the Common Stock became entitled to such dividend or distribution. Holders of Series B Preferred Stock also have rights to vote for the election of
On May 17, 2022, the Company issued one share of tandem preferred stock, par value $
On all matters submitted to a vote of the stockholders of the Company, the holders of the Series B Preferred Stock through their holdings of Tandem Preferred Stock will be entitled to vote with the holders of the Common Stock as a single class. Each share of Tandem Preferred Stock entitles the holder to one vote per share, subject to adjustment for issuance of any shares of Common Stock pursuant to any dividend or distribution on shares of Common Stock, share split or share combination or other transactions as specified in the Certificate of Designation of Tandem Preferred Stock.
Shares of Tandem Preferred Stock are not entitled to receive dividends of any kind. In the case of a transfer of the underlying Series B Preferred Stock by a holder to any transferee, the Tandem Preferred Stock shall be automatically transferred simultaneously to such transferee without any further action by such Holder. Upon the redemption of a holder’s shares of Series B Preferred Stock or the conversion of shares of Series B Preferred Stock into Common Stock, an equal number of such holder’s shares of Tandem Preferred Stock shall, without any further action required by the holder, be automatically transferred to the Company for cancellation without the payment of any additional consideration by the Company. In the event of any liquidation, winding-up or dissolution of the Company each holder of the Tandem Preferred Stock shall be entitled to receive and to be paid out of the assets of the Company available for distribution to its stockholders an amount in cash equal to the par value of such Tandem Preferred Stock with respect to each share of Tandem Preferred Stock held by such holder.
Treasury Stock
As of December 31, 2022, the Company had
Warrants
At December 31, 2023, there were warrants outstanding to purchase
121
Private Placement of Unregistered Shares and Warrants
On March 15, 2021, the Company, entered into a securities purchase agreement with certain accredited institutional investors pursuant to which the Company issued and sold to ten accredited institutional investors in a private placement an aggregate of
Each private placement warrant entitles the holder to purchase one-four thousandth of
Special Voting Preferred Stock
On October 9, 2023, the Company entered into the Subscription, Voting and Redemption Agreement with GP-HGM LLC, an entity affiliated to the Executive Chairman of the Company, pursuant to which GP-HGM LLC purchased
18. Related-Party Transactions
Relationship with HandsOn Global Management
The Company incurred reimbursable travel expenses to HOVS LLC and HandsOn Fund 4 I, LLC (collectively, and together with certain of their affiliated entities managed by HandsOn Global Management LLC, including such entity, “HGM”) of less than $
Pursuant to a master agreement dated January 1, 2015 between Rule 14, LLC and a subsidiary of the Company, the Company incurs marketing fees to Rule 14, LLC, a portfolio company of HGM. Similarly, the Company is party to
Certain operating companies lease their operating facilities from HOV RE, LLC and HOV Services Limited, which are affiliates under common control with HGM. The rental expense for these operating leases was $
122
each of the years ended December 31, 2023 and 2022, respectively. In addition, HOV Services, Ltd. provides the Company data capture and technology services. The expense recognized for these services was approximately $
Consulting Agreement
The Company receives services from Oakana Holdings, Inc. The Company and Oakana Holdings, Inc. are related through a family relationship between certain shareholders and the president of Oakana Holdings, Inc. The expense recognized for these services was $
Subscription Agreements
On July 21, 2022, the Company entered into a share subscription agreement with its Executive Chairman. Pursuant to this subscription agreement, on August 11, 2022, the Company issued and sold
Subscription, Voting and Redemption Agreement
On October 9, 2023, the Company entered into the Subscription, Voting and Redemption Agreement with GP-HGM LLC, an entity affiliated to the Executive Chairman of the Company, pursuant to which GP-HGM LLC purchased
At the Annual Meeting, stockholders will be asked to approve an amendment to the Certificate of Designations of the Company’s Series B Preferred Stock to allow the Company to have the ability to (a) pay dividends in shares of Common Stock, (b) pay less than all of the accrued dividends, and (c) pay dividends on any date designated by the Company’s Board for the payment of dividends. These Special Voting Stock are outstanding as of December 31, 2023.
Invoicing Support and Collection Services
On September 1, 2023, the Company, through one of its subsidiaries, entered into a Master Services Agreement (the “Agreement”) with Doctors of Waikiki LLP (the “DOW”), which is an affiliate under common control with HGM, where the Company could provide services under one or more statement(s) of work (each, a “SOW”) to DOW. Each SOW, together with the terms of this Agreement, shall be deemed a separate contract that is effective as of date set forth in the SOW. The Company, acting under the first statement of work (SOW-1), provides collection services to DOW to collect past-due medical debts from its patients and insurance companies for which the Company receives a commission of
Account Receivable Sale Agreement
On September 18, 2023, the Company, through one of its subsidiaries, entered into an Account Receivable Sale Agreement (the “AR Agreement”) with DOW for purchases of accounts receivable from DOW. Under the AR Agreement, DOW agreed to sell certain healthcare receivables eligible under the AR purchase program, subject to acceptance by the Company up to $
123
including origination fees, underwriting fees, returned payment fees, late payment fees, and administration fees. For the year ended December 31, 2023, the Company has recognized
Payable and Receivable/Prepaid Balances with Affiliates
Payable and receivable/prepaid balances with affiliates as of December 31, 2023 and December 31, 2022 were as follows:
December 31, 2023 |
| December 31, 2022 | ||||||||||
Receivables and | Payables | Receivables and | Payables | |||||||||
HOV Services, Ltd | $ | | $ | — | $ | | $ | — | ||||
Rule 14 | — | | — | | ||||||||
HGM | — | | | — | ||||||||
DOW | — | | — | — | ||||||||
$ | | $ | | $ | | $ | | |||||
19. Segment and Geographic Area Information
The Company’s operating segments are significant strategic business units that align its products and services with how it manages its business, approaches the markets and interacts with its clients. The Company is organized into
ITPS: The ITPS segment provides a wide range of solutions and services designed to aid businesses in information capture, processing, decisioning and distribution to customers primarily in the financial services, commercial, public sector and legal industries.
HS: The HS segment operates and maintains an outsourcing business specializing in both the healthcare provider and payer markets.
LLPS: The LLPS segment provides a broad array of support services in connection with class action settlement administration, claims adjudication, labor, employment and other legal matters.
The chief operating decision maker reviews segment profit to evaluate operating segment performance and determine how to allocate resources to operating segments. “Segment profit” is defined as revenue less cost of revenue (exclusive of depreciation and amortization). The Company does not allocate selling, general, and administrative expenses, depreciation and amortization, interest expense, net and sundry expenses (income), net. The Company manages assets on a total company basis, not by operating segment, and therefore asset information and capital
124
expenditures by operating segments are not presented. A reconciliation of segment profit to net loss before income taxes is presented below.
Year ended December 31, 2023 | ||||||||||||
| ITPS |
| HS |
| LLPS |
| Total | |||||
Revenue | $ | | $ | | $ | | $ | | ||||
Cost of revenue (exclusive of depreciation and amortization) | |
| |
| | | ||||||
Segment profit | | | | | ||||||||
Selling, general and administrative expenses (exclusive of depreciation and amortization) | | |||||||||||
Depreciation and amortization | | |||||||||||
Related party expense | | |||||||||||
Interest expense, net | | |||||||||||
Debt modification and extinguishment costs (gain), net | ( | |||||||||||
Sundry expense, net | | |||||||||||
Other income, net | ( | |||||||||||
Net loss before income taxes | $ | ( | ||||||||||
Year ended December 31, 2022 | ||||||||||||
| ITPS |
| HS |
| LLPS |
| Total | |||||
Revenue | $ | | $ | | $ | | $ | | ||||
Cost of revenue (exclusive of depreciation and amortization) | |
| |
| | | ||||||
Segment profit | | | | | ||||||||
Selling, general and administrative expenses (exclusive of depreciation and amortization) | | |||||||||||
Depreciation and amortization | | |||||||||||
Impairment of goodwill and other intangible assets | | |||||||||||
Related party expense | | |||||||||||
Interest expense, net | | |||||||||||
Debt modification and extinguishment costs (gain), net | | |||||||||||
Sundry income, net | ( | |||||||||||
Other expense, net | | |||||||||||
Net loss before income taxes | $ | ( | ||||||||||
The following table presents revenues by principal geographic area where the Company’s customers are located for the years ended December 31, 2023 and 2022.
Years ended December 31, | ||||||
| 2023 |
| 2022 | |||
United States | $ | | $ | | ||
EMEA | | | ||||
Other | | | ||||
Total Consolidated Revenue | $ | | $ | | ||
125
20. Subsequent Events
Receivable Purchase Agreement
On February 12, 2024, certain of the Company’s subsidiaries entered into a receivables purchase agreement with B. Riley Securities, Inc. (“BRSI”) (as subsequently amended on February 29, 2024, March 29, 2024 and March 31, 2024, the “BR Receivables Purchase Agreement”). Under the terms of the BR Receivables Purchase Agreement, certain of the Company’s subsidiaries agreed to sell certain existing receivables and all of their future receivables to BRSI until such time as BRSI shall have collected $
Repayments on BRCC Facility
During January 1, 2024 through April 3, 2024, the Company repaid $
126
ITEM 9. CHANGES IN AND DISAGREEMENTS WITH ACCOUNTANTS ON ACCOUNTING AND FINANCIAL DISCLOSURE
None.
ITEM 9A. CONTROLS AND PROCEDURES
Evaluation of Disclosure Controls and Procedures
Our management, with the participation of our Principal Executive Officer (“PEO”) and our Interim Chief Financial Officer (“CFO”), has evaluated the effectiveness of our disclosure controls and procedures (as defined in Rules 13a-15(e) and 15d-15(e) under the Securities Exchange Act of 1934, as amended (the “Exchange Act”)) as of December 31, 2023. Disclosure controls and procedures include, without limitation, controls and procedures designed to ensure that information required to be disclosed by a company in the reports that it files or submits under the Exchange Act is accumulated and communicated to the company’s management, including its principal executive officer and principal financial officer, as appropriate to allow timely decisions regarding required disclosure. In designing and evaluating the disclosure controls and procedures, management recognizes that any controls and procedures, no matter how well designed and operated, can provide only reasonable assurance of achieving the desired control objectives. Based upon that evaluation, as discussed below, our PEO and CFO have concluded that, as of the end of the period covered by this Annual Report, our disclosure controls and procedures were not effective because of the material weaknesses in internal control over financial reporting described below.
Notwithstanding such material weaknesses in internal control over financial reporting, our management, including our PEO and CFO, has concluded that our consolidated balance sheets as of and for the years ended December 31, 2023 and 2022 and the consolidated statements of operations, comprehensive loss, stockholders’ deficit, and cash flows for each of the years in the two-year period ended December 31, 2023, present fairly, in all material respects, our financial position, results of our operations and our cash flows for the periods presented in this Annual Report, in conformity with U.S. GAAP.
Management’s Report on Internal Control over Financial Reporting
Management, under the supervision of the board of directors, is responsible for establishing and maintaining adequate “internal control over financial reporting,” as defined in Rules 13a-15(f) and 15d-15(f) of the Exchange Act. Our internal control over financial reporting is designed to provide reasonable assurance regarding the reliability of financial reporting and the preparation of financial statements for external purposes in accordance with U.S. GAAP and includes those policies and procedures that (1) pertain to the maintenance of records that, in reasonable detail, accurately and fairly reflect the transactions and dispositions of the assets of the Company; (2) provide reasonable assurance that transactions are recorded as necessary to permit preparation of financial statements in accordance with U.S. GAAP, and that receipts and expenditures of the Company are being made only in accordance with authorizations of management and directors of the Company; and (3) provide reasonable assurance regarding prevention or timely detection of unauthorized acquisition, use, or disposition of the Company’s assets that could have a material effect on the financial statements. All internal control systems, no matter how well designed, have inherent limitations. Therefore, even those systems determined to be effective can provide only reasonable assurance with respect to financial statement preparation and presentation. Because of its inherent limitations, a system of internal control over financial reporting may not prevent or detect misstatements.
A material weakness is a deficiency, or combination of deficiencies, in internal control over financial reporting, such that there is a reasonable possibility that a material misstatement of our annual or interim financial statements will not be prevented or detected on a timely basis.
Management, with participation of the PEO and CFO, under the oversight of our Board of Directors, assessed the effectiveness of our internal control over financial reporting as of December 31, 2023 using the criteria set forth by the Committee of Sponsoring Organizations of the Treadway Commission in Internal Control- Integrated Framework (2013) (the “COSO 2013 Framework”). Based on its assessment, our management, including our PEO and CFO, has concluded
127
that our internal control over financial reporting was not effective as of December 31, 2023 due to material weaknesses in our internal control over financial reporting described below.
The Company had reported several material weaknesses in the prior year filings as follows:
| A) | Identified in prior years, and remediated during 2023: |
| ● | Procure to pay: The material weakness in procure to pay process was identified across operating expenses, accounts payable, and accrued liabilities sub-processes. The material weakness primarily originated from non-updation of the Delegation of Authority matrix, which was subsequently revised and implemented during the year to ensure appropriate approvals for expenses and vendor payments. |
| ● | Goodwill: The material weakness in goodwill process was identified primarily due to inadequate documentation over control performance. During the year, we appointed experienced control owners, and enhanced documentation and review controls to remediate the material weakness. |
| ● | Program Development: The material weakness in program development was on account of a post implementation signoff for a system migration which was not received from the vendor in a timely manner. The review controls were subsequently strengthened. |
| B) | Identified in prior years, and carried forward: |
| ● | Order to cash: The material weakness in order to cash process was noted across revenue, customer deposits, accounts receivable and deferred revenue sub-processes. During the year, we enhanced review controls, added experienced people across order to cash sub-processes for managing critical control activities, and rationalized the controls framework to remove duplicate and redundant controls. While these measures have helped to remediate few processes, but the material weakness was not fully remediated as of year end. |
| ● | The Company did not design, implement and operate effective process-level control activities related to treasury (including cash and cash equivalents), and financial reporting (including review of the recording of manual journal entries, period end financial close/account reconciliation process and preparation of the consolidated financial statements). |
| ● | Access management: This material weakness is on account of delayed access revocation from certain software applications. |
| ● | The risk assessment process failed to identify and assess risks of misstatement, including fraud risks, to ensure controls were designed and implemented to respond to those risks. |
Because there is a reasonable possibility that material misstatement of the consolidated financial statements will not be prevented or detected on a timely basis, we concluded the deficiencies represent material weaknesses in our internal control over financial reporting and our internal control over financial reporting was not effective as of December 31, 2023.
128
Remediation Plan
We have identified and implemented several steps, and continue to do so, to remediate the material weaknesses described in this Item 9A. The COE team has also started reviewing the current processes, looked at weakness reported and are working on the road map to eliminate the weakness.
We are undertaking the following additional remediation measures to further strengthen internal controls:
| ● | The remediation efforts in Order to cash process will be extended to the other sub processes . |
| ● | For the treasury and financial reporting processes, enhancing the design of existing control activities and implementing additional process-level control activities. |
| ● | Deploying additional information and communications controls to allow the effective operation of control activities. |
| ● | Continuing to hire, train, and retain individuals with appropriate skills and experience, assigning responsibilities and holding individuals accountable for their roles related to internal control over financial reporting. |
| ● | Implementing an Identity and Access Management tool to onboard software applications through a Single Sign-On process which will strengthen user logical access management. |
Management intends to deploy the aforementioned additional remediation measures within a reasonable time frame. The effort may require incremental time and resources to remediate and we may decide to take other measures with appropriate executive sponsorship to address the material weaknesses or modify the remediation steps described above. Until these deficiencies are remediated, we plan to continue to perform additional analyses and other procedures to ensure that our consolidated financial statements are prepared in accordance with U.S. GAAP.
Changes in Internal Controls over Financial Reporting
Except for the continued remediation efforts, there were no changes to the Company’s internal control over financial reporting (as defined in Rules 13a-15(f) and 15d-15(f) under the Exchange Act) during the quarter ended December 31, 2023 that has materially affected, or is reasonably likely to materially affect, our internal control over financial reporting.
ITEM 9B. OTHER INFORMATION
.
ITEM 9C. DISCLOSURE REGARDING FOREIGN JURISDICTIONS THAT PREVENT INSPECTION
Not applicable.
PART III
ITEM 10. DIRECTORS, EXECUTIVE OFFICERS, AND CORPORATE GOVERNANCE
Information about our executive officers is contained in the section titled “Executive Officers” in Part I of this Annual Report.
The other information required by this Item will be included in our Proxy Statement for the 2024 Annual General Meeting of Shareholders under the captions “Director Nominees,” “Continuing Members of the Board of Directors,” “Additional Information Concerning the Board of Directors of the Company,” Committees of the Board of Directors” and “Section 16(a) Beneficial Ownership Reporting Compliance,” which will be filed with the SEC no later than 120 days after the close of the fiscal year ended December 31, 2023 and is incorporated by reference in this Annual Report.
129
ITEM 11. EXECUTIVE COMPENSATION
The information required by this Item will be included in our Proxy Statement for the 2024 Annual General Meeting of Shareholders under the captions “Executive Compensation” and “Director Remuneration,” which will be filed with the SEC no later than 120 days after the close of the fiscal year ended December 31, 2023 and is incorporated by reference in this Annual Report.
ITEM 12. SECURITY OWNERSHIP OF CERTAIN BENEFICIAL OWNERS AND MANAGEMENT AND RELATED STOCKHOLDER MATTERS
The information required by this Item will be included in our Proxy Statement for the 2024 Annual General Meeting of Shareholders under the caption “Security Ownership of Certain Beneficial Owners and Management” and “Securities Authorized for Issuance under Equity Compensation Plans,” which will be filed with the SEC no later than 120 days after the close of the fiscal year ended December 31, 2023 and is incorporated by reference in this Annual Report.
ITEM 13. CERTAIN RELATIONSHIPS AND RELATED TRANSACTIONS, AND DIRECTOR INDEPENDENCE
The information required by this Item will be included in our Proxy Statement for the 2024 Annual General Meeting of Shareholders under the captions “Certain Relationships and Related Party Transactions” and “Director Independence,” which will be filed with the SEC no later than 120 days after the close of the fiscal year ended December 31, 2023 and is incorporated by reference in this Annual Report.
ITEM 14. PRINCIPAL ACCOUNTANT FEES AND SERVICES
The information required by this Item will be included in our Proxy Statement for the 2024 Annual General Meeting of Shareholders under the caption “Independent Registered Public Accounting Firm Fees” which will be filed with the SEC no later than 120 days after the close of the fiscal year ended December 31, 2023 and is incorporated by reference in this Annual Report.
130
PART IV
ITEM 15. EXHIBIT AND FINANCIAL STATEMENT SCHEDULES
a) (1) Financial Statements
(a)(3) Exhibits
Exhibit |
| Description |
| Filed or |
|---|---|---|---|---|
2.1 |
|
|
| |
3.1 |
| Restated Certificate of Incorporation, dated July 12, 2017 (4) |
|
|
3.2 | ||||
3.3 | ||||
3.4 | ||||
3.5 | ||||
3.6 |
|
| ||
3.7 |
| Certificate of Decrease of Series A Perpetual Convertible Preferred Stock. (22) |
|
|
3.8 | ||||
3.9 | ||||
3.10 | Certificate of Decrease of Series B Perpetual Convertible Preferred Stock. (27) | |||
3.11 | Certificate of Designations, Preferences, Rights and Limitations of Tandem Preferred Stock. (22) | |||
3.12 |
131
Exhibit |
| Description |
| Filed or |
|---|---|---|---|---|
3.13 | ||||
3.14 | Certificate of Designations, Preferences, Rights and Limitations of Special Voting Preferred Stock. (22) | |||
3.15 | ||||
3.16 | Certificate of Designations, Preferences, Rights and Limitations of Special Voting Preferred Stock. (27) | |||
3.17 | ||||
3.18 | ||||
3.19 | Certificate of Decrease of Series B Perpetual Convertible Preferred Stock. (30) | |||
3.20 | ||||
3.21 | ||||
3.21 | ||||
4.1 | ||||
4.2 |
|
|
| |
4.3 |
| Form of Warrant Agreement between Continental Stock Transfer & Trust Company and the Registrant (1) |
|
|
4.4 |
|
|
| |
4.5 | ||||
4.6 |
|
|
| |
4.7 |
|
|
| |
4.8 | ||||
4.9 | ||||
4.10 | ||||
4.11 |
132
Exhibit |
| Description |
| Filed or |
|---|---|---|---|---|
4.12 | ||||
4.13 | ||||
4.14 | ||||
4.15 | ||||
10.1 |
|
| ||
10.2 |
|
|
| |
10.3 |
|
|
| |
10.4 |
|
|
| |
10.5 | ||||
10.6 | ||||
10.7 |
|
|
| |
10.8 |
|
|
| |
10.9 |
|
|
| |
10.10 | ||||
10.11 | Fourth Amendment to First Lien Credit Agreement, dated as of December 9, 2021. (19) | |||
10.12 |
133
Exhibit |
| Description |
| Filed or |
|---|---|---|---|---|
10.13 | ||||
10.14 | ||||
10.15 | ||||
10.16 | ||||
10.17 | ||||
10.18 | ||||
10.19 | ||||
10.20 | ||||
10.21 | ||||
10.22 | ||||
10.23 | Second Amendment to Loan Agreement, dated April 11, 2021 (14) | |||
10.24 |
134
Exhibit |
| Description |
| Filed or |
|---|---|---|---|---|
10.25 | ||||
10.26 | ||||
10.27 | ||||
10.28 | Amended and Restated Exela Technologies Inc. 2018 Stock Incentive Plan.(18) | |||
10.29 | ||||
10.30 | ||||
10.31 |
| Exela Technologies, Inc. Executive Officer Annual Bonus Plan. (8) |
|
|
10.32 |
|
|
| |
10.33 |
|
|
| |
10.34 | ||||
10.35 | ||||
10.36 | ||||
10.37 | ||||
10.38 | ||||
21.1 | Filed | |||
23.1 | Filed | |||
23.2 | Filed | |||
31.1 | Filed | |||
31.2 | Filed | |||
32.1 | Furnished | |||
32.2 | Furnished | |||
97 | Filed | |||
101.INS | Inline XBRL Instance Document | Filed | ||
101.SCH | Inline XBRL Taxonomy Extension Schema | Filed |
135
Exhibit |
| Description |
| Filed or |
|---|---|---|---|---|
101.CAL | Inline XBRL Taxonomy Extension Calculation Linkbase | Filed | ||
101.DEF | Inline XBRL Taxonomy Extension Definition Linkbase | Filed | ||
101.LAB | Inline XBRL Taxonomy Extension Label Linkbase | Filed | ||
101.PRE | Inline XBRL Taxonomy Extension Presentation Linkbase | Filed | ||
104 | Cover Page Interactive Data File (embedded within the Inline XBRL document and included in Exhibit 101) |
| (1) | Incorporated by reference to the Registrant’s Registration Statement on Form S-1 (SEC File No. 333-198988). |
| (2) | Incorporated by reference to the Registrant’s Current Report on Form 8-K filed on February 22, 2017. |
| (3) | Incorporated by reference to the Registrants’ Current Report on Form 8-K, filed on June 21, 2017. |
| (4) | Incorporated by reference to the Registrants’ Current Report on Form 8-K, filed on July 18, 2017. |
| (5) | Incorporated by reference to the Registrants’ Current Report on Form 8-K, filed on July 17, 2018. |
| (6) | Incorporated by reference to the Registrants’ Current Report on Form 8-K, filed on April 17, 2019. |
| (7) | Incorporated by reference to the Registrants’ Quarterly Report on Form 10-Q, filed on May 10, 2019. |
| (8) | Incorporated by reference to the Registrants’ Quarterly Report on Form 10-Q, filed on November 12, 2019. |
| (9) | Incorporated by reference to the Registrants’ Current Report on Form 8-K, filed on May 21, 2020. |
| (10) | Incorporated by reference to the Registrants’ Quarterly Report on Form 10-Q, filed on August 10, 2020. |
| (11) | Incorporated by reference to the Registrants’ Current Report on Form 8 K, filed on December 17, 2021. |
| (12) | Incorporated by reference to the Registrants’ Current Report on Form 8 K, filed on January 25, 2021. |
| (13) | Incorporated by reference to the Registrant’s Current Report on Form 8-K, filed on March 19, 2021. |
| (14) | Incorporated by reference to the Registrant’s Current Report on Form 8-K, filed on April 15, 2021. |
| (15) | Incorporated by reference to the Registrant’s Current Report on Form 8-K, filed on September 16, 2021. |
| (16) | Incorporated by reference to the Registrant’s Current Report on Form 8-K, filed on September 30, 2021. |
| (17) | Incorporated by reference to the Registrant’s Current Report on Form 8-K, filed on December 2, 2021. |
| (18) | Incorporated by reference to the Registrant’s Registration Statement on Form S-8, filed on February 16, 2022. |
| (19) | Incorporated by reference to the Registrants’ Annual Report on Form 10-K, filed on March 16, 2022. |
| (20) | Incorporated by reference from Exhibit (a)(1)(N) to Amendment No. 11 to Schedule TO, filed by the Company with the Securities and Exchange Commission on March 11, 2022. |
| (21) | Incorporated by reference to the Registrants’ Quarterly Report on Form 10-Q, filed on May 10, 2022. |
| (22) | Incorporated by reference to the Registrant’s Current Report on Form 8-K, filed on May 19, 2022. |
| (23) | Incorporated by reference to the Registrant’s Current Report on Form 8-K, filed on June 21, 2022 |
| (24) | Incorporated by reference to the Registrant’s Current Report on Form 8-K, filed on June 29, 2022. |
| (25) | Incorporated by reference to the Registrant’s Current Report on Form 8-K, filed on July 26, 2022. |
| (26) | Incorporated by reference to the Registrants’ Quarterly Report on Form 10-Q, filed on August 12, 2022. |
| (27) | Incorporated by reference to the Registrant’s Current Report on Form 8-K, filed on March 13, 2023. |
| (28) | Incorporated by reference to the Registrant’s Current Report on Form 8-K, filed on May 12, 2023. |
| (29) | Incorporated by reference to the Registrant’s Current Report on Form 8-K, filed on June 9, 2023. |
| (30) | Incorporated by reference to the Registrant’s Current Report on Form 8-K, filed on March 13, 2023. |
| (31) | Incorporated by reference to the Registrant’s Current Report on Form 8-K, filed on October 10, 2023. |
| (32) | Incorporated by reference to the Registrant’s Current Report on Form 8-K, filed on July 17, 2023. |
ITEM 16. FORM 10-K SUMMARY.
None.
136
SIGNATURES
Pursuant to the requirements of Section 13 or 15(d) of the Securities Exchange Act of 1934, as amended, the Registrant has duly caused this report to be signed on its behalf by the undersigned, thereunto duly authorized.
Dated: | By: | /s/ Par Chadha |
April 3, 2024 | Par Chadha, Executive Chairman |
Pursuant to the requirements of the Securities Exchange Act of 1934, as amended, this report has been signed below by the following persons on behalf of the Registrant and in the capacities and on the dates indicated.
Dated: | By: | /s/ Par Chadha |
April 3, 2024 | Par Chadha | |
Executive Chairman (Principal Executive Officer) | ||
Dated: | By: | /s/ Matthew T. Brown |
April 3, 2024 | Matthew T. Brown, Interim Chief Financial Officer | |
(Principal Financial Officer and Principal Accounting | ||
Officer) | ||
Dated: | By: | /s/ Martin P. Akins |
April 3, 2024 | Martin P. Akins, Director | |
Dated: | By: | /s/ Marc A. Beilinson |
April 3, 2024 | Marc A. Beilinson, Director | |
Dated: | By: | /s/ Sharon Chadha |
April 3, 2024 | Sharon Chadha, Director | |
Dated: | By: | /s/ J. Coley Clark |
April 3, 2024 | J. Coley Clark, Director | |
Dated: | By: | /s/ Ronald C. Cogburn |
April 3, 2024 | Ronald C. Cogburn, Director | |
Dated: | By: | /s/ James G. Reynolds |
April 3, 2024 | James G. Reynolds, Director |
137